morgan stanley financials conference june 13, 2017 stanley financials conference june 13, 2017...
TRANSCRIPT

Morgan Stanley Financials Conference
June 13, 2017
George R. Aylward
President and Chief Executive Officer
2
IMPORTANT DISCLOSURES
This presentation contains statements that are, or may be considered to be, forward-looking statements. All statements that are not historical facts,
including statements about our beliefs or expectations, are “forward-looking statements” within the meaning of The Private Securities Litigation
Reform Act of 1995. These statements may be identified by such forward-looking terminology as “expect,” “estimate,” “plan,” “intend,” “believe,”
“anticipate,” “may,” “will,” “should,” “could,” “continue,” “project,” or similar statements or variations of such terms.
Our forward-looking statements are based on a series of expectations, assumptions and projections about our company, are not guarantees of future
results or performance, and involve substantial risks and uncertainty, including assumptions and projections concerning our assets under
management, cash inflows and outflows, operating cash flows, our ability to expand distribution and product offerings, and future credit facilities, for
all forward periods. All of our forward-looking statements are as of the date of this release only. The company can give no assurance that such
expectations or forward-looking statements will prove to be correct. Actual results may differ materially.
Our business and our forward-looking statements involve substantial known and unknown risks and uncertainties, including those discussed under
“Risk Factors,” and “Management’s Discussion and Analysis of Financial Condition and Results of Operations” in our 2016 Annual Report on Form
10-K, as well as the following risks and uncertainties: (a) any reduction in our assets under management; (b) the withdrawal, renegotiation or
termination of investment advisory agreements; (c) damage to our reputation; (d) failure to comply with investment guidelines or other contractual
requirements; (e) the inability to attract and retain key personnel; (f) challenges from the competition we face in our business; (g) adverse regulatory
and legal developments; (h) unfavorable changes in tax laws or limitations; (i) adverse developments related to unaffiliated subadvisers; (j) negative
implications of changes in key distribution relationships; (k) interruptions in or failure to provide service by third-parties; (l) volatility associated with
our common stock; (m) adverse civil litigation and government investigations or proceedings; (n) the risk of loss on our investments; (o) the inability
to make quarterly distributions; (p) the lack of sufficient capital on satisfactory terms; (q) liabilities and losses not covered by insurance; (r) the
inability to satisfy financial covenants; (s) the failure to complete the acquisition of RidgeWorth; (t) the inability to achieve expected acquisition-
related financial benefits and synergies; and other risks and uncertainties described in our 2016 Annual Report on Form 10-K or in any of our filings
with the Securities and Exchange Commission (“SEC”).
Certain other factors which may impact our continuing operations, prospects, financial results and liquidity, or which may cause actual results to
differ from such forward-looking statements, are discussed or included in the company’s periodic reports filed with the SEC and are available on our
website at www.virtus.com under “Investor Relations.” You are urged to carefully consider all such factors.
The company does not undertake or plan to update or revise any such forward-looking statements to reflect actual results, changes in plans,
assumptions, estimates or projections, or other circumstances occurring after the date of this presentation, even if such results, changes or
circumstances make it clear that any forward-looking information will not be realized. If there are any future public statements or disclosures by us
which modify or impact any of the forward-looking statements contained in or accompanying this presentation, such statements or disclosures will be
deemed to modify or supersede such statements in this presentation.
3
AGENDA
Overview of Virtus
Acquisition of RidgeWorth Investments
Financial Review
Growth Opportunities
Appendix

OVERVIEW OF VIRTUS
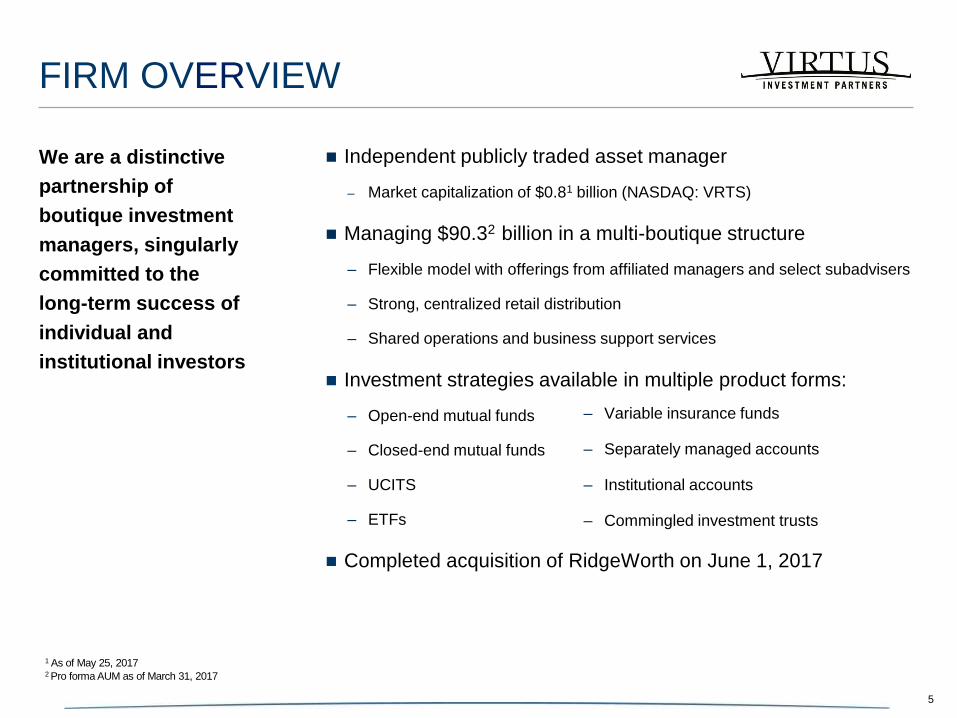
We are a distinctive
partnership of
boutique investment
managers, singularly
committed to the
long-term success of
individual and
institutional investors
Independent publicly traded asset manager
– Market capitalization of $0.81 billion (NASDAQ: VRTS)
Managing $90.32 billion in a multi-boutique structure
– Flexible model with offerings from affiliated managers and select subadvisers
– Strong, centralized retail distribution
– Shared operations and business support services
Investment strategies available in multiple product forms:
– Open-end mutual funds
– Closed-end mutual funds
– UCITS
– ETFs
Completed acquisition of RidgeWorth on June 1, 2017
FIRM OVERVIEW
– Variable insurance funds
– Separately managed accounts
– Institutional accounts
– Commingled investment trusts
5
1 As of May 25, 2017 2 Pro forma AUM as of March 31, 2017

6
VALUE PROPOSITION
Flexible Multi-Boutique
Asset Manager
Flexible partnership approach with alignment of interests
Preserves affiliate culture, investment process, and brand
Shared distribution and support services
Diverse, High-Quality
Product Offerings
Well-diversified across asset classes and investment styles
Differentiated strategies for changing environments and preferences
Attractive investment offerings with strong performance
Effective
Distribution Capabilities
Provides one-point access to distinctive investment capabilities
Relationships with a broad network of intermediaries
Consultative and educational sales approach
Attractive
Financial Profile
Strong and diverse cash flow generation
Proven operating leverage and ability to generate attractive margins
Prudent capital management with modest financial leverage, focused on
growing the business
Multiple Opportunities
for Growth
Introduction of new products
Expansion of investment capabilities and distribution
Addition of new affiliates

ACQUISITION OF RIDGEWORTH

8
Diversification of
Investment Strategies
and Clients
Increases the breadth of product offerings from differentiated investment
managers
Provides access to broader base of potential clients
Diversifies product offerings for greater opportunities through changing market
cycles
Enhanced and Expanded
Distribution Resources
Expands institutional distribution with dedicated and experienced sales and
client service resources
Enhances retail distribution resources and access in DCIO, private bank and
independent/RIA channels
Increases offerings, making Virtus a more meaningful partner to distributors
Increased Profitability
and Scale
Increases AUM by 88% to $90.31 billion and open-end assets by 71% to
$42.21 billion
Enhances profitability and cash flow through greater scale and anticipated
synergies
Expected to be meaningfully accretive to EPS, as adjusted, with attractive IRR
Expanded Growth
Opportunities
Enables offering of existing strategies through broader institutional resources
Increases mutual fund offerings available through national retail distribution
Expands investment strategies to be made available in other product forms
and markets
TRANSACTION HIGHLIGHTS
1 Pro forma AUM as of March 31, 2017

9
Financially
Compelling Purchase price represents 6.5x EBITDA1, including synergies
Accretion estimate of ~20%
Attractive high-teens IRR targeted
Material Synergies Anticipated cost synergies of $25 million per annum; ~85% expected to be
realized within twelve months of closing; excludes potential revenue synergies
No change to the investment professionals within the RidgeWorth boutiques
Highly executable cost savings driven by elimination of duplicate corporate and
business support resources
Approximately $15 million of one-time costs related to achievement of synergies
Meaningful Tax
Benefits
Purchased intangibles of approximately $420 million to be amortized over 15
years for tax purposes
Expected to create annual tax expense savings of $10.8 million2
1 EBITDA calculated as $48 million of RidgeWorth Adjusted EBITDA for the trailing twelve months ended 9/30/2016, plus $25 million of fully phased-in cost synergies. 2 Assuming 38.3% tax rate
FINANCIAL IMPACT

MULTI-BOUTIQUE ASSET MANAGER
10
Income-Focused
Equity
Multi-Sector Fixed
Income
Investment Grade
Leveraged Finance
Value Equity
Growth Equity
Quantitative
Strategies
Quality-Oriented
Equity
AF
FIL
IAT
ES
S
UB
AD
VIS
ER
S
1 RidgeWorth has a minority ownership position in Zevenbergen Capital Investments
Denotes RidgeWorth affiliates and subadvisers
1
Flexible model with diversified investment strategies across affiliates and subadvisers

11
Managed
Accounts
14%
DIVERSITY OF STRATEGIES
Pro forma as of March 31, 2017; totals may not add due to rounding 1Includes Silvant, Rampart, asset allocation and other subadvised strategies 2Primarily includes assets to be managed by investment professionals from Rampart 3Liquidity category includes ultra short bond strategies 4Option strategies
AUM by Asset Class AUM by Product Type
Total AUM: $90.3 billion
Open-End
Mutual
Funds
46%
AUM by Manager
Duff & Phelps
12% Kayne
Anderson
Rudnick
16%
Newfleet
13%
Vontobel
10%
Affiliated Managers
Seix (IG) $15.8
Seix (Lev. Fin.) 13.9
Kayne Anderson Rudnick 14.1
Newfleet 11.8
Ceredex 10.9
Duff & Phelps 10.4
Silvant 1.3
Rampart and Other2 2.2
$80.4
Subadvisers
Vontobel $8.8
Other Subadvisers 1.1
$9.9
Other1
5% Institutional
28%
Funds
Open-End $41.2
Closed-End 6.8
Variable Insurance Funds 0.9
ETFs 0.9
$49.8
Separate Accounts
Institutional $25.0
Managed Accounts 12.4
Structured Products 3.1
$40.5
Seix
(Lev. Fin.)
15%
Ceredex
12%
Seix (IG)
17%
Alternative & Other4
5%
Domestic
Equity
34%
Fixed
Income
43%
Domestic Equity
Large-Cap $14.6
Small-Cap 11.9
Mid-Cap 4.6
$31.1
International Equity
International $9.5
Fixed Income & Liquidity
Taxable $36.3
Non-Taxable 2.7
Liquidity3 6.6
$45.6
Alternative & Other
Alternative $3.6
Other4 0.5
$4.1
Liquidity3
7%
International
Equity
11% Closed-End Funds
8%
Structured Products
3%

12
Majority of mutual fund AUM has strong investment performance
61%
89% 85%
1 Year 3 Year 5 Year
AUM excludes non-rated funds
1 Lipper as of March 31, 2017 2 Based on institutional-class shares, except for two Virtus funds that do not have institutional-class shares (the Strategic Allocation Fund and the Tactical Allocation Fund), for
which A-class shares were used; all fund data as of March 31, 2017
% AUM in Top Half of Peer Group1 Morningstar Rating By Assets2
Morningstar
Rating
# of
Funds
$mm
AUM
% of
AUM
12 $25,951 63%
22 $9,138 22%
19 $3,912 10%
9 $1,216 3%
3 $858 2%
85%
95%
Pro Forma Combined Mutual Fund Assets Under Management
CONSISTENT STRONG PERFORMANCE
Morningstar Normal Distribution
5 Star 4 Star 3 Star 2 Star 1 Star
10% 22.5% 35% 22.5% 10%

13
4 and 5 Star Mutual Funds by Asset Class
Mutual fund AUM as of March 31, 2017 1 Based on institutional-class shares, except for two Virtus funds that do not have institutional-class shares (the Strategic Allocation and Tactical Allocation funds), for which A-
class shares were used; all fund data as of March 31, 2017
Asset Class # of Funds
Fixed Income 15 Funds
U.S. Equity 8 Funds
Alternative /
Allocation 5 Funds
International Equity 6 Funds
Top 5 Largest Mutual Funds
Fund AUM
($B)
M’Star
Rating1
Virtus Emerging Market
Opportunities $7.3 5
Virtus Multi-Sector S/T Bond 7.2 5
RidgeWorth Seix Floating Rate
High Income 5.9 5
RidgeWorth Ceredex Mid-Cap
Value Equity 3.4 5
RidgeWorth Ceredex Large Cap
Value Equity 2.1 4
1
34 mutual funds rated 4 or 5 Stars, including the five largest funds, on a pro forma basis
DIVERSITY OF PERFORMANCE

14 AUM as of March 31, 2017
Institutional
13%
Institutional
51% Retail
49%
Retail
69% Retail
87%
Virtus ($48.0B) RidgeWorth ($42.3B) Pro Forma ($90.3B)
Institutional
31%
AU
M b
y C
lien
t T
yp
e
The transaction substantially grows the institutional business and enhances retail distribution
EFFECTIVE DISTRIBUTION CAPABILITIES
Adds ~$20 billion of assets, and expands our
product offerings and distribution resources
Experienced institutional sales / client service
team
Multiple institutional-quality offerings
Diversified and stable client base
Direct and consultant-sourced relationships
The transaction strengthens Virtus’ retail
distribution approach by adding
complementary capabilities and creating
significant opportunities for future growth
Greater access and support for Virtus funds in
the DCIO channel
Increased exposure for RidgeWorth funds in
the wirehouse channel
Institutional Retail

FINANCIAL REVIEW

KEY OPERATING ATTRIBUTES
Revenues Diverse in terms of product types, investment strategies and affiliates
Competitive net management fee rate
Majority of revenues from recurring asset-based fees; modest performance fees
Management fees recorded net of fees paid to unaffiliated subadvisers
Employment Expenses Highly variable cost structure; balance between fixed and variable expenses
Affiliate incentive pools based on contribution to operating profit; a portion paid
in form of restricted equity to align and retain key talent
Alignment of sales-based compensation to sales levels and relative profit
contribution
Operating Margins
Proven operating leverage, fixed cost discipline and efficient business support
functions contribute to profit margins that are competitive with other publicly
traded multi-boutique asset managers
16

KEY CAPITAL POLICIES
Working Capital Manage working capital to ensure adequate resources available for near-term
liquidity requirements
Evaluate as a percentage of annual spend, defined as GAAP operating
expenses
Target working capital to spend ratio of 50-75% to ensure operating flexibility
Seed Capital and
Structured Product
Investments
Seed capital investments consist of primarily highly liquid investments in mutual
funds and separately managed accounts for the purpose of 1) establishing track
records and 2) gaining distribution access
Maintain seed capital range of $125 - $175 million; variability based on other
capital priorities, product and distribution needs
Structured products consist of primarily CLO equity investments in company-
sponsored CLOs where affiliates act as collateral manager
Capital Management Operate the company through a filter of an investment grade credit
Maintain financial flexibility to balance leverage levels with ability to grow and
invest in the business
Focus on servicing interest expense on debt and maintenance of dividends to
preferred and common shareholders
Target leverage ratio of less than 2x
17
18
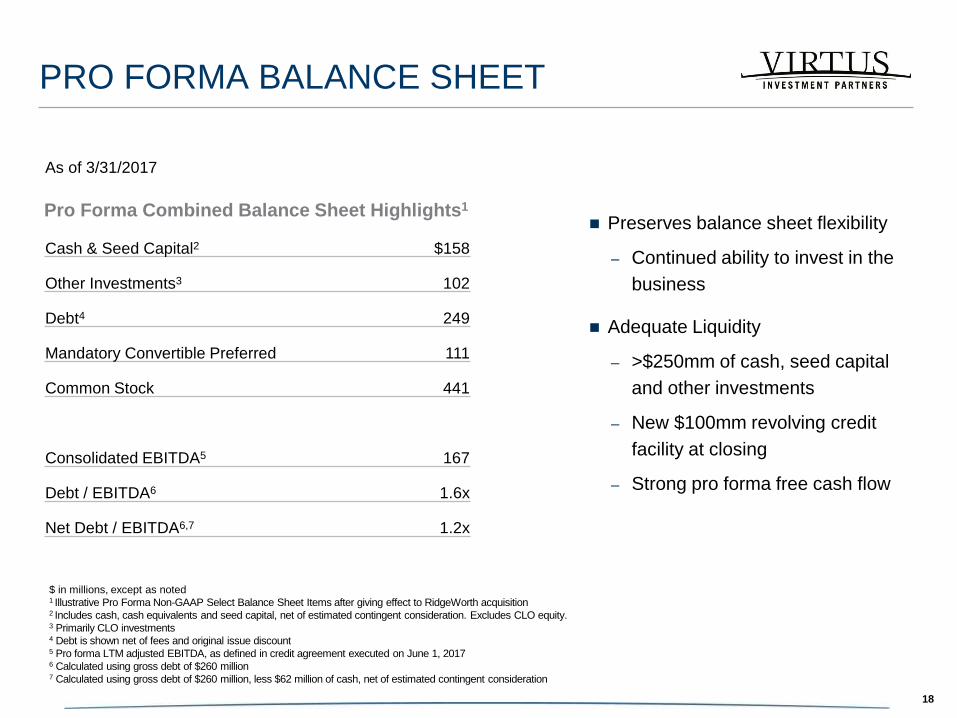
Preserves balance sheet flexibility
– Continued ability to invest in the
business
Adequate Liquidity
– >$250mm of cash, seed capital
and other investments
– New $100mm revolving credit
facility at closing
– Strong pro forma free cash flow
PRO FORMA BALANCE SHEET
As of 3/31/2017
Cash & Seed Capital2 $158
Other Investments3 102
Debt4 249
Mandatory Convertible Preferred 111
Common Stock 441
Consolidated EBITDA5 167
Debt / EBITDA6 1.6x
Net Debt / EBITDA6,7 1.2x
Pro Forma Combined Balance Sheet Highlights1
$ in millions, except as noted 1 Illustrative Pro Forma Non-GAAP Select Balance Sheet Items after giving effect to RidgeWorth acquisition 2 Includes cash, cash equivalents and seed capital, net of estimated contingent consideration. Excludes CLO equity. 3 Primarily CLO investments 4 Debt is shown net of fees and original issue discount 5 Pro forma LTM adjusted EBITDA, as defined in credit agreement executed on June 1, 2017 6 Calculated using gross debt of $260 million
7 Calculated using gross debt of $260 million, less $62 million of cash, net of estimated contingent consideration

GROWTH OPPORTUNITIES

MULTIPLE OPPORTUNITIES FOR GROWTH
20
Area Growth Opportunities RidgeWorth Acquisition
Product Leverage capabilities of current managers
Offer existing strategies in other product structures
Broaden capabilities with new teams/managers
Distribution Increase market share in retail channels
Deepen presence in other channels
Expand into non-U.S. distribution channels
Inorganic Leverage multi-boutique platform by adding targeted capabilities
Maintain selective and disciplined approach to inorganic growth
opportunities
SUMMARY
Flexible Multi-Boutique Asset Manager
Diverse, High-Quality Product Offerings
Effective Distribution Capabilities
Attractive Financial Profile
Multiple Opportunities for Growth
21

APPENDIX
VIRTUS HISTORY
23
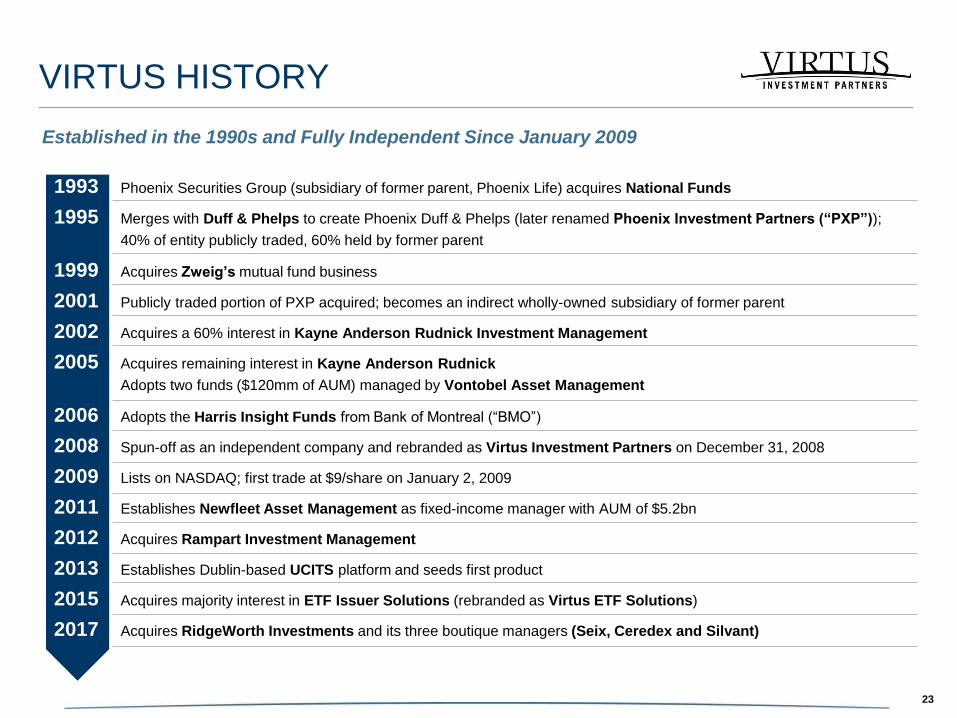
Established in the 1990s and Fully Independent Since January 2009
1993 Phoenix Securities Group (subsidiary of former parent, Phoenix Life) acquires National Funds
1995 Merges with Duff & Phelps to create Phoenix Duff & Phelps (later renamed Phoenix Investment Partners (“PXP”));
40% of entity publicly traded, 60% held by former parent
1999 Acquires Zweig’s mutual fund business
2001 Publicly traded portion of PXP acquired; becomes an indirect wholly-owned subsidiary of former parent
2002 Acquires a 60% interest in Kayne Anderson Rudnick Investment Management
2005 Acquires remaining interest in Kayne Anderson Rudnick
Adopts two funds ($120mm of AUM) managed by Vontobel Asset Management
2006 Adopts the Harris Insight Funds from Bank of Montreal (“BMO”)
2008 Spun-off as an independent company and rebranded as Virtus Investment Partners on December 31, 2008
2009 Lists on NASDAQ; first trade at $9/share on January 2, 2009
2011 Establishes Newfleet Asset Management as fixed-income manager with AUM of $5.2bn
2012 Acquires Rampart Investment Management
2013 Establishes Dublin-based UCITS platform and seeds first product
2015 Acquires majority interest in ETF Issuer Solutions (rebranded as Virtus ETF Solutions)
2017 Acquires RidgeWorth Investments and its three boutique managers (Seix, Ceredex and Silvant)
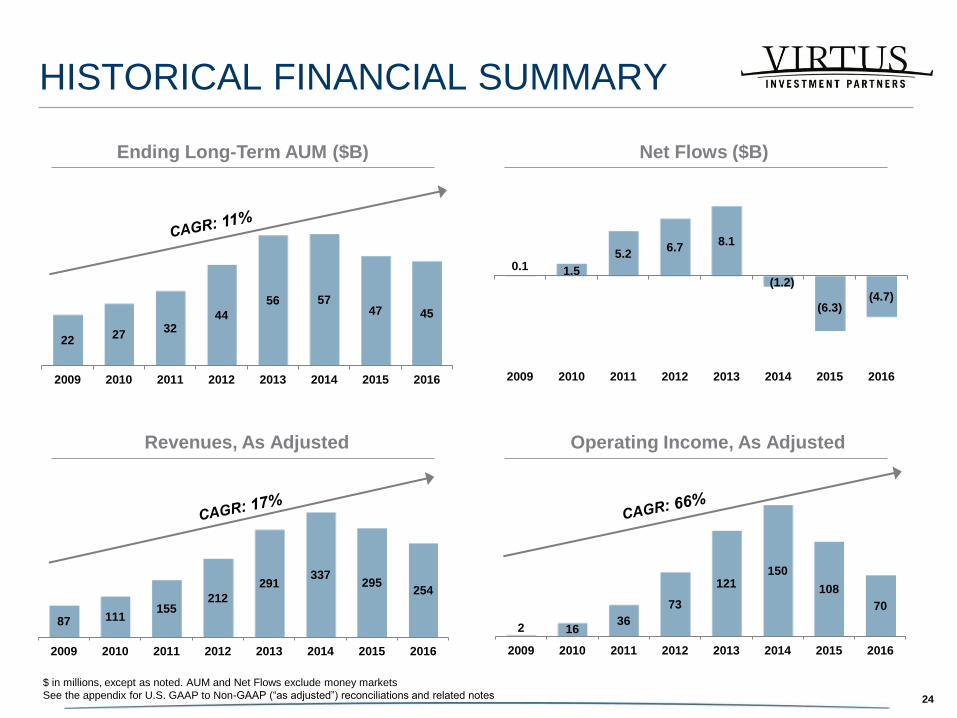
0.1 1.5
5.2 6.7
8.1
(1.2)
(6.3) (4.7)
2009 2010 2011 2012 2013 2014 2015 2016
HISTORICAL FINANCIAL SUMMARY
24
Ending Long-Term AUM ($B) Net Flows ($B)
22 27
32 44
56 57 47 45
2009 2010 2011 2012 2013 2014 2015 2016
Revenues, As Adjusted Operating Income, As Adjusted
87 111 155
212
291 337
295 254
2009 2010 2011 2012 2013 2014 2015 2016
2 16 36
73
121 150
108
70
2009 2010 2011 2012 2013 2014 2015 2016
$ in millions, except as noted. AUM and Net Flows exclude money markets
See the appendix for U.S. GAAP to Non-GAAP (“as adjusted”) reconciliations and related notes
25
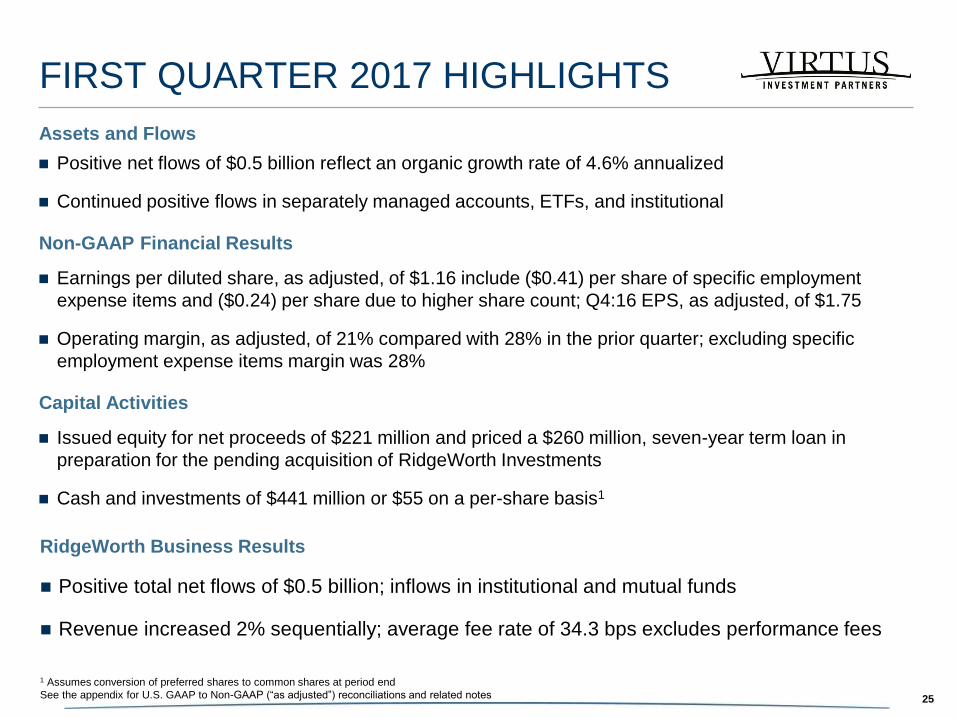
FIRST QUARTER 2017 HIGHLIGHTS
Assets and Flows
1 Assumes conversion of preferred shares to common shares at period end
See the appendix for U.S. GAAP to Non-GAAP (“as adjusted”) reconciliations and related notes
Positive net flows of $0.5 billion reflect an organic growth rate of 4.6% annualized
Continued positive flows in separately managed accounts, ETFs, and institutional
Earnings per diluted share, as adjusted, of $1.16 include ($0.41) per share of specific employment
expense items and ($0.24) per share due to higher share count; Q4:16 EPS, as adjusted, of $1.75
Operating margin, as adjusted, of 21% compared with 28% in the prior quarter; excluding specific
employment expense items margin was 28%
Issued equity for net proceeds of $221 million and priced a $260 million, seven-year term loan in
preparation for the pending acquisition of RidgeWorth Investments
Cash and investments of $441 million or $55 on a per-share basis1
Non-GAAP Financial Results
Capital Activities
RidgeWorth Business Results
Positive total net flows of $0.5 billion; inflows in institutional and mutual funds
Revenue increased 2% sequentially; average fee rate of 34.3 bps excludes performance fees

$45.7 $45.2 $46.5 $45.4 $48.0
3/31/16 6/30/16 9/30/16 12/31/16 3/31/17
AUM profile
is diversified
by product
type as well
as asset
class
ASSETS UNDER MANAGEMENT
26
$ in billions 1 Consists of real estate securities, master limited partnerships, and other 2 Consists of option strategies
Assets By Asset Class
Equity 59.3% 58.0% 57.3% 56.9% 58.3%
Fixed 32.8% 34.2% 33.9% 34.2% 33.1%
Alternatives1 6.8% 6.8% 7.9% 7.8% 7.6%
Other2 1.1% 1.0% 0.9% 1.1% 1.0%

First quarter
was the best
for flows in
10 quarters
Inflows/(Outflows)
ASSET FLOWS
27
Metrics
Net Flows ($2.6) ($2.2) $0.5 ($0.4) $0.5
Net Flow Rate1 (22.2%) (19.0%) 4.3% (3.2%) 4.6%
$2.8 $2.4 $3.1 $2.6
$3.3
Q1 16 Q2 16 Q3 16 Q4 16 Q1 17
($5.4) ($4.6)
($2.6) ($3.0) ($2.8)
1 Annualized net flows divided by beginning-of-period AUM
Net flows
Inflows
Outflows
$ in billions

Excluding
$4.9 million
of specific
employment
items,
margin
would have
been 28.4%
Operating Income, As Adjusted
NON-GAAP RESULTS
28
Metrics
Net Income, As Adjusted $9.5 $10.3 $12.9 $11.6 $8.6
Operating Margin, As Adjusted 24.4% 26.6% 31.2% 28.4% 20.9%
Diluted earnings per share, as adjusted
$15.2 $16.7
$20.3 $18.2
$13.5
Q1 16 Q2 16 Q3 16 Q4 16 Q1 17
$1.24
$1.64 $1.75
$1.12 $1.16
$ in millions, except per share data
See the appendix for U.S. GAAP to Non-GAAP (“as adjusted”) reconciliations and related notes

CAPITAL POSITION
29
Metrics
Cash and Investments Per Share $46 $48 $50 $46 $55
Return of Capital $19.9 $51.2 $13.7 $164.2 $7.2
Borrowing Capacity $75.0 $75.0 $150.0 $120.0 $150.0
Basic Shares Outstanding 8.260 7.718 7.610 5.889 6.989
$50
$156 $165
$65
$236
$281
$174 $179
$180
$175 $52 $38 $38
$29
$31
3/31/16 6/30/16 9/30/16 12/31/16 3/31/17
$383 $368
$ and shares outstanding in millions, except per share data
$383
Cash and Investments Cash and cash equivalents
Seed investments
Investments – other
$274
$441

30
U.S. GAAP TO NON-GAAP RECONCILIATION – Q1 2017
$ and share counts in thousands, except per share data
U.S. GAAP
Basis
Distribution and
other asset-
based expenses
Consolidated
investment
products
Amortization
of intangible
assets
Seed capital and
CLO investments
Acquisition and
integration
expenses Other
Non-GAAP
Basis
Revenues
Investment management fees 59,271$ -$ 242$ -$ -$ -$ -$ 59,513$
Distribution and services fees 10,783 - 10 - - - - 10,793
Administration and transfer agent fees 8,981 - 34 - - - - 9,015
Other income and fees 741 - - - - - - 741
Distribution and other asset-based expenses - (15,323) - - - - - (15,323)
Total revenues 79,776 (15,323) 286 - - - - 64,739
Operating Expenses
Employment expenses 39,641 - - - - - - 39,641
Distribution and other asset-based expenses 15,323 (15,323) - - - - - -
Other operating expense 13,226 - - - - (1,629) (669) 10,928
Other operating expenses of consolidated sponsored investment products 577 - (577) - - - - -
Other operating expenses of consolidated investment products 65 - (65) - - - - -
Depreciation and other amortization 664 - - - - - - 664
Amortization expense 233 - - (233) - - - -
Total operating expenses 69,729 (15,323) (642) (233) - (1,629) (669) 51,233
Operating Income 10,047 - 928 233 - 1,629 669 13,506
Other Income (Expense)
Realized and unrealized gain (loss) on investments, net 297 - 3,513 - (3,810) - - -
Realized and unrealized gain (loss) on investments
of consolidated sponsored investment products, net 3,726 - (3,726) - - - - -
Realized and unrealized gain (loss) on investments
of consolidated investment product, net 718 - (718) - - - - -
Other income (expense), net 646 - 1,424 - (1,424) - - 646
Total other income (expense), net 5,387 - 493 - (5,234) - - 646
Interest Income (Expense)
Interest expense (243) - - - - - - (243)
Interest and dividend income 188 - 660 - (733) - - 115
Interest and dividend income of investments of
consolidated sponsored investment products, net 1,495 - (1,495) - - - - -
Interest income of consolidated investment product 4,161 - (4,161) - - - - -
Interest expense of consolidated investment product (2,857) - 2,857 - - - - -
Total interest (expense) income, net 2,744 - (2,139) - (733) - - (128)
Income Before Income Taxes 18,178 - (718) 233 (5,967) 1,629 669 14,024
Income tax expense 4,433 - - 90 (288) 628 544 5,407
Net Income 13,745 - (718) 143 (5,679) 1,001 125 8,617
Preferred stockholder dividends (2,084) - - - - - 2,084 -
Noncontrolling interests (718) - 718 - - - - -
Net Income Attributable to Common Stockholders 10,943$ -$ -$ 143$ (5,679)$ 1,001$ 2,209$ 8,617$
Earnings Per Share - Basic 1.67$ 1.19$
Earnings Per Share - Diluted 1.62$ 1.16$
Weighted Average Shares Outstanding - Basic (in thousands) 6,542 7,217
Weighted Average Shares Outstanding - Diluted (in thousands) 6,773 7,447
Reclassifications Adjustments

31
U.S. GAAP TO NON-GAAP RECONCILIATION – Q4 2016
$ and share counts in thousands, except per share data
U.S. GAAP
Basis
Distribution and
other asset-
based expenses
Consolidated
investment
products
Amortization
of intangible
assets
Seed capital and
CLO investments
Acquisition and
integration
expenses Other
Non-GAAP
Basis
Revenues
Investment management fees 58,996$ -$ 283$ -$ -$ -$ -$ 59,279$
Distribution and services fees 11,489 - 11 - - - - 11,500
Administration and transfer agent fees 9,176 - 35 - - - - 9,211
Other income and fees 189 - - - - - - 189
Distribution and other asset-based expenses - (16,136) - - - - - (16,136)
Total revenues 79,850 (16,136) 329 - - - - 64,043
Operating Expenses
Employment expenses 33,457 - - - - - - 33,457
Distribution and other asset-based expenses 16,136 (16,136) - - - - - -
Other operating expense 15,660 - - - - (3,347) (611) 11,702
Other operating expenses of consolidated sponsored investment products 488 - (488) - - - - -
Other operating expenses of consolidated investment products 23 - (23) - - - - -
Restructuring and severance - - - - - - - -
Depreciation and other amortization 700 - - - - - - 700
Amortization expense 603 - - (603) - - - -
Total operating expenses 67,067 (16,136) (511) (603) - (3,347) (611) 45,859
Operating Income 12,783 - 840 603 - 3,347 611 18,184
Other Income (Expense)
Realized and unrealized gain (loss) on investments, net 1,398 - (2,555) - 1,158 - - 1
Realized and unrealized gain (loss) on investments
of consolidated sponsored investment products, net (3,110) - 3,110 - - - - -
Realized and unrealized gain (loss) on investments
of consolidated investment product, net (4,030) - 4,030 - - - - -
Other income (expense), net 626 - (1,774) - 1,774 - - 626
Total other income (expense), net (5,116) - 2,811 - 2,932 - - 627
Interest Income (Expense)
Interest expense (290) - - - - - - (290)
Interest and dividend income 630 - 1,300 - (1,848) - - 82
Interest and dividend income of investments of
consolidated sponsored investment products, net 1,488 - (1,488) - - - - -
Interest income of consolidated investment product 4,058 - (4,058) - - - - -
Interest expense of consolidated investment product (1,104) - 1,104 - - - - -
Total interest (expense) income, net 4,782 - (3,142) - (1,848) - - (208)
Income Before Income Taxes 12,449 - 509 603 1,084 3,347 611 18,603
Income tax expense 532 - - 227 4,754 1,260 230 7,003
Net Income 11,917 - 509 376 (3,670) 2,087 381 11,600
Noncontrolling interests 509 - (509) - - - - -
Net Income Attributable to Common Stockholders 12,426$ -$ -$ 376$ (3,670)$ 2,087$ 381$ 11,600$
Earnings Per Share - Basic 1.94$ 1.81$
Earnings Per Share - Diluted 1.87$ 1.75$
Weighted Average Shares Outstanding - Basic (in thousands) 6,413 6,413
Weighted Average Shares Outstanding - Diluted (in thousands) 6,627 6,627
Reclassifications Adjustments
32
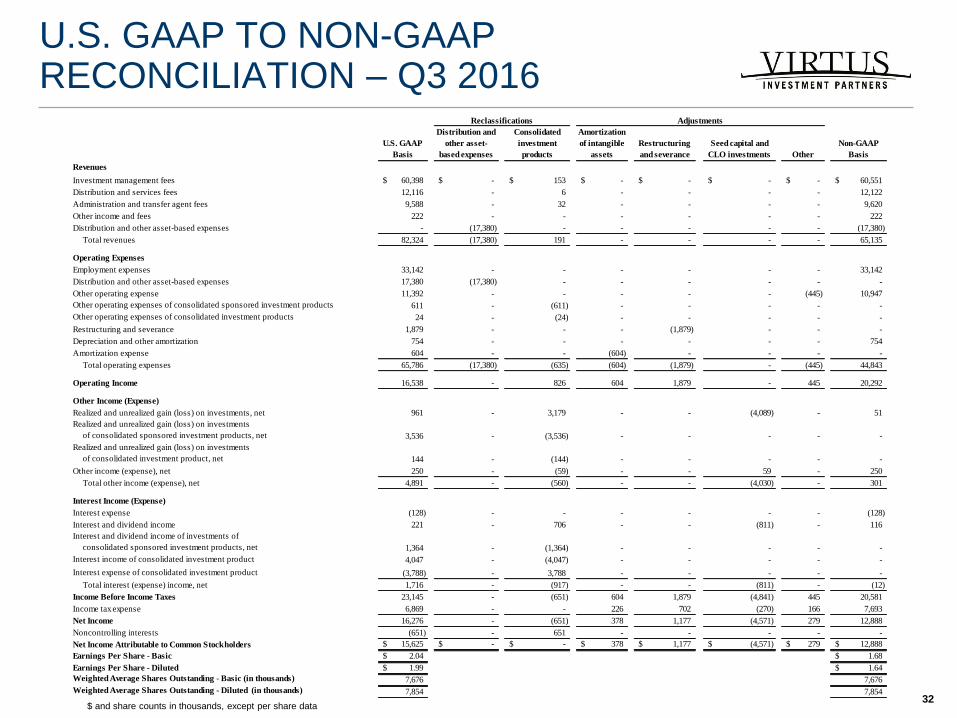
U.S. GAAP TO NON-GAAP RECONCILIATION – Q3 2016
$ and share counts in thousands, except per share data
U.S. GAAP
Basis
Distribution and
other asset-
based expenses
Consolidated
investment
products
Amortization
of intangible
assets
Restructuring
and severance
Seed capital and
CLO investments Other
Non-GAAP
Basis
Revenues
Investment management fees 60,398$ -$ 153$ -$ -$ -$ -$ 60,551$
Distribution and services fees 12,116 - 6 - - - - 12,122
Administration and transfer agent fees 9,588 - 32 - - - - 9,620
Other income and fees 222 - - - - - - 222
Distribution and other asset-based expenses - (17,380) - - - - - (17,380)
Total revenues 82,324 (17,380) 191 - - - - 65,135
Operating Expenses
Employment expenses 33,142 - - - - - - 33,142
Distribution and other asset-based expenses 17,380 (17,380) - - - - - -
Other operating expense 11,392 - - - - - (445) 10,947
Other operating expenses of consolidated sponsored investment products 611 - (611) - - - - -
Other operating expenses of consolidated investment products 24 - (24) - - - - -
Restructuring and severance 1,879 - - - (1,879) - - -
Depreciation and other amortization 754 - - - - - - 754
Amortization expense 604 - - (604) - - - -
Total operating expenses 65,786 (17,380) (635) (604) (1,879) - (445) 44,843
Operating Income 16,538 - 826 604 1,879 - 445 20,292
Other Income (Expense)
Realized and unrealized gain (loss) on investments, net 961 - 3,179 - - (4,089) - 51
Realized and unrealized gain (loss) on investments
of consolidated sponsored investment products, net 3,536 - (3,536) - - - - -
Realized and unrealized gain (loss) on investments
of consolidated investment product, net 144 - (144) - - - - -
Other income (expense), net 250 - (59) - - 59 - 250
Total other income (expense), net 4,891 - (560) - - (4,030) - 301
Interest Income (Expense)
Interest expense (128) - - - - - - (128)
Interest and dividend income 221 - 706 - - (811) - 116
Interest and dividend income of investments of
consolidated sponsored investment products, net 1,364 - (1,364) - - - - -
Interest income of consolidated investment product 4,047 - (4,047) - - - - -
Interest expense of consolidated investment product (3,788) - 3,788 - - - - -
Total interest (expense) income, net 1,716 - (917) - - (811) - (12)
Income Before Income Taxes 23,145 - (651) 604 1,879 (4,841) 445 20,581
Income tax expense 6,869 - - 226 702 (270) 166 7,693
Net Income 16,276 - (651) 378 1,177 (4,571) 279 12,888
Noncontrolling interests (651) - 651 - - - - -
Net Income Attributable to Common Stockholders 15,625$ -$ -$ 378$ 1,177$ (4,571)$ 279$ 12,888$
Earnings Per Share - Basic 2.04$ 1.68$
Earnings Per Share - Diluted 1.99$ 1.64$
Weighted Average Shares Outstanding - Basic (in thousands) 7,676 7,676
Weighted Average Shares Outstanding - Diluted (in thousands) 7,854 7,854
Reclassifications Adjustments

33
U.S. GAAP TO NON-GAAP RECONCILIATION – Q2 2016
$ and share counts in thousands, except per share data
U.S. GAAP
Basis
Distribution and
other asset-
based expenses
Consolidated
investment
products
Amortization
of intangible
assets
Restructuring
and severance
Seed capital and
CLO investments Other
Non-GAAP
Basis
Revenues
Investment management fees 58,192$ -$ (88)$ -$ -$ -$ -$ 58,104$
Distribution and services fees 12,167 - 12 - - - - 12,179
Administration and transfer agent fees 9,499 - 49 - - - - 9,548
Other income and fees 227 - - - - - - 227
Distribution and other asset-based expenses - (17,432) - - - - - (17,432)
Total revenues 80,085 (17,432) (27) - - - - 62,626
Operating Expenses
Employment expenses 33,065 - - - - - - 33,065
Distribution and other asset-based expenses 17,432 (17,432) - - - - - -
Other operating expense 12,457 - - - - - (358) 12,099
Other operating expenses of consolidated sponsored investment products 777 - (777) - - - - -
Other operating expenses of consolidated investment products 3,841 - (3,841) - - - - -
Restructuring and severance 2,391 - - - (2,391) - - -
Depreciation and other amortization 776 - - - - - - 776
Amortization expense 603 - - (603) - - - -
Total operating expenses 71,342 (17,432) (4,618) (603) (2,391) - (358) 45,940
Operating Income 8,743 - 4,591 603 2,391 - 358 16,686
Other Income (Expense)
Realized and unrealized gain (loss) on investments, net 3,281 - 2,923 - - (6,110) - 94
Realized and unrealized gain (loss) on investments
of consolidated sponsored investment products, net 3,097 - (3,097) - - - - -
Realized and unrealized gain (loss) on investments
of consolidated investment product, net 581 - (581) - - - - -
Other (expense) income, net (15) - (8,799) - - 8,799 - (15)
Total other income (expense), net 6,944 - (9,554) - - 2,689 - 79
Interest Income (Expense)
Interest expense (129) - - - - - - (129)
Interest and dividend income 619 - 2,961 - - (3,470) - 110
Interest and dividend income of investments of
consolidated sponsored investment products, net 1,696 - (1,696) - - - - -
Interest income of consolidated investment product 2,582 - (2,582) - - - - -
Interest expense of consolidated investment product (5,668) - 5,668 - - - - -
Total interest (expense) income, net (900) - 4,351 - - (3,470) - (19)
Income Before Income Taxes 14,787 - (612) 603 2,391 (781) 358 16,746
Income tax expense 6,087 - - 232 921 (930) 138 6,448
Net Income 8,700 - (612) 371 1,470 149 220 10,298
Noncontrolling interests (612) - 612 - - - - -
Net Income Attributable to Common Stockholders 8,088$ -$ -$ 371$ 1,470$ 149$ 220$ 10,298$
Earnings Per Share - Basic 0.99$ 1.26$
Earnings Per Share - Diluted 0.97$ 1.24$
Weighted Average Shares Outstanding - Basic (in thousands) 8,170 8,170
Weighted Average Shares Outstanding - Diluted (in thousands) 8,314 8,314
Reclassifications Adjustments

34
U.S. GAAP TO NON-GAAP RECONCILIATION – Q1 2016
$ and share counts in thousands, except per share data
U.S. GAAP
Basis
Distribution and
other asset-
based expenses
Consolidated
investment
products
Amortization
of intangible
assets
Seed capital and
CLO investments Other
Non-GAAP
Basis
Revenues
Investment management fees 57,644$ -$ 91$ -$ -$ -$ 57,735$
Distribution and services fees 12,478 - 24 - - - 12,502
Administration and transfer agent fees 9,998 - 94 - - - 10,092
Other income and fees 175 - - - - - 175
Distribution and other asset-based expenses - (18,101) - - - - (18,101)
Total revenues 80,295 (18,101) 209 - - - 62,403
Operating Expenses
Employment expenses 35,977 - - - - - 35,977
Distribution and other asset-based expenses 18,101 (18,101) - - - - -
Other operating expense 10,765 - - - - (414) 10,351
Other operating expenses of consolidated sponsored investment products 1,133 - (1,133) - - - -
Other operating expenses of consolidated investment products 56 - (56) - - - -
Depreciation and other amortization 862 - - - - - 862
Amortization expense 651 - - (651) - - -
Total operating expenses 67,545 (18,101) (1,189) (651) - (414) 47,190
Operating Income 12,750 - 1,398 651 - 414 15,213
Other Income (Expense)
Realized and unrealized (loss) gain on investments, net (658) - 1,808 - (1,155) - (5)
Realized and unrealized gain (loss) on investments
of consolidated sponsored investment products, net 295 - (295) - - - -
Realized and unrealized gain (loss) on investments
of consolidated investment product, net 2,235 - (2,235) - - - -
Other income, net 228 - 2,504 - (2,504) - 228
Total other (expense) income, net 2,100 - 1,782 - (3,659) - 223
Interest Income (Expense)
Interest expense (132) - - - - - (132)
Interest and dividend income 273 - 1,748 - (1,883) - 138
Interest and dividend income of investments of
consolidated sponsored investment products, net 2,961 - (2,961) - - - -
Interest income of consolidated investment product 2,206 - (2,206) - - - -
Interest expense of consolidated investment product (732) - 732 - - - -
Total interest income, net 4,576 - (2,687) - (1,883) - 6
Income Before Income Taxes 19,426 - 493 651 (5,542) 414 15,442
Income tax expense 7,556 - - 250 (2,045) 159 5,920
Net Income 11,870 - 493 401 (3,497) 255 9,522
Noncontrolling interests 493 - (493) - - - -
Net Income Attributable to Common Stockholders 12,363$ -$ -$ 401$ (3,497)$ 255$ 9,522$
Earnings Per Share - Basic 1.48$ 1.14$
Earnings Per Share - Diluted 1.45$ 1.12$
Weighted Average Shares Outstanding - Basic (in thousands) 8,344 8,344
Weighted Average Shares Outstanding - Diluted (in thousands) 8,506 8,506
Reclassifications Adjustments

35
Non-GAAP financial measures differ from financial measures determined in accordance with U.S. GAAP as a result of the reclassification of certain income
statement items, as well as the exclusion of certain expenses and other items that are not reflective of the earnings generated from providing investment
management and related services. Non-GAAP financial measures have material limitations and should not be viewed in isolation or as a substitute for U.S. GAAP
measures.
Notes to Reconciliations:
1. Distribution and other asset-based expenses - Primarily payments to third-party distribution partners for providing services to investors in our sponsored funds
and payments to third-party service providers for investment management-related services. Management believes that making this adjustment aids in
comparing the company’s operating results with other asset management firms that do not utilize intermediary distribution par tners or third-party service
providers.
2. Consolidated investment products - Revenues and expenses generated by operating activities of majority owned seed capital related mutual funds and CLOs.
Management believes that excluding these operating activities to reflect revenues and expenses of the company prior to the consolidation of these products is
consistent with the approach of reflecting its operating results from managing client assets.
3. Amortization of intangible assets - Non-cash amortization expense or impairment expense, if any, attributable to acquisition-related intangible assets.
Management believes that making this adjustment aids in comparing the company’s operating results with other asset management firms that have not
engaged in acquisitions.
4. Restructuring and severance - Certain expenses associated with restructuring the business, including lease abandonment-related expenses, and severance
costs associated with staff reductions, that are not reflective of the ongoing earnings generation of the business. Management believes that making this
adjustment aids in comparing the company's operating results with prior periods.
5. Seed capital and CLO investments earnings/(losses) - Gains and losses (realized and unrealized), dividends and interest income generated by seed capital
and CLO investments. Earnings or losses generated by investments in seed capital and CLO investments can vary significantly from period to period and do
not reflect the company’s operating results from providing investment management and related services. Management believes that making this adjustment
aids in comparing the company’s operating results with prior periods and with other asset management firms that do not have meaningful seed capital and
CLO investments.
6. Acquisition and integration expenses - Expenses that are directly related to acquisition and integration activities. Acquisition expenses include transaction
closing costs, professional fees and financing fees. Integration expenses include costs incurred that are directly attributable to combining the businesses,
including compensation, restructuring and severance charges, professional fees, consulting fees and other expenses. Management believes that making these
adjustments aids in comparing the company’s operating results with other asset management firms that have not engaged in acqu isitions.
7. Other - Certain expenses that are not reflective of the ongoing earnings generation of the business. In addition, it includes income tax expense/(benefit) items,
such as adjustments for uncertain tax positions, valuation allowances and other unusual or infrequent items not related to current operating results to reflect a
normalized effective rate. Management believes that making these adjustments aids in comparing the company’s operating results with prior periods.
FOOTNOTES

36
FOOTNOTES
Components of Other for the respective periods are shown in the table below:
Q1:16 Q2:16 Q3:16 Q4:16 Q1:17 YTD:16 YTD:17
Other ($ in thousands)
System transition expenses $414 $358 $445 $611 $669 $414 $669
Tax impact of transition expenses (159) (138) (166) (230) (258) (159) (258)
Discrete tax adjustments - - - - (286) - (286)
Preferred stockholder dividends - - - - 2,084 - 2,084
Total Other $255 $220 $279 $381 $2,209 $255 $2,209
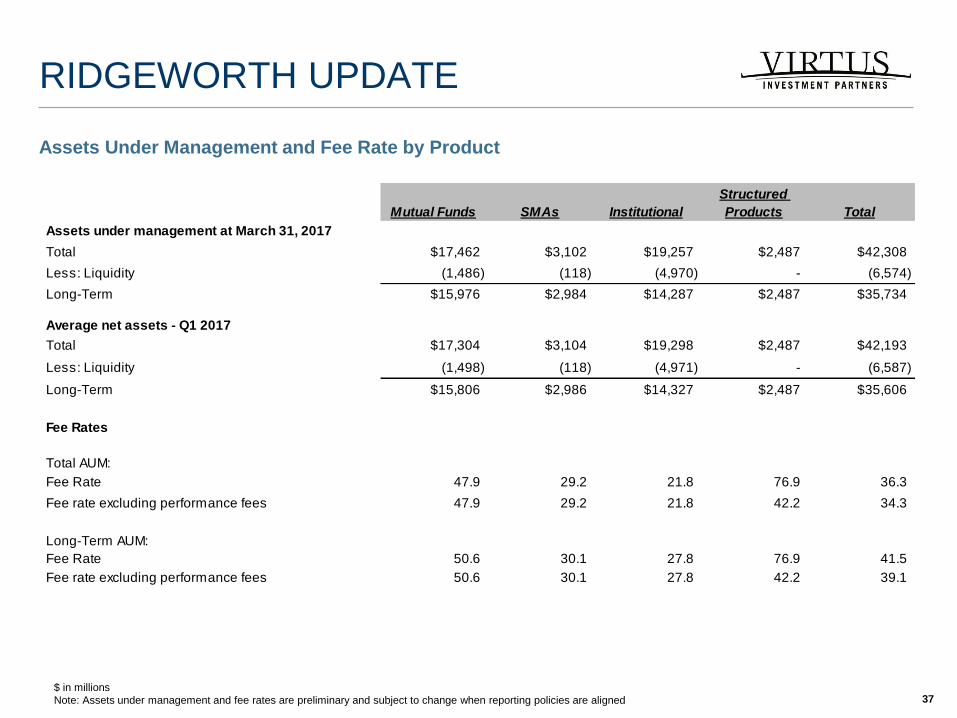
37 $ in millions
Note: Assets under management and fee rates are preliminary and subject to change when reporting policies are aligned
RIDGEWORTH UPDATE
Assets Under Management and Fee Rate by Product
Mutual Funds SMAs Institutional
Structured
Products Total
Assets under management at March 31, 2017
Total $17,462 $3,102 $19,257 $2,487 $42,308
Less: Liquidity (1,486) (118) (4,970) - (6,574)
Long-Term $15,976 $2,984 $14,287 $2,487 $35,734
Average net assets - Q1 2017
Total $17,304 $3,104 $19,298 $2,487 $42,193
Less: Liquidity (1,498) (118) (4,971) - (6,587)
Long-Term $15,806 $2,986 $14,327 $2,487 $35,606
Fee Rates
Total AUM:
Fee Rate 47.9 29.2 21.8 76.9 36.3
Fee rate excluding performance fees 47.9 29.2 21.8 42.2 34.3
Long-Term AUM:
Fee Rate 50.6 30.1 27.8 76.9 41.5
Fee rate excluding performance fees 50.6 30.1 27.8 42.2 39.1
38
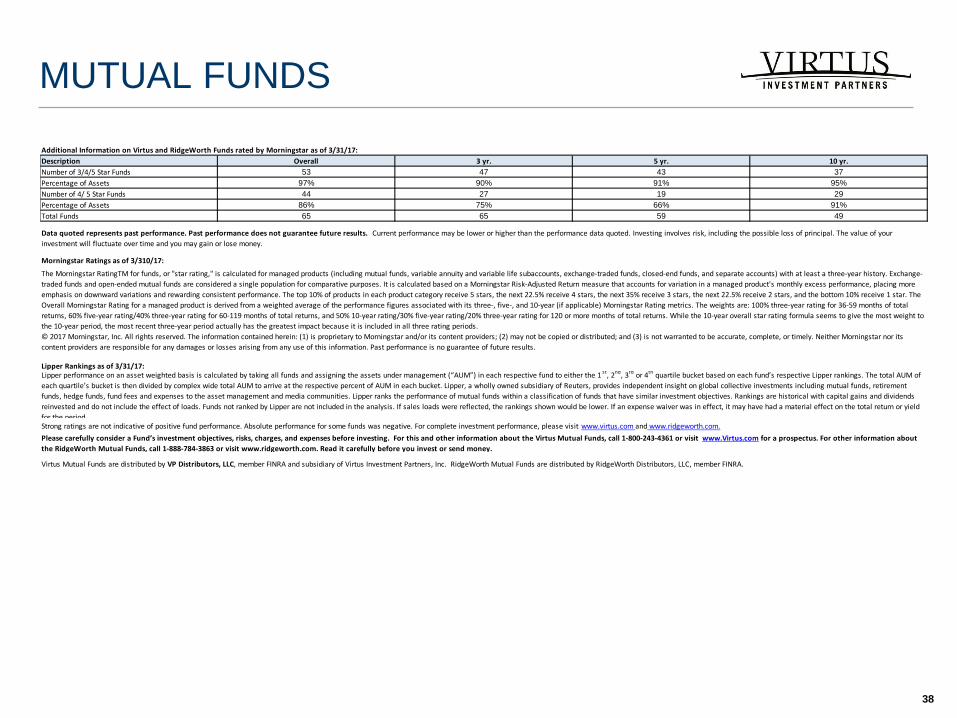
MUTUAL FUNDS
Additional Information on Virtus and RidgeWorth Funds rated by Morningstar as of 3/31/17:
Description Overall 3 yr. 5 yr. 10 yr.
Number of 3/4/5 Star Funds 53 47 43 37
Percentage of Assets 97% 90% 91% 95%
Number of 4/ 5 Star Funds 44 27 19 29
Percentage of Assets 86% 75% 66% 91%
Total Funds 65 65 59 49
Morningstar Ratings as of 3/310/17:
Lipper Rankings as of 3/31/17:
Data quoted represents past performance. Past performance does not guarantee future results. Current performance may be lower or higher than the performance data quoted. Investing involves risk, including the possible loss of principal. The value of your
investment will fluctuate over time and you may gain or lose money.
The Morningstar RatingTM for funds, or "star rating," is calculated for managed products (including mutual funds, variable annuity and variable life subaccounts, exchange-traded funds, closed-end funds, and separate accounts) with at least a three-year history. Exchange-
traded funds and open-ended mutual funds are considered a single population for comparative purposes. It is calculated based on a Morningstar Risk-Adjusted Return measure that accounts for variation in a managed product's monthly excess performance, placing more
emphasis on downward variations and rewarding consistent performance. The top 10% of products in each product category receive 5 stars, the next 22.5% receive 4 stars, the next 35% receive 3 stars, the next 22.5% receive 2 stars, and the bottom 10% receive 1 star. The
Overall Morningstar Rating for a managed product is derived from a weighted average of the performance figures associated with its three-, five-, and 10-year (if applicable) Morningstar Rating metrics. The weights are: 100% three-year rating for 36-59 months of total
returns, 60% five-year rating/40% three-year rating for 60-119 months of total returns, and 50% 10-year rating/30% five-year rating/20% three-year rating for 120 or more months of total returns. While the 10-year overall star rating formula seems to give the most weight to
the 10-year period, the most recent three-year period actually has the greatest impact because it is included in all three rating periods.
© 2017 Morningstar, Inc. All rights reserved. The information contained herein: (1) is proprietary to Morningstar and/or its content providers; (2) may not be copied or distributed; and (3) is not warranted to be accurate, complete, or timely. Neither Morningstar nor its
content providers are responsible for any damages or losses arising from any use of this information. Past performance is no guarantee of future results.
Lipper performance on an asset weighted basis is calculated by taking all funds and assigning the assets under management (“AUM”) in each respective fund to either the 1st
, 2nd
, 3rd
or 4th
quartile bucket based on each fund’s respective Lipper rankings. The total AUM of
each quartile’s bucket is then divided by complex wide total AUM to arrive at the respective percent of AUM in each bucket. Lipper, a wholly owned subsidiary of Reuters, provides independent insight on global collective investments including mutual funds, retirement
funds, hedge funds, fund fees and expenses to the asset management and media communities. Lipper ranks the performance of mutual funds within a classification of funds that have similar investment objectives. Rankings are historical with capital gains and dividends
reinvested and do not include the effect of loads. Funds not ranked by Lipper are not included in the analysis. If sales loads were reflected, the rankings shown would be lower. If an expense waiver was in effect, it may have had a material effect on the total return or yield
for the period.Strong ratings are not indicative of positive fund performance. Absolute performance for some funds was negative. For complete investment performance, please visit www.virtus.com and www.ridgeworth.com.
Please carefully consider a Fund’s investment objectives, risks, charges, and expenses before investing. For this and other information about the Virtus Mutual Funds, call 1-800-243-4361 or visit www.Virtus.com for a prospectus. For other information about
the RidgeWorth Mutual Funds, call 1-888-784-3863 or visit www.ridgeworth.com. Read it carefully before you invest or send money.
Virtus Mutual Funds are distributed by VP Distributors, LLC, member FINRA and subsidiary of Virtus Investment Partners, Inc. RidgeWorth Mutual Funds are distributed by RidgeWorth Distributors, LLC, member FINRA.
