morgan stanley consumer & retail conference - ab-inbev.com · ab inbev brings together seven...
TRANSCRIPT

Morgan StanleyConsumer & Retail Conference
New York, November 20, 2009
© AB InBev 2009 – All rights reserved

Carlos Brito Chief Executive Officer
Introduction
© AB InBev 2009 – All rights reserved

AB InBev brings together seven centuries of brewing history through value-creating consolidation
2004
2008
20021987 1995
20042000 2002Market Cap (11/18/09):
$81.8 Billion
2© AB InBev 2009 – All rights reserved

Progress since the Anheuser-Busch combination closed
© AB InBev 2009 – All rights reserved
Capital markets
� Raised over $37 billion through:
• $9.8 billion rights offering
• Over $20 billion in bond issuances
• Disposals: Overachieved on our $7 billion target
� Brought the BUD ticker back to the NYSE
9M 2009 financial highlights
� Improved revenue/hl by 4.6% while reducing CoS/hl by 1.1%
� Achieved 1.6% volume growth in our Focus Brands
� Grew market share in countries representing approximately 65% of our volume
� Delivered $875 million of synergies, nearing our $1 billion 2009 commitment
� Increased organic EBITDA by 18%
� Reduced our Net Debt/EBITDA from 4.7x at the start of 2009 to 4.2x as of June 30, 2009
Going forward
• Focus on core business to drive growth
3

Dream – People – Culture
Dream
People
Culture
To become the Best Beer Company in a Better World
�Great companies are formed by great people
�Our most important sustainable competitive advantage
�Meritocracy, informality, candor
�Consumer-centric
�Think and act like owners
�Disciplined execution
�Hard work and focus on results
�No short-cuts
4© AB InBev 2009 – All rights reserved
5© AB InBev 2009 – All rights reserved
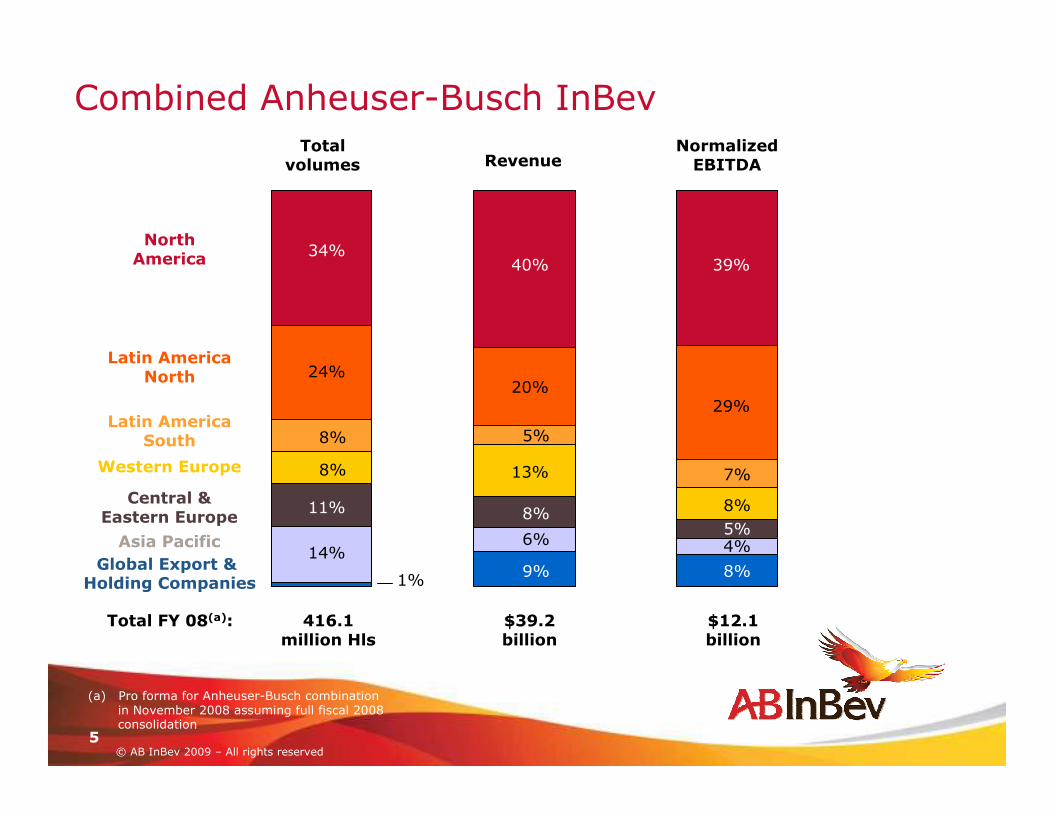
Combined Anheuser-Busch InBev
Total FY 08(a): 416.1million Hls
$39.2billion
$12.1billion
Totalvolumes Revenue
NormalizedEBITDA
Latin AmericaNorth
Central &Eastern Europe
Western Europe
Asia Pacific
Latin AmericaSouth
NorthAmerica
Global Export & Holding Companies
34%
24%
8%
8%
11%
14%
1%
40%
20%
5%
13%
8%
6%
9%
39%
29%
7%
8%
5%4%
8%
(a) Pro forma for Anheuser-Busch combination in November 2008 assuming full fiscal 2008 consolidation

Leading market share across key countries
6© AB InBev 2009 – All rights reserved
US No. 1 49.9%
Canada No. 1 42.9%
Brazil(a) No. 1 67.5%
Argentina(a) No. 1 74.4%
Belgium No. 1 57.7%
Ukraine No. 1 37.5%
Germany(a) No. 2 9.6%
Russia No. 2 18.4%
UK No. 3 21.8%
China(b) No. 3 11.2%
Key countriesMarket position
and shareSelected brands
Source: Plato Logic, unless otherwiseindicated in 2008 Annual Report(a) Beer operations only(b) YTD May 2009; excludes Tsingtao

AB InBev is among the world’s leading consumer products companies
0
5
10
15
20
25
30
35
0 5 10 15 20 25
Annual EBITDA ($ billion)
Nu
mber
of
Billion-D
oll
ar-
Bra
nds
7© AB InBev 2009 – All rights reserved
Source: Company filings, AB InBev estimates
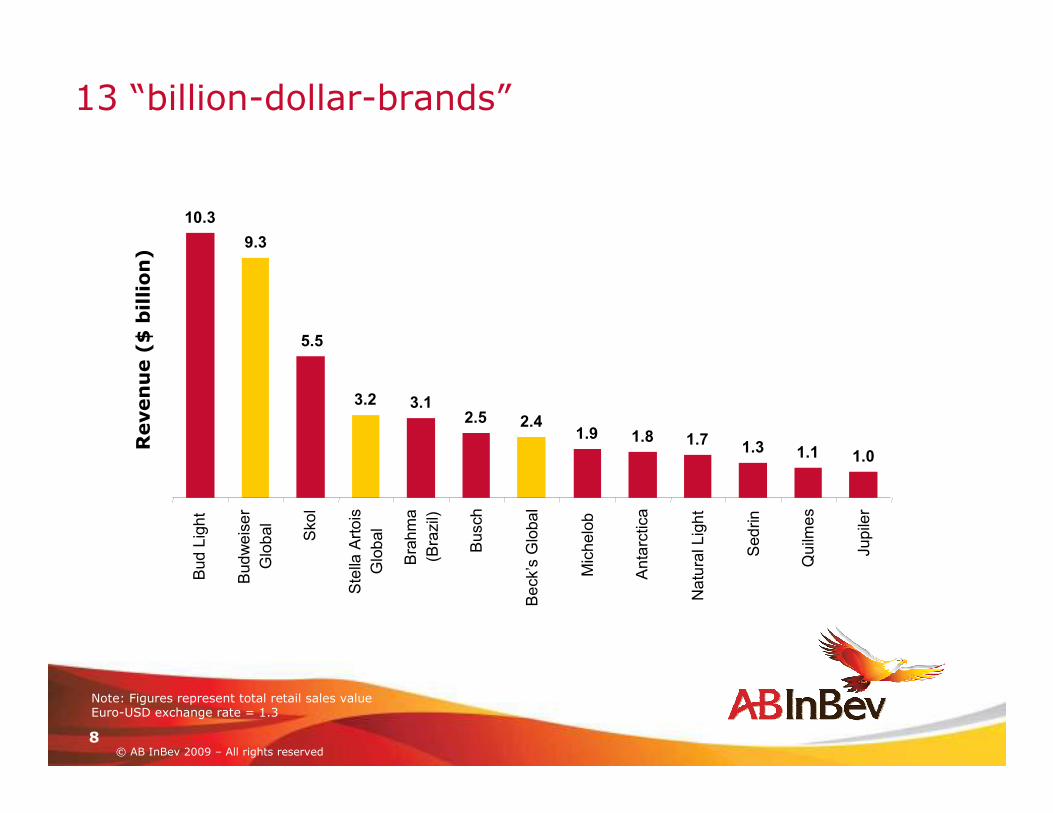
13 “billion-dollar-brands”
10.3
9.3
5.5
3.2 3.1
2.5 2.4 1.9 1.8 1.7
1.3 1.1 1.0
Bud Light
Budweiser
Global
Skol
Stella Artois
Global
Brahma
(Brazil)
Busch
Beck’s G
lobal
Michelob
Antarctica
Natural Light
Sedrin
Quilm
es
Jupiler
Revenue (
$ b
illion)
Note: Figures represent total retail sales valueEuro-USD exchange rate = 1.3
8© AB InBev 2009 – All rights reserved

2007 2008 2009
1
2
3
4
5
6
7
8
9
10
Source: BrandZ Report – Millward Brown OptimorNote: Brand value calculated as the sum of all future earningseach brand is forecast to generate, discounted to a present day value9
Three AB InBev brands in BrandZ Global Top 5
© AB InBev 2009 – All rights reserved

21.3%
24.7%
28.6%
31.9%
36.2%
33.1%32.7%
2003A 2004A 2005A 2006A 2007C 2008A 9M09A
Margin drivers
� Topline growth
� Mutual exchanging of best practices
� Increasing scale reinforced by financial discipline
� Global sales and marketing capabilities with regional impact
Margin evolution
+1,490 bps
(a) Interbrew standalone(b) 2007 figures are presented on a combined basis which includes combined financials of Anheuser-Busch for the last six
weeks of 2007 to facilitate like-for-like comparisons with the financials in FY 2008(c) Combined EBITDA margin (including 12 months of AB) was 30.8%
Topline growth along with increased scale and efficiencies has driven steady margin expansion
(a) (b)
10© AB InBev 2009 – All rights reserved
(c)

As the global market leader, AB InBevconnects in new ways to drive growth
© AB InBev 2009 – All rights reserved
We win through growing our share of throat and the category by:
�Connecting with new consumers
�Connecting through new innovations
�Connecting with new media
�Connecting in new markets
11

Case studies in connecting:Stella Artois and Premium Light segment
© AB InBev 2009 – All rights reserved
12
Newconsumers
Newinnovations
Newmedia

Stella Artois – Brand building based on seven centuries of tradition
13© AB InBev 2009 – All rights reserved
The Chalice
Rich Heritage
Perfect Pouring Ritual
Super Premium Positioning
Sophistication and Culture
Modern Applications
Perfection has its price
Innovation

Wine lovers increasingly love Stella Artois
0 10 20 30 40 50 60
In sophistication, Stella
Artois is closer to wine
than to beer
Sophistication imagery
Wine
Hard Liquor
Beer
Past week consumption
Stella Artois drinkers
consume wine twice as
often as beer drinkers
Stella Artois
0 10 20 30 40 50 60
Heineken
Beer
Stella Artois
14© AB InBev 2009 – All rights reserved
Source: MP&R BEVScape Poll

15© AB InBev 2009 – All rights reserved
Redefining the Premium Light category
#1 beer in the US
The summer state of mind#13 beer only 1 year after
launch¹
M #13 in the beer category of over 1,200 brandsdistributed through convenience store and grocery outletsyear to date
Low-carb for active lifestyles
Huge flavorRedefining wheat beer
Lowest calorie beer in the world
Bud Light Lime overindexes with
women:
35% vs. 20% industry average
16© AB InBev 2009 – All rights reserved
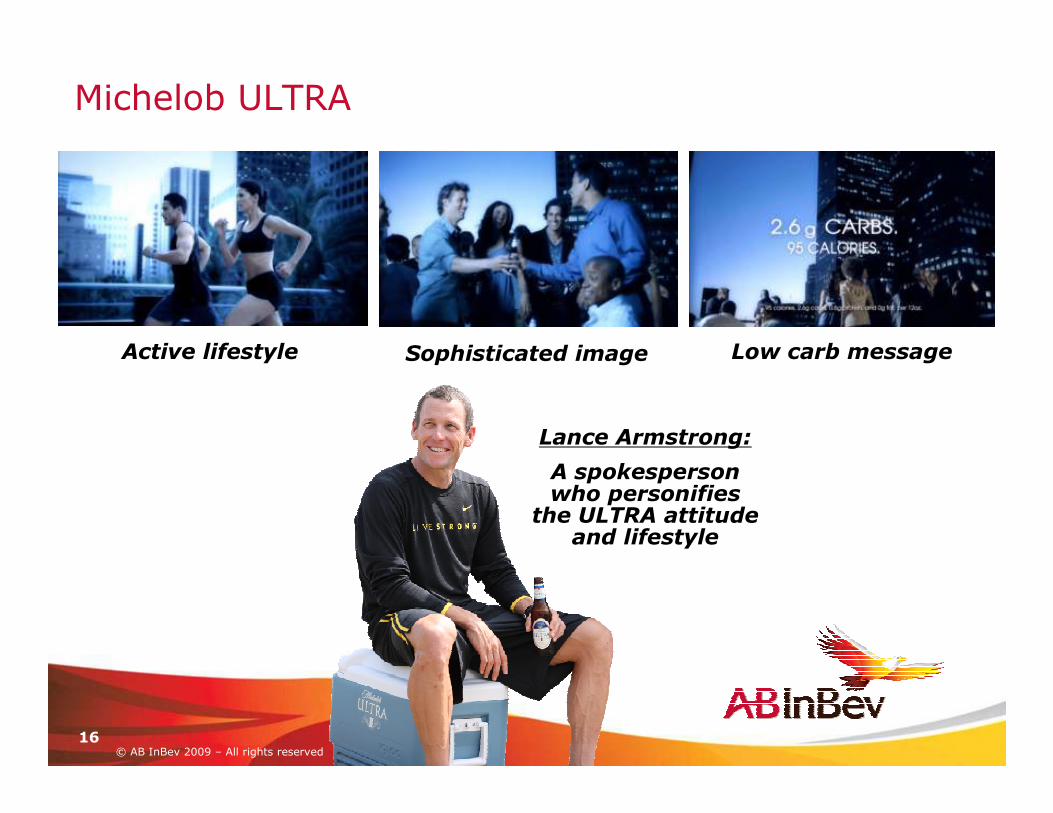
Michelob ULTRA
Active lifestyle Sophisticated image Low carb message
Lance Armstrong:
A spokesperson who personifies
the ULTRA attitude and lifestyle

17© AB InBev 2009 – All rights reserved
The first Light Wheat beer, growing the category
� Brand role
• Expand the consumer base and occasions of the Bud Light mega brand
• Trendsetter (primary)
• Loyalist (secondary)
• Define the wheat beer category for target consumers ages 25-44
� Positioned as “more flavorful light beer”…not micro/craft
� Media support and sampling to drive awareness and trial
• Launch plan with late night/entertainment/ digital focus – Saturday Night Live
� National launch – October 5th
Breaking new ground withBud Light Golden Wheat

Connecting through social media: Bud Light Lime in Canada launch strategy
Harness early adopters
Earn social buzz
Drive mass social awareness
© AB InBev 2009 – All rights reserved18
LimeInvasion Phase 1: Phase 2: Phase 3:
Earning buzz by driving to #1
sponsored YouTube
channel in May ‘09
3 days, 5 cities, 50,000 limes

0.98
0.72
36.4%
3,549
5,259
9,763
3Q09
394 bp32.6%35.3%% Margin
EPS
Normalized EPS
Normalized EBITDA
Gross profit
Revenue
$ million,
except per share data
0.72
0.87
11.9%3,5532,138
5.2%5,5993,502
-0.4%10,8936,061
Organic
growth(a)
3Q08
combined
3Q08
reported
(a) Excludes the impact of changes in currencies on translation of foreign operations, theimpact of acquisitions and divestitures, the start up or termination of activities, and the transfer of activities between segments
© AB InBev 2009 – All rights reserved
3Q 2009 highlights
19
� Broad market share gains driven by Focus Brand strategy execution
• Year to date, we gained market share in 5 of our key markets: Argentina, Belgium, Brazil, the UK and the US, and maintained market share in the Ukraine
• In Brazil, we ended October with a 70.6% market share, up from 67% at the beginning of 2009
• Market share gains achieved in countries representing approximately 65% of our volumes
• Focus Brand volumes increased 0.4%, with third quarter growth led by Antarctica, Brahma and Skol in Brazil, Harbin and Budweiser in China, and Stella Artois in the UK. In 9M09, Focus Brands grew 1.6%

© AB InBev 2009 – All rights reserved
20
4Q and 2009 outlook
� Improved volume performance• Demand trends remain soft, but we see improved volume performance in
4Q09 compared with 3Q09 year-over-year results
� Cost of Sales per hectoliter• Projected to decline slightly percentagewise for 2009 in total
� Increased sales and marketing investment• Further step up at a rate above that of the third quarter, as we fund new
product launches and drive Focus Brand growth
� Higher administrative expenses• Reflects higher accruals for variable compensation compared to 2008,
when most Zones reversed accruals as a result of business performance in that period
� Tougher synergy comparison• $875 million delivered in 9M09
• Tougher comparison in the fourth quarter as we lap $250 million of synergies achieved in the second half of 2008
� EBITDA margin expansion• Fourth quarter EBITDA growth in line with the third quarter

On track to achieve our 2009 commitments
21© AB InBev 2009 – All rights reserved
2009 commitments Status
• Capturing $1 billion of synergies
• Releasing $500 million of working capital in the US
• Maintaining pricing discipline in relevant markets while continuing to support our Focus Brands
• Execute at least $7 billion in divestitures
• Reducing capex by at least $1 billion
• Enhancing the maturity and currency profile of our debt
• Optimizing the effective tax ratetowards the 25-27% range
$875 million achieved in 9M09
$312 million positive cash flow impact in HY09, excluding derivatives
9M09 revenue/hl growth of 4.6%Focus Brand volumes up 1.6%
Achieved: Approximately $9.4 billion of divestitures announced of which approximately $7.4 billion are cash proceeds at closing
$566 million positive impact in HY09
Significantly enhanced with over $20 billion of bond issues
Tax guidance maintained for the full year; 27.2% tax rate in 9M09

• #1 Leading Global Beer Company with leadership positions in the two largest profit pools, US and Brazil, and a strong position in the biggest and fastest growing volume pool: China
• Track Record of Margin Enhancement driven by topline growth, economies of scale, global business processes, and financial discipline
• The Right Marketing Strategy: Focus Brand Driven, and Disciplined in Marketing and Innovation across the globe to drive brand health today, and price premium tomorrow
• High Performance Culture emphasizing ownership, meritocracy, and individual accountability
• Unique Opportunities to Replicate Commercial Best Practices across the globe to drive sustainable topline growth
• Rapid De-Leveraging and Balance Sheet Improvementthrough strong free cash flow, refinancing, and asset disposals
22© AB InBev 2009 – All rights reserved
Summary

Q&A
© AB InBev 2009 – All rights reserved