more than food on the table: agriculture’s true
TRANSCRIPT
Interagency Group on Rural DevelopmentIICA-IDB-ECLAC-IFAD-GTZ-World Bank-USAID
MORE THAN FOOD ON THE TABLE:AGRICULTURE’S TRUE CONTRIBUTION
TO THE ECONOMY
INTER-AMERICAN INSTITUTE FOR COOPERATION AND AGRICULTURE

This document was produced by the Directorate of Strategic Planning and Institutional Modernization and the Area of Tradeand Agribusiness of the Inter-American Institute for Cooperation on Agriculture, within the framework of Interagency Groupon Rural Development (IICA, IDB, World Bank, ECLAC, FAO, IFAD, GTZ and USAID). The team was made up of Rafael A. Trejos,who coordinated the effort, Joaquín Arias, Oswaldo Segura and Eliécer Vargas; technical support was provided by Julio Alfaro.
We would like to thank Lizardo de las Casas, Mark Meassick and Adrián Rodríguez, from IICA, and Martine Dirven, from ECLAC,for their comments and observations.
The opinions and viewpoints expressed herein, as well as possible mistakes and omissions, are the responsibility of the authorsand do not necessarily represent the official position of IICA or of the other agencies making up the Interagency Group on RuralDevelopment.
January 2004
This publication can be obtained from:
Technical Cooperation SecretariatInter-American Institute for Cooperation on AgricultureP.O. Box 55-2200, Coronado, Costa Rica
E-mail: [email protected] or [email protected]: (506) 216-0223Web site: http://www.iica.int
More than food on the table: agriculture's true contribution to the economy / Rafael Trejos, Joaquín Arias, Osvaldo Segura,Eliécer Vargas. -- San José, C.R. : IICA. Directorate of StrategicPlanning and Institutional Modernization; Area of Trade and Agribusiness, 2004.116 p. ; 27 cm.
ISBN 92-9039-595 8
1. Agricultural Development - Latin America 2. EconomicDevelopment I. Trejos, R. II. Arias, J. III. Segura, O. IV. Vargas, EV. IICA VI. Título.
AGRIS DEWEYE10 338.1
FOREWORD . . . . . . . . . . . . . . . . . . . . . . . . . . . . . . . . . . . . . . . . . . . . . . . . . . . . . . . . . . . . . . . . v
EXECUTIVE SUMMARY . . . . . . . . . . . . . . . . . . . . . . . . . . . . . . . . . . . . . . . . . . . . . . . . . . . . xi
1. INTRODUCTION. . . . . . . . . . . . . . . . . . . . . . . . . . . . . . . . . . . . . . . . . . . . . . . . . . . . . . . . . 1Procedure. . . . . . . . . . . . . . . . . . . . . . . . . . . . . . . . . . . . . . . . . . . . . . . . . . . . . . . . . . . 1The Social Accounting Matrix . . . . . . . . . . . . . . . . . . . . . . . . . . . . . . . . . . . . . . . . . . 1Measuring Agriculture’s Contribution to Economic Development . . . . . . . . . . . . . . 3The True Measurement of the Agriculture’s Contribution . . . . . . . . . . . . . . . . . . . 4Objective of the Study . . . . . . . . . . . . . . . . . . . . . . . . . . . . . . . . . . . . . . . . . . . . . . . . . 4Scope of the Research. . . . . . . . . . . . . . . . . . . . . . . . . . . . . . . . . . . . . . . . . . . . . . . . . . . . . . 5
2. METHODOLOGY. . . . . . . . . . . . . . . . . . . . . . . . . . . . . . . . . . . . . . . . . . . . . . . . . . . . . . . . . 7Procedure. . . . . . . . . . . . . . . . . . . . . . . . . . . . . . . . . . . . . . . . . . . . . . . . . . . . . . . . . . . 7The Social Accounting Matrix . . . . . . . . . . . . . . . . . . . . . . . . . . . . . . . . . . . . . . . . . . 7The SAM Multiplier Model . . . . . . . . . . . . . . . . . . . . . . . . . . . . . . . . . . . . . . . . . . . . . 9
3. AGRICULTURE’S TRUE CONTRIBUTION TO THE ECONOMY . . . . . . . . . . . . 11Primary Agriculture vs “Agriculture and Agrifood” . . . . . . . . . . . . . . . . . . . . . . . . 11Agricultural Linkages . . . . . . . . . . . . . . . . . . . . . . . . . . . . . . . . . . . . . . . . . . . . . . . . 13Agriculture’s Multiplier Effects . . . . . . . . . . . . . . . . . . . . . . . . . . . . . . . . . . . . . . . . 19
Multiplier effects on production . . . . . . . . . . . . . . . . . . . . . . . . . . . . . . . . . . . . . 19Multiplier effects on the generation of value added and income . . . . . . . . . . . . 22Multiplier effects in the case of Costa Rica . . . . . . . . . . . . . . . . . . . . . . . . . . . . . 23
Policy simulations and analysis . . . . . . . . . . . . . . . . . . . . . . . . . . . . . . . . . . . . . . . . 24Impact of a change in the exports of the agricultural aggregate . . . . . . . . . . . . 24Impact of a chance in investment in the aggregate of agriculture and
agrifood. . . . . . . . . . . . . . . . . . . . . . . . . . . . . . . . . . . . . . . . . . . . . . . . . . . . . . 25Simulations in Key agricultural Sectors . . . . . . . . . . . . . . . . . . . . . . . . . . . . . . . . . 26
Increase in coffee exports . . . . . . . . . . . . . . . . . . . . . . . . . . . . . . . . . . . . . . . . . . . 27Increase in exports of fruits, vegetables and nuts . . . . . . . . . . . . . . . . . . . . . . . . 28Increase in exports of wheat, corn and oils . . . . . . . . . . . . . . . . . . . . . . . . . . . . . 29
CONTENTS
Increase in exports of oilseeds and oleaginous crops . . . . . . . . . . . . . . . . . . . . . 30Simulations in Key Agroindustrial Sectors . . . . . . . . . . . . . . . . . . . . . . . . . . . . . . . 31
Increase in exports of textiles and clothing manufactures . . . . . . . . . . . . . . . . . 31Increase in the exports of timber and paper manufactures . . . . . . . . . . . . . . . . 32
4. CONCLUSIONS . . . . . . . . . . . . . . . . . . . . . . . . . . . . . . . . . . . . . . . . . . . . . . . . . . . . . . . . . 35
BIBLIOGRAPHY . . . . . . . . . . . . . . . . . . . . . . . . . . . . . . . . . . . . . . . . . . . . . . . . . . . . . . . . . . . 37
GLOSSARY . . . . . . . . . . . . . . . . . . . . . . . . . . . . . . . . . . . . . . . . . . . . . . . . . . . . . . . . . . . . . . . . 41
ANNEXES . . . . . . . . . . . . . . . . . . . . . . . . . . . . . . . . . . . . . . . . . . . . . . . . . . . . . . . . . . . . . . . . . 45
Food production has always been a precondition for the development of civilization. Thesystems linked to agriculture, especially as regards its relationship to the environment,
industry, finance, trade and consumers, have become more intricate and complex. Therefore, newparadigms and new policy instruments are needed to meet society’s need for food security.
The idea of analyzing agriculture’s true contribution to economic development surfaced at themeeting of the Inter-Agency Group on Rural Development (IGRD) held in 2002 in Cuba. IICAagreed to perform the first tasks involved in this important joint research initiative.
This document quantifies agriculture’s true contribution to the economy in 11 countries thatare members of the Inter-American System, using social accounting matrixes (SAM) to estimatemultiplier effects between sectors. Agriculture has been identified as an important supplier of inputsand a generator of value added that plays a key role in the distribution of the income between urbanand rural regions.
This report provides evidence that investment in agriculture should be seen as an investmentin the entire economy and that the differentiated impact of sectoral policies for urban and ruralregions should not be ignored. The study shows clearly that agriculture promotes sustainabledevelopment and the inclusion of rural communities, especially the poorest, in economy activity.
IICA hopes these research findings will be subjected to technical scrutiny, so that, togetherwith its partners, the Institute can continue developing sound methodological and conceptualapproaches that offer a fairer assessment of agriculture’s importance in the countries, and helpreposition it in political circles.
Dr. Chelston W.D. Brathwaite DIRECTOR GENERAL
FOREWORD

TABLE 1. Gross domestic product and agricultural value added in US$ thousandmillions and as a percentage, for 1997 . . . . . . . . . . . . . . . . . . . . . . . . . . . . . . . 12
TABLE 2. Use Made of the gross output for 10 Countries in the Americas (inpercentages, by sector) . . . . . . . . . . . . . . . . . . . . . . . . . . . . . . . . . . . . . . . . . . . 14
TABLE 3. Use Made of the gross output by Country (in percentages, by sector) . . . . . . 15
TABLE 4. Cost of the gross output for 10 Countries in the Americas . . . . . . . . . . . . . . . 17
TABLE 5. Cost of the gross output by Country (in percentages, by sector) . . . . . . . . . . 19
TABLE 6. Effect of a 10% increase in agriculture and agrifood exports by country,as a percentage of growth by item . . . . . . . . . . . . . . . . . . . . . . . . . . . . . . . . . . 24
TABLE 7. Effect of a US$100 million increase in investment by country,as a percentage of growth by item . . . . . . . . . . . . . . . . . . . . . . . . . . . . . . . . . . 25
TABLE 8. Effect of a 10% increase in coffee exports by country, as a percentage ofgrowth by item . . . . . . . . . . . . . . . . . . . . . . . . . . . . . . . . . . . . . . . . . . . . . . . . . . 27
TABLE 9. Effect of a 10% increase in vegetable, fruit and nut exports by country,as a percentage of growth by item . . . . . . . . . . . . . . . . . . . . . . . . . . . . . . . . . . 28
TABLE 10. Effect of a 10% increase in wheat and corn exports by country, as a percentage of growth by item . . . . . . . . . . . . . . . . . . . . . . . . . . . . . . . . . . 29
TABLE 11. Effect of a 10% increase in oilseed exports by country,as a percentage of growth by item . . . . . . . . . . . . . . . . . . . . . . . . . . . . . . . . . . 29
TABLE 12. Effect of a 10% increase in exports of manufactures of textilesand wearing apparel by country, as a percentage of growth by item . . . . . . . 30
TABLE 13. Effect of a 10% increase in exports of manufactures of wood by country,as a percentage of growth by item . . . . . . . . . . . . . . . . . . . . . . . . . . . . . . . . . . 31
TABLE 14. Effect of a 10% increase in exports of manufactures of paper and paperproducts by country, as a percentage of growth by category . . . . . . . . . . . . . 31
LIST OF TABLES

ACRONYMS
AgGDP Agriculture Gross domestic product
CGE Computable General Equilibrium Models
DIPEMI Directorate of Strategic Planning and Institutional Modernization
ECLAC Economic Commission for Latin America and the Caribbean
FAO Food and Agriculture Organization of the United Nations
GDP Gross Domestic Product
GEM General Equilibrium Models
GTAP Global Trade Analysis Project (Universidad de Purdue)
GTZ Deutsche Gesellschaft für Tecnische Zusammenarbeit
IDB Inter-American Development Bank
IFAD International Fund for Agricultural Development
IGRD Interagency Group on Rural Development
IICA Inter-American Institute for Cooperation on Agriculture
ISIC International Standard Industrial Clasification
LAC Latin America and the Caribbean
Lc Remuneration to skilled labor
LIM Leontief Inverse Matrix
Lnc Remuneration to unskilled labor
OAS Organization of American States
SAM Social Accounting Matrix
SNC System of National Accounts
SRD Sustainable Rural Development
USAID The United States Agency for International Development


Background
Agriculture is more than agricultural production and food: today, all nations regard it as astrategic asset. However, the importance attached to it in political circles and among decisionmakers varies. In some countries, its political importance is on the decline and support for it islimited; in others, especially the most developed nations, increasing amounts of resources arebeing allocated to it in the form of subsidies and external aids.1
The ministers of agriculture of the Americas have expressed concern at the way in whichagriculture’s value is underestimated. Given the challenges posed by the new environment,agriculture must be viewed differently if it is to be repositioned at policy-making level.2
In recent decades, recognition of the interdependence between agriculture and industry hasbeen growing. The production systems linked to agriculture -agroindustry, for example- havebecome more intricate and complex, and more sophisticated and dynamic food distributionnetworks are needed.
However, agriculture’s performance and its contribution to our countries’ economicdevelopment has traditionally been undervalued, since it is measured using information aboutharvests and the sale of raw materials, mainly crops and livestock. As a result, the backwardand forward linkages with agroindustry, the services and trade sectors, and, in general, the restof the economy, are undervalued. The value added generated by these linkages throughout theeconomy does not appear in the basic agricultural statistics of most countries.
The methods traditionally used to measure agriculture’s contribution also overlook its rolein meeting the growing demand for environmental goods and services from urban centers. Asan economic bridge between rural and urban areas, agriculture provides food, work and naturalresource services to urban dwellers.
To properly measure agriculture’s performance and contribution, account must be taken ofits effects on the distribution of income among rural and urban households, wage earners and
01. In 2002 alone, the developed countries invested US$350 billion in government subsidies to support their farmers. (www.oecd.org)02. The Interagency Group on Rural Development took up this concern. At the meeting in Havana (2002), IICA offered to conduct
the necessary analyses.
EXECUTIVE SUMMARY

MORE THAN FOOD ON THE TABLE: AGRICULTURE’S TRUE CONTRIBUTION TO THE ECONOMYxii
owners. This is key to evaluating its impact on poverty alleviation strategies and, in particular,on the livelihoods of rural dwellers.3
Objective of the research
The first stage of the research called for the development of a methodology for estimatingthe true importance of agriculture to our countries’ economic development. This methodologyempirically addresses the concept of agriculture and agrifood4; calculates agricultural linkages;and simulates agriculture’s impact on the economic activity of the countries.
Another goal is to highlight agriculture’s contribution to the livelihoods of rural dwellers andthe sector’s potential for contributing to the development of national economies.5
Methodology
The study focuses on 11 countries in the western hemisphere: Argentina, Brazil, Canada,Chile, Colombia, Costa Rica, Mexico, Peru, United States, Uruguay and Venezuela.6
A consistent accounting framework was required to facilitate the measurement of agriculture’scontribution to GDP, and to assess the strength of its linkages with other sectors of the economy.Social accounting matrixes (SAM) offer a suitable accounting framework, since they make itpossible to examine the structural links between production, consumption, trade and theaccumulation and distribution of income. They can also be used to develop economic models thatsimulate the impact of public policies and other exogenous changes on the entire economy.
The greatest virtue of a social accounting matrix is that it explicitly describes the flow of incomeand makes it possible to analyze issues related to income distribution. As databases, matrixeshave been widely used to study trade policy, income distribution, fiscal policy, external impactsand structural adjustment issues.
03. In a globalized world, a country’s food security can only be assured if rural livelihoods are strengthened. It is also a key conditionfor achieving the Millennium Development Goals set for 2015 for health and nutrition.
04. The concept of “agriculture and agrifood” includes in the measurement of agricultural aggregates, those sectors that are linkedby their requirement for agricultural inputs, such as the food processing sector and the agroindustrial sector. Some authorshave used “wider agriculture,” “extended agriculture,” “agro-based sectors,” and other similar terms, when referring to thesame concept.
05. Future stages will include dimensions that are important for rural economies, especially the natural resources sector, throughthe so-called “Green Accounts” (already in progress); the specification of regional accounts; and a better specification ofpromising activities such as agrotourism. In addition, an analytical framework will be developed for detecting other, harderto quantify contributions related to the social, cultural and environmental dimensions.
06. The information used to create the SAM for 10 countries (Argentina, Brazil, Canada, Chile, Colombia, Mexico, Peru, Uruguay,United States, Venezuela) was obtained from the GTAP database (Global Trade Analysis Project, Purdue University). For CostaRica, the study used the matrix developed by IICA which uses 1974 as the baseline. (IICA, 2004)
EXECUTIVE SUMMARY xiii
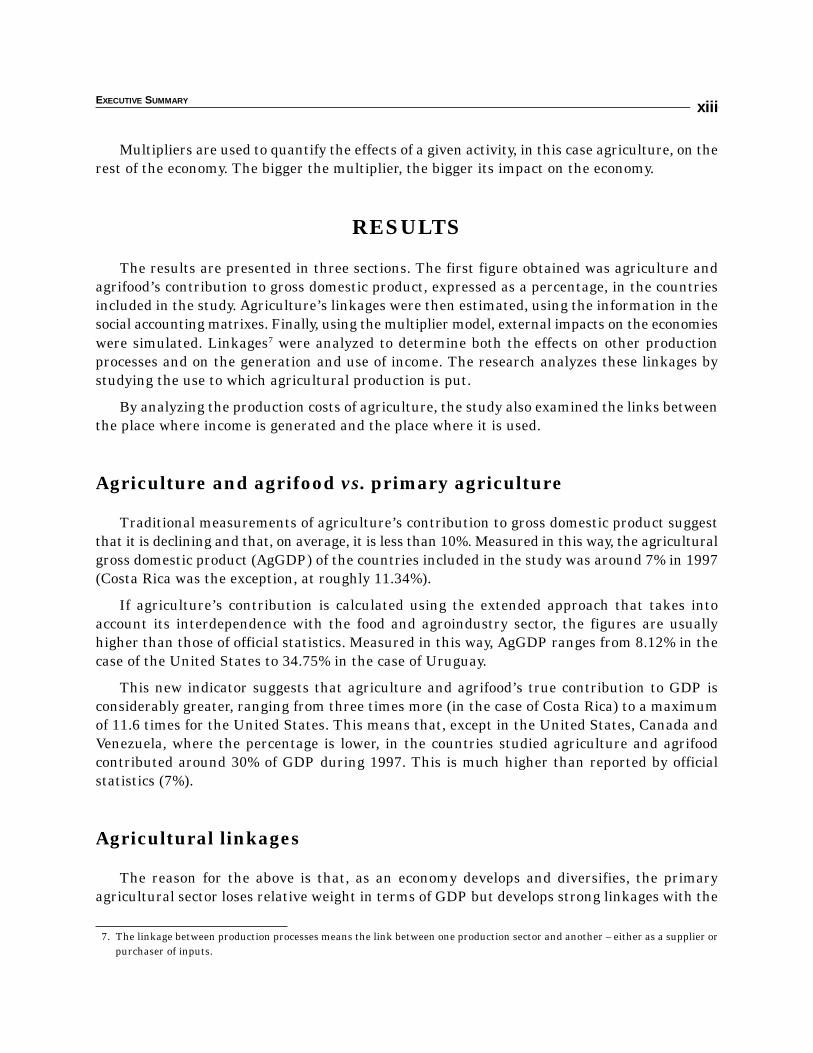
Multipliers are used to quantify the effects of a given activity, in this case agriculture, on therest of the economy. The bigger the multiplier, the bigger its impact on the economy.
RESULTS
The results are presented in three sections. The first figure obtained was agriculture andagrifood’s contribution to gross domestic product, expressed as a percentage, in the countriesincluded in the study. Agriculture’s linkages were then estimated, using the information in thesocial accounting matrixes. Finally, using the multiplier model, external impacts on the economieswere simulated. Linkages7 were analyzed to determine both the effects on other productionprocesses and on the generation and use of income. The research analyzes these linkages bystudying the use to which agricultural production is put.
By analyzing the production costs of agriculture, the study also examined the links betweenthe place where income is generated and the place where it is used.
Agriculture and agrifood vs. primary agriculture
Traditional measurements of agriculture’s contribution to gross domestic product suggestthat it is declining and that, on average, it is less than 10%. Measured in this way, the agriculturalgross domestic product (AgGDP) of the countries included in the study was around 7% in 1997(Costa Rica was the exception, at roughly 11.34%).
If agriculture’s contribution is calculated using the extended approach that takes intoaccount its interdependence with the food and agroindustry sector, the figures are usuallyhigher than those of official statistics. Measured in this way, AgGDP ranges from 8.12% in thecase of the United States to 34.75% in the case of Uruguay.
This new indicator suggests that agriculture and agrifood’s true contribution to GDP isconsiderably greater, ranging from three times more (in the case of Costa Rica) to a maximumof 11.6 times for the United States. This means that, except in the United States, Canada andVenezuela, where the percentage is lower, in the countries studied agriculture and agrifoodcontributed around 30% of GDP during 1997. This is much higher than reported by officialstatistics (7%).
Agricultural linkages
The reason for the above is that, as an economy develops and diversifies, the primaryagricultural sector loses relative weight in terms of GDP but develops strong linkages with the
07. The linkage between production processes means the link between one production sector and another – either as a supplier orpurchaser of inputs.
MORE THAN FOOD ON THE TABLE: AGRICULTURE’S TRUE CONTRIBUTION TO THE ECONOMYxiv
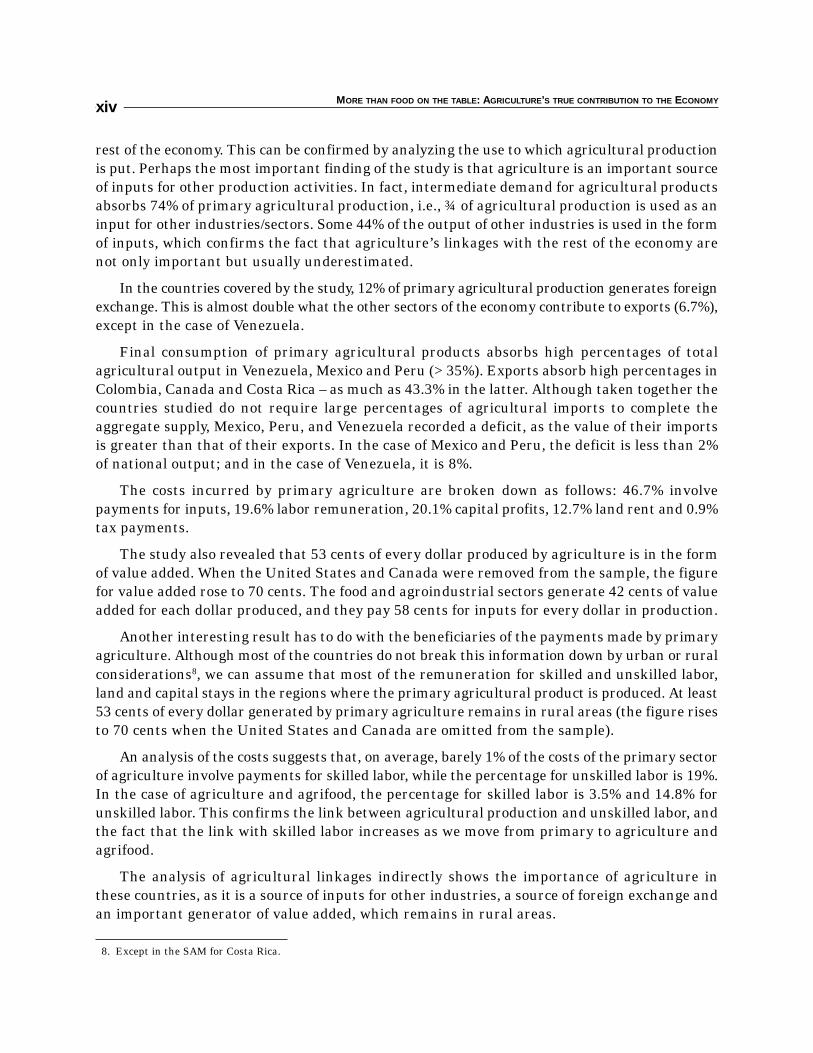
rest of the economy. This can be confirmed by analyzing the use to which agricultural productionis put. Perhaps the most important finding of the study is that agriculture is an important sourceof inputs for other production activities. In fact, intermediate demand for agricultural productsabsorbs 74% of primary agricultural production, i.e., ¾ of agricultural production is used as aninput for other industries/sectors. Some 44% of the output of other industries is used in the formof inputs, which confirms the fact that agriculture’s linkages with the rest of the economy arenot only important but usually underestimated.
In the countries covered by the study, 12% of primary agricultural production generates foreignexchange. This is almost double what the other sectors of the economy contribute to exports (6.7%),except in the case of Venezuela.
Final consumption of primary agricultural products absorbs high percentages of totalagricultural output in Venezuela, Mexico and Peru (>35%). Exports absorb high percentages inColombia, Canada and Costa Rica – as much as 43.3% in the latter. Although taken together thecountries studied do not require large percentages of agricultural imports to complete theaggregate supply, Mexico, Peru, and Venezuela recorded a deficit, as the value of their importsis greater than that of their exports. In the case of Mexico and Peru, the deficit is less than 2%of national output; and in the case of Venezuela, it is 8%.
The costs incurred by primary agriculture are broken down as follows: 46.7% involvepayments for inputs, 19.6% labor remuneration, 20.1% capital profits, 12.7% land rent and 0.9%tax payments.
The study also revealed that 53 cents of every dollar produced by agriculture is in the formof value added. When the United States and Canada were removed from the sample, the figurefor value added rose to 70 cents. The food and agroindustrial sectors generate 42 cents of valueadded for each dollar produced, and they pay 58 cents for inputs for every dollar in production.
Another interesting result has to do with the beneficiaries of the payments made by primaryagriculture. Although most of the countries do not break this information down by urban or ruralconsiderations8, we can assume that most of the remuneration for skilled and unskilled labor,land and capital stays in the regions where the primary agricultural product is produced. At least53 cents of every dollar generated by primary agriculture remains in rural areas (the figure risesto 70 cents when the United States and Canada are omitted from the sample).
An analysis of the costs suggests that, on average, barely 1% of the costs of the primary sectorof agriculture involve payments for skilled labor, while the percentage for unskilled labor is 19%.In the case of agriculture and agrifood, the percentage for skilled labor is 3.5% and 14.8% forunskilled labor. This confirms the link between agricultural production and unskilled labor, andthe fact that the link with skilled labor increases as we move from primary to agriculture andagrifood.
The analysis of agricultural linkages indirectly shows the importance of agriculture inthese countries, as it is a source of inputs for other industries, a source of foreign exchange andan important generator of value added, which remains in rural areas.
08. Except in the SAM for Costa Rica.
EXECUTIVE SUMMARY xv
Agriculture’s multiplier effects
The analysis of multipliers shows that each additional unit demanded from the primary sectorhas a strong effect on other sectors. In Canada, 3.1 additional units derived output are generated,and in Argentina as many as 5.5. The multipliers for agriculture are similar to those for othersectors, which seems to contradict the accepted wisdom that agriculture has fewer effects thanother activities, especially the industrial sectors.
An additional injection in agriculture, or a one-unit increase in demand for its exports,generates growth in the production of the food sector (from 0.16 in Canada to 0.73 in Argentina)and the agroindustrial sector (from 0.10 in Canada to 0.56 in Argentina).
A one-dollar increase in primary agricultural exports also has a very positive effect onfactor of production remuneration (labor, capital and land), ranging from US$1.421 in Canadato US$3.34 in Argentina. Except for Canada and Brazil, unskilled labor remuneration is higherin the agricultural sector than in the other economic sectors (ranging from US$0.58 in Peru toUS$1.30 in Argentina).
Every extra dollar of demand for primary agricultural production generates an increase inhousehold income of between US$1.42 (Canada) and US$3.34 (Argentina). This is an extremelyimportant statistic, given that agriculture generates more household income than otherindustries.9
The study also revealed that every dollar of government funds transferred to household incomewill generate another US$1.50: 78 cents in the form of capital remuneration, 4 cents in landrent and 68 cents in the form of labor remuneration (47 and 21 cents for unskilled and skilledlabor, respectively). The industries that benefit most from higher demand vary from country tocountry, but those that benefit most from the transfer of income to households are commerceand sales (multiplier of 0.41), real estate and rents (0.17), administrative services provided bythe state (0.16), and foods produced from fish, vegetables and fruits (0.15).
In the case of Costa Rica, it was possible to conduct an even more exhaustive analysis. Havinga social accounting matrix with more detailed information about institutions and factors ofproduction made it possible to pinpoint agriculture’s role in rural economic development. ForCosta Rica the agricultural sectors of green coffee, livestock, tobacco, meat and milk production,sugar and ripe coffee produce multipliers of more than 2, which means that a one-dollar increasein demand produces more than one extra dollar in the other industries. These multipliers onlyare bettered by the multiplier for construction, services and administrative services.
The coffee, sugar, livestock and milk sectors make high payments to rural labor whiletobacco makes a higher contribution to urban wages. Specifically, a one-dollar increase in greencoffee exports generates 20 cents of urban labor, 45 cents of rural labor, 4 cents of taxes and 84cents as capital profits (including land rent).
09. In the case of Peru, the multiplier for agroindustry is slightly higher than for the primary agricultural sector.
MORE THAN FOOD ON THE TABLE: AGRICULTURE’S TRUE CONTRIBUTION TO THE ECONOMYxvi
A one-dollar increase in exports of green coffee from Costa Rica generates an increase ofUS$1.18 in family income. This multiplier is the second highest, bettered only by the multiplierfor the services sector. Other sectors that generate high multipliers of income for families areripe coffee, unprocessed tobacco, livestock, bananas and sugar.
For Costa Rica, it was also possible to estimate the effect of a direct transfer from thegovernment to the households. Each dollar transferred to the households would produce another99 cents of value added: 22 cents in urban labor remuneration, 16 cents in rural laborremuneration, 54 cents in capital profits and 3 cents in taxes.
Simulations and policy analysis
The analysis of multipliers by means of SAMs makes it possible to generate simulations thatprovide the criteria for identifying key sectors of the economy. They identify not only those withgreater production linkages but also those that generate more value added and have better effectson the distribution of income between rural and urban households.
At the end of the document, a series of simulations are performed for the countries includedin the study to demonstrate the usefulness of the instrument. The first is a simulation of anaggregate change in agricultural exports, followed by a simulation of changes in the specific exportsof some sectors.
By way of example, an analysis was made of the effect on the economy of a 10% increase inthe demand for Peruvian agricultural exports (including the primary, food and agroindustrysubsectors). A US$277 million increase in exports (0.26% of Peru’s total production) generatesa further US$750 million in other production activities, US$550 million in factor of productionremuneration (US$140 million for labor, US$373 million for capital) and a similar increase inthe net income of the country’s households and families. In percentages, a 0.26% increase in foodproduction produces 0.93% growth in total output, and a 0.95% rise in factor of productionremuneration. Similar simulations are performed with changes in investment, foreign trade andother variables. The results show clearly that in order to improve the well-being of thecommunities, investments must be made, and support provided for, the agricultural sector ofthe economies of countries in the Americas.
A 10% increase in wheat exports in Argentina and Uruguay (equivalent to only 0.03% and0.01% of the countries’ total output) generates a 0.15% and 0.06% growth in the output of otherindustries, and increases of 0.17% and 0.06% in family incomes, respectively. The biggestincrease in factor of production remuneration in both countries is for land (0.46% in Argentinaand 0.18% in Uruguay).
The results of a simulated 10% increase in exports for the oil-seed sectors of Brazil, Canada,Uruguay and the United States suggest that the impact would be similar in all three countries:0.03-0.05% growth in total output. Households would also benefit, with increases in income of0.03-0.05%. However, the factor of production remuneration generated by the growth inproduction varies from country to country. For example, the figure for land retribution is
EXECUTIVE SUMMARY xvii
largest for Canada (0.71%) and smallest for Uruguay (0.14%). This suggests that land is a biggerconstraint in Canada than in Uruguay, as far as a possible growth in exports is concerned.
Simulating a 10% increase in demand for the corn, barley, oats and other sector confirmedjust how important this sector is for Argentina. A US$141 million increase in demand inArgentina would generate 0.60% more throughout the agricultural primary sector and 0.14%in all the economy. In other words, each dollar invested would produce another US$5.4 ofvalue.
A simulation also revealed that a 10% growth in Costa Rica’s coffee exports10 would generatean increase of almost 1% in the total value added of the economy. Furthermore, rural workremuneration would increase significantly, by 0.75% or nearly three times the increase inurban work remuneration (0.28%) and more than the figure for capital remuneration (0.63%).
The impact of a 10% increase in the demand for coffee varies considerably in the cases ofBrazil, Colombia, Peru and Costa Rica. For Brazil, a US$274 million increase in exports wouldcause the country’s total production to grow by US$1139 million and households would receiveUS$600 million more in income. As a percentage, this is an increase of 0.08% in both totalproduction and household income. For Colombia, while the dollar values are very similar (a US$225million rise in exports would generate US$900 million in additional production and a US$500-million increase in income) the percentages are not (0.53% in production and 0.57% in income).This is due to the greater relative importance of coffee to Colombia than to Brazil. A US$41 millionincrease in the coffee sector in Peru has a spillover effect of only US$55 million on the country’seconomy as a whole.
A study was also conducted of the vegetable, fruit and nuts sector of Argentina, Chile,Colombia, Mexico, Uruguay and Costa Rica. The effect of a 10% growth in the exports of thissector is similar in all the countries barring Costa Rica: the initial injection produces a fourfoldincrease in total economic output. In the case of Costa Rica, the increase is twofold. Nor are theremarked differences between the countries with regard to the generation of household income.Of all the sectors analyzed, this turned out to be the one whose results were most similar forall the countries studied.
CONCLUSIONS
The study demonstrated clearly the importance of the value added of the agriculturalproduction chain to the domestic economies of all the countries in the Americas, thus correctingthe traditional skewed view of agriculture’s contribution and its potential for economicdevelopment. The study validated the methodology in 11 countries and underscored the role ofagriculture as a supplier of inputs, a generator of value added and foreign exchange, and animportant factor in the redistribution of income.
10. For Costa Rica, a 10% increase in coffee exports represents 0.26% of total national output (GDP) in 1997.
MORE THAN FOOD ON THE TABLE: AGRICULTURE’S TRUE CONTRIBUTION TO THE ECONOMYxviii
When analyzing agriculture’s true contribution to our countries’ economic development, theanalytical framework of SAM multipliers makes it possible to factor in considerations regardingthe generation and use of income, since it gives decision makers indicators of the effects on labor,capital, land and family income. This information is important when negotiating developmentstrategies, since it makes it possible to identify sectors that not only have a significant multipliereffect on production but that can also have important effects on the distribution of income andthe value added generated.
Using these methods to measure agriculture’s true contribution to the economy clearlydemonstrates agriculture’s importance to development. This, in turn, will make it possible toimprove decisions regarding investments and policy-making for agriculture, so that theycontribute more effectively to development and poverty reduction.
Background to the Study
Agriculture is something more than crops and food: nowadays all countries regard it as a strategicasset. However, the importance attached to it in political circles and among decision-makersvaries. In some countries, its political importance is declining and the support it receives islimited, while in others, especially in the most developed, increasing amounts of resources are beingallocated to agriculture in the form of subsidies and external support. In 2002 alone, developedcountries invested around $350 billion in government subsidies to support their farmers.
The underestimation of the value of agriculture is a concern that has been clearly expressedby the Ministers of Agriculture of the Americas and, given the challenges posed by the newenvironment, it is essential to view agriculture in a new light in order to reposition it at thepolicymaking level. This concern was addressed by the Interagency Group on Rural Development,IGRD11. At a meeting in Havana (2001), IICA agreed to carry out the necessary analyses todetermine agriculture’s true contribution to rural livelihoods and the sector’s importance for theeconomic development of national economies. The present study is a response to that commitment.
The Role of Agriculture in Economic Development
During the 50s, 60s and 70s it was believed that an economic development model based onimport substitution and the promotion of industrialization would be capable of imitating thesuccess achieved by developed countries. This model promoted growth on the basis of “star”sectors, disengaging agriculture from the motor of economic development. It was argued thatthese “star” sectors must have strong production links with other industrial sectors and that,since agriculture did not have strong forward and backward linkages with the rest of theeconomy12, it could not generate growth. Today it is recognized that agriculture generatesimportant production chains and intersectoral links, which generate value added beyond theirown activity. Agriculture is not an isolated sector, but is interconnected with other sectors of theeconomy and contributes to growth through: the absorption of labor, mainly unskilled and rural
11. ECLAC, FAO, GTZ, IICA, IDB, IFAD, USAID and World Bank, .12. The measurement of these chains or linkages was based on input–output techniques, e.g., Input –Output matrices based on
National Accounts.
1. INTRODUCTION

labor; the generation of foreign exchange; the use and conservation of natural resources; thegeneration of investment capital; and, the generation of strong linkages, for example withtrade, financial services, transportation and storage, among others.
The debate on agriculture’s role in the economic development of countries is still “unfold.”Although the days of theories and doctrines that considered the industrial sector to be the exclusiveengine of the development13 are over, among policymakers the role of agriculture still appearsto be unclear, misunderstood and even confused.
However, three aspects may be emphasized in the current debate on the role. Firstly, it isnecessary to recognize the interdependence between agriculture and the rest of the economy.For economic growth to occur, agriculture and the other sectors must carry out functions thatare intrinsically related to each other (Hayani and Ruttan, 1985). Agriculture should contribute– as a whole and in coordination with the rest of the economic sectors - to maximize the use ofcompetitive advantages and participate in the process of capital accumulation, within anenvironmentally sustainable scenario (FAO, 1995).
Indeed, in the context of the continuous search for competitiveness, it is only by payingattention to all the links of the productive process that it is possible to achieve the yields andquality of products necessary to enter and remain in the markets (ECLAC, 2001). The productionsystems linked to agriculture – agroindustry, for example - have become more intricate andcomplex, and require more sophisticated and dynamic food distribution networks. Thus, thecoordination of functions between agriculture and other sectors becomes indispensable.
Secondly, it is necessary to recognize the stabilizing role of agriculture on rural livelihoods andfood security. Although food production has always been regarded as an essential requirement forthe development of civilization, its role in bringing stability to rural livelihoods and in the sustainabilityof the rural territories is not clearly perceived. The following citation summarizes the argument:
“The abatement of rural poverty should be based, above all, on the economic activation ofthe [rural] territories, based on a vision of territorial development in which theimplementation of a dynamic and competitive agriculture plays a decisive role as the pivotalpoint for the articulation of different business activities that generate employment. Thisin turn would create a spiral of demand for services and products, making economicdynamism sustainable” (ECLAC, 2001).
Recent publications mention agriculture and sustainable rural livelihoods as key ingredientsto reduce poverty levels in developing nations and to achieve the Millennium Development Goalsfor the year 2015 in the areas of health and nutrition. More than 800 million poor people throughoutthe world, and more than 200 million in Latin America and the Caribbean, are faced with seriousproblems in terms of their ability to satisfy their basic nutritional requirements. Nowadays, in ourglobalized world, the issue of food security has once again emerged as the main challenge facinghumankind; it is a source of institutional tensions, trade disputes and it also poses moral questions.
MORE THAN FOOD ON THE TABLE: AGRICULTURE’S TRUE CONTRIBUTION TO THE ECONOMY2
13. See Hirschman (1958) as the proponent of this model. For a general discussion on agriculture in economic developmenttheories see chapter two of Hayani & Ruttan (1991).
Thirdly, the multi-functionality of agriculture involves the economic and the non-economicdimensions of agriculture. Rural and urban inhabitants place increasing demands to theecosystem services of the agriculture (protection of water sources, recreational areas, etc.). Thefollowing citation clarifies the concept of multi-functionality.
“The multi-functionality of agriculture is determined by a set of externalities, in other words,the additional benefits or damage generated by the activity itself. Aside from the goods itproduces, agriculture generates a set of collateral effects that are not incorporated into thefunctions of production, or into the costs and income structures of productive activities, norare they part of the financial analysis of an entrepreneur. Rather, they are effects that escapefrom its productive activity, but that affect the whole of society.” (Echeverri and Pillar, 2002).
In specific terms, much of the debate on agriculture’s contribution to the development ofcountries ignores issues such as agriculture’s role in the conservation of natural resources andthe environment; the treatment of certain problems of a global character (climate change,biodiversity, desertification and others) and the development of social capital and the preservationof community life.
Any attempt to properly measure agriculture’s contribution and define its role in economicdevelopment should therefore consider the three arguments outlined above.
Measuring Agriculture’s Contribution to Economic Development
Agriculture’s performance and its contribution to our countries’ economic development hastraditionally been undervalued, since it is measured using information about harvests and thesale of raw materials, mainly crops and livestock. As a result, the backward and forwardlinkages with agroindustry, the services and trade sectors and, in general, the rest of theeconomy, are overlooked. Thus, the value added generated by these linkages throughout theeconomy does not appear in the basic agricultural statistics of most countries.
Some studies have attempted to measure agriculture’s true contribution to the developmentof the Latin American countries, using input-output (I-O) matrices to estimate the multipliers14,and trying to incorporate agriculture’s linkages with related sectors into the measurement. Infact, a study for El Salvador determined that agriculture and agrifood is the sector with the greatestcapacity to boost the economy, since a 10% increase in the sector adds 3.36% to the gross valueof domestic output. Furthermore, it was estimated that in 1996 the agricultural sector represented32.2% of the gross value of production, equivalent to more than 23% of GDP, 31.3% of intermediatedomestic demand and 32.8% of final demand (Ramos and Pérez, 1999).
Another study conducted in 1996 for the Chilean economy shows that, taking into accountonly the direct linkages with the manufacturing sector, agriculture’s direct share of GDP
INTRODUCTION 3
14. In this study the word multiplier is used to designate the multiplying effect or the increase by repetition and accumulation thatan initial injection in a sector of the economy has on the economy as a whole.
increased from 4.4 to 15.1%; employment increased from 14.1% of the economically activepopulation to 22.1%; and total exports increased from 4.8% to 19.9%. In other words, theimportance of the agricultural sector is multiplied by 3.4, 1.5, and 4.1 times in the respectiveparameters (Dirven, 2002). In the case of Guatemala, Navas and Toro (1991) underscore theimportance of agriculture and agrifood in terms of its share of aggregate demand (33.1%) and itsaggregate value in relation to the sector’s absorption (74.5%). They also conducted an exerciseto calculate the multipliers, which confirmed the importance of the agricultural sector’s linkages.
The True Measurement of the Agriculture’s Contribution
These attempts to measure agriculture’s contribution would appear to prove the hypothesisthat, if the added value of pre-harvest and post-harvest production chains is included in theanalysis, agriculture becomes a significant contributor to GDP. However, these efforts do littleto measure agriculture’s role in generating value added and in the redistribution of income. Nordo they measure the contributions of environmental and other services provided by agriculture.
To properly measure agriculture’s performance and contribution, account must be taken ofits effects on the distribution of income among rural and urban households, wage earners andowners. These aspects are essential to evaluate its impact on poverty alleviation strategies and,in particular, on the livelihoods of rural populations. Furthermore, a true measurement ofagriculture’s contribution should not overlook its role in meeting the growing demand forenvironmental goods and services from urban centers. As an economic bridge between rural andurban areas, agriculture provides food, employment and natural resource services to urbandwellers. In a globalized world, a country’s food security can only be assured if rural livelihoodsare strengthened.
Objective of the Study
The aim of the study was to develop a methodology to estimate agriculture’s true contributionto our countries’ economic development. This methodology empirically addresses the conceptof agriculture and agrifood; calculates agricultural linkages; and simulates the impact ofagriculture on the countries’ overall economic activity.
Another goal is to highlight agriculture’s contribution to the livelihoods of rural dwellers andthe sector’s potential for contributing to the development of national economies.15
MORE THAN FOOD ON THE TABLE: AGRICULTURE’S TRUE CONTRIBUTION TO THE ECONOMY4
15. Future stages will include dimensions that are important for rural economies, especially the natural resources sector, throughthe so-called “Green Accounts” (already in progress); the specification of regional accounts; and a better specification ofpromising activities such as agro tourism. In addition, an analytical framework will be developed for detecting other, harderto quantify contributions related to the social, cultural and environmental dimensions.

INTRODUCTION
Scope of the Research
This document attempts to highlight agriculture’s contribution to the livelihoods of ruraldwellers and the sector’s potential for contributing to the development of national economies.Future stages of the study will include other dimensions that are important for rural economies,particularly the natural resources sector, through the so-called “Green Accounting” (already inprogress); the specification of regional accounts; and a better specification of promising activitiessuch as the agro-tourism. In addition, an analytical framework will be developed to detectother contributions that are harder to quantify, related to social, cultural and environmentaldimensions.
As part of a joint research initiative within the framework of the IGRD, this report presentsthe results of Phases I and II of the study’s first component. Feedback will make it possible torefine and complement current efforts to produce an analytical framework that incorporates greenaccounts and will also facilitate the development of Computable General Equilibrium models.The capability developed will make it possible to improve policy analysis by providing ananalytical framework that integrates the social, economic and environmental dimensions of ruraldevelopment.
5

Procedure
In order to develop and validate the methodology to measure agriculture’s true contributionto economic development, it was first necessary to establish the data requirements and selectthe countries to be studied. Thus eleven Social Accounting Matrices were calculated. The studythen proceeded to calculate the percentages of the productive sectors’ share of the gross domesticproduct (GDP), complementing this with an estimate of the relative share of “agriculture andagrifood.” Then the destination (use) of agricultural production was analyzed, along with thepayments made by this sector, placing special emphasis on compensation to the factors ofproduction (factor payments). The next step was to calculate a socioeconomic model known asSAM Multipliers, which facilitates analysis of the possible effects of external injections (throughincreased demand for exports, foreign investment, transfers and external donations, among others)on the economy of the countries studied. This analysis provides a direct measurement of thelinkages between agriculture and the rest of the economy. Finally, simulations were carried outfor some of the most important agricultural sectors for groups of countries.
The Social Accounting Matrix16
As mentioned in the introduction, the methods used to assess the true contribution ofagriculture should: measure the impact of agriculture and its linkages; consider the generationof value added and the distribution of income; and measure the impact on the environment. Inpractice, however, this approach is limited by the methods used to collect statistical data andby the limited financial resources available to update cost structures and more efficiently recordintermediate consumption and value added in the economy.
Nowadays, countries make considerable efforts to gather and compile such information ina series of national accounts and, as a result, most countries have a matrix or a table showingthe supply and use of production. In fact, these national accounts are the richest and mostconsistent source of information available to us. For this reason, the present study utilizes thesocial accounting matrixes of the different countries as a database, since these are based onnational accounts.
16. For more information on the methodological aspects of the SAM and the model of SAM multipliers, see Annex A.
2. METHODOLOGY
In general, a Social Accounting Matrix (SAM) is a database in matrix format that consistentlyrepresents all monetary flows of goods, services and income formation between all the agentsof an economy within a reference period (Ferri and Uriel, 2000). A SAM reflects these relationshipsas well as broader linkages, making it possible to examine the structural links betweenproduction, consumption, trade and the accumulation and distribution of income. The mostimportant characteristics that make the SAM suitable for the purposes of this research are(Alarcón, in Adamson et al, 1999):
• Comprehensive: the SAM reflects the total circular flow of the economy as a whole.
• Consistent: it complies with the Walrasian general equilibrium rule; all markets are inbalance.
• Transparent: the SAM provides an objective view of the structural socioeconomic relationsof the economy under study.
• Flexible: it may be utilized as a basis for developing Computable General Equilibrium (CGE)models or to expand these by including additional modules that are considered relevant,such as demographic data, social and environmental indicators or both.
The greatest virtue of a social accounting matrix is that it explicitly describes the flow of incomeand makes it possible to analyze issues related to income distribution. As databases, these matrixeshave also been widely used to study trade policy, income distribution, fiscal policy, external impactsand structural adjustment issues, among others. Furthermore, they can be used to developsocioeconomic models that simulate the impact of public policies and of other exogenous changeson the economy as a whole.
The information used to create the SAMs for 10 of the countries in the study (Argentina,Brazil, Canada, Chile, Colombia, Mexico, Peru, Uruguay, the United States and Venezuela) wasobtained from the GTAP database (Global Trade Analysis Project, Purdue University). For CostaRica, the study used a SAM developed by IICA (IICA, 2004) based on the year 1997 (this is alsouseful because the GTAP database uses 1997 as its base year) and including 41 different sectorsof the economy. Based on these 11 SAMs (presented in an abbreviated form in Annex B), themultipliers were estimated.17
It should be noted that, although the SAM is an accounting framework consistent with themonetary flows of the economy, there are some important monetary flows that are notincorporated in it. For example, certain productive sectors such as personal consumption or theinformal sector are unaccounted for, due to a lack of statistical data. Nevertheless, the informationprovided by SAMs is far more comprehensive than that derived from input-output matrices, andsignificantly improves the measurement of agriculture’s true contribution to economicdevelopment.
MORE THAN FOOD ON THE TABLE: AGRICULTURE’S TRUE CONTRIBUTION TO THE ECONOMY8
17. For Costa Rica’s SAM in all extension (115 X 115 sectors), please see (IICA, 2004) or contact the web site: www.iica.int.
The SAM Multiplier Model
One of the socioeconomic models that can be generated from a social accounting matrix isthe SAM Multiplier model. As a model, a SAM multiplier is an extension of input-outputmultipliers (I-O models) popular in the industrial analysis literature of the 1970s and 1980s.However, SAM multipliers are more complete and yield greater values that those obtained froman input-output matrix. For more information, see De Janvry and Sadoulet (1995).
The analysis of multipliers is based on the premise that in order to produce more in one sector,it is necessary to acquire inputs from another. This is known as direct input requirements. Butin order to supply these inputs, the different sectors of the economy also need to use inputs fromother activities and so the process is repeated, creating a long chain of what are known as indirectinput requirements. The SAM multiplier model reflects the total input requirements, both directand indirect. This process also generates changes in factor payments, in the national income andin its distribution.
SAM multipliers (see Annex D) are used to quantify the links between a particular activity- in this case agriculture - and the rest of the economy. For example, if a change occurs inagricultural output, this also produces changes in demand for inputs, employment and thegeneration of income in rural areas. Conversely, changes in other sectors of the economy affectagricultural production, agricultural employment and the distribution of farm incomes. The biggerthe multiplier, the greater its impact on the economy.
An analysis of SAM multipliers may provide the criteria for identifying key sectors of theeconomy, where new investments may create opportunities for growth. By focusing efforts onthose sectors with strong backward and forward linkages to production, and through a propergeneration and distribution of income, the process of economic growth can be accelerated18.
METHODOLOGY 9
18. Unlike the analysis of input –output multipliers that only take into account the linkages between industries but not the effectson the generation and use of value added (see Sadoulet & De Janvry; Holland & Wyeth)

The results are presented in three sections. The first figures obtained show the contributionof agriculture and agrifood, expressed as a percentage, to gross domestic product in the countriesstudied. Agriculture’s linkages were then estimated, using information from the social accountingmatrixes. These linkages were analyzed to determine both the effects on other productionprocesses and on the generation and use of income. The effects on production were analyzed bystudying the use given to the agricultural output (its destination); and the linkages with thegeneration and use of income were examined through an analysis of agricultural production costs.
Finally, using the SAM multiplier model, the study simulated external impacts on thecountries’ economies.
Primary Agriculture vs “Agriculture and Agrifood”
To corroborate, at least in a general way, the hypothesis that agriculture’s true contributionto the economy is greater than what is usually reported and believed, we turn once again to theconcept of agriculture and agrifood. This means adding to the measurement of the agriculturalaggregates those sectors that are linked by their requirement for agricultural inputs, such asthe production of processed foods and the agroindustrial sector. The concept of agriculture andagrifood as a group of interdependent sectors closely linked to the primary agricultural sector,opens up the possibility of reappraising the value of agriculture. Manufacturing industriesbased on natural resources do not usually enter into statistical data as agriculture but asindustry; for example, the food processing industry, the clothing industry that relies on cottonand the furniture and paper industries that depend on timber. All these economic activities arebased on raw materials from rural areas and on primary agriculture, and help us to betterunderstand what we wish to add to the concept of agriculture and agrifood.
Table 1 shows the contribution of primary agriculture and “agriculture and agrifood” to theGross Domestic Product. For the 10 countries with the GTAP database the primary agriculturalsector is defined as agriculture, forestry, and fisheries (Chapters 1- 4 of the CPC and 5 of theISIC) and “agriculture and agrifood” is defined as the primary sector plus processed foods andmanufactures derived either from this sector or from agroindustry (Chapters 21-25 of the CPCand Chapters 17- 22 of the ISIC). For Costa Rica, the primary sector consists of the first 9 linesof the Social Accounting Matrix of 1997 (banana, ripe coffee, sugarcane, cacao in beans, crude
3. AGRICULTURE’S TRUECONTRIBUTION TO THE ECONOMY
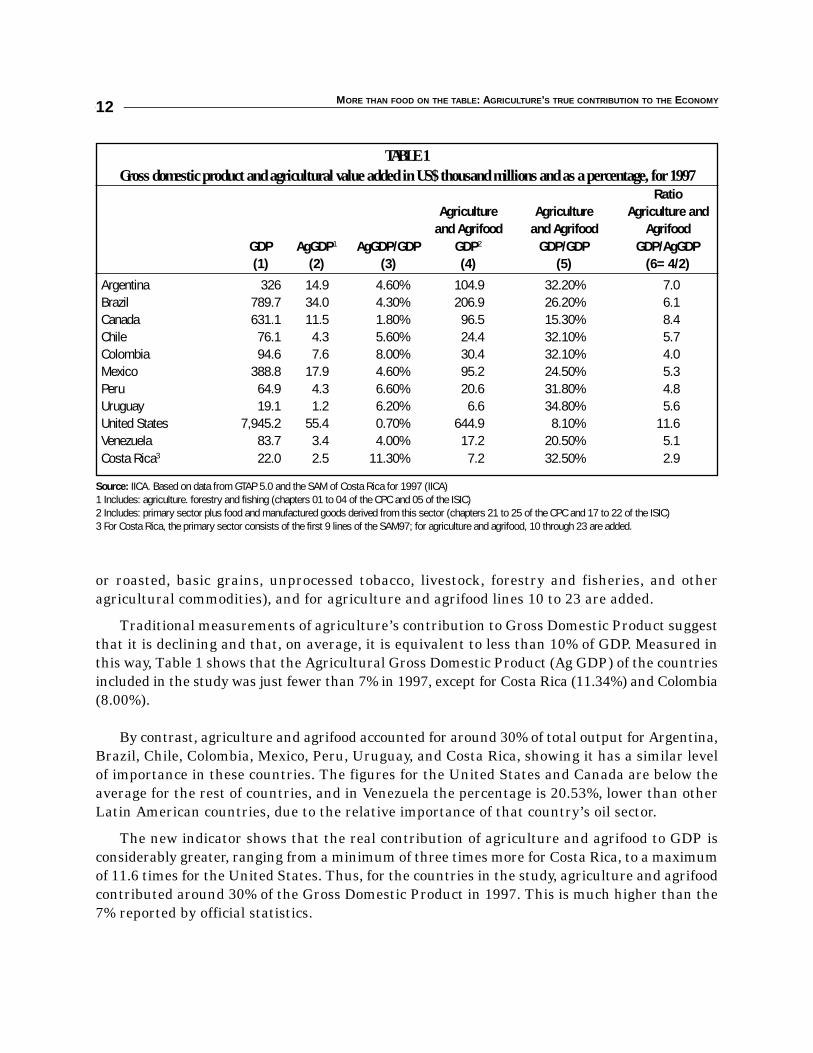
or roasted, basic grains, unprocessed tobacco, livestock, forestry and fisheries, and otheragricultural commodities), and for agriculture and agrifood lines 10 to 23 are added.
Traditional measurements of agriculture’s contribution to Gross Domestic Product suggestthat it is declining and that, on average, it is equivalent to less than 10% of GDP. Measured inthis way, Table 1 shows that the Agricultural Gross Domestic Product (Ag GDP) of the countriesincluded in the study was just fewer than 7% in 1997, except for Costa Rica (11.34%) and Colombia(8.00%).
By contrast, agriculture and agrifood accounted for around 30% of total output for Argentina,Brazil, Chile, Colombia, Mexico, Peru, Uruguay, and Costa Rica, showing it has a similar levelof importance in these countries. The figures for the United States and Canada are below theaverage for the rest of countries, and in Venezuela the percentage is 20.53%, lower than otherLatin American countries, due to the relative importance of that country’s oil sector.
The new indicator shows that the real contribution of agriculture and agrifood to GDP isconsiderably greater, ranging from a minimum of three times more for Costa Rica, to a maximumof 11.6 times for the United States. Thus, for the countries in the study, agriculture and agrifoodcontributed around 30% of the Gross Domestic Product in 1997. This is much higher than the7% reported by official statistics.
MORE THAN FOOD ON THE TABLE: AGRICULTURE’S TRUE CONTRIBUTION TO THE ECONOMY12
TABLE 1Gross domestic product and agricultural value added in US$ thousand millions and as a percentage, for 1997
RatioAgriculture Agriculture Agriculture and
and Agrifood and Agrifood AgrifoodGDP AgGDP1 AgGDP/GDP GDP2 GDP/GDP GDP/AgGDP(1) (2) (3) (4) (5) (6=4/2)
Argentina 326 14.9 4.60% 104.9 32.20% 7.0Brazil 789.7 34.0 4.30% 206.9 26.20% 6.1Canada 631.1 11.5 1.80% 96.5 15.30% 8.4Chile 76.1 4.3 5.60% 24.4 32.10% 5.7Colombia 94.6 7.6 8.00% 30.4 32.10% 4.0Mexico 388.8 17.9 4.60% 95.2 24.50% 5.3Peru 64.9 4.3 6.60% 20.6 31.80% 4.8Uruguay 19.1 1.2 6.20% 6.6 34.80% 5.6United States 7,945.2 55.4 0.70% 644.9 8.10% 11.6Venezuela 83.7 3.4 4.00% 17.2 20.50% 5.1Costa Rica3 22.0 2.5 11.30% 7.2 32.50% 2.9
Source: IICA. Based on data from GTAP 5.0 and the SAM of Costa Rica for 1997 (IICA)1 Includes: agriculture. forestry and fishing (chapters 01 to 04 of the CPC and 05 of the ISIC)2 Includes: primary sector plus food and manufactured goods derived from this sector (chapters 21 to 25 of the CPC and 17 to 22 of the ISIC)3 For Costa Rica, the primary sector consists of the first 9 lines of the SAM97; for agriculture and agrifood, 10 through 23 are added.
AGRICULTURE’S TRUE CONTRIBUTION TO THE ECONOMY 13
It is interesting to note that, the greater the level of diversification of a country’s economicstructure, the greater the weight of the food and manufactured products that transform the inputsof primary agriculture, particularly in the cases of the U.S., Canada, Argentina and Brazil.
Agricultural Linkages
As an economy develops and becomes more diversified, the primary agricultural sectorloses relative weight in terms of GDP, but develops strong linkages with the rest of the economy.
This can be confirmed by using the SAM to examine the important linkages that existbetween agriculture and the rest of the economy. The extent of these linkages may be identifiedby analyzing the use of agricultural production (its destination). If a substantial part ofagriculture is intended for intermediate uses (for example, for food processing) we shouldexpect strong linkages between industries.
The destination of agricultural output is studied by analyzing the transactions between eachof the different national accounts, starting with the following equation:
Q = D + I + C + X + G–M (1)
Where Q: gross output19; D: intermediate demand; I: investment; C: private householdconsumption; X: exports; G: government consumption; and, M: imports. It is also necessary to divide the economy into 5 sectors, as follows:
• Primary sector: made up of agriculture, forestry, and fisheries (Chapters 1- 4 of theCPC and 5 of the ISIC) for the 10 GTAP countries, for Costa Rica the first 9 lines ofthe SAM97.
• Processed Food: includes Chapters 21-25 of the CPC classification; for Costa Rica, lines10 - 16 and 18 of the SAM97.
• Agroindustry: defined in Chapters 17- 22 of the ISIC; for Costa Rica, lines 17 and 19-23 of the SAM97.
• Natural Resources: Chapters 10-14 of the ISIC; for Costa Rica, there is no disaggregationfor this sector.
• Rest of the Economy: Chapters 23-99 of the ISIC; for Costa Rica lines 24-41.
The results obtained by following equation 1 are shown in Table 2. Analysis of the destinationof the countries’ agricultural output (excluding Costa Rica20) shows that agriculture is animportant source of inputs for other productive activities: intermediate demand for agriculturalcommodities absorbs 74% of primary agricultural output. In other words, ¾ of agricultural
19. The concept of gross output is sometimes confused with Gross Domestic Product (GDP). The difference between both is thatto estimate the GDP is the value of inputs used in the production is subtracted from gross output
20. Costa Rica’s exclusion from the total is due to the fact that its data comes from a different source and the consolidation mustbe done thoroughly. Also, the small size of its economy does not alter the total results.
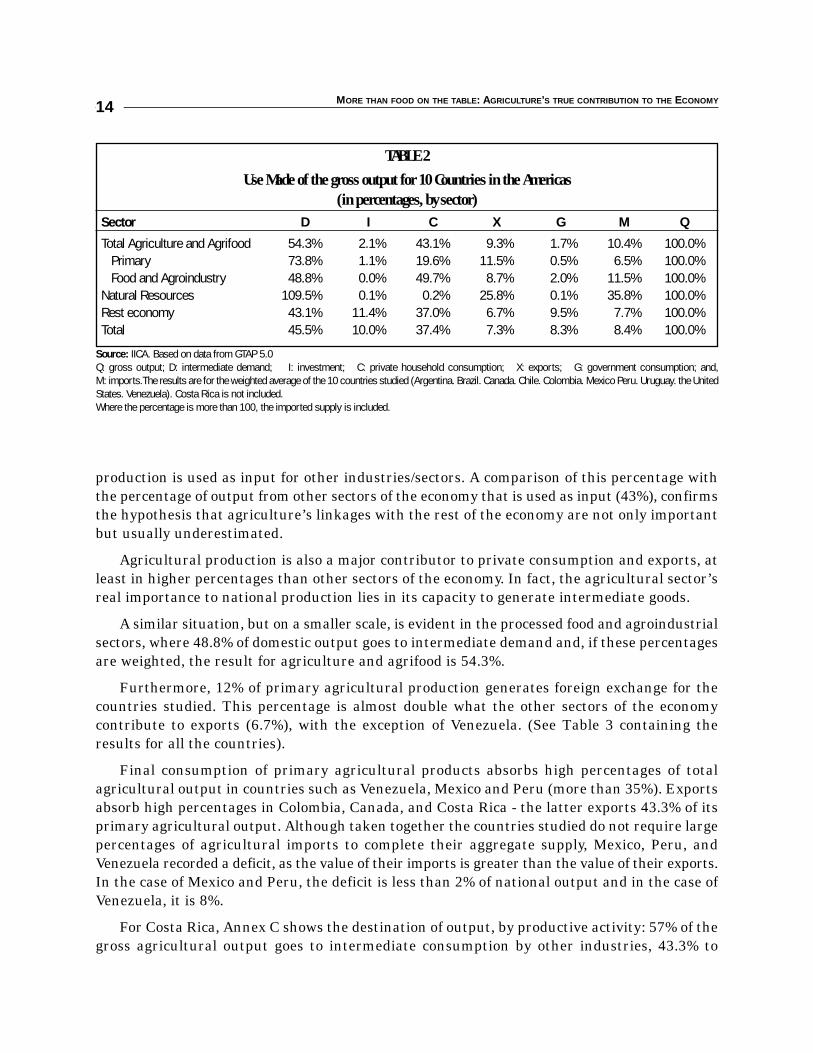
production is used as input for other industries/sectors. A comparison of this percentage withthe percentage of output from other sectors of the economy that is used as input (43%), confirmsthe hypothesis that agriculture’s linkages with the rest of the economy are not only importantbut usually underestimated.
Agricultural production is also a major contributor to private consumption and exports, atleast in higher percentages than other sectors of the economy. In fact, the agricultural sector’sreal importance to national production lies in its capacity to generate intermediate goods.
A similar situation, but on a smaller scale, is evident in the processed food and agroindustrialsectors, where 48.8% of domestic output goes to intermediate demand and, if these percentagesare weighted, the result for agriculture and agrifood is 54.3%.
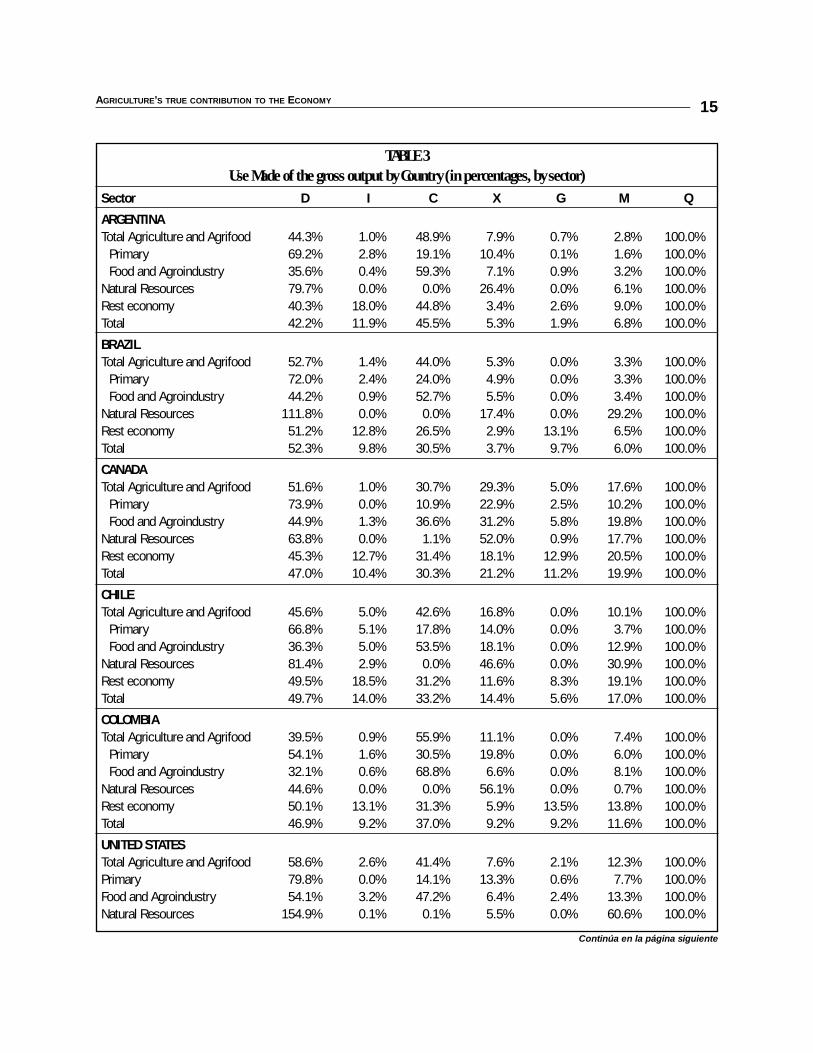
Furthermore, 12% of primary agricultural production generates foreign exchange for thecountries studied. This percentage is almost double what the other sectors of the economycontribute to exports (6.7%), with the exception of Venezuela. (See Table 3 containing theresults for all the countries).
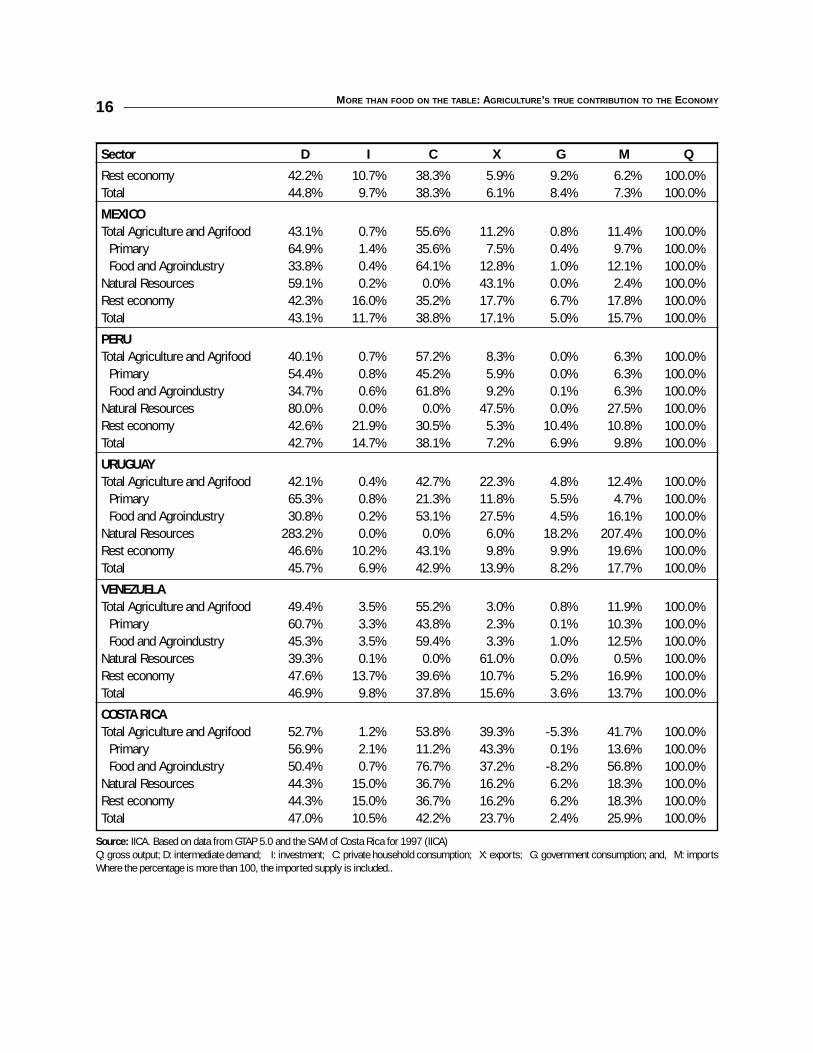
Final consumption of primary agricultural products absorbs high percentages of totalagricultural output in countries such as Venezuela, Mexico and Peru (more than 35%). Exportsabsorb high percentages in Colombia, Canada, and Costa Rica - the latter exports 43.3% of itsprimary agricultural output. Although taken together the countries studied do not require largepercentages of agricultural imports to complete their aggregate supply, Mexico, Peru, andVenezuela recorded a deficit, as the value of their imports is greater than the value of their exports.In the case of Mexico and Peru, the deficit is less than 2% of national output and in the case ofVenezuela, it is 8%.
For Costa Rica, Annex C shows the destination of output, by productive activity: 57% of thegross agricultural output goes to intermediate consumption by other industries, 43.3% to
MORE THAN FOOD ON THE TABLE: AGRICULTURE’S TRUE CONTRIBUTION TO THE ECONOMY14
TABLE 2
Use Made of the gross output for 10 Countries in the Americas(in percentages, by sector)
Sector D I C X G M Q
Total Agriculture and Agrifood 54.3% 2.1% 43.1% 9.3% 1.7% 10.4% 100.0%Primary 73.8% 1.1% 19.6% 11.5% 0.5% 6.5% 100.0%Food and Agroindustry 48.8% 0.0% 49.7% 8.7% 2.0% 11.5% 100.0%
Natural Resources 109.5% 0.1% 0.2% 25.8% 0.1% 35.8% 100.0%Rest economy 43.1% 11.4% 37.0% 6.7% 9.5% 7.7% 100.0%Total 45.5% 10.0% 37.4% 7.3% 8.3% 8.4% 100.0%
Source: IICA. Based on data from GTAP 5.0 Q: gross output; D: intermediate demand; I: investment; C: private household consumption; X: exports; G: government consumption; and,M: imports.The results are for the weighted average of the 10 countries studied (Argentina. Brazil. Canada. Chile. Colombia. Mexico Peru. Uruguay. the UnitedStates. Venezuela). Costa Rica is not included.Where the percentage is more than 100, the imported supply is included.
AGRICULTURE’S TRUE CONTRIBUTION TO THE ECONOMY 15
TABLE 3Use Made of the gross output by Country (in percentages, by sector)
Sector D I C X G M Q
ARGENTINATotal Agriculture and Agrifood 44.3% 1.0% 48.9% 7.9% 0.7% 2.8% 100.0%
Primary 69.2% 2.8% 19.1% 10.4% 0.1% 1.6% 100.0%Food and Agroindustry 35.6% 0.4% 59.3% 7.1% 0.9% 3.2% 100.0%
Natural Resources 79.7% 0.0% 0.0% 26.4% 0.0% 6.1% 100.0%Rest economy 40.3% 18.0% 44.8% 3.4% 2.6% 9.0% 100.0%Total 42.2% 11.9% 45.5% 5.3% 1.9% 6.8% 100.0%
BRAZILTotal Agriculture and Agrifood 52.7% 1.4% 44.0% 5.3% 0.0% 3.3% 100.0%
Primary 72.0% 2.4% 24.0% 4.9% 0.0% 3.3% 100.0%Food and Agroindustry 44.2% 0.9% 52.7% 5.5% 0.0% 3.4% 100.0%
Natural Resources 111.8% 0.0% 0.0% 17.4% 0.0% 29.2% 100.0%Rest economy 51.2% 12.8% 26.5% 2.9% 13.1% 6.5% 100.0%Total 52.3% 9.8% 30.5% 3.7% 9.7% 6.0% 100.0%
CANADATotal Agriculture and Agrifood 51.6% 1.0% 30.7% 29.3% 5.0% 17.6% 100.0%
Primary 73.9% 0.0% 10.9% 22.9% 2.5% 10.2% 100.0%Food and Agroindustry 44.9% 1.3% 36.6% 31.2% 5.8% 19.8% 100.0%
Natural Resources 63.8% 0.0% 1.1% 52.0% 0.9% 17.7% 100.0%Rest economy 45.3% 12.7% 31.4% 18.1% 12.9% 20.5% 100.0%Total 47.0% 10.4% 30.3% 21.2% 11.2% 19.9% 100.0%
CHILETotal Agriculture and Agrifood 45.6% 5.0% 42.6% 16.8% 0.0% 10.1% 100.0%
Primary 66.8% 5.1% 17.8% 14.0% 0.0% 3.7% 100.0%Food and Agroindustry 36.3% 5.0% 53.5% 18.1% 0.0% 12.9% 100.0%
Natural Resources 81.4% 2.9% 0.0% 46.6% 0.0% 30.9% 100.0%Rest economy 49.5% 18.5% 31.2% 11.6% 8.3% 19.1% 100.0%Total 49.7% 14.0% 33.2% 14.4% 5.6% 17.0% 100.0%
COLOMBIATotal Agriculture and Agrifood 39.5% 0.9% 55.9% 11.1% 0.0% 7.4% 100.0%
Primary 54.1% 1.6% 30.5% 19.8% 0.0% 6.0% 100.0%Food and Agroindustry 32.1% 0.6% 68.8% 6.6% 0.0% 8.1% 100.0%
Natural Resources 44.6% 0.0% 0.0% 56.1% 0.0% 0.7% 100.0%Rest economy 50.1% 13.1% 31.3% 5.9% 13.5% 13.8% 100.0%Total 46.9% 9.2% 37.0% 9.2% 9.2% 11.6% 100.0%
UNITED STATESTotal Agriculture and Agrifood 58.6% 2.6% 41.4% 7.6% 2.1% 12.3% 100.0%Primary 79.8% 0.0% 14.1% 13.3% 0.6% 7.7% 100.0%Food and Agroindustry 54.1% 3.2% 47.2% 6.4% 2.4% 13.3% 100.0%Natural Resources 154.9% 0.1% 0.1% 5.5% 0.0% 60.6% 100.0%
Continúa en la página siguiente
MORE THAN FOOD ON THE TABLE: AGRICULTURE’S TRUE CONTRIBUTION TO THE ECONOMY16
Sector D I C X G M Q
Rest economy 42.2% 10.7% 38.3% 5.9% 9.2% 6.2% 100.0%Total 44.8% 9.7% 38.3% 6.1% 8.4% 7.3% 100.0%
MEXICOTotal Agriculture and Agrifood 43.1% 0.7% 55.6% 11.2% 0.8% 11.4% 100.0%
Primary 64.9% 1.4% 35.6% 7.5% 0.4% 9.7% 100.0%Food and Agroindustry 33.8% 0.4% 64.1% 12.8% 1.0% 12.1% 100.0%
Natural Resources 59.1% 0.2% 0.0% 43.1% 0.0% 2.4% 100.0%Rest economy 42.3% 16.0% 35.2% 17.7% 6.7% 17.8% 100.0%Total 43.1% 11.7% 38.8% 17.1% 5.0% 15.7% 100.0%
PERUTotal Agriculture and Agrifood 40.1% 0.7% 57.2% 8.3% 0.0% 6.3% 100.0%
Primary 54.4% 0.8% 45.2% 5.9% 0.0% 6.3% 100.0%Food and Agroindustry 34.7% 0.6% 61.8% 9.2% 0.1% 6.3% 100.0%
Natural Resources 80.0% 0.0% 0.0% 47.5% 0.0% 27.5% 100.0%Rest economy 42.6% 21.9% 30.5% 5.3% 10.4% 10.8% 100.0%Total 42.7% 14.7% 38.1% 7.2% 6.9% 9.8% 100.0%
URUGUAYTotal Agriculture and Agrifood 42.1% 0.4% 42.7% 22.3% 4.8% 12.4% 100.0%
Primary 65.3% 0.8% 21.3% 11.8% 5.5% 4.7% 100.0%Food and Agroindustry 30.8% 0.2% 53.1% 27.5% 4.5% 16.1% 100.0%
Natural Resources 283.2% 0.0% 0.0% 6.0% 18.2% 207.4% 100.0%Rest economy 46.6% 10.2% 43.1% 9.8% 9.9% 19.6% 100.0%Total 45.7% 6.9% 42.9% 13.9% 8.2% 17.7% 100.0%
VENEZUELATotal Agriculture and Agrifood 49.4% 3.5% 55.2% 3.0% 0.8% 11.9% 100.0%
Primary 60.7% 3.3% 43.8% 2.3% 0.1% 10.3% 100.0%Food and Agroindustry 45.3% 3.5% 59.4% 3.3% 1.0% 12.5% 100.0%
Natural Resources 39.3% 0.1% 0.0% 61.0% 0.0% 0.5% 100.0%Rest economy 47.6% 13.7% 39.6% 10.7% 5.2% 16.9% 100.0%Total 46.9% 9.8% 37.8% 15.6% 3.6% 13.7% 100.0%
COSTA RICATotal Agriculture and Agrifood 52.7% 1.2% 53.8% 39.3% -5.3% 41.7% 100.0%
Primary 56.9% 2.1% 11.2% 43.3% 0.1% 13.6% 100.0%Food and Agroindustry 50.4% 0.7% 76.7% 37.2% -8.2% 56.8% 100.0%
Natural Resources 44.3% 15.0% 36.7% 16.2% 6.2% 18.3% 100.0%Rest economy 44.3% 15.0% 36.7% 16.2% 6.2% 18.3% 100.0%Total 47.0% 10.5% 42.2% 23.7% 2.4% 25.9% 100.0%
Source: IICA. Based on data from GTAP 5.0 and the SAM of Costa Rica for 1997 (IICA)Q: gross output; D: intermediate demand; I: investment; C: private household consumption; X: exports; G: government consumption; and, M: importsWhere the percentage is more than 100, the imported supply is included..
AGRICULTURE’S TRUE CONTRIBUTION TO THE ECONOMY 17
exports, 11.2% to private consumption, and 2% to investment. The domestic agricultural supplyis completed by imports of 13.6%.
In general, the above-mentioned structure of the destination of agricultural production doesnot vary from country to country. However, Canada, and to a greater extent Costa Rica, standout as economies that are more “open” to foreign trade, since their exports and imports, for allsectors, as a proportion of the gross output, are higher than the rest of the countries. It is alsointeresting to note that Chile and Venezuela show higher than average levels of investment inthe extended agricultural sector. Finally, Venezuela’s export structure is different due to theimportance of its oil sector, which means that the natural resources sector accounts for a largeproportion of the country’s exports.
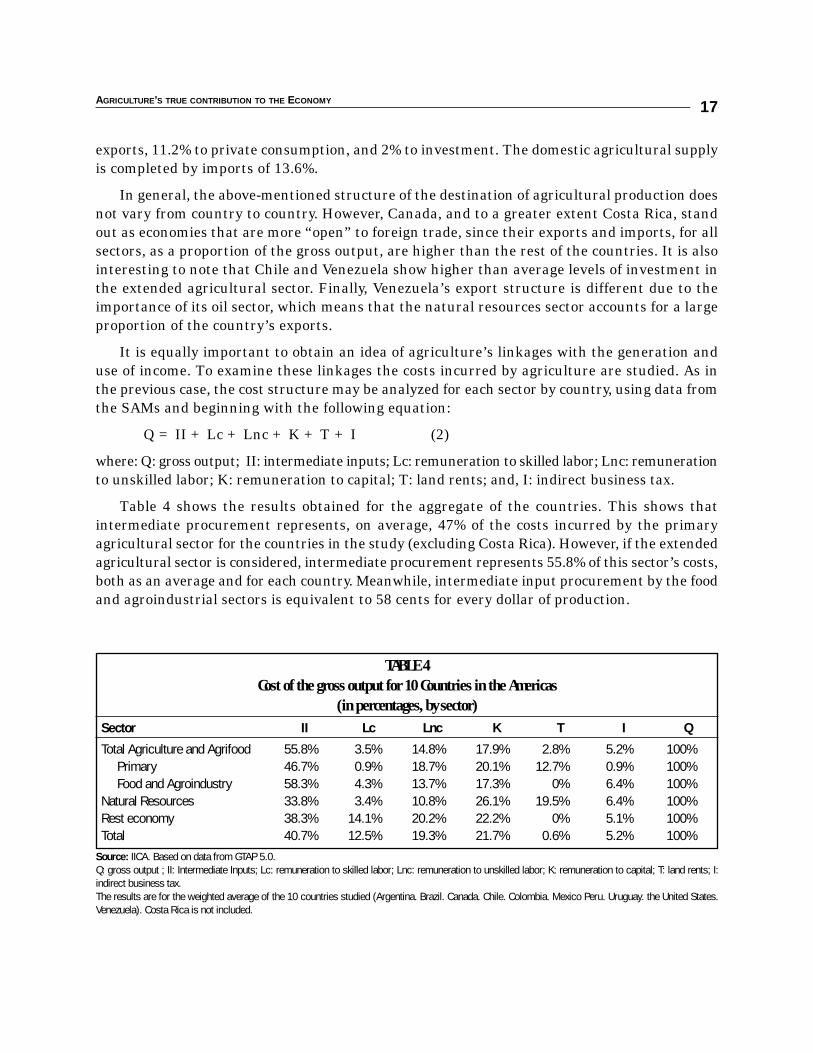
It is equally important to obtain an idea of agriculture’s linkages with the generation anduse of income. To examine these linkages the costs incurred by agriculture are studied. As inthe previous case, the cost structure may be analyzed for each sector by country, using data fromthe SAMs and beginning with the following equation:
Q = II + Lc + Lnc + K + T + I (2)
where: Q: gross output; II: intermediate inputs; Lc: remuneration to skilled labor; Lnc: remunerationto unskilled labor; K: remuneration to capital; T: land rents; and, I: indirect business tax.
Table 4 shows the results obtained for the aggregate of the countries. This shows thatintermediate procurement represents, on average, 47% of the costs incurred by the primaryagricultural sector for the countries in the study (excluding Costa Rica). However, if the extendedagricultural sector is considered, intermediate procurement represents 55.8% of this sector’s costs,both as an average and for each country. Meanwhile, intermediate input procurement by the foodand agroindustrial sectors is equivalent to 58 cents for every dollar of production.
TABLE 4Cost of the gross output for 10 Countries in the Americas
(in percentages, by sector)Sector II Lc Lnc K T I Q
Total Agriculture and Agrifood 55.8% 3.5% 14.8% 17.9% 2.8% 5.2% 100%Primary 46.7% 0.9% 18.7% 20.1% 12.7% 0.9% 100%Food and Agroindustry 58.3% 4.3% 13.7% 17.3% 0% 6.4% 100%
Natural Resources 33.8% 3.4% 10.8% 26.1% 19.5% 6.4% 100%Rest economy 38.3% 14.1% 20.2% 22.2% 0% 5.1% 100%Total 40.7% 12.5% 19.3% 21.7% 0.6% 5.2% 100%
Source: IICA. Based on data from GTAP 5.0.Q: gross output ; II: Intermediate Inputs; Lc: remuneration to skilled labor; Lnc: remuneration to unskilled labor; K: remuneration to capital; T: land rents; I:indirect business tax.The results are for the weighted average of the 10 countries studied (Argentina. Brazil. Canada. Chile. Colombia. Mexico Peru. Uruguay. the United States.Venezuela). Costa Rica is not included.
With respect to the generation of value added, the study explicitly shows that for every dollarproduced in agriculture, 53 cents is value added. When the United States and Canada areremoved from the group of countries studied, the value added is 70 cents. In turn, the food andagroindustrial sectors generate 42 cents in value added for every dollar produced.
Table 4 also provides details on primary agriculture’s payments to the factors of production:19.6% goes to labor remuneration, 20.1% to capital remuneration (very similar to the observedin the rest of the economy), 12.7% to land rent, and 0.9% to tax payments. It is important to pointout that the tax burden in the primary sector is almost nil, around 1% on average for the countrieslisted and is generally lower than for other sectors of the economy in almost all the countries.As far as taxation is concerned, it is interesting to note that some countries appear withnegative taxation for primary agriculture, something that may be seen in the most disaggregateddata21. This would appear to be evidence of the weight of subsidies in this sector.
An analysis of primary sector costs in the countries studied suggests that, on average, only1% is assigned to the payment of skilled labor, while the percentage for unskilled labor is 19%.This percentage is not surpassed by any other sector of the economy in the Latin Americancountries22, except in Brazil as shown in Table 5. The agricultural sector is therefore associatedwith a less technical labor force. In the case of agriculture and agrifood, however, the percentagefor skilled labor increases to 3.5%, while the percentage corresponding to unskilled labordecreases to 14.8%. This confirms the link between agricultural production and unskilled laborand the fact that the link with skilled labor is strengthened as we move from primary toagriculture and agrifood.
The study also highlights an interesting result, which has to do with the distribution of thepayments made by agriculture. If it is argued that most of the remuneration to skilled andunskilled labor, land and capital, remains in the regions where agricultural production takes place,then according to this reasoning and based on value added calculations for agriculture, for everydollar produced in primary agriculture at least 53 cents remains in rural areas (or 70 cents, ifwe remove the United States and Canada from the sample).
It is necessary to clarify two points with respect to Costa Rica, as its data comes from a differentsource: firstly, the fact that no disaggregated data is available for land rents and secondly, thatlabor is not divided into categories of skilled and unskilled labor, but rather into rural and urbanlabor. Therefore, Lc corresponds to urban labor and Lnc to rural labor. As is to be expected, thestudy shows that agriculture and agrifood assigns a larger proportion of its resources to rurallabor remuneration (13.0%) than to urban labor (6.0%). This difference is even more markedin primary agriculture, 23.0% vs. 2.6% (for more details see Annex C).
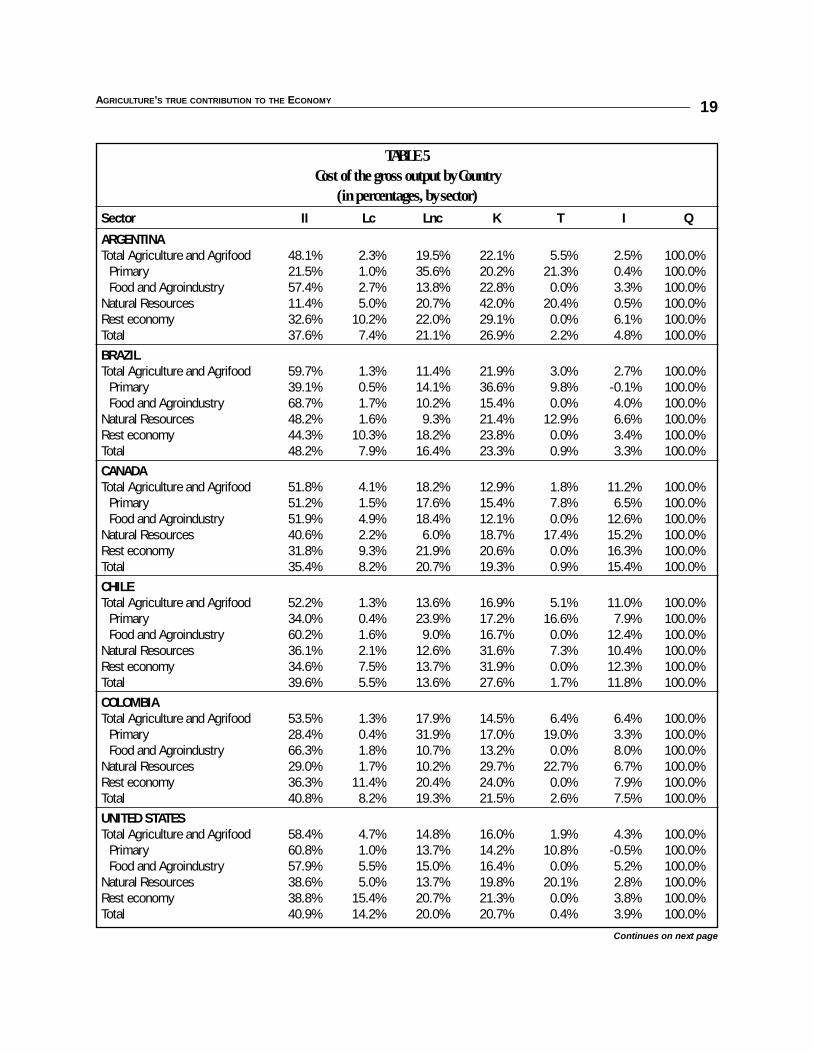
In general terms, the cost structure of the primary agricultural sector is similar for all thecountries studied, although with slight differences, as shown in Table 5. However, in the UnitedStates, the primary sector accounts for a greater percentage of intermediate inputs (60.8%) as
MORE THAN FOOD ON THE TABLE: AGRICULTURE’S TRUE CONTRIBUTION TO THE ECONOMY18
21. For more details see Annex C on the case of Costa Rica.22. In the case of the United States and Canada the “rest of the economy” sector pays the highest percentage, 21%. For Brazil this
percentage is 18%.
AGRICULTURE’S TRUE CONTRIBUTION TO THE ECONOMY 19
TABLE 5Cost of the gross output by Country
(in percentages, by sector)Sector II Lc Lnc K T I Q
ARGENTINATotal Agriculture and Agrifood 48.1% 2.3% 19.5% 22.1% 5.5% 2.5% 100.0%
Primary 21.5% 1.0% 35.6% 20.2% 21.3% 0.4% 100.0%Food and Agroindustry 57.4% 2.7% 13.8% 22.8% 0.0% 3.3% 100.0%
Natural Resources 11.4% 5.0% 20.7% 42.0% 20.4% 0.5% 100.0%Rest economy 32.6% 10.2% 22.0% 29.1% 0.0% 6.1% 100.0%Total 37.6% 7.4% 21.1% 26.9% 2.2% 4.8% 100.0%
BRAZILTotal Agriculture and Agrifood 59.7% 1.3% 11.4% 21.9% 3.0% 2.7% 100.0%
Primary 39.1% 0.5% 14.1% 36.6% 9.8% -0.1% 100.0%Food and Agroindustry 68.7% 1.7% 10.2% 15.4% 0.0% 4.0% 100.0%
Natural Resources 48.2% 1.6% 9.3% 21.4% 12.9% 6.6% 100.0%Rest economy 44.3% 10.3% 18.2% 23.8% 0.0% 3.4% 100.0%Total 48.2% 7.9% 16.4% 23.3% 0.9% 3.3% 100.0%
CANADATotal Agriculture and Agrifood 51.8% 4.1% 18.2% 12.9% 1.8% 11.2% 100.0%
Primary 51.2% 1.5% 17.6% 15.4% 7.8% 6.5% 100.0%Food and Agroindustry 51.9% 4.9% 18.4% 12.1% 0.0% 12.6% 100.0%
Natural Resources 40.6% 2.2% 6.0% 18.7% 17.4% 15.2% 100.0%Rest economy 31.8% 9.3% 21.9% 20.6% 0.0% 16.3% 100.0%Total 35.4% 8.2% 20.7% 19.3% 0.9% 15.4% 100.0%
CHILETotal Agriculture and Agrifood 52.2% 1.3% 13.6% 16.9% 5.1% 11.0% 100.0%
Primary 34.0% 0.4% 23.9% 17.2% 16.6% 7.9% 100.0%Food and Agroindustry 60.2% 1.6% 9.0% 16.7% 0.0% 12.4% 100.0%
Natural Resources 36.1% 2.1% 12.6% 31.6% 7.3% 10.4% 100.0%Rest economy 34.6% 7.5% 13.7% 31.9% 0.0% 12.3% 100.0%Total 39.6% 5.5% 13.6% 27.6% 1.7% 11.8% 100.0%
COLOMBIATotal Agriculture and Agrifood 53.5% 1.3% 17.9% 14.5% 6.4% 6.4% 100.0%
Primary 28.4% 0.4% 31.9% 17.0% 19.0% 3.3% 100.0%Food and Agroindustry 66.3% 1.8% 10.7% 13.2% 0.0% 8.0% 100.0%
Natural Resources 29.0% 1.7% 10.2% 29.7% 22.7% 6.7% 100.0%Rest economy 36.3% 11.4% 20.4% 24.0% 0.0% 7.9% 100.0%Total 40.8% 8.2% 19.3% 21.5% 2.6% 7.5% 100.0%
UNITED STATESTotal Agriculture and Agrifood 58.4% 4.7% 14.8% 16.0% 1.9% 4.3% 100.0%
Primary 60.8% 1.0% 13.7% 14.2% 10.8% -0.5% 100.0%Food and Agroindustry 57.9% 5.5% 15.0% 16.4% 0.0% 5.2% 100.0%
Natural Resources 38.6% 5.0% 13.7% 19.8% 20.1% 2.8% 100.0%Rest economy 38.8% 15.4% 20.7% 21.3% 0.0% 3.8% 100.0%Total 40.9% 14.2% 20.0% 20.7% 0.4% 3.9% 100.0%
Continues on next page
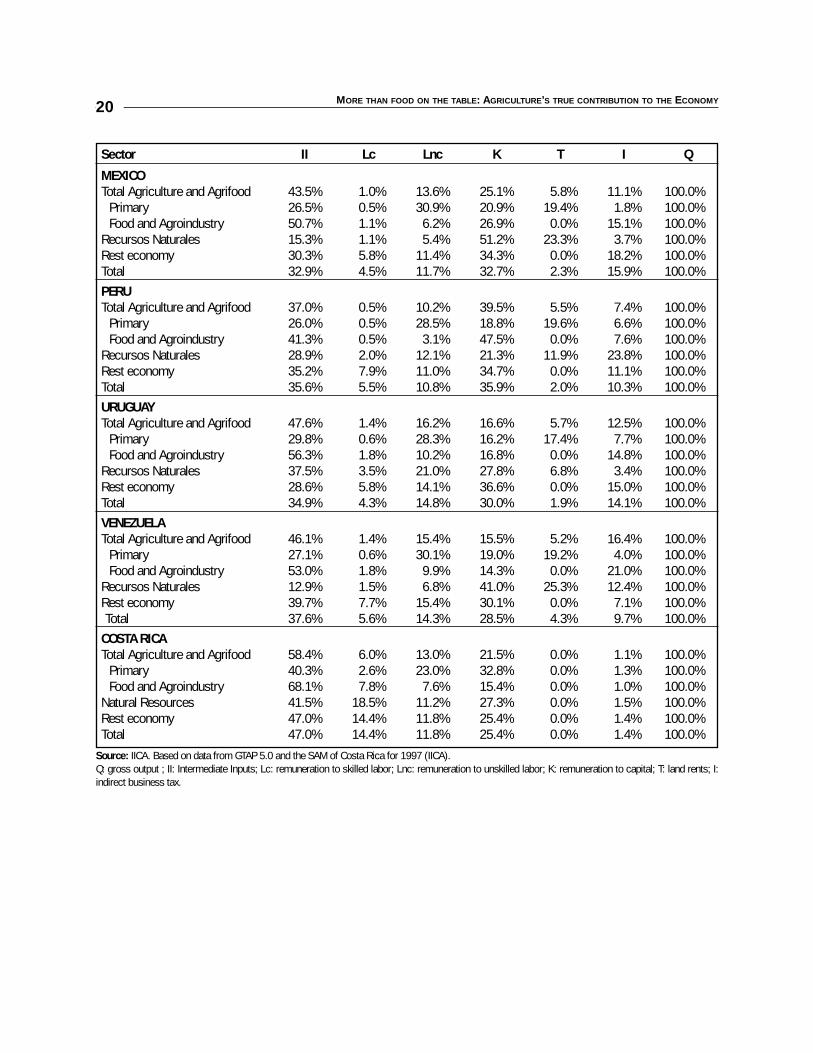
MORE THAN FOOD ON THE TABLE: AGRICULTURE’S TRUE CONTRIBUTION TO THE ECONOMY20
Sector II Lc Lnc K T I Q
MEXICOTotal Agriculture and Agrifood 43.5% 1.0% 13.6% 25.1% 5.8% 11.1% 100.0%
Primary 26.5% 0.5% 30.9% 20.9% 19.4% 1.8% 100.0%Food and Agroindustry 50.7% 1.1% 6.2% 26.9% 0.0% 15.1% 100.0%
Recursos Naturales 15.3% 1.1% 5.4% 51.2% 23.3% 3.7% 100.0%Rest economy 30.3% 5.8% 11.4% 34.3% 0.0% 18.2% 100.0%Total 32.9% 4.5% 11.7% 32.7% 2.3% 15.9% 100.0%
PERUTotal Agriculture and Agrifood 37.0% 0.5% 10.2% 39.5% 5.5% 7.4% 100.0%
Primary 26.0% 0.5% 28.5% 18.8% 19.6% 6.6% 100.0%Food and Agroindustry 41.3% 0.5% 3.1% 47.5% 0.0% 7.6% 100.0%
Recursos Naturales 28.9% 2.0% 12.1% 21.3% 11.9% 23.8% 100.0%Rest economy 35.2% 7.9% 11.0% 34.7% 0.0% 11.1% 100.0%Total 35.6% 5.5% 10.8% 35.9% 2.0% 10.3% 100.0%
URUGUAYTotal Agriculture and Agrifood 47.6% 1.4% 16.2% 16.6% 5.7% 12.5% 100.0%
Primary 29.8% 0.6% 28.3% 16.2% 17.4% 7.7% 100.0%Food and Agroindustry 56.3% 1.8% 10.2% 16.8% 0.0% 14.8% 100.0%
Recursos Naturales 37.5% 3.5% 21.0% 27.8% 6.8% 3.4% 100.0%Rest economy 28.6% 5.8% 14.1% 36.6% 0.0% 15.0% 100.0%Total 34.9% 4.3% 14.8% 30.0% 1.9% 14.1% 100.0%
VENEZUELATotal Agriculture and Agrifood 46.1% 1.4% 15.4% 15.5% 5.2% 16.4% 100.0%
Primary 27.1% 0.6% 30.1% 19.0% 19.2% 4.0% 100.0%Food and Agroindustry 53.0% 1.8% 9.9% 14.3% 0.0% 21.0% 100.0%
Recursos Naturales 12.9% 1.5% 6.8% 41.0% 25.3% 12.4% 100.0%Rest economy 39.7% 7.7% 15.4% 30.1% 0.0% 7.1% 100.0%Total 37.6% 5.6% 14.3% 28.5% 4.3% 9.7% 100.0%
COSTA RICATotal Agriculture and Agrifood 58.4% 6.0% 13.0% 21.5% 0.0% 1.1% 100.0%
Primary 40.3% 2.6% 23.0% 32.8% 0.0% 1.3% 100.0%Food and Agroindustry 68.1% 7.8% 7.6% 15.4% 0.0% 1.0% 100.0%
Natural Resources 41.5% 18.5% 11.2% 27.3% 0.0% 1.5% 100.0%Rest economy 47.0% 14.4% 11.8% 25.4% 0.0% 1.4% 100.0%Total 47.0% 14.4% 11.8% 25.4% 0.0% 1.4% 100.0%
Source: IICA. Based on data from GTAP 5.0 and the SAM of Costa Rica for 1997 (IICA).Q: gross output ; II: Intermediate Inputs; Lc: remuneration to skilled labor; Lnc: remuneration to unskilled labor; K: remuneration to capital; T: land rents; I:indirect business tax.
AGRICULTURE’S TRUE CONTRIBUTION TO THE ECONOMY 21
gross output costs than in the Latin American countries (around 30%). Furthermore, in the USthe levels of compensation paid to skilled labor are higher than in the rest of the countries.
The analysis of agricultural linkages, both through the study of the destination of productionand production costs, highlights the importance of agriculture in these countries as a source ofinputs for other industries, a source of foreign exchange and an important generator of valueadded. It is also argued here that the income generated by agriculture remains in the rural areasand plays an important role in creating sustainable rural livelihoods.
Agriculture’s Multiplier Effects
Agricultural linkages were calculated using the methodology described earlier and accordingto the technical calculations described in Annex A. For all countries, the SAM is divided into sixaccounts23 and the capital, governmental and external sectors were chosen as exogenousaccounts. These exogenous accounts facilitate the simulation of policies and external shocks tothe model: changes in demand for exports, changes in government transfers and infusions offoreign investment, among others. The multiplier model made it possible to explore the impactof various exogenous changes on the economy: for example, on local supply, income, itsdistribution among households, the structure of institutional expenditure and capital flight.
For the purposes of this document, the multipliers are summarized in Annex D, whichincludes the results for the 11 countries.
Multiplier effects on production
Annex D contains tables for each country with the SAM multipliers. The analysis of multipliersshows that each additional unit demanded from the primary sector produces strong impact on othersectors, generating a multiplier effect on the total output of the economy. This effect ranges from3.076 additional units in Canada, to as many as 5.495 in Argentina. If we compare the multipliersfor agriculture with those for other sectors of the economy for the 11 countries, we see that themultipliers for agriculture are similar to those for other sectors. This contradicts the accepted wisdomthat agriculture has fewer effects than other activities, especially the industrial sectors.
It was also estimated that every additional unit produced in the primary agricultural sector,significantly increased production in the food sector (from 0.16 in Canada to 0.73 in Argentina)as well as in the agroindustrial sector (from 0.10 in Canada to 0.56 in Argentina).
23. (1) Activities or Production Account; (2) Commodities Account; (3) Factor Accounts (includes Labor and Capital RemunerationsAccounts); (4) Institutional Account (disaggregated into different socioeconomic groups: households, companies and government);(5) Capital Account; and, (6) Rest of the World Account.
Multiplier effects on the generation of value added and income
The multiplier effect on the generation of value added for all the countries in the study isshown in the tables in Annex D. Every additional unit of primary agricultural productiondemanded also has a very positive effect on factor payments (labor, capital and land): from US$1.421 in Canada, to US$ 3.34 in Argentina. Except for Canada and Brazil, unskilled laborremuneration is higher in the agricultural sector than in other sectors of the economy, rangingfrom US$ 0.58 in Peru up to US $ 1.30 in Argentina.
Every additional dollar of demand for primary agricultural production generates an increasein household incomes, ranging from US$ 1.42 in Canada to US$ 3.34 in Argentina. This statisticis extremely important, given that agriculture generates more household income than otherindustries. In the case of Peru, the multiplier effect of agroindustry is slightly higher than thatof the primary agricultural sector.
Analysis of the multipliers also reveals that every dollar of government funds transferredto household incomes24 generates another US$ 1.50. Of this, 78 cents is in the form of capitalremuneration, 4 cents in land rents and 68 cents in the form of labor remuneration (47 and 21cents for unskilled and skilled labor, respectively). The industries that benefit most fromincreased demand vary from country to country, but those that benefit most from governmenttransfers of income to households are commerce and sales (multiplier of 0.41), real estate andrents (0.17), administrative services provided by the state (0.16) and foods produced from fish,vegetables and fruits (0.15).
Multiplier effects in the case of Costa Rica
In the case of Costa Rica, it was possible to conduct an even more exhaustive analysis. Theavailability of a social accounting matrix with more detailed information about institutions andfactors of production made it possible to define agriculture’s role in rural economic development.For Costa Rica, the agricultural sectors of green coffee, livestock, tobacco, meat and milkproduction, sugar and ripe coffee, produce multipliers of more than 2, which means that a one-dollar increase in demand produces more than one extra dollar in the other industries. Thesemultipliers are only surpassed by the multipliers for construction, services and administrativeservices (see Annex D, Table of SAM Multipliers for Costa Rica).
The coffee, sugar, livestock and milk sectors make high payments to rural labor, whiletobacco makes a higher contribution to urban wages. Specifically, a one-dollar increase inproduction in the green coffee sector generates 20 cents of urban labor, 45 cents of rural labor,4 cents of taxes and 84 cents as capital profits (including land rents).
Similarly, every additional dollar of production of green coffee in Costa Rica (for example,as a result of increased demand for export coffee), generates an increase of US$ 1.18 in family
MORE THAN FOOD ON THE TABLE: AGRICULTURE’S TRUE CONTRIBUTION TO THE ECONOMY22
24. This is shown in “Private” account multipliers in the Tables of Annex D. This is the multiplier for shocks or external injectionsof income to households (private account).

AGRICULTURE’S TRUE CONTRIBUTION TO THE ECONOMY
incomes. This multiplier is the second highest, surpassed only by the multiplier for the servicessector. Other sectors that generate high multipliers for family incomes are ripe coffee, unprocessedtobacco, livestock, bananas and sugar.
Finally, in the case of Costa Rica it was also possible to estimate the effects of a direct transferof funds from the government to households. Every dollar transferred to households wouldgenerate another 99 cents of value added: 22 cents in urban labor remuneration, 16 cents in rurallabor remuneration, 54 cents in capital profits and 3 cents in taxes. The sectors that would benefitmost by increasing their output are: chemicals (0.24), social, community and personal services(0.22), meat and milk production (0.21) and other manufactured products (0.15). Althoughadditional information on capital ownership between rural and urban areas is not available, theforegoing analysis indicates that direct income transfers from the government to households couldseriously affect the distribution of income between rural and urban households, giving higherremuneration to urban territories, higher payments to urban labor, and bringing more benefitsto urban industries and families.
The extensive analysis conducted for Costa Rica underscores the importance of disaggregatedSAMs that clearly specify institutions such as rural and urban households, for example. On thispoint, it is essential to analyze the sectors in a more disaggregated manner, since some linkagesmay be underestimated or the multiplier of a particular sector may be greater. Furthermore, aswe can see in the case of Costa Rica, specific activities, even within the same sector, may affectthe economic balance between regions in very different ways. Thus, the better we understandhow these differences affect the regions, the better the decision-making process will be and thebetter our ability to evaluate the impact of policies.
Policy simulations and analysis
The analysis of multipliers using the SAM system is complemented in the following sectionwith a series of simulations performed to demonstrate the usefulness of this instrument in theanalysis and design of public policy25.
The first simulation is of an aggregate change in agricultural exports and an infusion ofinvestment in all the countries studied, followed by simulations of changes in the specificexports of some key agricultural and agroindustrial sectors.
Impact of a change in the exports of the agricultural aggregate
A first simulation is based on an analysis of the effects generated in the countries by a growthin exports of the extended agricultural sector (including the primary, food and agroindustrysubsectors). Such an increase is considered exogenous, i.e. due to a hypothetical increase in demand
23
25. For a detailed explanation of the methodology used to carry out the simulations, refer to Annex A in the Model of multipliersand simulations.

for products on the part of the leading importers or by any other factor that produces a 10% growthin exports of agriculture and agrifood.
Table 6 shows that this impact generates an initial boost to the economy, ranging from $95million in Venezuela to nearly $11,600 million in the United States. This amount variesaccording to structure and value of each country’s exports. If we consider the effect that thisshock will have on the economy, taking into account the fact that the agricultural sector has strongproduction chains and is very closely linked to the rest of the economy, we find the total impacton the economy ranges from 0.23% growth for Venezuela to 2.72% for Uruguay. In other words,the total impact of the initial shock, which is traditionally used to measure the effects on theagricultural sector, is multiplied by 2.6 times for Canada and by up to 5.7 times for Argentina.
The simulation also makes it possible to predict the effects on the generation of householdor family income. In this case, the increase ranges from 0.20% in Venezuela to 2.52% in Uruguay,a pattern very similar to that for the overall effect on the economy. One obvious result, whichis also consistent with what we have discussed so far, is that the factor of production that benefitsmost in all the countries is land, showing increases of more than 4% in the case of Uruguay andCanada.
MORE THAN FOOD ON THE TABLE: AGRICULTURE’S TRUE CONTRIBUTION TO THE ECONOMY24
TABLE 6Effect of a 10% increase in agriculture and agrifood exports by country,
as a percentage of growth by itemArgentina Brazil Canada Chile Colombia USA Mexico Peru Uruguay Venezuela
Initial injection into 1,480 1,978 5,332 655 522 11,585 1,833 278 229 95the economy* 0.27% 0.13% 0.48% 0.48% 0.31% 0.08% 0.27% 0.26% 0.74% 0.06%
Total effecton the economy 1.55% 0.71% 1.26% 0.02 1.19% 0.34% 0.86% 0.94% 2.72% 0.23%
Total effect/Initial injection 5.7 5.4 2.6 3.4 3.9 4.2 3.2 3.7 3.7 3.7
Effect onhousehold income 1.51% 0.67% 1.13% 1.48% 1.17% 0.31% 0.83% 0.95% 2.52% 0.20%
Factor paymentsLand 2.99% 1.54% 4.60% 3.61% 3.09% 2.13% 1.86% 1.92% 4.06% 0.57%Unskilled Labor 1.55% 0.64% 1.22% 1.65% 1.26% 0.32% 0.93% 0.93% 2.76% 0.24%Skilled labor 1.22% 0.52% 1.00% 1.13% 0.86% 0.27% 0.60% 0.57% 2.18% 0.18%Capital 1.46% 0.71% 1.07% 1.37% 1.07% 0.32% 0.79% 0.97% 2.36% 0.19%Natural Resources 1.07% 0.76% 1.11% 2.19% 0.65% 0.34% 0.45% 1.09% 3.70% 0.08%
Note: * Datum in US$ million and as growth rate.Source: IICA with data from the Annexes.
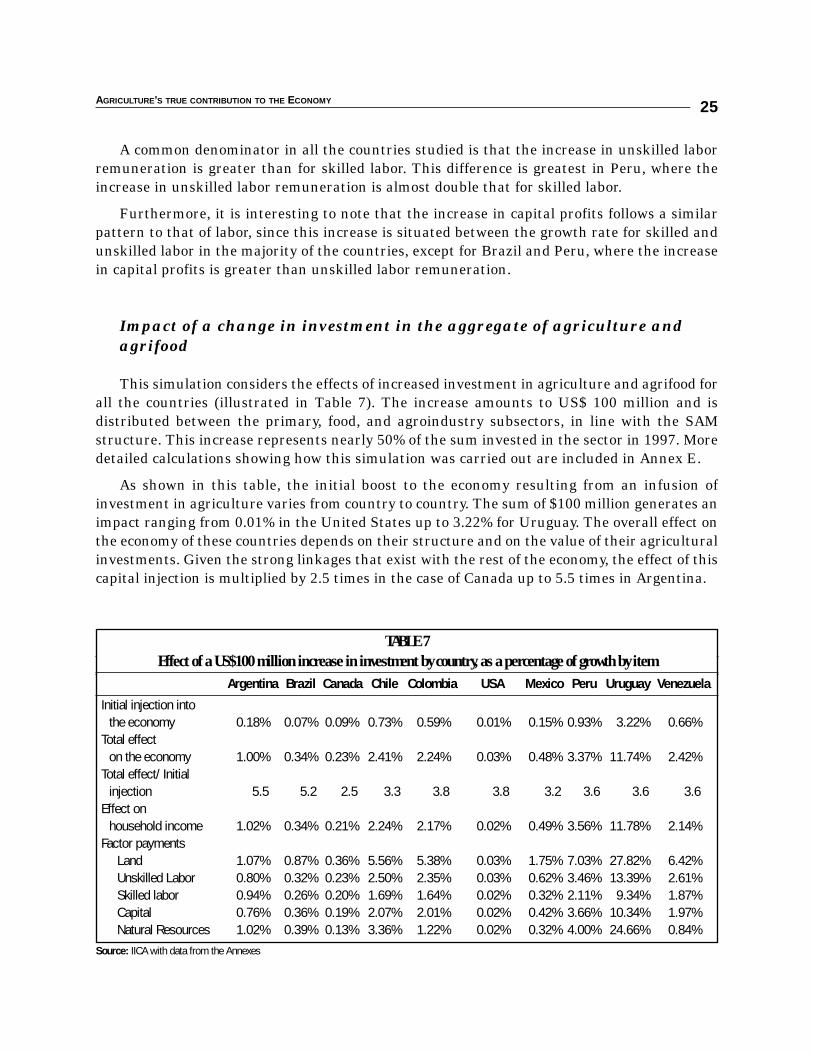
A common denominator in all the countries studied is that the increase in unskilled laborremuneration is greater than for skilled labor. This difference is greatest in Peru, where theincrease in unskilled labor remuneration is almost double that for skilled labor.
Furthermore, it is interesting to note that the increase in capital profits follows a similarpattern to that of labor, since this increase is situated between the growth rate for skilled andunskilled labor in the majority of the countries, except for Brazil and Peru, where the increasein capital profits is greater than unskilled labor remuneration.
Impact of a change in investment in the aggregate of agriculture andagrifood
This simulation considers the effects of increased investment in agriculture and agrifood forall the countries (illustrated in Table 7). The increase amounts to US$ 100 million and isdistributed between the primary, food, and agroindustry subsectors, in line with the SAMstructure. This increase represents nearly 50% of the sum invested in the sector in 1997. Moredetailed calculations showing how this simulation was carried out are included in Annex E.
As shown in this table, the initial boost to the economy resulting from an infusion ofinvestment in agriculture varies from country to country. The sum of $100 million generates animpact ranging from 0.01% in the United States up to 3.22% for Uruguay. The overall effect onthe economy of these countries depends on their structure and on the value of their agriculturalinvestments. Given the strong linkages that exist with the rest of the economy, the effect of thiscapital injection is multiplied by 2.5 times in the case of Canada up to 5.5 times in Argentina.
AGRICULTURE’S TRUE CONTRIBUTION TO THE ECONOMY 25
Source: IICA with data from the Annexes
TABLE 7Effect of a US$100 million increase in investment by country, as a percentage of growth by item
Argentina Brazil Canada Chile Colombia USA Mexico Peru Uruguay Venezuela
Initial injection intothe economy 0.18% 0.07% 0.09% 0.73% 0.59% 0.01% 0.15% 0.93% 3.22% 0.66%
Total effecton the economy 1.00% 0.34% 0.23% 2.41% 2.24% 0.03% 0.48% 3.37% 11.74% 2.42%
Total effect/ Initialinjection 5.5 5.2 2.5 3.3 3.8 3.8 3.2 3.6 3.6 3.6
Effect onhousehold income 1.02% 0.34% 0.21% 2.24% 2.17% 0.02% 0.49% 3.56% 11.78% 2.14%
Factor paymentsLand 1.07% 0.87% 0.36% 5.56% 5.38% 0.03% 1.75% 7.03% 27.82% 6.42%Unskilled Labor 0.80% 0.32% 0.23% 2.50% 2.35% 0.03% 0.62% 3.46% 13.39% 2.61%Skilled labor 0.94% 0.26% 0.20% 1.69% 1.64% 0.02% 0.32% 2.11% 9.34% 1.87%Capital 0.76% 0.36% 0.19% 2.07% 2.01% 0.02% 0.42% 3.66% 10.34% 1.97%Natural Resources 1.02% 0.39% 0.13% 3.36% 1.22% 0.02% 0.32% 4.00% 24.66% 0.84%
MORE THAN FOOD ON THE TABLE: AGRICULTURE’S TRUE CONTRIBUTION TO THE ECONOMY26
With regard to the generation of household incomes, the pattern is virtually the same as theoverall effect on the economy, ranging from nearly 0.03% in the United States to around 11.8%for Uruguay.
An analysis of the effects on factors of production remuneration reveals that the biggestincrease in all the countries is for land, with very significant percentages in the case of Uruguaywhere land rents increase by almost 30%.
Similarly, the results of the simulation reveal a greater increase in payments made tounskilled labor vis à vis skilled labor, except in the case of Argentina. It is interesting to notethat in Argentina, Chile, Peru, and Uruguay there is a major impact on natural resourceremunerations, with very significant percentages that are almost as high as land rents, rangingfrom 3% in Argentina to 25% in Uruguay.
Simulations in Key Agricultural Sectors
In order to identify and analyze key agricultural sectors in the economies of the Americas,an initial comparison was made of the percentage of the gross output of each economy representedby a particular sector, selecting the sectors with high percentages. These sectors were then analyzedby simulating exogenous impacts to the SAM multipliers model. Thus, dozens of simulations wereperformed on the most important sectors. This chapter describes the simulations with themost significant effects, particularly on incomes, helping to pinpoint key agricultural sectors.
Increase in coffee exports
A 10% increase in external demand for coffee from Brazil, Colombia, Peru, and Costa Ricahas a very different impact on each country. This impact generates an initial boost to theeconomy ranging, in absolute terms, from $41 million in case of Costa Rica and Peru tonearly $275 for Brazil; in percentage terms, it varies from 0.02% for Brazil to 0.19% for CostaRica. It is also evident that this sector has greatest importance for Costa Rica and Colombia,see Table 8.
The overall effect on growth of the economy goes from 0.05% for Peru to 0.60% for CostaRica. With respect to the initial injection, we can see that this impact is multiplied by 1.4 timesin Peru and by 4 times in Colombia. At the same time, income generation increases by nearly0.10% in Brazil and Peru, and by around 0.6% for Costa Rica and Colombia. The growth in factorof production remunerations would also be much higher for these last two countries.
In the case of Costa Rica, an initial infusion of nearly $42 million generates $63 million inprivate income, which is distributed as follows: $35 million in capital profits, $19 million in rurallabor remuneration and $9 million to urban labor (see Annex F). Table 8 shows that paymentsto rural labor increase by 0.75%, almost three times the increase shown by urban laborremunerations (0,28%) and higher than the increase in capital profits (0.63%).
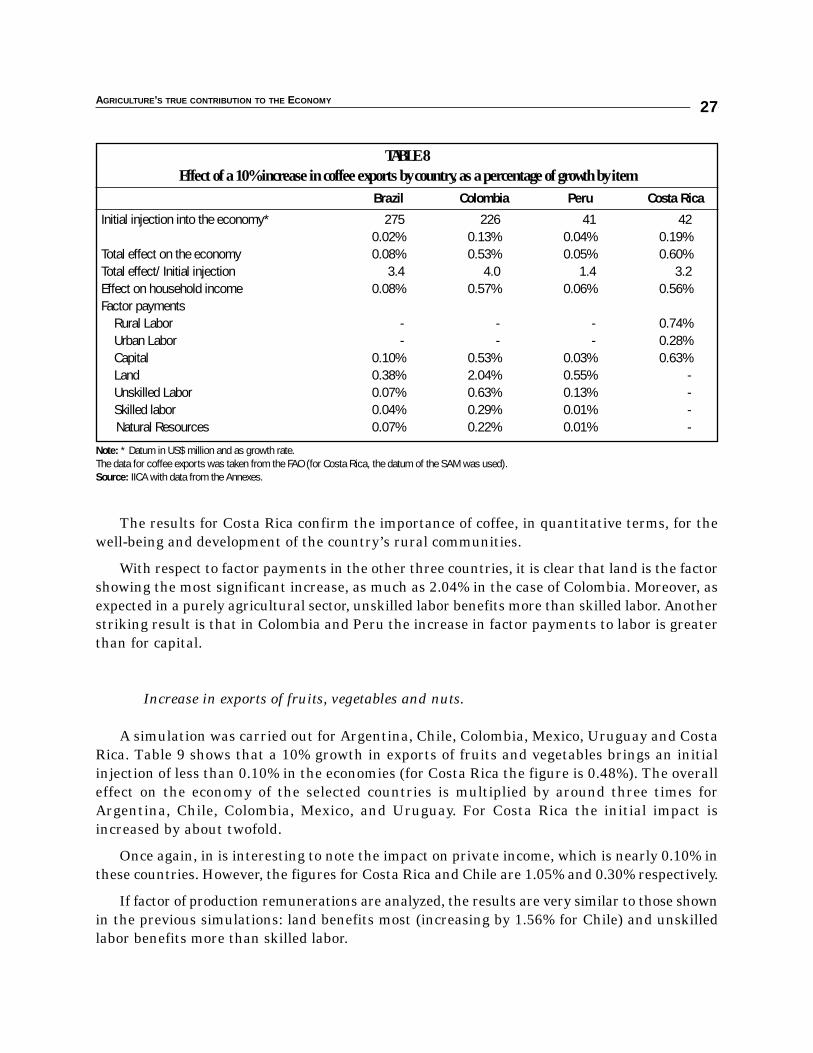
AGRICULTURE’S TRUE CONTRIBUTION TO THE ECONOMY 27
The results for Costa Rica confirm the importance of coffee, in quantitative terms, for thewell-being and development of the country’s rural communities.
With respect to factor payments in the other three countries, it is clear that land is the factorshowing the most significant increase, as much as 2.04% in the case of Colombia. Moreover, asexpected in a purely agricultural sector, unskilled labor benefits more than skilled labor. Anotherstriking result is that in Colombia and Peru the increase in factor payments to labor is greaterthan for capital.
Increase in exports of fruits, vegetables and nuts.
A simulation was carried out for Argentina, Chile, Colombia, Mexico, Uruguay and CostaRica. Table 9 shows that a 10% growth in exports of fruits and vegetables brings an initialinjection of less than 0.10% in the economies (for Costa Rica the figure is 0.48%). The overalleffect on the economy of the selected countries is multiplied by around three times forArgentina, Chile, Colombia, Mexico, and Uruguay. For Costa Rica the initial impact isincreased by about twofold.
Once again, in is interesting to note the impact on private income, which is nearly 0.10% inthese countries. However, the figures for Costa Rica and Chile are 1.05% and 0.30% respectively.
If factor of production remunerations are analyzed, the results are very similar to those shownin the previous simulations: land benefits most (increasing by 1.56% for Chile) and unskilledlabor benefits more than skilled labor.
TABLE 8Effect of a 10% increase in coffee exports by country, as a percentage of growth by item
Brazil Colombia Peru Costa Rica
Initial injection into the economy* 275 226 41 420.02% 0.13% 0.04% 0.19%
Total effect on the economy 0.08% 0.53% 0.05% 0.60%Total effect/ Initial injection 3.4 4.0 1.4 3.2Effect on household income 0.08% 0.57% 0.06% 0.56%Factor payments
Rural Labor - - - 0.74%Urban Labor - - - 0.28%Capital 0.10% 0.53% 0.03% 0.63%Land 0.38% 2.04% 0.55% -Unskilled Labor 0.07% 0.63% 0.13% -Skilled labor 0.04% 0.29% 0.01% -Natural Resources 0.07% 0.22% 0.01% -
Note: * Datum in US$ million and as growth rate.The data for coffee exports was taken from the FAO (for Costa Rica, the datum of the SAM was used).Source: IICA with data from the Annexes.
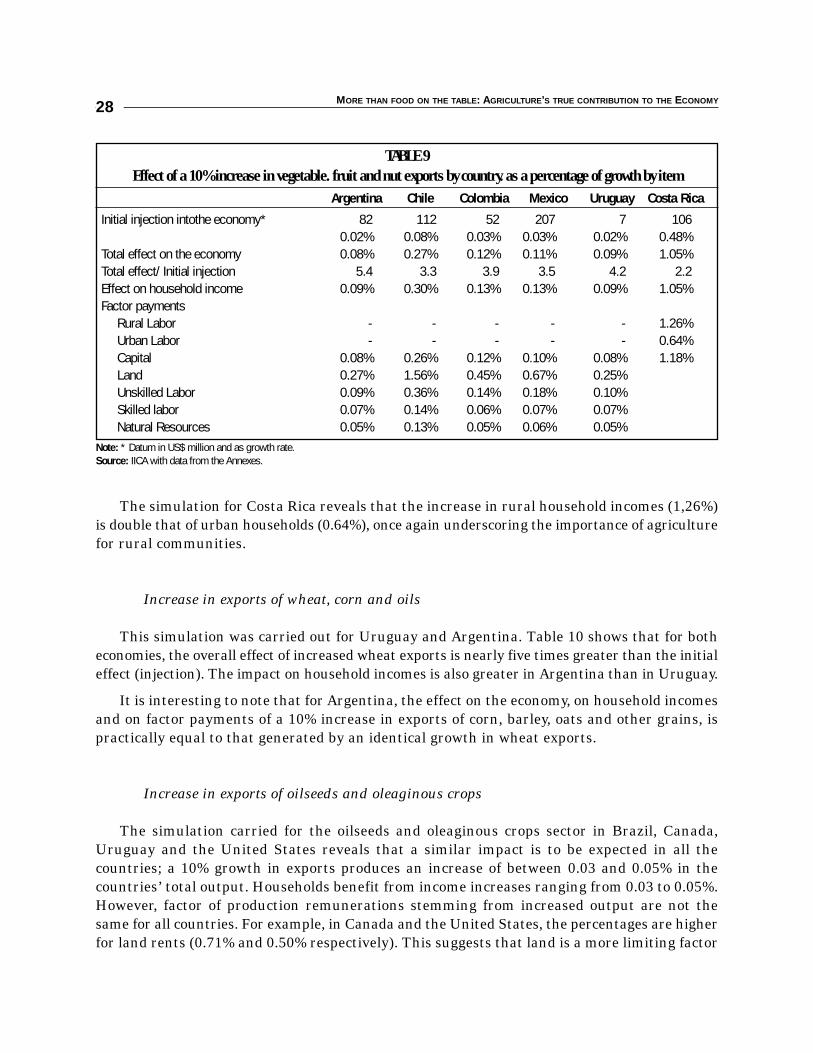
MORE THAN FOOD ON THE TABLE: AGRICULTURE’S TRUE CONTRIBUTION TO THE ECONOMY28
The simulation for Costa Rica reveals that the increase in rural household incomes (1,26%)is double that of urban households (0.64%), once again underscoring the importance of agriculturefor rural communities.
Increase in exports of wheat, corn and oils
This simulation was carried out for Uruguay and Argentina. Table 10 shows that for botheconomies, the overall effect of increased wheat exports is nearly five times greater than the initialeffect (injection). The impact on household incomes is also greater in Argentina than in Uruguay.
It is interesting to note that for Argentina, the effect on the economy, on household incomesand on factor payments of a 10% increase in exports of corn, barley, oats and other grains, ispractically equal to that generated by an identical growth in wheat exports.
Increase in exports of oilseeds and oleaginous crops
The simulation carried for the oilseeds and oleaginous crops sector in Brazil, Canada,Uruguay and the United States reveals that a similar impact is to be expected in all thecountries; a 10% growth in exports produces an increase of between 0.03 and 0.05% in thecountries’ total output. Households benefit from income increases ranging from 0.03 to 0.05%.However, factor of production remunerations stemming from increased output are not thesame for all countries. For example, in Canada and the United States, the percentages are higherfor land rents (0.71% and 0.50% respectively). This suggests that land is a more limiting factor
TABLE 9Effect of a 10% increase in vegetable. fruit and nut exports by country. as a percentage of growth by item
Argentina Chile Colombia Mexico Uruguay Costa Rica
Initial injection intothe economy* 82 112 52 207 7 1060.02% 0.08% 0.03% 0.03% 0.02% 0.48%
Total effect on the economy 0.08% 0.27% 0.12% 0.11% 0.09% 1.05%Total effect/ Initial injection 5.4 3.3 3.9 3.5 4.2 2.2Effect on household income 0.09% 0.30% 0.13% 0.13% 0.09% 1.05%Factor payments
Rural Labor - - - - - 1.26%Urban Labor - - - - - 0.64%Capital 0.08% 0.26% 0.12% 0.10% 0.08% 1.18%Land 0.27% 1.56% 0.45% 0.67% 0.25%Unskilled Labor 0.09% 0.36% 0.14% 0.18% 0.10%Skilled labor 0.07% 0.14% 0.06% 0.07% 0.07%Natural Resources 0.05% 0.13% 0.05% 0.06% 0.05%
Note: * Datum in US$ million and as growth rate.Source: IICA with data from the Annexes.
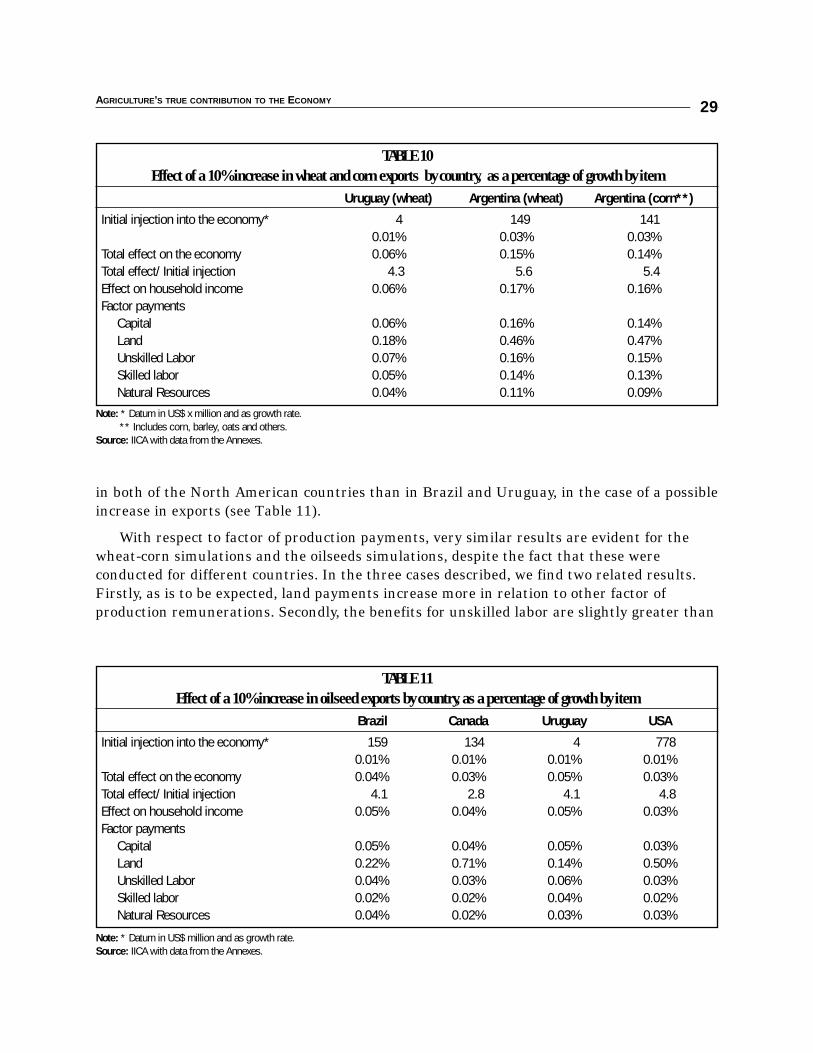
AGRICULTURE’S TRUE CONTRIBUTION TO THE ECONOMY 29
in both of the North American countries than in Brazil and Uruguay, in the case of a possibleincrease in exports (see Table 11).
With respect to factor of production payments, very similar results are evident for thewheat-corn simulations and the oilseeds simulations, despite the fact that these wereconducted for different countries. In the three cases described, we find two related results.Firstly, as is to be expected, land payments increase more in relation to other factor ofproduction remunerations. Secondly, the benefits for unskilled labor are slightly greater than
TABLE 10Effect of a 10% increase in wheat and corn exports by country, as a percentage of growth by item
Uruguay (wheat) Argentina (wheat) Argentina (corn**)
Initial injection into the economy* 4 149 1410.01% 0.03% 0.03%
Total effect on the economy 0.06% 0.15% 0.14%Total effect/ Initial injection 4.3 5.6 5.4Effect on household income 0.06% 0.17% 0.16%Factor payments
Capital 0.06% 0.16% 0.14%Land 0.18% 0.46% 0.47%Unskilled Labor 0.07% 0.16% 0.15%Skilled labor 0.05% 0.14% 0.13%Natural Resources 0.04% 0.11% 0.09%
Note: * Datum in US$ x million and as growth rate.** Includes corn, barley, oats and others.
Source: IICA with data from the Annexes.
TABLE 11Effect of a 10% increase in oilseed exports by country, as a percentage of growth by item
Brazil Canada Uruguay USA
Initial injection into the economy* 159 134 4 7780.01% 0.01% 0.01% 0.01%
Total effect on the economy 0.04% 0.03% 0.05% 0.03%Total effect/ Initial injection 4.1 2.8 4.1 4.8Effect on household income 0.05% 0.04% 0.05% 0.03%Factor payments
Capital 0.05% 0.04% 0.05% 0.03%Land 0.22% 0.71% 0.14% 0.50%Unskilled Labor 0.04% 0.03% 0.06% 0.03%Skilled labor 0.02% 0.02% 0.04% 0.02%Natural Resources 0.04% 0.02% 0.03% 0.03%
Note: * Datum in US$ million and as growth rate.Source: IICA with data from the Annexes.

MORE THAN FOOD ON THE TABLE: AGRICULTURE’S TRUE CONTRIBUTION TO THE ECONOMY30
for skilled labor, though in all three cases the difference between skilled and unskilled laboris not as marked as in the cases of coffee and fruits and vegetables.
Simulations in Key Agroindustrial Sectors
In order to identify and analyze key agroindustrial sectors in the economies of the Americas,the same procedure was followed with the agroindustrial sectors. This section describes thesimulations with the most significant effects.
Increase in exports of textiles and clothing manufactures
Four countries were analyzed in the light of a hypothetical 10% increase in external demandfor textiles and clothing: Colombia, Mexico, Uruguay, and Costa Rica. This growth in exportsgenerates an overall effect in the economies of Colombia, Mexico and Uruguay that is three timesthe initial injection. For example, an initial injection of 0.19% in the Uruguayan economy (resultingfrom a 10% growth in textiles and clothing exports) increases domestic output by 0.31%. In caseof Costa Rica, an initial injection of 0.26% increases national output by 0.37%. (See Table 12).
The impact of increased textile and clothing exports on household incomes ranges from a0.14% growth in Colombia to 0.67% in Uruguay. As expected, the pattern is very similar to theoverall effect on the economy.
Meanwhile, the impact on factor of production payments for Colombia, Mexico, and Uruguayvaries for each country. In Colombia, on the one hand, the greatest increase is seen in unskilled
TABLE 12Effect of a 10% increase in exports of manufactures of textiles and wearing apparel by country,
as a percentage of growth by itemColombia Mexico Uruguay Costa Rica
Initial injection into the economy* 75 746 59 570.04% 0.11% 0.19% 0.26%
Total effect on the economy 0.17% 0.34% 0.69% 0.46%Total effect/ Initial injection 3.9 3.0 3.7 1.8Effect on household income 0.14% 0.31% 0.67% 0.37%Factor paymentsRural Labor - - - 0.44%Urban Labor - - - 0.39%
Capital 0.15% 0.33% 0.69% 0.33%Land 0.12% 0.29% 0.78% -Unskilled Labor 0.16% 0.30% 0.64% -Skilled labor 0.10% 0.21% 0.57% -Natural Resources 0.06% 0.18% 0.39% -
Note: * Datum in US$ million and as growth rate.Source: IICA with data from the Annexes.
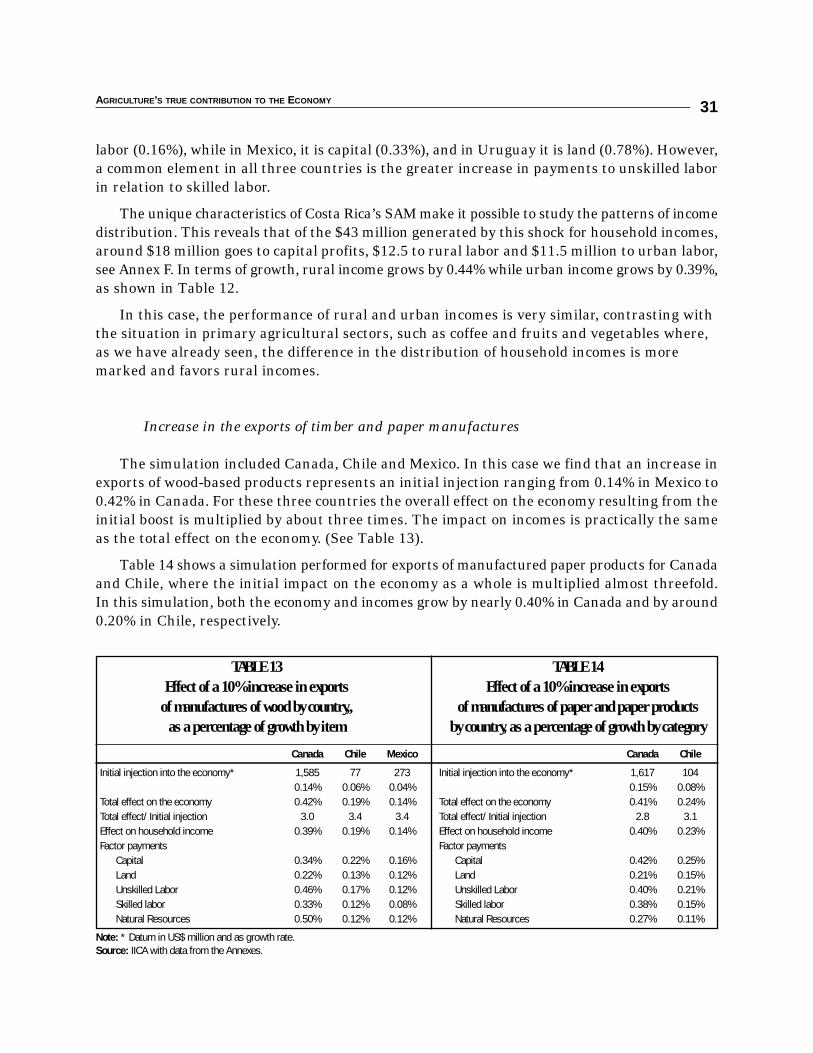
AGRICULTURE’S TRUE CONTRIBUTION TO THE ECONOMY
labor (0.16%), while in Mexico, it is capital (0.33%), and in Uruguay it is land (0.78%). However,a common element in all three countries is the greater increase in payments to unskilled laborin relation to skilled labor.
The unique characteristics of Costa Rica’s SAM make it possible to study the patterns of incomedistribution. This reveals that of the $43 million generated by this shock for household incomes,around $18 million goes to capital profits, $12.5 to rural labor and $11.5 million to urban labor,see Annex F. In terms of growth, rural income grows by 0.44% while urban income grows by 0.39%,as shown in Table 12.
In this case, the performance of rural and urban incomes is very similar, contrasting withthe situation in primary agricultural sectors, such as coffee and fruits and vegetables where,as we have already seen, the difference in the distribution of household incomes is moremarked and favors rural incomes.
Increase in the exports of timber and paper manufactures
The simulation included Canada, Chile and Mexico. In this case we find that an increase inexports of wood-based products represents an initial injection ranging from 0.14% in Mexico to0.42% in Canada. For these three countries the overall effect on the economy resulting from theinitial boost is multiplied by about three times. The impact on incomes is practically the sameas the total effect on the economy. (See Table 13).
Table 14 shows a simulation performed for exports of manufactured paper products for Canadaand Chile, where the initial impact on the economy as a whole is multiplied almost threefold.In this simulation, both the economy and incomes grow by nearly 0.40% in Canada and by around0.20% in Chile, respectively.
31
TABLE 13 TABLE 14Effect of a 10% increase in exports Effect of a 10% increase in exports
of manufactures of wood by country,, of manufactures of paper and paper productsas a percentage of growth by item by country, as a percentage of growth by category
Canada Chile Mexico Canada Chile
Initial injection into the economy* 1,585 77 273 Initial injection into the economy* 1,617 1040.14% 0.06% 0.04% 0.15% 0.08%
Total effect on the economy 0.42% 0.19% 0.14% Total effect on the economy 0.41% 0.24%Total effect/ Initial injection 3.0 3.4 3.4 Total effect/ Initial injection 2.8 3.1Effect on household income 0.39% 0.19% 0.14% Effect on household income 0.40% 0.23%Factor payments Factor payments
Capital 0.34% 0.22% 0.16% Capital 0.42% 0.25%Land 0.22% 0.13% 0.12% Land 0.21% 0.15%Unskilled Labor 0.46% 0.17% 0.12% Unskilled Labor 0.40% 0.21%Skilled labor 0.33% 0.12% 0.08% Skilled labor 0.38% 0.15%Natural Resources 0.50% 0.12% 0.12% Natural Resources 0.27% 0.11%
Note: * Datum in US$ million and as growth rate.Source: IICA with data from the Annexes.
With regard to factor payments, in the case of wood and paper products it is interesting tonote that unskilled labor benefits more than skilled labor. This is the same result obtained inall the cases analyzed in this document.
At the same time, the results of the simulation conducted with manufactured paper productsshow that payments to capital is the factor of production with the greatest increase, whereasin the case of the wood (Canada is the exception), the increase is greatest for natural resources.
The results obtained on hypothetical changes, both in the general sectors and in keyagricultural and agroindustrial sectors, show that in order to improve the well-being ofcommunities it is essential to provide incentives, investment and support for the agriculturalsector of the economies of the Americas.
MORE THAN FOOD ON THE TABLE: AGRICULTURE’S TRUE CONTRIBUTION TO THE ECONOMY32
The study has clearly demonstrated the importance of the value added of the agriculturalproduction chain to the domestic economies of all the countries in the Americas, thus
correcting the traditional skewed view of agriculture’s contribution and its potential foreconomic development. The study validated the methodology in 11 countries and highlightedthe role of agriculture as a supplier of inputs, a generator of value added and foreign exchangeearnings, and an important factor in the redistribution of income.
When analyzing agriculture’s true contribution to our countries’ economic development, theanalytical framework of SAM multipliers makes it possible to factor in considerations relatedto the generation and use of income, since it provides policymakers with indicators of theeffects on labor, capital, land, and household incomes. This information is important whennegotiating development strategies, since it makes it possible to identify sectors that not onlyhave a significant multiplier effect on production, but that can also have important effects onthe distribution of the income and the value added generated.
The application of these methods to measure agriculture’s true contribution to the economygives us a better understanding of its importance to development. This, in turn, makes itpossible to improve decisions regarding investments and policy-making for agriculture, so thatthey contribute more effectively to development and poverty reduction.
4. CONCLUSIONS

Adamson, M; Montiel, N; Alarcón, J; Vargas, H; Solano, A; Sandoval, F. 1999. Matrices decontabilidad social: nota metodológica y una propuesta para Costa Rica. San José, CostaRica, IICE-Universidad de Costa Rica.
Alarcón, J.V. et al. 1990. The social accounting framework for development, concepts, constructionand applications. EUA, Aldershot Avebury.
Aristy-Escuder, J. 1999. Dominican Republic: a CGE analysis. North American Journal ofEconomics and Finance no. 10:207-233.
Arnault, C. 2002. Designing the financial social accounting matrix underlying the integratedmacroeconomic model for poverty analysis: the Cameroon country-case. Washington DC,World Bank.
Astori, D. 1990. Enfoque crítico de los modelos de contabilidad social. 9 ed.. España, EditorialSiglo XXI.
Casaburi, G. G. 1999. Dynamic agroindustrial clusters: the political economy competitive sectorsin Argentina and Chile. New York, Editorial St. Martin's Press.
CEPAL. 2001. Revalorar la agricultura y el desarrollo rural para la sustentabilidad. México.
Claus, I. 2002. Inter industry linkages in New Zealand. New Zealand Treasury. Working paperno. 02/09.
Gereffi, G.; Korzeniewicz, M. comps. 1994. Commodity chains and global capitalism. Westport,Connecticut, Praeger Publishers.
Defourny, J.; Thorbecke, E. 1994. Structural path analysis and multiplier decomposition withina social accounting matrix framework. Economic Journal 94(373):111-136.
Dimaranan, B.; McDougall, R. 2002 Data base summary: input - output multipliers. In Globaltrade, assistance, and production: the GTAP 5. Purdue, Purdue University.
BIBLIOGRAPHY

Dirección Nacional de Programación Económica y Regional 1999. Argentina: informe sectorialsobre leche y productos lácteos. In Apertura económica y (des) encadenamientos productivos.Santiago, Chile, CEPAL. p. 315-346.
Dirven, M. 2001. Conceptos sobre encadenamientos y clusters en el territorio. Santiago, Chile,CEPAL. (Mimeografiado)
Dirven, M. 2002. Los encadenamientos de la agricultura chilena: un acercamiento a unamedición. Santiago, Chile, CEPAL. (Mimeografiado)
Dubcovsky, G. 1999. Nicaragua: structural adjustment policy analysis in the nineties. NorthAmerican Journal of Economics and Finance no. 10:169-205.
Echeverri, R y Pilar, M. 2002. Nueva ruralidad: visión del territorio en América Latina y el Caribe.San José, Costa Rica, IICA.
FAO. 1995. El desarrollo agrícola en el nuevo marco macroeconómico de América Latina.Santiago, Chile.
Ferri, J.; Uriel, E. 2000. Multiplicadores contables y análisis estructural en la matriz decontabilidad social: una aplicación al caso español. Investigaciones Económicas 24:419-453.
Golan, A.; Vogel, S. 2000. Estimation of non-stationary social accounting matrix coefficients withsupply - side information. Economic System Research 12(4): 447-471.
Haggblade, S.; Hazell, P.; Brown, J. 1989. Farm-nonfarm linkages in rural Sub-Saharan Africa.World Development 17:1173-1201.
Hayami, Y.; Ruttan, V.W. 1985. Agricultural development: an international perspective. Baltimoreand London, Johns Hopkins University Press.
Holland, D.; Wyeth, P. 1993. SAM multipliers: their decomposition, interpretation and relationshipto input-output multipliers. Washington State University. College of Agriculture andHome Economics Research Center. Research Bulletin XB1027.
Holst, R. 1990. Interindustry analysis with social accounting methods. Economic SystemsResearch 2: 125-145.
IICA. 2004. Matriz de contabilidad social de 1997 para Costa Rica. San José, Costa Rica.
Kehoe, T. 1996. Social accounting matrices and applied general equilibrium models. FederalReserve Bank of Minneapolis. Working Paper no. 563.
MORE THAN FOOD ON THE TABLE: AGRICULTURE’S TRUE CONTRIBUTION TO THE ECONOMY36
Key, N.; Sadoulet, E.; Janvry, A. de. 2000. Transaction costs and agricultural household supplyresponse. American Journal of Agricultural Economics 82(2):245-259.
Koo, W.; Lou, J. 1997. The relationship between the agricultural and industrial sectors inChinese economic development. North Dakota State University. Department of AgriculturalEconomics. Agricultural Economics Report no. 368.
Maki, W. 1980. Regional input-output and social accounting systems for agricultural and ruraldevelopment planning. University of Minnesota. Department of Agricultural and AppliedEconomics. Staff Papers Series P80-21.
Maki, W.; Ingar, K. 1992. Analyzing a rural region's future with a social accounting system.University of Minnesota. Department of Agricultural and Applied Economics. Staff PapersSeries P92-22.
Navas, F.; Toro, G. 1991. Relaciones intersectoriales en la agricultura guatemalteca. In Laagricultura de Guatemala, relaciones macro e intersectoriales y promoción de exportaciones.Guatemala, IICA.
Pyatt, G.; Thorbecke, E. 1976. Planning techniques for a better future. Geneva, InternationalLabor Office.
Pyatt, G.; Roe, A. 1977. A SAM approach to modeling. Journal of Policy Modeling no.10:301-337.
Pyatt, G.; Round, J. 1979. Accounting and fixed price multipliers in a social accounting matrixframework. Economic Journal 89(356):850-873.
Pyatt, G.; Round, J. 1985. Social accounting: a basis for planning. Washington DC, WorldBank/Oxford University Press.
Pyatt, G. 1991. Fundamentals of social accounting. Economic Systems Research 3(3): 315-341.
Ramos, H.; Pérez, G. 1999. Revalorización del sector agropecuario en El Salvador. El Salvador,Ministerio de Agricultura. (Política Agrícola, vol. 7)
Sadoulet, E.; Janvry, A. de. 1995. Input-output tables, social accounting matrices, and multipliers.In Quantitative development policy analysis. EEUU, John Hopkins University Press.
Sayan, S.; Nazmi, D. 1997. Measuring the degree of block interdependence between agriculturaland non-agricultural sectors in Turkey. Applied Economics Letter no.5:329-332.
Schiff, M.; Valdés, A. 1998. Agriculture and the macroeconomic. Washington DC, World Bank.(Handbook of Agricultural Economics)
BIBLIOGRAPHY 37

Subramanian, S.; Sadoulet, E. 1990 The transmission of production fluctuations and technicalchange in a village economy: a social accounting matrix approach. Economic Developmentand Cultural Change 39(1):131-174.
Tarancón, M.A. 1997. Sector transporte y crecimiento regional en Andalucía: aplicación del métodode los 'límites tolerables'. Documento de trabajo Seminario de Economía Cuantitativa,Universidad de Castilla-La Mancha.
Taylor, E.; Yúnez, A. 1998. Vinculaciones entre las actividades agropecuarias y no agropecuariasde pequeños productores rurales de México. In Simposio Latinoamericano de Investigacióny Extensión en Sistemas Agropecuarios (3., 1998, Lima, Perú)
Thiel, R.; Piáoslo, D. 2002. Constructing a social accounting matrix with a distributional focus:the case of Bolivia. Kiel Working Paper no. 1094.
Vaillant, M. 1999. El complejo productivo lácteo en Uruguay. In Apertura económica y(des)encadenamientos productivos. Santiago, Chile, CEPAL. p. 263-314.
Vogel, S. 1994. Structural changes in agriculture: production linkages and agriculture demand-led industrialization. Oxford Economic Papers 46(1): 136-156.
Winters, P.; Janvry, A. de; Sadoulet, E.; Stamoulis, K. 1997. The role of agriculture in development:visible and invisible surplus transfers Uruguay. University of California at Berkeley.Department of Agricultural and Resource Economics. Working Paper no. 814.
MORE THAN FOOD ON THE TABLE: AGRICULTURE’S TRUE CONTRIBUTION TO THE ECONOMY38
PRODUCTION
Gross Domestic Product (GDP) is the market value of the final goods and services producedin a country during a given period of time. The Primary Sector or Agricultural GDP is definedas the production of agriculture, forestry, and fisheries. Agriculture and agrifood Ag GDPincludes the primary, food and agroindustrial subsectors.
Disposable National Income measures the country’s disposable income for final consumptionand net savings. Value added is understood as the value of payments made to the factors ofproduction, generated by a productive process. Full-Employment Output measures theoutput of the economy when unemployment is at its natural or normal rate.
DEMAND
Gross output is the total sum of value of goods and services produced in a country during agiven period of time: including inputs and final goods and services. The concept of gross outputis sometimes confused with Gross Domestic Product (GDP). The difference between both is thatto estimate the GDP is the value of inputs used in the production is subtracted from gross output.
Intermediate Demand consists of the value of the production of goods and services of agiven sector that is demanded as input by other sectors of the economy. Investment is definedas expenditure on equipment and infrastructure that is used repeatedly or continuously to producegoods and services, as well as the stock of business inventories.
Private Consumption or final consumption by households consists of consumer goods or servicesacquired by individual households, either by purchasing them or through social securitytransfers received in kind. Government Consumption is the value of spending on consumergoods or services by government departments or institutions. Imports of goods and services consistof purchases, exchanges (barter), gifts or donations of goods and services by residents from non-residents. Exports of goods and services consist of sales, exchanges, gifts or donations of goodsand services by residents to non-residents.
Consumption of Intermediate Inputs is the value of goods and services consumed as inputby a production process, i.e. it includes the goods and/or services that are transformed or areconsumed in the productive process. Indirect business taxes are obtained by subtracting the
GLOSSARY
subsidies granted by the government from the total of the taxes that the government receivesfrom production.26
SOCIAL ACCOUNTING MATRIXES
An Input-output Matrix (IOM) basically describes the existing structural interdependencebetween the various sectors or industries, and for this reason it mainly considers the total ofreal intermediate transactions in the economy.
A Social Accounting Matrix (SAM) is a database that consistently represents, in matrix format,all flows of goods, services and income between all agents of the economy within a period ofreference. A SAM presents the structural characteristics of the economy in an explicit and detailedmanner.
Walrasian Equilibrium is a balance in which supply is equal to demand for each and everyone of the markets in the economy. A Computable General Equilibrium (CGE) Model basedon the SAM presupposes a General or Walrasian Equilibrium. The CGE models use non-linearprogramming to solve a system of behavioral equations and to find a vector of equilibrium prices.This model could dynamically simulate the effects of policies on the economic system.
Endogenous Variables are variations that are determined only by the relationships within themodel, while Exogenous Variables are those that vary due to external changes of the model.Comparative Static is the study of how economic variables respond to changes in theenvironment. The idea is to compare the current situation with the one that would be createdwhen all possible adjustments have been made, i.e. comparing one situation of equilibrium withanother.
LINKAGES AND MULTIPLIERS
In relation to backward linkages, the analysis is based on the premise that in order toproduce more in a given sector, it is necessary to purchase inputs from other sectors, This is knownas direct input requirements. But in order to supply these inputs, the different sectors of theeconomy must also use inputs from other activities, and so the process is repeated, creating along chain of what are termed indirect input requirements. The aim is to calculate the total ofinput requirements, both direct and indirect. This process also generates changes in factor ofproduction payments, in national income and in its distribution.
Forward linkages occur when the output of a given sector is or may be utilized as input byseveral or many of the other sectors of the economy. As capacity increases in a sector with strongforward linkages, the supply of inputs for other sectors will increase. Or, viewed from anotherperspective, these linkages indicate to the extent to which demand in other sectors of the
MORE THAN FOOD ON THE TABLE: AGRICULTURE’S TRUE CONTRIBUTION TO THE ECONOMY40
26. The importance of the use of this accounting framework was discussed by Pyatt (1991).

GLOSARY 41
economy sectors should be expanded in order to absorb an additional unit produced in a givensector, for example, agriculture.
Multipliers are a series of measures that describe the relationships inherent to the SAMbased on technical calculations. Thus, we have the multiplier for demand (backward linkages),and the multiplier for a uniform expansion of supply (forward linkages).
OTHERS TECHNICAL DEFINITIONS
A Function of Production is defined as the relationship between the quantity of factors usedto produce a product, and the amount of that product that is produced. Relative Price is definedas the price of a product compared with other prices of the economy. Marginal Propensity toConsume is the proportion of additional income spent by an economic agent (households)instead of saving. Average Propensity to Consume is the average percentage of consumptionby an economic agent instead of saving. Elasticity of Substitution measures the extent to whicha variation in the level of supply and demand for a product responds to a variation in its price.Income Elasticity measures the extent to which the level of demand for a product respondsto variations in the income of consumers.

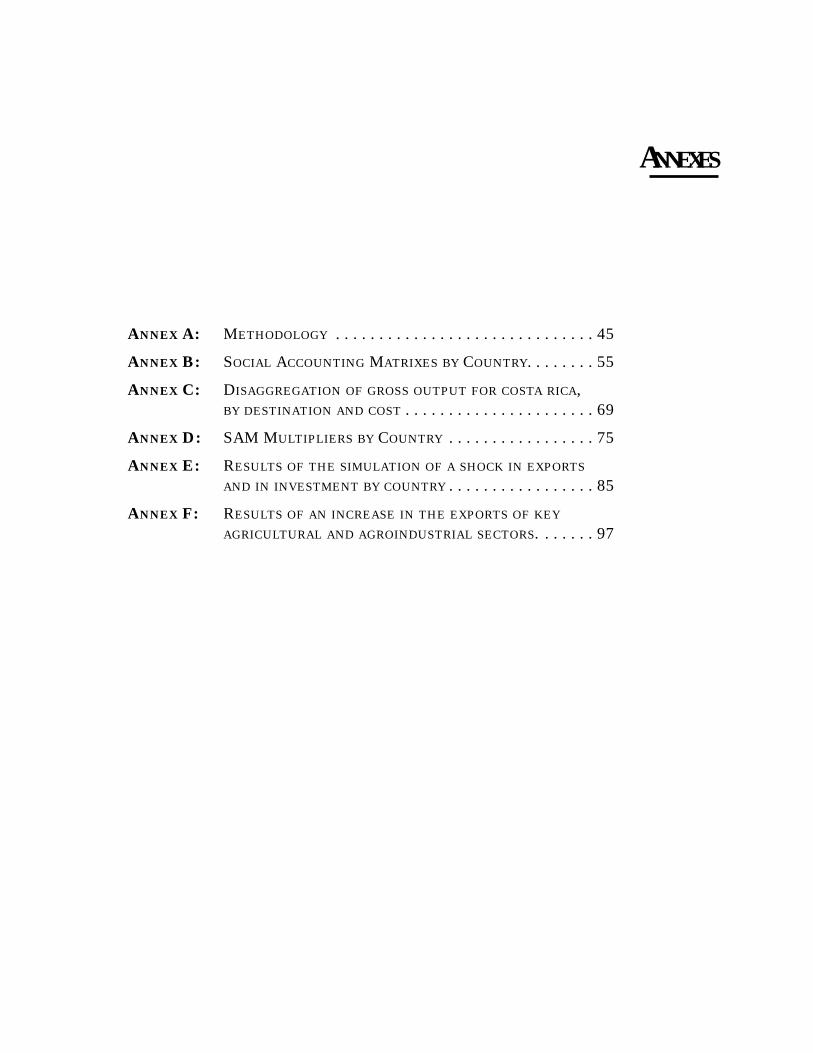
ANNEX A: METHODOLOGY . . . . . . . . . . . . . . . . . . . . . . . . . . . . . . 45
ANNEX B: SOCIAL ACCOUNTING MATRIXES BY COUNTRY. . . . . . . . 55
ANNEX C: DISAGGREGATION OF GROSS OUTPUT FOR COSTA RICA,BY DESTINATION AND COST . . . . . . . . . . . . . . . . . . . . . . 69
ANNEX D: SAM MULTIPLIERS BY COUNTRY . . . . . . . . . . . . . . . . . 75
ANNEX E: RESULTS OF THE SIMULATION OF A SHOCK IN EXPORTS
AND IN INVESTMENT BY COUNTRY . . . . . . . . . . . . . . . . . 85
ANNEX F: RESULTS OF AN INCREASE IN THE EXPORTS OF KEY
AGRICULTURAL AND AGROINDUSTRIAL SECTORS. . . . . . . 97
ANNEXES

ANNEX AMethodology
METHODOLOGY
Social Accounting Matrix
A Social Accounting Matrix (SAM) is a database that represents, consistently and in amatrix format, all the flows of goods, services, and income among all the agents in an economyduring a given reference period (Ferri and Uriel, 2000). As an analytical tool, SAMs havebecome the best instrument available for studying the characteristics of economic developmentprocesses, and key aspects and questions related to them (Alarcon, in Adamson et al., 1999).
These matrixes were developed in the mid-1970s to provide an information system that couldbe used to analyze employment opportunities and income distribution (Pyatt and Thorbecke,1976). Initially, they were constructed to evaluate economic policies in developing countries (Pyattand Round, 1985) but they are now also used in developed countries, as an instrument foranalyzing fiscal, trade and other policies.27 They are an extension of the input-output modeldeveloped by Wassily Leontief in the 1930s, which includes, besides the structure of production,data on income distribution and the demand from institutions.
The first distinctive feature of a SAM is the definition of an exhaustive and mutuallyexclusive set of socioeconomic groups linked to the productive sphere (in respect of both incomeand expenditure). The main reason why a SAM is used in this study is that it emphasizes real,intermediate economic relationships. The system of national accounts, on the other hand,describes the end results of the economy. Thus, the growth of different branches of activitygenerates income for the different households according to the production factors they possess.The resources of these households spend on consumption also create demand for goods from thedifferent production sectors of the economy. Of course, the database also considers the incomeand expenditure of other institutional sectors (the government, firms, and the rest of the
27. To present economic transactions in a matrix format, three conditions must be met: 1) all the matrix’s rows and columns aredefined symmetrically, with each account, defined by a row and a column of the matrix, used to record the transactions of agiven agent; 2) each transaction is entered in a single cell of the matrix, using the accounting concept of double entry and showingthat the expenditure of one agent is the income of another; and, 3) for each of the accounts in the matrix, the sum of each row(income) is the same as the sum of each column (expenditure).
world). Therefore, it complements the primary income of households with the differentredistributive mechanisms that exist in the economy. In other words, a SAM is used to explainthe structural interdependence among the sectors of a given economy, emphasizing therelationships established among the agents of production, and the relationships between theseagents and the users of the finished products (Astori, 1990).
Thus, a SAM provides information about the entire economic structure of an economy. It canbe used to ascertain a country’ gross domestic product or value added, as well as the contributionthat each economy activity and factor of production makes to the value added. It is also possibleto obtain information about per capita income, income distribution among households, and thesource of income (be it local or external); the economy’s dependence on other countries; the weightof national and international remittances in the population’s income; and other matters of interest.In other words, a SAM is not a set of isolated data, but a comprehensive and integratedanalytical system (Adamson et al., 1999). SAMs have not only been used to describe thesestructural relationships, however; they can also be used to plan their future evolution.
Schematically speaking, a SAM is a squared matrix28 in which each sector or account has itsown row and column. Expenditures are listed in the columns and income in the rows. As eachaccount must balance, the totals for the row and the column are the same.
The way in which production sectors are disaggregated within a SAM will depend, firstly,on the objectives sought, and, secondly, on the quantity and quality of the available informationthat exists.This second point is the biggest limiting factor in analyses carried out using suchinstruments.
Another advantage of this instrument is that, through extensions, information can beincorporated about the use of natural resources and pollution processes, as well as socialindicators, by means of a module of basic needs and another of social indicators (Adamson et al.,1999).
In short, the main reasons why SAMs are very interesting to use are (Alarcon, in Adamsonet al., 1999):
1. Their comprehensiveness: they reflect the total circular flow of the entire economy.2. Their consistency: they obey the Walrasian rule of general equilibrium; for all accounts,
the total for the rows is identical to the total for the columns.3. Their transparency: they make it possible to objectively establish the socioeconomic
structural relationships of the economy studied.4. Their flexibility: they can be used to develop Computable General Equilibrium Models
(CGE)28 or to extend them, including demographic data or social and environmentalindicators, or both. Thus, relevant additional modules can be introduced.
MORE THAN FOOD ON THE TABLE: AGRICULTURE’S TRUE CONTRIBUTION TO THE ECONOMY48
28. These can be used to simulate the integral effects of different policies (e.g., economic, social and environmental policies). Theyare based on a series of equations that characterize the performance of the economic sectors described in the accounts of a SAM,where the expected performance of these sectors, the restrictions of the system and the conditions needed for equilibrium shouldbe spelt out.
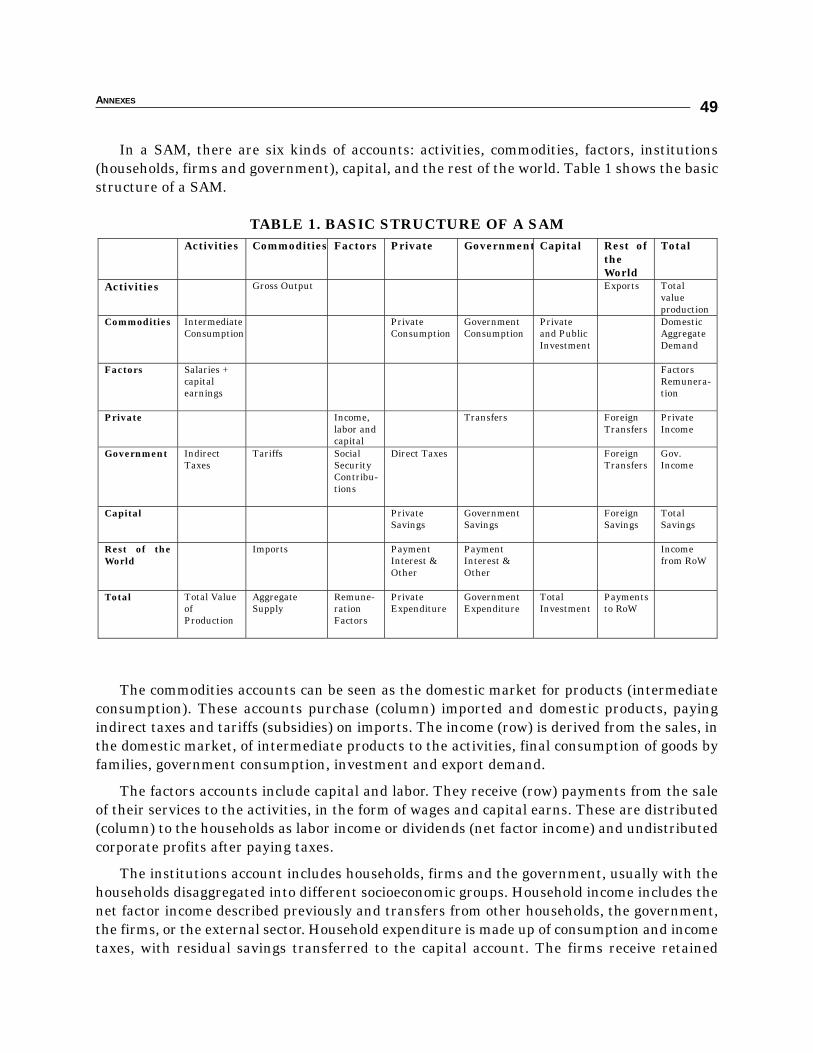
ANNEXES
In a SAM, there are six kinds of accounts: activities, commodities, factors, institutions(households, firms and government), capital, and the rest of the world. Table 1 shows the basicstructure of a SAM.
TABLE 1. BASIC STRUCTURE OF A SAM
The commodities accounts can be seen as the domestic market for products (intermediateconsumption). These accounts purchase (column) imported and domestic products, payingindirect taxes and tariffs (subsidies) on imports. The income (row) is derived from the sales, inthe domestic market, of intermediate products to the activities, final consumption of goods byfamilies, government consumption, investment and export demand.
The factors accounts include capital and labor. They receive (row) payments from the saleof their services to the activities, in the form of wages and capital earns. These are distributed(column) to the households as labor income or dividends (net factor income) and undistributedcorporate profits after paying taxes.
The institutions account includes households, firms and the government, usually with thehouseholds disaggregated into different socioeconomic groups. Household income includes thenet factor income described previously and transfers from other households, the government,the firms, or the external sector. Household expenditure is made up of consumption and incometaxes, with residual savings transferred to the capital account. The firms receive retained
49
Activities Commodities
Factors Private Government Capital Rest of
the World
Total
Activities Gross Output Exports
Total value production
Commodities
Intermediate Consumption
Private Consumption
Government Consumption
Private and Public Investment
Domestic Aggregate Demand
Factors Salaries + capital earnings
Factors Remunera-tion
Private Income, labor and capital
Transfers
Foreign Transfers
Private Income
Government Indirect Taxes
Tariffs
Social Security Contribu-tions
Direct Taxes
Foreign Transfers
Gov. Income
Capital Private Savings
Government Savings
Foreign Savings
Total Savings
Rest of the World
Imports
Payment Interest & Other
Payment Interest & Other
Income from RoW
Total Total Value of Production
Aggregate Supply
Remune-ration Factors
Private Expenditure
Government Expenditure
Total Investment
Payments to RoW
earnings and dividends gained abroad, spend on taxes and transfers, and the residual saving isincluded in the capital account. The government account makes outlays to purchase products,in addition to the transfers to different institutions, and what is left (savings/deficits) is enteredin the capital account. On the income side, the government receives the different taxes andtransfers from the external sector (net borrowing).
The capital account is identified independently, and contains the savings of institutions andthe external sector. This provides the financing for capital formation and changes in theinventory (investment).
The last account is used to record the transactions that take place between the domesticeconomy and the rest of the world. The economy receives income from the external sector aspayment for exports, and pays for imports. Likewise, a net payment is received from abroad forsome factors, and the debt is serviced.
Relationships and characteristics inherent in a SAM
It is possible to distinguish between two types of measures in the relationships andcharacteristics inherent in a SAM. On the one hand, there are those based on the directcalculation of ratios, which include the “technical coefficients of production” (Leontief coefficients),meaning the ratios between the purchases that sector j makes from sector i, and the totalproduction of j. Another series of measures on the subject are the linkages of demand (supply),meaning the percentage of purchases (sales) of each activity to the rest of the economy with regardto the total intermediate purchases (sales) of the economy; and the Chenry and Watanabecoefficients, which measure the strength of forward and backward linkages among the branchesof activity, calculated as the proportion of a sector’s purchases and intermediate sales with respectto the sector’s total purchases and sales.
There is also a series of descriptive measures of the relationships inherent in the SAM calledmultipliers which are extensions to the Input-Output multipliers methodology. In Input-outputmodels, there are two types of multipliers: backward and forward multipliers. Backwardmultipliers are computed using the Leontief Inverse Matrix (LIM) that uses an input-outputcoefficients matrix. Meanwhile; forward multipliers are computed using a LIM that uses asupply coefficients matrix29. SAM multipliers extent the calculation of the backward multipliersto include value added and income distribution in what is referred to as the matrix of SAMcoefficients (Adelman and Robinson, 1986). The inverse of this matrix of SAM coefficientsyields the multipliers of an external injection for sector j-th under the column j-th. This vectorof multiplier present the own multiplier in the j-th raw which measure the additional demandgenerated on the j-th sector. The other multipliers of the vector measures the capacity of thedifferent sectors for transmitting throughout the production structure a unit increase in the finaldemand of activity j;
MORE THAN FOOD ON THE TABLE: AGRICULTURE’S TRUE CONTRIBUTION TO THE ECONOMY50
29. A matrix of supply coefficients is obtained by dividing the row of intermediate inputs supply by the total supply of a sector and;the input-output coefficient matrix is obtained by dividing the row of intermediate inputs by the total of each column.
ANNEXES
The first type of measures described help to obtain an approximation of the importance of eachactivity in the economic system as a whole, since they measure simply the direct contribution ofthe given industry to the total production of each sector, and of the economy. The second type ofmeasures calculate the importance of each production activity in the economy, considering not onlytheir direct contribution to production, but also their indirect contribution (which results from beingthe “supplier” of “suppliers” of other production activities), included in the LIM coefficients.
SAMs are also a complete database that can be used to develop different models, which inturn make it possible to conduct analyses of the impact of changes in policy and variables thatare regarded as exogenous (international prices, foreign investment, exports). Build uponmathematical formulations, a SAM-based model shows the flows that exist among all thecomponents of an economy, as well as those that occur between it and its environment (i.e. withits surroundings). These models, then, should reproduce the original data of the SAM accordingto the functional relationships that it contains (calibration of the model). Once the calibrationhas been carried out, it will be possible to use the model to simulate the effects that differentpolicy scenarios would have on the economic structure of the country in question (e.g., a tradenegotiation package). In practice, such effects are evaluated by comparing the initial data (theoriginal SAM or the data of the model that reproduce it) with the results of the simulation exerciseperformed using the model.
Multiplier and simulation model
The valuable statistical data that SAMs provide, and the accounting relationships derivedfrom them, make it possible to study in greater depth, without the need for complicatedmodeling, the consequences that a variation in any of the accounts have on production, the useof factors, and the distribution of income, in a way analogous to the input-output analysis creditedto Leontief.
Models of this kind are known as linear multiplier models. The methodology used to breakdown the multipliers is based on the guidelines provided by Pyatt and Round (1979), Defournyand Thorbecke (1994), Sadoulet and Janvry (1995), Ferri and Uriel (2000), Adamson et al. (1999),and others.
Estimates of such models are useful for exploring the impact that various changes in exogenousvariables have on an economy, e.g., on the local supply, income, income distribution amonghouseholds, investment, the structure of the expenditure of institutions and capital outflows.
Linear multiplier models are based on the following assumptions: idle production capacity,fixed prices, linear production functions and fixed proportion (means that the elasticities ofsubstitution are nil, and production factors are perfect complements), average and marginal andpropensities to consume are equal, income elasticities are unitary).
The first step in constructing multiplier models is to divide the SAM accounts into two groups:
1. Endogenous. These accounts usually include the factors of production, households andfirms, and production activities.
51
2. Exogenous. These accounts contain the government, capital, and the rest of the world.They are used to enter the data for the change that we wish to model and analyze.
The selection of the accounts that make up each group is crucial, since it determines the typeof experiments with economic policies that can be formulated.
Once the accounts have been grouped together, the next step is to standardize the SAM, bydividing the amount in each cell by the corresponding column total. The resulting matrixcontains the average propensity to expenditure of all the accounts (technical coefficients),represented by the letter S.
The elements of the S matrix are in the form:
where mij are the elements of the SAM and n is the number of rows in the SAM.All the payments from exogenous to endogenous accounts are recorded in matrix X. This isconstructed by eliminating the columns of the endogenous accounts and the rows of theexogenous accounts from the SAM. X is known as the matrix of exogenous injections.
The result of the elimination of the rows and columns of the exogenous accounts of S is thematrix of endogenous propensities A.
Matrix K is comprised of sub-matrixes Aij. The accounts of matrix A are in subgroups: theaccounts of activities are located in the first row; the accounts of production factors in the second;and household accounts in the third.30 Thus, elements i and j of sub-matrix A represent the averagepropensity to consume of the endogenous accounts of subgroup i with respect to those ofsubgroup k, and the Aij record the average propensity to consume of the endogenous accountsof the i-th subgroup with respect to itself.
The SAM multiplier matrix is represented as M, and, just like the Leontief input-outputmultipliers, is the result of the matrix operation:
M = (I -A)-1
where M is a squared matrix that contains the total effects of the exogenous changes on theendogenous accounts.
The result of the multiplying matrix M by the vector of exogenous injections yields vectory. This vector contains the total income of the endogenous accounts:
y = M X = (I - A)-1 X
MORE THAN FOOD ON THE TABLE: AGRICULTURE’S TRUE CONTRIBUTION TO THE ECONOMY52
∑=
= n
iij
ijij
m
ms
1
30. This depends on the characteristics of the SAM utilized.
ANNEXES
When a change is introduced into the transfers of the exogenous accounts to the endogenousones, matrix X is modified, which in turn also affects the income of the endogenous accounts(represented by vector y). The total impact caused by an exogenous change in the endogenousaccounts is obtained by resolving the operation:
ym = M Xm ,
where ym is the modified vector of the total income of the endogenous accounts and xm is themodified vector of exogenous injections.
This operation not only records the total effect of the exogenous change on production, butalso makes it possible to evaluate the total impact on the structure of income and expenditureof all the institutions in the economy.
M is known as the ex-post multiplier matrix. It contains the information that records all themultiplier effects of any exogenous induction introduced into the system. In other words, itindicates to what extent an exogenous injection into the system affects the total income of theendogenous accounts. This multiplier can be analyzed in more detail by disaggregating it.
The total impacts contained in M can be disaggregated into three types of effects, by meansof a multiplicative process.31 This breakdown shows the iterative process and the relationshipsof the circular flow of the economy - that is, the flow between the distribution of income(factorial and personal) and production, resulting from an exogenous injection of expenditureinto the system (Alarcon, in Adamson et al., 1999). The disaggregated effects are threefold:
i) Intra-group effect. Only reflects the change in the accounts that belong to the groupin which the modification was originally made.
ii) Extra-group or crossed effect. Shows the impact of the accounts of groups other thanthe one where the exogenous change occurred.
iii) Inter-group or circular effect. Records the variation in the group that presented theinitial change, after having passed through and affected the other groups of accounts.
For example, if exports of a given product increase, a derive demand for inputs of other industriesused in the production process of the original product is generated. This reaction is the intra-groupeffect. It also leads to a greater use of the factors of production, increasing the income of theinstitutions that own the factors concerned. These movements are the extra-group effect, since theinitial change alters the accounts of the groups, except for the one that initially underwent the change.Finally, a higher level of household income modifies the households’ original consumption pattern,affecting the production sectors. This is the inter-group effect, since the accounts where the exogenouschange occurred react to the adjustments to the new situation of all the other groups of accounts.
As seen, the SAM presents the structural characteristics of the economy in an explicit anddetailed way. It is a static instrument, however. To overcome this limitation and dynamicallysimulate the effects of policies on the economic system, CGE models are developed afterwards.
53
31. Proposed by Pyatt and Roe in 1977. There is also an additive disaggregation, which can be studied in Stone (1981) or Adamsonet al. (1999).
EXCEL can be used for multiplier models and simulation exercises, to estimate the impactof exogenous changes, although the GAMS (General Algebraic Modeling System) software issuggested as an alternative, because it is more expeditious for formulating simulations andobtaining results.
As stated earlier, the accounting principles used in SAMs make them very flexible. Elements thatthe researcher is interested in can be incorporated, such as natural resources and their valuation.
The simulations for analyzing impact can also be based on the knowledge of the influencesexternal to the economy studied. An example of this is the analysis of impact of a change in theflow of remittances on the economy of the households. If the use to which households put theremittances is known, alternative forms of investment can be proposed, so that the economy andthe households obtain a greater benefit from such external flows.
Limitations of Multiplier Models
The multisectoral models based on SAMs are superior to input-output models, to partialequilibrium models, and to another type of model based on systems of expenditures. This isbecause, since a SAM is used to construct them, they include all the components of an economyand its interrelationships, and they are general, not partial, equilibrium models. Unlike input-output models (that do not take into consideration the aspects of income distribution) and modelsbased on expenditure systems (that do not include production), multiplier models incorporatethem into a single model.
Nevertheless, SAM-based models are linear; they have limitations because of the assumptionsmade in them concerning prices, resources, and technology, as well as the propensities toconsume of the institutions. The first two assumptions are related, since SAM-based models canbe interpreted as fixed-price models - that is, that the multipliers calculated assume thatexogenous changes do not affect prices. This assumption is equivalent to proposing that theeconomy is not using its resources to the full, nor has technological restrictions. Alternatively,by assuming fixed coefficients in the supply and using fixed average propensities to consume,relative prices are irrelevant in this type of model. The existence of fixed proportions means thatno substitution is possible among inputs, factors, goods, and services. On the supply side, thismeans that even when relative prices change, the input mix will not change for producing moreof the product in question in response to an increase in demand.
The assumption that resources are fully utilized can be avoided, however, by introducingrestrictions in the supply of some of the activities of the economy.
The third and final limitation of SAM-based multiplier models is the assumption that theaverage propensities to consume of the households are unitary. This limitation can be avoidedif marginal (rather than average) shares are incorporated into the component of the share toexpenditure of the SAM, before calculating M.
Nonetheless, multiplier models continue to be fixed-price. One alternative, which considersrelative prices and the effect of changes in them on the decisions of the economic agents, arecomputable general equilibrium models (CGE), which also use SAMs as their database
MORE THAN FOOD ON THE TABLE: AGRICULTURE’S TRUE CONTRIBUTION TO THE ECONOMY54

ANNEX BSocial Accounting Matrixes by Country
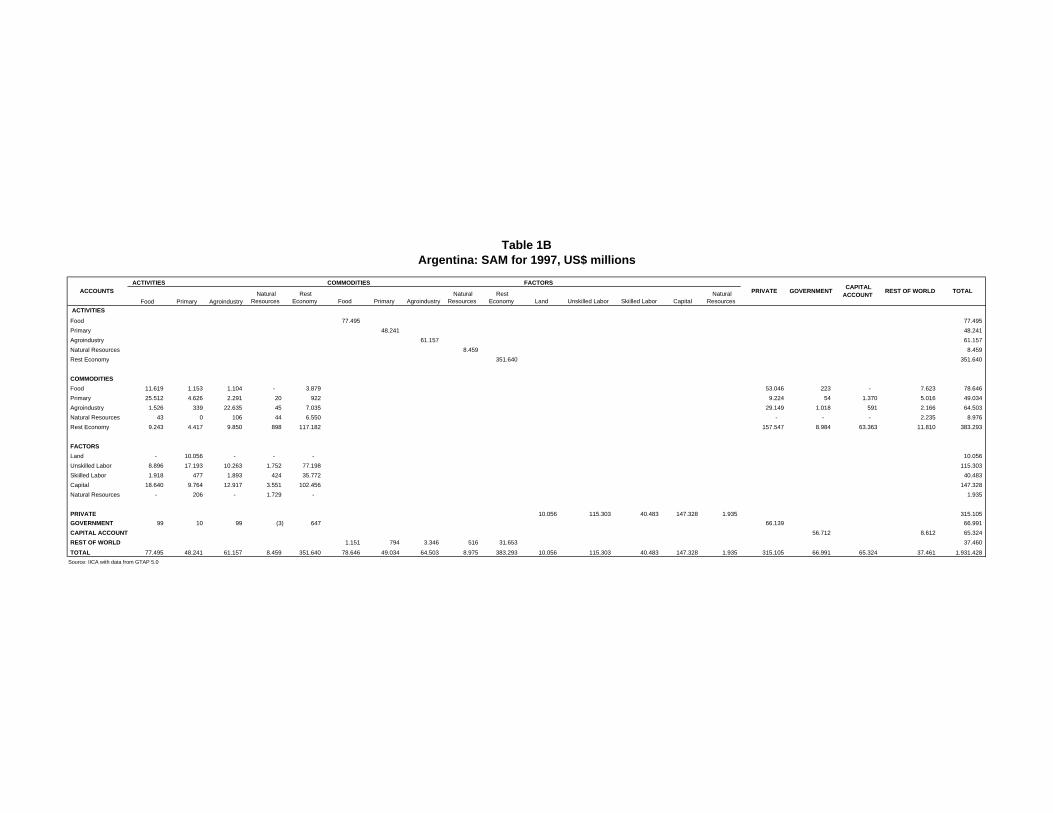
Food Primary Agroindustry Natural
Resources Rest
Economy Food Primary Agroindustry Natural
Resources Rest
Economy Land Unskilled Labor Skiilled Labor Capital Natural
Resources ACTIVITIES
Food 77.495 77.495 Primary 48.241 48.241 Agroindustry 61.157 61.157 Natural Resources 8.459 8.459 Rest Economy 351.640 351.640
COMMODITIESFood 11.619 1.153 1.104 - 3.879 53.046 223 - 7.623 78.646 Primary 25.512 4.626 2.291 20 922 9.224 54 1.370 5.016 49.034 Agroindustry 1.526 339 22.635 45 7.035 29.149 1.018 591 2.166 64.503 Natural Resources 43 0 106 44 6.550 - - - 2.235 8.976 Rest Economy 9.243 4.417 9.850 898 117.182 157.547 8.984 63.363 11.810 383.293
FACTORSLand - 10.056 - - - 10.056 Unskilled Labor 8.896 17.193 10.263 1.752 77.198 115.303 Skiilled Labor 1.918 477 1.893 424 35.772 40.483 Capital 18.640 9.764 12.917 3.551 102.456 147.328 Natural Resources - 206 - 1.729 - 1.935
PRIVATE 10.056 115.303 40.483 147.328 1.935 315.105 GOVERNMENT 99 10 99 (3) 647 66.139 66.991 CAPITAL ACCOUNT 56.712 8.612 65.324 REST OF WORLD 1.151 794 3.346 516 31.653 37.460
TOTAL 77.495 48.241 61.157 8.459 351.640 78.646 49.034 64.503 8.975 383.293 10.056 115.303 40.483 147.328 1.935 315.105 66.991 65.324 37.461 1.931.428
Table 1BArgentina: SAM for 1997, US$ millions
COMMODITIES FACTORSTOTALPRIVATE GOVERNMENT CAPITAL
ACCOUNT REST OF WORLDACCOUNTS ACTIVITIES
Source: IICA with data from GTAP 5.0

Food Primary Agroindustry Natural
Resources Rest
Economy Food Primary Agroindustry Natural
Resources Rest
Economy Land Unskilled Labor Skiilled Labor Capital Natural
Resources ACTIVITIES
Food 128.586 128.586 Primary 112.977 112.977 Agroindustry 130.395 130.395 Natural Resources 19.071 19.071 Rest Economy 1.113.113 1.113.113
COMMODITIESFood 23.350 4.246 1.312 24 14.337 81.701 0 - 7.176 132.147 Primary 49.715 16.234 4.596 25 10.817 27.080 0 2.712 5.483 116.662 Agroindustry 2.735 458 42.971 176 24.940 54.719 0 2.414 7.123 135.536 Natural Resources 297 586 140 880 19.410 - - - 3.326 24.640 Rest Economy 27.782 23.213 34.851 9.310 474.824 294.946 145.718 142.022 32.827 1.185.493
FACTORSLand - 10.546 - - - 10.546 Unskilled Labor 9.647 15.887 16.789 1.771 202.579 246.674 Skiilled Labor 1.583 559 2.756 300 114.216 119.414 Capital 13.482 41.366 26.473 4.082 264.880 350.282 Natural Resources - 553 - 2.454 - 3.007
PRIVATE 10.546 246.674 119.414 350.282 3.007 729.923 GOVERNMENT (5) (671) 508 48 (12.891) 271.476 258.466 CAPITAL ACCOUNT 112.747 34.401 147.148 REST OF WORLD 1.151 794 3.346 516 31.653 37.460
TOTAL 128.586 112.977 130.395 19.071 1.113.112 129.736 113.771 133.742 19.587 1.144.766 10.546 246.674 119.414 350.282 3.007 729.923 258.466 147.148 90.336 5.001.539
REST OF WORLD TOTAL
Table 2BBrazil: SAM for 1997, US$ millions
ACCOUNTS ACTIVITIES COMMODITIES FACTORS
PRIVATE GOVERNMENT CAPITAL ACCOUNT
Source: IICA with data from GTAP 5.0

Food Primary Agroindustry Natural
Resources Rest
Economy Food Primary Agroindustry Natural
Resources Rest
Economy Land Unskilled Labor Skiilled Labor Capital Natural
Resources ACTIVITIES
Food 49.207 49.207 Primary 41.988 41.988 Agroindustry 90.970 90.970 Natural Resources 38.998 38.998 Rest Economy 888.073 888.073
COMMODITIESFood 8.494 2.396 138 16 6.835 30.993 1.339 - 8.107 58.320 Primary 13.318 7.692 8.703 1 1.318 4.584 1.035 1 9.599 46.250 Agroindustry 2.286 342 22.076 174 20.130 20.298 6.759 1.888 35.617 109.570 Natural Resources 158 73 374 358 23.912 426 333 - 20.283 45.916 Rest Economy 9.421 14.065 23.983 18.507 336.409 279.288 114.480 113.092 161.183 1.070.428
FACTORSLand - 2.002 - - - 2.002 Unskilled Labor 6.467 7.377 19.330 2.351 194.119 229.644 Skiilled Labor 1.423 624 5.502 861 82.988 91.397 Capital 7.211 6.470 9.821 7.277 183.286 214.064 Natural Resources - 1.294 - 6.769 - 8.063
PRIVATE 2.002 229.644 91.397 214.064 8.063 545.170 GOVERNMENT 431 (346) 1.044 2.684 39.077 209.582 252.471 CAPITAL ACCOUNT 128.525 (13.543) 114.981 REST OF WORLD 9.113 4.262 18.599 6.917 182.355 221.246 TOTAL 49.207 41.988 90.970 38.998 888.073 58.320 46.250 109.570 45.916 1.070.428 2.002 229.644 91.397 214.064 8.063 545.170 252.471 114.981 221.246 4.118.759
TOTALPRIVATE GOVERNMENT CAPITAL ACCOUNT REST OF WORLDACCOUNTS
ACTIVITIES COMMODITIES FACTORS
Table 3BCanada: SAM for 1997, US$ millions
Source: IICA with data from GTAP 5.0

Food Primary Agroindustry Natural
Resources Rest
Economy Food Primary Agroindustry Natural
Resources Rest
Economy Land Unskilled Labor Skiilled Labor Capital Natural
Resources ACTIVITIES
Food 16.414 16.414 Primary 11.884 11.884 Agroindustry 10.560 10.560 Natural Resources 5.343 5.343 Rest Economy 92.715 92.715
COMMODITIESFood 2.586 527 128 - 1.181 9.742 12 555 2.792 17.522 Primary 5.861 1.607 265 2 207 2.117 - 610 1.660 12.329 Agroindustry 432 118 2.665 35 2.114 4.685 - 786 2.094 12.930 Natural Resources 29 189 16 627 3.490 1 - 153 2.492 6.996 Rest Economy 3.698 2.314 3.753 1.802 34.354 28.934 7.675 17.130 10.743 110.401
FACTORSLand - 1.558 - - - 1.558 Unskilled Labor 1.267 2.837 1.174 671 12.727 18.675 Skiilled Labor 246 49 197 111 6.972 7.576 Capital 2.287 2.046 2.222 1.687 29.581 37.823 Natural Resources - 412 - 387 - 800
PRIVATE 1.558 18.675 7.576 37.823 800 66.432 GOVERNMENT 9 227 142 22 2.088 20.953 23.440 CAPITAL ACCOUNT 15.753 3.481 19.234 REST OF WORLD 1.108 445 2.369 1.652 17.687 23.261 TOTAL 16.414 11.884 10.561 5.343 92.715 17.522 12.329 12.930 6.995 110.401 1.558 18.675 7.576 37.823 800 66.432 23.440 19.234 23.261 495.890
COMMODITIES FACTORSPRIVATE GOVERNMENTACCOUNTS
ACTIVITIES
Table 4BChile: SAM for 1997, US$ millions
CAPITAL ACCOUNT REST OF WORLD TOTAL
Source: IICA with data from GTAP 5.0

Food Primary Agroindustry Natural
Resources Rest
Economy Food Primary Agroindustry Natural
Resources Rest
Economy Land Unskilled Labor Skiilled Labor Capital Natural
Resources ACTIVITIES
Food 20.969 20.969 Primary 15.888 15.888 Agroindustry 10.221 10.221 Natural Resources 6.209 6.209 Rest Economy 115.807 115.807
COMMODITIESFood 2.191 974 209 0 1.663 16.079 - - 925 22.040 Primary 6.804 783 320 - 684 4.853 - 247 3.147 16.837 Agroindustry 472 129 2.274 16 2.076 5.374 - 181 1.146 11.668 Natural Resources 37 1 81 1 2.650 2 - - 3.485 6.256 Rest Economy 6.038 3.109 4.415 2.130 42.308 36.202 15.585 15.193 6.863 131.841
FACTORSLand - 2.853 - - - 2.853 Unskilled Labor 2.060 5.065 1.284 630 23.597 32.637 Skiilled Labor 364 67 202 107 13.210 13.949 Capital 2.817 2.703 1.291 1.844 27.751 36.406 Natural Resources - 159 - 1.412 - 1.571
PRIVATE 2.853 32.637 13.949 36.406 1.571 87.415 GOVERNMENT 186 46 147 68 1.870 24.905 27.221 CAPITAL ACCOUNT 11.637 3.984 15.621 REST OF WORLD 1.072 949 1.446 47 16.034 19.548
TOTAL 20.969 15.888 10.221 6.209 115.806 22.040 16.837 11.668 6.255 131.841 2.853 32.637 13.949 36.406 1.571 87.415 27.221 15.621 19.549 594.954
Colombia: SAM for 1997, US$ millions
ACCOUNTS ACTIVITIES COMMODITIES FACTORS
PRIVATE GOVERNMENT CAPITAL ACCOUNT REST OF WORLD TOTAL
Table 5B
Source: IICA with data from GTAP 5.0

Food Primary Agroindustry Natural
Resources Rest
Economy Food Primary Agroindustry Natural
Resources Rest
Economy Land Unskilled Labor Skiilled Labor Capital Natural
Resources ACTIVITIES
Food 556.231 556.231 Primary 265.090 265.090 Agroindustry 700.891 700.891 Natural Resources 115.628 115.628 Rest Economy 12.711.763 12.711.763
COMMODITIESFood 85.890 21.857 1.665 0 95.515 342.644 10.004 - 30.674 588.250 Primary 134.386 46.424 12.483 1 18.269 37.324 1.498 10 35.178 285.573 Agroindustry 19.527 4.094 201.932 370 249.319 250.807 19.753 40.024 49.998 835.824 Natural Resources 107 444 528 2.072 176.005 97 9 77 6.404 185.743 Rest Economy 138.913 96.054 198.713 45.426 4.879.341 4.864.264 1.170.894 1.358.257 750.524 13.502.383
FACTORSLand - 27.433 - - - 27.433 Unskilled Labor 57.658 36.196 130.836 15.802 2.626.969 2.867.461 Skiilled Labor 18.562 2.766 50.079 5.813 1.958.465 2.035.685 Capital 101.287 37.558 104.657 22.951 2.707.885 2.974.338 Natural Resources - 1.311 - 23.192 - 24.503
PRIVATE 27.433 2.867.461 2.035.685 2.974.338 24.503 7.929.420 GOVERNMENT (99) (9.046) (1) - (4) 2.434.283 2.425.134 CAPITAL ACCOUNT 1.222.976 175.392 1.398.368 REST OF WORLD 32.019 20.483 134.933 70.115 790.620 1.048.169
TOTAL 556.231 265.091 700.891 115.628 12.711.764 588.250 285.573 835.824 185.742 13.502.383 27.433 2.867.461 2.035.685 2.974.338 24.503 7.929.420 2.425.134 1.398.368 1.048.169 50.477.886
TOTAL
Table 6BUnited States: SAM for 1997, US$ millions
ACCOUNTS ACTIVITIES COMMODITIES FACTORS
PRIVATE GOVERNMENT CAPITAL ACCOUNT REST OF WORLD
Source: IICA with data from GTAP 5.0
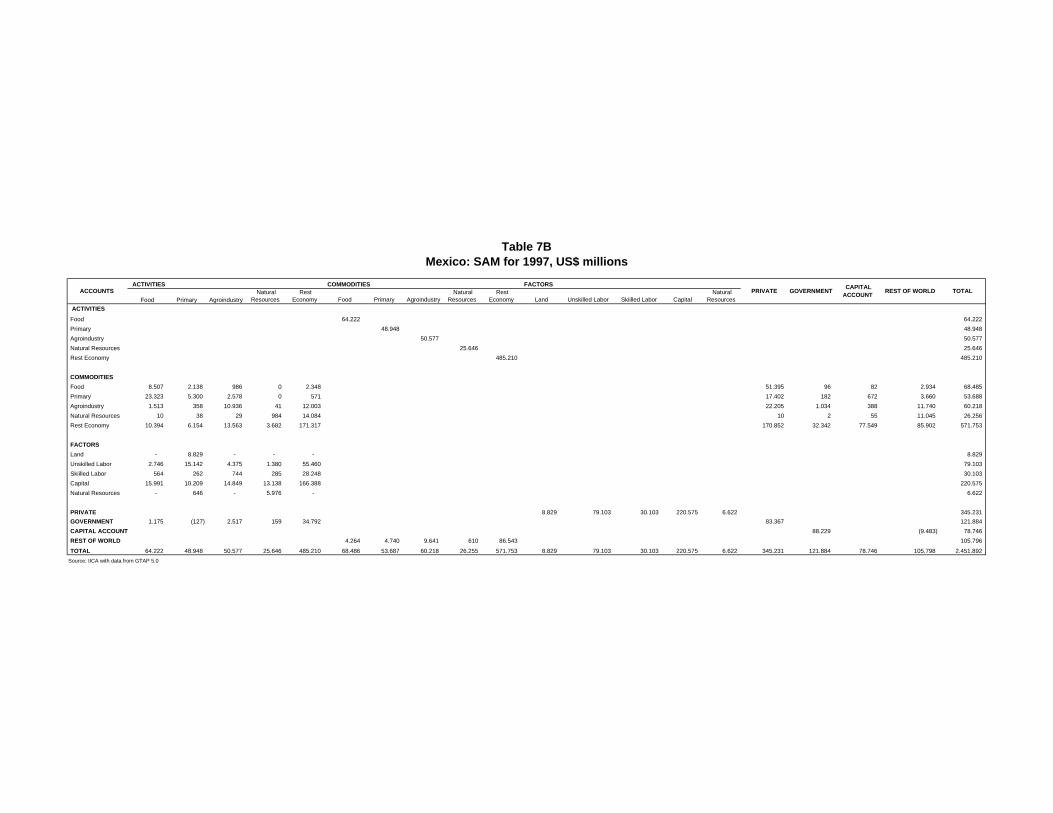
Food Primary Agroindustry Natural
Resources Rest
Economy Food Primary Agroindustry Natural
Resources Rest
Economy Land Unskilled Labor Skiilled Labor Capital Natural
Resources ACTIVITIES
Food 64.222 64.222 Primary 48.948 48.948 Agroindustry 50.577 50.577 Natural Resources 25.646 25.646 Rest Economy 485.210 485.210
COMMODITIESFood 8.507 2.138 986 0 2.348 51.395 96 82 2.934 68.485 Primary 23.323 5.300 2.578 0 571 17.402 182 672 3.660 53.688 Agroindustry 1.513 358 10.936 41 12.003 22.205 1.034 388 11.740 60.218 Natural Resources 10 38 29 984 14.084 10 2 55 11.045 26.256 Rest Economy 10.394 6.154 13.563 3.682 171.317 170.852 32.342 77.549 85.902 571.753
FACTORSLand - 8.829 - - - 8.829 Unskilled Labor 2.746 15.142 4.375 1.380 55.460 79.103 Skiilled Labor 564 262 744 285 28.248 30.103 Capital 15.991 10.209 14.849 13.138 166.388 220.575 Natural Resources - 646 - 5.976 - 6.622
PRIVATE 8.829 79.103 30.103 220.575 6.622 345.231 GOVERNMENT 1.175 (127) 2.517 159 34.792 83.367 121.884 CAPITAL ACCOUNT 88.229 (9.483) 78.746 REST OF WORLD 4.264 4.740 9.641 610 86.543 105.796
TOTAL 64.222 48.948 50.577 25.646 485.210 68.486 53.687 60.218 26.255 571.753 8.829 79.103 30.103 220.575 6.622 345.231 121.884 78.746 105.798 2.451.892
REST OF WORLD TOTAL
Table 7BMexico: SAM for 1997, US$ millions
ACCOUNTS ACTIVITIES COMMODITIES FACTORS
PRIVATE GOVERNMENT CAPITAL ACCOUNT
Source: IICA with data from GTAP 5.0
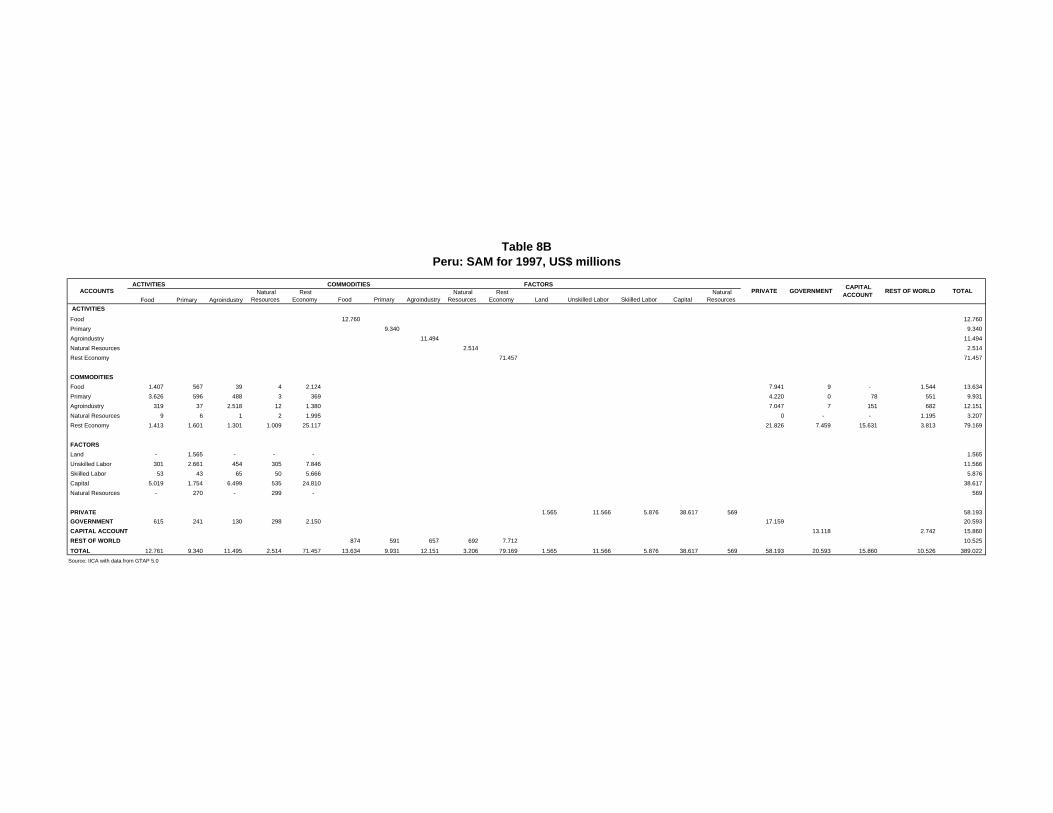
Food Primary Agroindustry Natural
Resources Rest
Economy Food Primary Agroindustry Natural
Resources Rest
Economy Land Unskilled Labor Skiilled Labor Capital Natural
Resources ACTIVITIES
Food 12.760 12.760 Primary 9.340 9.340 Agroindustry 11.494 11.494 Natural Resources 2.514 2.514 Rest Economy 71.457 71.457
COMMODITIESFood 1.407 567 39 4 2.124 7.941 9 - 1.544 13.634 Primary 3.626 596 488 3 369 4.220 0 78 551 9.931 Agroindustry 319 37 2.518 12 1.380 7.047 7 151 682 12.151 Natural Resources 9 6 1 2 1.995 0 - - 1.195 3.207 Rest Economy 1.413 1.601 1.301 1.009 25.117 21.826 7.459 15.631 3.813 79.169
FACTORSLand - 1.565 - - - 1.565 Unskilled Labor 301 2.661 454 305 7.846 11.566 Skiilled Labor 53 43 65 50 5.666 5.876 Capital 5.019 1.754 6.499 535 24.810 38.617 Natural Resources - 270 - 299 - 569
PRIVATE 1.565 11.566 5.876 38.617 569 58.193 GOVERNMENT 615 241 130 298 2.150 17.159 20.593 CAPITAL ACCOUNT 13.118 2.742 15.860 REST OF WORLD 874 591 657 692 7.712 10.525
TOTAL 12.761 9.340 11.495 2.514 71.457 13.634 9.931 12.151 3.206 79.169 1.565 11.566 5.876 38.617 569 58.193 20.593 15.860 10.526 389.022
TOTALCOMMODITIES FACTORS
PRIVATE GOVERNMENTACCOUNTS ACTIVITIES CAPITAL
ACCOUNT REST OF WORLD
Table 8BPeru: SAM for 1997, US$ millions
Source: IICA with data from GTAP 5.0
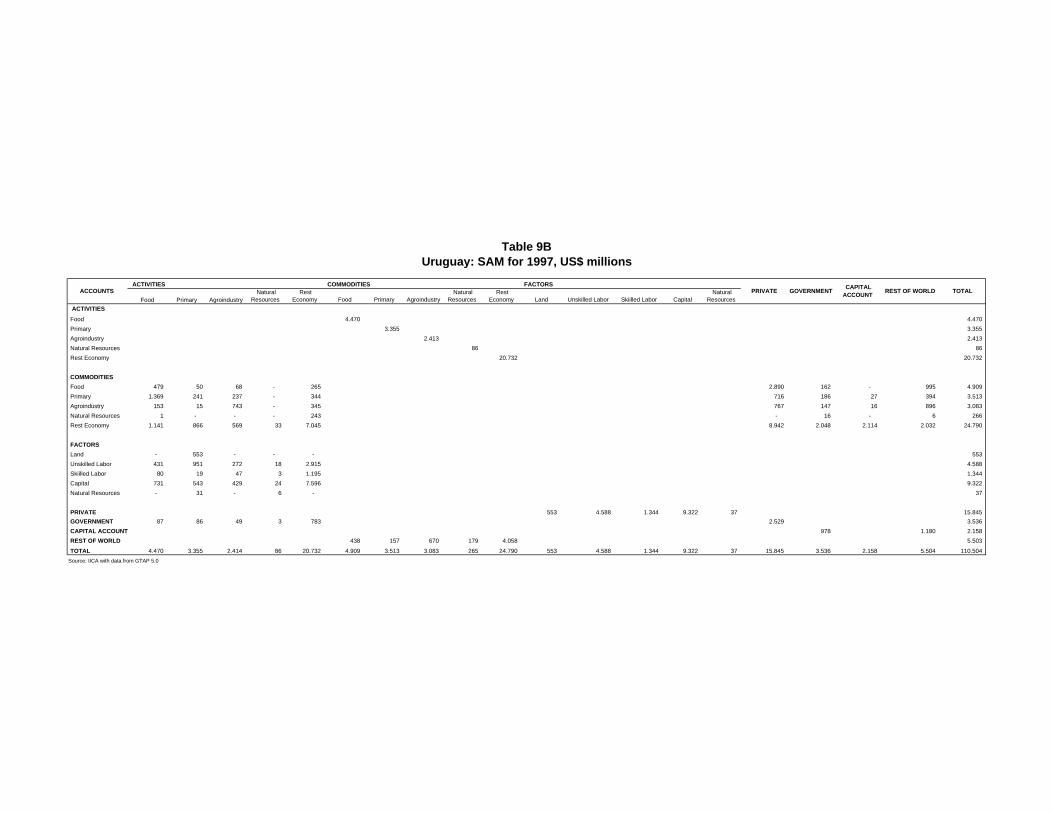
Food Primary Agroindustry Natural
Resources Rest
Economy Food Primary Agroindustry Natural
Resources Rest
Economy Land Unskilled Labor Skiilled Labor Capital Natural
Resources ACTIVITIES
Food 4.470 4.470 Primary 3.355 3.355 Agroindustry 2.413 2.413 Natural Resources 86 86 Rest Economy 20.732 20.732
COMMODITIESFood 479 50 68 - 265 2.890 162 - 995 4.909 Primary 1.369 241 237 - 344 716 186 27 394 3.513 Agroindustry 153 15 743 - 345 767 147 16 896 3.083 Natural Resources 1 - - - 243 - 16 - 6 266 Rest Economy 1.141 866 569 33 7.045 8.942 2.048 2.114 2.032 24.790
FACTORSLand - 553 - - - 553 Unskilled Labor 431 951 272 18 2.915 4.588 Skiilled Labor 80 19 47 3 1.195 1.344 Capital 731 543 429 24 7.596 9.322 Natural Resources - 31 - 6 - 37
PRIVATE 553 4.588 1.344 9.322 37 15.845 GOVERNMENT 87 86 49 3 783 2.529 3.536 CAPITAL ACCOUNT 978 1.180 2.158 REST OF WORLD 438 157 670 179 4.058 5.503
TOTAL 4.470 3.355 2.414 86 20.732 4.909 3.513 3.083 265 24.790 553 4.588 1.344 9.322 37 15.845 3.536 2.158 5.504 110.504
GOVERNMENT CAPITAL ACCOUNT REST OF WORLD
Table 9BUruguay: SAM for 1997, US$ millions
ACCOUNTS ACTIVITIES COMMODITIES FACTORS
PRIVATE TOTAL
Source: IICA with data from GTAP 5.0

Food Primary Agroindustry Natural
Resources Rest
Economy Food Primary Agroindustry Natural
Resources Rest
Economy Land Unskilled Labor Skiilled Labor Capital Natural
Resources ACTIVITIES
Food 14.035 14.035 Primary 8.370 8.370 Agroindustry 8.808 8.808 Natural Resources 19.338 19.338 Rest Economy 99.973 99.973
COMMODITIESFood 2.179 566 109 160 2.238 9.017 121 443 431 15.263 Primary 3.485 703 412 102 378 3.670 12 274 196 9.231 Agroindustry 384 26 2.588 190 1.908 4.551 103 364 319 10.434 Natural Resources 36 7 22 290 7.250 9 - 14 11.802 19.429 Rest Economy 4.291 1.283 3.383 4.149 34.524 39.636 5.211 13.649 10.738 116.864
FACTORSLand - 1.454 - - - 1.454 Unskilled Labor 1.191 2.522 1.081 1.316 15.369 21.479 Skiilled Labor 226 46 180 298 7.746 8.495 Capital 2.239 1.588 1.016 7.933 30.083 42.859 Natural Resources - 156 - 4.899 - 5.054
PRIVATE 1.454 21.479 8.495 42.859 5.054 79.341 GOVERNMENT 5 19 17 3 477 22.458 22.979 CAPITAL ACCOUNT 17.531 (2.788) 14.743 REST OF WORLD 1.228 861 1.626 90 16.891 20.696
TOTAL 14.035 8.370 8.808 19.338 99.973 15.263 9.231 10.434 19.428 116.864 1.454 21.479 8.495 42.859 5.054 79.341 22.979 14.743 20.697 538.842
TOTAL
Table 10BVenezuela: SAM for 1997, US$ millions
ACCOUNTS ACTIVITIES COMMODITIES FACTORS
PRIVATE GOVERNMENT CAPITAL ACCOUNT REST OF WORLD
Source: IICA with data from GTAP 5.0
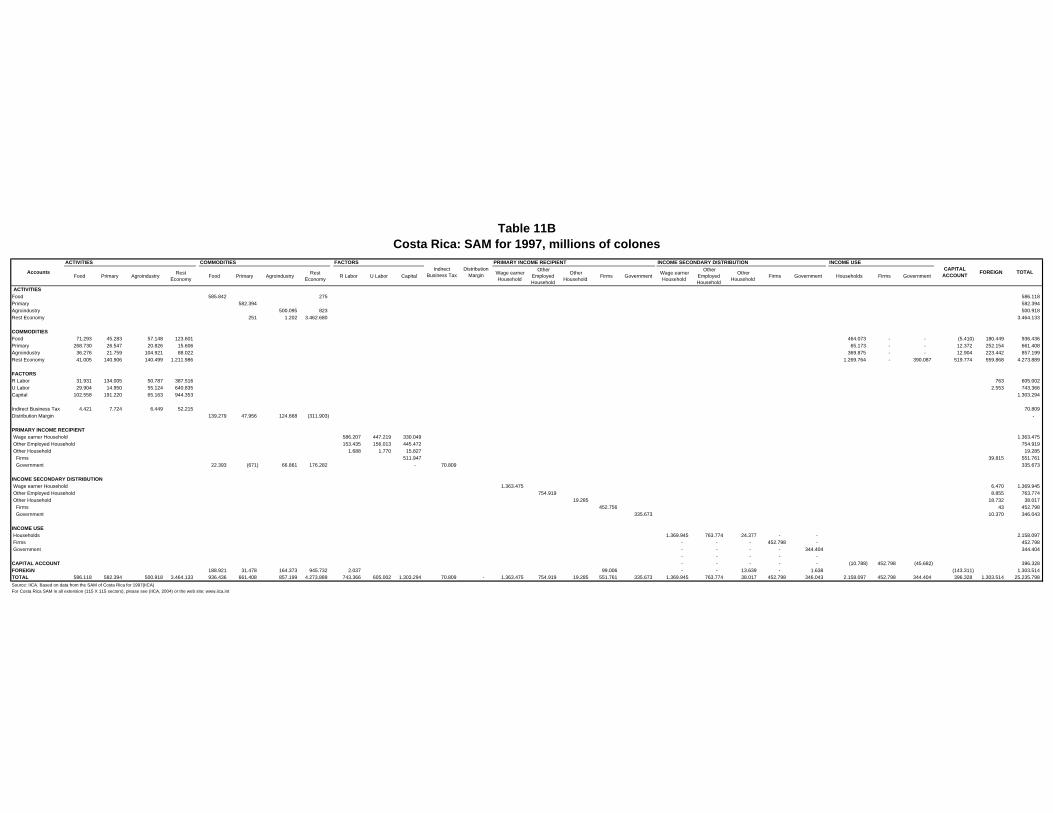
Food Primary Agroindustry Rest Economy Food Primary Agroindustry Rest
Economy R Labor U Labor Capital Wage earner Household
Other Employed Household
Other Household Firms Government Wage earner
Household
Other Employed Household
Other Household Firms Government Households Firms Government
ACTIVITIESFood 585.842 275 586.118 Primary 582.394 582.394 Agroindustry 500.095 823 500.918 Rest Economy 251 1.202 3.462.680 3.464.133
COMMODITIESFood 71.293 45.283 57.148 123.601 464.073 - - (5.410) 180.449 936.436 Primary 268.730 26.547 20.826 15.606 65.173 - - 12.372 252.154 661.408 Agroindustry 36.276 21.759 104.921 88.022 369.875 - - 12.904 223.442 857.199 Rest Economy 41.005 140.906 140.499 1.211.986 1.269.764 - 390.087 519.774 559.868 4.273.889
FACTORSR Labor 31.931 134.005 50.787 387.516 763 605.002 U Labor 29.904 14.950 55.124 640.835 2.553 743.366 Capital 102.558 191.220 65.163 944.353 1.303.294
Indirect Business Tax 4.421 7.724 6.449 52.215 70.809 Distribution Margin 139.279 47.956 124.668 (311.903) -
Wage earner Household 586.207 447.219 330.049 1.363.475 Other Employed Household 153.435 156.013 445.472 754.919 Other Household 1.688 1.770 15.827 19.285 Firms 511.947 39.815 551.761 Government 22.393 (671) 66.861 176.282 - 70.809 335.673
Wage earner Household 1.363.475 6.470 1.369.945 Other Employed Household 754.919 8.855 763.774 Other Household 19.285 18.732 38.017 Firms 452.756 43 452.798 Government 335.673 10.370 346.043
INCOME USE Households 1.369.945 763.774 24.377 - - 2.158.097 Firms - - - 452.798 - 452.798 Government - - - - 344.404 344.404
- - - - - CAPITAL ACCOUNT - - - - - (10.788) 452.798 (45.682) 396.328 FOREIGN 188.921 31.478 164.373 945.732 2.037 99.006 - - 13.639 - 1.638 (143.311) 1.303.514 TOTAL 586.118 582.394 500.918 3.464.133 936.436 661.408 857.199 4.273.889 743.366 605.002 1.303.294 70.809 - 1.363.475 754.919 19.285 551.761 335.673 1.369.945 763.774 38.017 452.798 346.043 2.158.097 452.798 344.404 396.328 1.303.514 25.235.798 Source: IICA. Based on data from the SAM of Costa Rica for 1997(IICA)For Costa Rica SAM in all extension (115 X 115 sectors), please see (IICA, 2004) or the web site: www.iica.int
FOREIGN TOTAL
Table 11BCosta Rica: SAM for 1997, millions of colones
PRIMARY INCOME RECIPIENT INCOME SECONDARY DISTRIBUTION INCOME USECAPITAL
ACCOUNTDistribution
Margin
COMMODITIES FACTORSIndirect
Business Tax
INCOME SECONDARY DISTRIBUTION
PRIMARY INCOME RECIPIENT
Accounts
ACTIVITIES
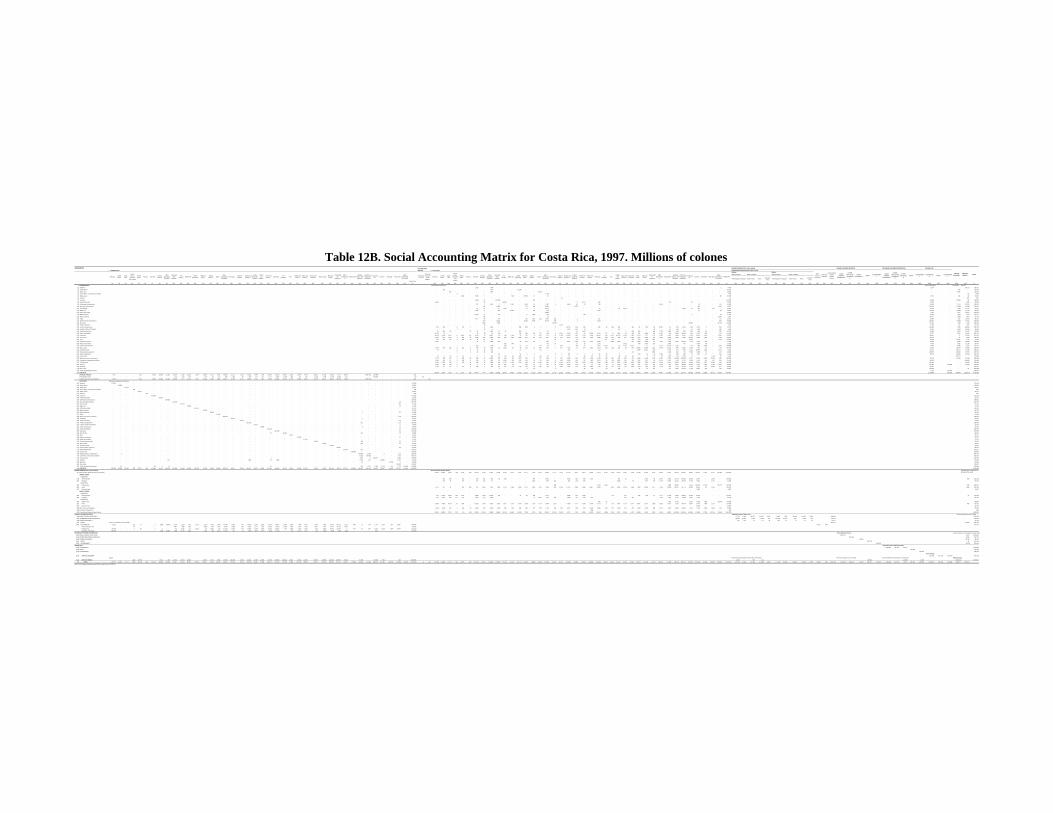
INCOME GENERATION (Value Added) INCOME USE
c COMMODITIES a ACTIVITIES Remuneration Wage Earners (Labor Factor)
(1) (2) (3) (4) (5) (6) (7) (8) (9) (10) (11) (12) (13) (14) (15) (16) (17) (18) (19) (20) (21) (22) (23) (24) (25) (26) (27) (28) (29) (30) (31) (32) (33) (34) (35) (36) (37) (38) (39) (40) (41) ( c) (42) (43) (44) (45) (46) (47) (48) (49) (50) (51) (52) (53) (54) (55) (56) (57) (58) (59) (60) (61) (62) (63) (64) (65) (66) (67) (68) (69) (70) (71) (72) (73) (74) (75) (76) (77) (78) (79) (80) (81) (82) (a ) (83) (84) (85) (86) (87) (88) (89) (90) (91) (92) (93) (94) (95) (96) (97) (98) (99) (100) (101) (102) (103) (104) (105) (106) (107) (108) (109) (110) (t)
c COMMODOTIES Intermediate Consumption Final Consumption Investment Exports(1) Bananas - - - - - - 1.102 - 5.590 - - - - - - - - - - - - - - - - - - - - - - - - - - - - - - - 2 6.694 1.106 - - 134.151 141.951 (2) Coffee beans - 156 - - - - - - 975 - - - 81.245 - - - - - - - - - - - - - - - - - - - - - - - - - - - - 82.376 - - 675 - 83.052 (3) Sugar cane - - 587 - - - - - 1.378 - - - - - - 17.258 - - - - - - - - - - - - - - - - - - - - - - - - - 19.223 - - 2.901 - 22.123 (4) Cocoa beans, unroasted and roasted - - - 0 - - - - - - - - - - - - 1.755 - - - - - - - - - - - - - - - - - - - - - - - - 1.755 - - - 50 1.805 (5) Staple grains - - - - 1.912 - 3.486 7 - - - 528 - 29.345 17 - 37 - - - - - - - - - - - - - - - - - - - - - - - 86 35.418 5.401 - 511 30 41.360 (6) Tobacco - - - - - - - - - - - - - - - - - - 23 - - - - - - - - - - - - - - - - - - - - - - 23 - - - 881 905 (7) Livestock - - - - - - 1.969 42 - 107.888 - - - - 291 - - - - - - - - - - - - - - - - - - - - - - - - - - 110.190 16.803 - (8.831) 64 118.226 (8) Forestry, fisheries 5.600 - - - - - - 19 - - 20.056 - - - - - - - - - 2 8.444 - 125 - - - - - - - - - 107 - - 22 - - - - 34.375 8.230 - - 3.455 46.060 (9) Other agricultural products - - - - - - 701 2 3.024 11 - 8.140 - 3.933 18 - 1.507 0 - 8.968 63 26 - 188 - - - - - - - - 14.919 - - - - 36 - - 119 41.655 33.634 - 17.114 113.524 205.928
(10) Meat and dairy products - - - - - - - 190 - 13.023 - - - 473 326 - 23.203 - - - 6.276 - - - - - - - - - - - - - - - - 283 - - 4.693 48.467 217.362 - (5.698) 13.380 273.511 (11) Fish canning - - - - - - 42 83 - 11 5.368 - - 13 1 - 10.521 - - - - - - 36 - - 38 1.416 - - - - - - - 2.068 22 592 - 142 7 20.360 20.790 - (119) 37.171 78.201 (12) Edible oils - - - - - - 1.561 5 - 155 - 10.164 - - 357 - 183 - - - - - - 1.746 - - - - - - - - - - - - - 47 - - 89 14.307 42.776 - (2.856) 11.714 65.941 (13) Coffee processing - - - - - - - - - - - - - - - - 10.802 - - - - - - - - - - - - - - - - - - - - - - - - 10.802 7.951 - 4.277 97.547 120.576 (14) Milling of grains - - - - - - 31.830 13 - 155 - - - 22 4.644 - 944 - - - - 260 - - - - - - - - - - - - - - 8 - - - 58 37.934 63.835 - (785) 2.428 103.411 (15) Bakery products - - - - - - - 126 - - - - - - - - 21 - - - - - - - - - - - - - - - - - - - - - - - 2.587 2.733 36.747 - (266) 4.564 43.778 (16) Sugar - - - - - - 5.477 14 - 536 - - - 192 1.625 101 4.935 282 - - 2 - - 267 - - - - - - - - - - - - - - - - 735 14.167 22.998 - 118 11.914 49.196 (17) Other manufactured products - - - - - - - 573 - 13.322 - - - 13.061 6.196 - 21.479 478 - - 1 - - 3.210 - - - - - - - - - - - - - - - - 938 59.258 135.923 - (3.556) 47.911 239.535 (18) Beverages - - - - - - - 5.942 - 3.349 - - - - - - - 30.494 - - - - - - - - - - - - - - - - - - 85.044 - - - 23.725 148.554 51.614 - (80) 1.732 201.820 (19) Tobacco products - - - - - - - 30 - - - - - - - - - - 3.861 - - - - - - - - - - - - - - - - - - - - - - 3.891 21.789 - 131 563 26.374 (20) Textiles and garments 101 103 - 0 172 7 - 5 1.139 - - - 538 800 1 4 - 0 - 26.746 153 135 - 501 12 660 659 - 196 95 239 60 10.784 11 375 1.312 150 1.276 3 - 212 46.449 110.559 - 4.230 133.331 294.570 (21) Leather goods and footwear - - - 1 - - - 19 1 - - - - - - - - - - 1.970 3.721 70 - - - - 872 - - - - 89 - 22 168 - 13 1.760 - - 480 9.186 13.681 - (345) 16.419 38.941 (22) Timber and furniture 70 252 86 - - 15 53 - 1.531 17 12 - 369 - - - 13 - - - 10 1.497 - - - - - 1 420 403 - 442 7.759 5.883 454 233 387 360 82 - 363 20.712 15.346 - 3.873 11.578 51.508 (23) Paper and printing 17.476 79 - - - - 18 (0) 31 139 - - 170 286 113 767 182 3 1.591 6.153 105 13 37.220 1.212 177 11 1.097 25 289 657 3.606 176 1.487 294 6.388 24.940 435 5.472 435 - 437 111.482 72.577 - 8.571 13.641 206.272 (24) Chemicals 24.825 8.190 3.333 11 6.623 252 4.263 15 28.927 20 140 2.284 70 267 8 651 157 42 1.269 41.078 862 1.729 4.264 66.281 519 4.112 46.278 2.616 1.343 3.279 7.177 2.117 7.457 6.187 2.609 8.341 2.315 19.216 1.103 - 5.342 315.571 163.501 - 17 47.943 527.032 (25) Oil refineries 2.936 801 1.594 2 825 50 2.930 321 3.585 219 553 889 1.682 515 176 499 827 22 151 8.134 133 202 3.439 1.606 903 396 587 544 5.391 1.694 1.285 612 2.832 8.688 4.995 7.086 36.636 6.393 7.354 - 559 118.045 39.775 - 76 4.529 162.425 (26) Tires 361 313 350 0 190 10 24 147 725 - - - - - - - - 12 - - 12 - - - 257 132 - - 124 923 344 1.987 - 1.131 - - 12.221 - - - 1.729 20.992 33.646 - 12.285 5.732 72.654 (27) Rubber and plastics 4.647 - - - - - 32 27 1.886 659 - - 15 510 82 - 630 - - 8.257 1.562 127 2.147 3.088 - 6.050 4.692 - 247 2.654 9.810 43 304 1.340 1.867 20.161 575 5.791 129 - - 77.333 44.803 - 6.604 24.398 153.138 (28) Glass and ceramics - - - - - - - - - - 233 966 - - - - 275 20 - - 13 14 - 1.141 - - - 1.422 - 340 1.656 197 - 1.941 - 737 - 3.339 38 - - 12.332 8.870 - 3.302 11.193 35.697 (29) Construction materials - - - 1 - - 693 - 2.836 - 300 - 27 39 - 224 39 - 849 - 296 52 - 3.792 21.343 - 24 1.761 13.721 - 32 - 9.771 42.274 1.266 - 279 966 5.309 - 2.763 108.659 8.684 - 5.595 3.382 126.321 (30) Base metals 1.978 496 232 0 161 9 199 78 3.170 43 1.302 63 18 511 14 869 613 7 677 7.243 45 274 1.912 1.179 148 518 921 58 673 26.966 17.696 1.211 3.948 13.310 839 6.336 2.320 4.771 141 - 432 101.379 24.165 - 19.379 23.859 168.783 (31) Electrical Goods 58 - - 0 - 8 20 22 632 - - - 23 - 7 370 - - - 362 - - - 223 - - - - - 2.889 34.852 405 - 6.535 670 7.494 3.411 10.886 1.010 - 1.372 71.250 56.070 - 89.557 87.286 304.163 (32) Transportation equipment - - - 0 - 4 10 18 342 - - - - - - - - - - - - - - - - - - - 43 - - 8.931 - 1.647 312 28 6.515 3.268 70 - 173 21.360 160.987 - 133.392 17.973 333.712 (33) Other manufactures - - - - - - - - - 16 - - 13 8 2 - - 0 4 967 8 1 4 25 28 - 3 - - 119 18 40 7.394 16 284 563 13 1.357 13 - 246 11.144 26.670 - 32.385 84.583 154.782 (34) Construction 29 8 47 0 16 - 3 2 169 19 239 45 465 - 1 146 87 1 1 97 - 56 33 24 35 - 50 44 147 - 3 79 95 1.681 216 1.708 6 - - 1.134 97 6.783 - - 207.021 - 213.804 (35) Banking, finance and insurance 1.749 328 224 1 518 20 998 46 10.515 170 405 83 1.645 706 67 714 300 9 197 3.658 257 243 4.700 2.498 696 381 884 536 376 6.599 6.608 1.573 5.031 8.402 19.988 128.338 8.947 17.435 6.639 17.290 509 260.282 32.178 - 10.160 25.408 328.028 (36) Commerce, restaurants and hotels 1.241 150 67 0 108 8 319 13 906 20 1.226 386 832 152 32 59 149 4 239 1.910 102 60 560 1.233 10 130 1.605 345 311 366 807 28 2.174 2.233 824 2.723 1.180 2.371 197 387 259 25.724 88.229 - - 118.491 232.444 (37) Transportation 3.203 1.035 756 0 632 34 524 12 2.862 482 1.771 1.140 7.315 436 137 3.296 492 23 1.809 11.751 332 1.024 6.702 2.329 659 151 3.821 1.363 5.431 5.590 7.288 1.159 2.354 11.474 22.250 24.363 12.944 37.482 2.175 5.800 836 193.235 151.964 - - 90.429 435.628 (38) Services 1.029 105 198 0 - 10 6 8 676 68 817 65 - 281 11 37 491 16 1.369 2.634 118 97 64 731 49 14 1.150 313 684 341 1.011 115 1.209 641 4.867 34.826 12.301 9.207 1.354 3.784 2.870 83.567 227.302 245.899 - 14.640 571.407 (39) Electricity 1.294 231 123 0 119 9 444 1 945 183 381 279 1.126 735 66 497 268 6 549 7.991 130 279 3.063 979 76 372 1.285 140 1.056 1.226 958 364 1.970 364 2.129 14.387 2.155 2.736 557 6.686 517 56.676 49.591 - - - 106.267 (40) Real estate - - - - - - - - - 3 - - - 5 16 - - 0 - - - 30 28 - 39 - 153 - - 96 49 197 - 174 1.335 31.799 1.400 14.034 287 - 418 50.064 151.503 - - 21 201.588 (41) Public administration services - - - - - - - - - - - - - - - - - - - - - - - - - - - - - - - - - - - - - - - - - - 1.826 144.188 - - 146.014 (c ) SUBTOTAL 66.596 12.247 7.597 17 11.277 436 56.704 7.777 71.845 140.506 32.803 25.032 95.553 52.291 14.210 25.491 79.910 31.417 12.589 137.920 14.205 14.633 64.136 92.415 24.950 12.926 64.117 10.583 30.451 54.237 93.440 19.825 79.487 114.356 71.837 317.441 189.299 149.078 26.899 35.222 52.652 2.414.407 2.168.885 390.087 539.639 1.215.914 6.728.932
Distribution Margin 7.367 - - - 621 - 3.992 10.816 25.161 59.050 5.192 12.922 1.194 21.842 8.273 9.234 39.062 21.572 5.196 39.312 4.848 7.635 28.613 86.553 20.685 15.103 33.435 4.163 16.191 27.639 35.290 73.714 10.684 - - (609.471) (25.889) - - - - 621 Internalization costs - - - - - - - - - 320 418 197 - 277 46 132 886 2.394 55 675 227 312 1.221 5.672 1.469 654 327 262 1.346 1.295 2.788 4.094 822 - - - (25.889) - - - - (0) 0,0 - Transportation and Trade Margins 7.367 - - - 621 - 3.992 10.816 25.161 58.729 4.774 12.725 1.194 21.565 8.227 9.102 38.176 19.178 5.141 38.637 4.621 7.324 27.392 80.881 19.216 14.449 33.108 3.901 14.846 26.344 32.502 69.620 9.862 - - (609.471) - - - - - 621 (0) -
ACTIVITIES Domestic production at retail prices(42) Bananas 125.356 - - - - - - - - - - - - - - - - - - - - - - - - - - - - - - - - - - - - - - - - 125.356 125.356 (43) Coffee beans - 83.009 - - - - - - - - - - - - - - - - - - - - - - - - - - - - - - - - - - - - - - - 83.009 83.009 (44) Sugar cane - - 22.123 - - - - - - - - - - - - - - - - - - - - - - - - - - - - - - - - - - - - - - 22.123 22.123 (45) Cocoa beans, unroasted and roasted - - - 509 - - - - - - - - - - - - - - - - - - - - - - - - - - - - - - - - - - - - - 509 509 (46) Staple grains - - - - 19.757 - - - - - - - - - - - - - - - - - - - - - - - - - - - - - - - - - - - - 19.757 19.757 (47) Tobacco - - - - - 905 - - - - - - - - - - - - - - - - - - - - - - - - - - - - - - - - - - - 905 905 (48) Livestock - - - - - - 114.180 - - - - - - - - - - - - - - - - - - - - - - - - - - - - - - - - - - 114.180 114.180 (49) Forestry, fisheries - - - - - - - 26.614 - - - - - - - - - - - - - - - - - - - - - - - - - - - - - - - - - 26.614 26.614 (50) Other agricultural products - - - - - - - - 189.942 - - - - - - - - - - - - - - - - - - - - - - - - - - - - - - - - 189.942 189.942 (51) Meat and dairy products - - - - - - - - - 187.628 - - - - - - - - - - - - - - - - - - - - - - - - - - - - - 28 - 187.657 187.657 (52) Fish canning - - - - - - - - - - 51.015 - - - - - - - - - - - - - - - - - - - - - - - - - - - - 183 - 51.198 51.198 (53) Edible oils - - - - - - - - - - - 41.899 - - - - - - - - - - - - - - - - - - - - - - - - - - - 12 - 41.910 41.910 (54) Coffee processing - - - - - - - - - - - - 117.223 - - - - - - - - - - - - - - - - - - - - - - - - - - - - 117.223 117.223 (55) Milling of grains - - - - - - - - - - - - - 63.786 - - - - - - - - - - - - - - - - - - - - - - - - - - - 63.786 63.786 (56) Bakery products - - - - - - - - - - - - - - 25.635 - - - - - - - - - - - - - - - - - - - 1 - - - - 50 - 25.686 25.686 (57) Sugar - - - - - - - - - - - - - - - 32.045 - - - - - - - - - - - - - - - - - - - - - - - - - 32.045 32.045 (58) Other manufactured products - - - - - - - - - - - - - - - - 129.799 - - - - - - - - - - - - - - - - - - - - - - 178 - 129.976 129.976 (59) Beverages - - - - - - - - - - - - - - - - - 66.611 - - - - - - - - - - - - - - - - 1 - - - - - - 66.612 66.612 (60) Tobacco products - - - - - - - - - - - - - - - - - - 17.222 - - - - - - - - - - - - - - - - - - - - 39 - 17.261 17.261 (61) Textiles and garments - - - - - - - - - - - - - - - - - - - 201.126 - - - - - - - - - - - - - - 421 - - - - 110 - 201.658 201.658 (62) Leather goods and footwear - - - - - - - - - - - - - - - - - - - - 20.872 - - - - - - - - - - - - - - - - - - 8 - 20.880 20.880 (63) Timber and furniture - - - - - - - - - - - - - - - - - - - - - 26.530 - - - - - - - - - - - - 0 - - - - 11 - 26.542 26.542 (64) Paper and printing - - - - - - - - - - - - - - - - - - - - - - 104.546 - - - - - - - - - - - - - - - - 54 - 104.600 104.600 (65) Chemicals - - - - - - - - - - - - - - - - - - - - - - - 147.358 - - - - - - - - - - - - - - - 32 - 147.390 147.390 (66) Oil refineries - - - - - - - - - - - - - - - - - - - - - - 33 - 28.445 - - - - - - - - - 131 - - - - 18 - 28.626 28.626 (67) Tires - - - - - - - - - - - - - - - - - - - - - - - - - 20.911 - - - - - - - - - - - - - - - 20.911 20.911 (68) Rubber and plastics - - - - - - - - - - - - - - - - - - - - - - - - - - 92.913 - - - - - - - - - - - - 14 - 92.927 92.927 (69) Glass and ceramics - - - - - - - - - - - - - - - - - - - - - - - - - - - 17.563 - - - - - - - - - - - - - 17.563 17.563 (70) Construction materials - - - - - - - - - - - - - - - - - - - - - - - - - - - - 47.005 - - - - - 140 - - - - 22 - 47.167 47.167 (71) Base metals - - - - - - - - - - - - - - - - - - - - - - - - - - - - - 76.105 - - - - 245 - - - - 22 - 76.373 76.373 (72) Electrical Goods - - - - - - - - - - - - - - - - - - - - - - - - - - - - - - 132.443 - - - - - - - - - - 132.443 132.443 (73) Transportation equipment - - - - - - - - - - - - - - - - - - - - - - - - - - - - - - - 32.334 - - - - - - - 39 - 32.373 32.373 (74) Other manufactures - - - - - - - - - - - - - - - - - - - - - - - - - - - - - - - - 107.544 - 623 - - - - - - 108.167 108.167 (75) Construction - - - - - - - - - - - - - - - - - - - - - - - - - - - - - - - - - 212.860 - - - - - - - 212.860 212.860 (76) Banking, finance and insurance - 5 - - - - - - - - - - - - - - - - - - - - - - - - - - - - - - - - 266.543 2.286 - 9 - 532 - 269.376 269.376 (77) Commerce, restaurants and hotels - - - - - - - - - - - - - - - - - - - - - - - - - - - - - - - - - - 14.164 837.666 - - - 1.187 - 853.017 853.017 (78) Transportation - - - - - - - - - - - - - - - - - - - - - - 1 - - - - - - - - - - - 1.031 3 422.271 - - 2.233 - 425.539 425.539 (79) Services - - - - - - - - 123 - - - - - - - - - - 1.048 - - 93 1.048 - - - - - - - - - - 6.794 153 - 565.995 - 1.013 - 576.268 576.268 (80) Electricity - - - - - - - - - - - - - - - - - - - - - - - - - - - - - - - - - - 62 - - - 97.399 2 - 97.463 97.463 (81) Real estate - - - - - - - - - - - - - - - - - - - - - - - - - - - - - - - - - - - - - - - 170.007 - 170.007 170.007 (82) Public administration services - 38 - - - - 54 3 28 - - - - - - - - - - - - - 28 - - - - - - - - - - - 390 1.011 2.566 3.423 931 1.179 146.014 155.664 155.664 (a ) SUBTOTAL 125.356 83.052 22.123 509 19.757 905 114.233 26.617 190.094 187.628 51.015 41.899 117.223 63.786 25.635 32.045 129.799 66.611 17.222 202.174 20.872 26.530 104.701 148.406 28.445 20.911 92.913 17.563 47.005 76.105 132.443 32.334 107.544 212.860 290.547 841.120 424.837 569.427 98.331 176.974 146.014 5.133.562 5.133.562
INCOME GENERATION (Value Added) Gross Domestic Product (GDP)(r ) Remuneration Wage Earners (Labor Factor) 33.947 34.681 8.367 369 8.138 499 20.774 5.144 37.037 16.746 5.703 5.527 5.761 4.172 7.324 5.381 18.553 11.222 2.526 51.287 5.523 8.672 19.350 21.413 4.276 3.160 17.919 3.557 9.783 10.266 28.780 9.228 20.626 77.531 87.033 230.881 70.592 299.115 21.042 9.742 103.408 1.345.053
URBAN LABOR Independent
(83) Self-employed - 343 258 - 272 - 136 161 530 34 338 - - - 875 - 2.851 - - 6.426 530 590 1.722 - - - 551 15 - - 2.452 69 2.687 8.823 11.793 29.984 10.492 17.227 - 1.458 - 100.618 530 101.148 (84) Employer - 148 78 - 475 - 407 221 45 - - - - - 1.227 - 399 182 - 652 219 545 - - - - 2.592 - 79 - 897 779 3.445 9.060 11.201 22.780 5.330 9.561 - 1.724 - 72.046 72.046
Wage Earner(85) Public Sector - - - - - - - - - - - - - - - - - 306 - - - - - 1.433 4.185 - - - - - - - - 1.885 18.996 - 5.611 123.631 11.419 - 69.770 237.235 930 238.164 (86) Firms 5.707 117 21 - 262 499 171 1.622 3.478 7.604 3.738 2.366 1.484 1.075 2.500 851 5.020 7.324 2.526 17.072 2.068 2.686 11.817 8.046 - 2.341 8.306 1.996 3.889 3.960 11.894 6.757 7.293 14.288 24.635 85.771 19.044 39.053 741 3.228 - 321.251 1.094 322.345 (87) Domestic help - - - - - - - - - - - - - - - - - - - - - - - - - - - - - - - - - - - - - 9.663 - - - 9.663 9.663
RURAL LABOR Independent
(88) Self-employed 175 11.115 2.996 159 3.770 - 5.850 1.049 10.758 126 - - 72 53 925 - 1.614 - - 3.585 237 1.326 - - - 441 - 124 - 825 209 64 1.474 14.549 6.320 25.925 11.235 12.242 - - - 117.217 76 117.293 (89) Employer 159 8.423 935 127 975 - 3.842 213 4.838 - - - - - 74 2.405 182 196 - 1.946 353 656 236 - - - - 297 592 - - - 692 5.392 1.131 17.698 2.047 5.354 - - - 58.764 58.764
Wage Earner(90) Public Sector - - - - - - - - - - - - - - - - - - - - - - - 806 91 - - - - - - - - 1.221 3.721 - 2.877 47.218 7.318 - 33.638 96.890 96.890 (91) Firms 27.906 14.535 4.079 82 2.384 - 10.368 1.879 17.388 8.982 1.627 3.161 4.204 3.045 1.723 2.124 8.488 3.215 - 21.606 2.117 2.868 5.574 11.128 1 377 6.471 1.125 5.222 5.481 13.327 1.558 5.035 22.312 9.234 48.724 13.957 22.413 1.564 3.333 - 318.615 686 319.302 (92) Domestic help - - - - - - - - - - - - - - - - - - - - - - - - - - - - - - - - - - - - - 12.753 - - - 12.753 12.753
(93) Other Taxes on Production 1.198 1.030 426 1 348 10 2.339 272 2.100 1.739 262 329 628 268 407 278 1.470 510 143 3.177 300 378 1.028 1.365 259 577 1.189 341 437 1.482 1.768 399 1.144 2.465 6.298 13.056 4.111 6.492 2.203 7.928 701 70.855 70.855 (94) Production Subsidies (-) - - - - - - - - - - - - - - - - - - - - - - (46) - - - - - - - - - - - - - - - - - - (46) (46) (95) Gross Earned Surplus (Capital Factor) 23.614 35.051 5.734 122 (5) (40) 34.363 13.420 78.960 28.666 12.429 11.022 15.281 7.055 3.746 895 30.043 23.464 2.003 9.274 852 2.859 20.132 32.197 (859) 4.249 9.701 3.082 6.497 10.388 8.455 2.921 6.910 18.507 104.208 291.639 161.536 121.582 47.320 117.115 (1.096) 1.303.294 1.303.294
PRIMARY INCOME RECIPIENT National Income of factor cost(96) WAGE EARNER HOUSEHOLD 12.760 9.168 236.477 318.327 9.475 14.947 7.478 96.369 315.921 12.504 330.049 1.363.475 (97) OTHER EMPLOYEE HOUSEHOLD 86.633 62.729 1.238 2.690 145 101.483 51.164 504 2.670 191 445.472 754.919 (98) OTHER HOUSEHOLD 736 149 42 717 44 863 122 17 711 57 15.827 19.285 (99) FIRMS Taxes on production net of subsidies 511.947 39.815 551.761
(100) GOVERNMENT 9.228 - - 112 33 - 1 (390) (9.656) 2.079 1.232 295 2.159 2.276 6.412 (345) 25.594 8.285 598 20.070 2.881 2.685 15.033 44.007 5.094 8.024 7.480 2.072 3.248 5.982 15.812 46.721 1.118 944 51 796 1.724 1.025 7.937 24.247 - 264.864 70.855 (46) 335.673 Indirect Business Tax - - - 111 - - - - - 2.481 1.056 955 - 2.568 626 258 6.478 5.908 165 3.370 1.311 946 3.933 19.913 4.355 2.691 1.337 974 2.681 2.713 7.341 21.315 1.802 - - - - - - - - 95.290 Products Tax 27.936 - - 1 33 - 1 5 - 82 3.327 23 2.159 33 5.881 89 21.753 2.394 440 17.694 2.190 2.456 11.615 26.167 739 5.385 7.170 1.420 592 3.867 8.973 25.764 0 944 51 796 1.926 1.025 7.937 24.247 - 215.115 Subsidies on Products (18.708) - - - - - - (396) (9.656) (485) (3.151) (683) - (325) (95) (692) (2.637) (17) (7) (994) (619) (717) (515) (2.072) - (52) (1.027) (322) (25) (599) (503) (358) (684) - - - (202) - - - - (45.541)
SECONDARY INCOME DISTRIBUTION Gross National Income(101) WAGE EARNER HOUSEHOLD 1.363.475 6.470 1.369.945 (102) OTHER EMPLOYEE HOUSEHOLD 754.919 8.855 763.774 (103) OTHER HOUSEHOLD 19.285 18.732 38.017 (104) FIRMS 452.756 43 452.798 (105) GOVERNMENT 335.673 10.370 346.043
INCOME USE Disposable Gross National Income(106) HOUSEHOLDS 1.369.945 763.774 24.377 2.158.097 (107) FIRMS 452.798 452.798 (108) GOVERNMENT 344.404 344.404
Gross Saving(109) CAPITAL ACCOUNT (10.788) 452.798 (45.682) 396.328
Imports Remuneration of employees to the Rest of the World Rent from property to rest of world Current transfers from property to rest of world Net Borrowing(110) REST OF WORLD - - - 1.183 20.949 - - 9.017 329 24.754 20.763 10.825 - 15.507 3.457 8.263 45.079 105.353 3.358 33.014 10.339 14.658 57.925 248.066 108.202 28.617 19.310 11.899 59.876 59.058 120.618 180.943 35.435 - 37.429 - 34.956 955 - 367 - 1.330.505 1.018 407 611 99.006 13.639 1.638 (143.311) 1.303.514
(t) TOTAL 141.951 83.052 22.123 1.805 41.360 905 118.226 46.060 205.928 273.511 78.201 65.941 120.576 103.411 43.778 49.196 239.535 201.820 26.374 294.570 38.941 51.508 206.272 527.032 162.425 72.654 153.138 35.697 126.321 168.783 304.163 333.712 154.782 213.804 328.028 232.444 435.628 571.407 106.267 201.588 146.014 6.728.932 0 (0) 125.356 83.009 22.123 509 19.757 905 114.180 26.614 189.942 187.657 51.198 41.910 117.223 63.786 25.686 32.045 129.976 66.612 17.261 201.658 20.880 26.542 104.600 147.390 28.626 20.911 92.927 17.563 47.167 76.373 132.443 32.373 108.167 212.860 269.376 853.017 425.539 576.268 97.463 170.007 155.664 5.133.562 101.148 72.046 238.164 322.345 9.663 117.293 58.764 96.890 319.302 12.753 70.855 (46) 1.303.294 1.363.475 754.919 19.285 551.761 335.673 1.369.945 763.774 38.017 452.798 346.043 2.158.097 452.798 344.404 396.328 1.303.514
Remuneration of employees to the Rest of the World
Rent from property to rest of world
Current transfers from property to rest of world
ACCOUNTS
Meat and dairy
products
Fish canning Edible oils
Staple grains Bananas
Coffee beans
Sugar cane
Coffee processing
Cocoa beans,
unroasted and roasted
Tobacco Livestock Forestry, fisheries
Other agricultural
products
Milling of grains
Tobacco products
Textiles and garments
Leather goods and footwear
Timber and
furniture
Paper and printing
Bakery products Sugar
Other manufactured products
Beverages Base metals Electrical
Goods Chemicals Oil
refineries Tires Rubber and
plastics Glass and ceramics
Construction materials
Public administration services
SUBTOTAL
DISTRIBUTION MARGIN
Commerce, restaurants and hotels
Transportation Services Electricity
Internalization costs
Transportation and
Trade Margins
Real estate Transportat
ion equipment
Other manufacture
s Construction
Banking, finance and insurance
Cocoa beans,
unroasted and
roasted
Staple grains Bananas
Coffee beans
Sugar cane Tobacco Livestock
Forestry, fisheries
Other agricultural
products
Meat and dairy
products
Fish canning Edible oils
Coffee processing
Milling of grains
Bakery products Sugar
Other manufactured products
Beverages Tobacco products
Textiles and garments
Leather goods and footwear
Timber and furniture
Paper and printing Chemicals
Oil refineries Tires
Rubber and
plastics
Glass and ceramics
Construction materials
Base metals
Electrical Goods
Transportation
equipment
Other manufacture
s Construction
Banking, finance and insurance
Commercerestaurants and hotels
Transportation Services
INDEPENDENT WAGE EARNER
Electricity Real estate Public
administration services
SUBTOTALEmployer
Domestic help
INDEPENDENT WAGE EARNER
SECONDARY INCOME DISTRIBUTION
Other Taxes on
Production
Production Subsidies
Gross Earned Surplus (Capital Factor)
PRIMARY INCOME RECIPIENT
Domestic help
URBAN RURAL
Public Sector
HOUSEHOLDS FIRMS
GOVERNMENT
CAPITAL ACCOUNT
Source: IICA. Based on data from the SAM of Costa Rica for 1997(IICA)
'WAGE EARNER
HOUSEHOLD
OTHER EMPLOYEE HOUSEHOL
D
OTHER EMPLOYEE HOUSEHOL
DFirmsSelf-employed Self-employed EmployerFirms Public Sector
Table 12B. Social Accounting Matrix for Costa Rica, 1997. Millions of colonesOTHER
HOUSEHOLD
FIRMSGOVERNMEN
TOTHER
HOUSEHOLD FIRMSGOVERNMEN
T
'WAGE EARNER
HOUSEHOLD
REST OF WORLD TOTAL

ANNEX CDisaggregation of Gross Output for Costa Rica, by Destination and Cost

Intermediate Consumption
Private Consumption Investment Government
Consumption ExportsImports +
Distribution margin
Taxes Gross Output
Banana 28,8 4,7 - - 576,2 31,6 39,6 538,4 Coffee beans 353,8 - 2,9 - - - - 356,7 Sugar Cane 82,6 - 12,5 - - - - 95,0 Cocoa Beans and Toast 7,5 - - - 0,2 5,1 0,5 2,2 Staple grains 152,1 23,2 2,2 - 0,1 92,6 0,1 84,9 Unprocessed tobacco 0,1 - - - 3,8 - - 3,9 Livestock 473,3 72,2 (37,9) - 0,3 17,1 0,0 490,7 Forestry and Fishing 147,6 35,3 - - 14,8 85,2 (1,7) 114,3 Other Agricultural Products 178,9 144,5 73,5 - 487,6 109,5 (41,5) 816,5 TOTAL PRIMARY AGRICULTURE 1.424,7 279,9 53,1 - 1.083,0 341,2 (2,9) 2.502,6
Meat and Dairy Products 208,2 933,6 (24,5) - 57,5 360,0 8,9 805,9 Fish, crustaceous and others sea products 87,4 89,3 (0,5) - 159,7 111,5 5,3 219,1 Vegetable and Animal Oils and Fats 61,5 183,7 (12,3) - 50,3 102,0 1,3 180,0 Green Coffee 46,4 34,2 18,4 - 419,0 5,1 9,3 503,5 Milling, excluding coffee processing 162,9 274,2 (3,4) - 10,4 160,4 9,8 274,0 Bakery Products 11,7 157,8 (1,1) - 19,6 50,4 27,5 110,1 Sugar 60,8 98,8 0,5 - 51,2 75,1 (1,5) 137,6 Beverages 638,1 221,7 (0,3) - 7,4 545,2 35,6 286,1 TOTAL FOOD INDUSTRY 1.277,1 1.993,3 (23,2) - 775,1 1.409,7 96,2 2.516,3
Other Manufactured Products 254,5 583,8 (15,3) - 205,8 361,4 109,9 557,5 Tobacco (cigarettes) 16,7 93,6 0,6 - 2,4 36,7 2,6 74,0 Textiles and garments 199,5 474,9 18,2 - 572,7 310,7 86,2 868,4 Textiles and garments 39,5 58,8 (1,5) - 70,5 65,2 12,4 89,6 Timber and Furniture 89,0 65,9 16,6 - 49,7 95,8 11,5 114,0 Paper and Printing 478,8 311,7 36,8 - 58,6 371,7 64,6 449,7 TOTAL AGROINDUSTRY 1.078,0 1.588,7 55,4 - 959,7 1.241,5 287,2 2.153,2 TOTAL AGRICULTURE AND AGRIFOOD 3.779,8 3.861,9 85,3 - 2.817,8 2.992,3 380,5 7.172,0
Chemicals 1.355,4 702,3 0,1 - 205,9 1.437,2 189,0 637,4 Oil refining (gasoline, diesel, etc,) 507,0 170,8 0,3 - 19,5 553,6 21,9 122,2 Tires 90,2 144,5 52,8 - 24,6 187,8 34,5 89,8 Rubber and Plastic Products 332,2 192,4 28,4 - 104,8 226,5 32,1 399,1 Glass and Ceramic Products 53,0 38,1 14,2 - 48,1 69,0 8,9 75,4 Clay products for construction 466,7 37,3 24,0 - 14,5 326,7 14,0 201,9 Base metals 435,4 103,8 83,2 - 102,5 372,4 25,7 326,9 Electrical Goods 306,0 240,8 384,7 - 374,9 669,7 67,9 568,9 Transportation Equipment 91,7 691,5 572,9 - 77,2 1.093,8 200,7 138,9 Other Manufactures 47,9 114,6 139,1 - 363,3 198,1 4,8 461,9 Construction 29,1 - 889,2 - - - 4,1 914,3 Financial Services and Insurance 1.118,0 138,2 43,6 - 109,1 160,8 0,2 1.247,9 Trade, Restaurants and Hotels 110,5 379,0 - - 508,9 (2.617,8) 3,4 3.612,7 Transportation, Storage and Communications 830,0 652,7 - - 388,4 38,9 7,4 1.824,7 Social, Communal and Personal Services 358,9 976,3 - 1.056,2 62,9 4,1 4,4 2.445,8 Electricity 243,4 213,0 - - - - 34,1 422,3 Real State Services 215,0 650,7 - - 0,1 1,6 104,1 760,1 Public Administration Services - 7,8 - 619,3 - - - 627,2 TOTAL REST ECONOMY 6.590,5 5.453,8 2.232,5 1.675,5 2.404,7 2.722,4 757,2 14.877,5 TOTAL 10.370,3 9.315,7 2.317,8 1.675,5 5.222,5 5.714,7 1.137,6 22.049,5 Source: IICA. Based on data from the SAM of Costa Rica for 1997(IICA)
Table 1CCosta Rica: Use made of the Gross Output by sector, millions of colones, 1997

Intermediate Consumption
Private Consumption Investment Government
Consumption ExportsImports +
Distribution margin
Taxes Gross Output
Banana 5,3% 0,9% 0,0% 0,0% 107,0% 5,9% 7,4% 100,0%Coffee beans 99,2% 0,0% 0,8% 0,0% 0,0% 0,0% 0,0% 100,0%Sugar Cane 86,9% 0,0% 13,1% 0,0% 0,0% 0,0% 0,0% 100,0%Cocoa Beans and Toast 345,0% 0,0% 0,0% 0,0% 9,8% 232,7% 22,1% 100,0%Staple grains 179,3% 27,3% 2,6% 0,0% 0,2% 109,2% 0,2% 100,0%Unprocessed tobacco 2,6% 0,0% 0,0% 0,0% 97,4% 0,0% 0,0% 100,0%Livestock 96,5% 14,7% -7,7% 0,0% 0,1% 3,5% 0,0% 100,0%Forestry and Fishing 129,1% 30,9% 0,0% 0,0% 13,0% 74,5% -1,5% 100,0%Other Agricultural Products 21,9% 17,7% 9,0% 0,0% 59,7% 13,4% -5,1% 100,0%TOTAL PRIMARY AGRICULTURE 56,9% 11,2% 2,1% 0,0% 43,3% 13,6% -0,1% 100,0%
Meat and Dairy Products 25,8% 115,8% -3,0% 0,0% 7,1% 44,7% 1,1% 100,0%Fish, crustaceous and others sea products 39,9% 40,8% -0,2% 0,0% 72,9% 50,9% 2,4% 100,0%Vegetable and Animal Oils and Fats 34,1% 102,1% -6,8% 0,0% 28,0% 56,7% 0,7% 100,0%Green Coffee 9,2% 6,8% 3,6% 0,0% 83,2% 1,0% 1,8% 100,0%Milling, excluding coffee processing 59,5% 100,1% -1,2% 0,0% 3,8% 58,6% 3,6% 100,0%Bakery Products 10,7% 143,3% -1,0% 0,0% 17,8% 45,8% 25,0% 100,0%Sugar 44,2% 71,8% 0,4% 0,0% 37,2% 54,6% -1,1% 100,0%Beverages 223,0% 77,5% -0,1% 0,0% 2,6% 190,5% 12,4% 100,0%TOTAL FOOD INDUSTRY 50,8% 79,2% -0,9% 0,0% 30,8% 56,0% 3,8% 100,0%
Other Manufactured Products 45,7% 104,7% -2,7% 0,0% 36,9% 64,8% 19,7% 100,0%Tobacco (cigarettes) 22,6% 126,5% 0,8% 0,0% 3,3% 49,7% 3,5% 100,0%Textiles and garments 23,0% 54,7% 2,1% 0,0% 65,9% 35,8% 9,9% 100,0%Textiles and garments 44,0% 65,5% -1,7% 0,0% 78,7% 72,8% 13,8% 100,0%Timber and Furniture 78,1% 57,8% 14,6% 0,0% 43,6% 84,0% 10,1% 100,0%Paper and Printing 106,5% 69,3% 8,2% 0,0% 13,0% 82,7% 14,4% 100,0%TOTAL AGROINDUSTRY 50,1% 73,8% 2,6% 0,0% 44,6% 57,7% 13,3% 100,0%
TOTAL AGRICULTURE AND AGRIFOOD 52,7% 53,8% 1,2% 0,0% 39,3% 41,7% 5,3% 100,0%
Chemicals 212,6% 110,2% 0,0% 0,0% 32,3% 225,5% 29,7% 100,0% Oil refining (gasoline, diesel, etc,) 415,0% 139,8% 0,3% 0,0% 15,9% 453,1% 17,9% 100,0% Tires 100,4% 160,9% 58,7% 0,0% 27,4% 209,1% 38,4% 100,0% Rubber and Plastic Products 83,2% 48,2% 7,1% 0,0% 26,3% 56,8% 8,1% 100,0% Glass and Ceramic Products 70,2% 50,5% 18,8% 0,0% 63,7% 91,5% 11,8% 100,0% Clay products for construction 231,2% 18,5% 11,9% 0,0% 7,2% 161,8% 6,9% 100,0% Base metals 133,2% 31,8% 25,5% 0,0% 31,4% 113,9% 7,9% 100,0% Electrical Goods 53,8% 42,3% 67,6% 0,0% 65,9% 117,7% 11,9% 100,0% Transportation Equipment 66,1% 497,9% 412,5% 0,0% 55,6% 787,6% 144,5% 100,0% Other Manufactures 10,4% 24,8% 30,1% 0,0% 78,6% 42,9% 1,0% 100,0% Construction 3,2% 0,0% 97,3% 0,0% 0,0% 0,0% 0,4% 100,0% Financial Services and Insurance 89,6% 11,1% 3,5% 0,0% 8,7% 12,9% 0,0% 100,0% Trade, Restaurants and Hotels 3,1% 10,5% 0,0% 0,0% 14,1% -72,5% 0,1% 100,0% Transportation, Storage and Communications 45,5% 35,8% 0,0% 0,0% 21,3% 2,1% 0,4% 100,0% Social, Communal and Personal Services 14,7% 39,9% 0,0% 43,2% 2,6% 0,2% 0,2% 100,0% Electricity 57,6% 50,4% 0,0% 0,0% 0,0% 0,0% 8,1% 100,0% Real State Services 28,3% 85,6% 0,0% 0,0% 0,0% 0,2% 13,7% 100,0% Public Administration Services 0,0% 1,3% 0,0% 98,7% 0,0% 0,0% 0,0% 100,0%TOTAL REST ECONOMY 44,3% 36,7% 15,0% 11,3% 16,2% 18,3% 5,1% 100,0%
TOTAL 47,0% 42,2% 10,5% 7,6% 23,7% 25,9% 5,2% 100,0%Source: IICA. Based on data from the SAM of Costa Rica for 1997(IICA)
Table 2C.Costa Rica: Use made of the Gross Output in percentages by sector, 1997

Intermediate Inputs Skilled Labor Unskilled Labor Indirect Business
Tax Capital TOTAL
Banana 286,0 24,5 121,3 5,1 101,4 538,4 Coffee beans 52,6 2,6 146,3 4,4 150,6 356,5 Sugar Cane 32,6 1,5 34,4 1,8 24,6 95,0 Cocoa Beans and Toast 0,1 - 1,6 0,0 0,5 2,2 Staple grains 48,4 4,3 30,6 1,5 (0,0) 84,9 Unprocessed tobacco 1,9 2,1 - 0,0 (0,2) 3,9 Livestock 243,6 3,1 86,2 10,0 147,6 490,4 Forestry and Fishing 33,4 8,6 13,5 1,2 57,6 114,3 Other Agricultural Products 308,6 17,4 141,7 9,0 339,1 815,8 TOTAL PRIMARY AGRICULTURE 1.007,2 64,2 575,6 33,2 821,3 2.501,5
Meat and Dairy Products 603,5 32,8 39,1 7,5 123,1 806,0 Fish, crustaceous and others sea products 140,9 17,5 7,0 1,1 53,4 219,9 Vegetable and Animal Oils and Fats 107,5 10,2 13,6 1,4 47,3 180,0 Green Coffee 410,4 6,4 18,4 2,7 65,6 503,5 Milling, excluding coffee processing 224,6 4,6 13,3 1,2 30,3 274,0 Bakery Products 61,0 19,8 11,7 1,7 16,1 110,3 Sugar 109,5 3,7 19,5 1,2 3,8 137,6 Beverages 134,9 33,6 14,6 2,2 100,8 286,1 TOTAL FOOD INDUSTRY 1.792,4 128,4 137,1 19,0 440,5 2.517,5
Other Manufactured Products 343,2 35,5 44,2 6,3 129,0 558,3 Tobacco (cigarettes) 54,1 10,9 - 0,6 8,6 74,1 Textiles and garments 592,4 103,7 116,6 13,6 39,8 866,2 Textiles and garments 61,0 12,1 11,6 1,3 3,7 89,7 Timber and Furniture 62,9 16,4 20,8 1,6 12,3 114,0 Paper and Printing 275,5 58,2 25,0 4,2 86,5 449,3 TOTAL AGROINDUSTRY 1.389,0 236,8 218,1 27,7 279,9 2.151,5 TOTAL AGRICULTURE AND AGRIFOOD 4.188,6 429,4 930,9 79,9 1.541,7 7.170,5
Chemicals 396,9 40,7 51,3 5,9 138,3 633,1 Oil refining (gasoline, diesel, etc,) 107,2 18,0 0,4 1,1 (3,7) 123,0 Tires 55,5 10,1 3,5 2,5 18,2 89,8 Rubber and Plastic Products 275,4 49,2 27,8 5,1 41,7 399,1 Glass and Ceramic Products 45,5 8,6 6,6 1,5 13,2 75,4 Clay products for construction 130,8 17,0 25,0 1,9 27,9 202,6 Base metals 233,0 17,0 27,1 6,4 44,6 328,0 Electrical Goods 401,3 65,5 58,1 7,6 36,3 568,9 Transportation Equipment 85,2 32,7 7,0 1,7 12,5 139,0 Other Manufactures 341,4 57,7 30,9 4,9 29,7 464,6 Construction 491,2 146,3 186,7 10,6 79,5 914,3 Financial Services and Insurance 308,6 286,2 87,7 27,1 447,6 1.157,0 Trade, Restaurants and Hotels 1.363,5 595,0 396,6 56,1 1.252,6 3.663,8 Transportation, Storage and Communications 813,1 173,9 129,3 17,7 693,8 1.827,8 Social, Communal and Personal Services 640,3 855,3 429,4 27,9 522,2 2.475,2 Electricity 115,5 52,2 38,1 9,5 203,2 418,6 Real State Services 151,3 27,5 14,3 34,1 503,0 730,2 Public Administration Services 226,1 299,7 144,5 3,0 (4,7) 668,6 TOTAL REST ECONOMY 6.181,7 2.752,5 1.664,4 224,3 4.056,1 14.879,0 TOTAL 10.370,3 3.181,9 2.595,3 304,1 5.597,9 22.049,5 Source: IICA. Based on data from the SAM of Costa Rica for 1997(IICA)
Table 3CCosta Rica: Cost of the Gross Output by sector, millions of colones, 1997
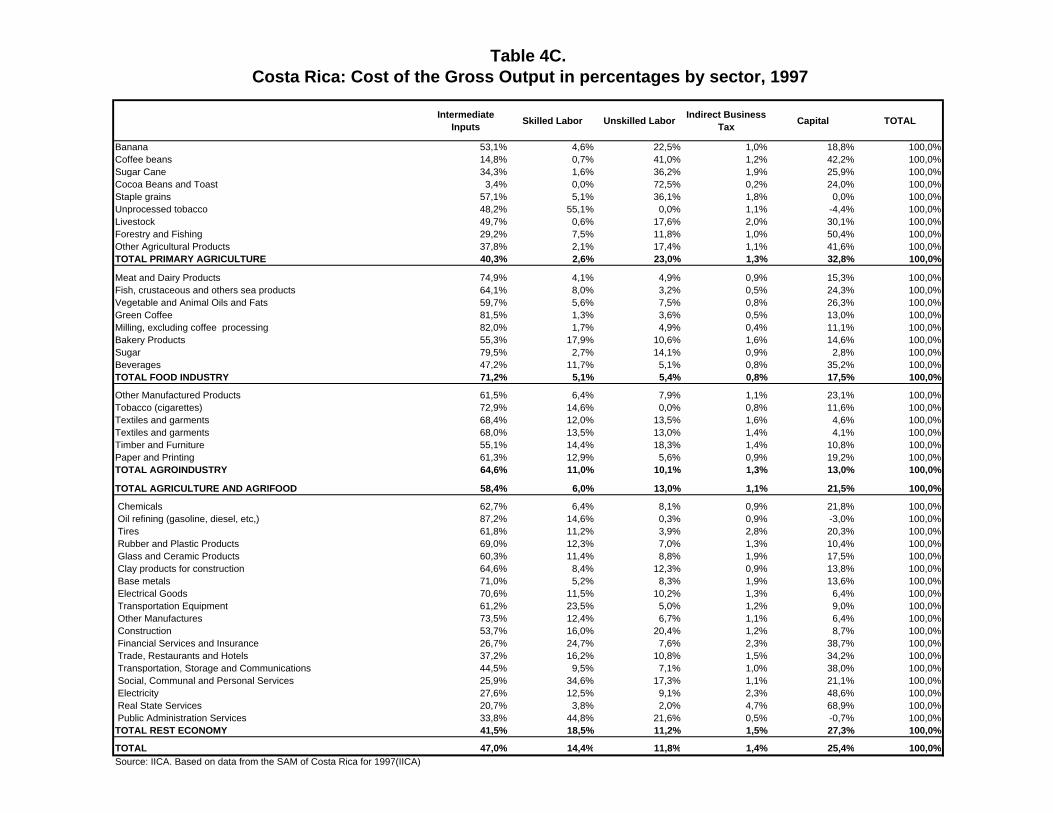
Intermediate Inputs Skilled Labor Unskilled Labor Indirect Business
Tax Capital TOTAL
Banana 53,1% 4,6% 22,5% 1,0% 18,8% 100,0%Coffee beans 14,8% 0,7% 41,0% 1,2% 42,2% 100,0%Sugar Cane 34,3% 1,6% 36,2% 1,9% 25,9% 100,0%Cocoa Beans and Toast 3,4% 0,0% 72,5% 0,2% 24,0% 100,0%Staple grains 57,1% 5,1% 36,1% 1,8% 0,0% 100,0%Unprocessed tobacco 48,2% 55,1% 0,0% 1,1% -4,4% 100,0%Livestock 49,7% 0,6% 17,6% 2,0% 30,1% 100,0%Forestry and Fishing 29,2% 7,5% 11,8% 1,0% 50,4% 100,0%Other Agricultural Products 37,8% 2,1% 17,4% 1,1% 41,6% 100,0%TOTAL PRIMARY AGRICULTURE 40,3% 2,6% 23,0% 1,3% 32,8% 100,0%
Meat and Dairy Products 74,9% 4,1% 4,9% 0,9% 15,3% 100,0%Fish, crustaceous and others sea products 64,1% 8,0% 3,2% 0,5% 24,3% 100,0%Vegetable and Animal Oils and Fats 59,7% 5,6% 7,5% 0,8% 26,3% 100,0%Green Coffee 81,5% 1,3% 3,6% 0,5% 13,0% 100,0%Milling, excluding coffee processing 82,0% 1,7% 4,9% 0,4% 11,1% 100,0%Bakery Products 55,3% 17,9% 10,6% 1,6% 14,6% 100,0%Sugar 79,5% 2,7% 14,1% 0,9% 2,8% 100,0%Beverages 47,2% 11,7% 5,1% 0,8% 35,2% 100,0%TOTAL FOOD INDUSTRY 71,2% 5,1% 5,4% 0,8% 17,5% 100,0%
Other Manufactured Products 61,5% 6,4% 7,9% 1,1% 23,1% 100,0%Tobacco (cigarettes) 72,9% 14,6% 0,0% 0,8% 11,6% 100,0%Textiles and garments 68,4% 12,0% 13,5% 1,6% 4,6% 100,0%Textiles and garments 68,0% 13,5% 13,0% 1,4% 4,1% 100,0%Timber and Furniture 55,1% 14,4% 18,3% 1,4% 10,8% 100,0%Paper and Printing 61,3% 12,9% 5,6% 0,9% 19,2% 100,0%TOTAL AGROINDUSTRY 64,6% 11,0% 10,1% 1,3% 13,0% 100,0%
TOTAL AGRICULTURE AND AGRIFOOD 58,4% 6,0% 13,0% 1,1% 21,5% 100,0%
Chemicals 62,7% 6,4% 8,1% 0,9% 21,8% 100,0% Oil refining (gasoline, diesel, etc,) 87,2% 14,6% 0,3% 0,9% -3,0% 100,0% Tires 61,8% 11,2% 3,9% 2,8% 20,3% 100,0% Rubber and Plastic Products 69,0% 12,3% 7,0% 1,3% 10,4% 100,0% Glass and Ceramic Products 60,3% 11,4% 8,8% 1,9% 17,5% 100,0% Clay products for construction 64,6% 8,4% 12,3% 0,9% 13,8% 100,0% Base metals 71,0% 5,2% 8,3% 1,9% 13,6% 100,0% Electrical Goods 70,6% 11,5% 10,2% 1,3% 6,4% 100,0% Transportation Equipment 61,2% 23,5% 5,0% 1,2% 9,0% 100,0% Other Manufactures 73,5% 12,4% 6,7% 1,1% 6,4% 100,0% Construction 53,7% 16,0% 20,4% 1,2% 8,7% 100,0% Financial Services and Insurance 26,7% 24,7% 7,6% 2,3% 38,7% 100,0% Trade, Restaurants and Hotels 37,2% 16,2% 10,8% 1,5% 34,2% 100,0% Transportation, Storage and Communications 44,5% 9,5% 7,1% 1,0% 38,0% 100,0% Social, Communal and Personal Services 25,9% 34,6% 17,3% 1,1% 21,1% 100,0% Electricity 27,6% 12,5% 9,1% 2,3% 48,6% 100,0% Real State Services 20,7% 3,8% 2,0% 4,7% 68,9% 100,0% Public Administration Services 33,8% 44,8% 21,6% 0,5% -0,7% 100,0%TOTAL REST ECONOMY 41,5% 18,5% 11,2% 1,5% 27,3% 100,0%
TOTAL 47,0% 14,4% 11,8% 1,4% 25,4% 100,0%Source: IICA. Based on data from the SAM of Costa Rica for 1997(IICA)
Table 4C. Costa Rica: Cost of the Gross Output in percentages by sector, 1997

ANNEX DSAM Multipliers by Country
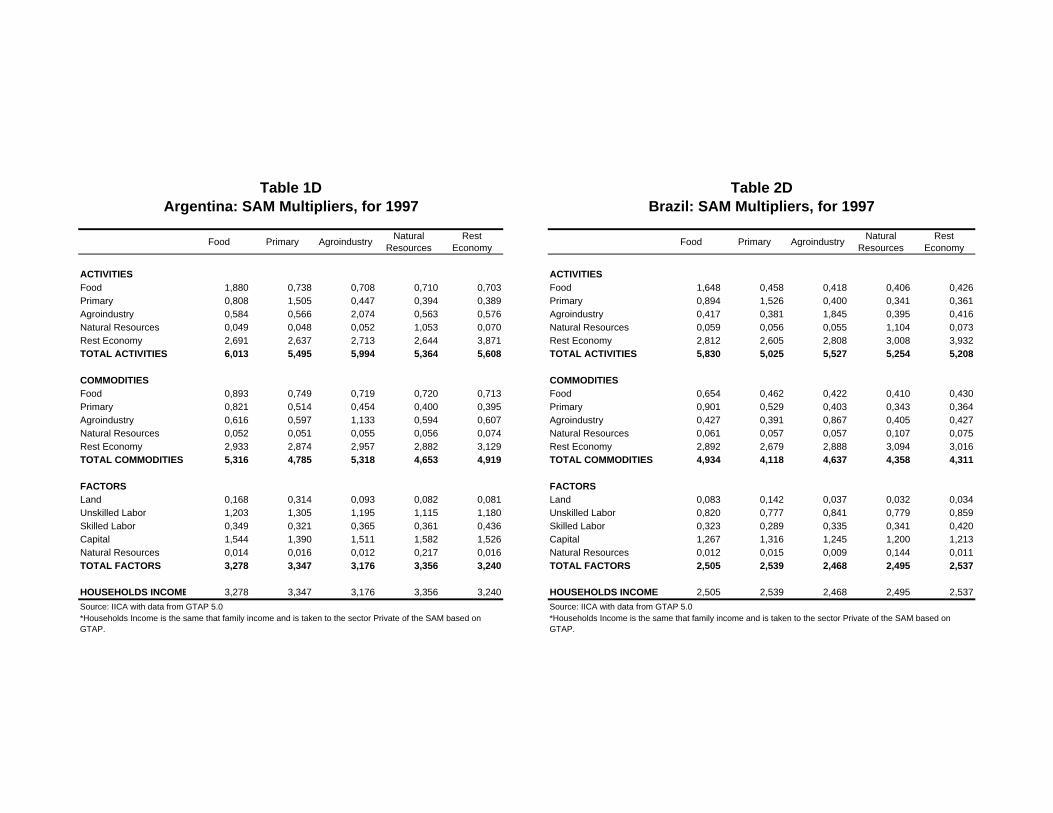
Food Primary Agroindustry Natural Resources
Rest Economy Food Primary Agroindustry Natural
ResourcesRest
Economy
ACTIVITIES ACTIVITIESFood 1,880 0,738 0,708 0,710 0,703 Food 1,648 0,458 0,418 0,406 0,426Primary 0,808 1,505 0,447 0,394 0,389 Primary 0,894 1,526 0,400 0,341 0,361Agroindustry 0,584 0,566 2,074 0,563 0,576 Agroindustry 0,417 0,381 1,845 0,395 0,416Natural Resources 0,049 0,048 0,052 1,053 0,070 Natural Resources 0,059 0,056 0,055 1,104 0,073Rest Economy 2,691 2,637 2,713 2,644 3,871 Rest Economy 2,812 2,605 2,808 3,008 3,932TOTAL ACTIVITIES 6,013 5,495 5,994 5,364 5,608 TOTAL ACTIVITIES 5,830 5,025 5,527 5,254 5,208
COMMODITIES COMMODITIESFood 0,893 0,749 0,719 0,720 0,713 Food 0,654 0,462 0,422 0,410 0,430Primary 0,821 0,514 0,454 0,400 0,395 Primary 0,901 0,529 0,403 0,343 0,364Agroindustry 0,616 0,597 1,133 0,594 0,607 Agroindustry 0,427 0,391 0,867 0,405 0,427Natural Resources 0,052 0,051 0,055 0,056 0,074 Natural Resources 0,061 0,057 0,057 0,107 0,075Rest Economy 2,933 2,874 2,957 2,882 3,129 Rest Economy 2,892 2,679 2,888 3,094 3,016TOTAL COMMODITIES 5,316 4,785 5,318 4,653 4,919 TOTAL COMMODITIES 4,934 4,118 4,637 4,358 4,311
FACTORS FACTORSLand 0,168 0,314 0,093 0,082 0,081 Land 0,083 0,142 0,037 0,032 0,034Unskilled Labor 1,203 1,305 1,195 1,115 1,180 Unskilled Labor 0,820 0,777 0,841 0,779 0,859Skilled Labor 0,349 0,321 0,365 0,361 0,436 Skilled Labor 0,323 0,289 0,335 0,341 0,420Capital 1,544 1,390 1,511 1,582 1,526 Capital 1,267 1,316 1,245 1,200 1,213Natural Resources 0,014 0,016 0,012 0,217 0,016 Natural Resources 0,012 0,015 0,009 0,144 0,011TOTAL FACTORS 3,278 3,347 3,176 3,356 3,240 TOTAL FACTORS 2,505 2,539 2,468 2,495 2,537
HOUSEHOLDS INCOME 3,278 3,347 3,176 3,356 3,240 HOUSEHOLDS INCOME* 2,505 2,539 2,468 2,495 2,537Source: IICA with data from GTAP 5.0 Source: IICA with data from GTAP 5.0
Argentina: SAM Multipliers, for 1997 Brazil: SAM Multipliers, for 1997Table 1D Table 2D
*Households Income is the same that family income and is taken to the sector Private of the SAM based on GTAP.
*Households Income is the same that family income and is taken to the sector Private of the SAM based on GTAP.
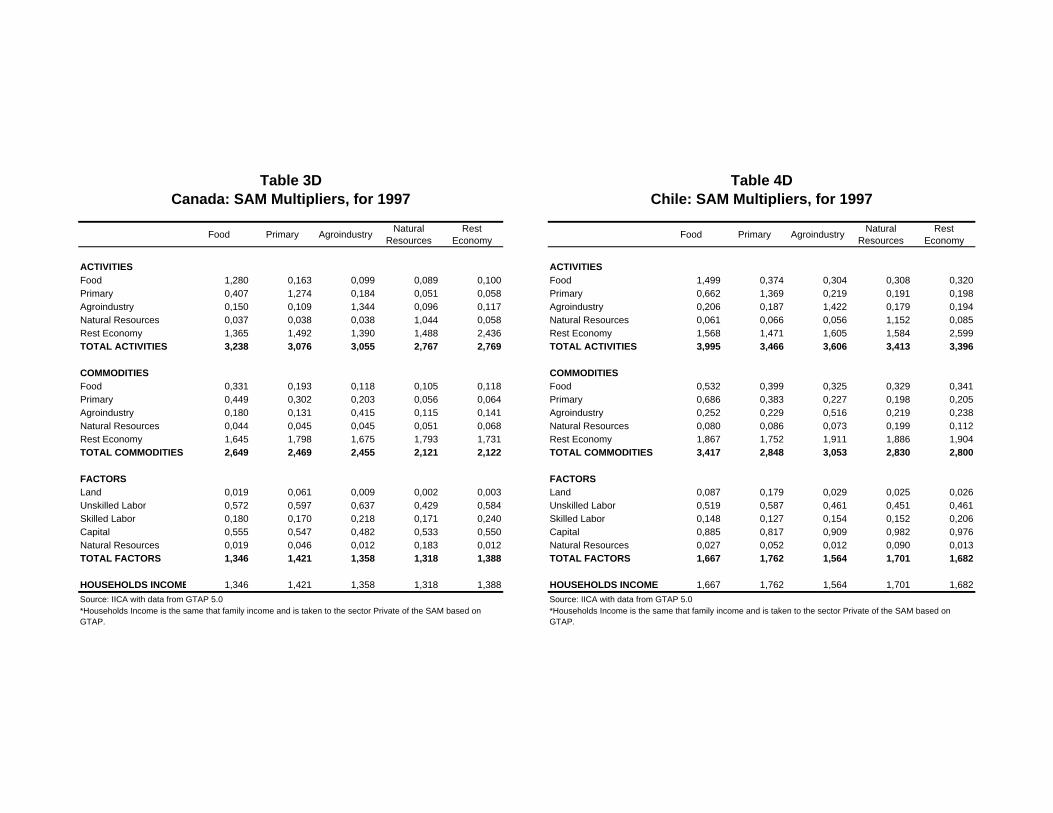
Food Primary Agroindustry Natural Resources
Rest Economy Food Primary Agroindustry Natural
ResourcesRest
Economy
ACTIVITIES ACTIVITIESFood 1,280 0,163 0,099 0,089 0,100 Food 1,499 0,374 0,304 0,308 0,320Primary 0,407 1,274 0,184 0,051 0,058 Primary 0,662 1,369 0,219 0,191 0,198Agroindustry 0,150 0,109 1,344 0,096 0,117 Agroindustry 0,206 0,187 1,422 0,179 0,194Natural Resources 0,037 0,038 0,038 1,044 0,058 Natural Resources 0,061 0,066 0,056 1,152 0,085Rest Economy 1,365 1,492 1,390 1,488 2,436 Rest Economy 1,568 1,471 1,605 1,584 2,599TOTAL ACTIVITIES 3,238 3,076 3,055 2,767 2,769 TOTAL ACTIVITIES 3,995 3,466 3,606 3,413 3,396
COMMODITIES COMMODITIESFood 0,331 0,193 0,118 0,105 0,118 Food 0,532 0,399 0,325 0,329 0,341Primary 0,449 0,302 0,203 0,056 0,064 Primary 0,686 0,383 0,227 0,198 0,205Agroindustry 0,180 0,131 0,415 0,115 0,141 Agroindustry 0,252 0,229 0,516 0,219 0,238Natural Resources 0,044 0,045 0,045 0,051 0,068 Natural Resources 0,080 0,086 0,073 0,199 0,112Rest Economy 1,645 1,798 1,675 1,793 1,731 Rest Economy 1,867 1,752 1,911 1,886 1,904TOTAL COMMODITIES 2,649 2,469 2,455 2,121 2,122 TOTAL COMMODITIES 3,417 2,848 3,053 2,830 2,800
FACTORS FACTORSLand 0,019 0,061 0,009 0,002 0,003 Land 0,087 0,179 0,029 0,025 0,026Unskilled Labor 0,572 0,597 0,637 0,429 0,584 Unskilled Labor 0,519 0,587 0,461 0,451 0,461Skilled Labor 0,180 0,170 0,218 0,171 0,240 Skilled Labor 0,148 0,127 0,154 0,152 0,206Capital 0,555 0,547 0,482 0,533 0,550 Capital 0,885 0,817 0,909 0,982 0,976Natural Resources 0,019 0,046 0,012 0,183 0,012 Natural Resources 0,027 0,052 0,012 0,090 0,013TOTAL FACTORS 1,346 1,421 1,358 1,318 1,388 TOTAL FACTORS 1,667 1,762 1,564 1,701 1,682
HOUSEHOLDS INCOME 1,346 1,421 1,358 1,318 1,388 HOUSEHOLDS INCOME* 1,667 1,762 1,564 1,701 1,682Source: IICA with data from GTAP 5.0 Source: IICA with data from GTAP 5.0
Canada: SAM Multipliers, for 1997 Chile: SAM Multipliers, for 1997Table 3D Table 4D
*Households Income is the same that family income and is taken to the sector Private of the SAM based on GTAP.
*Households Income is the same that family income and is taken to the sector Private of the SAM based on GTAP.
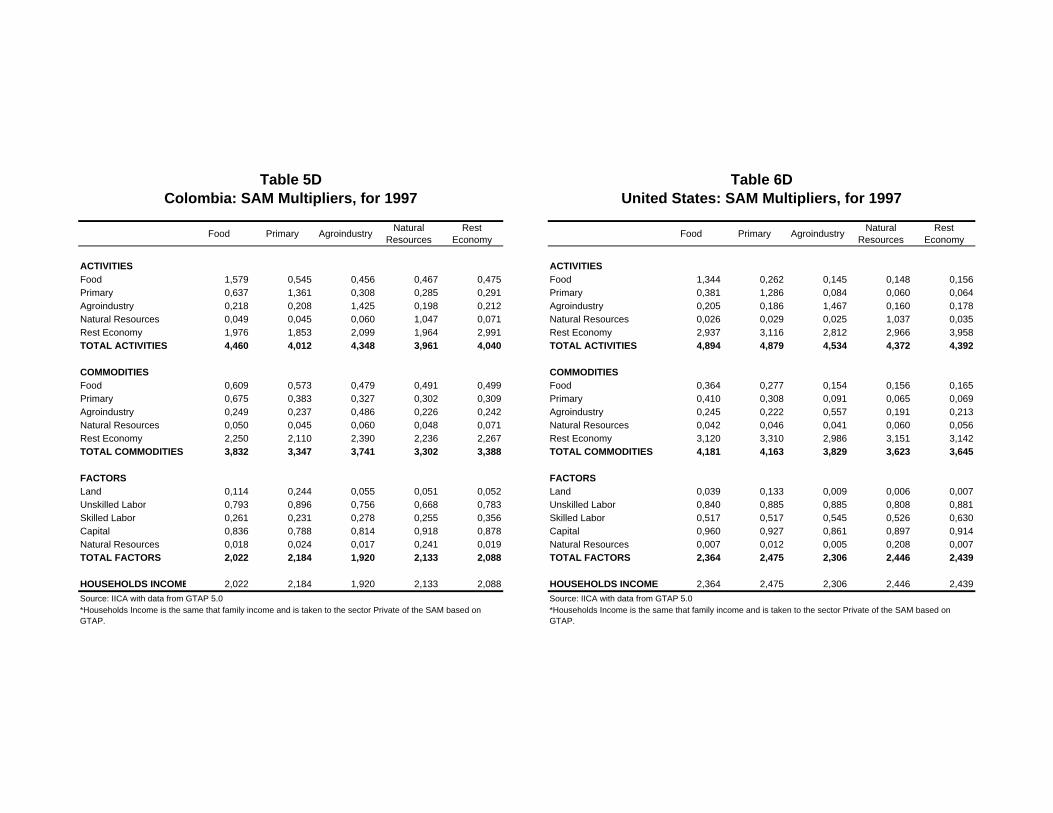
Food Primary Agroindustry Natural Resources
Rest Economy Food Primary Agroindustry Natural
ResourcesRest
Economy
ACTIVITIES ACTIVITIESFood 1,579 0,545 0,456 0,467 0,475 Food 1,344 0,262 0,145 0,148 0,156Primary 0,637 1,361 0,308 0,285 0,291 Primary 0,381 1,286 0,084 0,060 0,064Agroindustry 0,218 0,208 1,425 0,198 0,212 Agroindustry 0,205 0,186 1,467 0,160 0,178Natural Resources 0,049 0,045 0,060 1,047 0,071 Natural Resources 0,026 0,029 0,025 1,037 0,035Rest Economy 1,976 1,853 2,099 1,964 2,991 Rest Economy 2,937 3,116 2,812 2,966 3,958TOTAL ACTIVITIES 4,460 4,012 4,348 3,961 4,040 TOTAL ACTIVITIES 4,894 4,879 4,534 4,372 4,392
COMMODITIES COMMODITIESFood 0,609 0,573 0,479 0,491 0,499 Food 0,364 0,277 0,154 0,156 0,165Primary 0,675 0,383 0,327 0,302 0,309 Primary 0,410 0,308 0,091 0,065 0,069Agroindustry 0,249 0,237 0,486 0,226 0,242 Agroindustry 0,245 0,222 0,557 0,191 0,213Natural Resources 0,050 0,045 0,060 0,048 0,071 Natural Resources 0,042 0,046 0,041 0,060 0,056Rest Economy 2,250 2,110 2,390 2,236 2,267 Rest Economy 3,120 3,310 2,986 3,151 3,142TOTAL COMMODITIES 3,832 3,347 3,741 3,302 3,388 TOTAL COMMODITIES 4,181 4,163 3,829 3,623 3,645
FACTORS FACTORSLand 0,114 0,244 0,055 0,051 0,052 Land 0,039 0,133 0,009 0,006 0,007Unskilled Labor 0,793 0,896 0,756 0,668 0,783 Unskilled Labor 0,840 0,885 0,885 0,808 0,881Skilled Labor 0,261 0,231 0,278 0,255 0,356 Skilled Labor 0,517 0,517 0,545 0,526 0,630Capital 0,836 0,788 0,814 0,918 0,878 Capital 0,960 0,927 0,861 0,897 0,914Natural Resources 0,018 0,024 0,017 0,241 0,019 Natural Resources 0,007 0,012 0,005 0,208 0,007TOTAL FACTORS 2,022 2,184 1,920 2,133 2,088 TOTAL FACTORS 2,364 2,475 2,306 2,446 2,439
HOUSEHOLDS INCOME 2,022 2,184 1,920 2,133 2,088 HOUSEHOLDS INCOME* 2,364 2,475 2,306 2,446 2,439Source: IICA with data from GTAP 5.0 Source: IICA with data from GTAP 5.0
Table 6DUnited States: SAM Multipliers, for 1997
*Households Income is the same that family income and is taken to the sector Private of the SAM based on GTAP.
*Households Income is the same that family income and is taken to the sector Private of the SAM based on GTAP.
Table 5DColombia: SAM Multipliers, for 1997
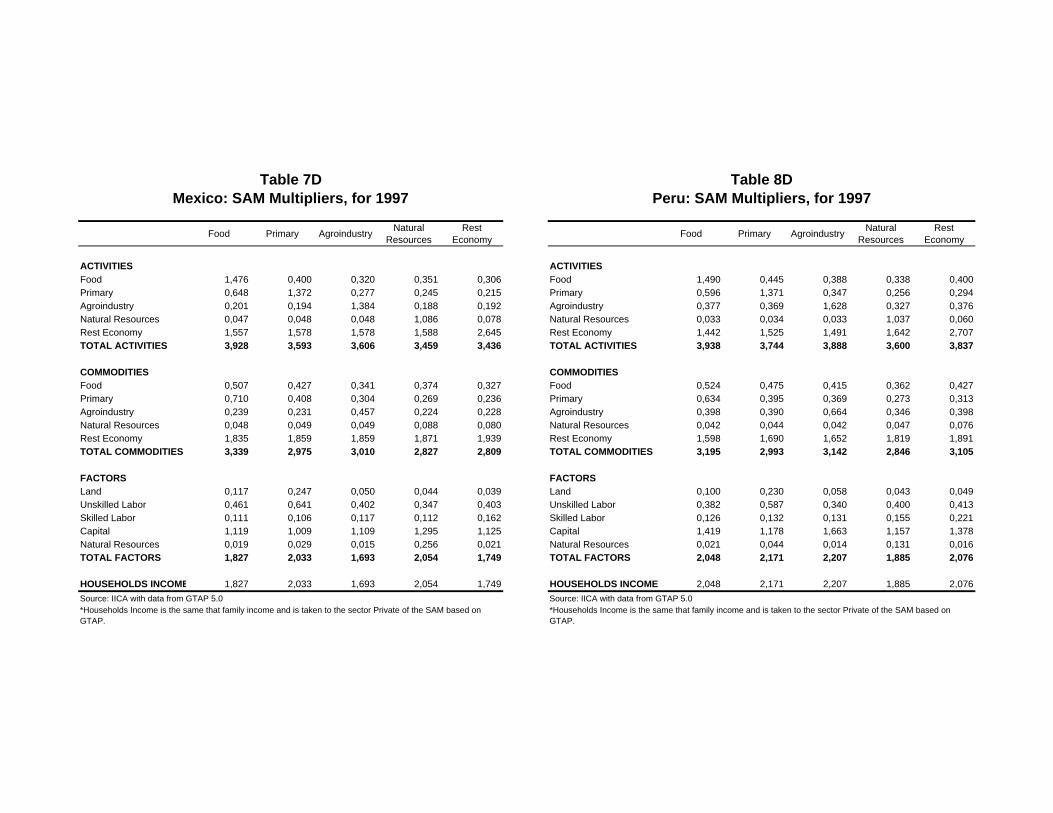
Food Primary Agroindustry Natural Resources
Rest Economy Food Primary Agroindustry Natural
ResourcesRest
Economy
ACTIVITIES ACTIVITIESFood 1,476 0,400 0,320 0,351 0,306 Food 1,490 0,445 0,388 0,338 0,400Primary 0,648 1,372 0,277 0,245 0,215 Primary 0,596 1,371 0,347 0,256 0,294Agroindustry 0,201 0,194 1,384 0,188 0,192 Agroindustry 0,377 0,369 1,628 0,327 0,376Natural Resources 0,047 0,048 0,048 1,086 0,078 Natural Resources 0,033 0,034 0,033 1,037 0,060Rest Economy 1,557 1,578 1,578 1,588 2,645 Rest Economy 1,442 1,525 1,491 1,642 2,707TOTAL ACTIVITIES 3,928 3,593 3,606 3,459 3,436 TOTAL ACTIVITIES 3,938 3,744 3,888 3,600 3,837
COMMODITIES COMMODITIESFood 0,507 0,427 0,341 0,374 0,327 Food 0,524 0,475 0,415 0,362 0,427Primary 0,710 0,408 0,304 0,269 0,236 Primary 0,634 0,395 0,369 0,273 0,313Agroindustry 0,239 0,231 0,457 0,224 0,228 Agroindustry 0,398 0,390 0,664 0,346 0,398Natural Resources 0,048 0,049 0,049 0,088 0,080 Natural Resources 0,042 0,044 0,042 0,047 0,076Rest Economy 1,835 1,859 1,859 1,871 1,939 Rest Economy 1,598 1,690 1,652 1,819 1,891TOTAL COMMODITIES 3,339 2,975 3,010 2,827 2,809 TOTAL COMMODITIES 3,195 2,993 3,142 2,846 3,105
FACTORS FACTORSLand 0,117 0,247 0,050 0,044 0,039 Land 0,100 0,230 0,058 0,043 0,049Unskilled Labor 0,461 0,641 0,402 0,347 0,403 Unskilled Labor 0,382 0,587 0,340 0,400 0,413Skilled Labor 0,111 0,106 0,117 0,112 0,162 Skilled Labor 0,126 0,132 0,131 0,155 0,221Capital 1,119 1,009 1,109 1,295 1,125 Capital 1,419 1,178 1,663 1,157 1,378Natural Resources 0,019 0,029 0,015 0,256 0,021 Natural Resources 0,021 0,044 0,014 0,131 0,016TOTAL FACTORS 1,827 2,033 1,693 2,054 1,749 TOTAL FACTORS 2,048 2,171 2,207 1,885 2,076
HOUSEHOLDS INCOME 1,827 2,033 1,693 2,054 1,749 HOUSEHOLDS INCOME* 2,048 2,171 2,207 1,885 2,076Source: IICA with data from GTAP 5.0 Source: IICA with data from GTAP 5.0
Table 7D
*Households Income is the same that family income and is taken to the sector Private of the SAM based on GTAP.
Peru: SAM Multipliers, for 1997Table 8D
Mexico: SAM Multipliers, for 1997
*Households Income is the same that family income and is taken to the sector Private of the SAM based on GTAP.
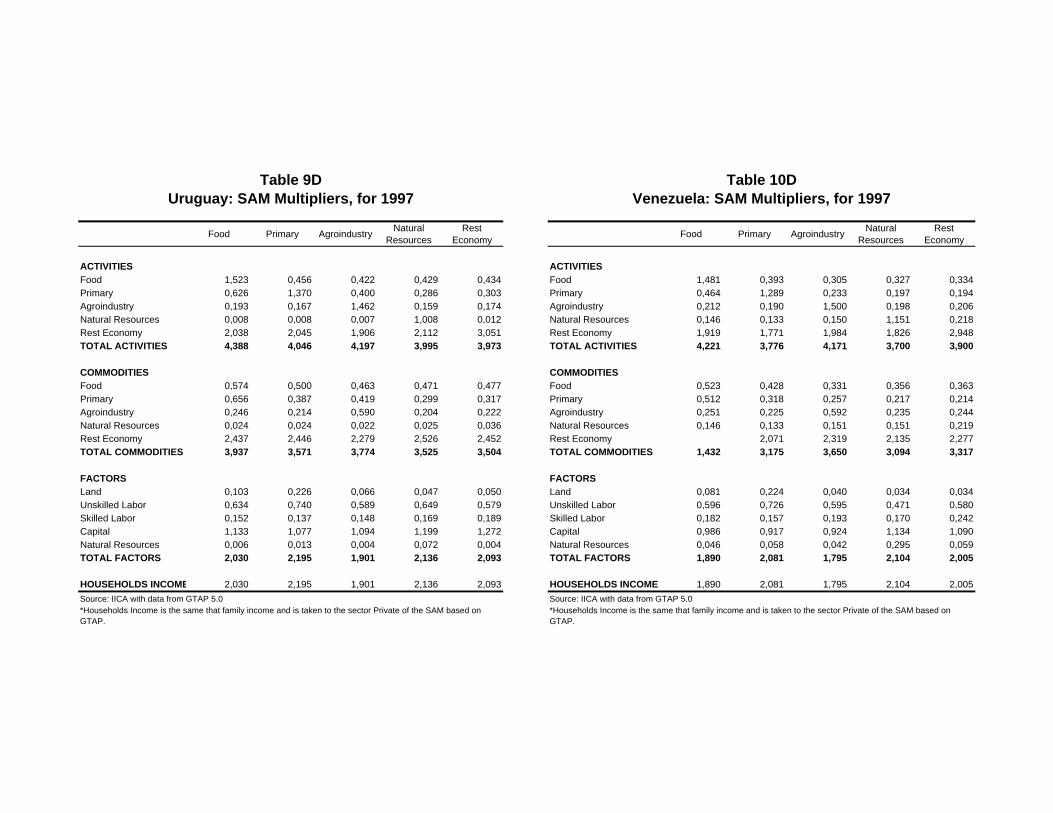
Food Primary Agroindustry Natural Resources
Rest Economy Food Primary Agroindustry Natural
ResourcesRest
Economy
ACTIVITIES ACTIVITIESFood 1,523 0,456 0,422 0,429 0,434 Food 1,481 0,393 0,305 0,327 0,334Primary 0,626 1,370 0,400 0,286 0,303 Primary 0,464 1,289 0,233 0,197 0,194Agroindustry 0,193 0,167 1,462 0,159 0,174 Agroindustry 0,212 0,190 1,500 0,198 0,206Natural Resources 0,008 0,008 0,007 1,008 0,012 Natural Resources 0,146 0,133 0,150 1,151 0,218Rest Economy 2,038 2,045 1,906 2,112 3,051 Rest Economy 1,919 1,771 1,984 1,826 2,948TOTAL ACTIVITIES 4,388 4,046 4,197 3,995 3,973 TOTAL ACTIVITIES 4,221 3,776 4,171 3,700 3,900
COMMODITIES COMMODITIESFood 0,574 0,500 0,463 0,471 0,477 Food 0,523 0,428 0,331 0,356 0,363Primary 0,656 0,387 0,419 0,299 0,317 Primary 0,512 0,318 0,257 0,217 0,214Agroindustry 0,246 0,214 0,590 0,204 0,222 Agroindustry 0,251 0,225 0,592 0,235 0,244Natural Resources 0,024 0,024 0,022 0,025 0,036 Natural Resources 0,146 0,133 0,151 0,151 0,219Rest Economy 2,437 2,446 2,279 2,526 2,452 Rest Economy 2,071 2,319 2,135 2,277TOTAL COMMODITIES 3,937 3,571 3,774 3,525 3,504 TOTAL COMMODITIES 1,432 3,175 3,650 3,094 3,317
FACTORS FACTORSLand 0,103 0,226 0,066 0,047 0,050 Land 0,081 0,224 0,040 0,034 0,034Unskilled Labor 0,634 0,740 0,589 0,649 0,579 Unskilled Labor 0,596 0,726 0,595 0,471 0,580Skilled Labor 0,152 0,137 0,148 0,169 0,189 Skilled Labor 0,182 0,157 0,193 0,170 0,242Capital 1,133 1,077 1,094 1,199 1,272 Capital 0,986 0,917 0,924 1,134 1,090Natural Resources 0,006 0,013 0,004 0,072 0,004 Natural Resources 0,046 0,058 0,042 0,295 0,059TOTAL FACTORS 2,030 2,195 1,901 2,136 2,093 TOTAL FACTORS 1,890 2,081 1,795 2,104 2,005
HOUSEHOLDS INCOME 2,030 2,195 1,901 2,136 2,093 HOUSEHOLDS INCOME* 1,890 2,081 1,795 2,104 2,005Source: IICA with data from GTAP 5.0 Source: IICA with data from GTAP 5.0
Table 9D
*Households Income is the same that family income and is taken to the sector Private of the SAM based on GTAP.
*Households Income is the same that family income and is taken to the sector Private of the SAM based on GTAP.
Venezuela: SAM Multipliers, for 1997Table 10D
Uruguay: SAM Multipliers, for 1997
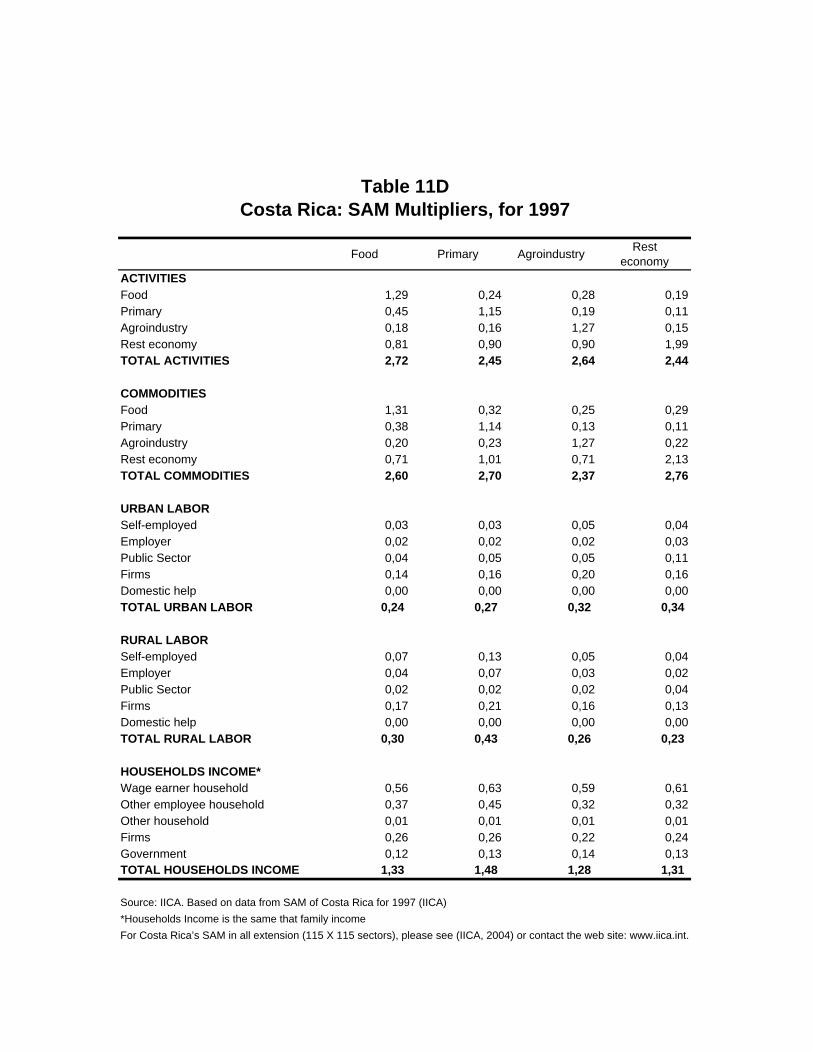
Food Primary Agroindustry Rest economy
ACTIVITIESFood 1,29 0,24 0,28 0,19Primary 0,45 1,15 0,19 0,11Agroindustry 0,18 0,16 1,27 0,15Rest economy 0,81 0,90 0,90 1,99TOTAL ACTIVITIES 2,72 2,45 2,64 2,44
COMMODITIESFood 1,31 0,32 0,25 0,29Primary 0,38 1,14 0,13 0,11Agroindustry 0,20 0,23 1,27 0,22Rest economy 0,71 1,01 0,71 2,13TOTAL COMMODITIES 2,60 2,70 2,37 2,76
URBAN LABORSelf-employed 0,03 0,03 0,05 0,04Employer 0,02 0,02 0,02 0,03Public Sector 0,04 0,05 0,05 0,11Firms 0,14 0,16 0,20 0,16Domestic help 0,00 0,00 0,00 0,00TOTAL URBAN LABOR 0,24 0,27 0,32 0,34
RURAL LABORSelf-employed 0,07 0,13 0,05 0,04Employer 0,04 0,07 0,03 0,02Public Sector 0,02 0,02 0,02 0,04Firms 0,17 0,21 0,16 0,13Domestic help 0,00 0,00 0,00 0,00TOTAL RURAL LABOR 0,30 0,43 0,26 0,23
HOUSEHOLDS INCOME*Wage earner household 0,56 0,63 0,59 0,61Other employee household 0,37 0,45 0,32 0,32Other household 0,01 0,01 0,01 0,01Firms 0,26 0,26 0,22 0,24Government 0,12 0,13 0,14 0,13TOTAL HOUSEHOLDS INCOME 1,33 1,48 1,28 1,31
*Households Income is the same that family incomeFor Costa Rica’s SAM in all extension (115 X 115 sectors), please see (IICA, 2004) or contact the web site: www.iica.int.
Costa Rica: SAM Multipliers, for 1997Table 11D
Source: IICA. Based on data from SAM of Costa Rica for 1997 (IICA)

FACTORS INCOME USE
COMMODITIES ACTIVITIES
COMMODOTIES
Bananas 1,001 0,002 0,002 0,001 0,001 0,002 0,011 0,001 0,029 0,005 0,001 0,005 0,002 0,002 0,001 0,001 0,000 0,001 0,001 0,002 0,002 0,001 0,001 0,000 0,000 0,000 0,001 0,001 0,001 0,001 0,001 0,000 0,004 0,002 0,002 0,007 0,001 0,002 0,002 0,002 0,002 0,000 0,002 0,002 0,002 0,003 0,002 0,002 0,012 0,002 0,032 0,008 0,002 0,008 0,002 0,003 0,002 0,002 0,003 0,001 0,002 0,003 0,003 0,002 0,001 0,001 0,001 0,001 0,001 0,002 0,001 0,001 0,001 0,001 0,006 0,002 0,002 0,002 0,002 0,002 0,002 0,002 0,002 0,003 0,003 0,003 0,003 0,003 0,003 0,003 0,003 0,003 0,003 0,000 0,000 0,002 0,003 0,003 0,002 0,000 0,000 0,003 0,003 0,002 0,000 0,000 0,003 0,000
Coffee beans 0,004 1,008 0,006 0,002 0,002 0,006 0,006 0,003 0,010 0,006 0,003 0,004 0,681 0,007 0,008 0,004 0,001 0,036 0,003 0,003 0,003 0,003 0,002 0,001 0,000 0,001 0,002 0,002 0,002 0,002 0,002 0,000 0,004 0,005 0,006 0,023 0,005 0,007 0,005 0,005 0,007 0,000 0,005 0,008 0,006 0,008 0,005 0,006 0,006 0,006 0,011 0,008 0,005 0,006 0,701 0,011 0,014 0,006 0,067 0,004 0,005 0,005 0,006 0,005 0,005 0,005 0,003 0,004 0,004 0,005 0,004 0,004 0,004 0,004 0,006 0,005 0,006 0,006 0,005 0,007 0,006 0,006 0,007 0,009 0,009 0,009 0,009 0,009 0,009 0,009 0,009 0,009 0,009 0,000 0,000 0,006 0,009 0,009 0,006 0,000 0,000 0,009 0,009 0,006 0,000 0,000 0,009 0,000
Sugar cane 0,005 0,008 1,034 0,003 0,003 0,007 0,023 0,004 0,013 0,012 0,004 0,005 0,007 0,005 0,018 0,365 0,002 0,012 0,004 0,004 0,004 0,003 0,003 0,001 0,001 0,001 0,003 0,003 0,002 0,002 0,002 0,000 0,005 0,006 0,006 0,026 0,005 0,008 0,006 0,006 0,010 0,000 0,006 0,008 0,034 0,009 0,006 0,007 0,024 0,007 0,014 0,018 0,006 0,007 0,007 0,007 0,031 0,561 0,022 0,007 0,005 0,006 0,008 0,006 0,005 0,005 0,003 0,005 0,005 0,006 0,005 0,005 0,005 0,005 0,007 0,006 0,007 0,007 0,005 0,008 0,006 0,006 0,010 0,010 0,011 0,011 0,011 0,011 0,011 0,011 0,011 0,011 0,011 0,000 0,000 0,006 0,011 0,011 0,007 0,000 0,000 0,011 0,011 0,007 0,000 0,000 0,011 0,000
Cocoa beans, unroasted and roasted 0,001 0,001 0,001 1,000 0,000 0,001 0,001 0,000 0,001 0,001 0,000 0,000 0,001 0,001 0,002 0,000 0,000 0,008 0,000 0,000 0,000 0,000 0,000 0,000 0,000 0,000 0,000 0,000 0,000 0,000 0,000 0,000 0,000 0,001 0,001 0,003 0,001 0,001 0,001 0,001 0,001 0,000 0,001 0,001 0,001 0,001 0,001 0,001 0,001 0,001 0,001 0,001 0,001 0,001 0,001 0,002 0,003 0,001 0,016 0,001 0,001 0,001 0,001 0,001 0,001 0,001 0,000 0,000 0,001 0,001 0,001 0,000 0,001 0,001 0,001 0,001 0,001 0,001 0,001 0,001 0,001 0,001 0,001 0,001 0,001 0,001 0,001 0,001 0,001 0,001 0,001 0,001 0,001 0,000 0,000 0,001 0,001 0,001 0,001 0,000 0,000 0,001 0,001 0,001 0,000 0,000 0,001 0,000
Staple grains 0,015 0,023 0,020 0,008 1,057 0,021 0,129 0,011 0,017 0,059 0,011 0,021 0,022 0,306 0,044 0,013 0,005 0,016 0,011 0,011 0,017 0,011 0,008 0,004 0,002 0,004 0,008 0,008 0,006 0,006 0,006 0,001 0,012 0,019 0,020 0,079 0,016 0,025 0,018 0,017 0,027 0,000 0,017 0,023 0,020 0,029 0,119 0,021 0,134 0,019 0,019 0,086 0,017 0,033 0,022 0,497 0,076 0,020 0,029 0,015 0,017 0,016 0,032 0,022 0,016 0,014 0,010 0,014 0,014 0,017 0,015 0,014 0,015 0,015 0,017 0,019 0,022 0,022 0,016 0,025 0,020 0,020 0,027 0,032 0,033 0,033 0,033 0,033 0,033 0,033 0,033 0,033 0,033 0,000 0,000 0,020 0,033 0,033 0,021 0,000 0,000 0,033 0,033 0,021 0,000 0,000 0,033 0,000
Tobacco 0,000 0,000 0,000 0,000 0,000 1,000 0,000 0,000 0,000 0,000 0,000 0,000 0,000 0,000 0,000 0,000 0,000 0,000 0,001 0,000 0,000 0,000 0,000 0,000 0,000 0,000 0,000 0,000 0,000 0,000 0,000 0,000 0,000 0,000 0,000 0,000 0,000 0,000 0,000 0,000 0,000 0,000 0,000 0,000 0,000 0,000 0,000 0,000 0,000 0,000 0,000 0,000 0,000 0,000 0,000 0,000 0,000 0,000 0,000 0,000 0,002 0,000 0,000 0,000 0,000 0,000 0,000 0,000 0,000 0,000 0,000 0,000 0,000 0,000 0,000 0,000 0,000 0,000 0,000 0,000 0,000 0,000 0,000 0,000 0,000 0,000 0,000 0,000 0,000 0,000 0,000 0,000 0,000 0,000 0,000 0,000 0,000 0,000 0,000 0,000 0,000 0,000 0,000 0,000 0,000 0,000 0,000 0,000
Livestock 0,046 0,069 0,060 0,024 0,025 0,062 1,066 0,034 0,051 0,458 0,034 0,033 0,065 0,030 0,048 0,039 0,015 0,072 0,032 0,034 0,102 0,029 0,024 0,011 0,005 0,012 0,025 0,025 0,017 0,019 0,019 0,004 0,035 0,055 0,059 0,236 0,048 0,074 0,054 0,052 0,086 0,000 0,052 0,069 0,060 0,085 0,052 0,062 0,068 0,059 0,055 0,668 0,052 0,052 0,067 0,049 0,081 0,060 0,133 0,045 0,050 0,050 0,191 0,056 0,048 0,040 0,029 0,042 0,042 0,050 0,045 0,042 0,044 0,044 0,051 0,056 0,066 0,065 0,049 0,074 0,058 0,058 0,086 0,096 0,097 0,097 0,097 0,097 0,097 0,097 0,097 0,097 0,097 0,000 0,000 0,059 0,097 0,097 0,062 0,000 0,000 0,097 0,097 0,062 0,000 0,000 0,097 0,000
Forestry, fisheries 0,047 0,012 0,011 0,004 0,004 0,014 0,009 1,006 0,011 0,007 0,280 0,006 0,012 0,006 0,007 0,007 0,003 0,018 0,006 0,006 0,005 0,174 0,004 0,002 0,001 0,002 0,005 0,016 0,004 0,004 0,003 0,001 0,015 0,015 0,010 0,043 0,008 0,013 0,009 0,009 0,013 0,000 0,054 0,012 0,011 0,014 0,009 0,014 0,009 0,011 0,012 0,010 0,430 0,010 0,012 0,009 0,013 0,011 0,033 0,008 0,009 0,009 0,009 0,338 0,008 0,008 0,006 0,007 0,007 0,032 0,009 0,008 0,008 0,010 0,022 0,015 0,012 0,012 0,009 0,013 0,010 0,010 0,013 0,016 0,017 0,017 0,017 0,017 0,017 0,017 0,017 0,017 0,017 0,000 0,000 0,010 0,017 0,017 0,011 0,000 0,000 0,017 0,017 0,011 0,000 0,000 0,017 0,000
Other agricultural products 0,021 0,031 0,028 0,011 0,012 0,029 0,041 0,014 1,038 0,024 0,015 0,163 0,030 0,050 0,021 0,018 0,007 0,021 0,015 0,050 0,016 0,014 0,011 0,006 0,002 0,006 0,012 0,011 0,008 0,009 0,009 0,002 0,121 0,025 0,027 0,108 0,022 0,034 0,025 0,023 0,035 0,000 0,024 0,031 0,028 0,039 0,024 0,029 0,042 0,025 0,042 0,035 0,023 0,257 0,031 0,082 0,036 0,027 0,038 0,020 0,023 0,073 0,029 0,027 0,022 0,022 0,013 0,020 0,020 0,023 0,021 0,019 0,020 0,020 0,174 0,025 0,030 0,030 0,022 0,034 0,027 0,027 0,035 0,044 0,044 0,044 0,044 0,044 0,044 0,044 0,044 0,044 0,044 0,000 0,000 0,027 0,044 0,044 0,028 0,000 0,000 0,044 0,044 0,028 0,000 0,000 0,044 0,000
Meat and dairy products 0,097 0,146 0,128 0,051 0,053 0,132 0,105 0,072 0,108 1,131 0,072 0,070 0,138 0,067 0,091 0,083 0,031 0,170 0,069 0,073 0,245 0,062 0,052 0,024 0,011 0,026 0,054 0,053 0,036 0,040 0,041 0,009 0,076 0,118 0,125 0,502 0,101 0,157 0,115 0,109 0,187 0,000 0,110 0,146 0,128 0,181 0,110 0,132 0,109 0,124 0,117 0,190 0,111 0,110 0,141 0,109 0,155 0,128 0,314 0,095 0,105 0,106 0,457 0,120 0,102 0,086 0,062 0,089 0,090 0,107 0,096 0,088 0,094 0,093 0,109 0,118 0,141 0,139 0,103 0,157 0,124 0,124 0,187 0,204 0,207 0,207 0,206 0,207 0,206 0,207 0,207 0,207 0,207 0,000 0,000 0,125 0,207 0,207 0,133 0,000 0,000 0,207 0,207 0,133 0,000 0,000 0,207 0,000
Fish canning 0,013 0,019 0,017 0,007 0,007 0,018 0,016 0,011 0,014 0,013 1,084 0,010 0,018 0,013 0,017 0,011 0,004 0,060 0,009 0,010 0,008 0,009 0,007 0,004 0,001 0,003 0,008 0,052 0,005 0,005 0,006 0,001 0,010 0,016 0,017 0,076 0,013 0,022 0,015 0,015 0,021 0,000 0,015 0,019 0,017 0,024 0,015 0,018 0,016 0,020 0,016 0,019 0,129 0,016 0,019 0,021 0,029 0,017 0,111 0,013 0,014 0,014 0,015 0,017 0,014 0,013 0,008 0,012 0,013 0,105 0,013 0,012 0,013 0,013 0,015 0,016 0,019 0,021 0,014 0,022 0,016 0,017 0,021 0,027 0,027 0,027 0,027 0,027 0,027 0,027 0,027 0,027 0,027 0,000 0,000 0,016 0,027 0,027 0,018 0,000 0,000 0,027 0,027 0,018 0,000 0,000 0,027 0,000
Edible oils 0,022 0,032 0,028 0,011 0,012 0,030 0,038 0,014 0,024 0,023 0,015 1,198 0,030 0,011 0,024 0,018 0,007 0,014 0,015 0,016 0,014 0,013 0,011 0,010 0,002 0,006 0,013 0,012 0,008 0,009 0,009 0,002 0,017 0,026 0,027 0,109 0,022 0,034 0,025 0,024 0,034 0,000 0,025 0,032 0,028 0,039 0,025 0,030 0,039 0,025 0,026 0,034 0,024 0,311 0,031 0,018 0,041 0,028 0,026 0,020 0,023 0,024 0,026 0,026 0,022 0,034 0,013 0,020 0,021 0,024 0,021 0,019 0,021 0,020 0,024 0,026 0,031 0,030 0,022 0,034 0,027 0,027 0,034 0,044 0,045 0,045 0,045 0,045 0,045 0,045 0,045 0,045 0,045 0,000 0,000 0,027 0,045 0,045 0,029 0,000 0,000 0,045 0,045 0,029 0,000 0,000 0,045 0,000
Coffee processing 0,006 0,009 0,008 0,003 0,003 0,009 0,008 0,005 0,007 0,008 0,005 0,005 1,009 0,009 0,012 0,005 0,002 0,054 0,004 0,005 0,004 0,004 0,003 0,002 0,001 0,002 0,004 0,003 0,002 0,003 0,003 0,001 0,005 0,008 0,008 0,033 0,007 0,010 0,007 0,007 0,011 0,000 0,007 0,009 0,008 0,012 0,007 0,009 0,009 0,009 0,008 0,012 0,007 0,007 0,009 0,015 0,020 0,008 0,099 0,007 0,007 0,007 0,008 0,008 0,007 0,007 0,004 0,006 0,006 0,007 0,006 0,006 0,006 0,006 0,007 0,008 0,009 0,009 0,007 0,010 0,008 0,008 0,011 0,013 0,013 0,013 0,013 0,013 0,013 0,013 0,013 0,013 0,013 0,000 0,000 0,008 0,013 0,013 0,009 0,000 0,000 0,013 0,013 0,009 0,000 0,000 0,013 0,000
Milling of grains 0,039 0,058 0,051 0,020 0,021 0,053 0,315 0,028 0,043 0,144 0,029 0,028 0,055 1,022 0,137 0,033 0,012 0,040 0,027 0,029 0,043 0,030 0,021 0,010 0,004 0,010 0,021 0,021 0,014 0,016 0,016 0,004 0,030 0,047 0,050 0,201 0,040 0,062 0,046 0,044 0,067 0,000 0,044 0,058 0,051 0,072 0,044 0,053 0,326 0,048 0,047 0,210 0,044 0,044 0,057 0,036 0,234 0,051 0,073 0,038 0,042 0,042 0,081 0,058 0,041 0,034 0,025 0,035 0,035 0,043 0,038 0,035 0,037 0,037 0,044 0,047 0,057 0,055 0,041 0,062 0,050 0,050 0,067 0,082 0,083 0,083 0,083 0,083 0,083 0,083 0,083 0,083 0,083 0,000 0,000 0,050 0,083 0,083 0,053 0,000 0,000 0,083 0,083 0,053 0,000 0,000 0,083 0,000
Bakery products 0,014 0,021 0,019 0,007 0,008 0,019 0,015 0,012 0,016 0,011 0,011 0,010 0,020 0,007 1,010 0,012 0,005 0,009 0,010 0,010 0,008 0,009 0,008 0,003 0,002 0,004 0,008 0,008 0,005 0,006 0,006 0,001 0,011 0,017 0,018 0,074 0,015 0,023 0,017 0,016 0,039 0,000 0,016 0,021 0,019 0,027 0,016 0,019 0,015 0,021 0,017 0,016 0,017 0,016 0,021 0,012 0,016 0,019 0,016 0,014 0,015 0,015 0,016 0,018 0,015 0,012 0,009 0,013 0,013 0,016 0,014 0,013 0,014 0,014 0,016 0,017 0,021 0,020 0,015 0,023 0,018 0,018 0,039 0,030 0,030 0,030 0,030 0,030 0,030 0,030 0,030 0,030 0,030 0,000 0,000 0,018 0,030 0,030 0,020 0,000 0,000 0,030 0,030 0,020 0,000 0,000 0,030 0,000
Sugar 0,014 0,020 0,018 0,007 0,007 0,019 0,063 0,010 0,015 0,034 0,010 0,010 0,019 0,012 0,051 1,014 0,006 0,033 0,010 0,010 0,012 0,009 0,007 0,004 0,002 0,004 0,008 0,007 0,005 0,006 0,006 0,001 0,011 0,016 0,017 0,070 0,014 0,022 0,016 0,015 0,028 0,000 0,015 0,020 0,018 0,025 0,015 0,019 0,065 0,018 0,016 0,049 0,015 0,015 0,020 0,019 0,087 0,021 0,061 0,018 0,015 0,015 0,023 0,017 0,014 0,014 0,009 0,012 0,013 0,015 0,013 0,012 0,013 0,013 0,015 0,016 0,020 0,019 0,015 0,022 0,017 0,017 0,028 0,028 0,029 0,029 0,029 0,029 0,029 0,029 0,029 0,029 0,029 0,000 0,000 0,017 0,029 0,029 0,018 0,000 0,000 0,029 0,029 0,018 0,000 0,000 0,029 0,000
Other manufactured products 0,062 0,075 0,072 0,025 0,030 0,076 0,053 0,185 0,059 0,053 0,084 0,041 0,085 0,028 0,035 0,061 1,193 0,035 0,056 0,048 0,034 0,061 0,036 0,013 0,008 0,014 0,034 0,039 0,030 0,031 0,028 0,006 0,047 0,076 0,081 0,290 0,287 0,095 0,065 0,067 0,258 0,000 0,070 0,075 0,072 0,088 0,064 0,076 0,055 0,319 0,064 0,078 0,128 0,064 0,087 0,045 0,060 0,094 0,064 0,585 0,086 0,070 0,064 0,118 0,071 0,048 0,046 0,049 0,056 0,079 0,080 0,068 0,065 0,057 0,067 0,077 0,091 0,080 0,295 0,094 0,069 0,072 0,258 0,100 0,101 0,101 0,101 0,101 0,101 0,101 0,101 0,101 0,101 0,000 0,000 0,061 0,101 0,101 0,065 0,000 0,000 0,101 0,101 0,065 0,000 0,000 0,101 0,000
Beverages 0,073 0,108 0,095 0,038 0,040 0,100 0,113 0,063 0,081 0,126 0,056 0,052 0,102 0,176 0,220 0,062 0,026 1,149 0,051 0,054 0,055 0,048 0,038 0,025 0,008 0,019 0,042 0,040 0,026 0,030 0,030 0,007 0,056 0,087 0,092 0,370 0,075 0,115 0,085 0,081 0,126 0,000 0,083 0,108 0,095 0,133 0,084 0,100 0,116 0,110 0,088 0,184 0,086 0,082 0,105 0,286 0,375 0,095 0,276 0,079 0,078 0,078 0,103 0,093 0,076 0,089 0,046 0,067 0,068 0,080 0,071 0,066 0,070 0,069 0,081 0,087 0,104 0,102 0,077 0,115 0,092 0,091 0,126 0,151 0,152 0,152 0,152 0,152 0,152 0,152 0,152 0,152 0,152 0,000 0,000 0,092 0,153 0,153 0,098 0,000 0,000 0,153 0,153 0,098 0,000 0,000 0,153 0,000
Tobacco products 0,010 0,015 0,013 0,005 0,005 0,013 0,010 0,007 0,011 0,007 0,007 0,007 0,014 0,005 0,007 0,008 0,003 0,006 1,178 0,007 0,006 0,006 0,005 0,002 0,001 0,003 0,005 0,005 0,004 0,004 0,004 0,001 0,008 0,012 0,013 0,051 0,010 0,016 0,012 0,011 0,016 0,000 0,011 0,015 0,013 0,018 0,011 0,013 0,011 0,013 0,012 0,011 0,011 0,011 0,014 0,008 0,011 0,013 0,011 0,010 0,273 0,011 0,011 0,012 0,010 0,008 0,006 0,009 0,009 0,011 0,010 0,009 0,009 0,009 0,011 0,012 0,014 0,014 0,010 0,016 0,013 0,013 0,016 0,021 0,021 0,021 0,021 0,021 0,021 0,021 0,021 0,021 0,021 0,000 0,000 0,013 0,021 0,021 0,013 0,000 0,000 0,021 0,021 0,013 0,000 0,000 0,021 0,000
Textiles and garments 0,051 0,076 0,066 0,026 0,032 0,077 0,054 0,034 0,062 0,039 0,036 0,037 0,076 0,035 0,034 0,043 0,016 0,030 0,036 1,137 0,034 0,034 0,027 0,013 0,006 0,024 0,033 0,027 0,020 0,022 0,022 0,005 0,120 0,061 0,066 0,265 0,052 0,082 0,059 0,056 0,081 0,000 0,057 0,076 0,066 0,092 0,067 0,077 0,056 0,058 0,067 0,056 0,056 0,058 0,079 0,057 0,059 0,066 0,055 0,048 0,055 0,200 0,064 0,066 0,053 0,047 0,034 0,082 0,054 0,055 0,054 0,048 0,051 0,051 0,172 0,061 0,074 0,073 0,054 0,083 0,064 0,064 0,081 0,104 0,106 0,106 0,105 0,106 0,105 0,106 0,106 0,106 0,106 0,000 0,000 0,064 0,106 0,106 0,068 0,000 0,000 0,106 0,106 0,068 0,000 0,000 0,106 0,000
Leather goods and footwear 0,007 0,010 0,009 0,004 0,004 0,009 0,007 0,005 0,008 0,005 0,005 0,005 0,010 0,004 0,005 0,006 0,002 0,004 0,005 0,013 1,110 0,006 0,004 0,002 0,001 0,002 0,010 0,004 0,003 0,003 0,003 0,001 0,006 0,009 0,010 0,037 0,007 0,014 0,008 0,008 0,014 0,000 0,008 0,010 0,009 0,015 0,008 0,009 0,007 0,009 0,008 0,008 0,008 0,008 0,010 0,006 0,008 0,009 0,008 0,007 0,008 0,020 0,205 0,012 0,007 0,006 0,004 0,008 0,017 0,008 0,007 0,007 0,007 0,010 0,009 0,009 0,011 0,010 0,007 0,015 0,009 0,009 0,014 0,014 0,015 0,015 0,015 0,015 0,015 0,015 0,015 0,015 0,015 0,000 0,000 0,009 0,015 0,015 0,009 0,000 0,000 0,015 0,015 0,009 0,000 0,000 0,015 0,000
Timber and furniture 0,008 0,014 0,014 0,004 0,004 0,027 0,009 0,005 0,016 0,006 0,006 0,007 0,016 0,004 0,005 0,008 0,002 0,005 0,006 0,006 0,005 1,035 0,004 0,002 0,001 0,002 0,004 0,004 0,007 0,006 0,003 0,002 0,061 0,039 0,012 0,042 0,009 0,013 0,010 0,009 0,015 0,000 0,009 0,014 0,014 0,014 0,009 0,027 0,009 0,009 0,018 0,009 0,009 0,011 0,017 0,007 0,009 0,013 0,009 0,007 0,009 0,009 0,009 0,067 0,008 0,007 0,008 0,007 0,007 0,009 0,018 0,014 0,008 0,022 0,088 0,039 0,013 0,012 0,009 0,013 0,011 0,010 0,015 0,016 0,016 0,016 0,016 0,016 0,016 0,016 0,016 0,016 0,016 0,000 0,000 0,010 0,016 0,016 0,010 0,000 0,000 0,016 0,016 0,010 0,000 0,000 0,016 0,000
Paper and printing 0,200 0,072 0,063 0,024 0,027 0,067 0,053 0,032 0,059 0,038 0,037 0,036 0,071 0,028 0,036 0,061 0,015 0,030 0,123 0,066 0,033 0,030 1,247 0,015 0,007 0,014 0,038 0,029 0,021 0,027 0,038 0,005 0,056 0,063 0,088 0,391 0,051 0,088 0,063 0,056 0,078 0,000 0,226 0,072 0,063 0,086 0,056 0,067 0,055 0,055 0,064 0,055 0,057 0,057 0,073 0,046 0,061 0,093 0,055 0,045 0,188 0,096 0,061 0,058 0,487 0,054 0,041 0,050 0,062 0,059 0,057 0,061 0,088 0,054 0,080 0,063 0,100 0,108 0,052 0,089 0,068 0,063 0,078 0,097 0,099 0,098 0,098 0,098 0,098 0,099 0,099 0,099 0,098 0,000 0,000 0,059 0,099 0,099 0,063 0,000 0,000 0,099 0,099 0,063 0,000 0,000 0,099 0,000
Chemicals 0,334 0,287 0,333 0,067 0,257 0,483 0,195 0,079 0,308 0,120 0,090 0,161 0,244 0,128 0,092 0,181 0,037 0,082 0,156 0,282 0,119 0,114 0,097 1,176 0,019 0,128 0,424 0,154 0,059 0,085 0,097 0,019 0,188 0,188 0,166 0,694 0,133 0,231 0,153 0,134 0,227 0,000 0,378 0,287 0,333 0,238 0,538 0,483 0,202 0,137 0,333 0,175 0,138 0,253 0,251 0,208 0,157 0,278 0,152 0,112 0,239 0,412 0,223 0,222 0,191 0,628 0,109 0,444 0,699 0,312 0,159 0,187 0,223 0,200 0,270 0,188 0,186 0,192 0,135 0,232 0,165 0,151 0,227 0,242 0,245 0,244 0,244 0,244 0,244 0,245 0,245 0,244 0,244 0,000 0,000 0,148 0,245 0,245 0,157 0,000 0,000 0,245 0,245 0,157 0,000 0,000 0,245 0,000
Oil refineries 0,066 0,066 0,128 0,020 0,044 0,113 0,073 0,032 0,065 0,043 0,041 0,050 0,081 0,034 0,034 0,078 0,012 0,031 0,048 0,068 0,031 0,031 0,046 0,014 1,017 0,018 0,030 0,045 0,067 0,033 0,026 0,006 0,063 0,105 0,073 0,257 0,127 0,078 0,120 0,050 0,065 0,000 0,075 0,066 0,128 0,071 0,092 0,113 0,075 0,055 0,071 0,063 0,063 0,078 0,083 0,055 0,058 0,120 0,058 0,036 0,074 0,099 0,058 0,060 0,091 0,051 0,099 0,061 0,050 0,091 0,181 0,074 0,060 0,062 0,090 0,106 0,083 0,071 0,131 0,079 0,131 0,056 0,065 0,076 0,077 0,077 0,077 0,077 0,077 0,077 0,077 0,077 0,077 0,000 0,000 0,046 0,077 0,077 0,049 0,000 0,000 0,077 0,077 0,049 0,000 0,000 0,077 0,000
Tires 0,020 0,029 0,039 0,009 0,014 0,035 0,019 0,014 0,023 0,013 0,014 0,013 0,028 0,010 0,012 0,023 0,005 0,011 0,015 0,014 0,011 0,012 0,010 0,004 0,004 1,006 0,010 0,011 0,009 0,015 0,010 0,008 0,015 0,028 0,024 0,091 0,046 0,029 0,021 0,020 0,038 0,000 0,023 0,029 0,039 0,031 0,030 0,035 0,019 0,025 0,025 0,019 0,021 0,021 0,029 0,017 0,020 0,035 0,020 0,016 0,023 0,020 0,020 0,022 0,020 0,015 0,022 0,022 0,017 0,021 0,024 0,033 0,022 0,081 0,021 0,029 0,027 0,025 0,048 0,029 0,022 0,023 0,038 0,035 0,035 0,035 0,035 0,035 0,035 0,035 0,035 0,035 0,035 0,000 0,000 0,021 0,035 0,035 0,023 0,000 0,000 0,035 0,035 0,023 0,000 0,000 0,035 0,000
Rubber and plastics 0,068 0,046 0,043 0,016 0,018 0,046 0,034 0,021 0,047 0,027 0,024 0,025 0,044 0,022 0,023 0,028 0,009 0,022 0,026 0,058 0,065 0,022 0,030 0,015 0,004 0,095 1,052 0,018 0,014 0,034 0,053 0,004 0,033 0,048 0,047 0,254 0,036 0,060 0,038 0,035 0,049 0,000 0,077 0,046 0,043 0,055 0,039 0,046 0,035 0,036 0,051 0,039 0,037 0,039 0,046 0,036 0,040 0,043 0,040 0,029 0,039 0,084 0,121 0,043 0,060 0,052 0,023 0,331 0,086 0,037 0,038 0,076 0,121 0,038 0,047 0,048 0,053 0,070 0,037 0,061 0,041 0,040 0,049 0,062 0,063 0,063 0,063 0,063 0,063 0,063 0,063 0,063 0,063 0,000 0,000 0,038 0,063 0,063 0,040 0,000 0,000 0,063 0,063 0,040 0,000 0,000 0,063 0,000
Glass and ceramics 0,006 0,008 0,008 0,003 0,003 0,008 0,006 0,004 0,007 0,004 0,007 0,022 0,008 0,003 0,004 0,005 0,002 0,005 0,005 0,005 0,004 0,004 0,003 0,004 0,001 0,002 0,004 1,045 0,002 0,005 0,009 0,001 0,005 0,017 0,007 0,033 0,006 0,015 0,007 0,006 0,009 0,000 0,007 0,008 0,008 0,010 0,007 0,008 0,006 0,006 0,007 0,006 0,011 0,035 0,008 0,005 0,007 0,008 0,009 0,006 0,007 0,007 0,007 0,007 0,006 0,014 0,004 0,006 0,006 0,091 0,006 0,011 0,021 0,012 0,007 0,017 0,008 0,009 0,006 0,015 0,007 0,007 0,009 0,011 0,011 0,011 0,011 0,011 0,011 0,011 0,011 0,011 0,011 0,000 0,000 0,007 0,011 0,011 0,007 0,000 0,000 0,011 0,011 0,007 0,000 0,000 0,011 0,000
Construction materials 0,022 0,025 0,034 0,009 0,014 0,033 0,029 0,011 0,038 0,017 0,019 0,019 0,028 0,012 0,012 0,027 0,005 0,012 0,059 0,022 0,021 0,013 0,014 0,014 0,150 0,006 0,014 0,071 1,136 0,010 0,009 0,002 0,095 0,252 0,030 0,098 0,030 0,030 0,086 0,022 0,046 0,000 0,025 0,025 0,034 0,031 0,029 0,033 0,030 0,019 0,042 0,025 0,029 0,030 0,029 0,020 0,021 0,042 0,022 0,015 0,090 0,032 0,039 0,025 0,027 0,050 0,858 0,022 0,023 0,145 0,365 0,023 0,021 0,021 0,136 0,253 0,033 0,027 0,031 0,030 0,094 0,025 0,046 0,031 0,032 0,032 0,031 0,032 0,031 0,032 0,032 0,032 0,032 0,000 0,000 0,019 0,032 0,032 0,020 0,000 0,000 0,032 0,032 0,020 0,000 0,000 0,032 0,000
Base metals 0,042 0,041 0,043 0,011 0,018 0,045 0,030 0,017 0,046 0,020 0,039 0,021 0,038 0,021 0,018 0,047 0,007 0,019 0,055 0,052 0,016 0,021 0,026 0,009 0,005 0,016 0,022 0,017 0,016 1,201 0,089 0,007 0,056 0,107 0,034 0,158 0,031 0,048 0,030 0,027 0,040 0,000 0,048 0,041 0,043 0,041 0,037 0,045 0,031 0,030 0,050 0,029 0,060 0,033 0,039 0,034 0,031 0,072 0,035 0,021 0,084 0,075 0,030 0,041 0,052 0,032 0,027 0,055 0,036 0,034 0,043 0,446 0,204 0,070 0,081 0,108 0,038 0,044 0,032 0,048 0,032 0,030 0,040 0,046 0,046 0,046 0,046 0,046 0,046 0,046 0,047 0,046 0,046 0,000 0,000 0,028 0,047 0,047 0,030 0,000 0,000 0,047 0,047 0,030 0,000 0,000 0,047 0,000
Electrical Goods 0,032 0,046 0,041 0,016 0,017 0,053 0,033 0,021 0,039 0,023 0,024 0,023 0,045 0,016 0,021 0,036 0,010 0,019 0,025 0,026 0,018 0,020 0,017 0,008 0,004 0,009 0,018 0,018 0,012 0,036 1,144 0,004 0,026 0,075 0,044 0,202 0,042 0,071 0,048 0,036 0,059 0,000 0,036 0,046 0,041 0,056 0,036 0,053 0,034 0,036 0,042 0,034 0,037 0,037 0,046 0,026 0,036 0,056 0,035 0,029 0,039 0,038 0,034 0,038 0,034 0,029 0,021 0,030 0,030 0,036 0,033 0,081 0,332 0,045 0,038 0,075 0,049 0,056 0,043 0,072 0,052 0,041 0,059 0,064 0,064 0,064 0,064 0,064 0,064 0,064 0,064 0,064 0,064 0,000 0,000 0,039 0,064 0,064 0,041 0,000 0,000 0,064 0,064 0,041 0,000 0,000 0,064 0,000
Transportation equipment 0,066 0,099 0,088 0,035 0,036 0,095 0,068 0,045 0,076 0,050 0,049 0,048 0,095 0,033 0,044 0,058 0,021 0,039 0,049 0,050 0,039 0,041 0,036 0,016 0,008 0,017 0,037 0,037 0,025 0,028 0,028 1,034 0,052 0,089 0,088 0,346 0,085 0,113 0,080 0,075 0,106 0,000 0,075 0,099 0,088 0,123 0,075 0,095 0,071 0,078 0,082 0,072 0,075 0,076 0,097 0,054 0,076 0,089 0,073 0,064 0,074 0,072 0,072 0,081 0,071 0,057 0,043 0,061 0,060 0,075 0,068 0,062 0,065 0,347 0,075 0,090 0,099 0,096 0,087 0,113 0,086 0,085 0,106 0,139 0,141 0,141 0,140 0,141 0,140 0,141 0,141 0,141 0,141 0,000 0,000 0,085 0,141 0,141 0,090 0,000 0,000 0,141 0,141 0,090 0,000 0,000 0,141 0,000
Other manufactures 0,012 0,017 0,015 0,006 0,006 0,016 0,012 0,008 0,013 0,009 0,008 0,008 0,016 0,006 0,008 0,010 0,004 0,007 0,009 0,012 0,007 0,007 0,006 0,003 0,001 0,003 0,006 0,006 0,004 0,006 0,005 0,001 1,059 0,014 0,016 0,063 0,012 0,021 0,014 0,013 0,020 0,000 0,013 0,017 0,015 0,021 0,013 0,016 0,012 0,013 0,014 0,013 0,013 0,013 0,017 0,010 0,013 0,015 0,013 0,011 0,013 0,018 0,013 0,014 0,012 0,010 0,008 0,011 0,011 0,013 0,011 0,013 0,012 0,012 0,085 0,014 0,018 0,017 0,012 0,021 0,015 0,015 0,020 0,024 0,024 0,024 0,024 0,024 0,024 0,024 0,024 0,024 0,024 0,000 0,000 0,015 0,024 0,024 0,016 0,000 0,000 0,024 0,024 0,016 0,000 0,000 0,024 0,000
Construction 0,001 0,002 0,004 0,001 0,001 0,002 0,001 0,001 0,002 0,001 0,004 0,002 0,005 0,001 0,001 0,005 0,000 0,002 0,001 0,001 0,001 0,002 0,001 0,000 0,001 0,000 0,001 0,002 0,002 0,001 0,001 0,000 0,002 1,010 0,002 0,014 0,001 0,002 0,001 0,007 0,002 0,000 0,002 0,002 0,004 0,002 0,002 0,002 0,001 0,001 0,002 0,002 0,006 0,003 0,006 0,001 0,002 0,007 0,003 0,001 0,001 0,002 0,001 0,003 0,002 0,001 0,003 0,001 0,002 0,004 0,005 0,001 0,001 0,004 0,003 0,010 0,002 0,004 0,001 0,002 0,001 0,008 0,002 0,002 0,002 0,002 0,002 0,002 0,002 0,002 0,002 0,002 0,002 0,000 0,000 0,001 0,002 0,002 0,001 0,000 0,000 0,002 0,002 0,001 0,000 0,000 0,002 0,000
Banking, finance and insurance 0,085 0,093 0,093 0,031 0,049 0,114 0,079 0,040 0,127 0,052 0,062 0,059 0,108 0,047 0,045 0,076 0,018 0,041 0,068 0,072 0,047 0,044 0,066 0,023 0,013 0,025 0,050 0,058 0,030 0,079 0,059 0,011 0,104 0,128 1,154 0,926 0,087 0,134 0,140 0,164 0,099 0,000 0,096 0,093 0,093 0,109 0,104 0,114 0,082 0,070 0,138 0,076 0,094 0,092 0,111 0,076 0,077 0,117 0,076 0,056 0,104 0,105 0,088 0,085 0,131 0,080 0,071 0,087 0,082 0,118 0,079 0,175 0,135 0,117 0,150 0,129 0,171 0,256 0,090 0,135 0,152 0,189 0,099 0,120 0,122 0,122 0,122 0,122 0,122 0,122 0,122 0,122 0,122 0,000 0,000 0,074 0,122 0,122 0,078 0,000 0,000 0,122 0,122 0,078 0,000 0,000 0,122 0,000
Commerce, restaurants and hotels 0,048 0,059 0,054 0,020 0,024 0,062 0,043 0,026 0,048 0,030 0,045 0,036 0,063 0,022 0,027 0,036 0,012 0,025 0,039 0,037 0,026 0,025 0,024 0,012 0,005 0,013 0,033 0,032 0,017 0,019 0,020 0,004 0,046 0,058 0,052 1,213 0,043 0,066 0,048 0,045 0,062 0,000 0,055 0,059 0,054 0,070 0,050 0,062 0,045 0,045 0,052 0,044 0,069 0,056 0,064 0,036 0,046 0,055 0,046 0,037 0,060 0,053 0,049 0,049 0,048 0,043 0,027 0,046 0,054 0,065 0,046 0,042 0,046 0,038 0,067 0,059 0,059 0,059 0,044 0,066 0,051 0,052 0,062 0,080 0,081 0,081 0,081 0,081 0,081 0,081 0,081 0,081 0,081 0,000 0,000 0,049 0,081 0,081 0,052 0,000 0,000 0,081 0,081 0,052 0,000 0,000 0,081 0,000
Transportation 0,126 0,151 0,161 0,048 0,069 0,171 0,110 0,062 0,126 0,078 0,098 0,094 0,205 0,060 0,071 0,166 0,029 0,066 0,162 0,122 0,069 0,080 0,094 0,030 0,022 0,031 0,083 0,099 0,086 0,085 0,075 0,013 0,107 0,188 0,199 0,653 1,131 0,220 0,140 0,144 0,154 0,000 0,143 0,151 0,161 0,169 0,145 0,171 0,114 0,108 0,137 0,113 0,150 0,147 0,211 0,097 0,122 0,255 0,121 0,089 0,249 0,178 0,128 0,155 0,186 0,106 0,124 0,108 0,137 0,202 0,231 0,188 0,171 0,135 0,154 0,189 0,228 0,180 0,135 0,221 0,151 0,163 0,154 0,191 0,193 0,193 0,193 0,193 0,193 0,193 0,193 0,193 0,193 0,000 0,000 0,116 0,193 0,193 0,124 0,000 0,000 0,193 0,193 0,124 0,000 0,000 0,193 0,000
Services 0,113 0,156 0,147 0,054 0,057 0,155 0,109 0,070 0,122 0,079 0,090 0,079 0,151 0,056 0,070 0,096 0,033 0,065 0,140 0,090 0,065 0,067 0,058 0,028 0,013 0,029 0,068 0,070 0,046 0,048 0,050 0,010 0,095 0,135 0,154 0,704 0,138 1,185 0,138 0,139 0,183 0,000 0,128 0,156 0,147 0,191 0,120 0,155 0,113 0,121 0,132 0,115 0,139 0,124 0,155 0,091 0,120 0,147 0,120 0,100 0,215 0,131 0,122 0,130 0,115 0,098 0,075 0,101 0,112 0,142 0,124 0,106 0,114 0,105 0,136 0,135 0,173 0,195 0,141 0,186 0,149 0,158 0,183 0,216 0,219 0,219 0,218 0,219 0,218 0,219 0,219 0,219 0,219 0,000 0,000 0,132 0,219 0,219 0,140 0,000 0,000 0,219 0,219 0,140 0,000 0,000 0,219 0,000
Electricity 0,043 0,048 0,047 0,016 0,020 0,053 0,039 0,020 0,041 0,027 0,029 0,029 0,055 0,025 0,024 0,040 0,010 0,021 0,050 0,055 0,023 0,025 0,035 0,010 0,005 0,015 0,027 0,023 0,021 0,022 0,018 0,004 0,043 0,043 0,048 0,232 0,037 0,055 1,043 0,069 0,052 0,000 0,049 0,048 0,047 0,056 0,043 0,053 0,040 0,035 0,044 0,039 0,044 0,045 0,057 0,040 0,041 0,061 0,039 0,029 0,076 0,080 0,043 0,048 0,070 0,036 0,030 0,051 0,045 0,046 0,057 0,050 0,042 0,043 0,062 0,043 0,054 0,064 0,038 0,056 0,046 0,079 0,052 0,063 0,064 0,064 0,063 0,064 0,063 0,064 0,064 0,064 0,064 0,000 0,000 0,038 0,064 0,064 0,041 0,000 0,000 0,064 0,064 0,041 0,000 0,000 0,064 0,000
Real estate 0,069 0,101 0,089 0,035 0,037 0,093 0,070 0,045 0,076 0,051 0,052 0,050 0,097 0,034 0,045 0,058 0,021 0,040 0,051 0,051 0,040 0,043 0,037 0,017 0,008 0,018 0,040 0,039 0,025 0,029 0,029 0,007 0,055 0,085 0,094 0,492 0,074 0,133 0,083 1,077 0,110 0,000 0,078 0,101 0,089 0,124 0,077 0,093 0,072 0,079 0,082 0,074 0,079 0,078 0,099 0,055 0,078 0,090 0,074 0,065 0,078 0,074 0,075 0,083 0,073 0,060 0,045 0,063 0,066 0,078 0,068 0,065 0,067 0,071 0,079 0,085 0,104 0,136 0,076 0,134 0,090 0,088 0,110 0,141 0,143 0,143 0,142 0,143 0,142 0,143 0,143 0,143 0,143 0,000 0,000 0,086 0,143 0,143 0,092 0,000 0,000 0,143 0,143 0,092 0,000 0,000 0,143 0,000
Public administration services 0,001 0,001 0,001 0,000 0,000 0,001 0,001 0,000 0,001 0,001 0,001 0,001 0,001 0,000 0,000 0,001 0,000 0,000 0,000 0,001 0,000 0,000 0,000 0,000 0,000 0,000 0,000 0,000 0,000 0,000 0,000 0,000 0,001 0,001 0,001 0,004 0,001 0,001 0,001 0,001 1,001 0,000 0,001 0,001 0,001 0,001 0,001 0,001 0,001 0,001 0,001 0,001 0,001 0,001 0,001 0,001 0,001 0,001 0,001 0,001 0,001 0,001 0,001 0,001 0,001 0,001 0,000 0,001 0,001 0,001 0,001 0,001 0,001 0,001 0,001 0,001 0,001 0,001 0,001 0,001 0,001 0,001 0,001 0,001 0,002 0,002 0,002 0,002 0,002 0,002 0,002 0,002 0,002 0,000 0,000 0,001 0,002 0,002 0,001 0,000 0,000 0,002 0,002 0,001 0,000 0,000 0,002 0,000
Distribution Margin 0,142 0,068 0,082 0,019 0,064 0,094 0,162 0,281 0,194 0,319 0,129 0,273 0,055 0,279 0,283 0,238 0,137 0,243 0,262 0,211 0,222 0,225 0,192 0,197 0,153 0,249 0,279 0,142 0,161 0,219 0,169 0,234 0,130 0,083 0,048 -2,413 0,019 0,062 0,058 0,034 0,100 1,000 0,102 0,068 0,082 0,066 0,102 0,094 0,133 0,080 0,078 0,150 0,096 0,122 0,046 0,109 0,160 0,078 0,148 0,092 0,100 0,113 0,182 0,149 0,104 0,116 0,144 0,142 0,100 0,052 0,089 0,123 0,122 0,138 0,088 0,083 0,053 0,058 0,081 0,062 0,062 0,037 0,100 0,069 0,070 0,070 0,070 0,070 0,070 0,070 0,070 0,070 0,070 0,000 0,000 0,042 0,070 0,070 0,045 0,000 0,000 0,070 0,070 0,045 0,000 0,000 0,070 0,000
ACTIVITIES
Bananas 0,884 0,002 0,002 0,001 0,001 0,002 0,010 0,001 0,026 0,005 0,001 0,004 0,002 0,002 0,001 0,001 0,000 0,001 0,001 0,002 0,001 0,001 0,001 0,000 0,000 0,000 0,001 0,001 0,000 0,001 0,001 0,000 0,003 0,002 0,002 0,006 0,001 0,002 0,001 0,001 0,002 0,000 1,001 0,002 0,002 0,002 0,001 0,002 0,010 0,002 0,028 0,007 0,001 0,007 0,002 0,003 0,002 0,002 0,002 0,001 0,001 0,003 0,003 0,002 0,001 0,001 0,001 0,001 0,001 0,001 0,001 0,001 0,001 0,001 0,005 0,002 0,002 0,002 0,001 0,002 0,002 0,002 0,002 0,003 0,003 0,003 0,003 0,003 0,003 0,003 0,003 0,003 0,003 0,000 0,000 0,002 0,003 0,003 0,002 0,000 0,000 0,003 0,003 0,002 0,000 0,000 0,003 0,000
Coffee beans 0,004 1,008 0,006 0,002 0,002 0,006 0,006 0,003 0,010 0,006 0,003 0,004 0,681 0,007 0,008 0,004 0,001 0,036 0,003 0,003 0,003 0,003 0,002 0,001 0,000 0,001 0,002 0,002 0,002 0,002 0,002 0,000 0,004 0,005 0,006 0,022 0,005 0,007 0,005 0,005 0,007 0,000 0,005 1,008 0,006 0,008 0,005 0,006 0,006 0,006 0,011 0,008 0,005 0,006 0,700 0,011 0,014 0,006 0,067 0,004 0,005 0,005 0,006 0,005 0,005 0,005 0,003 0,004 0,004 0,005 0,004 0,004 0,004 0,004 0,006 0,005 0,006 0,006 0,005 0,007 0,006 0,006 0,007 0,009 0,009 0,009 0,009 0,009 0,009 0,009 0,009 0,009 0,009 0,000 0,000 0,006 0,009 0,009 0,006 0,000 0,000 0,009 0,009 0,006 0,000 0,000 0,009 0,000
Sugar cane 0,005 0,008 1,034 0,003 0,003 0,007 0,023 0,004 0,013 0,012 0,004 0,005 0,007 0,005 0,018 0,365 0,002 0,012 0,004 0,004 0,004 0,003 0,003 0,001 0,001 0,001 0,003 0,003 0,002 0,002 0,002 0,000 0,005 0,006 0,006 0,026 0,005 0,008 0,006 0,006 0,010 0,000 0,006 0,008 1,034 0,009 0,006 0,007 0,024 0,007 0,014 0,018 0,006 0,007 0,007 0,007 0,031 0,561 0,022 0,007 0,005 0,006 0,008 0,006 0,005 0,005 0,003 0,005 0,005 0,006 0,005 0,005 0,005 0,005 0,007 0,006 0,007 0,007 0,005 0,008 0,006 0,006 0,010 0,010 0,011 0,011 0,011 0,011 0,011 0,011 0,011 0,011 0,011 0,000 0,000 0,006 0,011 0,011 0,007 0,000 0,000 0,011 0,011 0,007 0,000 0,000 0,011 0,000
Cocoa beans, unroasted and roasted 0,000 0,000 0,000 0,282 0,000 0,000 0,000 0,000 0,000 0,000 0,000 0,000 0,000 0,000 0,000 0,000 0,000 0,002 0,000 0,000 0,000 0,000 0,000 0,000 0,000 0,000 0,000 0,000 0,000 0,000 0,000 0,000 0,000 0,000 0,000 0,001 0,000 0,000 0,000 0,000 0,000 0,000 0,000 0,000 0,000 1,000 0,000 0,000 0,000 0,000 0,000 0,000 0,000 0,000 0,000 0,000 0,000 0,000 0,000 0,000 0,000 0,000 0,000 0,000 0,000 0,000 0,000 0,000 0,000 0,000 0,000 0,000 0,000 0,000 0,000 0,000 0,000 0,000 0,000 0,000 0,000 0,000 0,000 0,000 0,000 0,000 0,000 0,000 0,000 0,000 0,000 0,000 0,000 0,000 0,000 0,000 0,000 0,000 0,000 0,000 0,000 0,000 0,000 0,000 0,000 0,000 0,000 0,000
Staple grains 0,007 0,011 0,010 0,004 0,505 0,010 0,062 0,005 0,008 0,028 0,005 0,010 0,010 0,146 0,021 0,006 0,002 0,007 0,005 0,005 0,008 0,005 0,004 0,002 0,001 0,002 0,004 0,004 0,003 0,003 0,003 0,001 0,006 0,009 0,009 0,038 0,008 0,012 0,009 0,008 0,013 0,000 0,008 0,011 0,010 0,014 1,057 0,010 0,064 0,009 0,009 0,041 0,008 0,016 0,011 0,237 0,036 0,010 0,014 0,007 0,008 0,008 0,016 0,010 0,008 0,006 0,005 0,007 0,007 0,008 0,007 0,007 0,007 0,007 0,008 0,009 0,011 0,010 0,008 0,012 0,009 0,009 0,013 0,015 0,016 0,016 0,016 0,016 0,016 0,016 0,016 0,016 0,016 0,000 0,000 0,009 0,016 0,016 0,010 0,000 0,000 0,016 0,016 0,010 0,000 0,000 0,016 0,000
Tobacco 0,000 0,000 0,000 0,000 0,000 1,000 0,000 0,000 0,000 0,000 0,000 0,000 0,000 0,000 0,000 0,000 0,000 0,000 0,001 0,000 0,000 0,000 0,000 0,000 0,000 0,000 0,000 0,000 0,000 0,000 0,000 0,000 0,000 0,000 0,000 0,000 0,000 0,000 0,000 0,000 0,000 0,000 0,000 0,000 0,000 0,000 0,000 1,000 0,000 0,000 0,000 0,000 0,000 0,000 0,000 0,000 0,000 0,000 0,000 0,000 0,002 0,000 0,000 0,000 0,000 0,000 0,000 0,000 0,000 0,000 0,000 0,000 0,000 0,000 0,000 0,000 0,000 0,000 0,000 0,000 0,000 0,000 0,000 0,000 0,000 0,000 0,000 0,000 0,000 0,000 0,000 0,000 0,000 0,000 0,000 0,000 0,000 0,000 0,000 0,000 0,000 0,000 0,000 0,000 0,000 0,000 0,000 0,000
Livestock 0,044 0,066 0,058 0,023 0,024 0,060 1,030 0,033 0,049 0,443 0,033 0,032 0,062 0,029 0,046 0,038 0,014 0,070 0,031 0,033 0,099 0,028 0,024 0,011 0,005 0,012 0,025 0,024 0,016 0,018 0,018 0,004 0,034 0,053 0,057 0,228 0,046 0,071 0,052 0,050 0,083 0,000 0,050 0,066 0,058 0,082 0,050 0,060 1,066 0,057 0,053 0,645 0,051 0,050 0,064 0,047 0,078 0,058 0,129 0,043 0,048 0,048 0,184 0,055 0,046 0,039 0,028 0,040 0,040 0,049 0,043 0,040 0,042 0,042 0,049 0,054 0,064 0,063 0,047 0,071 0,056 0,056 0,083 0,093 0,094 0,094 0,094 0,094 0,094 0,094 0,094 0,094 0,094 0,000 0,000 0,057 0,094 0,094 0,060 0,000 0,000 0,094 0,094 0,060 0,000 0,000 0,094 0,000
Forestry, fisheries 0,027 0,007 0,006 0,002 0,002 0,008 0,005 0,581 0,006 0,004 0,162 0,004 0,007 0,003 0,004 0,004 0,001 0,010 0,003 0,003 0,003 0,100 0,002 0,001 0,001 0,001 0,003 0,009 0,002 0,002 0,002 0,001 0,009 0,009 0,006 0,025 0,005 0,008 0,005 0,005 0,008 0,000 0,031 0,007 0,006 0,008 0,005 0,008 0,005 1,006 0,007 0,006 0,248 0,006 0,007 0,005 0,007 0,006 0,019 0,004 0,005 0,005 0,005 0,195 0,005 0,005 0,003 0,004 0,004 0,018 0,005 0,005 0,005 0,006 0,013 0,009 0,007 0,007 0,005 0,008 0,006 0,006 0,008 0,009 0,010 0,010 0,010 0,010 0,010 0,010 0,010 0,010 0,010 0,000 0,000 0,006 0,010 0,010 0,006 0,000 0,000 0,010 0,010 0,006 0,000 0,000 0,010 0,000
Other agricultural products 0,019 0,029 0,025 0,010 0,011 0,027 0,037 0,013 0,958 0,022 0,014 0,151 0,027 0,046 0,019 0,017 0,006 0,019 0,014 0,046 0,014 0,013 0,010 0,006 0,002 0,005 0,011 0,010 0,007 0,008 0,008 0,002 0,112 0,023 0,025 0,100 0,020 0,031 0,023 0,022 0,032 0,000 0,022 0,029 0,025 0,036 0,022 0,027 0,039 0,023 1,038 0,032 0,022 0,237 0,028 0,075 0,033 0,025 0,035 0,019 0,021 0,067 0,027 0,025 0,020 0,020 0,012 0,019 0,018 0,021 0,019 0,018 0,019 0,019 0,161 0,023 0,028 0,028 0,020 0,031 0,025 0,025 0,032 0,040 0,041 0,041 0,041 0,041 0,041 0,041 0,041 0,041 0,041 0,000 0,000 0,025 0,041 0,041 0,026 0,000 0,000 0,041 0,041 0,026 0,000 0,000 0,041 0,000
Meat and dairy products 0,066 0,100 0,088 0,035 0,036 0,091 0,072 0,049 0,074 0,776 0,050 0,048 0,094 0,046 0,062 0,057 0,021 0,117 0,047 0,050 0,168 0,042 0,036 0,017 0,007 0,018 0,037 0,036 0,024 0,027 0,028 0,006 0,052 0,081 0,086 0,345 0,069 0,107 0,079 0,075 0,129 0,000 0,075 0,100 0,088 0,124 0,076 0,091 0,075 0,085 0,081 1,131 0,076 0,076 0,097 0,075 0,106 0,088 0,216 0,065 0,072 0,073 0,314 0,082 0,070 0,059 0,042 0,061 0,061 0,074 0,066 0,061 0,064 0,064 0,075 0,081 0,097 0,095 0,071 0,108 0,085 0,085 0,129 0,140 0,142 0,142 0,142 0,142 0,142 0,142 0,142 0,142 0,142 0,000 0,000 0,086 0,142 0,142 0,091 0,000 0,000 0,142 0,142 0,091 0,000 0,000 0,142 0,000
Fish canning 0,009 0,013 0,011 0,004 0,005 0,012 0,010 0,007 0,010 0,009 0,707 0,007 0,012 0,009 0,011 0,007 0,003 0,039 0,006 0,006 0,005 0,006 0,005 0,002 0,001 0,002 0,005 0,034 0,003 0,004 0,004 0,001 0,007 0,011 0,011 0,050 0,009 0,014 0,010 0,011 0,014 0,000 0,010 0,013 0,011 0,016 0,010 0,012 0,011 0,013 0,010 0,013 1,084 0,010 0,012 0,014 0,019 0,011 0,072 0,008 0,009 0,009 0,010 0,011 0,009 0,009 0,005 0,008 0,008 0,068 0,008 0,008 0,009 0,008 0,010 0,011 0,012 0,014 0,009 0,015 0,011 0,011 0,014 0,018 0,018 0,018 0,018 0,018 0,018 0,018 0,018 0,018 0,018 0,000 0,000 0,011 0,018 0,018 0,012 0,000 0,000 0,018 0,018 0,012 0,000 0,000 0,018 0,000
Edible oils 0,014 0,020 0,018 0,007 0,008 0,019 0,024 0,009 0,015 0,015 0,010 0,761 0,019 0,007 0,015 0,012 0,004 0,009 0,010 0,010 0,009 0,008 0,007 0,006 0,001 0,004 0,008 0,007 0,005 0,006 0,006 0,001 0,011 0,016 0,017 0,069 0,014 0,022 0,016 0,015 0,022 0,000 0,016 0,020 0,018 0,025 0,016 0,019 0,025 0,016 0,017 0,022 0,015 1,198 0,020 0,011 0,026 0,018 0,017 0,013 0,015 0,015 0,016 0,016 0,014 0,022 0,009 0,013 0,013 0,015 0,013 0,012 0,013 0,013 0,015 0,016 0,019 0,019 0,014 0,022 0,017 0,017 0,022 0,028 0,028 0,028 0,028 0,028 0,028 0,028 0,028 0,028 0,028 0,000 0,000 0,017 0,028 0,028 0,018 0,000 0,000 0,028 0,028 0,018 0,000 0,000 0,028 0,000
Coffee processing 0,006 0,009 0,008 0,003 0,003 0,008 0,008 0,005 0,007 0,008 0,005 0,004 0,981 0,009 0,012 0,005 0,002 0,052 0,004 0,005 0,004 0,004 0,003 0,002 0,001 0,002 0,003 0,003 0,002 0,003 0,003 0,001 0,005 0,007 0,008 0,032 0,006 0,010 0,007 0,007 0,010 0,000 0,007 0,009 0,008 0,011 0,007 0,008 0,008 0,008 0,007 0,011 0,007 0,007 1,009 0,015 0,020 0,008 0,096 0,006 0,007 0,007 0,008 0,008 0,006 0,006 0,004 0,006 0,006 0,007 0,006 0,006 0,006 0,006 0,007 0,007 0,009 0,009 0,007 0,010 0,008 0,008 0,010 0,013 0,013 0,013 0,013 0,013 0,013 0,013 0,013 0,013 0,013 0,000 0,000 0,008 0,013 0,013 0,008 0,000 0,000 0,013 0,013 0,008 0,000 0,000 0,013 0,000
Milling of grains 0,024 0,036 0,032 0,013 0,013 0,033 0,194 0,017 0,027 0,089 0,018 0,017 0,034 0,630 0,085 0,021 0,008 0,024 0,017 0,018 0,027 0,018 0,013 0,006 0,003 0,006 0,013 0,013 0,009 0,010 0,010 0,002 0,019 0,029 0,031 0,124 0,025 0,038 0,028 0,027 0,042 0,000 0,027 0,036 0,032 0,045 0,027 0,033 0,201 0,030 0,029 0,130 0,027 0,027 0,035 1,022 0,144 0,032 0,045 0,023 0,026 0,026 0,050 0,035 0,025 0,021 0,015 0,022 0,022 0,026 0,024 0,022 0,023 0,023 0,027 0,029 0,035 0,034 0,025 0,039 0,031 0,031 0,042 0,050 0,051 0,051 0,051 0,051 0,051 0,051 0,051 0,051 0,051 0,000 0,000 0,031 0,051 0,051 0,033 0,000 0,000 0,051 0,051 0,033 0,000 0,000 0,051 0,000
Bakery products 0,008 0,013 0,011 0,004 0,005 0,011 0,009 0,007 0,009 0,006 0,007 0,006 0,012 0,004 0,591 0,007 0,003 0,005 0,006 0,006 0,005 0,005 0,004 0,002 0,001 0,002 0,005 0,005 0,003 0,003 0,004 0,001 0,007 0,010 0,011 0,043 0,009 0,013 0,010 0,010 0,023 0,000 0,009 0,013 0,011 0,016 0,009 0,011 0,009 0,013 0,010 0,009 0,010 0,010 0,012 0,007 1,010 0,011 0,009 0,008 0,009 0,009 0,009 0,011 0,009 0,007 0,005 0,008 0,008 0,009 0,008 0,008 0,008 0,008 0,009 0,010 0,012 0,012 0,009 0,013 0,011 0,011 0,023 0,018 0,018 0,018 0,018 0,018 0,018 0,018 0,018 0,018 0,018 0,000 0,000 0,011 0,018 0,018 0,011 0,000 0,000 0,018 0,018 0,011 0,000 0,000 0,018 0,000
Sugar 0,009 0,013 0,012 0,005 0,005 0,012 0,041 0,007 0,010 0,022 0,007 0,006 0,012 0,008 0,033 0,660 0,004 0,022 0,006 0,007 0,008 0,006 0,005 0,003 0,001 0,002 0,005 0,005 0,003 0,004 0,004 0,001 0,007 0,011 0,011 0,045 0,009 0,014 0,010 0,010 0,018 0,000 0,010 0,013 0,012 0,016 0,010 0,012 0,042 0,011 0,011 0,032 0,010 0,010 0,013 0,013 0,056 1,014 0,040 0,012 0,010 0,010 0,015 0,011 0,009 0,009 0,006 0,008 0,008 0,010 0,009 0,008 0,008 0,008 0,010 0,011 0,013 0,013 0,010 0,014 0,011 0,011 0,018 0,018 0,019 0,019 0,019 0,019 0,019 0,019 0,019 0,019 0,019 0,000 0,000 0,011 0,019 0,019 0,012 0,000 0,000 0,019 0,019 0,012 0,000 0,000 0,019 0,000
Other manufactured products 0,020 0,025 0,024 0,008 0,010 0,025 0,018 0,061 0,020 0,018 0,028 0,013 0,028 0,009 0,011 0,020 0,394 0,011 0,019 0,016 0,011 0,020 0,012 0,004 0,003 0,005 0,011 0,013 0,010 0,010 0,009 0,002 0,015 0,025 0,027 0,096 0,095 0,031 0,022 0,022 0,085 0,000 0,023 0,025 0,024 0,029 0,021 0,025 0,018 0,105 0,021 0,026 0,042 0,021 0,029 0,015 0,020 0,031 0,021 1,193 0,028 0,023 0,021 0,039 0,023 0,016 0,015 0,016 0,018 0,026 0,026 0,022 0,021 0,019 0,022 0,025 0,030 0,026 0,097 0,031 0,023 0,024 0,085 0,033 0,033 0,033 0,033 0,033 0,033 0,033 0,033 0,033 0,033 0,000 0,000 0,020 0,033 0,033 0,021 0,000 0,000 0,033 0,033 0,021 0,000 0,000 0,033 0,000
Beverages 0,040 0,059 0,052 0,020 0,022 0,054 0,061 0,034 0,044 0,069 0,031 0,028 0,055 0,095 0,119 0,034 0,014 0,623 0,028 0,029 0,030 0,026 0,021 0,014 0,004 0,011 0,023 0,021 0,014 0,016 0,016 0,004 0,031 0,047 0,050 0,201 0,041 0,062 0,046 0,045 0,068 0,000 0,045 0,059 0,052 0,072 0,045 0,054 0,063 0,060 0,048 0,100 0,047 0,045 0,057 0,155 0,203 0,052 1,150 0,043 0,042 0,043 0,056 0,051 0,041 0,048 0,025 0,037 0,037 0,044 0,038 0,036 0,038 0,037 0,044 0,047 0,057 0,056 0,042 0,063 0,050 0,050 0,068 0,082 0,083 0,083 0,083 0,083 0,083 0,083 0,083 0,083 0,083 0,000 0,000 0,050 0,083 0,083 0,053 0,000 0,000 0,083 0,083 0,053 0,000 0,000 0,083 0,000
Tobacco products 0,006 0,010 0,008 0,003 0,003 0,009 0,007 0,005 0,007 0,005 0,005 0,005 0,009 0,003 0,004 0,006 0,002 0,004 0,769 0,005 0,004 0,004 0,003 0,002 0,001 0,002 0,004 0,004 0,002 0,003 0,003 0,001 0,005 0,008 0,008 0,033 0,007 0,010 0,008 0,007 0,010 0,000 0,007 0,010 0,008 0,012 0,007 0,009 0,007 0,008 0,008 0,007 0,007 0,007 0,009 0,005 0,007 0,008 0,007 0,006 1,178 0,007 0,007 0,008 0,007 0,006 0,004 0,006 0,006 0,007 0,006 0,006 0,006 0,006 0,007 0,008 0,009 0,009 0,007 0,010 0,008 0,008 0,010 0,014 0,014 0,014 0,014 0,014 0,014 0,014 0,014 0,014 0,014 0,000 0,000 0,008 0,014 0,014 0,009 0,000 0,000 0,014 0,014 0,009 0,000 0,000 0,014 0,000
Textiles and garments 0,035 0,052 0,045 0,018 0,022 0,053 0,037 0,023 0,043 0,026 0,025 0,025 0,052 0,024 0,024 0,029 0,011 0,021 0,024 0,777 0,024 0,023 0,018 0,009 0,004 0,016 0,022 0,019 0,014 0,015 0,015 0,003 0,082 0,042 0,047 0,182 0,036 0,056 0,041 0,039 0,055 0,000 0,039 0,052 0,045 0,063 0,046 0,053 0,038 0,040 0,046 0,038 0,038 0,040 0,054 0,039 0,040 0,045 0,038 0,033 0,037 1,137 0,044 0,045 0,036 0,032 0,023 0,056 0,037 0,038 0,037 0,033 0,035 0,035 0,118 0,042 0,051 0,050 0,037 0,057 0,044 0,044 0,055 0,072 0,072 0,072 0,072 0,072 0,072 0,072 0,072 0,072 0,072 0,000 0,000 0,044 0,072 0,072 0,046 0,000 0,000 0,072 0,072 0,046 0,000 0,000 0,072 0,000
Leather goods and footwear 0,004 0,006 0,005 0,002 0,002 0,005 0,004 0,003 0,004 0,003 0,003 0,003 0,005 0,002 0,002 0,003 0,001 0,002 0,003 0,007 0,595 0,003 0,002 0,001 0,000 0,001 0,006 0,002 0,001 0,002 0,002 0,001 0,003 0,005 0,005 0,020 0,004 0,008 0,004 0,004 0,008 0,000 0,004 0,006 0,005 0,008 0,004 0,005 0,004 0,005 0,005 0,004 0,004 0,004 0,005 0,003 0,004 0,005 0,004 0,004 0,004 0,011 1,110 0,006 0,004 0,003 0,002 0,005 0,009 0,004 0,004 0,004 0,004 0,005 0,005 0,005 0,006 0,005 0,004 0,008 0,005 0,005 0,008 0,008 0,008 0,008 0,008 0,008 0,008 0,008 0,008 0,008 0,008 0,000 0,000 0,005 0,008 0,008 0,005 0,000 0,000 0,008 0,008 0,005 0,000 0,000 0,008 0,000
Timber and furniture 0,004 0,007 0,007 0,002 0,002 0,014 0,004 0,003 0,008 0,003 0,003 0,003 0,008 0,002 0,003 0,004 0,001 0,003 0,003 0,003 0,003 0,533 0,002 0,001 0,001 0,001 0,002 0,002 0,003 0,003 0,002 0,001 0,031 0,020 0,006 0,021 0,005 0,007 0,005 0,005 0,007 0,000 0,005 0,007 0,007 0,007 0,004 0,014 0,005 0,005 0,009 0,005 0,005 0,005 0,009 0,004 0,005 0,007 0,005 0,004 0,005 0,005 0,005 1,035 0,004 0,003 0,004 0,004 0,004 0,005 0,009 0,007 0,004 0,011 0,045 0,020 0,007 0,006 0,005 0,007 0,006 0,005 0,007 0,008 0,008 0,008 0,008 0,008 0,008 0,008 0,008 0,008 0,008 0,000 0,000 0,005 0,008 0,008 0,005 0,000 0,000 0,008 0,008 0,005 0,000 0,000 0,008 0,000
Paper and printing 0,101 0,036 0,032 0,012 0,014 0,034 0,027 0,016 0,030 0,019 0,019 0,018 0,036 0,014 0,018 0,031 0,008 0,015 0,062 0,033 0,017 0,015 0,632 0,008 0,004 0,007 0,019 0,015 0,011 0,014 0,019 0,003 0,028 0,032 0,045 0,198 0,026 0,045 0,032 0,029 0,040 0,000 0,115 0,036 0,032 0,044 0,028 0,034 0,028 0,028 0,033 0,028 0,029 0,029 0,037 0,023 0,031 0,047 0,028 0,023 0,095 0,049 0,031 0,029 1,247 0,028 0,021 0,025 0,032 0,030 0,029 0,031 0,045 0,027 0,041 0,032 0,051 0,055 0,027 0,045 0,034 0,032 0,040 0,049 0,050 0,050 0,050 0,050 0,050 0,050 0,050 0,050 0,050 0,000 0,000 0,030 0,050 0,050 0,032 0,000 0,000 0,050 0,050 0,032 0,000 0,000 0,050 0,000
Chemicals 0,093 0,080 0,093 0,019 0,072 0,135 0,054 0,022 0,086 0,033 0,025 0,045 0,068 0,036 0,026 0,051 0,010 0,023 0,044 0,079 0,033 0,032 0,027 0,329 0,005 0,036 0,119 0,043 0,017 0,024 0,027 0,005 0,053 0,052 0,047 0,194 0,037 0,065 0,043 0,038 0,064 0,000 0,106 0,080 0,093 0,067 0,151 0,135 0,056 0,038 0,093 0,049 0,039 0,071 0,070 0,058 0,044 0,078 0,042 0,031 0,067 0,115 0,062 0,062 0,054 1,176 0,031 0,124 0,196 0,087 0,044 0,052 0,062 0,056 0,076 0,053 0,052 0,054 0,038 0,065 0,046 0,042 0,064 0,068 0,068 0,068 0,068 0,068 0,068 0,068 0,068 0,068 0,068 0,000 0,000 0,041 0,068 0,068 0,044 0,000 0,000 0,068 0,068 0,044 0,000 0,000 0,068 0,000
Oil refineries 0,012 0,012 0,023 0,004 0,008 0,020 0,013 0,006 0,012 0,008 0,007 0,009 0,014 0,006 0,006 0,014 0,002 0,005 0,009 0,012 0,005 0,005 0,008 0,003 0,178 0,003 0,005 0,008 0,012 0,006 0,005 0,001 0,011 0,019 0,013 0,045 0,022 0,014 0,021 0,009 0,011 0,000 0,013 0,012 0,023 0,013 0,016 0,020 0,013 0,010 0,012 0,011 0,011 0,014 0,015 0,010 0,010 0,021 0,010 0,006 0,013 0,017 0,010 0,011 0,016 0,009 1,017 0,011 0,009 0,016 0,032 0,013 0,011 0,011 0,016 0,019 0,015 0,013 0,023 0,014 0,023 0,010 0,011 0,013 0,014 0,014 0,014 0,014 0,014 0,014 0,014 0,014 0,014 0,000 0,000 0,008 0,014 0,014 0,009 0,000 0,000 0,014 0,014 0,009 0,000 0,000 0,014 0,000
Tires 0,006 0,008 0,011 0,002 0,004 0,010 0,005 0,004 0,007 0,004 0,004 0,004 0,008 0,003 0,003 0,007 0,002 0,003 0,004 0,004 0,003 0,003 0,003 0,001 0,001 0,290 0,003 0,003 0,003 0,004 0,003 0,002 0,004 0,008 0,007 0,026 0,013 0,008 0,006 0,006 0,011 0,000 0,007 0,008 0,011 0,009 0,009 0,010 0,006 0,007 0,007 0,006 0,006 0,006 0,008 0,005 0,006 0,010 0,006 0,005 0,007 0,006 0,006 0,006 0,006 0,004 0,006 1,006 0,005 0,006 0,007 0,009 0,006 0,023 0,006 0,008 0,008 0,007 0,014 0,008 0,006 0,006 0,011 0,010 0,010 0,010 0,010 0,010 0,010 0,010 0,010 0,010 0,010 0,000 0,000 0,006 0,010 0,010 0,006 0,000 0,000 0,010 0,010 0,006 0,000 0,000 0,010 0,000
Rubber and plastics 0,041 0,028 0,026 0,009 0,011 0,028 0,021 0,013 0,028 0,016 0,015 0,015 0,027 0,014 0,014 0,017 0,006 0,013 0,016 0,035 0,039 0,013 0,018 0,009 0,002 0,058 0,638 0,011 0,009 0,021 0,032 0,002 0,020 0,029 0,029 0,154 0,022 0,037 0,023 0,021 0,030 0,000 0,047 0,028 0,026 0,033 0,023 0,028 0,022 0,022 0,031 0,024 0,023 0,024 0,028 0,022 0,024 0,026 0,024 0,017 0,024 0,051 0,074 0,026 0,036 0,032 0,014 0,201 1,052 0,023 0,023 0,046 0,074 0,023 0,029 0,029 0,032 0,043 0,022 0,037 0,025 0,024 0,030 0,038 0,038 0,038 0,038 0,038 0,038 0,038 0,038 0,038 0,038 0,000 0,000 0,023 0,038 0,038 0,025 0,000 0,000 0,038 0,038 0,025 0,000 0,000 0,038 0,000
Glass and ceramics 0,003 0,004 0,004 0,001 0,002 0,004 0,003 0,002 0,003 0,002 0,004 0,011 0,004 0,002 0,002 0,002 0,001 0,002 0,002 0,002 0,002 0,002 0,001 0,002 0,000 0,001 0,002 0,514 0,001 0,002 0,004 0,001 0,002 0,008 0,004 0,016 0,003 0,007 0,003 0,003 0,004 0,000 0,003 0,004 0,004 0,005 0,003 0,004 0,003 0,003 0,003 0,003 0,006 0,017 0,004 0,002 0,003 0,004 0,004 0,003 0,003 0,003 0,003 0,004 0,003 0,007 0,002 0,003 0,003 1,045 0,003 0,005 0,010 0,006 0,003 0,008 0,004 0,004 0,003 0,007 0,004 0,003 0,004 0,006 0,006 0,006 0,006 0,006 0,006 0,006 0,006 0,006 0,006 0,000 0,000 0,003 0,006 0,006 0,004 0,000 0,000 0,006 0,006 0,004 0,000 0,000 0,006 0,000
Construction materials 0,008 0,009 0,013 0,003 0,005 0,012 0,011 0,004 0,014 0,006 0,007 0,007 0,011 0,005 0,005 0,010 0,002 0,004 0,022 0,008 0,008 0,005 0,005 0,005 0,056 0,002 0,005 0,027 0,423 0,004 0,003 0,001 0,035 0,094 0,012 0,037 0,011 0,011 0,032 0,008 0,017 0,000 0,009 0,009 0,013 0,011 0,011 0,012 0,011 0,007 0,016 0,009 0,011 0,011 0,011 0,007 0,008 0,016 0,008 0,005 0,034 0,012 0,015 0,009 0,010 0,019 0,319 0,008 0,008 0,054 1,136 0,009 0,008 0,008 0,051 0,094 0,012 0,010 0,011 0,011 0,035 0,009 0,017 0,012 0,012 0,012 0,012 0,012 0,012 0,012 0,012 0,012 0,012 0,000 0,000 0,007 0,012 0,012 0,008 0,000 0,000 0,012 0,012 0,008 0,000 0,000 0,012 0,000
Base metals 0,019 0,018 0,020 0,005 0,008 0,020 0,013 0,008 0,021 0,009 0,018 0,010 0,017 0,009 0,008 0,021 0,003 0,009 0,025 0,023 0,007 0,010 0,012 0,004 0,002 0,007 0,010 0,008 0,007 0,542 0,040 0,003 0,025 0,048 0,016 0,072 0,014 0,022 0,014 0,012 0,018 0,000 0,022 0,018 0,020 0,018 0,017 0,020 0,014 0,013 0,022 0,013 0,027 0,015 0,018 0,015 0,014 0,033 0,016 0,010 0,038 0,034 0,014 0,019 0,023 0,014 0,012 0,025 0,016 0,015 0,020 1,201 0,092 0,032 0,036 0,049 0,017 0,020 0,014 0,022 0,015 0,014 0,018 0,021 0,021 0,021 0,021 0,021 0,021 0,021 0,021 0,021 0,021 0,000 0,000 0,013 0,021 0,021 0,014 0,000 0,000 0,021 0,021 0,014 0,000 0,000 0,021 0,000
Electrical Goods 0,014 0,020 0,018 0,007 0,007 0,023 0,014 0,009 0,017 0,010 0,011 0,010 0,019 0,007 0,009 0,016 0,004 0,008 0,011 0,011 0,008 0,008 0,008 0,004 0,002 0,004 0,008 0,008 0,005 0,016 0,498 0,002 0,012 0,032 0,019 0,088 0,018 0,031 0,021 0,016 0,026 0,000 0,016 0,020 0,018 0,024 0,016 0,023 0,015 0,016 0,018 0,015 0,016 0,016 0,020 0,011 0,016 0,024 0,015 0,013 0,017 0,017 0,015 0,016 0,015 0,013 0,009 0,013 0,013 0,016 0,014 0,035 1,144 0,020 0,017 0,033 0,021 0,024 0,019 0,031 0,022 0,018 0,026 0,028 0,028 0,028 0,028 0,028 0,028 0,028 0,028 0,028 0,028 0,000 0,000 0,017 0,028 0,028 0,018 0,000 0,000 0,028 0,028 0,018 0,000 0,000 0,028 0,000
Transportation equipment 0,006 0,010 0,009 0,003 0,003 0,009 0,007 0,004 0,007 0,005 0,005 0,005 0,009 0,003 0,004 0,006 0,002 0,004 0,005 0,005 0,004 0,004 0,004 0,002 0,001 0,002 0,004 0,004 0,002 0,003 0,003 0,100 0,005 0,009 0,009 0,034 0,008 0,011 0,008 0,008 0,010 0,000 0,007 0,010 0,009 0,012 0,007 0,009 0,007 0,008 0,008 0,007 0,007 0,007 0,009 0,005 0,007 0,009 0,007 0,006 0,007 0,007 0,007 0,008 0,007 0,006 0,004 0,006 0,006 0,007 0,007 0,006 0,006 1,034 0,007 0,009 0,010 0,009 0,008 0,011 0,008 0,008 0,010 0,014 0,014 0,014 0,014 0,014 0,014 0,014 0,014 0,014 0,014 0,000 0,000 0,008 0,014 0,014 0,009 0,000 0,000 0,014 0,014 0,009 0,000 0,000 0,014 0,000
Other manufactures 0,008 0,012 0,011 0,004 0,004 0,011 0,008 0,005 0,009 0,006 0,006 0,006 0,012 0,004 0,005 0,007 0,003 0,005 0,006 0,009 0,005 0,005 0,004 0,002 0,001 0,002 0,005 0,005 0,003 0,004 0,004 0,001 0,736 0,010 0,013 0,046 0,009 0,015 0,010 0,009 0,014 0,000 0,009 0,012 0,011 0,015 0,009 0,011 0,009 0,009 0,010 0,009 0,009 0,009 0,012 0,007 0,009 0,011 0,009 0,008 0,009 0,013 0,009 0,010 0,009 0,007 0,006 0,008 0,007 0,009 0,008 0,009 0,008 0,009 1,060 0,010 0,013 0,013 0,009 0,015 0,011 0,011 0,014 0,017 0,017 0,017 0,017 0,017 0,017 0,017 0,017 0,017 0,017 0,000 0,000 0,010 0,017 0,017 0,011 0,000 0,000 0,017 0,017 0,011 0,000 0,000 0,017 0,000
Construction 0,001 0,002 0,004 0,001 0,001 0,002 0,001 0,001 0,002 0,001 0,004 0,002 0,005 0,001 0,001 0,005 0,000 0,001 0,001 0,001 0,001 0,002 0,001 0,000 0,001 0,000 0,001 0,002 0,002 0,001 0,001 0,000 0,002 1,005 0,002 0,014 0,001 0,002 0,001 0,007 0,002 0,000 0,002 0,002 0,004 0,002 0,002 0,002 0,001 0,001 0,002 0,002 0,006 0,003 0,006 0,001 0,002 0,007 0,003 0,001 0,001 0,002 0,001 0,003 0,002 0,001 0,003 0,001 0,002 0,004 0,005 0,001 0,001 0,004 0,003 1,010 0,002 0,004 0,001 0,002 0,001 0,008 0,002 0,002 0,002 0,002 0,002 0,002 0,002 0,002 0,002 0,002 0,002 0,000 0,000 0,001 0,002 0,002 0,001 0,000 0,000 0,002 0,002 0,001 0,000 0,000 0,002 0,000
Banking, finance and insurance 0,070 0,077 0,076 0,025 0,041 0,093 0,065 0,033 0,104 0,043 0,051 0,048 0,089 0,038 0,037 0,063 0,015 0,034 0,056 0,059 0,039 0,036 0,054 0,019 0,010 0,020 0,041 0,048 0,024 0,064 0,048 0,009 0,085 0,105 0,938 0,765 0,072 0,110 0,114 0,137 0,081 0,000 0,079 0,077 0,076 0,089 0,085 0,093 0,067 0,057 0,113 0,063 0,078 0,076 0,091 0,062 0,063 0,096 0,062 0,046 0,086 0,086 0,072 0,070 0,107 0,066 0,058 0,071 0,067 0,097 0,065 0,142 0,110 0,095 0,123 0,105 1,140 0,209 0,073 0,111 0,124 0,155 0,081 0,099 0,100 0,100 0,100 0,100 0,100 0,100 0,100 0,100 0,100 0,000 0,000 0,060 0,100 0,100 0,064 0,000 0,000 0,100 0,100 0,064 0,000 0,000 0,100 0,000
Commerce, restaurants and hotels 0,178 0,218 0,199 0,073 0,089 0,228 0,160 0,096 0,179 0,112 0,166 0,132 0,231 0,082 0,099 0,132 0,045 0,092 0,144 0,136 0,097 0,093 0,090 0,045 0,018 0,048 0,121 0,119 0,063 0,072 0,075 0,014 0,172 0,216 0,240 4,415 0,158 0,244 0,178 0,177 0,229 0,000 0,201 0,218 0,199 0,259 0,186 0,228 0,166 0,166 0,194 0,164 0,254 0,207 0,237 0,133 0,170 0,203 0,170 0,135 0,220 0,197 0,181 0,180 0,178 0,160 0,101 0,168 0,199 0,241 0,169 0,159 0,172 0,143 0,248 0,217 0,221 1,224 0,162 0,245 0,192 0,194 0,229 0,294 0,297 0,297 0,297 0,297 0,297 0,297 0,297 0,297 0,297 0,000 0,000 0,179 0,297 0,297 0,191 0,000 0,000 0,297 0,297 0,191 0,000 0,000 0,297 0,000
Transportation 0,123 0,148 0,157 0,047 0,068 0,167 0,108 0,061 0,124 0,076 0,095 0,091 0,200 0,059 0,070 0,162 0,029 0,064 0,158 0,119 0,067 0,078 0,092 0,029 0,021 0,030 0,081 0,097 0,084 0,083 0,073 0,013 0,105 0,184 0,198 0,642 1,098 0,215 0,137 0,152 0,151 0,000 0,140 0,148 0,157 0,165 0,142 0,167 0,112 0,106 0,134 0,111 0,146 0,144 0,206 0,095 0,119 0,249 0,119 0,087 0,242 0,174 0,125 0,151 0,182 0,103 0,121 0,105 0,134 0,197 0,225 0,184 0,167 0,132 0,151 0,185 0,223 0,177 1,132 0,217 0,148 0,160 0,151 0,187 0,189 0,189 0,189 0,189 0,189 0,189 0,189 0,189 0,189 0,000 0,000 0,114 0,189 0,189 0,121 0,000 0,000 0,189 0,189 0,121 0,000 0,000 0,189 0,000
Services 0,115 0,158 0,149 0,054 0,059 0,158 0,110 0,071 0,125 0,080 0,091 0,080 0,153 0,057 0,071 0,098 0,033 0,066 0,141 0,096 0,066 0,068 0,060 0,030 0,013 0,030 0,069 0,071 0,047 0,049 0,051 0,010 0,097 0,137 0,178 0,723 0,139 1,178 0,141 0,147 0,184 0,000 0,131 0,158 0,149 0,193 0,123 0,158 0,114 0,122 0,135 0,116 0,140 0,126 0,157 0,092 0,122 0,150 0,121 0,101 0,216 0,134 0,124 0,132 0,118 0,100 0,076 0,103 0,114 0,144 0,125 0,110 0,117 0,108 0,140 0,138 0,176 0,200 0,142 1,188 0,152 0,162 0,184 0,218 0,221 0,221 0,220 0,221 0,220 0,221 0,221 0,221 0,221 0,000 0,000 0,133 0,221 0,221 0,142 0,000 0,000 0,221 0,221 0,142 0,000 0,000 0,221 0,000
Electricity 0,040 0,044 0,043 0,014 0,019 0,049 0,036 0,019 0,037 0,024 0,027 0,026 0,051 0,023 0,022 0,036 0,009 0,019 0,046 0,050 0,021 0,023 0,032 0,009 0,005 0,013 0,025 0,021 0,020 0,021 0,017 0,004 0,039 0,039 0,044 0,213 0,034 0,051 0,956 0,063 0,048 0,000 0,045 0,044 0,043 0,051 0,039 0,049 0,037 0,032 0,040 0,036 0,041 0,041 0,052 0,037 0,037 0,056 0,036 0,027 0,070 0,073 0,040 0,044 0,064 0,033 0,028 0,047 0,041 0,042 0,052 0,046 0,038 0,039 0,057 0,040 0,049 0,059 0,035 0,051 1,042 0,073 0,048 0,058 0,058 0,058 0,058 0,058 0,058 0,058 0,058 0,058 0,058 0,000 0,000 0,035 0,058 0,058 0,037 0,000 0,000 0,058 0,058 0,037 0,000 0,000 0,058 0,000
Real estate 0,058 0,085 0,075 0,030 0,031 0,079 0,059 0,038 0,064 0,043 0,044 0,042 0,081 0,029 0,038 0,049 0,018 0,034 0,043 0,043 0,034 0,036 0,031 0,014 0,007 0,015 0,034 0,032 0,021 0,025 0,025 0,006 0,047 0,071 0,079 0,415 0,063 0,112 0,070 0,909 0,092 0,000 0,066 0,085 0,075 0,105 0,065 0,079 0,061 0,066 0,070 0,062 0,067 0,066 0,084 0,047 0,065 0,076 0,063 0,055 0,066 0,063 0,063 0,070 0,061 0,050 0,038 0,053 0,055 0,066 0,058 0,055 0,057 0,060 0,067 0,072 0,088 0,115 0,064 0,113 0,076 1,074 0,092 0,119 0,120 0,120 0,120 0,120 0,120 0,120 0,120 0,120 0,120 0,000 0,000 0,073 0,120 0,120 0,077 0,000 0,000 0,120 0,120 0,077 0,000 0,000 0,120 0,000
Public administration service 0,003 0,005 0,004 0,001 0,002 0,004 0,004 0,002 0,004 0,002 0,002 0,002 0,005 0,002 0,002 0,003 0,001 0,002 0,003 0,003 0,002 0,002 0,002 0,001 0,000 0,001 0,002 0,002 0,001 0,002 0,002 0,000 0,003 0,004 0,006 0,023 0,009 0,011 0,013 0,010 1,005 0,000 0,004 0,004 0,004 0,005 0,004 0,004 0,003 0,003 0,004 0,004 0,004 0,004 0,005 0,003 0,003 0,005 0,003 0,003 0,005 0,004 0,003 0,004 0,004 0,003 0,002 0,003 0,003 0,004 0,004 0,004 0,004 0,003 0,004 0,004 0,005 0,005 0,003 0,005 0,004 0,005 1,005 0,006 0,006 0,006 0,006 0,006 0,006 0,006 0,006 0,006 0,006 0,000 0,000 0,004 0,006 0,006 0,004 0,000 0,000 0,006 0,006 0,004 0,000 0,000 0,006 0,000
FACTORS
URBAN LABOR
Self-employed 0,022 0,030 0,036 0,009 0,018 0,027 0,022 0,015 0,026 0,015 0,022 0,015 0,031 0,014 0,034 0,023 0,005 0,025 0,020 0,041 0,027 0,024 0,022 0,005 0,003 0,006 0,017 0,014 0,009 0,011 0,019 0,002 0,040 0,068 0,066 0,252 0,045 0,061 0,024 0,033 0,028 0,000 0,025 0,030 0,036 0,031 0,037 0,027 0,022 0,026 0,028 0,022 0,034 0,024 0,032 0,023 0,059 0,035 0,046 0,016 0,030 0,060 0,050 0,047 0,044 0,018 0,014 0,021 0,027 0,028 0,023 0,025 0,044 0,023 0,057 0,069 0,075 0,070 0,046 0,062 0,026 0,037 0,028 1,035 0,035 0,035 0,035 0,035 0,035 0,035 0,035 0,035 0,035 0,000 0,000 0,021 0,035 0,035 0,023 0,000 0,000 0,035 0,035 0,023 0,000 0,000 0,035 0,000
Employer 0,015 0,020 0,021 0,006 0,020 0,019 0,018 0,013 0,017 0,011 0,013 0,010 0,020 0,011 0,037 0,014 0,005 0,010 0,013 0,015 0,015 0,020 0,009 0,004 0,002 0,005 0,026 0,009 0,006 0,008 0,011 0,004 0,038 0,062 0,055 0,188 0,027 0,038 0,017 0,027 0,020 0,000 0,017 0,020 0,021 0,021 0,041 0,019 0,019 0,022 0,018 0,017 0,020 0,016 0,021 0,017 0,063 0,021 0,018 0,014 0,019 0,021 0,028 0,038 0,017 0,013 0,011 0,018 0,043 0,019 0,017 0,018 0,025 0,039 0,054 0,062 0,064 0,052 0,027 0,039 0,018 0,030 0,020 0,024 1,024 0,024 0,024 0,024 0,024 0,024 0,024 0,024 0,024 0,000 0,000 0,015 0,024 0,024 0,015 0,000 0,000 0,024 0,024 0,015 0,000 0,000 0,024 0,000
Public Sector 0,040 0,051 0,051 0,017 0,021 0,055 0,038 0,023 0,044 0,027 0,030 0,028 0,053 0,020 0,023 0,036 0,012 0,022 0,045 0,036 0,022 0,023 0,024 0,013 0,031 0,011 0,025 0,025 0,018 0,021 0,019 0,004 0,036 0,058 0,117 0,262 0,062 0,277 0,161 0,057 0,506 0,000 0,045 0,051 0,051 0,061 0,044 0,055 0,039 0,039 0,048 0,039 0,046 0,044 0,054 0,033 0,040 0,055 0,040 0,037 0,069 0,051 0,042 0,045 0,047 0,045 0,176 0,038 0,041 0,050 0,048 0,046 0,043 0,040 0,052 0,058 0,132 0,072 0,060 0,277 0,171 0,060 0,506 0,068 0,069 1,069 0,069 0,069 0,069 0,069 0,069 0,069 0,069 0,000 0,000 0,042 0,069 0,069 0,044 0,000 0,000 0,069 0,069 0,044 0,000 0,000 0,069 0,000
Firms 0,122 0,090 0,085 0,029 0,045 0,647 0,073 0,080 0,096 0,080 0,116 0,095 0,105 0,052 0,105 0,079 0,061 0,068 0,178 0,124 0,106 0,100 0,109 0,035 0,013 0,057 0,103 0,105 0,062 0,063 0,081 0,028 0,123 0,164 0,170 0,755 0,120 0,173 0,087 0,095 0,104 0,000 0,138 0,090 0,085 0,105 0,094 0,647 0,075 0,139 0,104 0,117 0,178 0,150 0,108 0,084 0,179 0,121 0,125 0,184 0,272 0,181 0,198 0,194 0,215 0,126 0,072 0,198 0,170 0,214 0,166 0,141 0,186 0,285 0,178 0,165 0,192 0,209 0,124 0,174 0,093 0,107 0,104 0,117 0,119 0,119 1,119 0,119 0,119 0,119 0,119 0,119 0,119 0,000 0,000 0,072 0,119 0,119 0,076 0,000 0,000 0,119 0,119 0,076 0,000 0,000 0,119 0,000
Domestic help 0,002 0,003 0,003 0,001 0,001 0,003 0,002 0,001 0,002 0,001 0,002 0,001 0,003 0,001 0,001 0,002 0,001 0,001 0,002 0,002 0,001 0,001 0,001 0,001 0,000 0,000 0,001 0,001 0,001 0,001 0,001 0,000 0,002 0,002 0,003 0,012 0,002 0,020 0,002 0,002 0,003 0,000 0,002 0,003 0,003 0,003 0,002 0,003 0,002 0,002 0,002 0,002 0,002 0,002 0,003 0,002 0,002 0,003 0,002 0,002 0,004 0,002 0,002 0,002 0,002 0,002 0,001 0,002 0,002 0,002 0,002 0,002 0,002 0,002 0,002 0,002 0,003 0,003 0,002 0,020 0,003 0,003 0,003 0,004 0,004 0,004 0,004 1,004 0,004 0,004 0,004 0,004 0,004 0,000 0,000 0,002 0,004 0,004 0,002 0,000 0,000 0,004 0,004 0,002 0,000 0,000 0,004 0,000
RURAL LABOR
Self-employed 0,023 0,163 0,166 0,098 0,107 0,029 0,085 0,036 0,078 0,043 0,024 0,024 0,121 0,043 0,042 0,068 0,006 0,029 0,019 0,032 0,024 0,043 0,012 0,006 0,003 0,012 0,013 0,017 0,009 0,016 0,011 0,002 0,037 0,097 0,049 0,229 0,047 0,054 0,025 0,026 0,032 0,000 0,027 0,163 0,166 0,346 0,224 0,029 0,088 0,062 0,085 0,062 0,036 0,038 0,124 0,069 0,072 0,105 0,054 0,018 0,029 0,047 0,045 0,084 0,024 0,019 0,015 0,041 0,022 0,035 0,024 0,036 0,026 0,024 0,053 0,097 0,056 0,063 0,049 0,055 0,027 0,028 0,032 0,038 0,039 0,039 0,039 0,039 1,039 0,039 0,039 0,039 0,039 0,000 0,000 0,023 0,039 0,039 0,025 0,000 0,000 0,039 0,039 0,025 0,000 0,000 0,039 0,000
Employer 0,012 0,116 0,056 0,075 0,030 0,014 0,050 0,011 0,036 0,024 0,010 0,012 0,083 0,014 0,013 0,073 0,004 0,014 0,009 0,016 0,019 0,020 0,007 0,003 0,002 0,003 0,006 0,015 0,009 0,005 0,005 0,001 0,018 0,040 0,018 0,129 0,015 0,025 0,012 0,012 0,016 0,000 0,013 0,116 0,056 0,266 0,063 0,014 0,051 0,019 0,039 0,035 0,015 0,018 0,085 0,023 0,022 0,112 0,026 0,013 0,014 0,024 0,035 0,039 0,014 0,010 0,011 0,010 0,011 0,031 0,025 0,010 0,011 0,010 0,026 0,040 0,019 0,036 0,016 0,025 0,013 0,013 0,016 0,019 0,019 0,019 0,019 0,019 0,019 1,019 0,019 0,019 0,019 0,000 0,000 0,012 0,019 0,019 0,012 0,000 0,000 0,019 0,019 0,012 0,000 0,000 0,019 0,000
Public Sector 0,015 0,020 0,019 0,007 0,008 0,021 0,014 0,009 0,017 0,010 0,012 0,011 0,020 0,008 0,009 0,014 0,004 0,008 0,018 0,014 0,009 0,009 0,009 0,006 0,002 0,004 0,010 0,009 0,007 0,008 0,007 0,001 0,014 0,024 0,034 0,096 0,025 0,106 0,089 0,022 0,238 0,000 0,018 0,020 0,019 0,024 0,017 0,021 0,015 0,015 0,018 0,015 0,018 0,017 0,021 0,013 0,015 0,021 0,015 0,012 0,027 0,020 0,016 0,017 0,018 0,019 0,014 0,015 0,016 0,019 0,018 0,017 0,016 0,015 0,020 0,024 0,037 0,026 0,024 0,106 0,095 0,023 0,238 0,027 0,027 0,027 0,027 0,027 0,027 0,027 1,027 0,027 0,027 0,000 0,000 0,016 0,027 0,027 0,017 0,000 0,000 0,027 0,027 0,017 0,000 0,000 0,027 0,000
Firms 0,265 0,256 0,265 0,072 0,095 0,085 0,173 0,079 0,162 0,127 0,079 0,114 0,234 0,089 0,096 0,163 0,035 0,093 0,053 0,136 0,112 0,100 0,066 0,040 0,013 0,027 0,086 0,073 0,070 0,067 0,081 0,011 0,108 0,192 0,107 0,524 0,094 0,130 0,084 0,083 0,093 0,000 0,300 0,256 0,265 0,256 0,199 0,085 0,179 0,137 0,175 0,184 0,122 0,180 0,241 0,144 0,164 0,251 0,172 0,107 0,082 0,198 0,208 0,195 0,130 0,142 0,074 0,094 0,142 0,147 0,188 0,150 0,185 0,110 0,155 0,193 0,119 0,145 0,097 0,131 0,090 0,093 0,093 0,106 0,107 0,107 0,107 0,107 0,107 0,107 0,107 1,107 0,107 0,000 0,000 0,065 0,107 0,107 0,069 0,000 0,000 0,107 0,107 0,069 0,000 0,000 0,107 0,000
Domestic help 0,003 0,004 0,003 0,001 0,001 0,003 0,002 0,002 0,003 0,002 0,002 0,002 0,003 0,001 0,002 0,002 0,001 0,001 0,003 0,002 0,001 0,002 0,001 0,001 0,000 0,001 0,002 0,002 0,001 0,001 0,001 0,000 0,002 0,003 0,004 0,016 0,003 0,026 0,003 0,003 0,004 0,000 0,003 0,004 0,003 0,004 0,003 0,003 0,003 0,003 0,003 0,003 0,003 0,003 0,003 0,002 0,003 0,003 0,003 0,002 0,005 0,003 0,003 0,003 0,003 0,002 0,002 0,002 0,003 0,003 0,003 0,002 0,003 0,002 0,003 0,003 0,004 0,004 0,003 0,026 0,003 0,004 0,004 0,005 0,005 0,005 0,005 0,005 0,005 0,005 0,005 0,005 1,005 0,000 0,000 0,003 0,005 0,005 0,003 0,000 0,000 0,005 0,005 0,003 0,000 0,000 0,005 0,000
Other Taxes on Production 0,027 0,034 0,041 0,008 0,018 0,034 0,039 0,016 0,030 0,028 0,018 0,020 0,036 0,015 0,022 0,028 0,007 0,019 0,021 0,027 0,021 0,018 0,016 0,007 0,004 0,013 0,019 0,020 0,011 0,019 0,015 0,003 0,025 0,034 0,042 0,155 0,027 0,038 0,040 0,059 0,029 0,000 0,030 0,034 0,041 0,028 0,038 0,034 0,040 0,028 0,032 0,041 0,028 0,031 0,037 0,025 0,038 0,042 0,035 0,023 0,033 0,039 0,040 0,036 0,031 0,026 0,023 0,047 0,031 0,042 0,028 0,042 0,035 0,030 0,037 0,034 0,048 0,043 0,028 0,038 0,044 0,069 0,029 0,029 0,030 0,030 0,030 0,030 0,030 0,030 0,030 0,030 0,030 1,000 0,000 0,018 0,030 0,030 0,019 0,000 0,000 0,030 0,030 0,019 0,000 0,000 0,030 0,000
Production Subsidies (-) 0,000 0,000 0,000 0,000 0,000 0,000 0,000 0,000 0,000 0,000 0,000 0,000 0,000 0,000 0,000 0,000 0,000 0,000 0,000 0,000 0,000 0,000 0,000 0,000 0,000 0,000 0,000 0,000 0,000 0,000 0,000 0,000 0,000 0,000 0,000 0,000 0,000 0,000 0,000 0,000 0,000 0,000 0,000 0,000 0,000 0,000 0,000 0,000 0,000 0,000 0,000 0,000 0,000 0,000 0,000 0,000 0,000 0,000 0,000 0,000 0,000 0,000 0,000 0,000 -0,001 0,000 0,000 0,000 0,000 0,000 0,000 0,000 0,000 0,000 0,000 0,000 0,000 0,000 0,000 0,000 0,000 0,000 0,000 0,000 0,000 0,000 0,000 0,000 0,000 0,000 0,000 0,000 0,000 0,000 1,000 0,000 0,000 0,000 0,000 0,000 0,000 0,000 0,000 0,000 0,000 0,000 0,000 0,000
Gross Earned Surplus (Capital Factor) 0,514 0,831 0,654 0,203 0,174 0,386 0,634 0,491 0,746 0,471 0,496 0,482 0,842 0,268 0,322 0,400 0,220 0,373 0,382 0,322 0,250 0,293 0,306 0,150 0,041 0,153 0,276 0,301 0,190 0,234 0,189 0,040 0,381 0,499 0,751 3,066 0,707 0,703 0,805 0,957 0,459 0,000 0,582 0,832 0,654 0,721 0,365 0,386 0,657 0,849 0,809 0,687 0,761 0,759 0,867 0,434 0,549 0,614 0,687 0,667 0,585 0,467 0,467 0,569 0,604 0,532 0,233 0,533 0,455 0,611 0,509 0,518 0,434 0,411 0,548 0,502 0,854 0,848 0,727 0,707 0,874 1,107 0,459 0,542 0,548 0,548 0,547 0,548 0,547 0,548 0,549 0,548 0,548 0,000 0,000 1,331 0,549 0,549 0,352 0,000 0,000 0,549 0,549 0,352 0,000 0,000 0,549 0,000
PRIMARY INCOME RECIPIENT
WAGE EARNER HOUSEHOLD 0,582 0,671 0,623 0,201 0,236 0,913 0,482 0,325 0,529 0,375 0,372 0,378 0,660 0,248 0,331 0,416 0,171 0,296 0,401 0,406 0,323 0,320 0,293 0,135 0,070 0,141 0,302 0,296 0,208 0,223 0,241 0,055 0,395 0,599 0,644 2,526 0,499 0,926 0,636 0,515 1,070 0,000 0,659 0,671 0,623 0,714 0,494 0,913 0,499 0,563 0,573 0,547 0,571 0,594 0,679 0,401 0,565 0,639 0,545 0,517 0,614 0,589 0,602 0,621 0,576 0,475 0,401 0,492 0,497 0,601 0,560 0,496 0,554 0,565 0,569 0,602 0,725 0,697 0,509 0,928 0,683 0,581 1,070 0,602 0,608 1,474 1,468 1,461 0,608 0,608 1,476 1,470 1,461 0,000 0,000 0,543 1,481 0,481 0,309 0,000 0,000 0,481 0,481 0,309 0,000 0,000 0,481 0,000
OTHER EMPLOYEE HOUSEHOLD 0,241 0,572 0,468 0,233 0,212 0,216 0,370 0,234 0,393 0,244 0,231 0,220 0,512 0,164 0,222 0,293 0,094 0,196 0,185 0,202 0,161 0,195 0,150 0,067 0,022 0,076 0,150 0,153 0,095 0,116 0,106 0,022 0,247 0,405 0,422 1,751 0,360 0,401 0,345 0,413 0,246 0,000 0,273 0,572 0,468 0,826 0,444 0,216 0,383 0,405 0,426 0,356 0,354 0,346 0,527 0,265 0,378 0,450 0,362 0,284 0,283 0,294 0,301 0,378 0,295 0,237 0,126 0,263 0,248 0,311 0,255 0,257 0,243 0,227 0,355 0,407 0,480 0,484 0,370 0,403 0,374 0,474 0,246 1,144 1,162 0,296 0,299 0,306 1,156 1,162 0,297 0,300 0,306 0,000 0,000 0,518 0,292 1,292 0,187 0,000 0,000 0,292 0,292 0,187 0,000 0,000 0,292 0,000
OTHER HOUSEHOLD 0,008 0,013 0,010 0,004 0,003 0,007 0,009 0,007 0,011 0,007 0,007 0,007 0,012 0,004 0,005 0,006 0,003 0,005 0,006 0,005 0,004 0,005 0,004 0,002 0,001 0,002 0,004 0,004 0,003 0,003 0,003 0,001 0,006 0,008 0,011 0,044 0,010 0,010 0,011 0,013 0,007 0,000 0,009 0,013 0,010 0,013 0,007 0,007 0,010 0,012 0,011 0,010 0,011 0,011 0,013 0,007 0,009 0,010 0,010 0,009 0,008 0,007 0,007 0,009 0,009 0,007 0,003 0,008 0,007 0,009 0,007 0,007 0,007 0,006 0,008 0,008 0,012 0,012 0,010 0,011 0,012 0,014 0,007 0,015 0,010 0,008 0,010 0,012 0,015 0,010 0,008 0,010 0,012 0,000 0,000 0,017 0,008 0,008 1,005 0,000 0,000 0,008 0,008 0,005 0,000 0,000 0,008 0,000
FIRMS 0,202 0,327 0,257 0,080 0,068 0,152 0,249 0,193 0,293 0,185 0,195 0,189 0,331 0,105 0,126 0,157 0,087 0,146 0,150 0,126 0,098 0,115 0,120 0,059 0,016 0,060 0,108 0,118 0,074 0,092 0,074 0,016 0,150 0,196 0,295 1,204 0,278 0,276 0,316 0,376 0,180 0,000 0,229 0,327 0,257 0,283 0,143 0,152 0,258 0,333 0,318 0,270 0,299 0,298 0,340 0,170 0,216 0,241 0,270 0,262 0,230 0,184 0,183 0,224 0,237 0,209 0,092 0,209 0,179 0,240 0,200 0,204 0,170 0,161 0,215 0,197 0,336 0,333 0,285 0,278 0,343 0,435 0,180 0,213 0,215 0,215 0,215 0,215 0,215 0,215 0,216 0,215 0,215 0,000 0,000 0,523 0,216 0,216 0,138 1,000 0,000 0,216 0,216 0,138 0,000 0,000 0,216 0,000
GOVERNMENT 0,185 0,133 0,139 0,101 0,070 0,150 0,119 0,056 0,070 0,095 0,082 0,071 0,149 0,090 0,231 0,086 0,075 0,177 0,110 0,171 0,149 0,114 0,143 0,120 0,048 0,154 0,136 0,126 0,067 0,095 0,111 0,154 0,099 0,133 0,126 0,518 0,113 0,147 0,193 0,250 0,141 0,000 0,136 0,133 0,139 0,138 0,144 0,150 0,123 0,112 0,127 0,128 0,101 0,104 0,134 0,110 0,145 0,142 0,130 0,102 0,134 0,150 0,141 0,121 0,139 0,130 0,093 0,152 0,144 0,137 0,112 0,131 0,136 0,149 0,133 0,129 0,142 0,142 0,112 0,146 0,127 0,149 0,141 0,151 0,153 0,153 0,153 0,153 0,153 0,153 0,153 0,153 0,153 1,000 1,000 0,092 0,153 0,153 0,098 0,000 1,000 0,153 0,153 0,098 0,000 0,000 0,153 0,000
SECONDARY INCOME DISTRIBUTION
WAGE EARNER HOUSEHOLD 0,582 0,671 0,623 0,201 0,236 0,913 0,482 0,325 0,529 0,375 0,372 0,378 0,660 0,248 0,331 0,416 0,171 0,296 0,401 0,406 0,323 0,320 0,293 0,135 0,070 0,141 0,302 0,296 0,208 0,223 0,241 0,055 0,395 0,599 0,644 2,526 0,499 0,926 0,636 0,515 1,070 0,000 0,659 0,671 0,623 0,714 0,494 0,913 0,499 0,563 0,573 0,547 0,571 0,594 0,679 0,401 0,565 0,639 0,545 0,517 0,614 0,589 0,602 0,621 0,576 0,475 0,401 0,492 0,497 0,601 0,560 0,496 0,554 0,565 0,569 0,602 0,725 0,697 0,509 0,928 0,683 0,581 1,070 0,602 0,608 1,474 1,468 1,461 0,608 0,608 1,476 1,470 1,461 0,000 0,000 0,543 1,481 0,481 0,309 0,000 0,000 1,481 0,481 0,309 0,000 0,000 0,481 0,000
OTHER EMPLOYEE HOUSEHOLD 0,241 0,572 0,468 0,233 0,212 0,216 0,370 0,234 0,393 0,244 0,231 0,220 0,512 0,164 0,222 0,293 0,094 0,196 0,185 0,202 0,161 0,195 0,150 0,067 0,022 0,076 0,150 0,153 0,095 0,116 0,106 0,022 0,247 0,405 0,422 1,751 0,360 0,401 0,345 0,413 0,246 0,000 0,273 0,572 0,468 0,826 0,444 0,216 0,383 0,405 0,426 0,356 0,354 0,346 0,527 0,265 0,378 0,450 0,362 0,284 0,283 0,294 0,301 0,378 0,295 0,237 0,126 0,263 0,248 0,311 0,255 0,257 0,243 0,227 0,355 0,407 0,480 0,484 0,370 0,403 0,374 0,474 0,246 1,144 1,162 0,296 0,299 0,306 1,156 1,162 0,297 0,300 0,306 0,000 0,000 0,518 0,292 1,292 0,187 0,000 0,000 0,292 1,292 0,187 0,000 0,000 0,292 0,000
OTHER HOUSEHOLD 0,008 0,013 0,010 0,004 0,003 0,007 0,009 0,007 0,011 0,007 0,007 0,007 0,012 0,004 0,005 0,006 0,003 0,005 0,006 0,005 0,004 0,005 0,004 0,002 0,001 0,002 0,004 0,004 0,003 0,003 0,003 0,001 0,006 0,008 0,011 0,044 0,010 0,010 0,011 0,013 0,007 0,000 0,009 0,013 0,010 0,013 0,007 0,007 0,010 0,012 0,011 0,010 0,011 0,011 0,013 0,007 0,009 0,010 0,010 0,009 0,008 0,007 0,007 0,009 0,009 0,007 0,003 0,008 0,007 0,009 0,007 0,007 0,007 0,006 0,008 0,008 0,012 0,012 0,010 0,011 0,012 0,014 0,007 0,015 0,010 0,008 0,010 0,012 0,015 0,010 0,008 0,010 0,012 0,000 0,000 0,017 0,008 0,008 1,005 0,000 0,000 0,008 0,008 1,005 0,000 0,000 0,008 0,000
FIRMS 0,166 0,268 0,211 0,066 0,056 0,124 0,204 0,158 0,241 0,152 0,160 0,155 0,272 0,086 0,104 0,129 0,071 0,120 0,123 0,104 0,081 0,094 0,099 0,048 0,013 0,049 0,089 0,097 0,061 0,075 0,061 0,013 0,123 0,161 0,242 0,988 0,228 0,227 0,260 0,309 0,148 0,000 0,188 0,268 0,211 0,232 0,117 0,124 0,212 0,274 0,261 0,221 0,245 0,244 0,279 0,140 0,177 0,198 0,222 0,215 0,189 0,151 0,150 0,183 0,195 0,171 0,075 0,172 0,147 0,197 0,164 0,167 0,140 0,132 0,177 0,162 0,275 0,273 0,234 0,228 0,282 0,357 0,148 0,175 0,177 0,177 0,176 0,177 0,176 0,177 0,177 0,177 0,177 0,000 0,000 0,429 0,177 0,177 0,113 0,821 0,000 0,177 0,177 0,113 1,000 0,000 0,177 0,000
GOVERNMENT 0,185 0,133 0,139 0,101 0,070 0,150 0,119 0,056 0,070 0,095 0,082 0,071 0,149 0,090 0,231 0,086 0,075 0,177 0,110 0,171 0,149 0,114 0,143 0,120 0,048 0,154 0,136 0,126 0,067 0,095 0,111 0,154 0,099 0,133 0,126 0,518 0,113 0,147 0,193 0,250 0,141 0,000 0,136 0,133 0,139 0,138 0,144 0,150 0,123 0,112 0,127 0,128 0,101 0,104 0,134 0,110 0,145 0,142 0,130 0,102 0,134 0,150 0,141 0,121 0,139 0,130 0,093 0,152 0,144 0,137 0,112 0,131 0,136 0,149 0,133 0,129 0,142 0,142 0,112 0,146 0,127 0,149 0,141 0,151 0,153 0,153 0,153 0,153 0,153 0,153 0,153 0,153 0,153 1,000 1,000 0,092 0,153 0,153 0,098 0,000 1,000 0,153 0,153 0,098 0,000 1,000 0,153 0,000
INCOME USE
HOUSEHOLDS 0,828 1,251 1,098 0,437 0,450 1,133 0,858 0,564 0,929 0,624 0,608 0,602 1,180 0,414 0,556 0,714 0,266 0,495 0,589 0,611 0,486 0,518 0,445 0,203 0,093 0,219 0,454 0,451 0,305 0,342 0,349 0,077 0,646 1,010 1,073 4,305 0,865 1,333 0,988 0,936 1,320 0,000 0,937 1,251 1,098 1,549 0,942 1,133 0,888 0,975 1,006 0,909 0,931 0,947 1,214 0,671 0,949 1,096 0,914 0,807 0,902 0,888 0,907 1,005 0,877 0,717 0,529 0,759 0,749 0,917 0,820 0,757 0,802 0,796 0,930 1,014 1,212 1,190 0,885 1,338 1,065 1,064 1,320 1,756 1,777 1,775 1,773 1,775 1,773 1,777 1,778 1,777 1,775 0,000 0,000 1,072 1,778 1,778 1,140 0,000 0,000 1,778 1,778 1,140 0,000 0,000 1,778 0,000
FIRMS 0,166 0,268 0,211 0,066 0,056 0,124 0,204 0,158 0,241 0,152 0,160 0,155 0,272 0,086 0,104 0,129 0,071 0,120 0,123 0,104 0,081 0,094 0,099 0,048 0,013 0,049 0,089 0,097 0,061 0,075 0,061 0,013 0,123 0,161 0,242 0,988 0,228 0,227 0,260 0,309 0,148 0,000 0,188 0,268 0,211 0,232 0,117 0,124 0,212 0,274 0,261 0,221 0,245 0,244 0,279 0,140 0,177 0,198 0,222 0,215 0,189 0,151 0,150 0,183 0,195 0,171 0,075 0,172 0,147 0,197 0,164 0,167 0,140 0,132 0,177 0,162 0,275 0,273 0,234 0,228 0,282 0,357 0,148 0,175 0,177 0,177 0,176 0,177 0,176 0,177 0,177 0,177 0,177 0,000 0,000 0,429 0,177 0,177 0,113 0,821 0,000 0,177 0,177 0,113 1,000 0,000 0,177 1,000
DISTRIBUTION MARGIN
Costa Rica: SAM Multipliers, for 1997Table 12D.
OTHER HOUSEHOL
DFIRMS GOVERNMEN
TOTHER
HOUSEHOLDFIRMS GOVERNMEN
T
'WAGE EARNER
HOUSEHOLD
Source: IICA. Based on data from the SAM of Costa Rica for 1997(IICA)
'WAGE EARNER
HOUSEHOLD
OTHER EMPLOYEE HOUSEHOL
D
OTHER EMPLOYEE HOUSEHOL
DFirmsSelf-employed Self-employed EmployerFirms Public Sector
HOUSEHOLDS
FIRMSWAGE EARNER
SECONDARY INCOME DISTRIBUTION
Other Taxes on
Production
Production Subsidies
Gross Earned Surplus (Capital Factor)
PRIMARY INCOME RECIPIENT
Domestic help
URBAN RURAL
Public Sector
ServicesINDEPENDENT WAGE EARNER
Electricity Real estate Public
administration services
Employer Domestic help
INDEPENDENT Construction
Banking, finance and insurance
Commercerestaurants and hotels
Transportation
Base metals
Electrical Goods
Transportation
equipment
Other manufacture
s Tires
Rubber and
plastics
Glass and ceramics
Construction materials
Timber and furniture
Paper and printing
Chemicals Oil refineries
Beverages Tobacco products
Textiles and garments
Leather goods and footwear
Milling of grains
Bakery products
Sugar Other
manufactured products
Meat and dairy
products
Fish canning
Edible oils Coffee processing
Tobacco Livestock Forestry, fisheries
Other agricultural
products
Cocoa beans,
unroasted and
roasted
Staple grains
Bananas Coffee beans
Sugar cane
Transportation
equipment
Other manufacture
s Construction
Banking, finance and insurance
Public administration services
Commerce, restaurants and hotels
Transportation
Services Electricity Real estate Base metals Electrical Goods
Chemicals Oil refineries
Tires Rubber and plastics
Glass and ceramics
Construction materials
Timber and
furniture
Paper and printing
Bakery products
Sugar Other
manufactured products
Beverages Milling of grains
Tobacco products
Textiles and garments
Leather goods and footwear
Sugar cane
Coffee processing
Cocoa beans,
unroasted and roasted
Tobacco Livestock Forestry, fisheries
Other agricultural
products
ACCOUNTS
Meat and dairy
products
Fish canning
Edible oils Staple grains
Bananas Coffee beans

ANNEX EResults of the Simulation of a Shock in Exports and in Investment by Country
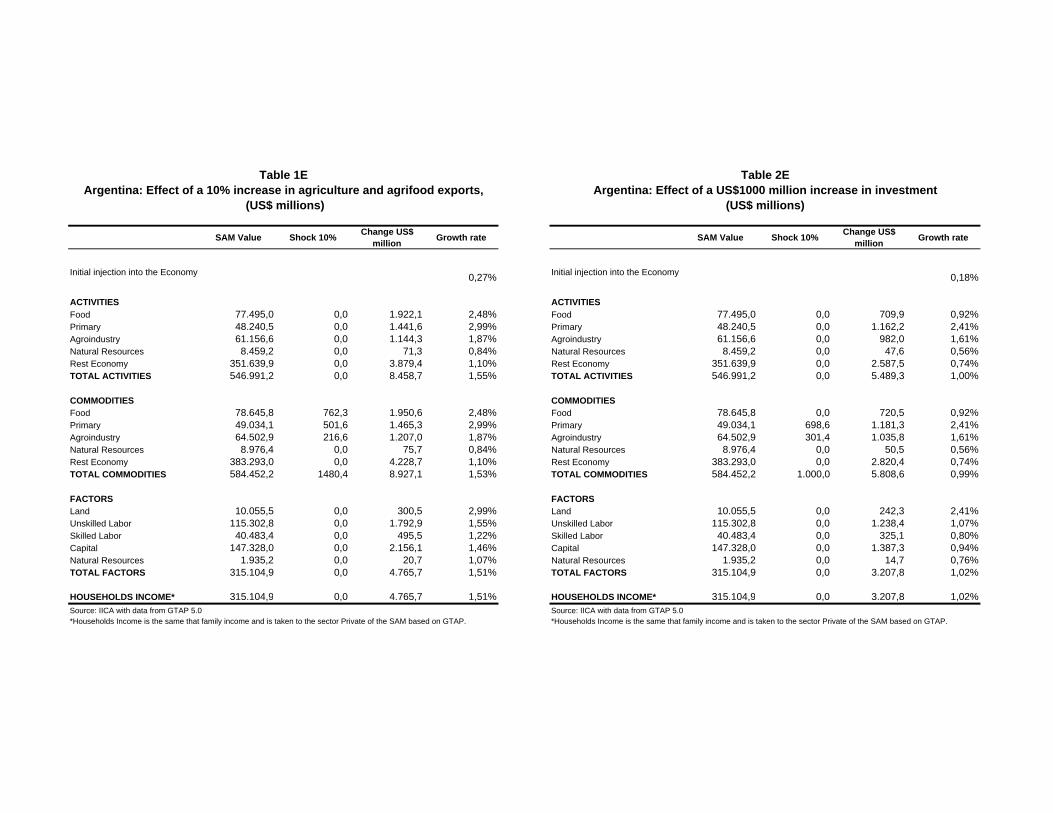
SAM Value Shock 10% Change US$ million Growth rate SAM Value Shock 10% Change US$
million Growth rate
Initial injection into the Economy 0,27% Initial injection into the Economy 0,18%
ACTIVITIES ACTIVITIESFood 77.495,0 0,0 1.922,1 2,48% Food 77.495,0 0,0 709,9 0,92%Primary 48.240,5 0,0 1.441,6 2,99% Primary 48.240,5 0,0 1.162,2 2,41%Agroindustry 61.156,6 0,0 1.144,3 1,87% Agroindustry 61.156,6 0,0 982,0 1,61%Natural Resources 8.459,2 0,0 71,3 0,84% Natural Resources 8.459,2 0,0 47,6 0,56%Rest Economy 351.639,9 0,0 3.879,4 1,10% Rest Economy 351.639,9 0,0 2.587,5 0,74%TOTAL ACTIVITIES 546.991,2 0,0 8.458,7 1,55% TOTAL ACTIVITIES 546.991,2 0,0 5.489,3 1,00%
COMMODITIES COMMODITIESFood 78.645,8 762,3 1.950,6 2,48% Food 78.645,8 0,0 720,5 0,92%Primary 49.034,1 501,6 1.465,3 2,99% Primary 49.034,1 698,6 1.181,3 2,41%Agroindustry 64.502,9 216,6 1.207,0 1,87% Agroindustry 64.502,9 301,4 1.035,8 1,61%Natural Resources 8.976,4 0,0 75,7 0,84% Natural Resources 8.976,4 0,0 50,5 0,56%Rest Economy 383.293,0 0,0 4.228,7 1,10% Rest Economy 383.293,0 0,0 2.820,4 0,74%TOTAL COMMODITIES 584.452,2 1480,4 8.927,1 1,53% TOTAL COMMODITIES 584.452,2 1.000,0 5.808,6 0,99%
FACTORS FACTORSLand 10.055,5 0,0 300,5 2,99% Land 10.055,5 0,0 242,3 2,41%Unskilled Labor 115.302,8 0,0 1.792,9 1,55% Unskilled Labor 115.302,8 0,0 1.238,4 1,07%Skilled Labor 40.483,4 0,0 495,5 1,22% Skilled Labor 40.483,4 0,0 325,1 0,80%Capital 147.328,0 0,0 2.156,1 1,46% Capital 147.328,0 0,0 1.387,3 0,94%Natural Resources 1.935,2 0,0 20,7 1,07% Natural Resources 1.935,2 0,0 14,7 0,76%TOTAL FACTORS 315.104,9 0,0 4.765,7 1,51% TOTAL FACTORS 315.104,9 0,0 3.207,8 1,02%
HOUSEHOLDS INCOME* 315.104,9 0,0 4.765,7 1,51% HOUSEHOLDS INCOME* 315.104,9 0,0 3.207,8 1,02%Source: IICA with data from GTAP 5.0 Source: IICA with data from GTAP 5.0
Table 1E Table 2E
(US$ millions)Argentina: Effect of a 10% increase in agriculture and agrifood exports, Argentina: Effect of a US$1000 million increase in investment
(US$ millions)
*Households Income is the same that family income and is taken to the sector Private of the SAM based on GTAP. *Households Income is the same that family income and is taken to the sector Private of the SAM based on GTAP.
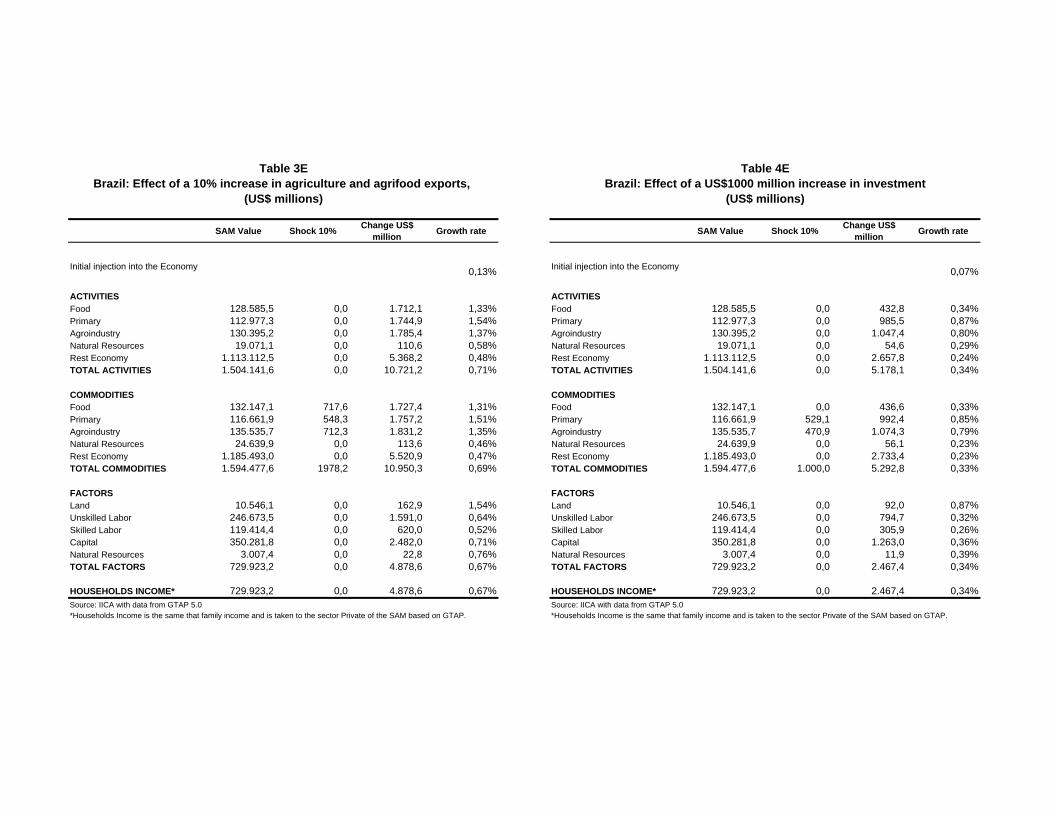
SAM Value Shock 10% Change US$ million Growth rate SAM Value Shock 10% Change US$
million Growth rate
Initial injection into the Economy 0,13% Initial injection into the Economy 0,07%
ACTIVITIES ACTIVITIESFood 128.585,5 0,0 1.712,1 1,33% Food 128.585,5 0,0 432,8 0,34%Primary 112.977,3 0,0 1.744,9 1,54% Primary 112.977,3 0,0 985,5 0,87%Agroindustry 130.395,2 0,0 1.785,4 1,37% Agroindustry 130.395,2 0,0 1.047,4 0,80%Natural Resources 19.071,1 0,0 110,6 0,58% Natural Resources 19.071,1 0,0 54,6 0,29%Rest Economy 1.113.112,5 0,0 5.368,2 0,48% Rest Economy 1.113.112,5 0,0 2.657,8 0,24%TOTAL ACTIVITIES 1.504.141,6 0,0 10.721,2 0,71% TOTAL ACTIVITIES 1.504.141,6 0,0 5.178,1 0,34%
COMMODITIES COMMODITIESFood 132.147,1 717,6 1.727,4 1,31% Food 132.147,1 0,0 436,6 0,33%Primary 116.661,9 548,3 1.757,2 1,51% Primary 116.661,9 529,1 992,4 0,85%Agroindustry 135.535,7 712,3 1.831,2 1,35% Agroindustry 135.535,7 470,9 1.074,3 0,79%Natural Resources 24.639,9 0,0 113,6 0,46% Natural Resources 24.639,9 0,0 56,1 0,23%Rest Economy 1.185.493,0 0,0 5.520,9 0,47% Rest Economy 1.185.493,0 0,0 2.733,4 0,23%TOTAL COMMODITIES 1.594.477,6 1978,2 10.950,3 0,69% TOTAL COMMODITIES 1.594.477,6 1.000,0 5.292,8 0,33%
FACTORS FACTORSLand 10.546,1 0,0 162,9 1,54% Land 10.546,1 0,0 92,0 0,87%Unskilled Labor 246.673,5 0,0 1.591,0 0,64% Unskilled Labor 246.673,5 0,0 794,7 0,32%Skilled Labor 119.414,4 0,0 620,0 0,52% Skilled Labor 119.414,4 0,0 305,9 0,26%Capital 350.281,8 0,0 2.482,0 0,71% Capital 350.281,8 0,0 1.263,0 0,36%Natural Resources 3.007,4 0,0 22,8 0,76% Natural Resources 3.007,4 0,0 11,9 0,39%TOTAL FACTORS 729.923,2 0,0 4.878,6 0,67% TOTAL FACTORS 729.923,2 0,0 2.467,4 0,34%
HOUSEHOLDS INCOME* 729.923,2 0,0 4.878,6 0,67% HOUSEHOLDS INCOME* 729.923,2 0,0 2.467,4 0,34%Source: IICA with data from GTAP 5.0 Source: IICA with data from GTAP 5.0
Table 3E Table 4E
*Households Income is the same that family income and is taken to the sector Private of the SAM based on GTAP. *Households Income is the same that family income and is taken to the sector Private of the SAM based on GTAP.
Brazil: Effect of a 10% increase in agriculture and agrifood exports, Brazil: Effect of a US$1000 million increase in investment(US$ millions) (US$ millions)

SAM Value Shock 10% Change US$ million Growth rate SAM Value Shock 10% Change US$
million Growth rate
Initial injection into the Economy 0,48% Initial injection into the Economy 0,09%
ACTIVITIES ACTIVITIESFood 49.206,9 0,0 1.310,8 2,66% Food 49.206,9 0,0 82,4 0,17%Primary 41.987,7 0,0 1.933,0 4,60% Primary 41.987,7 0,0 153,0 0,36%Agroindustry 90.970,4 0,0 4.172,1 4,59% Agroindustry 90.970,4 0,0 1.115,7 1,23%Natural Resources 38.998,3 0,0 171,4 0,44% Natural Resources 38.998,3 0,0 31,7 0,08%Rest Economy 888.073,3 0,0 6.342,6 0,71% Rest Economy 888.073,3 0,0 1.153,8 0,13%TOTAL ACTIVITIES 1.109.236,6 0,0 13.930,0 1,26% TOTAL ACTIVITIES 1.109.236,6 0,0 2.536,6 0,23%
COMMODITIES COMMODITIESFood 58.319,6 810,7 1.553,5 2,66% Food 58.319,6 0,0 97,6 0,17%Primary 46.249,5 959,9 2.129,2 4,60% Primary 46.249,5 0,3 168,6 0,36%Agroindustry 109.569,6 3561,7 5.025,1 4,59% Agroindustry 109.569,6 999,7 1.343,8 1,23%Natural Resources 45.915,6 0,0 201,9 0,44% Natural Resources 45.915,6 0,0 37,4 0,08%Rest Economy 1.070.428,4 0,0 7.645,0 0,71% Rest Economy 1.070.428,4 0,0 1.390,8 0,13%TOTAL COMMODITIES 1.330.482,7 5332,3 16.554,7 1,24% TOTAL COMMODITIES 1.330.482,7 1.000,0 3.038,1 0,23%
FACTORS FACTORSLand 2.002,3 0,0 92,2 4,60% Land 2.002,3 0,0 7,3 0,36%Unskilled Labor 229.643,9 0,0 2.795,2 1,22% Unskilled Labor 229.643,9 0,0 528,9 0,23%Skilled Labor 91.397,2 0,0 915,4 1,00% Skilled Labor 91.397,2 0,0 180,7 0,20%Capital 214.064,1 0,0 2.281,4 1,07% Capital 214.064,1 0,0 400,1 0,19%Natural Resources 8.062,9 0,0 89,3 1,11% Natural Resources 8.062,9 0,0 10,2 0,13%TOTAL FACTORS 545.170,4 0,0 6.173,4 1,13% TOTAL FACTORS 545.170,4 0,0 1.127,2 0,21%
HOUSEHOLDS INCOME* 545.170,4 0,0 6.173,4 1,13% HOUSEHOLDS INCOME* 545.170,4 0,0 1.127,2 0,21%Source: IICA with data from GTAP 5.0 Source: IICA with data from GTAP 5.0
Table 5E Table 6ECanada: Effect of a 10% increase in agriculture and agrifood exports, Canada: Effect of a US$1000 million increase in investment
(US$ millions) (US$ millions)
*Households Income is the same that family income and is taken to the sector Private of the SAM based on GTAP. *Households Income is the same that family income and is taken to the sector Private of the SAM based on GTAP.
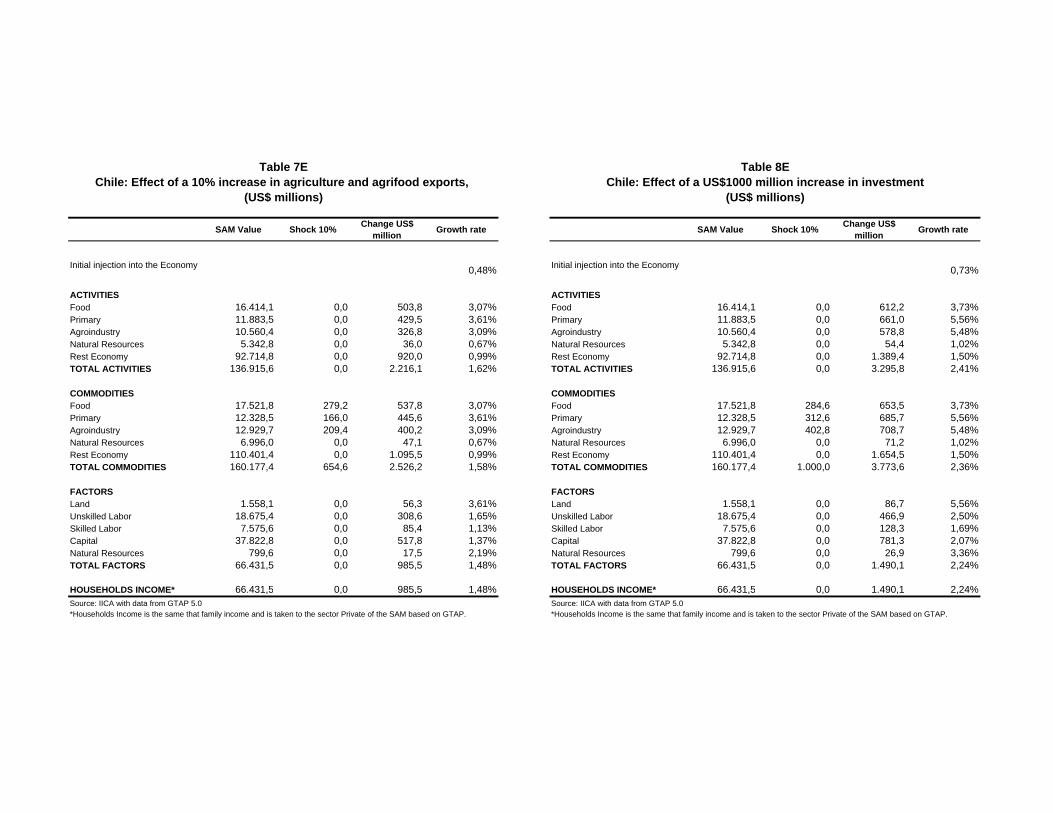
SAM Value Shock 10% Change US$ million Growth rate SAM Value Shock 10% Change US$
million Growth rate
Initial injection into the Economy 0,48% Initial injection into the Economy 0,73%
ACTIVITIES ACTIVITIESFood 16.414,1 0,0 503,8 3,07% Food 16.414,1 0,0 612,2 3,73%Primary 11.883,5 0,0 429,5 3,61% Primary 11.883,5 0,0 661,0 5,56%Agroindustry 10.560,4 0,0 326,8 3,09% Agroindustry 10.560,4 0,0 578,8 5,48%Natural Resources 5.342,8 0,0 36,0 0,67% Natural Resources 5.342,8 0,0 54,4 1,02%Rest Economy 92.714,8 0,0 920,0 0,99% Rest Economy 92.714,8 0,0 1.389,4 1,50%TOTAL ACTIVITIES 136.915,6 0,0 2.216,1 1,62% TOTAL ACTIVITIES 136.915,6 0,0 3.295,8 2,41%
COMMODITIES COMMODITIESFood 17.521,8 279,2 537,8 3,07% Food 17.521,8 284,6 653,5 3,73%Primary 12.328,5 166,0 445,6 3,61% Primary 12.328,5 312,6 685,7 5,56%Agroindustry 12.929,7 209,4 400,2 3,09% Agroindustry 12.929,7 402,8 708,7 5,48%Natural Resources 6.996,0 0,0 47,1 0,67% Natural Resources 6.996,0 0,0 71,2 1,02%Rest Economy 110.401,4 0,0 1.095,5 0,99% Rest Economy 110.401,4 0,0 1.654,5 1,50%TOTAL COMMODITIES 160.177,4 654,6 2.526,2 1,58% TOTAL COMMODITIES 160.177,4 1.000,0 3.773,6 2,36%
FACTORS FACTORSLand 1.558,1 0,0 56,3 3,61% Land 1.558,1 0,0 86,7 5,56%Unskilled Labor 18.675,4 0,0 308,6 1,65% Unskilled Labor 18.675,4 0,0 466,9 2,50%Skilled Labor 7.575,6 0,0 85,4 1,13% Skilled Labor 7.575,6 0,0 128,3 1,69%Capital 37.822,8 0,0 517,8 1,37% Capital 37.822,8 0,0 781,3 2,07%Natural Resources 799,6 0,0 17,5 2,19% Natural Resources 799,6 0,0 26,9 3,36%TOTAL FACTORS 66.431,5 0,0 985,5 1,48% TOTAL FACTORS 66.431,5 0,0 1.490,1 2,24%
HOUSEHOLDS INCOME* 66.431,5 0,0 985,5 1,48% HOUSEHOLDS INCOME* 66.431,5 0,0 1.490,1 2,24%Source: IICA with data from GTAP 5.0 Source: IICA with data from GTAP 5.0
Chile: Effect of a 10% increase in agriculture and agrifood exports, Chile: Effect of a US$1000 million increase in investment(US$ millions) (US$ millions)
Table 7E Table 8E
*Households Income is the same that family income and is taken to the sector Private of the SAM based on GTAP. *Households Income is the same that family income and is taken to the sector Private of the SAM based on GTAP.

SAM Value Shock 10% Change US$ million Growth rate SAM Value Shock 10% Change US$
million Growth rate
Initial injection into the Economy 0,31% Initial injection into the Economy 0,59%
ACTIVITIES ACTIVITIESFood 20.968,5 0,0 346,6 1,65% Food 20.968,5 0,0 465,5 2,22%Primary 15.887,8 0,0 491,1 3,09% Primary 15.887,8 0,0 854,6 5,38%Agroindustry 10.221,4 0,0 224,0 2,19% Agroindustry 10.221,4 0,0 642,0 6,28%Natural Resources 6.208,5 0,0 23,6 0,38% Natural Resources 6.208,5 0,0 46,5 0,75%Rest Economy 115.806,5 0,0 934,9 0,81% Rest Economy 115.806,5 0,0 1.786,9 1,54%TOTAL ACTIVITIES 169.092,7 0,0 2.020,2 1,19% TOTAL ACTIVITIES 169.092,7 0,0 3.795,5 2,24%
COMMODITIES COMMODITIESFood 22.040,3 92,5 364,3 1,65% Food 22.040,3 0,0 489,3 2,22%Primary 16.836,9 314,7 520,4 3,09% Primary 16.836,9 576,3 905,6 5,38%Agroindustry 11.667,7 114,6 255,7 2,19% Agroindustry 11.667,7 423,7 732,9 6,28%Natural Resources 6.255,9 0,0 23,8 0,38% Natural Resources 6.255,9 0,0 46,9 0,75%Rest Economy 131.841,0 0,0 1.064,4 0,81% Rest Economy 131.841,0 0,0 2.034,3 1,54%TOTAL COMMODITIES 188.641,8 521,8 2.228,5 1,18% TOTAL COMMODITIES 188.641,8 1.000,0 4.209,0 2,23%
FACTORS FACTORSLand 2.853,1 0,0 88,2 3,09% Land 2.853,1 0,0 153,5 5,38%Unskilled Labor 32.636,9 0,0 411,7 1,26% Unskilled Labor 32.636,9 0,0 767,7 2,35%Skilled Labor 13.948,7 0,0 119,5 0,86% Skilled Labor 13.948,7 0,0 229,0 1,64%Capital 36.405,7 0,0 389,4 1,07% Capital 36.405,7 0,0 731,0 2,01%Natural Resources 1.570,5 0,0 10,3 0,65% Natural Resources 1.570,5 0,0 19,1 1,22%TOTAL FACTORS 87.414,9 0,0 1.019,1 1,17% TOTAL FACTORS 87.414,9 0,0 1.900,2 2,17%
HOUSEHOLDS INCOME* 87.414,9 0,0 1.019,1 1,17% HOUSEHOLDS INCOME* 87.414,9 0,0 1.900,2 2,17%Source: IICA with data from GTAP 5.0 Source: IICA with data from GTAP 5.0
Colombia: Effect of a 10% increase in agriculture and agrifood exports, Colombia: Effect of a US$1000 million increase in investment(US$ millions) (US$ millions)
*Households Income is the same that family income and is taken to the sector Private of the SAM based on GTAP. *Households Income is the same that family income and is taken to the sector Private of the SAM based on GTAP.
Table 9E Table 10E
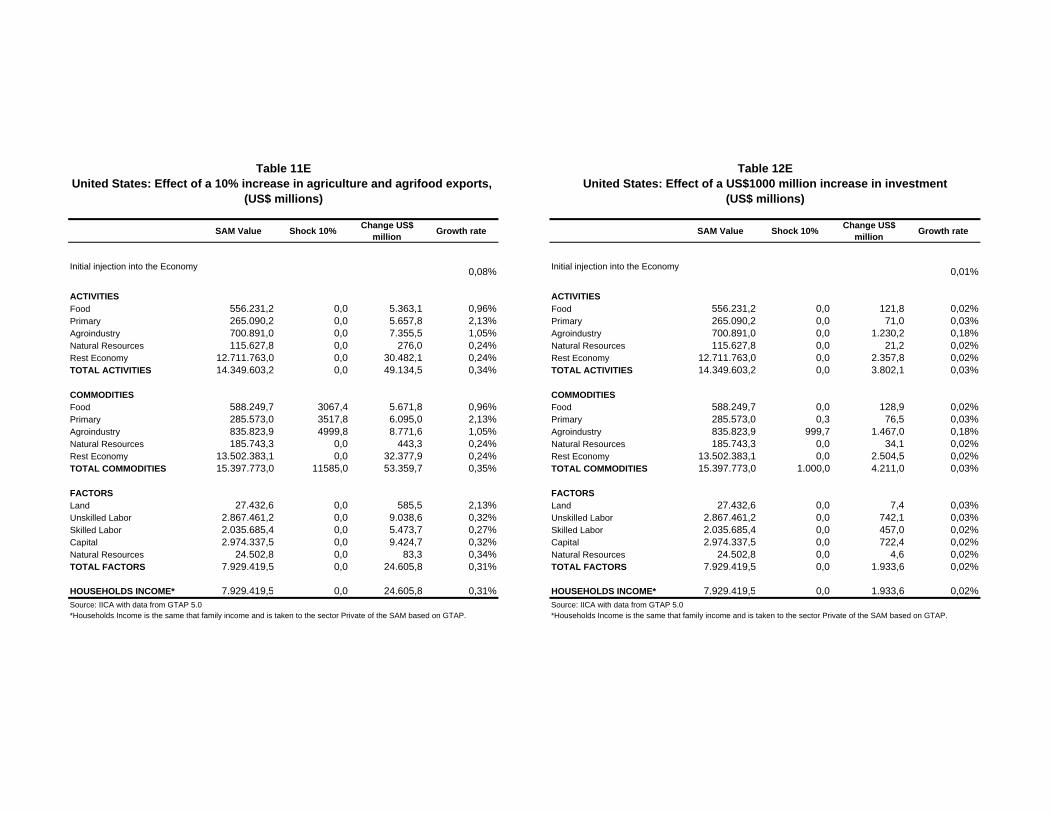
SAM Value Shock 10% Change US$ million Growth rate SAM Value Shock 10% Change US$
million Growth rate
Initial injection into the Economy 0,08% Initial injection into the Economy 0,01%
ACTIVITIES ACTIVITIESFood 556.231,2 0,0 5.363,1 0,96% Food 556.231,2 0,0 121,8 0,02%Primary 265.090,2 0,0 5.657,8 2,13% Primary 265.090,2 0,0 71,0 0,03%Agroindustry 700.891,0 0,0 7.355,5 1,05% Agroindustry 700.891,0 0,0 1.230,2 0,18%Natural Resources 115.627,8 0,0 276,0 0,24% Natural Resources 115.627,8 0,0 21,2 0,02%Rest Economy 12.711.763,0 0,0 30.482,1 0,24% Rest Economy 12.711.763,0 0,0 2.357,8 0,02%TOTAL ACTIVITIES 14.349.603,2 0,0 49.134,5 0,34% TOTAL ACTIVITIES 14.349.603,2 0,0 3.802,1 0,03%
COMMODITIES COMMODITIESFood 588.249,7 3067,4 5.671,8 0,96% Food 588.249,7 0,0 128,9 0,02%Primary 285.573,0 3517,8 6.095,0 2,13% Primary 285.573,0 0,3 76,5 0,03%Agroindustry 835.823,9 4999,8 8.771,6 1,05% Agroindustry 835.823,9 999,7 1.467,0 0,18%Natural Resources 185.743,3 0,0 443,3 0,24% Natural Resources 185.743,3 0,0 34,1 0,02%Rest Economy 13.502.383,1 0,0 32.377,9 0,24% Rest Economy 13.502.383,1 0,0 2.504,5 0,02%TOTAL COMMODITIES 15.397.773,0 11585,0 53.359,7 0,35% TOTAL COMMODITIES 15.397.773,0 1.000,0 4.211,0 0,03%
FACTORS FACTORSLand 27.432,6 0,0 585,5 2,13% Land 27.432,6 0,0 7,4 0,03%Unskilled Labor 2.867.461,2 0,0 9.038,6 0,32% Unskilled Labor 2.867.461,2 0,0 742,1 0,03%Skilled Labor 2.035.685,4 0,0 5.473,7 0,27% Skilled Labor 2.035.685,4 0,0 457,0 0,02%Capital 2.974.337,5 0,0 9.424,7 0,32% Capital 2.974.337,5 0,0 722,4 0,02%Natural Resources 24.502,8 0,0 83,3 0,34% Natural Resources 24.502,8 0,0 4,6 0,02%TOTAL FACTORS 7.929.419,5 0,0 24.605,8 0,31% TOTAL FACTORS 7.929.419,5 0,0 1.933,6 0,02%
HOUSEHOLDS INCOME* 7.929.419,5 0,0 24.605,8 0,31% HOUSEHOLDS INCOME* 7.929.419,5 0,0 1.933,6 0,02%Source: IICA with data from GTAP 5.0 Source: IICA with data from GTAP 5.0
United States: Effect of a 10% increase in agriculture and agrifood exports, United States: Effect of a US$1000 million increase in investment(US$ millions) (US$ millions)
Table 11E Table 12E
*Households Income is the same that family income and is taken to the sector Private of the SAM based on GTAP. *Households Income is the same that family income and is taken to the sector Private of the SAM based on GTAP.
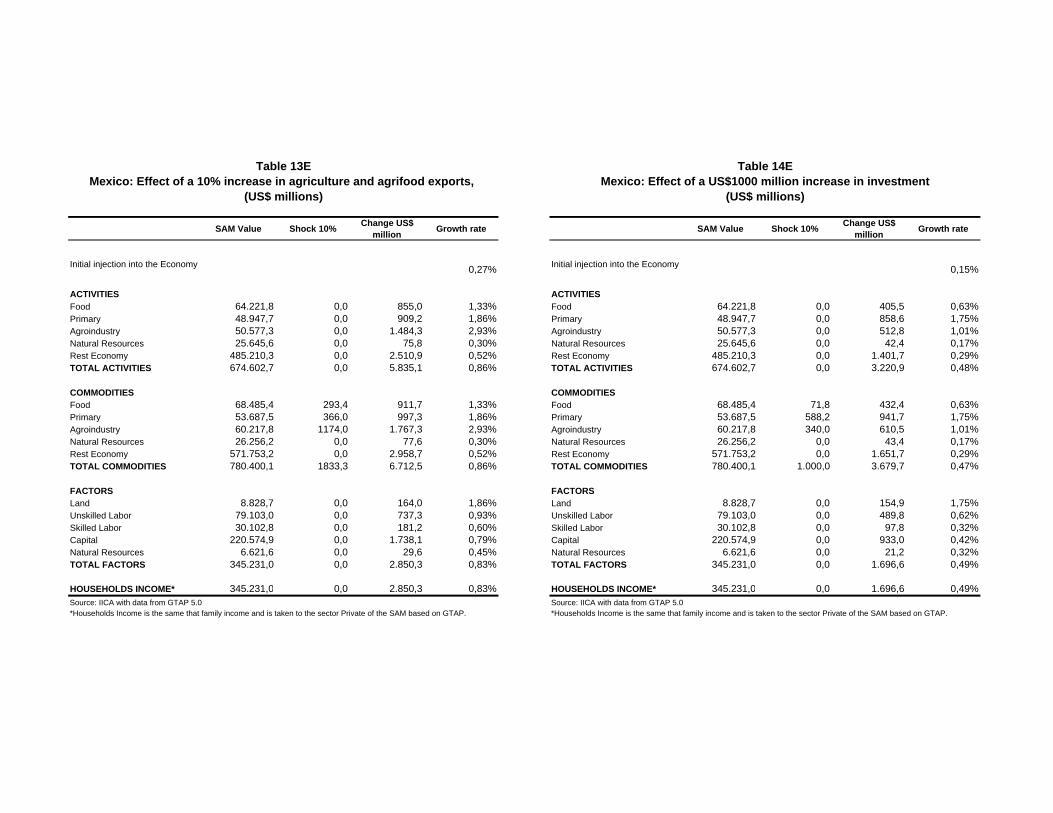
SAM Value Shock 10% Change US$ million Growth rate SAM Value Shock 10% Change US$
million Growth rate
Initial injection into the Economy 0,27% Initial injection into the Economy 0,15%
ACTIVITIES ACTIVITIESFood 64.221,8 0,0 855,0 1,33% Food 64.221,8 0,0 405,5 0,63%Primary 48.947,7 0,0 909,2 1,86% Primary 48.947,7 0,0 858,6 1,75%Agroindustry 50.577,3 0,0 1.484,3 2,93% Agroindustry 50.577,3 0,0 512,8 1,01%Natural Resources 25.645,6 0,0 75,8 0,30% Natural Resources 25.645,6 0,0 42,4 0,17%Rest Economy 485.210,3 0,0 2.510,9 0,52% Rest Economy 485.210,3 0,0 1.401,7 0,29%TOTAL ACTIVITIES 674.602,7 0,0 5.835,1 0,86% TOTAL ACTIVITIES 674.602,7 0,0 3.220,9 0,48%
COMMODITIES COMMODITIESFood 68.485,4 293,4 911,7 1,33% Food 68.485,4 71,8 432,4 0,63%Primary 53.687,5 366,0 997,3 1,86% Primary 53.687,5 588,2 941,7 1,75%Agroindustry 60.217,8 1174,0 1.767,3 2,93% Agroindustry 60.217,8 340,0 610,5 1,01%Natural Resources 26.256,2 0,0 77,6 0,30% Natural Resources 26.256,2 0,0 43,4 0,17%Rest Economy 571.753,2 0,0 2.958,7 0,52% Rest Economy 571.753,2 0,0 1.651,7 0,29%TOTAL COMMODITIES 780.400,1 1833,3 6.712,5 0,86% TOTAL COMMODITIES 780.400,1 1.000,0 3.679,7 0,47%
FACTORS FACTORSLand 8.828,7 0,0 164,0 1,86% Land 8.828,7 0,0 154,9 1,75%Unskilled Labor 79.103,0 0,0 737,3 0,93% Unskilled Labor 79.103,0 0,0 489,8 0,62%Skilled Labor 30.102,8 0,0 181,2 0,60% Skilled Labor 30.102,8 0,0 97,8 0,32%Capital 220.574,9 0,0 1.738,1 0,79% Capital 220.574,9 0,0 933,0 0,42%Natural Resources 6.621,6 0,0 29,6 0,45% Natural Resources 6.621,6 0,0 21,2 0,32%TOTAL FACTORS 345.231,0 0,0 2.850,3 0,83% TOTAL FACTORS 345.231,0 0,0 1.696,6 0,49%
HOUSEHOLDS INCOME* 345.231,0 0,0 2.850,3 0,83% HOUSEHOLDS INCOME* 345.231,0 0,0 1.696,6 0,49%Source: IICA with data from GTAP 5.0 Source: IICA with data from GTAP 5.0
Mexico: Effect of a 10% increase in agriculture and agrifood exports, Mexico: Effect of a US$1000 million increase in investment(US$ millions) (US$ millions)
Table 13E
*Households Income is the same that family income and is taken to the sector Private of the SAM based on GTAP. *Households Income is the same that family income and is taken to the sector Private of the SAM based on GTAP.
Table 14E

SAM Value Shock 10% Change US$ million Growth rate SAM Value Shock 10% Change US$
million Growth rate
Initial injection into the Economy 0,26% Initial injection into the Economy 0,93%
ACTIVITIES ACTIVITIESFood 12.760,4 0,0 263,4 2,06% Food 12.760,4 0,0 384,7 3,01%Primary 9.339,8 0,0 179,5 1,92% Primary 9.339,8 0,0 656,9 7,03%Agroindustry 11.494,3 0,0 178,5 1,55% Agroindustry 11.494,3 0,0 1.132,6 9,85%Natural Resources 2.514,1 0,0 8,6 0,34% Natural Resources 2.514,1 0,0 31,7 1,26%Rest Economy 71.456,7 0,0 383,5 0,54% Rest Economy 71.456,7 0,0 1.418,6 1,99%TOTAL ACTIVITIES 107.565,3 0,0 1.013,6 0,94% TOTAL ACTIVITIES 107.565,3 0,0 3.624,4 3,37%
COMMODITIES COMMODITIESFood 13.634,4 154,4 281,5 2,06% Food 13.634,4 0,0 411,0 3,01%Primary 9.930,7 55,1 190,9 1,92% Primary 9.930,7 341,5 698,4 7,03%Agroindustry 12.151,1 68,2 188,7 1,55% Agroindustry 12.151,1 658,5 1.197,3 9,85%Natural Resources 3.207,3 0,0 11,0 0,34% Natural Resources 3.207,3 0,0 40,4 1,26%Rest Economy 79.168,7 0,0 424,9 0,54% Rest Economy 79.168,7 0,0 1.571,7 1,99%TOTAL COMMODITIES 118.092,2 277,6 1.096,9 0,93% TOTAL COMMODITIES 118.092,2 1.000,0 3.918,8 3,32%
FACTORS FACTORSLand 1.565,4 0,0 30,1 1,92% Land 1.565,4 0,0 110,1 7,03%Unskilled Labor 11.566,3 0,0 107,6 0,93% Unskilled Labor 11.566,3 0,0 400,5 3,46%Skilled Labor 5.876,4 0,0 33,5 0,57% Skilled Labor 5.876,4 0,0 124,1 2,11%Capital 38.616,7 0,0 373,2 0,97% Capital 38.616,7 0,0 1.414,3 3,66%Natural Resources 568,6 0,0 6,2 1,09% Natural Resources 568,6 0,0 22,7 4,00%TOTAL FACTORS 58.193,4 0,0 550,6 0,95% TOTAL FACTORS 58.193,4 0,0 2.071,8 3,56%
HOUSEHOLDS INCOME* 58.193,4 0,0 550,6 0,95% HOUSEHOLDS INCOME* 58.193,4 0,0 2.071,8 3,56%Source: IICA with data from GTAP 5.0 Source: IICA with data from GTAP 5.0
Peru: Effect of a 10% increase in agriculture and agrifood exports, Peru: Effect of a US$1000 million increase in investment(US$ millions) (US$ millions)
Table 15E Table 16E
*Households Income is the same that family income and is taken to the sector Private of the SAM based on GTAP. *Households Income is the same that family income and is taken to the sector Private of the SAM based on GTAP.
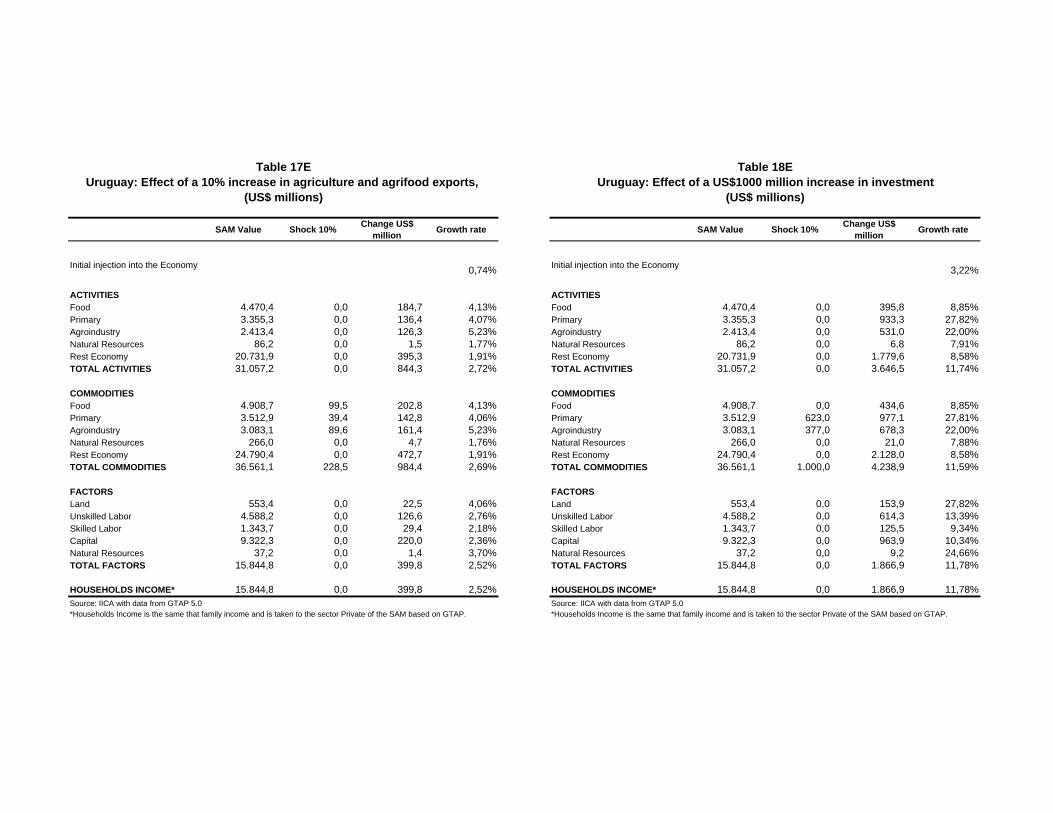
SAM Value Shock 10% Change US$ million Growth rate SAM Value Shock 10% Change US$
million Growth rate
Initial injection into the Economy 0,74% Initial injection into the Economy 3,22%
ACTIVITIES ACTIVITIESFood 4.470,4 0,0 184,7 4,13% Food 4.470,4 0,0 395,8 8,85%Primary 3.355,3 0,0 136,4 4,07% Primary 3.355,3 0,0 933,3 27,82%Agroindustry 2.413,4 0,0 126,3 5,23% Agroindustry 2.413,4 0,0 531,0 22,00%Natural Resources 86,2 0,0 1,5 1,77% Natural Resources 86,2 0,0 6,8 7,91%Rest Economy 20.731,9 0,0 395,3 1,91% Rest Economy 20.731,9 0,0 1.779,6 8,58%TOTAL ACTIVITIES 31.057,2 0,0 844,3 2,72% TOTAL ACTIVITIES 31.057,2 0,0 3.646,5 11,74%
COMMODITIES COMMODITIESFood 4.908,7 99,5 202,8 4,13% Food 4.908,7 0,0 434,6 8,85%Primary 3.512,9 39,4 142,8 4,06% Primary 3.512,9 623,0 977,1 27,81%Agroindustry 3.083,1 89,6 161,4 5,23% Agroindustry 3.083,1 377,0 678,3 22,00%Natural Resources 266,0 0,0 4,7 1,76% Natural Resources 266,0 0,0 21,0 7,88%Rest Economy 24.790,4 0,0 472,7 1,91% Rest Economy 24.790,4 0,0 2.128,0 8,58%TOTAL COMMODITIES 36.561,1 228,5 984,4 2,69% TOTAL COMMODITIES 36.561,1 1.000,0 4.238,9 11,59%
FACTORS FACTORSLand 553,4 0,0 22,5 4,06% Land 553,4 0,0 153,9 27,82%Unskilled Labor 4.588,2 0,0 126,6 2,76% Unskilled Labor 4.588,2 0,0 614,3 13,39%Skilled Labor 1.343,7 0,0 29,4 2,18% Skilled Labor 1.343,7 0,0 125,5 9,34%Capital 9.322,3 0,0 220,0 2,36% Capital 9.322,3 0,0 963,9 10,34%Natural Resources 37,2 0,0 1,4 3,70% Natural Resources 37,2 0,0 9,2 24,66%TOTAL FACTORS 15.844,8 0,0 399,8 2,52% TOTAL FACTORS 15.844,8 0,0 1.866,9 11,78%
HOUSEHOLDS INCOME* 15.844,8 0,0 399,8 2,52% HOUSEHOLDS INCOME* 15.844,8 0,0 1.866,9 11,78%Source: IICA with data from GTAP 5.0 Source: IICA with data from GTAP 5.0
Table 17E Table 18EUruguay: Effect of a 10% increase in agriculture and agrifood exports, Uruguay: Effect of a US$1000 million increase in investment
(US$ millions) (US$ millions)
*Households Income is the same that family income and is taken to the sector Private of the SAM based on GTAP. *Households Income is the same that family income and is taken to the sector Private of the SAM based on GTAP.
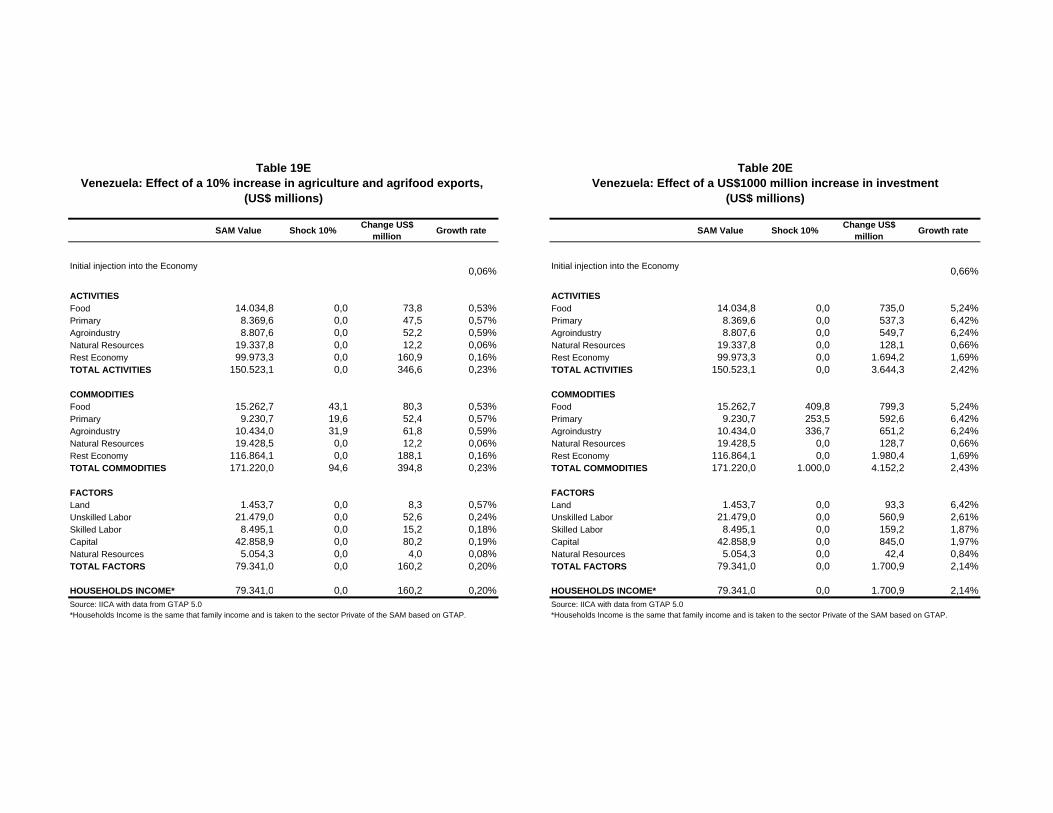
SAM Value Shock 10% Change US$ million Growth rate SAM Value Shock 10% Change US$
million Growth rate
Initial injection into the Economy 0,06% Initial injection into the Economy 0,66%
ACTIVITIES ACTIVITIESFood 14.034,8 0,0 73,8 0,53% Food 14.034,8 0,0 735,0 5,24%Primary 8.369,6 0,0 47,5 0,57% Primary 8.369,6 0,0 537,3 6,42%Agroindustry 8.807,6 0,0 52,2 0,59% Agroindustry 8.807,6 0,0 549,7 6,24%Natural Resources 19.337,8 0,0 12,2 0,06% Natural Resources 19.337,8 0,0 128,1 0,66%Rest Economy 99.973,3 0,0 160,9 0,16% Rest Economy 99.973,3 0,0 1.694,2 1,69%TOTAL ACTIVITIES 150.523,1 0,0 346,6 0,23% TOTAL ACTIVITIES 150.523,1 0,0 3.644,3 2,42%
COMMODITIES COMMODITIESFood 15.262,7 43,1 80,3 0,53% Food 15.262,7 409,8 799,3 5,24%Primary 9.230,7 19,6 52,4 0,57% Primary 9.230,7 253,5 592,6 6,42%Agroindustry 10.434,0 31,9 61,8 0,59% Agroindustry 10.434,0 336,7 651,2 6,24%Natural Resources 19.428,5 0,0 12,2 0,06% Natural Resources 19.428,5 0,0 128,7 0,66%Rest Economy 116.864,1 0,0 188,1 0,16% Rest Economy 116.864,1 0,0 1.980,4 1,69%TOTAL COMMODITIES 171.220,0 94,6 394,8 0,23% TOTAL COMMODITIES 171.220,0 1.000,0 4.152,2 2,43%
FACTORS FACTORSLand 1.453,7 0,0 8,3 0,57% Land 1.453,7 0,0 93,3 6,42%Unskilled Labor 21.479,0 0,0 52,6 0,24% Unskilled Labor 21.479,0 0,0 560,9 2,61%Skilled Labor 8.495,1 0,0 15,2 0,18% Skilled Labor 8.495,1 0,0 159,2 1,87%Capital 42.858,9 0,0 80,2 0,19% Capital 42.858,9 0,0 845,0 1,97%Natural Resources 5.054,3 0,0 4,0 0,08% Natural Resources 5.054,3 0,0 42,4 0,84%TOTAL FACTORS 79.341,0 0,0 160,2 0,20% TOTAL FACTORS 79.341,0 0,0 1.700,9 2,14%
HOUSEHOLDS INCOME* 79.341,0 0,0 160,2 0,20% HOUSEHOLDS INCOME* 79.341,0 0,0 1.700,9 2,14%Source: IICA with data from GTAP 5.0 Source: IICA with data from GTAP 5.0
Table 19E Table 20E
*Households Income is the same that family income and is taken to the sector Private of the SAM based on GTAP. *Households Income is the same that family income and is taken to the sector Private of the SAM based on GTAP.
Venezuela: Effect of a 10% increase in agriculture and agrifood exports, Venezuela: Effect of a US$1000 million increase in investment(US$ millions) (US$ millions)

ANNEX FResults of an Increase in the Exports of Key Agricultural and Agroindustrial Sectors
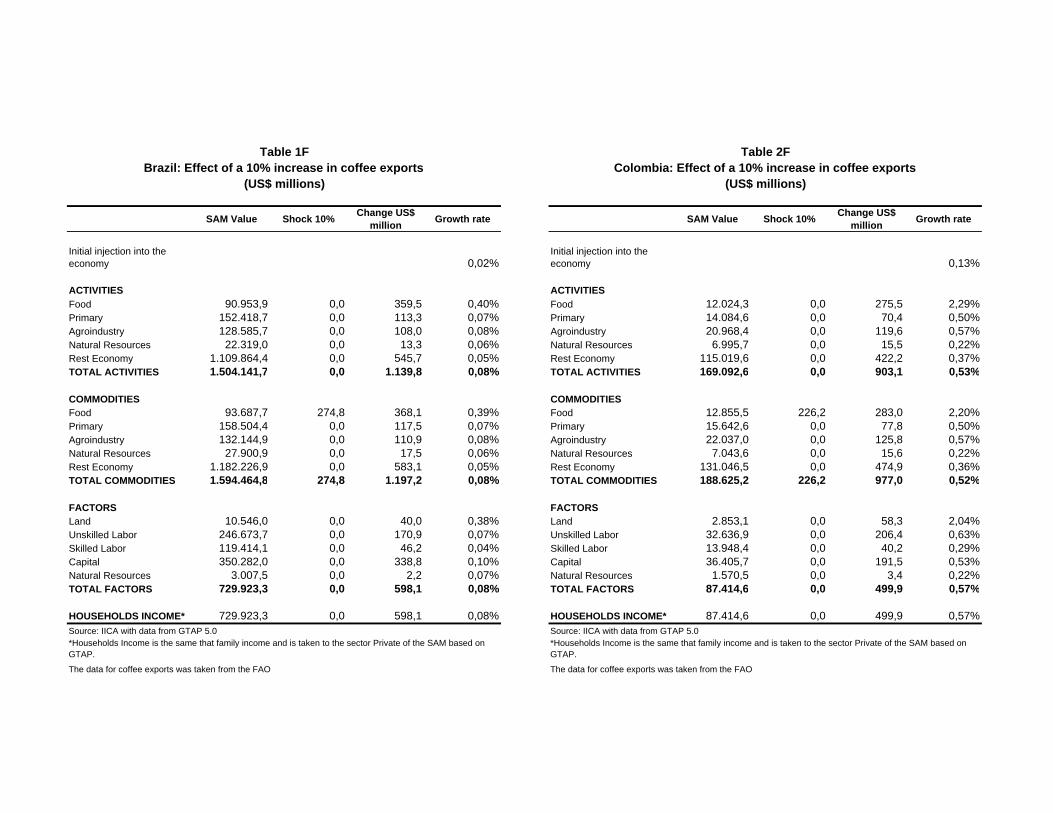
SAM Value Shock 10% Change US$ million Growth rate SAM Value Shock 10% Change US$
million Growth rate
Initial injection into the economy 0,02%
Initial injection into the economy 0,13%
ACTIVITIES ACTIVITIESFood 90.953,9 0,0 359,5 0,40% Food 12.024,3 0,0 275,5 2,29%Primary 152.418,7 0,0 113,3 0,07% Primary 14.084,6 0,0 70,4 0,50%Agroindustry 128.585,7 0,0 108,0 0,08% Agroindustry 20.968,4 0,0 119,6 0,57%Natural Resources 22.319,0 0,0 13,3 0,06% Natural Resources 6.995,7 0,0 15,5 0,22%Rest Economy 1.109.864,4 0,0 545,7 0,05% Rest Economy 115.019,6 0,0 422,2 0,37%TOTAL ACTIVITIES 1.504.141,7 0,0 1.139,8 0,08% TOTAL ACTIVITIES 169.092,6 0,0 903,1 0,53%
COMMODITIES COMMODITIESFood 93.687,7 274,8 368,1 0,39% Food 12.855,5 226,2 283,0 2,20%Primary 158.504,4 0,0 117,5 0,07% Primary 15.642,6 0,0 77,8 0,50%Agroindustry 132.144,9 0,0 110,9 0,08% Agroindustry 22.037,0 0,0 125,8 0,57%Natural Resources 27.900,9 0,0 17,5 0,06% Natural Resources 7.043,6 0,0 15,6 0,22%Rest Economy 1.182.226,9 0,0 583,1 0,05% Rest Economy 131.046,5 0,0 474,9 0,36%TOTAL COMMODITIES 1.594.464,8 274,8 1.197,2 0,08% TOTAL COMMODITIES 188.625,2 226,2 977,0 0,52%
FACTORS FACTORSLand 10.546,0 0,0 40,0 0,38% Land 2.853,1 0,0 58,3 2,04%Unskilled Labor 246.673,7 0,0 170,9 0,07% Unskilled Labor 32.636,9 0,0 206,4 0,63%Skilled Labor 119.414,1 0,0 46,2 0,04% Skilled Labor 13.948,4 0,0 40,2 0,29%Capital 350.282,0 0,0 338,8 0,10% Capital 36.405,7 0,0 191,5 0,53%Natural Resources 3.007,5 0,0 2,2 0,07% Natural Resources 1.570,5 0,0 3,4 0,22%TOTAL FACTORS 729.923,3 0,0 598,1 0,08% TOTAL FACTORS 87.414,6 0,0 499,9 0,57%
HOUSEHOLDS INCOME* 729.923,3 0,0 598,1 0,08% HOUSEHOLDS INCOME* 87.414,6 0,0 499,9 0,57%Source: IICA with data from GTAP 5.0 Source: IICA with data from GTAP 5.0
The data for coffee exports was taken from the FAO The data for coffee exports was taken from the FAO
Table 1F Table 2F
(US$ millions)Brazil: Effect of a 10% increase in coffee exports Colombia: Effect of a 10% increase in coffee exports
(US$ millions)
*Households Income is the same that family income and is taken to the sector Private of the SAM based on GTAP.
*Households Income is the same that family income and is taken to the sector Private of the SAM based on GTAP.
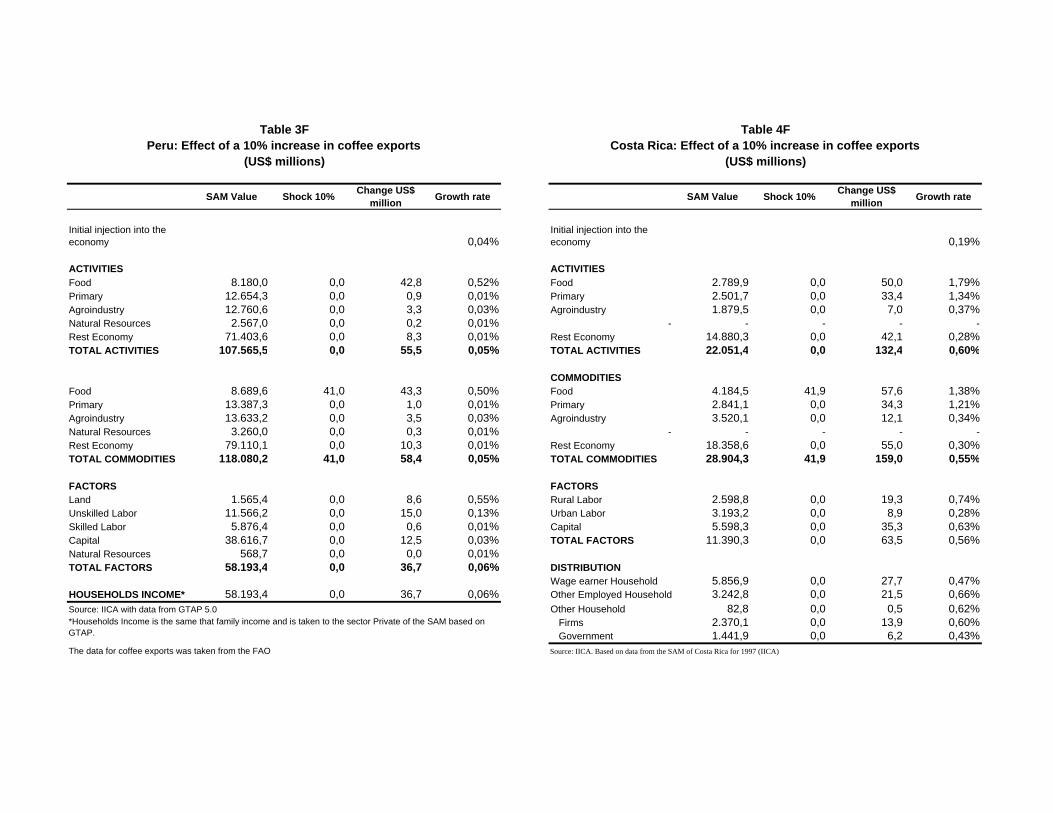
SAM Value Shock 10% Change US$ million Growth rate SAM Value Shock 10% Change US$
million Growth rate
Initial injection into the economy 0,04%
Initial injection into the economy 0,19%
ACTIVITIES ACTIVITIESFood 8.180,0 0,0 42,8 0,52% Food 2.789,9 0,0 50,0 1,79%Primary 12.654,3 0,0 0,9 0,01% Primary 2.501,7 0,0 33,4 1,34%Agroindustry 12.760,6 0,0 3,3 0,03% Agroindustry 1.879,5 0,0 7,0 0,37%Natural Resources 2.567,0 0,0 0,2 0,01% - - - - -Rest Economy 71.403,6 0,0 8,3 0,01% Rest Economy 14.880,3 0,0 42,1 0,28%TOTAL ACTIVITIES 107.565,5 0,0 55,5 0,05% TOTAL ACTIVITIES 22.051,4 0,0 132,4 0,60%
COMMODITIESFood 8.689,6 41,0 43,3 0,50% Food 4.184,5 41,9 57,6 1,38%Primary 13.387,3 0,0 1,0 0,01% Primary 2.841,1 0,0 34,3 1,21%Agroindustry 13.633,2 0,0 3,5 0,03% Agroindustry 3.520,1 0,0 12,1 0,34%Natural Resources 3.260,0 0,0 0,3 0,01% - - - - -Rest Economy 79.110,1 0,0 10,3 0,01% Rest Economy 18.358,6 0,0 55,0 0,30%TOTAL COMMODITIES 118.080,2 41,0 58,4 0,05% TOTAL COMMODITIES 28.904,3 41,9 159,0 0,55%
FACTORS FACTORSLand 1.565,4 0,0 8,6 0,55% Rural Labor 2.598,8 0,0 19,3 0,74%Unskilled Labor 11.566,2 0,0 15,0 0,13% Urban Labor 3.193,2 0,0 8,9 0,28%Skilled Labor 5.876,4 0,0 0,6 0,01% Capital 5.598,3 0,0 35,3 0,63%Capital 38.616,7 0,0 12,5 0,03% TOTAL FACTORS 11.390,3 0,0 63,5 0,56%Natural Resources 568,7 0,0 0,0 0,01%TOTAL FACTORS 58.193,4 0,0 36,7 0,06% DISTRIBUTION
Wage earner Household 5.856,9 0,0 27,7 0,47%HOUSEHOLDS INCOME* 58.193,4 0,0 36,7 0,06% Other Employed Household 3.242,8 0,0 21,5 0,66%Source: IICA with data from GTAP 5.0 Other Household 82,8 0,0 0,5 0,62%
Firms 2.370,1 0,0 13,9 0,60% Government 1.441,9 0,0 6,2 0,43%
The data for coffee exports was taken from the FAO Source: IICA. Based on data from the SAM of Costa Rica for 1997 (IICA)
Table 3F Table 4FPeru: Effect of a 10% increase in coffee exports Costa Rica: Effect of a 10% increase in coffee exports
(US$ millions) (US$ millions)
*Households Income is the same that family income and is taken to the sector Private of the SAM based on GTAP.
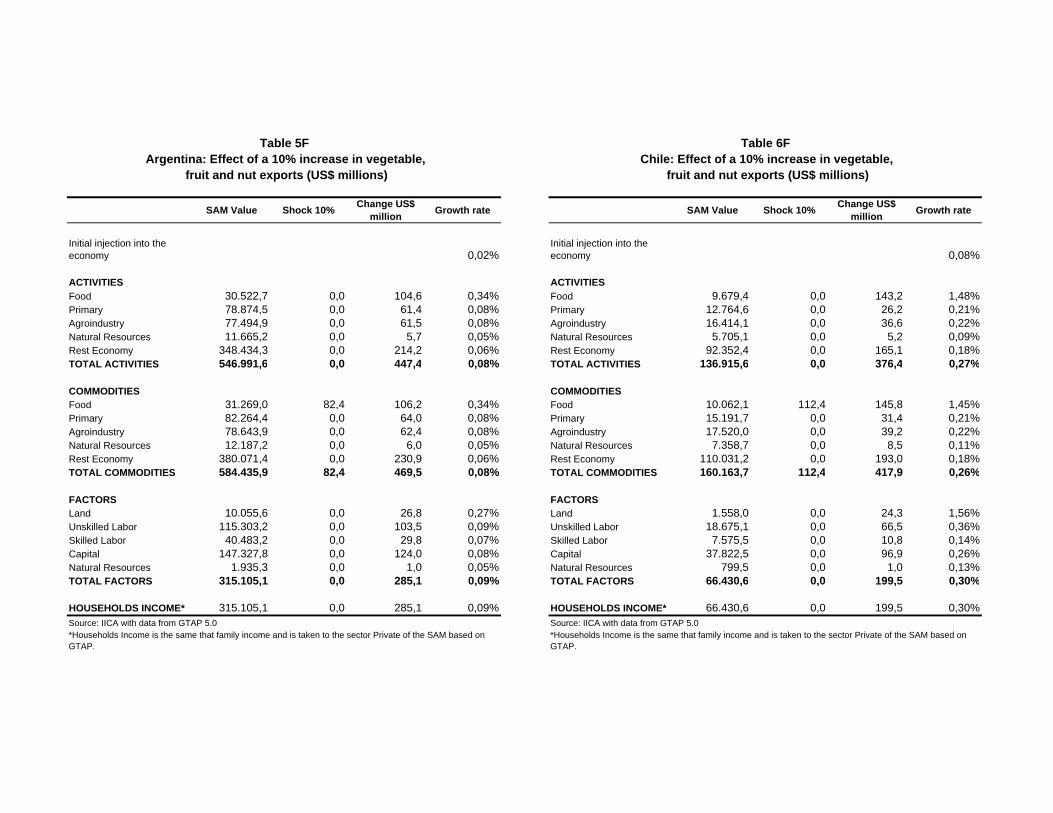
SAM Value Shock 10% Change US$ million Growth rate SAM Value Shock 10% Change US$
million Growth rate
Initial injection into the economy 0,02%
Initial injection into the economy 0,08%
ACTIVITIES ACTIVITIESFood 30.522,7 0,0 104,6 0,34% Food 9.679,4 0,0 143,2 1,48%Primary 78.874,5 0,0 61,4 0,08% Primary 12.764,6 0,0 26,2 0,21%Agroindustry 77.494,9 0,0 61,5 0,08% Agroindustry 16.414,1 0,0 36,6 0,22%Natural Resources 11.665,2 0,0 5,7 0,05% Natural Resources 5.705,1 0,0 5,2 0,09%Rest Economy 348.434,3 0,0 214,2 0,06% Rest Economy 92.352,4 0,0 165,1 0,18%TOTAL ACTIVITIES 546.991,6 0,0 447,4 0,08% TOTAL ACTIVITIES 136.915,6 0,0 376,4 0,27%
COMMODITIES COMMODITIESFood 31.269,0 82,4 106,2 0,34% Food 10.062,1 112,4 145,8 1,45%Primary 82.264,4 0,0 64,0 0,08% Primary 15.191,7 0,0 31,4 0,21%Agroindustry 78.643,9 0,0 62,4 0,08% Agroindustry 17.520,0 0,0 39,2 0,22%Natural Resources 12.187,2 0,0 6,0 0,05% Natural Resources 7.358,7 0,0 8,5 0,11%Rest Economy 380.071,4 0,0 230,9 0,06% Rest Economy 110.031,2 0,0 193,0 0,18%TOTAL COMMODITIES 584.435,9 82,4 469,5 0,08% TOTAL COMMODITIES 160.163,7 112,4 417,9 0,26%
FACTORS FACTORSLand 10.055,6 0,0 26,8 0,27% Land 1.558,0 0,0 24,3 1,56%Unskilled Labor 115.303,2 0,0 103,5 0,09% Unskilled Labor 18.675,1 0,0 66,5 0,36%Skilled Labor 40.483,2 0,0 29,8 0,07% Skilled Labor 7.575,5 0,0 10,8 0,14%Capital 147.327,8 0,0 124,0 0,08% Capital 37.822,5 0,0 96,9 0,26%Natural Resources 1.935,3 0,0 1,0 0,05% Natural Resources 799,5 0,0 1,0 0,13%TOTAL FACTORS 315.105,1 0,0 285,1 0,09% TOTAL FACTORS 66.430,6 0,0 199,5 0,30%
HOUSEHOLDS INCOME* 315.105,1 0,0 285,1 0,09% HOUSEHOLDS INCOME* 66.430,6 0,0 199,5 0,30%Source: IICA with data from GTAP 5.0 Source: IICA with data from GTAP 5.0
Table 5F Table 6FArgentina: Effect of a 10% increase in vegetable, Chile: Effect of a 10% increase in vegetable,
fruit and nut exports (US$ millions) fruit and nut exports (US$ millions)
*Households Income is the same that family income and is taken to the sector Private of the SAM based on GTAP.
*Households Income is the same that family income and is taken to the sector Private of the SAM based on GTAP.
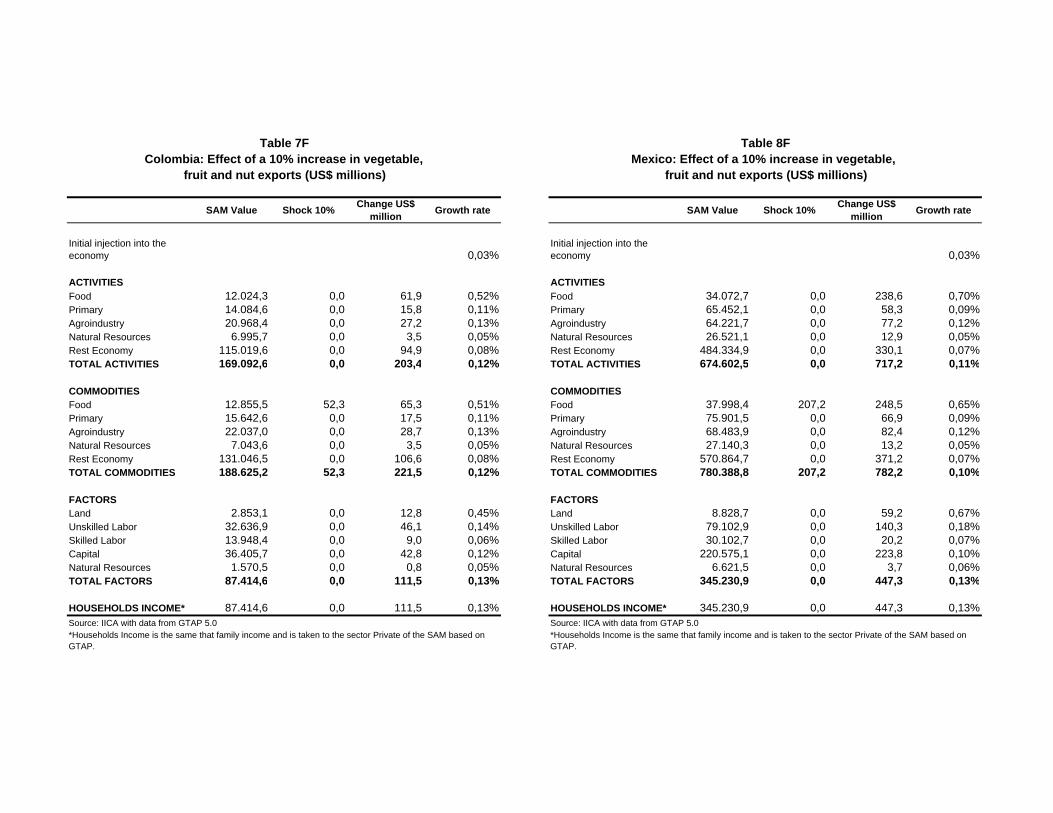
SAM Value Shock 10% Change US$ million Growth rate SAM Value Shock 10% Change US$
million Growth rate
Initial injection into the economy 0,03%
Initial injection into the economy 0,03%
ACTIVITIES ACTIVITIESFood 12.024,3 0,0 61,9 0,52% Food 34.072,7 0,0 238,6 0,70%Primary 14.084,6 0,0 15,8 0,11% Primary 65.452,1 0,0 58,3 0,09%Agroindustry 20.968,4 0,0 27,2 0,13% Agroindustry 64.221,7 0,0 77,2 0,12%Natural Resources 6.995,7 0,0 3,5 0,05% Natural Resources 26.521,1 0,0 12,9 0,05%Rest Economy 115.019,6 0,0 94,9 0,08% Rest Economy 484.334,9 0,0 330,1 0,07%TOTAL ACTIVITIES 169.092,6 0,0 203,4 0,12% TOTAL ACTIVITIES 674.602,5 0,0 717,2 0,11%
COMMODITIES COMMODITIESFood 12.855,5 52,3 65,3 0,51% Food 37.998,4 207,2 248,5 0,65%Primary 15.642,6 0,0 17,5 0,11% Primary 75.901,5 0,0 66,9 0,09%Agroindustry 22.037,0 0,0 28,7 0,13% Agroindustry 68.483,9 0,0 82,4 0,12%Natural Resources 7.043,6 0,0 3,5 0,05% Natural Resources 27.140,3 0,0 13,2 0,05%Rest Economy 131.046,5 0,0 106,6 0,08% Rest Economy 570.864,7 0,0 371,2 0,07%TOTAL COMMODITIES 188.625,2 52,3 221,5 0,12% TOTAL COMMODITIES 780.388,8 207,2 782,2 0,10%
FACTORS FACTORSLand 2.853,1 0,0 12,8 0,45% Land 8.828,7 0,0 59,2 0,67%Unskilled Labor 32.636,9 0,0 46,1 0,14% Unskilled Labor 79.102,9 0,0 140,3 0,18%Skilled Labor 13.948,4 0,0 9,0 0,06% Skilled Labor 30.102,7 0,0 20,2 0,07%Capital 36.405,7 0,0 42,8 0,12% Capital 220.575,1 0,0 223,8 0,10%Natural Resources 1.570,5 0,0 0,8 0,05% Natural Resources 6.621,5 0,0 3,7 0,06%TOTAL FACTORS 87.414,6 0,0 111,5 0,13% TOTAL FACTORS 345.230,9 0,0 447,3 0,13%
HOUSEHOLDS INCOME* 87.414,6 0,0 111,5 0,13% HOUSEHOLDS INCOME* 345.230,9 0,0 447,3 0,13%Source: IICA with data from GTAP 5.0 Source: IICA with data from GTAP 5.0
Colombia: Effect of a 10% increase in vegetable, Mexico: Effect of a 10% increase in vegetable, fruit and nut exports (US$ millions) fruit and nut exports (US$ millions)
Table 7F Table 8F
*Households Income is the same that family income and is taken to the sector Private of the SAM based on GTAP.
*Households Income is the same that family income and is taken to the sector Private of the SAM based on GTAP.
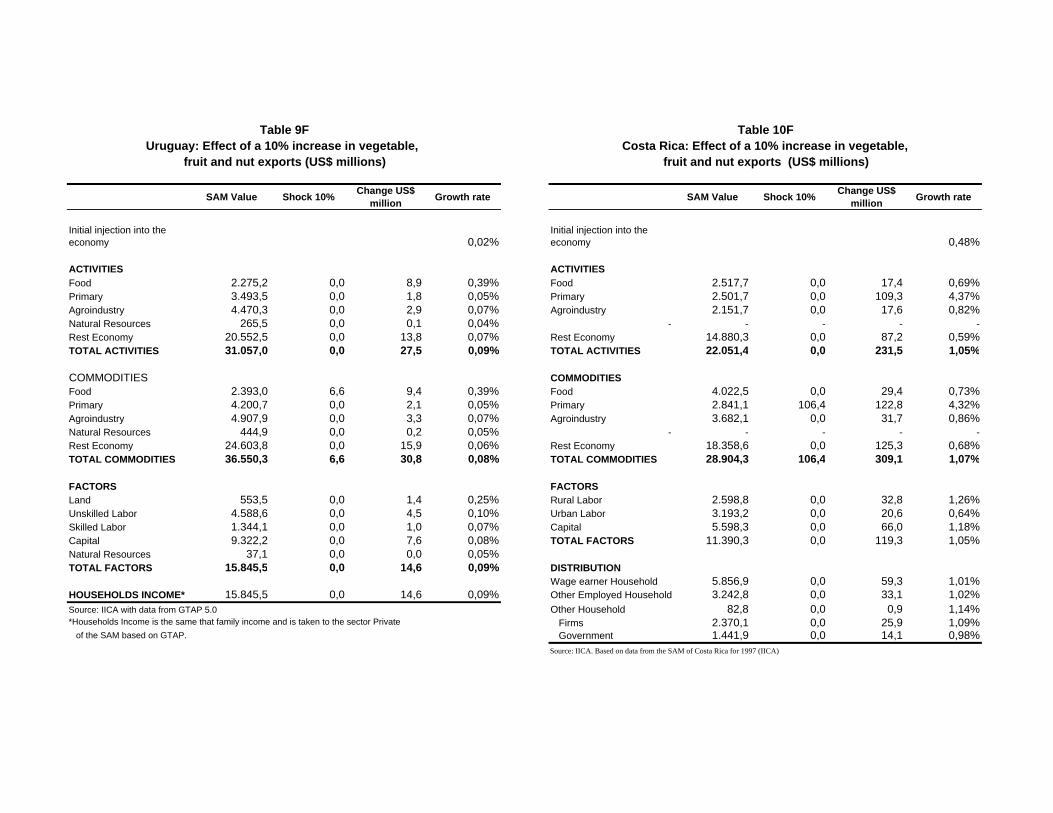
SAM Value Shock 10% Change US$ million Growth rate SAM Value Shock 10% Change US$
million Growth rate
Initial injection into the economy 0,02%
Initial injection into the economy 0,48%
ACTIVITIES ACTIVITIESFood 2.275,2 0,0 8,9 0,39% Food 2.517,7 0,0 17,4 0,69%Primary 3.493,5 0,0 1,8 0,05% Primary 2.501,7 0,0 109,3 4,37%Agroindustry 4.470,3 0,0 2,9 0,07% Agroindustry 2.151,7 0,0 17,6 0,82%Natural Resources 265,5 0,0 0,1 0,04% - - - - -Rest Economy 20.552,5 0,0 13,8 0,07% Rest Economy 14.880,3 0,0 87,2 0,59%TOTAL ACTIVITIES 31.057,0 0,0 27,5 0,09% TOTAL ACTIVITIES 22.051,4 0,0 231,5 1,05%
COMMODITIES COMMODITIESFood 2.393,0 6,6 9,4 0,39% Food 4.022,5 0,0 29,4 0,73%Primary 4.200,7 0,0 2,1 0,05% Primary 2.841,1 106,4 122,8 4,32%Agroindustry 4.907,9 0,0 3,3 0,07% Agroindustry 3.682,1 0,0 31,7 0,86%Natural Resources 444,9 0,0 0,2 0,05% - - - - -Rest Economy 24.603,8 0,0 15,9 0,06% Rest Economy 18.358,6 0,0 125,3 0,68%TOTAL COMMODITIES 36.550,3 6,6 30,8 0,08% TOTAL COMMODITIES 28.904,3 106,4 309,1 1,07%
FACTORS FACTORSLand 553,5 0,0 1,4 0,25% Rural Labor 2.598,8 0,0 32,8 1,26%Unskilled Labor 4.588,6 0,0 4,5 0,10% Urban Labor 3.193,2 0,0 20,6 0,64%Skilled Labor 1.344,1 0,0 1,0 0,07% Capital 5.598,3 0,0 66,0 1,18%Capital 9.322,2 0,0 7,6 0,08% TOTAL FACTORS 11.390,3 0,0 119,3 1,05%Natural Resources 37,1 0,0 0,0 0,05%TOTAL FACTORS 15.845,5 0,0 14,6 0,09% DISTRIBUTION
Wage earner Household 5.856,9 0,0 59,3 1,01%HOUSEHOLDS INCOME* 15.845,5 0,0 14,6 0,09% Other Employed Household 3.242,8 0,0 33,1 1,02%Source: IICA with data from GTAP 5.0 Other Household 82,8 0,0 0,9 1,14%
Firms 2.370,1 0,0 25,9 1,09% of the SAM based on GTAP. Government 1.441,9 0,0 14,1 0,98%
Source: IICA. Based on data from the SAM of Costa Rica for 1997 (IICA)
*Households Income is the same that family income and is taken to the sector Private
Table 9F Table 10FUruguay: Effect of a 10% increase in vegetable, Costa Rica: Effect of a 10% increase in vegetable,
fruit and nut exports (US$ millions) fruit and nut exports (US$ millions)

SAM Value Shock 10% Change US$ million Growth rate SAM Value Shock 10% Change US$
million Growth rate
Initial injection into the economy 0,03%
Initial injection into the economy 0,01%
ACTIVITIES ACTIVITIESFood 30.522,7 0,0 201,1 0,66% Food 2.275,2 0,0 5,4 0,24%Primary 78.874,5 0,0 112,1 0,14% Primary 3.493,5 0,0 1,2 0,03%Agroindustry 77.494,9 0,0 112,5 0,15% Agroindustry 4.470,3 0,0 2,1 0,05%Natural Resources 11.665,2 0,0 12,0 0,10% Natural Resources 265,5 0,0 0,1 0,03%Rest Economy 348.434,3 0,0 401,4 0,12% Rest Economy 20.552,5 0,0 9,5 0,05%TOTAL ACTIVITIES 546.991,6 0,0 839,1 0,15% TOTAL ACTIVITIES 31.057,0 0,0 18,2 0,06%
COMMODITIES COMMODITIESFood 31.269,0 149,0 202,1 0,65% Food 2.393,0 4,3 5,5 0,23%Primary 82.264,4 0,0 116,9 0,14% Primary 4.200,7 0,0 1,4 0,03%Agroindustry 78.643,9 0,0 114,2 0,15% Agroindustry 4.907,9 0,0 2,3 0,05%Natural Resources 12.187,2 0,0 12,4 0,10% Natural Resources 444,9 0,0 0,2 0,04%Rest Economy 380.071,4 0,0 432,0 0,11% Rest Economy 24.603,8 0,0 10,9 0,04%TOTAL COMMODITIES 584.435,9 149,0 877,6 0,15% TOTAL COMMODITIES 36.550,3 4,3 20,3 0,06%
FACTORS FACTORSLand 10.055,6 0,0 46,6 0,46% Land 553,5 0,0 1,0 0,18%Unskilled Labor 115.303,2 0,0 187,3 0,16% Unskilled Labor 4.588,6 0,0 3,2 0,07%Skilled Labor 40.483,2 0,0 56,2 0,14% Skilled Labor 1.344,1 0,0 0,7 0,05%Capital 147.327,8 0,0 229,2 0,16% Capital 9.322,2 0,0 5,3 0,06%Natural Resources 1.935,3 0,0 2,2 0,11% Natural Resources 37,1 0,0 0,0 0,04%TOTAL FACTORS 315.105,1 0,0 521,5 0,17% TOTAL FACTORS 15.845,5 0,0 10,2 0,06%
HOUSEHOLDS INCOME* 315.105,1 0,0 521,5 0,17% HOUSEHOLDS INCOME* 15.845,5 0,0 10,2 0,06%Source: IICA with data from GTAP 5.0 Source: IICA with data from GTAP 5.0
Table 11F Table 12FArgentina: Effect of a 10% increase in wheat exports Uruguay: Effect of a 10% increase in wheat exports
(US$ millions) (US$ millions)
*Households Income is the same that family income and is taken to the sector Private of the SAM based on GTAP.
*Households Income is the same that family income and is taken to the sector Private of the SAM based on GTAP.

SAM Value Shock 10% Change US$ million Growth rate
Initial injection into the economy 0,03%
ACTIVITIESFood 30.522,7 0,0 183,9 0,60%Primary 78.874,5 0,0 104,2 0,13%Agroindustry 77.494,9 0,0 105,4 0,14%Natural Resources 11.665,2 0,0 10,3 0,09%Rest Economy 348.434,3 0,0 359,6 0,10%TOTAL ACTIVITIES 546.991,6 0,0 763,4 0,14%
COMMODITIESFood 31.269,0 141,5 187,7 0,60%Primary 82.264,4 0,0 108,5 0,13%Agroindustry 78.643,9 0,0 107,0 0,14%Natural Resources 12.187,2 0,0 10,7 0,09%Rest Economy 380.071,4 0,0 387,0 0,10%TOTAL COMMODITIES 584.435,9 141,5 801,1 0,14%
FACTORSLand 10.055,6 0,0 47,3 0,47%Unskilled Labor 115.303,2 0,0 178,3 0,15%Skilled Labor 40.483,2 0,0 50,8 0,13%Capital 147.327,8 0,0 212,2 0,14%Natural Resources 1.935,3 0,0 1,8 0,09%TOTAL FACTORS 315.105,1 0,0 490,4 0,16%
HOUSEHOLDS INCOME* 315.105,1 0,0 490,4 0,16%Source: IICA with data from GTAP 5.0
(US$ millions)
Table 13F
*Households Income is the same that family income and is taken to the sector Private of the SAM based on GTAP.
Argentina: Effect of a 10% increase in corn, barley and oats exports
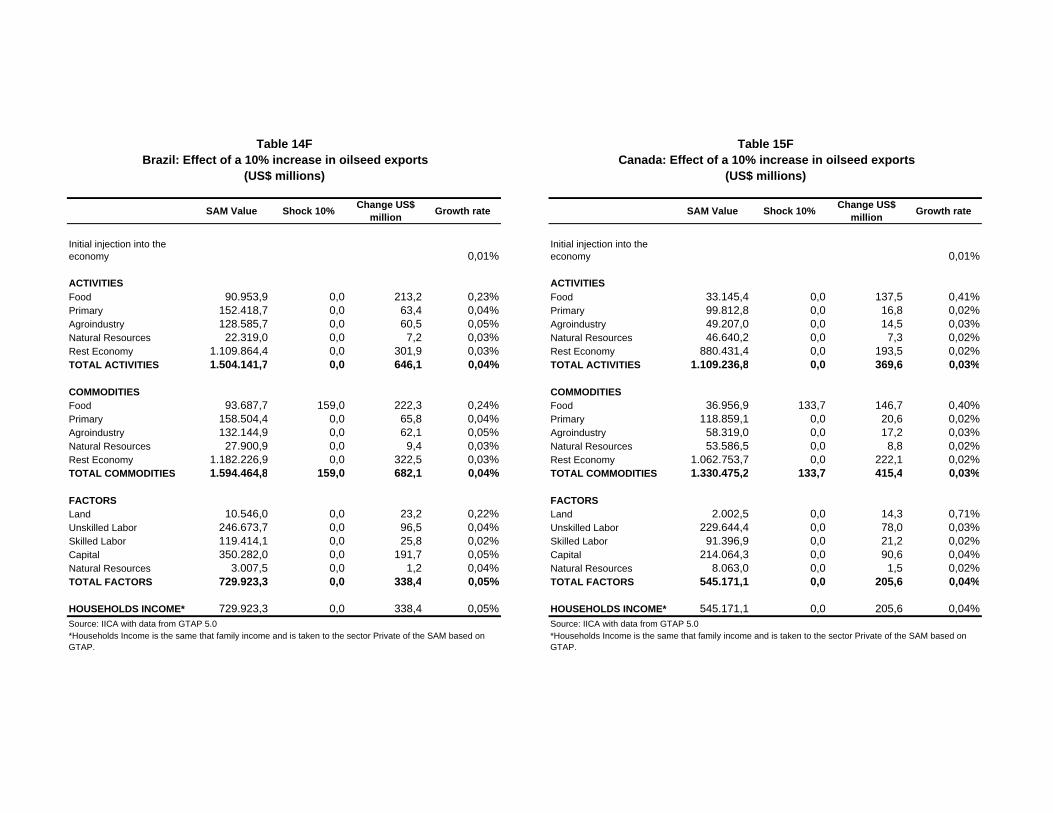
SAM Value Shock 10% Change US$ million Growth rate SAM Value Shock 10% Change US$
million Growth rate
Initial injection into the economy 0,01%
Initial injection into the economy 0,01%
ACTIVITIES ACTIVITIESFood 90.953,9 0,0 213,2 0,23% Food 33.145,4 0,0 137,5 0,41%Primary 152.418,7 0,0 63,4 0,04% Primary 99.812,8 0,0 16,8 0,02%Agroindustry 128.585,7 0,0 60,5 0,05% Agroindustry 49.207,0 0,0 14,5 0,03%Natural Resources 22.319,0 0,0 7,2 0,03% Natural Resources 46.640,2 0,0 7,3 0,02%Rest Economy 1.109.864,4 0,0 301,9 0,03% Rest Economy 880.431,4 0,0 193,5 0,02%TOTAL ACTIVITIES 1.504.141,7 0,0 646,1 0,04% TOTAL ACTIVITIES 1.109.236,8 0,0 369,6 0,03%
COMMODITIES COMMODITIESFood 93.687,7 159,0 222,3 0,24% Food 36.956,9 133,7 146,7 0,40%Primary 158.504,4 0,0 65,8 0,04% Primary 118.859,1 0,0 20,6 0,02%Agroindustry 132.144,9 0,0 62,1 0,05% Agroindustry 58.319,0 0,0 17,2 0,03%Natural Resources 27.900,9 0,0 9,4 0,03% Natural Resources 53.586,5 0,0 8,8 0,02%Rest Economy 1.182.226,9 0,0 322,5 0,03% Rest Economy 1.062.753,7 0,0 222,1 0,02%TOTAL COMMODITIES 1.594.464,8 159,0 682,1 0,04% TOTAL COMMODITIES 1.330.475,2 133,7 415,4 0,03%
FACTORS FACTORSLand 10.546,0 0,0 23,2 0,22% Land 2.002,5 0,0 14,3 0,71%Unskilled Labor 246.673,7 0,0 96,5 0,04% Unskilled Labor 229.644,4 0,0 78,0 0,03%Skilled Labor 119.414,1 0,0 25,8 0,02% Skilled Labor 91.396,9 0,0 21,2 0,02%Capital 350.282,0 0,0 191,7 0,05% Capital 214.064,3 0,0 90,6 0,04%Natural Resources 3.007,5 0,0 1,2 0,04% Natural Resources 8.063,0 0,0 1,5 0,02%TOTAL FACTORS 729.923,3 0,0 338,4 0,05% TOTAL FACTORS 545.171,1 0,0 205,6 0,04%
HOUSEHOLDS INCOME* 729.923,3 0,0 338,4 0,05% HOUSEHOLDS INCOME* 545.171,1 0,0 205,6 0,04%Source: IICA with data from GTAP 5.0 Source: IICA with data from GTAP 5.0
Brazil: Effect of a 10% increase in oilseed exports Canada: Effect of a 10% increase in oilseed exports(US$ millions) (US$ millions)
Table 14F Table 15F
*Households Income is the same that family income and is taken to the sector Private of the SAM based on GTAP.
*Households Income is the same that family income and is taken to the sector Private of the SAM based on GTAP.

SAM Value Shock 10% Change US$ million Growth rate SAM Value Shock 10% Change US$
million Growth rate
Initial injection into the economy 0,01%
Initial injection into the economy 0,01%
ACTIVITIES ACTIVITIESFood 2.275,2 0,0 4,6 0,20% Food 207.909,9 0,0 868,3 0,42%Primary 3.493,5 0,0 1,0 0,03% Primary 758.071,4 0,0 139,0 0,02%Agroindustry 4.470,3 0,0 1,6 0,04% Agroindustry 556.230,9 0,0 131,4 0,02%Natural Resources 265,5 0,0 0,1 0,02% Natural Resources 186.292,5 0,0 53,3 0,03%Rest Economy 20.552,5 0,0 7,6 0,04% Rest Economy 12.641.097,7 0,0 2.526,2 0,02%TOTAL ACTIVITIES 31.057,0 0,0 14,9 0,05% TOTAL ACTIVITIES 14.349.602,4 0,0 3.718,2 0,03%
COMMODITIES COMMODITIESFood 2.393,0 3,7 4,8 0,20% Food 226.994,9 777,6 892,2 0,39%Primary 4.200,7 0,0 1,1 0,03% Primary 894.396,4 0,0 166,6 0,02%Agroindustry 4.907,9 0,0 1,8 0,04% Agroindustry 588.248,3 0,0 139,0 0,02%Natural Resources 444,9 0,0 0,1 0,03% Natural Resources 256.548,0 0,0 74,0 0,03%Rest Economy 24.603,8 0,0 8,9 0,04% Rest Economy 13.431.573,8 0,0 2.638,1 0,02%TOTAL COMMODITIES 36.550,3 3,7 16,8 0,05% TOTAL COMMODITIES 15.397.761,4 777,6 3.910,0 0,03%
FACTORS FACTORSLand 553,5 0,0 0,8 0,14% Land 27.432,4 0,0 136,7 0,50%Unskilled Labor 4.588,6 0,0 2,6 0,06% Unskilled Labor 2.867.461,2 0,0 721,2 0,03%Skilled Labor 1.344,1 0,0 0,6 0,04% Skilled Labor 2.035.685,6 0,0 412,2 0,02%Capital 9.322,2 0,0 4,3 0,05% Capital 2.974.337,5 0,0 818,9 0,03%Natural Resources 37,1 0,0 0,0 0,03% Natural Resources 24.502,8 0,0 6,7 0,03%TOTAL FACTORS 15.845,5 0,0 8,2 0,05% TOTAL FACTORS 7.929.419,5 0,0 2.095,7 0,03%
HOUSEHOLDS INCOME* 15.845,5 0,0 8,2 0,05% HOUSEHOLDS INCOME* 7.929.419,5 0,0 2.095,7 0,03%Source: IICA with data from GTAP 5.0 Source: IICA with data from GTAP 5.0
Table 16F Table 17FUruguay: Effect of a 10% increase in oilseed exports United States: Effect of a 10% increase in oilseed exports
(US$ millions) (US$ millions)
*Households Income is the same that family income and is taken to the sector Private of the SAM based on GTAP.
*Households Income is the same that family income and is taken to the sector Private of the SAM based on GTAP.
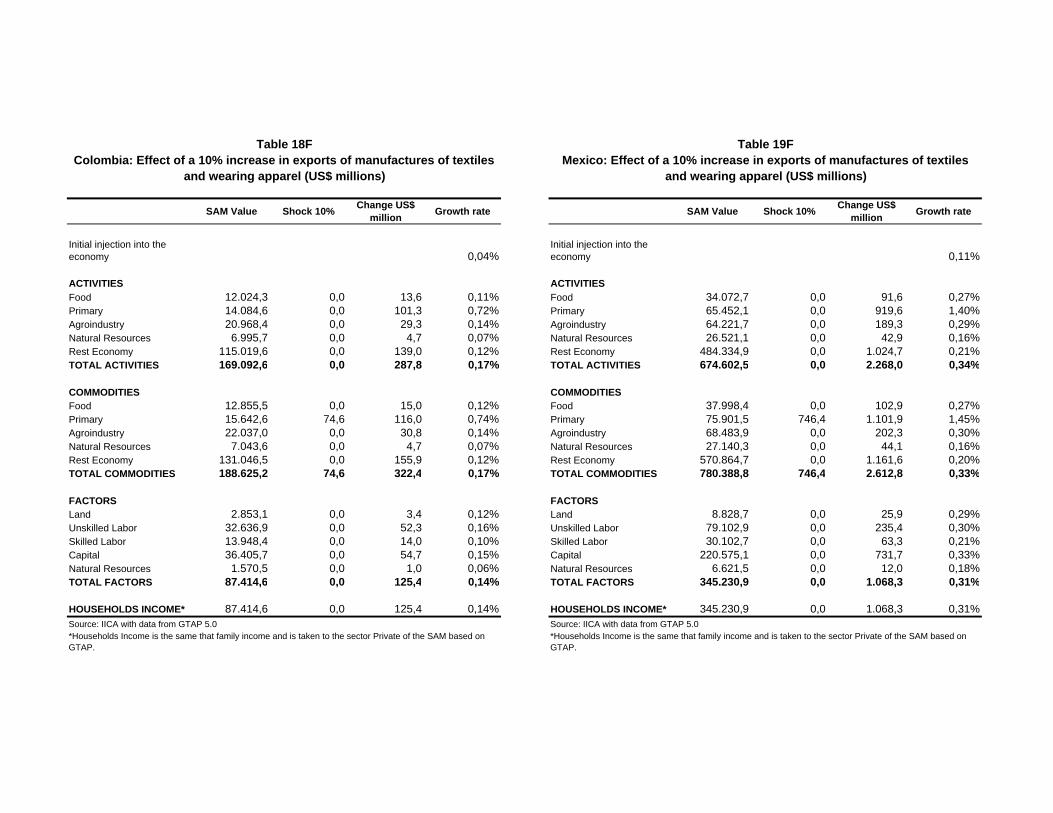
SAM Value Shock 10% Change US$ million Growth rate SAM Value Shock 10% Change US$
million Growth rate
Initial injection into the economy 0,04%
Initial injection into the economy 0,11%
ACTIVITIES ACTIVITIESFood 12.024,3 0,0 13,6 0,11% Food 34.072,7 0,0 91,6 0,27%Primary 14.084,6 0,0 101,3 0,72% Primary 65.452,1 0,0 919,6 1,40%Agroindustry 20.968,4 0,0 29,3 0,14% Agroindustry 64.221,7 0,0 189,3 0,29%Natural Resources 6.995,7 0,0 4,7 0,07% Natural Resources 26.521,1 0,0 42,9 0,16%Rest Economy 115.019,6 0,0 139,0 0,12% Rest Economy 484.334,9 0,0 1.024,7 0,21%TOTAL ACTIVITIES 169.092,6 0,0 287,8 0,17% TOTAL ACTIVITIES 674.602,5 0,0 2.268,0 0,34%
COMMODITIES COMMODITIESFood 12.855,5 0,0 15,0 0,12% Food 37.998,4 0,0 102,9 0,27%Primary 15.642,6 74,6 116,0 0,74% Primary 75.901,5 746,4 1.101,9 1,45%Agroindustry 22.037,0 0,0 30,8 0,14% Agroindustry 68.483,9 0,0 202,3 0,30%Natural Resources 7.043,6 0,0 4,7 0,07% Natural Resources 27.140,3 0,0 44,1 0,16%Rest Economy 131.046,5 0,0 155,9 0,12% Rest Economy 570.864,7 0,0 1.161,6 0,20%TOTAL COMMODITIES 188.625,2 74,6 322,4 0,17% TOTAL COMMODITIES 780.388,8 746,4 2.612,8 0,33%
FACTORS FACTORSLand 2.853,1 0,0 3,4 0,12% Land 8.828,7 0,0 25,9 0,29%Unskilled Labor 32.636,9 0,0 52,3 0,16% Unskilled Labor 79.102,9 0,0 235,4 0,30%Skilled Labor 13.948,4 0,0 14,0 0,10% Skilled Labor 30.102,7 0,0 63,3 0,21%Capital 36.405,7 0,0 54,7 0,15% Capital 220.575,1 0,0 731,7 0,33%Natural Resources 1.570,5 0,0 1,0 0,06% Natural Resources 6.621,5 0,0 12,0 0,18%TOTAL FACTORS 87.414,6 0,0 125,4 0,14% TOTAL FACTORS 345.230,9 0,0 1.068,3 0,31%
HOUSEHOLDS INCOME* 87.414,6 0,0 125,4 0,14% HOUSEHOLDS INCOME* 345.230,9 0,0 1.068,3 0,31%Source: IICA with data from GTAP 5.0 Source: IICA with data from GTAP 5.0
Table 18F Table 19F
and wearing apparel (US$ millions)
*Households Income is the same that family income and is taken to the sector Private of the SAM based on GTAP.
*Households Income is the same that family income and is taken to the sector Private of the SAM based on GTAP.
Colombia: Effect of a 10% increase in exports of manufactures of textiles Mexico: Effect of a 10% increase in exports of manufactures of textiles and wearing apparel (US$ millions)

SAM Value Shock 10% Change US$ million Growth rate SAM Value Shock 10% Change US$
million Growth rate
Initial injection into the economy 0,19%
Initial injection into the economy 0,26%
ACTIVITIES ACTIVITIESFood 2.275,2 0,0 9,2 0,40% Food 2.517,7 0,0 6,7 0,27%Primary 3.493,5 0,0 82,7 2,37% Primary 2.501,7 0,0 5,6 0,22%Agroindustry 4.470,3 0,0 22,0 0,49% Agroindustry 2.151,7 0,0 48,9 2,27%Natural Resources 265,5 0,0 0,8 0,31% - - - - -Rest Economy 20.552,5 0,0 100,9 0,49% Rest Economy 14.880,3 0,0 39,9 0,27%TOTAL ACTIVITIES 31.057,0 0,0 215,6 0,69% TOTAL ACTIVITIES 22.051,4 0,0 101,1 0,46%
COMMODITIES COMMODITIESFood 2.393,0 0,0 9,8 0,41% Food 4.022,5 0,0 11,5 0,29%Primary 4.200,7 59,1 100,1 2,38% Primary 2.841,1 0,0 6,4 0,22%Agroindustry 4.907,9 0,0 24,6 0,50% Agroindustry 3.682,1 57,3 73,5 2,00%Natural Resources 444,9 0,0 1,7 0,38% - - - - -Rest Economy 24.603,8 0,0 115,5 0,47% Rest Economy 18.358,6 0,0 58,3 0,32%TOTAL COMMODITIES 36.550,3 59,1 251,6 0,69% TOTAL COMMODITIES 28.904,3 57,3 149,6 0,52%
FACTORS FACTORSLand 553,5 0,0 4,3 0,78% Rural Labor 2.598,8 0,0 11,5 0,44%Unskilled Labor 4.588,6 0,0 29,2 0,64% Urban Labor 3.193,2 0,0 12,5 0,39%Skilled Labor 1.344,1 0,0 7,7 0,57% Capital 5.598,3 0,0 18,4 0,33%Capital 9.322,2 0,0 64,5 0,69% TOTAL FACTORS 11.390,3 0,0 42,4 0,37%Natural Resources 37,1 0,0 0,1 0,39%TOTAL FACTORS 15.845,5 0,0 105,9 0,67% DISTRIBUTION
Wage earner Household 5.856,9 0,0 23,2 0,40%HOUSEHOLDS INCOME* 15.845,5 0,0 105,9 0,67% Other Employed Household 3.242,8 0,0 11,6 0,36%Source: IICA with data from GTAP 5.0 Other Household 82,8 0,0 0,3 0,35%
Firms 2.370,1 0,0 7,2 0,31%of the SAM based on GTAP. Government 1.441,9 0,0 9,8 0,68%
Source: IICA. Based on data from the SAM of Costa Rica for 1997 (IICA)
and wearing apparel (US$ millions) of textiles and wearing apparel (US$ millions)
*Households Income is the same that family income and is taken to the sector Private
Table 20F Table 21FUruguay: Effect of a 10% increase in exports of manufactures of textiles Costa Rica: Effect of a 10% increase in exports of manufactures
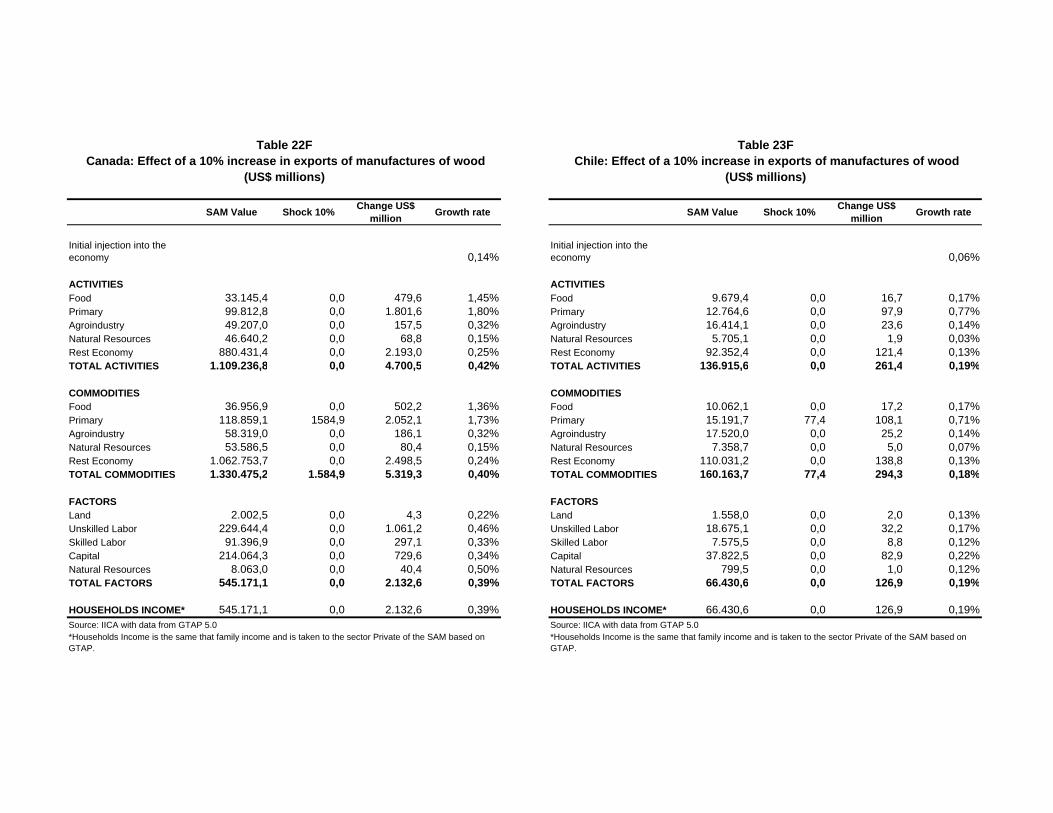
SAM Value Shock 10% Change US$ million Growth rate SAM Value Shock 10% Change US$
million Growth rate
Initial injection into the economy 0,14%
Initial injection into the economy 0,06%
ACTIVITIES ACTIVITIESFood 33.145,4 0,0 479,6 1,45% Food 9.679,4 0,0 16,7 0,17%Primary 99.812,8 0,0 1.801,6 1,80% Primary 12.764,6 0,0 97,9 0,77%Agroindustry 49.207,0 0,0 157,5 0,32% Agroindustry 16.414,1 0,0 23,6 0,14%Natural Resources 46.640,2 0,0 68,8 0,15% Natural Resources 5.705,1 0,0 1,9 0,03%Rest Economy 880.431,4 0,0 2.193,0 0,25% Rest Economy 92.352,4 0,0 121,4 0,13%TOTAL ACTIVITIES 1.109.236,8 0,0 4.700,5 0,42% TOTAL ACTIVITIES 136.915,6 0,0 261,4 0,19%
COMMODITIES COMMODITIESFood 36.956,9 0,0 502,2 1,36% Food 10.062,1 0,0 17,2 0,17%Primary 118.859,1 1584,9 2.052,1 1,73% Primary 15.191,7 77,4 108,1 0,71%Agroindustry 58.319,0 0,0 186,1 0,32% Agroindustry 17.520,0 0,0 25,2 0,14%Natural Resources 53.586,5 0,0 80,4 0,15% Natural Resources 7.358,7 0,0 5,0 0,07%Rest Economy 1.062.753,7 0,0 2.498,5 0,24% Rest Economy 110.031,2 0,0 138,8 0,13%TOTAL COMMODITIES 1.330.475,2 1.584,9 5.319,3 0,40% TOTAL COMMODITIES 160.163,7 77,4 294,3 0,18%
FACTORS FACTORSLand 2.002,5 0,0 4,3 0,22% Land 1.558,0 0,0 2,0 0,13%Unskilled Labor 229.644,4 0,0 1.061,2 0,46% Unskilled Labor 18.675,1 0,0 32,2 0,17%Skilled Labor 91.396,9 0,0 297,1 0,33% Skilled Labor 7.575,5 0,0 8,8 0,12%Capital 214.064,3 0,0 729,6 0,34% Capital 37.822,5 0,0 82,9 0,22%Natural Resources 8.063,0 0,0 40,4 0,50% Natural Resources 799,5 0,0 1,0 0,12%TOTAL FACTORS 545.171,1 0,0 2.132,6 0,39% TOTAL FACTORS 66.430,6 0,0 126,9 0,19%
HOUSEHOLDS INCOME* 545.171,1 0,0 2.132,6 0,39% HOUSEHOLDS INCOME* 66.430,6 0,0 126,9 0,19%Source: IICA with data from GTAP 5.0 Source: IICA with data from GTAP 5.0
(US$ millions) (US$ millions)
*Households Income is the same that family income and is taken to the sector Private of the SAM based on GTAP.
*Households Income is the same that family income and is taken to the sector Private of the SAM based on GTAP.
Table 22F Table 23FCanada: Effect of a 10% increase in exports of manufactures of wood Chile: Effect of a 10% increase in exports of manufactures of wood
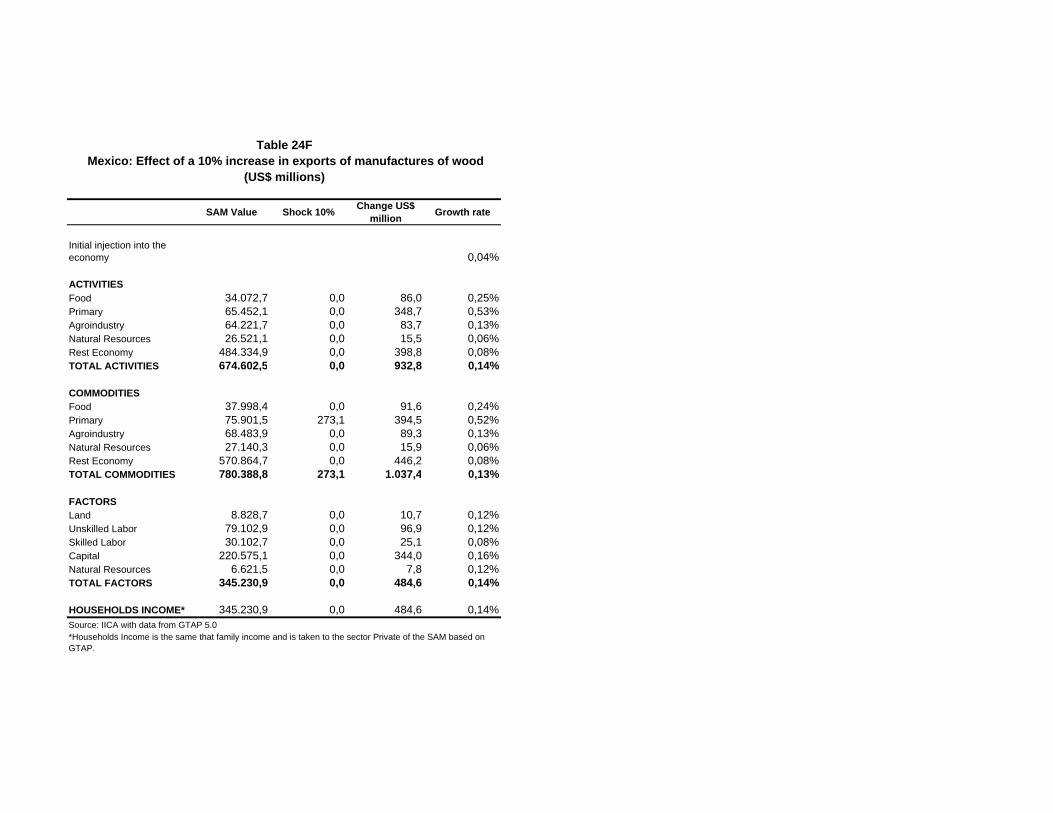
SAM Value Shock 10% Change US$ million Growth rate
Initial injection into the economy 0,04%
ACTIVITIESFood 34.072,7 0,0 86,0 0,25%Primary 65.452,1 0,0 348,7 0,53%Agroindustry 64.221,7 0,0 83,7 0,13%Natural Resources 26.521,1 0,0 15,5 0,06%Rest Economy 484.334,9 0,0 398,8 0,08%TOTAL ACTIVITIES 674.602,5 0,0 932,8 0,14%
COMMODITIESFood 37.998,4 0,0 91,6 0,24%Primary 75.901,5 273,1 394,5 0,52%Agroindustry 68.483,9 0,0 89,3 0,13%Natural Resources 27.140,3 0,0 15,9 0,06%Rest Economy 570.864,7 0,0 446,2 0,08%TOTAL COMMODITIES 780.388,8 273,1 1.037,4 0,13%
FACTORSLand 8.828,7 0,0 10,7 0,12%Unskilled Labor 79.102,9 0,0 96,9 0,12%Skilled Labor 30.102,7 0,0 25,1 0,08%Capital 220.575,1 0,0 344,0 0,16%Natural Resources 6.621,5 0,0 7,8 0,12%TOTAL FACTORS 345.230,9 0,0 484,6 0,14%
HOUSEHOLDS INCOME* 345.230,9 0,0 484,6 0,14%Source: IICA with data from GTAP 5.0
(US$ millions)
*Households Income is the same that family income and is taken to the sector Private of the SAM based on GTAP.
Table 24FMexico: Effect of a 10% increase in exports of manufactures of wood
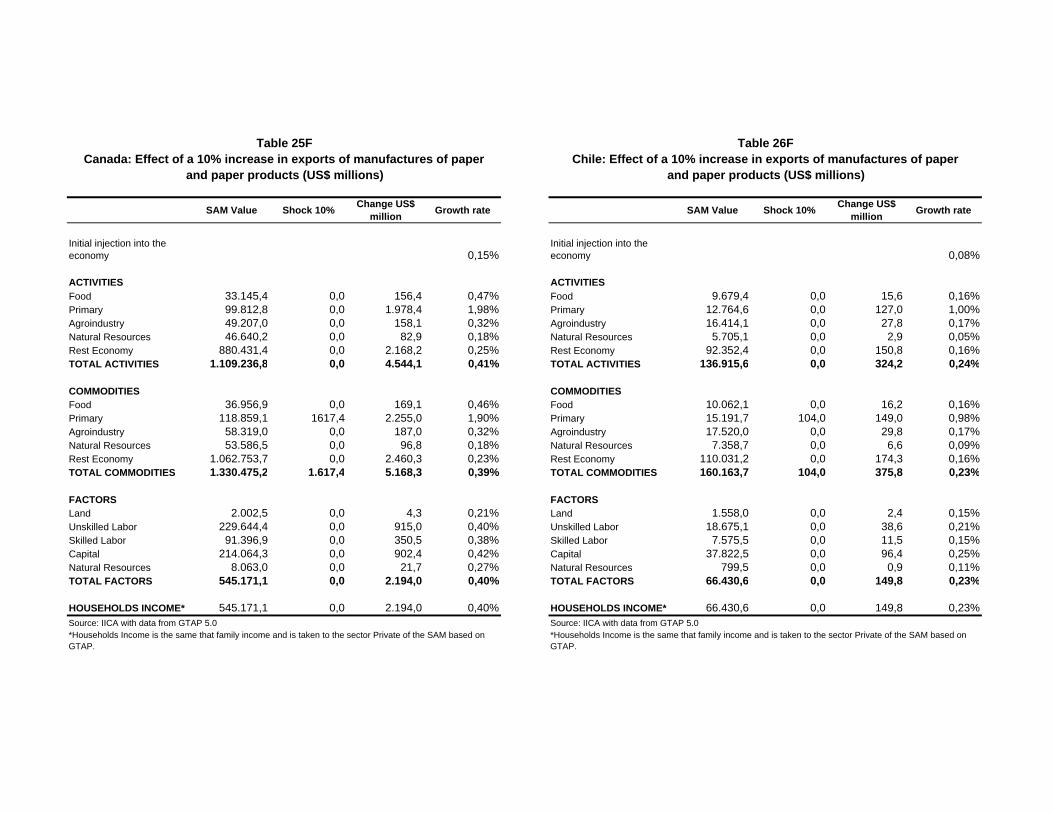
SAM Value Shock 10% Change US$ million Growth rate SAM Value Shock 10% Change US$
million Growth rate
Initial injection into the economy 0,15%
Initial injection into the economy 0,08%
ACTIVITIES ACTIVITIESFood 33.145,4 0,0 156,4 0,47% Food 9.679,4 0,0 15,6 0,16%Primary 99.812,8 0,0 1.978,4 1,98% Primary 12.764,6 0,0 127,0 1,00%Agroindustry 49.207,0 0,0 158,1 0,32% Agroindustry 16.414,1 0,0 27,8 0,17%Natural Resources 46.640,2 0,0 82,9 0,18% Natural Resources 5.705,1 0,0 2,9 0,05%Rest Economy 880.431,4 0,0 2.168,2 0,25% Rest Economy 92.352,4 0,0 150,8 0,16%TOTAL ACTIVITIES 1.109.236,8 0,0 4.544,1 0,41% TOTAL ACTIVITIES 136.915,6 0,0 324,2 0,24%
COMMODITIES COMMODITIESFood 36.956,9 0,0 169,1 0,46% Food 10.062,1 0,0 16,2 0,16%Primary 118.859,1 1617,4 2.255,0 1,90% Primary 15.191,7 104,0 149,0 0,98%Agroindustry 58.319,0 0,0 187,0 0,32% Agroindustry 17.520,0 0,0 29,8 0,17%Natural Resources 53.586,5 0,0 96,8 0,18% Natural Resources 7.358,7 0,0 6,6 0,09%Rest Economy 1.062.753,7 0,0 2.460,3 0,23% Rest Economy 110.031,2 0,0 174,3 0,16%TOTAL COMMODITIES 1.330.475,2 1.617,4 5.168,3 0,39% TOTAL COMMODITIES 160.163,7 104,0 375,8 0,23%
FACTORS FACTORSLand 2.002,5 0,0 4,3 0,21% Land 1.558,0 0,0 2,4 0,15%Unskilled Labor 229.644,4 0,0 915,0 0,40% Unskilled Labor 18.675,1 0,0 38,6 0,21%Skilled Labor 91.396,9 0,0 350,5 0,38% Skilled Labor 7.575,5 0,0 11,5 0,15%Capital 214.064,3 0,0 902,4 0,42% Capital 37.822,5 0,0 96,4 0,25%Natural Resources 8.063,0 0,0 21,7 0,27% Natural Resources 799,5 0,0 0,9 0,11%TOTAL FACTORS 545.171,1 0,0 2.194,0 0,40% TOTAL FACTORS 66.430,6 0,0 149,8 0,23%
HOUSEHOLDS INCOME* 545.171,1 0,0 2.194,0 0,40% HOUSEHOLDS INCOME* 66.430,6 0,0 149,8 0,23%Source: IICA with data from GTAP 5.0 Source: IICA with data from GTAP 5.0
and paper products (US$ millions) and paper products (US$ millions)
*Households Income is the same that family income and is taken to the sector Private of the SAM based on GTAP.
*Households Income is the same that family income and is taken to the sector Private of the SAM based on GTAP.
Table 25F Table 26FCanada: Effect of a 10% increase in exports of manufactures of paper Chile: Effect of a 10% increase in exports of manufactures of paper