more polarized but more independent: political party...
TRANSCRIPT

More polarized but more Independent: Political party identification and ideological self-
categorization among U.S. adults, college students, and late adolescents, 1970-2015
Jean M. Twenge, Nathan Honeycutt, and Radmila Prislin
San Diego State University
Ryne A. Sherman
Florida Atlantic University
Word Count: 9,454
Unedited Manuscript in press at Personality and Social Psychology Bulletin 6/17/2016
Subject to Final Copy-editing

2
Abstract
In three nationally representative surveys of U.S. residents (N = 10 million) from 1970 to 2015,
more Americans in the early 2010s (vs. previous decades) identified as Independent, including
when age effects were controlled. More in the early 2010s (vs. previous decades) expressed
polarized political views, including stronger political party affiliation or more extreme
ideological self-categorization (liberal vs. conservative) with fewer identifying as moderate. The
correlation between party affiliation and ideological views grew stronger over time. The overall
trend since the 1970s was toward more Americans identifying as Republican or conservative.
Older adults were more likely to identify as conservative and Republican. More Millennials
(born 1980-1994) identify as conservative than either GenX’ers or Boomers did at the same age,
and fewer are Democrats compared to Boomers. These trends are discussed in the context of
social identification processes and their implications for the political dynamics in the USA.
Keywords: POLITICAL VIEWS, POLITICAL PARTY AFFILIATION, IDEOLOGICAL
SELF-CATEGORIZATION, AGE, GENERATIONS

3
More polarized but more Independent: Political party identification and ideological self-
categorization among U.S. adults, college students, and late adolescents, 1970-2014
No sooner did the USA became an independent nation than it created two political parties
that fought for the “hearts and minds” of its citizenry. Although the names and ideological
profiles of the parties have changed over time, a two-party system continues to provide a basis
for the political identification of Americans. Even when modern-day Americans identify
themselves as Independents, they do so in reference to two parties: Republicans or Democrats.
Subjective identification with a political party has far-reaching consequences. It provides
a framework for understanding of and orientation in the political world (Cohen, 2003) and
shapes that world by informing political decision-making and voting behavior (Bartels, 2000).
Political identification, perhaps more than any other social category, evokes open competition for
positive distinctiveness (Tajfel & Turner, 1979), giving credence to Plato’s claim that humans
are political animals.
Because political identification is consequential, it is important to understand its
developmental trajectory and its shifts over historical time. If political identification changes
over time, does it follow a recognizable developmental pattern as people age and/or do people
move with the generational or cultural zeitgeist? If it is stable, is it equally strong over time?
Knowing answers to these questions could inform predictions about voting behavior and by
extension, socio-political climate.
Complicating projections about political outcomes is the issue of ideological self-
categorization (e.g., liberal or conservative) and its temporal (in)stability. Party affiliation is a
proxy but not a perfect indicator of ideological self-categorization. The latter stems from “beliefs
about the proper order of society and how it can be achieved” (Erikson & Tedin, 2003, p. 64). It

4
is typically classified along a single liberal (left) – conservative (right) dimension (Jost, Federico,
& Napier, 2009), depending on preferences for social change and equality versus tradition and
acceptance of inequality. Although individuals outside of political elites may not always position
themselves consistently along the liberal-conservative dimensions, their self-categorization on
this dimension is a potent predictor of their voting intentions (Jost, 2006).
In addition, models from cultural psychology suggest that cultural change may shift
political views, creating change over time in these beliefs (Markus & Kitayama, 2010).
Generational differences generally arise from cultural change (Twenge, 2014), with these
differences demonstrating the effect of the larger culture on the individual. Generational
differences in political party preferences and ideological self-categorization are currently
uncertain. Several polls (e.g., Newport, 2014) indicate that Millennials are more likely to identify
as Democrats and as liberals compared to Boomers (born 1946-1964) and Generation Xers
(GenX; 1965-1979)1. Even among Millennials who identify as Republicans, fewer describe
themselves as conservatives compared to other generations (Kiley & Dimock, 2014). However,
one-time polls cannot separate the effects of age and generation. Millennials may be more liberal
and more likely to be Democrats because they are young, and not because their generation is
more left-leaning. As the popular saying goes, “If you are not a liberal at 25, you have no heart.
If you are not a conservative at 35 you have no brain.”
Generational trends are better understood by examining generational differences in
ideological self-categorization using data collected over time, preferably with age held constant
or statistically controlled. For example, a time-lag design compares respondents of the same age
in different years, holding age constant while time period and generation vary (Schaie, 1965).
Other studies examine people of many ages across time; this type of data can be analyzed using a
5
special form of hierarchical linear modeling (HLM) known as age-period-cohort (APC) analysis
(Yang, 2008; Yang & Land, 2013). APC analysis separates the effects of age from those of
generation or cohort (defined as change that affects only the young) and time period (defined as
change that affects everyone equally; Campbell, Campbell, Siedor, & Twenge, 2015).
Time period and generational differences in political affiliation and ideological self-
categorization
Most observations about generational political tendencies in the USA rely on one-time
polls or anecdotal evidence rather than surveys taken across time. For example, generational
observers Strauss and Howe (1991) characterize GenX as more Republican-leaning,
conservative, and patriotic than the “hippie” Boomers who proceeded them. Millennials are seen
as more liberal and Democrat than GenXers (Kiley & Dimock, 2014). These perceptions suggest
that Boomers and Millennials are the more liberal and Democratic generations, whereas GenXers
are more Republican and conservative. However, to our knowledge, this claim has never been
tested using over-time data that can separate the effects of age from those of time period and
generation.
In addition to possible generational trends in affiliation with the two traditional parties,
some recent evidence also suggests that more Americans are identifying as Independents. The
previously observed trend toward party loyalties and partisanship (e.g. Bartels, 2000) could be
ending, or it was initially constricted and limited by the frame of reference when the analysis was
conducted. This appears particularly evident among Millennials (Jones, 2015; Pew Research
Center, 2015). Once again, however, these one-time polls cannot separate the effects of age,
period, and cohort, raising the possibility that young people might have always been more likely
to identify as Independents compared to older people. Alternatively, perhaps disassociating from

6
political parties and political institutions in general has increased over time (Dugan, 2015) in
concert with the established reduction of confidence in nearly all major societal institutions
(Twenge, Campbell, & Carter, 2014; Riffkin, 2014). Thus, the observed increase in the number
of Americans declaring themselves Independent in the political arena may well reflect these
broader cultural trends.
Age and Political Affiliation and ideological self-categorization
Any attempt at a projection of generations’ political trajectory must necessarily address
the role of age in political party identification and ideological self-categorization. Previous
research has yielded inconsistent findings. Some research suggests that aging has an impact on
party affiliation independent of generational factors. Using cross-sectional nation-wide surveys
from 1946-1958, Crittenden (1962) concluded that age seemed to account for a noticeable shift
toward Republicanism. Subsequent re-analysis of the same data, however, suggested that the
shift toward Republicanism was instead attributable to generation (Cutler, 1969). Further
corroborating this interpretation, a broader dataset spanning 24 years (1945-1969) determined
that aging had no effect on political ideology (Glenn & Hefner, 1972). Subsequent research
found inconclusive if not disconfirming evidence for prevailing stereotypes about a trend toward
conservatism with age (Danigelis & Cutler, 1991; Danigelis, Hardy, & Cutler, 2007; Glenn,
1974). Adding to this complexity is the possibility that the association may vary for particular
segments of the population (Saltzman, Chafetz, & Ebaugh, 1983) and with economic cycles
(Milojev, Greaves, Osborne, & Sibley, 2015).
Contemporary investigations on the role of age in party identification and ideological
self-categorization found a mix of similarities and differences between the young and old. There
is evidence that compared to the youth, older people have comparable percentages of

7
liberals/Democrats but higher percentages of conservatives/Republicans, and lower percentages
of moderates and disengaged (DeSilver, 2014; Pew Center, 2014a). Other evidence indicates that
generational imprinting is the strongest and most reliable predictor of ideological self-
categorization and party affiliation over the lifespan—at least among white voters. Using
Presidential polling surveys from 1952 to 2012, Ghitza and Gelman (2014) claim that political
events happening over a person’s lifespan inform his or her voting, with the events during
teenage and young adult years having the most impact.
Understanding age, time period, and generational differences in political affiliation and
ideological self-categorization is important because each of these factors can have a separate but
related role in shaping the political landscape of the USA. Unless these dynamics are parsed out,
it is impossible to understand current, much less future, impacts of different groups in society on
the political composition of the USA. For example, mistaking generational for age trends may
lead to an erroneous (and costly) conclusion that “young people will grow out of their current
political leanings.” Conversely, mistaking age for generational trends may lead to another
erroneous (and equally costly) conclusion that “this generation will stay with their current
political leanings.”
Time period and generational differences in political polarization
Political polarization is often defined as diverging ideology between members of the
public on specific issues (Fiorina, 2014), or as increasing separation between groups that are
clearly defined (Hill, 2005; Hill & Tausanovitch, 2015), such as political parties (e.g.,
Republicans vs. Democrats), or ideological categories (e.g., liberals vs. conservatives). Several
observers have speculated that political polarization has increased in recent decades, with
Americans abandoning moderation in favor of more extreme beliefs (e.g., Hill, 2005). For

8
example, a 2014 Pew Center poll found that Democrats have become more liberal and
Republicans more conservative, with more individuals placing themselves at the polar opposite
ends of the political spectrum than in 1994 (Pew Center, 2014b). However, this study did not
examine data before 1994, nor did it attempt to separate the effects of age, time period, and
generation on political polarization. Additionally, some authors claim that political polarization
has not increased, arguing that there are just as many moderates and more Independents in recent
years than in the past (Fiorina, 2014; Fiorina & Abrams, 2008), and thus no evidence that the
public has polarized in its policy views over time (Hill & Tausanovitch, 2015).
This seeming inconsistency may reflect lack of conceptual clarity. For example, when
conceptualized as issue partisanship or the association between issue attitudes and party
identification, polarization appears much more evident than when conceptualized as issue
alignment or the association between pairs of issues (Baldassarri & Gelman, 2008). For the
purposes of this study, we conceptualized polarization as extremity of party and ideological self-
categorization, as these variables are important in their own right. (For example, identifying as
“extremely conservative” is more polarized than identifying as simply “conservative.”) These
factors, regardless of how they may be related to policy positions, reflect movement that pushes
these groups apart. Arguably, the move apart may be integrally associated with an assertion of
uniqueness by the groups as they seek to establish and assert distinct identities.
The current study
The current study aims to provide a comprehensive overview of age, time period, and
generational (cohort) differences in political party affiliation (Democrat, Republican,
Independent) and ideological self-categorization (liberal, conservative, moderate) and the
relationship between the two. We also explore if political polarization (i.e., the extremity of

9
ideological self-categorization) has increased, examining those who identify as “strongly”
affiliated with a party or “very” or “extremely” conservative or liberal, versus those identifying
as moderate or only slightly liberal or conservative. To reach these goals, we draw from three
large, nationally representative surveys conducted over several decades. We analyze time period
and generational effects among 12th
graders in the Monitoring the Future (MtF) study covering
1976-2014 (N = 563,102), among entering college students from the American Freshman (AF)
survey covering 1970-2015 (N = 9.4 million). Both of these studies use time-lag designs with age
held constant, so any variation must be due to generation or time period. Finally, we examine
age, time period, and generational differences among adults 18 and older from the General Social
Survey (GSS) covering 1972-2014 (N = 58,542) using new HLM techniques (age/period/cohort,
or APC, models) that can separate the three effects (Yang, 2008).
METHOD
Samples
Monitoring the Future (Johnston, Bachman, O’Malley, & Schulenberg, 2015) has
surveyed a nationally representative sample of high school seniors (12th
graders) every year since
1976. The most recent year available for the purpose of this analysis was 2014 (N 1976-2014 =
563,102). High schools and the students within those schools are chosen using a random
sampling procedure to represent a cross section of the population in terms of region, gender,
race, and SES. Similar schools are replaced for those that decline to participate. Participation rate
is between 66% and 80% for schools and between 79% and 83% for students (Johnston et al.,
2014).
The American Freshman project, part of the Cooperative Institutional Research Program
(CIRP) administered by the Higher Education Research Institute (HERI), has surveyed a

10
nationwide sample of first-year students at 4-year colleges or universities every year since 1966
(e.g., Pryor, Hurtado, Saenz, Santos, & Korn, 2007), with the political questions first asked in
1970 and 2015 the most recent year available. Originally, some two-year colleges participated,
but the data – including that for past years – are now reported only for students at 4-year
institutions (N 1970-2015 = 9,407,435). Most respondents are 18 years old. Data for campuses
are included only if more than 75% of first-time full-time freshman students participated. The
survey weights its results to be demographically representative of all first-year students at 4-year
institutions in the USA; this population is more female, more white, and higher in SES than the
population of those who do not attend college. We obtained the aggregated data from HERI’s
publicly available research reports.
The General Social Survey (GSS) is a nationally representative sample of USA adults
over 18 years old, collected in most years between 1972 and 2014 (N = 58,893; for the questions
in the current survey, N ranges from 49,789 to 58,542). The GSS data and codebooks are
available online (see Smith, Marsden, Hout, & Kim, 2015). As recommended by the survey
administrators, we excluded the Black oversamples from 1982 and 1987 and weighted by the
variable WTSSALL, which makes the sample representative of individuals instead of households
and corrects for other sampling biases (Smith et al., 2013). However, differences between
weighted and unweighted analyses were minor.
Measures
12th
graders (Monitoring the Future)
MtF included two questions on political party affiliation and ideological self-
categorization asked of all participants in each year. The first was: “How would you describe
your political preference?” Response choices were 1 = “Strongly Republican,” 2 = “Mildly

11
Republican,” 3 = “Mildly Democrat,” 4 = “Strongly Democrat,” 5 = “American Independent
Party,” 6 = “No preference, independent,” 7 = “Other,” and 8 = “Don’t know, haven’t decided.”
In 1996, “American Independent Party” was changed to “Independent” and “no
preference, independent” was changed to “no preference.” We recoded party affiliation so
Republican corresponds to higher numbers, with 1 = Strongly Democrat, 2 = Mildly Democrat, 3
= Mildly Republican, and 4 = Strongly Republican. Given the wording change, for the initial
analyses of party affiliation we excluded “American Independent Party,” “Independent,” “no
preference, independent,” “no preference,” “other” and “don’t know” responses. In secondary
analyses, we examined “Independent” and “no preference” responses after 1996 when the
wording became consistent, still excluding “other” and “don't know” responses.
The second item assessing ideological self-categorization was: “How would you describe
your political beliefs?” Response choices were 1 = “Very conservative,” 2 = “Conservative,” 3 =
“Moderate,” 4 = “Liberal,” 5 = “Very liberal,” 6 = “Radical,” 8 = and “None of the above, or
don’t know.” We recoded ideological self-categorization so conservative corresponds to higher
numbers, with 1 = Radical, 2 = Very liberal, 3 = liberal, 4 = Moderate, 5 = Conservative, and 6 =
Very Conservative. We excluded “None of the above, or don’t know” from the primary analyses.
To examine political polarization, we recoded the variables to reflect the percentage of
respondents who answered in the extreme categories. For party affiliation, that included those
responding “Strongly Democrat” and “Strongly Republican” (coded 1) versus those choosing
“Mildly Democrat” or “Mildly Republican” (coded 0). For ideological self-categorization, this
included those responding “Radical,” “Very liberal,” or “Very conservative” (coded 1) with
conservative, liberal, and moderate coded 0.
Entering college students (American Freshman)

12
Starting in 1970 and every year through 2015, the survey asked, “How would you
characterize your political views?” with response choices of “far left,” “liberal,” “middle of the
road,” “conservative,” and “far right.” We combined “far left” and “liberal” into a single liberal
category, and “far right” and “conservative” into a single conservative category. We also
combined “far left” and “far right” into an “extreme views” category. The survey did not include
a question on party affiliation.
Adults (General Social Survey)
For party affiliation, the GSS asked since 1972, “Generally speaking, do you usually
think of yourself as a Republican, Democrat, Independent, or what?” with response choices of 0
= strong Democrat; 1 = not strong Democrat; 2 = independent, near Democrat; 3 = independent;
4 = independent, near Republican; 5 = not strong Republican; 6 = strong Republican; 7 = Other
party; 8 = don’t know. For the primary analyses, we excluded “other party” and “don’t know”
responses. We recoded the 0-6 scale to a 1-7 scale.
For ideological self-categorization, the GSS asked beginning in 1974, “We hear a lot of
talk these days about liberals and conservatives. I'm going to show you a seven-point scale on
which the political views that people might hold are arranged from extremely liberal (point 1) to
extremely conservative (point 7). Where would you place yourself on this scale?” with choices
of 1 = extremely liberal, 2 = liberal, 3 = slightly liberal, 4 = moderate, 5 = slightly conservative,
6 = conservative, 7 = extremely conservative, and 8 = don’t know. We excluded “don’t know”
responses. Political polarization was coded as in the other datasets, with “Strong Democrat” and
“Strong Republican” combined and “Extremely liberal” and “Extremely conservative”
combined.
Procedure

13
Data collected over time can be analyzed in many ways, including grouping by 20-year
generation blocks, by decades, or by individual year. As a compromise between specificity and
breadth, we separated the data into 5-year intervals in the tables. We report the effect sizes (d)
comparing the earliest and latest year blocks and the maximum d using the lowest and highest
numbers. We also include figures with all of the year-by-year data for most variables. We
present some results by generation for the 12th
grade and entering college student samples.
We report both continuous variables (e.g., the 1-7 scale for liberal to conservative in the
GSS) and dichotomous variables (e.g., the percentage who identify as Republicans). Given the
very large ns, we focus on effect sizes rather than statistical significance testing. With the large
sample sizes included here, virtually all ds with absolute values of .03 or larger were statistically
significant at p < .05 (and ds of .01 or larger in AF).
For the APC models, we estimated random coefficient models allowing intercepts to vary
across time periods (years) and generations (cohorts). Thus, an intercept (mean political
affiliation) score is calculated (using empirical Bayes estimation to correct for unreliability) for
each survey year and cohort. These intercepts represent the effects of time period and cohort
after controlling for each other and both linear and quadratic effects of age. This model has three
variance components: One for variability in cohort effects (τu0), one for variability in period
effects (τv0), and a residual term containing unmodeled variance within cohorts and periods. We
used 10-year intervals for cohorts as they provided reliable cohort effect estimates at a much less
cost to specificity than it would have been the case with 20 year cohorts. Variance in time period
and cohort effects indicates meaningful period and cohort differences respectively (Yang &
Land, 2013). Thus, the technique allows for the statistical separation of the effects of
generation/cohort, time period, and age. Age and age-squared were entered as fixed effects

14
predictors. Weighting could not be used for the mixed-effects analyses because proper
probability weighting for variance component estimation requires taking into account pairwise
selection probabilities, which is not possible in current statistical software (i.e., R).
RESULTS
Political party affiliation and ideological self-categorization
As 12th
graders, Millennials in the 2000s and early 2010s were slightly more likely to
identify as Republican and conservative than Boomers were at the same age in the 1970s; a
similar pattern appeared among entering college students and adults (see Tables 1-3 and Figures
1-4). Over the entire time period, Americans in the late 1970s favored Democrats the most of any
era, followed by the early Obama years in the late 2000s. On the other hand, the Reagan era of
the 1980s saw the largest percentage of Republicans. Comparing generation groups, 52% of
Millennials were Democrats, compared to 60% of Boomers and 49% of GenXers. Thus
Millennials were less likely to be Democrats than Boomers (d = -.15) but more likely than
GenXers (d = .07). The percentage of 12th
graders identifying as Republican increased after
2008, rising from 42% in 2008 to 51% in 2012 and 49% in 2014 (see Figure 1; this includes only
those identifying as either Democrat or Republican). Adults’ political party affiliation follows a
similar pattern over time as 12th
graders, with Democrats in the clear majority in the 1970s and
Republicans winning out in the 1980s (see Figure 5A).
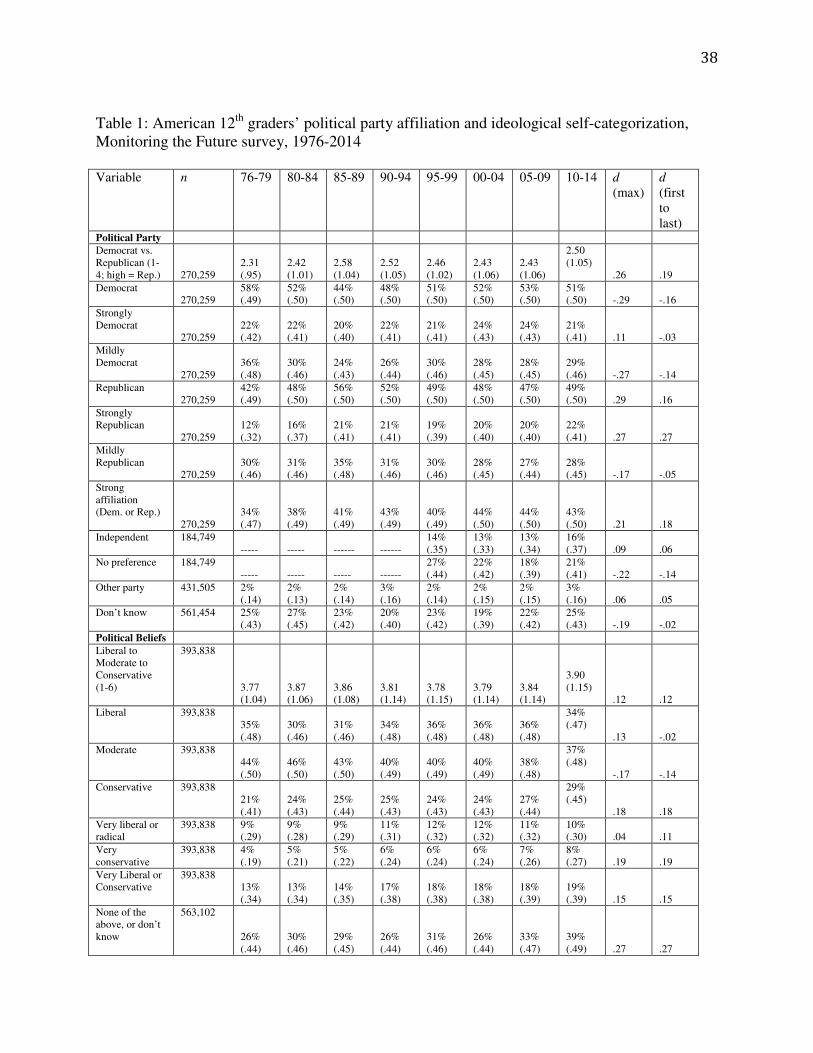
Between 2002 and 2014, 12th
graders’ ideological self-categorization also became more
conservative, d = .16 (see Figure 3). In 2002, 23% identified as conservative, which rose to 28%
in 2014. Among entering college students, only 15% identified as conservative or far right in
1971, which rose to 26% in 2006, declining to 22% in 2015. The largest change was a substantial
conservative shift between the early 1970s and the early 1980s (see Figure 4). Nevertheless,

15
more 12th
graders, and just as many college students, identified as conservative in the early 2010s
as did in the early 1980s, a time often characterized as conservative.
By generation groups, 20% of Boomers, 25% of GenXers, and 27% of Millennials
identified as conservative as 12th
graders. As entering college students, 17% of Boomers, 22% of
GenXers, and 23% of Millennials identified as far right or conservative. Thus, Millennials were
more conservative than both Boomers (d = .14 for 12th
graders; d = .15 for college students) and
GenXers (d = .04; d = .03). Among adults, the number identifying as liberal declined slightly
between the 1970s and the 2010s, and the number identifying as conservative rose slightly (see
Table 3).
The APC model for political party on the GSS adults showed relatively weak effects of
age and age-squared (b = .002, .0001; t = 1.55, 3.73 respectively). However, there was
substantial variance in intercepts for both time period (SD = .16 [.11, .20]) and cohort (SD = .13
[.07, .20]). Examining party as a continuous variable (with positive numbers = Republican and
negative = Democrat), the largest time period shift appeared between 1972 (Z = -.15) and 1990
(Z = .10), with Republicans gaining d = .25 (see Figure 5A). Between 1990 and 2012 (Z = -.07),
the trend reversed toward more Democrats, d = -.17.
The cohort born in the 1920s had the most Democrats (Z = -.12), whereas GenXers born
in the 1960s had the most Republicans (Z = .07), d = .19 (see Figure 5B). Millennials born in the
1980s (Z = -.04) were more likely to identify as Democrats than GenXers born in the 1960s, d = -
.11. Two-decade averages approximating the generations reveal a similar pattern: Silent
generation (1920s-1930s, Z = -.09), Boomers (1940s-1950s, Z = -.02), GenX (1960s-1970s Z =
.05), and Millennials (1980s-1990s, Z = -.03). Thus, Millennials do not appear to be unusually

16
Democratic, falling near the average across all generations when age and time period are
controlled.
The largest change over time in adults’ political affiliation is the increase in
Independents. Only 30% of adults identified as Independents in 1989, compared to 46% in 2014,
an all-time high (see Figure 2). The logistic APC model predicting Independent party
identification showed sizeable effects of age (odds ratio = 0.98, Z = -18.40) and age-squared
(odds ratio = 1.0001, Z = 4.18) indicating that younger people – controlling for time period and
cohort – are more likely to identify as independent (49% at age 18, 40% at age 32, 30% at age
55, and 22% at age 89). Additionally, although there was variation in intercepts due to both time
period (SD = .19 [.14, .24]) and cohort (SD = .08 [.03, .11]), most of the variation was due to
time period. In terms of time period effects, only 26% of adults were Independents in 1972, but
their numbers rose to 44% in 2014, also an all-time high. Cohort/generation explains very little
variance in the increase in Independents, with Silents born 1920s-1930s (34%), Boomers born
1940s-1950s (36%), GenX 1960s-1970s (33%), and Millennials 1980s-1990s (33%).
Given the constraints in the data set, we were only able to examine 12th
graders
identifying themselves as “Independent” or expressing “No preference” since 1996. 12th
graders
identifying as Independents rose from 11% to 18% between 2005 and 2014 (see Figure 6).
The APC model predicting ideological self-categorization showed large effects of age (b
= .01, t = 16.22) and age-squared (b = -.001, t = -6.19), indicating that – controlling for time
period and cohort – older people are more politically conservative on average (see Figure 7).
Specifically, Americans, on average, identified as more politically liberal (Z = -.24) at age 18,
increasingly more conservative from their 20s to their 60s (Z20 = -.22; Z30 = -.10; Z40 = -.01; Z50 =
.07; Z60 = .12; Z70 = .16), and largely stabilized after 70 (Z80 = .17; Z89 = .17). There was some
17
rather minimal variation in intercepts due to both time period (SD = .05 [.03, .07]) and cohort
(SD = .05 [.02, .08]). Time period effects for ideological self-categorization (conservative =
higher) shifted the most between 1975 (Z = -.02) and 1996 (Z = .09), d = .11, becoming more
liberal again in 2012 (Z = .00) and 2014 (Z = .01). Generational effects were also small, with
those born in the 1950s the most liberal (Z = -.01) and those born in the 1960s the most
conservative (Z = .09). Millennials born in the 1980s were close to the average (Z = .02) and
those born in the 1990s slightly more conservative (Z = .06). Two-decade averages
approximating the generations reveal a similar pattern: Silent (1920s-1930s, Z = .06), Boomers
(1940s-1950s, Z = -.01), GenX (1960s-1970s Z = .06), and Millennials (1980s-1990s, Z = .04).
This suggests a generational shift from liberal to conservative between Boomers born in the
1950s and GenXers born in the 1960s, a move back toward liberalism for those born in the 1970s
and 1980s, and a slight return to conservatism for those born in the 1990s.
Political polarization
Millennial 12th
graders and entering college students in the early 2010s were more
politically polarized than Boomers and GenX’ers were at the same age (see Tables 1 and 2 and
Figures 8-9). More 12th
graders in the 2010s identified as strong Democrats or strong
Republicans than in earlier decades. Fewer expressed no preference for a political party,
declining from 29% in 1998 to 23% in 2014 (see Figure 2). In addition, fewer 12th
graders and
entering college students identified as moderates in the 2010s compared to the late 1970s and
1980s (see Figures 3-4) and more identified as radical, very liberal, or very conservative (see
Tables 1-2 and Figure 9). By generation groups, 50% of college student Boomers identified as
middle-of-the-road, compared to 53% of GenX’ers and 47% of Millennials.
18
The same was true for adults, with twice as many identifying as “extremely” liberal or
conservative between the 1970s and the 2010s, and slightly fewer identifying as moderate or
only “slightly” liberal or conservative (see Table 3 and Figure 8). Although the number of
moderates among adults has not changed, those identifying as only slightly liberal or
conservative has decreased, suggesting a move away from the center similar to that found among
12th
graders. In the APC analyses, moderates (combining slightly liberal, slightly conservative,
and moderate) decreased from 73% in 1978 to 65% in 2010 (it then rose slightly to 67% in
2014).
For the most part, this polarization was primarily driven by those on the right
(Republicans and conservatives), even though those on the left (Democrats and liberals) still
have a greater proportion identifying in the extreme than those on the right. More 12th
graders
and college students in recent years (vs. previous eras) identified as strongly Republican, very
conservative, or far right, while the percentage identifying as strongly Democrat, very liberal, or
far left has stayed about the same, decreased, or increased at a slower pace compared to those on
the right. More adults identify as strongly Republican, but fewer as strongly Democratic.
However, identifying as extremely liberal or extremely conservative has increased at about the
same rate among adults. Thus, overall, the increase in political polarization is mostly due to more
Americans identifying as strongly Republican or very conservative.
We examined this another way in the 12th
grade sample by calculating the mean strength
of party affiliation or identification within groups. These analyses show similar results, with
greater polarization primarily driven by those on the right (see Table 4). That is, Republicans
have become more likely to identify as strongly Republican, and conservatives as very
conservative, while Democrats’ and liberals’ affiliation strength has remained about the same.

19
The logistic APC model predicting party extremity showed substantial linear (odds ratio
= 1.026, Z = 24.87) and quadratic (odds ratio = 0.9997, Z = -7.88) effects such that older people,
compared to younger people, were more likely to identify as “strong” in their affiliation as a
Democrat or Republican (see Figure 10A). On average, and controlling for time period and
cohort effects, Americans were least likely to endorse any “strong” affiliation at age 18 (13%),
but were increasingly more likely to endorse a “strong” affiliation as they aged (Age20 = 14%;
Age30 = 19%; Age40 = 24%; Age50 = 30%; Age60 = 34%; Z70 = 37%; Z80 = 40%; Z89 = 40%).
Although there was some variation in intercepts due to time period (SD = .12 [.09, .16]) and
cohort (SD = .08 [.00, .10]), a visual inspection of these effects indicated no clear pattern,
suggesting that this variation is due inconsistent fluctuations (see supplemental R code). The
logistic APC model predicting political view extremity showed only a weak linear trend (odds
ratio = 1.014, Z = 2.94) with no curvilinear effect (odds ratio = 1.00, Z = -0.52), such that older
people, compared to younger people, were slightly more likely to identify as “extreme” in their
ideological self-categorization (see Figure 10B). On average, Americans were least likely to
identify as either “extremely liberal” or “extremely conservative” at age 18 (3.9%), but were
increasingly more likely to endorse extreme views as they aged (Age20 = 4.0%; Age30 = 4.6%;
Age40 = 5.3%; Age50 = 6.0%; Age60 = 6.8%; Z70 = 7.6%; Z80 = 8.4%; Z89 = 9.2%). There was
also variation in intercepts due to time period (SD = .12 [.04, .18]) and cohort (SD = .25 [.08,
.37]). There was a general increase in extreme views by cohort, with the fewest with extreme
views in the 1900s-born cohort and the most in the 1980s-born (Millennial) cohort. The time
period variation was weaker and showed little discernable pattern of change.
Finally, we examined ideological polarization between the parties, examining the
correlations between political party affiliation (Democrats and Republicans only) and ideological

20
self-identification as liberal vs. conservative over time. The goal was to establish whether the
relationship between party and ideology changed over time with Democrats more likely to be
liberal and Republicans more likely to be conservative. We found that they were, with the
correlation between party and ideology highly positively related to year of data collection, r(27)
= .95, p < .001 for adults, and r(38) = .96, p < .001 for 12th
graders (see Figure 11). In other
words, the tie between political party and ideology became tighter in more recent years.
DISCUSSION
In three nationally representative samples, more Americans in the 2010s (vs. previous
decades) identify as Independents and more, especially on the right, express polarized
ideological self-categorization (e.g., identifying as “very” or “extremely” conservative). In
addition, the tie between ideological identification and political party has grown steadily
stronger. Thus more Americans view themselves at political extremes, but more are
disassociating from the two major political parties and are striking out as Independents.
These two trends are only seemingly contradictory. Although our data cannot speak to the
possible reasons, it is plausible that the observed increase in the percentage of Independents
could reflect a growing dissatisfaction with the entrenchment of the two major U.S. parties
(Jones, 2015). This conjecture is supported by the findings that Independents can be quite
partisan in their judgments (Hawkins & Nosek, 2012), and that Independents tend to vote
consistently for one party (Newport, 2014; Pew Research Center, 2015). This suggests that the
Independent identification does not reflect real ideological self-categorization. Rather, it is more
a reluctance to declare affiliation with a major party than a genuine independence, which would
be evident in more cross-party voting. While it has been argued that “conventional wisdom

21
regarding the ‘decline of parties’ is both exaggerated and outdated” (Bartels, 2000, p. 35), it
appears that trend toward self-identifying as Independent has become more robust.
The APC analyses revealed that time period differences in party identification were
curvilinear, with more Americans identifying as Democrats in the 1970s, the tide shifting toward
Republicans in the 1980s and 1990s, and Democrats winning out again in the late 2000s and
early 2010s. Generational differences showed that G.I.s and Silents included the most
Democrats, followed by Boomers and Millennials; GenX had the most Republicans. However,
Millennial 12th
graders and college students were more conservative and more likely to identify
as Republican than Boomers were in the 1970s and were slightly more conservative than
GenX’ers overall. The number of 12th
graders identifying as conservative increased between
2000 and 2014, and Millennials in the 2010s were similar to GenXers in the 1990s in their party
identification. Millennial 12th
graders were more likely to identify as Democrats during a brief
period around Obama’s first election to the Presidency, but during the 2010s returned to a more
even split between those identifying as Democrats vs. Republicans. If Millennials become more
Republican and conservative as they age as previous generations have done, they will not be the
highly Democratic and liberal generation many had anticipated. Although the effect sizes here
are small by most standards (e.g., Cohen, 1988), they are large enough to determine the
outcomes of closely contested presidential elections (e.g. Kennedy vs. Nixon, Bush v. Gore). For
example, a change from 49% to 50% is only d = .02, but Bush v. Gore was settled by a margin
considerably smaller than 1%.
As for political polarization, Millennials were more politically polarized than Boomers
and GenX’ers were at the same age, likely due to a time period effect. We also found that people
become more politically polarized as they age. Given this, Millennials could go on to be an

22
extremely politically polarized generation as they grow into mature adulthood, as they are
beginning adulthood already more polarized.
The APC models further showed that older people are more conservative and Republican
than younger people, even after the effects of generation and time period are accounted for. The
present research fails to confirm previous assertions that generational imprinting completely
explains the age differences in ideological self-categorization (Ghitza & Gelman, 2014).
Whereas generational imprinting could be a factor at play (though the present research doesn’t
directly investigate generational imprinting) the present findings independently demonstrate a
positive relationship between age and conservatism and Republicanism. Our analyses do lend
support for the adage about liberalism of the young and conservativism of the mature. This
conclusion is quite novel, and is inconsistent with research over the past four decades that has
vehemently claimed no association between age and conservatism (e.g., Danigelis et al., 2007).
This inconsistency may arise from assessment differences, as past research predominantly
assessed changes over time on specific issues (e.g., “support for civil liberties”), as opposed to
actual changes over time in ideological self-categorization. A critical feature of past methods
may be an erroneous assumption of strong correlations between ideological self-categorization
and positions on specific issues, thereby resulting in conclusions that might not actually address
the initial inquiry into the association between age and conservatism. Overall, the conclusion that
older age leads to more conservatism is consistent with research showing that Big Five openness
(which is connected to political liberalism) declines at older ages (Roberts et al., 2006).
Some may find it surprising that more 12th
graders, college students, and adults now
identify as conservative, given the increasing acceptance of liberal views around issues such as
same-sex marriage, tolerance for religious nonbelievers, and gender equality (e.g., Donnelly et
23
al., 2016; McCarthy, 2015; Twenge, Carter, & Campbell, 2015). This is only a seeming
contradiction, predicated on the assumption of a strong association between political self-
categorization and ideological self-categorization on specific (ideological) issues. This
assumption, however, has received little empirical support as only a few and shrinking number of
issues clearly delineate conservative from liberal orientation (Baldassarri & Bearman, 2007).
These issues (e.g., legalized abortion) are emphasized in pundits’ and political candidates’
debates likely because any venture to the outside territory may be counterproductive, revealing
that their targeted constituents share some significant views with their opponents. This point is
best illustrated by absence of correlation between ideological self-categorization (conservative
vs. liberal) and views on tolerance and equality (Brandt, Reyna, Chambers, Crawford, &
Wetherell, 2014; Wetherell, Brandt, & Reyna, 2013). It is possible that some issues that used to
be ideological have ceased to be so, or at least lost their ideological fervor, as illustrated by
increasing support for same-sex marriage among Republicans (McCarthy, 2015). The dynamic
nature of ideological attitudes suggests that although more high school seniors, college students,
and adults may have identified as conservative in 2014 than in 1970, they are not necessarily
subscribing to the same brand of conservatism present in 1970. Finally, it is worth mentioning
that the unidimensional scale of assessment used in these surveys may not have fully captured
the complexities of ideological attitudes (Weber & Federico, 2013). Hence identical scores may
reflect different underlying processes, including distinctly different underlying moral profiles
(Federico, Weber, Ergun & Hunt, 2013).
Further underlying the dynamic nature of our findings is the possibility that they may
reflect conformity to group norms as posited by social identity theory (Tajfel & Turner, 1979)
and self-categorization theory (Turner, 1985). Liberals and conservatives may have been

24
conforming to what they perceive to be the normative position of their group. In this process, the
conditions under which individuals have conformed to this norm has been a function of the
frame of reference (Turner, 1985), informed by their group membership as they seek to enhance
the status of the group to boost their own self-esteem (Tajfel & Turner, 1979). Polarized political
elites dominating the frame of reference aid and abet polarization of the populace. In tandem,
individuals then use elites as a reference and role-model for “party line” positions to adopt and
defend, given their initial ideological self-categorization as liberal or conservative (Zaller, 1992).
This then contributes to a new norm for each group that is more extreme than the former norm
(Hogg, Turner, & Davidson, 1990) as conservatives and liberals, Democrats and Republicans
seek to maximize differences between themselves. Consequently, following the precedent set by
political elites and seeking to maximize differences between each other will produce a trend of
increasing extremity in party identification and ideological self-categorization. This is evident by
the decline in individuals identifying as moderate, combined with an increase in individuals
identifying in the extremes of their group (i.e., very liberal/conservative; strongly
Democrat/Republican), a trend indicative of the social categorization theory processes essentially
being stuck on repeat.
Much past work purporting to demonstrate the presence of political polarization (e.g.,
Abramowitz & Saunders, 2008), has come under criticism, primarily because of the data from
which conclusions about political polarization were drawn. While, for instance, election returns,
vote reports, or even approval ratings may be significant political variables to analyze, they are
not sufficient sources of evidence for or against polarization (Fiorina, Abrams, & Pope, 2008).
Unlike past investigations of political polarization, the present study does not rely on these forms
of data, and instead tracks reported degrees of party affiliation and ideological self-categorization

25
over time in nationally representative samples. Importantly, however, our findings about
polarization of ideological self-categorization do not map onto the recent finding that divergence
in public ideology, measured as dispersion of views on ideological policy issues, has hardly
changed between 1956 and 2012 (Hill & Tausanovitch, 2015). How do we reconcile polarized
ideological self-categorization with the status quo in divergence of positions on ideological
policy issues? Should not the former derive from or at least reflect the latter? It could be argued
that rather than following the laws of formal logic, ideological self-categorization subscribes to
psycho-logic whereby consistently small differences between social categories trigger a race
toward their respective extremes. This may reflect “narcissism of small differences” (Blok,
1998). Narcissism of small (or minor) differences reflects a tendency for minor differences
between people who are otherwise highly similar to form the basis of hostility and conflict
between them (Blok, 1998). As noted by Bourdieu (1984, p. 481), “social identity lies in
difference, and difference is asserted against what is closest, which represents the greatest
threat.” Liberals and conservatives, Democrats and Republicans are not moving further apart on
particular issues, and in many instances they actually have great overlap and many shared views.
It may be the case that they are not aware of this overlap and instead use symbolic issues and
emphasize symbolic differences to shape their identity, and in turn these small and
overemphasized differences form the basis for more conflictual rather than conciliatory
relationships.
This process could be reinforced by selective attention to those few issues on which
social categories do differ and continue to widen their differences (e.g., abortion, Baldassarri &
Bearman, 2007). Public myopia for the lack of polarization on most issues and selective focus on
the polarizing issues is likely helped by the genuinely polarized political elites (Theriault, 2006)

26
who are hard at work limiting public discourse to the latter. Importantly, actual polarization on
the select few partisan issues is associated with an exaggeration of polarization on other issues,
which, in turn, is associated with greater political activism (Westfall et al., 2015). Because
voting, working toward getting “the right candidates” elected and other forms of political
activism shape political reality, it matters little that these very real outcomes may originate from
not-so-real polarization on the vast majority of political issues. What matters is the select few
polarized issues that feed polarized ideological self-categorization, as we suspect is the case.
The present research demonstrates a growing ideological self-categorization
entrenchment in Americans identifying as very or extremely liberal or conservative. Further, the
present findings demonstrate that over time, age cohorts move toward holding stronger party
identification and more extreme ideological self-categorization. Combine this with past research
demonstrating how people perceive Republican to be the exact opposite of Democrat, and liberal
to be the exact opposite of conservative (Heit & Nicholson, 2010), it becomes apparent that
governance may continue to become more difficult due to party polarization, though not
necessarily because of issue polarization. While only a few individual issues may currently be
highly polarized (e.g., abortion, illegal immigration), because of party polarization just about any
issue could become partisan if it serves a party purpose (e.g., appointment and confirmation of
judges). As the present research shows, the general population is also growing more extreme.
Even though political elites may be contributing to polarization of the American public (Zaller,
1992), given that political elites have already been polarized for some time (Theriault, 2006), the
growing polarization of the American public may in turn also drive political elite polarization to
even greater heights, further inhibiting efficient governance.

27
While political polarization may yield some benefits, such as easily identifiable parties
characterized by highly divergent policy platforms from which citizens can choose (Lavine, Jost,
& Lodge, 2015) or assurance that controversial issues will be thoroughly scrutinized by
individuals having opposing motivated preconceptions (Zaller, 1992), increased political
polarization has several downsides. Political polarization underlies significant repercussions for
interest representation, political integration, and social stability (Baldassarri and Gelman, 2008).
Further, individuals who hold extreme positions perceive greater polarization than those holding
less extreme positions (Van Boven, et al., 2012). In the process of “naïve realism,” these
individuals perceive polarization not necessarily because they believe their own attitudes are
extreme, but because they perceive the out-group to be more biased and self-interested than
themselves. Thus, as ideological self-categorization and political party identification become
increasingly polarized, we should expect to see more in-group vs. out-group information
processing and the resultant conflict. Whereas society as a whole may indeed see an increase in
tolerance, party and ideological dynamics are likely to grow in antagonism. Given growing
dissatisfaction with elected representatives (Dugan, 2015), political parties may be digging their
own graves by continuing to push polarization.
If more people continue to identify with the extremes of their wings—very liberal, very
conservative—the observed political stalemate and dysfunction will become even more
pronounced. Correspondingly, it could be expected that the professed value of tolerance for out-
group views will diminish. Regardless of likely negative implications of political polarization,
though, there may be some hope in a silver lining contingent upon the mobilization of
Independents. Whereas polarization may continue to intensify, it may intensify among smaller
and smaller groups. This may be especially obvious given the growth of individuals who now

28
identify as Independent and the shrinking numbers of those identifying as Republican or
Democrat. If Independents as a new “silent majority” become more vocal, they may change the
frustratingly confrontational and paralyzing dynamics created by the polarized political parties.
In recent general elections we have already been seeing this to an extent, as candidates from both
major parties engage in a “race to the middle” seeking to brand themselves as more moderate
than they were in the primary in order to appeal to this “silent majority.” Independents may have
a critical and unique opportunity to deescalate party polarization should they seek to take
advantage of their growing numbers.
29
References
Abramowitz, A. I., & Saunders, K. L. (2008). Is polarization a myth? The Journal of Politics,
70(2), 542–555.
Baldassarri, D., & Bearman, P. (2007). Dynamics of political polarization. American
Sociological Review, 72, 784-811.
Baldassarri, D., & Gelman, A. (2008). Partisans without constraint: Political polarization and
trends in American public opinion. American Journal of Sociology, 114, 408–446.
Bartels, L. M. (2000). Partisanship and voting behavior, 1952-1996. American Journal of
Political Science, 35–50.
Blok, A. (1998). The narcissism of minor differences. European Journal of Social Theory, 1, 33–
56. http://doi.org/10.1177/136843198001001004
Bourdieu, P. (1984). Distinction: A social critique of the judgement of taste. Harvard University
Press.
Brandt, M. J., Reyna, C., Chambers, J. R., Crawford, J. T., & Wetherell, G. (2014). The
ideological-conflict hypothesis intolerance among both liberals and conservatives.
Current Directions in Psychological Science, 23(1), 27–34.
Campbell, W. K., Campbell, S. M., Siedor, L., & Twenge, J. M. (2015). Generational differences
are real and useful. Industrial and Organizational Psychology: Perspectives on Science
and Practice, 8, 324-331.
Chambers, J. R., & Melnyk, D. (2006). Why do I hate thee? Conflict misperceptions and
intergroup mistrust. Personality and Social Psychology Bulletin, 32, 1295-1311.
Cohen, G. (2003). Party over policy: The dominating impact of group influence on political
beliefs. Journal of Personality and Social Psychology, 85, 808-822.

30
Cohen, J. (1988). Statistical power analysis for the behavioral sciences. (2nd
Ed). Hillsdale, NJ:
Lawrence Erlbaum.
Crittenden, J. (1962). Aging and party affiliation. Public Opinion Quarterly, 26, 648–657.
Cutler, N. E. (1969). Generation, maturation, and party affiliation: A cohort analysis. Public
Opinion Quarterly, 33, 583–588.
Danigelis, N. L., & Cutler, S. J. (1991). Cohort trends in attitudes about law and order: Who’s
leading the conservative wave? The Public Opinion Quarterly, 55(1), 24–49.
Danigelis, N. L., Hardy, M., & Cutler, S. J. (2007). Population aging, intracohort aging, and
sociopolitical attitudes. American Sociological Review, 72(5), 812–830.
http://doi.org/10.1177/000312240707200508
DeSilver, D. (2014) The politics of American generations: How age affects attitudes and voting
behavior. July 9, 2014. http://www.pewresearch.org/fact-tank/2014/07/09/the-politics-of-
american-generations-how-age-affects-attitudes-and-voting-behavior/
Donnelly, K., Twenge, J. M., Clark, M. A., Shaikh, S., Beiler-May, A., & Carter, N. T. (2016).
Attitudes toward women’s work and family roles in the United States, 1976-2013.
Psychology of Women Quarterly, 40, 41-54.
Dugan, A. (2015). U.S. Congress and its leaders suffer public discontent. Gallup Organization,
August 12, 2015. http://www.gallup.com/poll/184556/congress-leaders-suffer-public-
discontent.aspx
Erikson, R.S., & Tedin, K. L. (2003). American Public Opinion. New York: Longman. 6th
edition.

31
Federico, C. M., Weber, C. R., Ergun, D., & Hunt, C. (2013). Mapping the connections between
politics and morality: The multiple sociopolitical orientations involved in moral intuition.
Political Psychology, 34(4), 589–610. http://doi.org/10.1111/pops.12006
Fiorina, M. (2014). Americans have not become more politically polarized. Washington Post,
June 23, 2014. www.washingtonpost.com/blogs/monkey-cage/wp/2014/06/23/americans-
have-not-become-more-politically-polarized/
Fiorina, M. P., & Abrams, S. J. (2008). Political polarization in the American public. Annual
Review of Political Science, 11, 563-588.
Fiorina, M. P., Abrams, S. A., & Pope, J. C. (2008). Polarization in the American public:
Misconceptions and misreadings. The Journal of Politics, 70, 556–560.
Ghitza, Y., & Gelman, A. (2014). The great society, Reagan’s revolution, and generations of
presidential voting. Unpublished Working Paper, Columbia University, New York.
Retrieved from http://www.stat.columbia.edu/~gelman/research/unpublished/cohort_vot
ing_20140605.pdf
Glenn, N. D. (1974). Aging and conservatism. Annals of the American Academy of Political and
Social Science, 415, 176–186.
Glenn, N. D., & Hefner, T. (1972). Further evidence on aging and party identification. Public
Opinion Quarterly, 36, 31–47.
Hawkins, C. B., & Nosek, B. A. (2012). Motivated independence? Implicit party identity
predicts political judgments among self-proclaimed independents. Personality and Social
Psychology Bulletin, 38, 1437–1452.
Heit, E., & Nicholson, S. P. (2010). The opposite of Republican: Polarization and political
categorization. Cognitive Science, 34, 1503–1516.

32
Hill, S. (2005). Divided we stand: The polarizing of American politics. National Civic Review,
94(4), 3-14.
Hill, S. J., & Tausanovitch, C. (2015). A disconnect in representation? Comparison of trends in
congressional and public polarization. The Journal of Politics, 77, 1058–1075.
http://doi.org/10.1086/682398
Hogg, M. A., Turner, J. C., & Davidson, B. (1990). Polarized norms and social frames of
reference: A test of the self-categorization theory of group polarization. Basic and
Applied Social Psychology, 11, 77–100. http://doi.org/10.1207/s15324834basp1101_6
Jones, J. M. (2015). In U.S., New record 43% are political Independents. Gallup Organization,
January 7, 2015. http://www.gallup.com/poll/180440/new-record-political-
independents.aspx
Johnston, L. D., Bachman, J. G., O’Malley, P. M., & Schulenberg, J. E. (2015). Monitoring the
future: A continuing study of American youth, 2013. ICPSR35218-v2. Ann Arbor, MI:
Inter-university Consortium for Political and Social Research [distributor], 2015-03-26.
Jost , J. T. (2006). The end of the end of ideology. American Psychologists, 61, 651-670.
Jost, J. T., Federico, C. M., & Napier, J. L. (2009) Political ideology: Its structure, functions,
and elective affinities. Annual Review of Psychology, 60, 307-337.
Kiley, J., & Dimock, M. (2014). The GOP’s Millennial problem runs deep. Pew Research
Center, September 25, 2014.
Kwon, R. (2015). Does radical partisan politics affect national income distributions?
Congressional polarization and income inequality in the United States, 1913-2008. Social
Science Quarterly, 96, 49-64.

33
Lavine, H., Jost, J. T., & Lodge, M. (2015). Political cognition and its normative implications for
the“ democratic experiment”: Theory, evidence, and controversy. In M. Mikulincer, P. R.
Shaver, E. Borgida, & J. A. Bargh (Eds.), APA handbook of personality and social
psychology, Attitudes and social cognition (Vol. 1, pp. 721–752). Washington, D.C.:
American Psychological Association.
McCarthy, J. (2015). Record-high 60% of Americans support same-sex marriage. Gallup
Organization, May 19, 2015. http://www.gallup.com/poll/183272/record-high-americans-
support-sex-marriage.aspx
Milojev, P., Greaves, L., Osborne, D., & Sibley, C. G. (2015). Stability and change in political
conservatism following the global financial crisis. Personality and Social Psychology
Bulletin, 41, 127-139.
Newport, F. (2014). Party identification varies widely across the age spectrum: Young
Americans lean Democratic, independent as well. Gallup Organization, July 10, 2014.
http://www.gallup.com/poll/172439/party-identification-varies-widely-across-age-
spectrum.aspx
Pew Research Center (2014a). Beyond Red vs. Blue: The Political Typology. http://www.people-
press.org/2014/06/26/the-political-typology-beyond-red-vs-blue/
Pew Research Center. (2014b). Political polarization in the American public: How increasing
ideological uniformity and partisan antipathy affect politics, compromise, and everyday
life. http://www.people-press.org/2014/06/12/political-polarization-in-the-american-
public/
Pew Research Center (2015). A deep dive into party affiliation. April 7, 2015.
http://www.people-press.org/2015/04/07/a-deep-dive-into-party-affiliation/

34
Pryor, J. H., Hurtado, B., Saenz, V. B., Santos, J. L., & Korn, W. S. (2007). The American
Freshman: Forty-Year Trends, 1966-2006. Los Angeles: Higher Education Research
Institute.
Riffkin, R. (2014). Public faith in congress falls again, hits historic low. Gallup Organization,
June 19, 2014. http://www.gallup.com/poll/171710/public-faith-congress-falls-again-hits-
historic-low.aspx
Roberts, B. W., Walton, K. E., & Viechtbauer, W. (2006). Patterns of mean-level change in
personality traits across the life course: A meta-analysis of longitudinal studies.
Psychological Bulletin, 132, 1-25.
Saltzman Chafetz, J., & Fuchs Ebaugh, H. R. (1983). Growing conservatism in the United
States: An examination of trends in political opinion between 1972 and 1980.
Sociological Perspectives, 26, 275-298.
Schaie, K. W. (1965). A general model for the study of developmental problems. Psychological
Bulletin, 64, 92-107.
Smith, T. W., Marsden, P. Hout, M., & Kim, J. (2015). General Social Surveys, 1972-2014
[machine-readable data file] Chicago: National Opinion Research Center [producer];
Storrs, CT: The Roper Center for Public Opinion Research, University of Connecticut
[distributor]. Retrived from http://www3.norc.org/GSS+Website/Download/
Strauss, W., & Howe, N. (1991). Generations. New York: Random House.
Tajfel, H., & Turner, J. C. (1979). An integrative theory of intergroup conflict. The Social
Psychology of Intergroup Relations, 33(47), 74.
Theriault, S. M. (2006). Party polarization in the US Congress member replacement and member
adaptation. Party Politics, 12, 483–503. http://doi.org/10.1177/1354068806064730

35
Turner, J. C. (1985). Social categorization and the self-concept: A social cognitive theory of
group behavior. Advances in Group Processes: Theory and Research, 2, 77–122.
Twenge, J. M. (2014). Generation Me: Why Today’s Young Americans Are More Confident,
Assertive, Entitled--and More Miserable Than Ever Before. Second edition. New York:
Atria Books.
Twenge, J. M., Campbell, W. K., & Carter, N. T. (2014). Declines in trust in others and
confidence in institutions among American adults and late adolescents, 1972-2012.
Psychological Science, 25, 1914-1923.
Twenge, J.M., Campbell, W.K., & Freeman, E. C. (2012). Generational differences in young
adults’ life goals, concern for others, and civic orientation, 1966-2009. Journal of
Personality and Social Psychology, 102, 1045-1062.
Twenge, J. M., Carter, N. T., & Campbell, W. K. (2015). Time period, generational, and age
differences in tolerance for controversial beliefs and lifestyles in the U.S., 1972-2012.
Social Forces, 94, 379-399.
Van Boven, L., Judd, C. M., & Sherman, D. K. (2012). Political polarization projection: Social
projection of partisan attitude extremity and attitudinal processes. Journal of Personality
and Social Psychology, 103, 84–100.
Weber, C. R., & Federico, C. M. (2013). Moral foundations and heterogeneity in ideological
preferences. Political Psychology, 34, 107–126. http://doi.org/10.1111/j.1467-
9221.2012.00922.x
Westfall, J., Van Boven, L., Judd, C. M., & Chambers, J. R. (2015). Perceiving political
polarization in the United States: Party identity strength and attitude extremity exacerbate
the perceived partisan divide. Perspectives on Psychological Science, 10, 145-158.

36
Wetherell, G. A., Brandt, M. J., & Reyna, C. (2013). Discrimination across the ideological
divide: The role of value violations and abstract values in discrimination by liberals and
conservatives. Social Psychological and Personality Science, 4, 658-667.
Yang, Y. (2008). Social inequalities in happiness in the United States, 1972 to 2004: An age-
period-cohort analysis. American Sociological Review, 73, 204-226.
Yang Y., & Land K. C. (2013). Age-period-cohort analysis: New models, methods, and
empirical applications. Boca Raton, FL: CRC Press.
Zaller, J. (1992). The nature and origins of mass opinion. Cambridge university press.

37
Footnotes
1. In describing the trends and previous literature, we will sometimes employ common labels for
the generations such as the G.I. or “Greatest” generation (born 1900-1924), Silent (1925-
1945), Boomers (1946-1964; some argue 1943-1960), GenX (1965-1979), and
Millennials (1980-1994; for reviews, see Strauss & Howe, 1991; Twenge, 2014). These
birth year cutoffs are arbitrary and are not necessarily justified by empirical evidence, but
are useful labels for those born in certain eras. In addition, the most recent samples may
be part of a new generation (iGen, born 1995 and later), but we analyze them with
Millennials for ease of presentation.
38
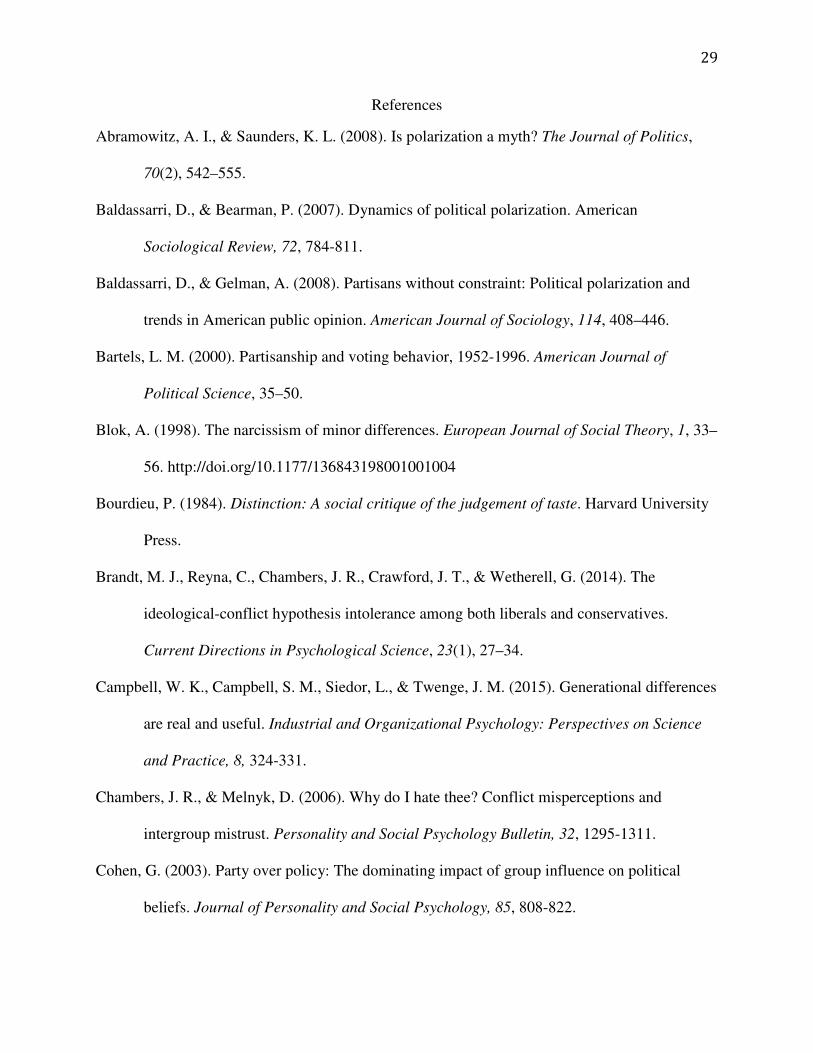
Table 1: American 12th
graders’ political party affiliation and ideological self-categorization,
Monitoring the Future survey, 1976-2014
Variable n 76-79 80-84 85-89 90-94 95-99 00-04 05-09 10-14 d
(max)
d
(first
to
last) Political Party
Democrat vs.
Republican (1-
4; high = Rep.) 270,259
2.31
(.95)
2.42
(1.01)
2.58
(1.04)
2.52
(1.05)
2.46
(1.02)
2.43
(1.06)
2.43
(1.06)
2.50
(1.05)
.26 .19
Democrat
270,259
58%
(.49)
52%
(.50)
44%
(.50)
48%
(.50)
51%
(.50)
52%
(.50)
53%
(.50)
51%
(.50) -.29 -.16
Strongly
Democrat
270,259
22%
(.42)
22%
(.41)
20%
(.40)
22%
(.41)
21%
(.41)
24%
(.43)
24%
(.43)
21%
(.41) .11 -.03
Mildly
Democrat
270,259
36%
(.48)
30%
(.46)
24%
(.43)
26%
(.44)
30%
(.46)
28%
(.45)
28%
(.45)
29%
(.46) -.27 -.14
Republican
270,259
42%
(.49)
48%
(.50)
56%
(.50)
52%
(.50)
49%
(.50)
48%
(.50)
47%
(.50)
49%
(.50) .29 .16
Strongly
Republican
270,259
12%
(.32)
16%
(.37)
21%
(.41)
21%
(.41)
19%
(.39)
20%
(.40)
20%
(.40)
22%
(.41) .27 .27
Mildly
Republican
270,259
30%
(.46)
31%
(.46)
35%
(.48)
31%
(.46)
30%
(.46)
28%
(.45)
27%
(.44)
28%
(.45) -.17 -.05
Strong
affiliation
(Dem. or Rep.)
270,259
34%
(.47)
38%
(.49)
41%
(.49)
43%
(.49)
40%
(.49)
44%
(.50)
44%
(.50)
43%
(.50) .21 .18
Independent 184,749
----- ----- ------ ------
14%
(.35)
13%
(.33)
13%
(.34)
16%
(.37) .09 .06
No preference 184,749
----- ----- ----- ------
27%
(.44)
22%
(.42)
18%
(.39)
21%
(.41) -.22 -.14
Other party
431,505 2%
(.14)
2%
(.13)
2%
(.14)
3%
(.16)
2%
(.14)
2%
(.15)
2%
(.15)
3%
(.16) .06 .05
Don’t know
561,454 25%
(.43)
27%
(.45)
23%
(.42)
20%
(.40)
23%
(.42)
19%
(.39)
22%
(.42)
25%
(.43) -.19 -.02
Political Beliefs
Liberal to
Moderate to
Conservative
(1-6)
393,838
3.77
(1.04)
3.87
(1.06)
3.86
(1.08)
3.81
(1.14)
3.78
(1.15)
3.79
(1.14)
3.84
(1.14)
3.90
(1.15)
.12 .12
Liberal
393,838
35%
(.48)
30%
(.46)
31%
(.46)
34%
(.48)
36%
(.48)
36%
(.48)
36%
(.48)
34%
(.47)
.13 -.02
Moderate
393,838
44%
(.50)
46%
(.50)
43%
(.50)
40%
(.49)
40%
(.49)
40%
(.49)
38%
(.48)
37%
(.48)
-.17 -.14
Conservative
393,838
21%
(.41)
24%
(.43)
25%
(.44)
25%
(.43)
24%
(.43)
24%
(.43)
27%
(.44)
29%
(.45)
.18 .18
Very liberal or
radical
393,838 9%
(.29)
9%
(.28)
9%
(.29)
11%
(.31)
12%
(.32)
12%
(.32)
11%
(.32)
10%
(.30) .04 .11
Very
conservative
393,838 4%
(.19)
5%
(.21)
5%
(.22)
6%
(.24)
6%
(.24)
6%
(.24)
7%
(.26)
8%
(.27) .19 .19
Very Liberal or
Conservative
393,838
13%
(.34)
13%
(.34)
14%
(.35)
17%
(.38)
18%
(.38)
18%
(.38)
18%
(.39)
19%
(.39) .15 .15
None of the
above, or don’t
know
563,102
26%
(.44)
30%
(.46)
29%
(.45)
26%
(.44)
31%
(.46)
26%
(.44)
33%
(.47)
39%
(.49) .27 .27

39
NOTES: d (max) = difference in standard deviations from the lowest group of years to the
highest; d (period) = difference in standard deviations from the early 1970s to the 2010s

40
Table 2: American entering college students’ political views, American Freshman Survey, 1970-
2015
Political Views n 70-
74
75-
79
80-
84
85-
89
90-
94
95-
99
00-
04
05-
09
10-
15
d
(ma
x)
d
(peri
od)
Far-left or liberal 9,407,4
36
37%
(.48)
28%
(.45)
22%
(.42)
25%
(.43)
28%
(.45)
26%
(.44)
28%
(.45)
32%
(.46)
31%
(.46)
-.33 -.13
Middle of the road 9,407,4
36
47%
(.50)
54%
(.50)
57%
(.49)
52%
(.50)
50%
(.50)
52%
(.50)
50%
(.50)
44%
(.50)
47%
(.50)
-.26 .00
Far right or conservative 9,407,4
36
16%
(.37)
18%
(.38)
21%
(.41)
22%
(.42)
22%
(.42)
22%
(.42)
22%
(.42)
24%
(.43)
22%
(.42)
.20 .15
Far left 9,407,4
36
2.5%
(.16)
1.8%
(.13)
1.7%
(.13)
1.9%
(.14)
2.1%
(.14)
2.4%
(.16)
2.9%
(.17)
3.0%
(.17)
2.8%
(.16)
.09 .02
Far right 9,407,4
36
.7%
(.07)
.8%
(.08)
1.1%
(.10)
1.4%
(.12)
1.4%
(.12)
1.5%
(.12)
1.6%
(.12)
1.8%
(.13)
1.7%
(.13)
.11 .11
Strong/extreme views (far
left OR far right)
9,407,4
36
3.2%
(.17)
2.6%
(.15)
2.9%
(.17)
3.3%
(.17)
3.5%
(.18)
3.9%
(.19)
4.5%
(.20)
4.7%
(.21)
4.7%
(.21)
.12 .08
NOTES: d (max) = difference in standard deviations from the lowest group of years to the
highest; d (period) = difference in standard deviations from the early 1970s to the 2010s

41
Table 3: American adults’ political party affiliation and ideological self-categorization, General
Social Survey, 1972-2014
Variable n 72-
74
75-
79
80-
84
85-
89
90-
94
95-
99
00-
04
05-
09
10-
14
d
(ma
x)
d
(per
iod)
Political Party
Democrat vs. Republican (1-7;
High = Rep.)
57,633 3.39
(1.9
8)
3.46
(1.9
0)
3.60
(1.9
5)
3.76
(2.0
5)
3.88
(2.0
4)
3.82
(1.9
4)
3.86
(2.0
0)
3.79
(1.9
7)
3.70
(1.9
3)
.24 .16
Democrat 57.633 46%
(.50)
42%
(.49)
39%
(.49)
38%
(.49)
36%
(.48)
33%
(.47)
33%
(.47)
33%
(.47)
33%
(.47)
-.27 -.27
Republican 57,633 23%
(.42)
22%
(.42)
24%
(.43)
29%
(.46)
31%
(.46)
28%
(.45)
28%
(.45)
27%
(.44)
23%
(.42)
.20 .00
Independent (Independent Near
Democrat, Independent Near
Republican, Independent)
57,633 31%
(.46)
36%
(.48)
37%
(.48)
32%
(.47)
33%
(.47)
39%
(.49)
38%
(.49)
41%
(.49)
44%
(.50)
.27 .27
Strongly Democrat 57,633 19%
(.39)
16%
(.37)
16%
(.36)
16%
(.37)
14%
(.35)
13%
(.34)
15%
(.35)
16%
(.37)
16%
(.37)
-.17 -.08
Strongly Republican 57,633 8%
(.27)
7%
(.25)
8%
(.28)
11%
(.31)
12%
(.32)
10%
(.30)
12%
(.33)
11%
(.32)
10%
(.30)
.17 .07
Strong/extreme views (Strongly
Democratic OR Republican)
57,633 26%
(.44)
23%
(.42)
24%
(.43)
27%
(.44)
26%
(.44)
23%
(.42)
27%
(.44)
27%
(.45)
26%
(.44)
.07 .00
Weak views (not strong
Democrat OR not strong
Republican)
57,633 42%
(.49)
42%
(.49)
39%
(.49)
41%
(.49)
41%
(.49)
38%
(.49)
35%
(.48)
32%
(.47)
30%
(.46)
.26 .26
Other party 58,542 4.3
%
(.20)
.05
%
(.07)
1.0
%
(.10)
.07
%
(.08)
1.1
%
(.10)
1.8
%
(.13)
1.5
%
(.12)
1.6
%
(.12)
2.5
%
(.16)
-.30 -.10
Ideological Self-Categorization
Liberal vs. Conservative (1-7;
High = Cons.)
49,789 3.98
(1.2
9)
4.04
(1.3
1)
4.16
(1.2
8)
4.12
(1.3
3)
4.15
(1.3
7)
4.17
(1.3
7)
4.16
(1.4
0)
4.15
(1.4
0)
4.12
(1.4
3)
.14 .10
Liberal 49,789 31%
(.46)
29%
(.45)
25%
(.43)
26%
(.44)
27%
(.44)
26%
(.44)
26%
(.44)
26%
(.44)
27%
(.44)
-.14 -.09
Moderate 49,789 40%
(.49)
39%
(.49)
41%
(.49)
39%
(.49)
37%
(.48)
38%
(.48)
39%
(.49)
39%
(.49)
39%
(.49)
-.04 -.02
Conservative 49,789 30%
(.46)
32%
(.47)
34%
(.48)
35%
(.48)
36%
(.48)
35%
(.48)
35%
(.48)
35%
(.48)
34%
(.47)
.13 .09
Extremely liberal 49,789 1.6
%
(.12)
2.4
%
(.15)
2.3
%
(.15)
2.3
%
(.15)
2.5
%
(.16)
2.3
%
(.15)
3.5
%
(.18)
2.9
%
(.17)
3.7
%
(.19)
.12 .12
Extremely conservative 49,789 2.4
%
(.15)
2.2
%
(.15)
2.9
%
(.17)
2.5
%
(.16)
3.3
%
(.18)
3.3
%
(.18)
3.6
%
(.19)
3.8
%
(.19)
4.2
%
(.20)
.11 .09
Strong/extreme views
(extremely liberal OR extremely
conservative)
49,789 4.0
%
(.20)
4.6
%
(.21)
5.2
%
(.22)
4.8
%
(.21)
5.8
%
(.23)
5.6
%
(.23)
7.1
%
(.26)
6.7
%
(.25)
7.9
%
(.27)
.15 .15
Moderate views (slightly liberal
or slightly conservative, or
moderate)
49,789 71%
(.45)
71%
(.45)
73%
(.45)
69%
(.46)
68%
(.47)
67%
(.47)
66%
(.47)
65%
(.47)
64%
(.48)
-.19 -.15
Don’t know 51,800 4.5
%
(.21)
4.8
%
(.21)
3.0
%
(.17)
4.3
%
(.20)
3.3
%
(.18)
5.1
%
(.22)
4.0
%
(.20)
3.3
%
(.18)
3.2
%
(.18)
-.08 -.07

42
NOTES: d (max) = difference in standard deviations from the lowest group of years to the
highest; d (period) = difference in standard deviations from the early 1970s to the 2010s

43
Table 4: American 12th
graders’ strength of party affiliation and political views, 1976-2014
76-79 80-84 85-89 90-94 95-99 00-04 05-09 10-14 d
(max)
d (period)
Mean
Republican 3.29
(.45)
3.34
(.48)
3.38
(.49)
3.40
(.49)
3.38
(.49)
3.41
(.49)
3.42
(.49)
3.44
(.50) .33 .33 Mean
Democrat 1.62
(.49)
1.58
(.49)
1.54
(.50)
1.55
(.50)
1.59
(.49)
1.53
(.50)
1.54
(.50)
1.58
(.49) .17 -.07 Mean
Conservative 5.19
(.39)
5.19
(.39)
5.20
(.40)
5.24
(.43)
5.25
(.44)
5.26
(.44)
5.26
(.44)
5.29
(.45) .24 .24 Mean Liberal 2.63
(.67)
2.58
(.72)
2.59
(.70)
2.55
(.71)
2.55
(.71)
2.56
(.70)
2.60
(.64)
2.61
(.64) .12 -.03
Note: Decreases in values for Democrats and liberals reflect increasing extremity, while
increases in values for Republicans and Conservatives reflect increasing extremity.

44
Figure 1: American 12th
graders’ political party affiliation, 1976-2014; high = Republican.
NOTE: Independents are not included as the wording of the response choices changed.
30%
40%
50%
60%
70%
Pe
rce
nt
Title
Democrat
Republican

45
Figure 2: Percentage of American adults identifying as Democrats, Republicans, and
Independents, 1972-2014
10
20
30
40
50
Democrat
Republican
Independent
46
Figure 3: American 12th
graders’ ideological self-categorization, 1976-2014
15%
20%
25%
30%
35%
40%
45%
50%P
erc
en
t
Year
Liberal
Conservative
Moderate

47
Figure 4: American entering college students’ ideological self-categorization, 1970-2015
15
20
25
30
35
40
45
50
55
60P
erc
en
t
Year
Far left or
liberal
Far right or
conservative
Middle of the
road

48
Figure 5: A) Time period and B) cohort (generational) effects in political party affiliation
(Republican = higher), controlling for age, U.S. adults, 1972-2014

49
Figure 6: Percentage of American 12th
graders identifying as Independent or expressing no party
preference, 1996-2014
10
15
20
25
30P
erc
en
t
Year
Independent
No
Preference

50
A)
B)
Figure 7: Age effects on A) political party (Republican = higher) and B) ideological self-
categorization (conservative = higher), U.S. adults, ages 18 to 96

51
Figure 8: Percentage of American 12th
graders identifying as strongly Democrat or strongly
Republican, 1976-2014
30%
32%
34%
36%
38%
40%
42%
44%
46%
48%
Str
on
g P
art
y A
ffil
iati
on
Survey Year

52
Figure 9: Percentage of American 12th
graders identifying as “very” liberal/radical or “very”
conservative, 1976-2014
10%
11%
12%
13%
14%
15%
16%
17%
18%
19%
20%
Str
on
g P
oli
tic
al
Be
lie
fs
Survey Year

53
A)
B)
Figure 10: Age effects on A) strong political party identification and B) extreme ideological self-
categorization, U.S. adults, ages 18 to 96

54
A)
B)
Figure 11: Trends in the correlation between political party identification (Democrat vs.
Republican only) and ideological self-categorization (liberal vs. conservative) among A) adults,
and B) 12th
graders.
0.13
0.18
0.23
0.28
0.33
0.38
0.43
0.48
Correlation
between party
affiliation and
ideological
self-view
Linear
(Correlation
between party
affiliation and
ideological
self-view)
0.2
0.25
0.3
0.35
0.4
0.45
0.5
0.55
0.6
0.65
0.7
Correlation
between party
affiliation and
ideological self-
view
Linear
(Correlation
between party
affiliation and
ideological self-
view)