more perennials better livestock healthier catchments …€¦ · more perennials better livestock...
TRANSCRIPT

Case study
More perennials
Better livestock
Healthier catchments
Key points
www.evergraze.com.au
• Improving degraded phalaris pastures with fertiliser, weed control and grazing can double carrying capacity
• The cost of establishing new pastures was reduced by utilising the high fertility sheep camps.
• To maximise benefi ts, the paddocks were fenced and managed appropriately.
• Factors affecting the results include good seasonal conditions and changed grazing management
During 2009, following a number of drought years, Barrie and Anne Noye were running a 500 head self-replacing Merino fl ock on their 133 hectare property in the foothills of the Strathbogie Ranges, near Euroa in North East Victoria.
The property ranges from relatively fl at, arable country on the valley fl oor to steep, non-arable lower foothill country at the northern end of the block.
The pastures are predominantly volunteer, annual pastures, although there are areas of native perennial pastures on the steeper country and some of the arable areas have been sown to phalaris in the past.
With this range of pasture bases to choose from, Barrie was keen to increase the pasture productivity on his property, using the most cost-effective means possible.
To rejuvenate or re-sow — weighing up the options
Department ofAgriculture and Food
EverGraze® is a Future Farm Industries CRC research and delivery partnership:
Farm info.
• Producer: Barrie and Anne Noye (EverGraze Supporting Site)
• Location: Creightons Creek, North East Victoria
• Property size: 133ha (one block of a larger enterprise)
• Mean annual rainfall: 700 mm • Soils: Sandy loams and sandy clay
loams derived from granite• Enterprise: Self-replacing Merinos.
Barrie and Anne Noye
BELOW: Local producers identify native grasses on the slope which was separated and managed separately from the more arable fl at and plateau.

Case study
Creightons Creek Supporting Site, North East Victoria2 www.evergraze.com.au
Looking at options“I wanted to compare the costs and benefi ts of sowing and managing a new perennial pasture with manipulating existing sown pasture species through fertilisation and weed control,” Barrie said.
“But I was also aware of the potential benefi ts of looking at the property as a whole, fencing off the different land classes according to their limitations (soil nutrients, slope, aspect, plant species), and managing them accordingly.
An EverGraze Supporting Site was therefore set up on the property in association with the Creightons Creek BESTWOOL-BESTLAMB group in 2010. The aim of this site was to compare the relative productivity and profi tability of three different treatment areas under various management regimes.
The original 16 ha was sub-divided according to landclass into three paddocks consisting of an old, established phalaris paddock (Paddock A), an area of native perennial pasture (Paddock B) and a newly sown phalaris paddock (Paddock C).
Supporting Site paddocksThe fi rst paddock (Paddock A) was a 3 ha area of gently rising country which had been sown to phalaris about 30 years ago. In addition to the reasonable stand of phalaris covering most of the area, there were also some native grass species and a signifi cant level of erodium and silver grass (Vulpia) at the beginning of the demonstration period. The erodium was a signifi cant problem which prevented grazing from mid-late spring onwards due to contamination of erodium seed in the wool.
Paddock B was a 5 ha area which was steep and non-arable, although small sections of the paddock were sown to phalaris at the same time as Paddock A. The phalaris had all but disappeared leaving native grasses (mainly low quality spear grasses and wallaby grasses) as the dominant perennials.
The third demonstration paddock, Paddock C, was 8.4 ha of both arable and steeper, non-arable country. This paddock was the highest point in the original 16 ha paddock and had been used as a camp by stock. The dominant species was erodium and there were very few perennials so in May 2009, the arable 3.3 ha of the paddock was sown to Landmaster phalaris at a rate of 4 kg/ha, together with 8 kg/ha sub clover and 100 kg/ha monoammonium phosphate (MAP) fertiliser. The steep, non-arable 4.9 ha of the paddock was left as native and annual pastures.
In the dirtTo start the demonstration, soil tests were taken in each of the three paddocks in early 2010.
Paddock A (old phalaris) was defi cient in both phosphorus (P) and potassium (K), while Paddock C (new phalaris) was very mildly defi cient in phosphorus only. Paddock B (native) had adequate levels of both P and K, and all the demonstration paddocks had satisfactory pH levels.
Increasing fertilityWith assistance from site co-ordinator Jim Shovelton, the 2010 soil tests for Paddock A were analysed to calculate how much fertiliser was required to quickly lift the defi cient nutrients (P and K) to non-limiting levels with one fertiliser application.
“The amount of phosphorus fertiliser applied to lift the soil test from an Olsen level of 6.3 mg/kg to 15 mg/kg was calculated using the phosphorus buffering index, as discussed in the Science behind the story,” Jim said.
A good phalaris strike rate was achieved on the high-fertility stock camp, despite ongoing competition from erodium.
In mid-February, 2012, Barrie Noye (pale green hat) and site co-ordinator Jim Shovelton (straw hat, white shirt) show a group of farmers Paddock A, an old phalaris paddock that was renovated using fertiliser, weed control and grazing management during the demonstration.
Case study
Creightons Creek Supporting Site, North East Victoria3 www.evergraze.com.au
Barrie and fellow group member Geoff Broughton at the same site in Paddock A in mid-September, 2012.
“In autumn 2010, 600 kg/ha Super Potash 2:1 (35 kg P/ha and 100 kg K/ha) and 60 g/ha molybdenum (as a foliar spray) was applied to Paddock A, using a boomspray.
“We hoped this would not only help the perennial species but also improve the content of desirable annual species such as sub-clover and annual ryegrass.”
Grass and broadleaf herbicides were also applied (separately), to control annual grass weeds and erodium respectively.
Paddock C received no fertiliser as the soil tests had shown the soils in the new phalaris pasture to be close to the desirable nutrient levels.
Paddock B (native pasture) was not fertilised because the country in this paddock was too steep to apply fertiliser from the ground.
Flock size and rainThe Noyes changed their grazing management from set stocking to rotational grazing, to coincide with the start of the demonstration.
”We boxed 500 ewes into one mob and moved them about every seven days, depending on feed on offer, pasture growth rates and what the season was doing,” Barrie said.
“Using this grazing strategy, the three demonstration paddocks had 35-60 days in between grazings to recover.
“The other change that coincided with the start of the demonstration work was a break in the seasons. In 2010 and 2011 we had 1115 mm and 771 mm respectively, which was well above our annual average and a vast improvement from the 553mm we received in 2009.”
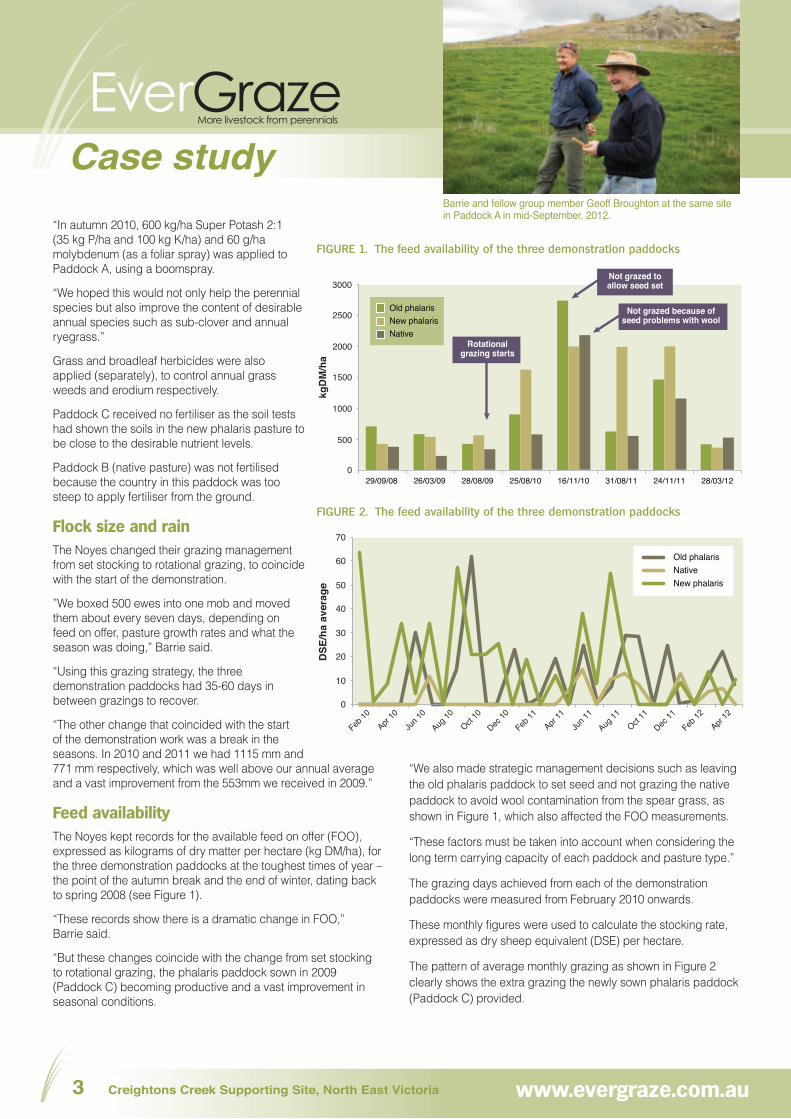
Feed availabilityThe Noyes kept records for the available feed on offer (FOO), expressed as kilograms of dry matter per hectare (kg DM/ha), for the three demonstration paddocks at the toughest times of year – the point of the autumn break and the end of winter, dating back to spring 2008 (see Figure 1).
“These records show there is a dramatic change in FOO,” Barrie said.
“But these changes coincide with the change from set stocking to rotational grazing, the phalaris paddock sown in 2009 (Paddock C) becoming productive and a vast improvement in seasonal conditions.
“We also made strategic management decisions such as leaving the old phalaris paddock to set seed and not grazing the native paddock to avoid wool contamination from the spear grass, as shown in Figure 1, which also affected the FOO measurements.
“These factors must be taken into account when considering the long term carrying capacity of each paddock and pasture type.”
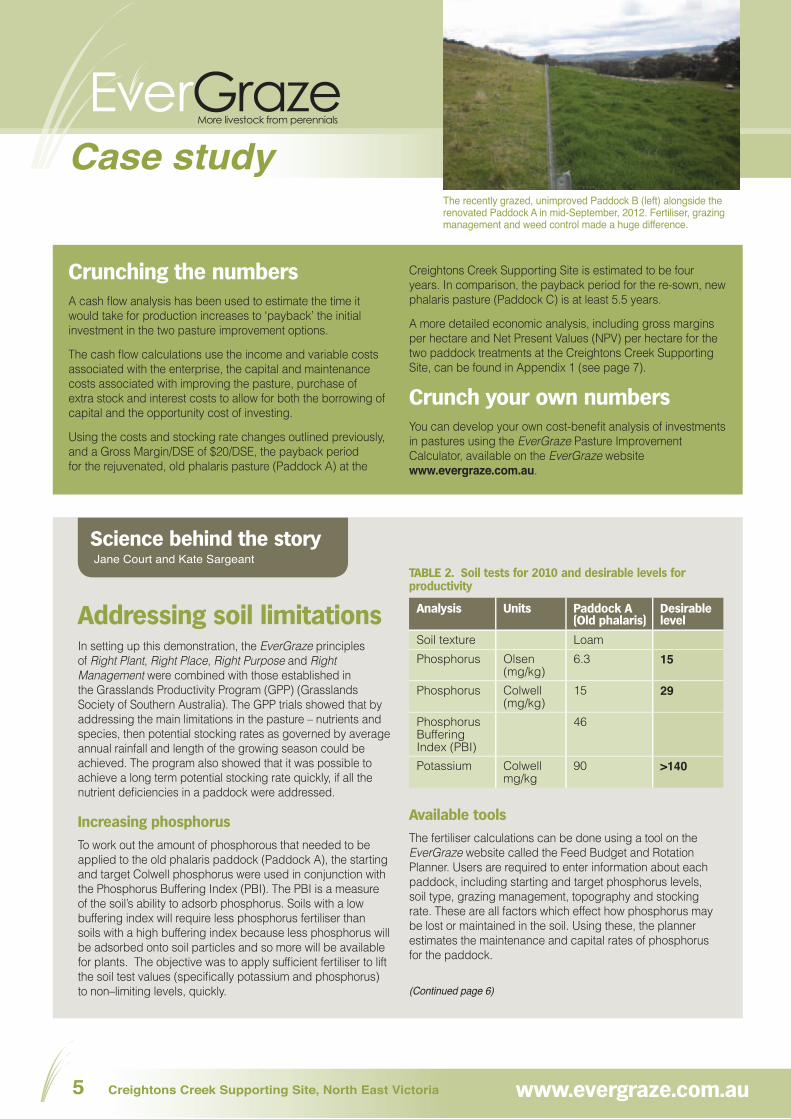
The grazing days achieved from each of the demonstration paddocks were measured from February 2010 onwards.
These monthly fi gures were used to calculate the stocking rate, expressed as dry sheep equivalent (DSE) per hectare.
The pattern of average monthly grazing as shown in Figure 2 clearly shows the extra grazing the newly sown phalaris paddock (Paddock C) provided.
FIGURE 1. The feed availability of the three demonstration paddocks
kgD
M/h
a
0
500
1000
1500
2000
2500
3000
29/09/08 26/03/09 28/08/09 25/08/10 16/11/10 31/08/11 24/11/11 28/03/12
Old phalarisNew phalarisNative
Rotational grazing starts
Not grazed to allow seed set
Not grazed because of seed problems with wool
FIGURE 2. The feed availability of the three demonstration paddocks
DSE
/ha
aver
age
Old phalarisNativeNew phalaris
0
10
20
30
40
50
60
70
Feb 10
Apr 10
Jun 1
0
Aug 10
Oct 10
Dec 10
Feb 11
Apr 11
Jun 1
1
Aug 11
Oct 11
Dec 11
Feb 12
Apr 12

Case study
Creightons Creek Supporting Site, North East Victoria4 www.evergraze.com.au
But because measurements did not start until autumn 2010, the pattern does not show the lost grazing in the new phalaris paddock while it became established.
Nor was the carryover feed from 2009 in each paddock taken into account when estimating carrying capacity over the demonstration.
Therefore, the potential carrying capacity of the three paddocks was estimated to be 10 DSE/ha in the old phalaris paddock, and 13 DSE/ha in the new phalaris paddock (as achieved over two years). The average stocking rate of the native paddock (Paddock B) was 3.5 DSE/ha.
The steep decline in the grazing achieved in the old phalaris paddock (Paddock A) between October and November 2010 was actually due to the paddock being left to set seed. There was also an area in Paddock C that we did not sow in 2009, so an adjustment was made for this when calculating stocking rates.
Species presentThe clover content of each paddock varied depending on the time of year that the assessments were taken. The old phalaris paddock almost always had a greater clover content than the other two pastures, regardless of when the measurements were taken, in response to fertiliser applied.
The rotational grazing strategy was designed to leave relatively high levels of residual pasture after the new phalaris paddock (Paddock C) was grazed, as Landmaster phalaris, being an upright winter active variety, is sensitive to heavy grazing. This also had a suppressing effect on the clover in that paddock.
The native grass paddock (Paddock B) continually had low clover content, consistent with the fact it received no fertiliser.
In general, the number of perennial pasture species improved over time. While the improved seasons contributed to this, the different treatments and grazing regime used in each paddock were the most infl uential factors.
Cost comparisonDespite the obvious differences in landscape between the demonstration paddocks, the site has provided some good data and demonstrated the relative benefi ts of pasture rejuvenation compared to re-sowing.
Although the soil type where the new phalaris pasture was sown in Paddock C was better than the soil under the old phalaris stand (Paddock A), initial estimates of return were similar over a ten year period for both paddocks.
An estimate of the costs associated with improving the phalaris-based pasture in Paddock A and re-sowing phalaris pasture in Paddock C are shown in Table 1.
Looking forwardFollowing this on-farm demonstration, Barrie is confi dent that where phalaris still exists in a degraded phalaris pasture, it is more cost-effective to rejuvenate the pasture with fertiliser, weed control and grazing management than starting again with new pasture establishment.
“It also showed the importance of addressing soil limitations and matching FOO to increased stocking rates, for increased profi tability,” Barrie said.
“The soil tests during the demonstration showed the nutrient transfer that occurs to hill areas, so I will now endeavour to keep this in mind when fertilising different areas of the farm.” ■
TABLE 1. Costs for improving and re-sowing phalaris pasture
Year Paddock A(Old phalaris)
Paddock C(New phalaris)
Fertiliser $200/ha(35 kgP/ha and 100 kgK/ha)
$60/ha
Weed control $23/ha (Broadleaf)$26/ha (Grass)
$25/ha (spring)$34/ha (pre-sowing)$25/ha (post-sowing)
Seed $163/ha
Contract sowing $55/ha
Total $274/ha $376/haOngoing maintenance fertiliser 0.7 kgP/DSE
$28/ha $36/ha
Contact
Barrie Noyep: (03) 5790 3223
Sowing a new pasture on the high fertility plateau was the best option where very few perennials were left. Fencing and managing this area with rotational grazing was important to ensure it did not become a sheep camp once again.
Paddock A in winter 2009 prior to improvements with fertiliser, weed control and grazing. Erodium and silver grass were dominant. Phalaris and clover were hard to fi nd.
Case study
Creightons Creek Supporting Site, North East Victoria5 www.evergraze.com.au
Science behind the storyJane Court and Kate Sargeant
Addressing soil limitationsIn setting up this demonstration, the EverGraze principles of Right Plant, Right Place, Right Purpose and Right Management were combined with those established in the Grasslands Productivity Program (GPP) (Grasslands Society of Southern Australia). The GPP trials showed that by addressing the main limitations in the pasture – nutrients and species, then potential stocking rates as governed by average annual rainfall and length of the growing season could be achieved. The program also showed that it was possible to achieve a long term potential stocking rate quickly, if all the nutrient defi ciencies in a paddock were addressed.
Increasing phosphorus
To work out the amount of phosphorous that needed to be applied to the old phalaris paddock (Paddock A), the starting and target Colwell phosphorus were used in conjunction with the Phosphorus Buffering Index (PBI). The PBI is a measure of the soil’s ability to adsorb phosphorus. Soils with a low buffering index will require less phosphorus fertiliser than soils with a high buffering index because less phosphorus will be adsorbed onto soil particles and so more will be available for plants. The objective was to apply suffi cient fertiliser to lift the soil test values (specifi cally potassium and phosphorus) to non–limiting levels, quickly.
Available tools
The fertiliser calculations can be done using a tool on the EverGraze website called the Feed Budget and Rotation Planner. Users are required to enter information about each paddock, including starting and target phosphorus levels, soil type, grazing management, topography and stocking rate. These are all factors which effect how phosphorus may be lost or maintained in the soil. Using these, the planner estimates the maintenance and capital rates of phosphorus for the paddock.
(Continued page 6)
Crunching the numbersA cash fl ow analysis has been used to estimate the time it would take for production increases to ‘payback’ the initial investment in the two pasture improvement options.
The cash fl ow calculations use the income and variable costs associated with the enterprise, the capital and maintenance costs associated with improving the pasture, purchase of extra stock and interest costs to allow for both the borrowing of capital and the opportunity cost of investing.
Using the costs and stocking rate changes outlined previously, and a Gross Margin/DSE of $20/DSE, the payback period for the rejuvenated, old phalaris pasture (Paddock A) at the
Creightons Creek Supporting Site is estimated to be four years. In comparison, the payback period for the re-sown, new phalaris pasture (Paddock C) is at least 5.5 years.
A more detailed economic analysis, including gross margins per hectare and Net Present Values (NPV) per hectare for the two paddock treatments at the Creightons Creek Supporting Site, can be found in Appendix 1 (see page 7).
Crunch your own numbersYou can develop your own cost-benefi t analysis of investments in pastures using the EverGraze Pasture Improvement Calculator, available on the EverGraze website www.evergraze.com.au.
TABLE 2. Soil tests for 2010 and desirable levels for productivity
Analysis Units Paddock A(Old phalaris)
Desirable level
Soil texture Loam
Phosphorus Olsen (mg/kg)
6.3 15
Phosphorus Colwell (mg/kg)
15 29
Phosphorus Buffering Index (PBI)
46
Potassium Colwell mg/kg
90 >140
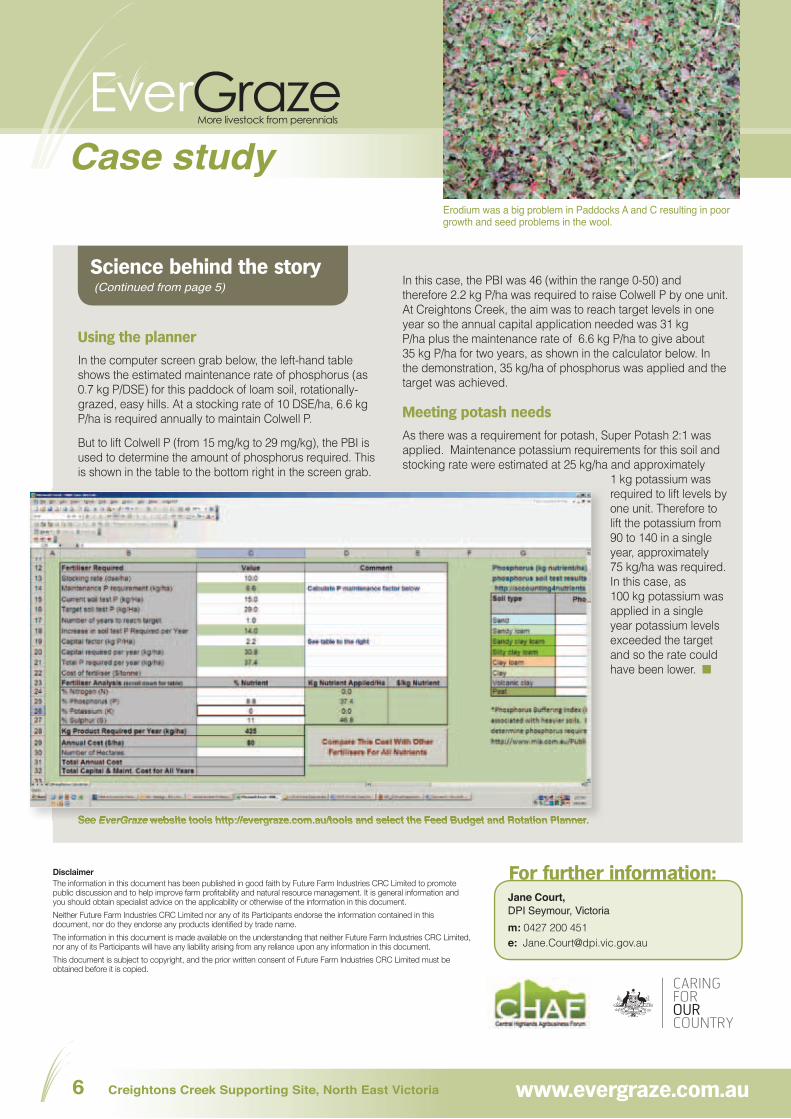
The recently grazed, unimproved Paddock B (left) alongside the renovated Paddock A in mid-September, 2012. Fertiliser, grazing management and weed control made a huge difference.
Case study
Creightons Creek Supporting Site, North East Victoria6 www.evergraze.com.au
Erodium was a big problem in Paddocks A and C resulting in poor growth and seed problems in the wool.
Science behind the story(Continued from page 5)
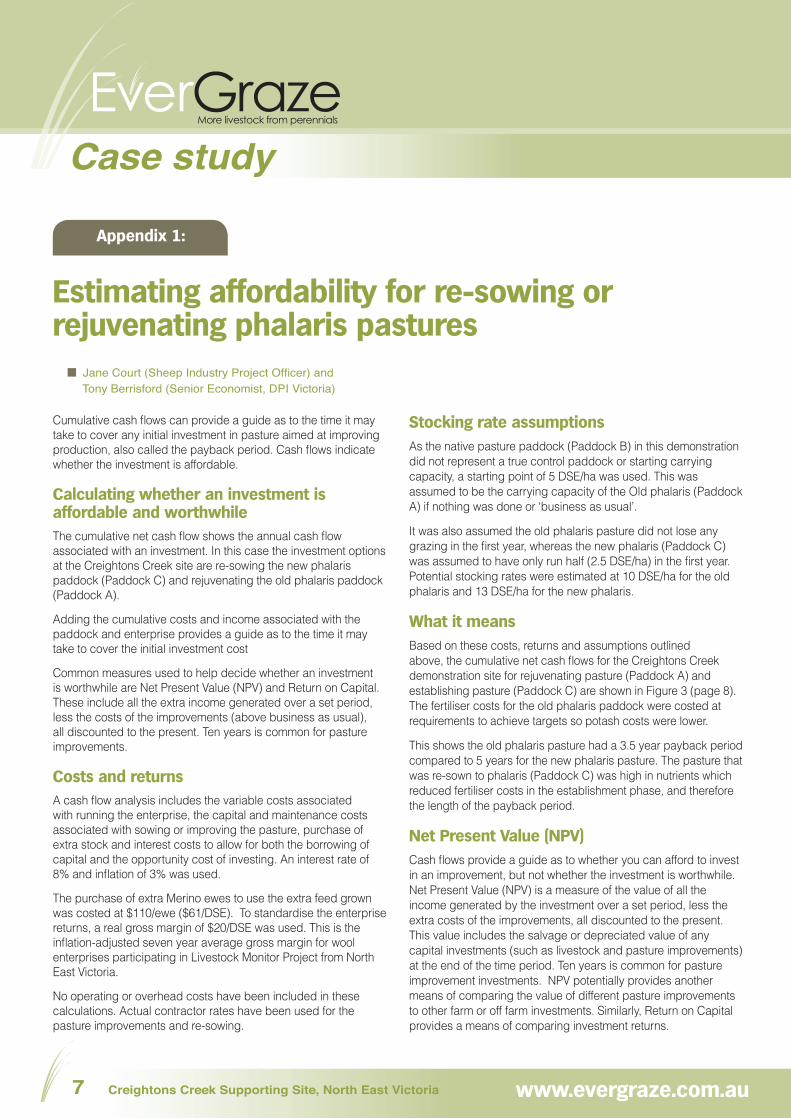
Using the planner
In the computer screen grab below, the left-hand table shows the estimated maintenance rate of phosphorus (as 0.7 kg P/DSE) for this paddock of loam soil, rotationally-grazed, easy hills. At a stocking rate of 10 DSE/ha, 6.6 kg P/ha is required annually to maintain Colwell P.
But to lift Colwell P (from 15 mg/kg to 29 mg/kg), the PBI is used to determine the amount of phosphorus required. This is shown in the table to the bottom right in the screen grab.
In this case, the PBI was 46 (within the range 0-50) and therefore 2.2 kg P/ha was required to raise Colwell P by one unit. At Creightons Creek, the aim was to reach target levels in one year so the annual capital application needed was 31 kg P/ha plus the maintenance rate of 6.6 kg P/ha to give about 35 kg P/ha for two years, as shown in the calculator below. In the demonstration, 35 kg/ha of phosphorus was applied and the target was achieved.
Meeting potash needs
As there was a requirement for potash, Super Potash 2:1 was applied. Maintenance potassium requirements for this soil and stocking rate were estimated at 25 kg/ha and approximately
1 kg potassium was required to lift levels by one unit. Therefore to lift the potassium from 90 to 140 in a single year, approximately 75 kg/ha was required. In this case, as 100 kg potassium was applied in a single year potassium levels exceeded the target and so the rate could have been lower. ■
See EverGraze website tools http://evergraze.com.au/tools and select the Feed Budget and Rotation Planner.See EverGraze website tools http://evergraze.com.au/tools and select the Feed Budget and Rotation Planner.EverGraze website tools http://evergraze.com.au/tools and select the Feed Budget and Rotation Planner.EverGraze
For further information:Jane Court,DPI Seymour, Victoriam: 0427 200 451e: [email protected]
DisclaimerThe information in this document has been published in good faith by Future Farm Industries CRC Limited to promote public discussion and to help improve farm profi tability and natural resource management. It is general information and you should obtain specialist advice on the applicability or otherwise of the information in this document.
Neither Future Farm Industries CRC Limited nor any of its Participants endorse the information contained in this document, nor do they endorse any products identifi ed by trade name.
The information in this document is made available on the understanding that neither Future Farm Industries CRC Limited, nor any of its Participants will have any liability arising from any reliance upon any information in this document.
This document is subject to copyright, and the prior written consent of Future Farm Industries CRC Limited must be obtained before it is copied.
Case study
Creightons Creek Supporting Site, North East Victoria7 www.evergraze.com.au
Estimating affordability for re-sowing or rejuvenating phalaris pastures
Cumulative cash fl ows can provide a guide as to the time it may take to cover any initial investment in pasture aimed at improving production, also called the payback period. Cash fl ows indicate whether the investment is affordable.
Calculating whether an investment is affordable and worthwhileThe cumulative net cash fl ow shows the annual cash fl ow associated with an investment. In this case the investment options at the Creightons Creek site are re-sowing the new phalaris paddock (Paddock C) and rejuvenating the old phalaris paddock (Paddock A).
Adding the cumulative costs and income associated with the paddock and enterprise provides a guide as to the time it may take to cover the initial investment cost
Common measures used to help decide whether an investment is worthwhile are Net Present Value (NPV) and Return on Capital. These include all the extra income generated over a set period, less the costs of the improvements (above business as usual), all discounted to the present. Ten years is common for pasture improvements.
Costs and returnsA cash fl ow analysis includes the variable costs associated with running the enterprise, the capital and maintenance costs associated with sowing or improving the pasture, purchase of extra stock and interest costs to allow for both the borrowing of capital and the opportunity cost of investing. An interest rate of 8% and infl ation of 3% was used.
The purchase of extra Merino ewes to use the extra feed grown was costed at $110/ewe ($61/DSE). To standardise the enterprise returns, a real gross margin of $20/DSE was used. This is the infl ation-adjusted seven year average gross margin for wool enterprises participating in Livestock Monitor Project from North East Victoria.
No operating or overhead costs have been included in these calculations. Actual contractor rates have been used for the pasture improvements and re-sowing.
Appendix 1:
■ Jane Court (Sheep Industry Project Offi cer) and Tony Berrisford (Senior Economist, DPI Victoria)
Stocking rate assumptions As the native pasture paddock (Paddock B) in this demonstration did not represent a true control paddock or starting carrying capacity, a starting point of 5 DSE/ha was used. This was assumed to be the carrying capacity of the Old phalaris (Paddock A) if nothing was done or ‘business as usual’.
It was also assumed the old phalaris pasture did not lose any grazing in the fi rst year, whereas the new phalaris (Paddock C) was assumed to have only run half (2.5 DSE/ha) in the fi rst year. Potential stocking rates were estimated at 10 DSE/ha for the old phalaris and 13 DSE/ha for the new phalaris.
What it meansBased on these costs, returns and assumptions outlined above, the cumulative net cash fl ows for the Creightons Creek demonstration site for rejuvenating pasture (Paddock A) and establishing pasture (Paddock C) are shown in Figure 3 (page 8). The fertiliser costs for the old phalaris paddock were costed at requirements to achieve targets so potash costs were lower.
This shows the old phalaris pasture had a 3.5 year payback period compared to 5 years for the new phalaris pasture. The pasture that was re-sown to phalaris (Paddock C) was high in nutrients which reduced fertiliser costs in the establishment phase, and therefore the length of the payback period.
Net Present Value (NPV)Cash fl ows provide a guide as to whether you can afford to invest in an improvement, but not whether the investment is worthwhile. Net Present Value (NPV) is a measure of the value of all the income generated by the investment over a set period, less the extra costs of the improvements, all discounted to the present. This value includes the salvage or depreciated value of any capital investments (such as livestock and pasture improvements) at the end of the time period. Ten years is common for pasture improvement investments. NPV potentially provides another means of comparing the value of different pasture improvements to other farm or off farm investments. Similarly, Return on Capital provides a means of comparing investment returns.
Case study
Creightons Creek Supporting Site, North East Victoria8 www.evergraze.com.au
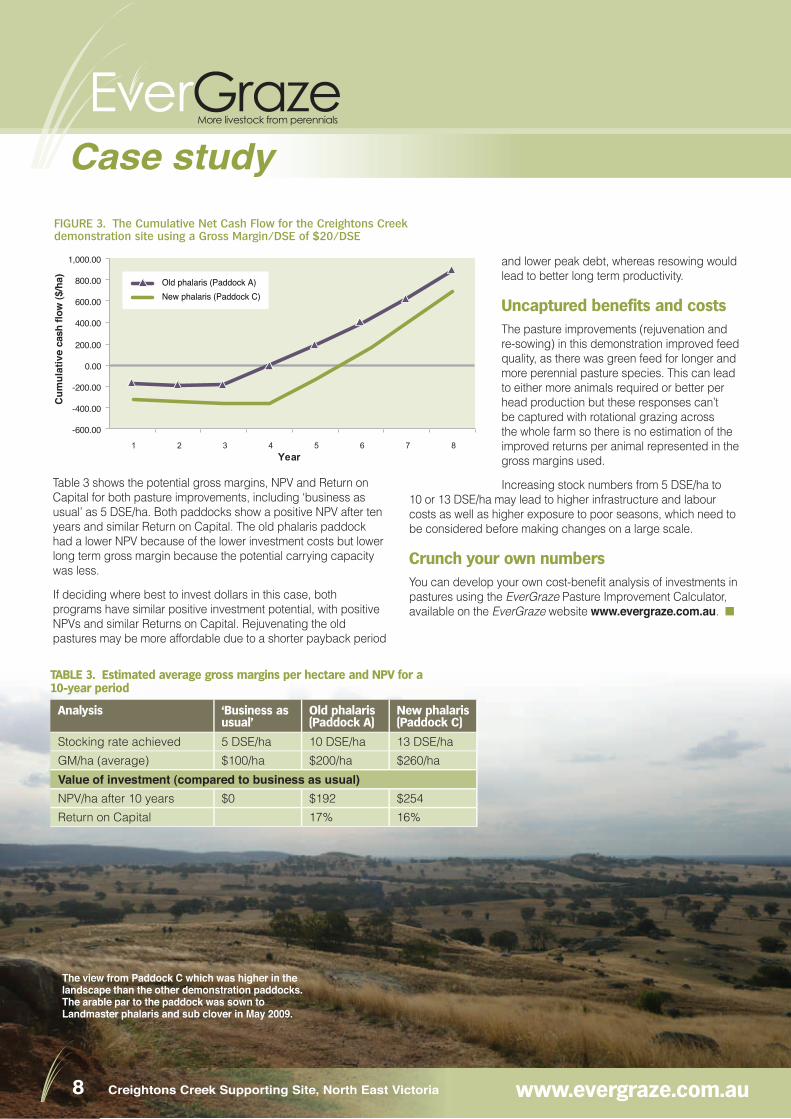
Table 3 shows the potential gross margins, NPV and Return on Capital for both pasture improvements, including ‘business as usual’ as 5 DSE/ha. Both paddocks show a positive NPV after ten years and similar Return on Capital. The old phalaris paddock had a lower NPV because of the lower investment costs but lower long term gross margin because the potential carrying capacity was less.
If deciding where best to invest dollars in this case, both programs have similar positive investment potential, with positive NPVs and similar Returns on Capital. Rejuvenating the old pastures may be more affordable due to a shorter payback period
and lower peak debt, whereas resowing would lead to better long term productivity.
Uncaptured benefits and costsThe pasture improvements (rejuvenation and re-sowing) in this demonstration improved feed quality, as there was green feed for longer and more perennial pasture species. This can lead to either more animals required or better per head production but these responses can’t be captured with rotational grazing across the whole farm so there is no estimation of the improved returns per animal represented in the gross margins used.
Increasing stock numbers from 5 DSE/ha to 10 or 13 DSE/ha may lead to higher infrastructure and labour costs as well as higher exposure to poor seasons, which need to be considered before making changes on a large scale.
Crunch your own numbersYou can develop your own cost-benefi t analysis of investments in pastures using the EverGraze Pasture Improvement Calculator, available on the EverGraze website www.evergraze.com.au. ■
FIGURE 3. The Cumulative Net Cash Flow for the Creightons Creek demonstration site using a Gross Margin/DSE of $20/DSE
-600.00
-400.00
-200.00
0.00
200.00
400.00
600.00
800.00
1,000.00
1 2 3 4 5 6 7 8Year
Cum
ulat
ive
cash
flow
($/h
a) Old phalaris (Paddock A)New phalaris (Paddock C)
The view from Paddock C which was higher in the landscape than the other demonstration paddocks. The arable par to the paddock was sown to Landmaster phalaris and sub clover in May 2009.
TABLE 3. Estimated average gross margins per hectare and NPV for a 10-year period
Analysis ‘Business as usual’
Old phalaris(Paddock A)
New phalaris(Paddock C)
Stocking rate achieved 5 DSE/ha 10 DSE/ha 13 DSE/ha
GM/ha (average) $100/ha $200/ha $260/ha
Value of investment (compared to business as usual)NPV/ha after 10 years $0 $192 $254
Return on Capital 17% 16%