morbidity - government of saskatchewan/media/files/health...for females, the top two icd chapter...
TRANSCRIPT

C h a p t e r C o n t e n t s
K e y F i n d i n g s 1
I n t r o d u c t i o n 1
H e a l t h -A d j u s t e d L i f e E x p e c t a n c y
2
A l l - C a u s e M o r -b i d i t y
3
M o r b i d i t y b y I C D C h a p t e r s
6
S e l f - R e p o r t e d H e a l t h S t a t u s
24
D e f i n i t i o n s 28
D a t a S o u r c e s 29
R e f e r e n c e s 29
Key Fi n d i n g s
M o r b i d i t y
S a s k a t c h e w a n H e a l t h
I n t ro d u c t i o n
This chapter describes morbidity (disease and illness) as measured by hospital sep-arations for the Saskatchewan population including average length of stay and hos-pitalizations by ICD chapters.
One of the most comprehensive and ac-cessible sources of morbidity information is the provincial hospital administrative database which records hospital separa-tions. A hospital separation occurs when a person leaves the hospital. It is the discharge or transfer from a hospital, or a death that occurs in a hospital and is recorded at the time of the discharge.
Hospitalization statistics provide infor-mation on conditions serious enough to
require stay in a hospital and are influ-enced by both availability of hospital beds and current practice regarding use of hospitals. In addition, individuals may be hospitalized more than once for the same condition.
Hospitalization represents the severe end of the illness spectrum and as result, does not include those with nonsevere illness.
Definitions and references are available at the end of the chapter.
The health-adjusted life expectancy (HALE) for Saskatchewan residents in-creased between 2000/02 and 2005/07 to 67.4 years for males and 70.3 years for females.
From 1995 to 2008 all cause hospitaliza-tion rates decreased significantly in Sas-katchewan. Both male and female rates decreased, with females having higher rates compared to males.
When examining the broad categories of disease and conditions grouped by the International Classification of Diseases (ICD) chapters over the 1995 to 2008 time period, the chapters with decreasing hospital separation rates included infec-tious and parasitic diseases, neoplasms, diseases of blood and blood-forming or-gans, mental disorders, nervous system disorders, circulatory system diseases, respiratory diseases, digestive system
diseases, genitourinary system diseases, pregnancy, childbirth and the puerperi-um, skin and subcutaneous tissue dis-eases, musculoskeletal diseases, congen-ital anomalies, perinatal conditions, ill-defined conditions, and injury and poi-soning. The only category that had rela-tively stable rates was endocrine, nutri-tional and metabolic diseases.
For males, the top two ICD chapter caus-es of hospital separations in 2008 were circulatory system diseases and digestive system diseases. For females, the top two ICD chapter causes of hospital sepa-rations in 2008 were pregnancy, child-birth and conditions of the puerperium, and digestive system diseases.
Canadian Community Health Survey (CCHS) respondents reporting good, very good or excellent health remained fairly constant at approximately 87 percent.

C h a p t e r
C o n t e n t s
K e y F i n d i n g s 1
I n t r o d u c t i o n 1
H e a l t h -
A d j u s t e d L i f e
E x p e c t a n c y
2
A l l - C a u s e M o r -
b i d i t y
3
M o r b i d i t y b y
I C D C h a p t e r s
6
S e l f - R e p o r t e d
H e a l t h S t a t u s
24
D e f i n i t i o n s 28
D a t a S o u r c e s 29
R e f e r e n c e s 29
Key Fin din gs
M o r b i d i t y
S a s k a t c h e w a n H e a l t h
In tro du ct io n
This chapter describes morbidity (disease
and illness) as measured by hospital sep-
arations for the Saskatchewan population
including average length of stay and hos-
pitalizations by ICD chapters.
One of the most comprehensive and ac-
cessible sources of morbidity information
is the provincial hospital administrative
database which records hospital separa-
tions. A hospital separation occurs when
a person leaves the hospital. It is the
discharge or transfer from a hospital, or a
death that occurs in a hospital and is
recorded at the time of the discharge.
Hospitalization statistics provide infor-
mation on conditions serious enough to
require stay in a hospital and are influ-
enced by both availability of hospital beds
and current practice regarding use of
hospitals. In addition, individuals may
be hospitalized more than once for the
same condition.
Hospitalization represents the severe end
of the illness spectrum and as result,
does not include those with nonsevere
illness.
Definitions and references are available
at the end of the chapter.
The health-adjusted life expectancy
(HALE) for Saskatchewan residents in-
creased between 2000/02 and 2005/07
to 67.4 years for males and 70.3 years for
females.
From 1995 to 2008 all cause hospitaliza-
tion rates decreased significantly in Sas-
katchewan. Both male and female rates
decreased, with females having higher
rates compared to males.
When examining the broad categories of
disease and conditions grouped by the
International Classification of Diseases
(ICD) chapters over the 1995 to 2008
time period, the chapters with decreasing
hospital separation rates included infec-
tious and parasitic diseases, neoplasms,
diseases of blood and blood-forming or-
gans, mental disorders, nervous system
disorders, circulatory system diseases,
respiratory diseases, digestive system
diseases, genitourinary system diseases,
pregnancy, childbirth and the puerperi-
um, musculoskeletal diseases, congenital
anomalies, perinatal conditions, ill-
defined conditions, and injury and poi-
soning. The only category that had in-
creasing rates was diseases of the skin
and subcutaneous tissue.
For males, the top two ICD chapter caus-
es of hospital separations in 2008 were
circulatory system diseases and digestive
system diseases. For females, the top
two ICD chapter causes of hospital sepa-
rations in 2008 were pregnancy, child-
birth and conditions of the puerperium,
and digestive system diseases.
Canadian Community Health Survey
(CCHS) respondents reporting good, very
good or excellent health remained fairly
constant at approximately 87 percent.

Health-adjusted life expectancy (HALE) is the num-
ber of years in full health that an individual can
expect to live given the current morbidity and mor-
tality conditions. It is a summary measure of pop-
ulation health that combines mortality and mor-
bidity data into a single index (Statistics Canada,
2012).
HALE differs from life expectancy which is an esti-
mate of the number of years a person would be
expected to live, either from birth or from age 65
years, based on age and sex-specific mortality
rates for a given period, under the assumption that
these mortality rates would stay constant over
subsequent years (St-Arnaud, J et al., 2005).
As expected, for all years (2000/02 and 2005/07)
and categories (Canada, Saskatchewan, males and
females), life expectancy was significantly higher
than HALE (Figure 6.1).
Page 2 M o r b i d i t y
Heal th- adju s ted L i fe Expectan cy
HALE and Life Expectancy: At birth by Sex, Canada and Saskatchewan,
2000/02 and 2005/07
CA
N M
00/0
2
CA
N M
00/0
2
CA
N M
05/0
7
CA
N M
05/0
7
CA
N F
00/0
2
CA
N F
00/0
2
CA
N F
05/0
7
CA
N F
05/0
7
SK
M00/0
2
SK
M00/0
2
SK
M05/0
7
SK
M05/0
7
SK
F00/0
2
SK
F05/0
7 SK
F05/0
7
SK
F00/0
2
0
10
20
30
40
50
60
70
80
90
Health-adjusted life expectancy Life expectancy
Ag
e (
yrs)
Fig: 6.1
In 2000/02 and 2005/07, the HALE was signifi-
cantly higher for Canada than for Saskatchewan.
From 2000/02 to 2005/07, the HALE at birth in-
creased slightly for both Canada and Saskatche-
wan males and females (Figure 6.1). The increases
were significant for Canadian males and females
and also for Saskatchewan males.
The HALE at birth for Saskatchewan men was 67.4
years in 2005/07 and for Saskatchewan women
was 70.3 years, with a difference between the sex-
es of 2.9 years. The HALE at birth for Canadian
men was 68.9 years in 2005/07 and for Canadian
women was 71.2 years, with a difference between
the sexes of 2.3 years.

Page 3
Hospital separation reflects the upper limit of the
non-fatal disease severity continuum. Morbidity
analysis by all causes provides information on the
total numbers of hospital separations within a
population and is used to monitor diseases and
health status, and also to plan health services.
In 2010-11, Saskatchewan had the fourth highest
age-sex standardized all cause hospital separation
rate (10,897 per 100,000) for the Canadian prov-
inces and territories. (Figure 6.2)
The provinces or territories with the highest all-
cause rates were Nunavut, Northwest Territories
and Yukon, at 14,888, 14,404 and 11,309 per
100,000, respectively. The lowest all-cause rate
was in Ontario, with a rate of 6,958 per 100,000.
Of the three prairie provinces, Saskatchewan had
the highest all cause hospital separation rates fol-
lowed by Manitoba and Alberta.
In 2010-11, Saskatchewan all cause age-
standardized average length of hospital stay
(ALOS) was 6.5 days (Figure 6.3). During the same
time period, the all cause ALOS for Canada was
7.3 days. The highest ALOS was found in Manito-
ba and Nova Scotia, at 8.5 days, while Nunavut
had the lowest at 3.2 days.
Of the three prairie provinces, Manitoba had the
highest all cause ALOS followed by Alberta and
Saskatchewan.
Al l C aus e Mo rbid i ty
M o r b i d i t y
0
2000
4000
6000
8000
10000
12000
14000
16000
BC AB SK MB ON QC NB NS PE NF YT NW NU CAN
Age
-se
x st
and
ard
ize
d r
ate
pe
r 1
00
,00
0
Province/Territory
All Cause Hospitalization: Age-sex standardized Rate of Hospitalization, Provinces, Territories and Canada, 2010-11
Fig: 6.2
0
1
2
3
4
5
6
7
8
9
BC AB SK MB ON QC NB NS PE NF YT NW NU CAN
Age
sta
nd
ard
ize
d A
LOS
in d
ays
Province/Territory
All Cause Hospitalization: Age standardized Average Length of Stay (ALOS) in days, Provinces, Territories and Canada, 2010-11
Fig: 6.3

Page 4 M o r b i d i t y
Morbidity rates, represented as all cause hospitali-
zation, exhibited a significant downward trend over
the time period 1995-2008, declining 27 percent
from 14,956 per 100,00 in 1995 to 10,903 per
100,000 in 2008 (Figure 6.4).
As would be expected, rates of hospital separation
increased with age with the exception of the less
than one year age group which includes births.
The age-specific rates declined slightly in all
groups over the 14 year time period (Figure 6.5)
The highest rate of hospital separations was in
those aged 75 years and older at 42,178 per
100,000. The age-specific rate of this age group
was nearly twice that of the next highest rates, the
less than one year ( 23,137 per 100,000) and the
65 to 74 year age group (22,720 per 100,000).
In 2008, age-specific all-cause hospital separation
rates per 100,000 population were found for the
following age groups:
Less than 1 year 23,137.0
1-19 years 4,990.9
20-44 years 9,360.5
45-64 years 9,702.8
65-74 years 22,719.7
75+ years 42,178.1
Sex-specific hospital separation rates due to all
causes were greater in females than males for eve-
ry year from 1995 to 2008 and both decreased over
the time period (Figure 6.6). In 2008, the all cause
rate was 13,774.9 per 100,000 for females, and
10,7073.9 per 100,000 for males.
All Cause Hospitalization: Age-standardized Rate of
Hospital Separations in Saskatchewan, 1995 - 2008
0
2000
4000
6000
8000
10000
12000
14000
16000
1995 1996 1997 1998 1999 2000 2001 2002 2003 2004 2005 2006 2007 2008
Year
Ag
e-s
tan
dard
ized
Rate
per
100,0
00
Fig: 6.4
All-cause Hospitalization: Crude Rate of Hospital
Separations in Saskatchewan by Age Group, 1995 -
2008
0
10000
20000
30000
40000
50000
60000
1995 1997 1999 2001 2003 2005 2007
Year
Cru
de R
ate
per
100,0
00
<1
1-19
20-44
45-64
65-74
75+
Fig: 6.5
Fig: 6.6
Page 5 M o r b i d i t y
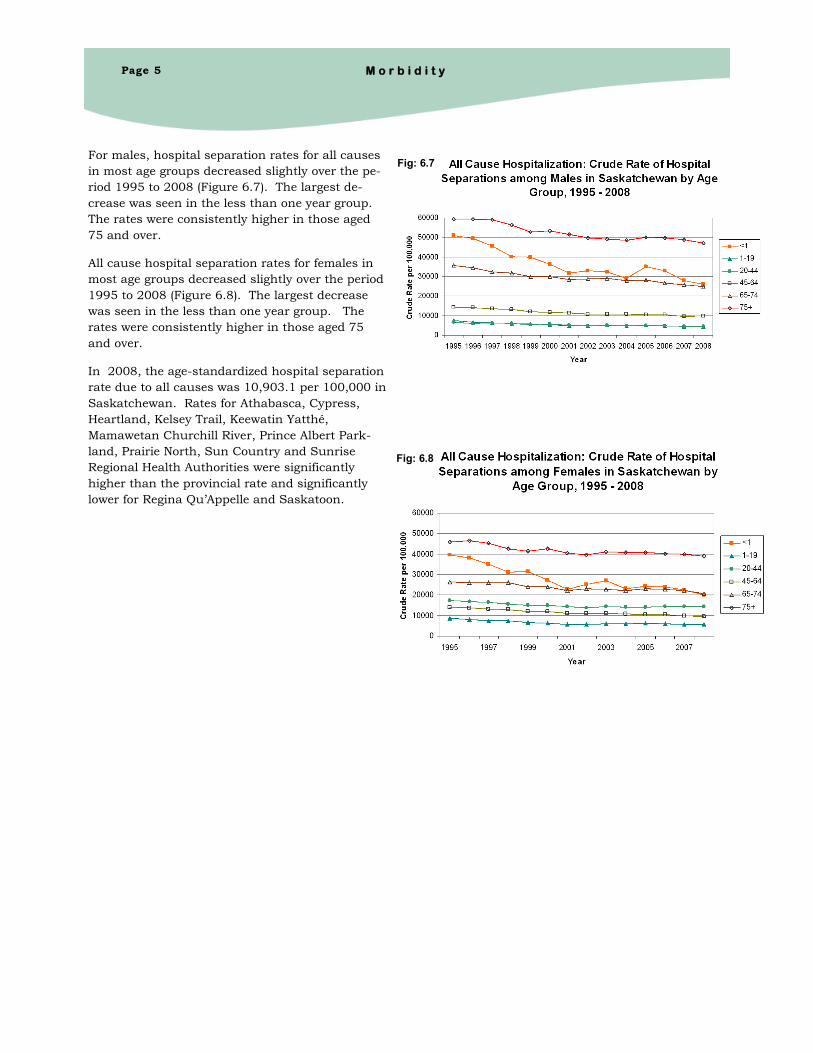
For males, hospital separation rates for all causes
in most age groups decreased slightly over the pe-
riod 1995 to 2008 (Figure 6.7). The largest de-
crease was seen in the less than one year group.
The rates were consistently higher in those aged
75 and over.
All cause hospital separation rates for females in
most age groups decreased slightly over the period
1995 to 2008 (Figure 6.8). The largest decrease
was seen in the less than one year group. The
rates were consistently higher in those aged 75
and over.
In 2008, the age-standardized hospital separation
rate due to all causes was 10,903.1 per 100,000 in
Saskatchewan. Rates for Athabasca, Cypress,
Heartland, Kelsey Trail, Keewatin Yatthé,
Mamawetan Churchill River, Prince Albert Park-
land, Prairie North, Sun Country and Sunrise
Regional Health Authorities were significantly
higher than the provincial rate and significantly
lower for Regina Qu’Appelle and Saskatoon.
Fig: 6.7
Fig: 6.8

Mo rbid i ty by ICD Chapters
Page 6 M o r b i d i t y
Morbidity analysis by International Classification
of Diseases (ICD) chapters enables an examination
of broad categories of illness in terms of related
conditions.
In 2008 the highest rates were caused by maternal
conditions, followed by digestive system diseases,
then respiratory system diseases and closely fol-
lowed by circulatory system diseases (Figure 6.9).
When analysis was stratified by sex, some differ-
ences were noted (Figure 6.10). After maternal
conditions, the highest hospital separations for
females were caused by digestive system diseases,
followed by circulatory system diseases and respir-
atory diseases. For males, the highest hospital
separations were due to circulatory system diseas-
es followed digestive system diseases and respira-
tory system diseases.
0
1,000
2,000
3,000
4,000
5,000
Ag
e-s
tan
dard
ized
Rate
per
100,0
00
Age-Standardized Hospital Separations Rate by ICD Chapters in Saskatchewan, 2008Fig: 6.9
0
1,000
2,000
3,000
4,000
5,000
Sex-s
pecif
ic R
ate
per
100,0
00
Crude Mortality Rate by ICD Chapters by Sex in Saskatchewan, 2009
Male
Female
Fig: 6.10

Page 7
Infectious and Parasitic Diseases: This ICD
chapter includes infections and diseases caused by
bacterial, viral, fungal, parasitic and other infec-
tious agents. Hospital separation rates due to in-
fectious and parasitic diseases decreased signifi-
cantly from 1995 to 2008 in Saskatchewan, from
261.6 per 100,000 in 1995 to 192.8 per 100,000 in
2008 (Figure 6.11).
Hospital separation rates varied across age groups
over the period 1995-2008, with the highest rate in
those aged less than one year. The hospital sepa-
ration rate of this age group varied between two
and five times the rate of the next highest group,
the 75 years and older age category, and decreased
61 percent during the fourteen year time period
(Figure 6.12). The age-specific rates for the re-
maining age groups remained relatively stable over
the same time period.
In 2008, the age-specific hospital separation rates
per 100,000 population due to infectious and para-
sitic diseases were found for the following age
groups:
Less than 1 year 1,125.7
1-19 years 212.6
20-44 years 97.4
45-64 years 155.7
65-74 years 319.2
75+ years 622.5
Sex-specific hospital separation rates decreased for
both sexes over the period 1995 to 2008 (Figure
6.13). Male and female rates were quite similar
and both exhibited fluctuations over the fourteen
years.
In 2008, the rate was 192.8 per 100,000 in Sas-
katchewan. Rates for Five Hills, Keewatin Yatthé,
Regina Qu'Appelle and Sunrise Regional Health
Authorities were significantly higher than the pro-
vincial rate and Heartland, Prairie North and Sas-
katoon were significantly lower.
Fig: 6.12
Fig: 6.13
M o r b i d i t y
Fig: 6.11
Page 8 M o r b i d i t y
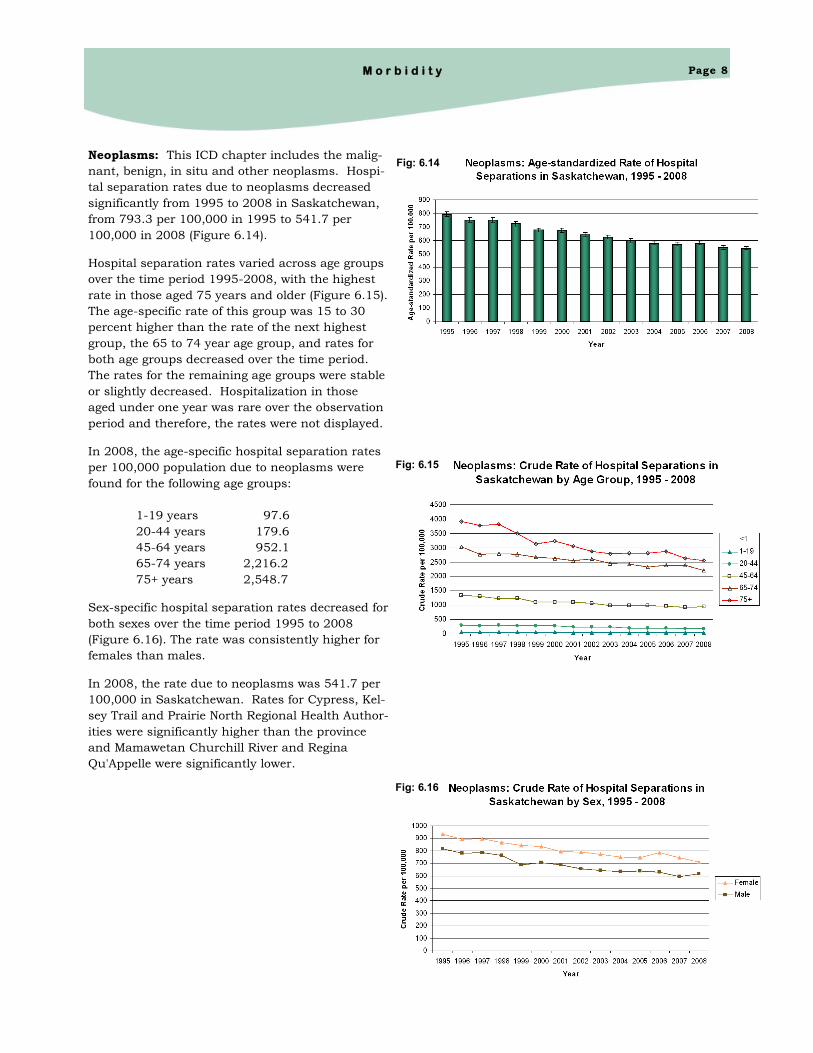
Neoplasms: This ICD chapter includes the malig-
nant, benign, in situ and other neoplasms. Hospi-
tal separation rates due to neoplasms decreased
significantly from 1995 to 2008 in Saskatchewan,
from 793.3 per 100,000 in 1995 to 541.7 per
100,000 in 2008 (Figure 6.14).
Hospital separation rates varied across age groups
over the time period 1995-2008, with the highest
rate in those aged 75 years and older (Figure 6.15).
The age-specific rate of this group was 15 to 30
percent higher than the rate of the next highest
group, the 65 to 74 year age group, and rates for
both age groups decreased over the time period.
The rates for the remaining age groups were stable
or slightly decreased. Hospitalization in those
aged under one year was rare over the observation
period and therefore, the rates were not displayed.
In 2008, the age-specific hospital separation rates
per 100,000 population due to neoplasms were
found for the following age groups:
1-19 years 97.6
20-44 years 179.6
45-64 years 952.1
65-74 years 2,216.2
75+ years 2,548.7
Sex-specific hospital separation rates decreased for
both sexes over the time period 1995 to 2008
(Figure 6.16). The rate was consistently higher for
females than males.
In 2008, the rate due to neoplasms was 541.7 per
100,000 in Saskatchewan. Rates for Cypress, Kel-
sey Trail and Prairie North Regional Health Author-
ities were significantly higher than the province
and Mamawetan Churchill River and Regina
Qu'Appelle were significantly lower.
Fig: 6.14
Fig: 6.15
Fig: 6.16

Page 9 M o r b i d i t y
Endocrine, Nutritional and Metabolic Diseases:
This ICD chapter includes diseases of the endo-
crine system such as the thyroid gland, pancreas
including diabetes, and other glands; nutritional
diseases such as malnutrition, obesity, and meta-
bolic disorders of proteins, fats and carbohydrates.
Hospital separation rates due to endocrine, nutri-
tional and metabolic diseases fluctuated from 1995
to 2008 in Saskatchewan (Figure 6.17). The rates
between 324.0 per 100,000 in 1995 and 312.2 per
100,000 in 2008 did not significantly differ.
Hospital separation rates varied across age groups
over the time period 1995-2008, with the highest
rate in those aged 75 years and older being over
one and a half times the rate of the next highest
group, the 65 to 74 year age group, which was two
times higher than the rate for the 45 to 64 year age
group (Figure 6.18). The age-specific rates for the
remaining age groups remained relatively stable
over the same time period.
In 2008, the age-specific hospital separation rates
per 100,000 population due to endocrine, nutri-
tional and metabolic disease were found for the
following age groups:
Less than 1 year 202.6
1-19 years 104.4
20-44 years 177.3
45-64 years 380.5
65-74 years 924.0
75+ years 1,554.3
Sex-specific hospital separation rates remained
stable for both sexes over the time period 1995 to
2008 (Figure 6.19). The rate was consistently
higher for females than males.
In 2008, the rate due to endocrine, nutritional and
metabolic disease was 312.2/100,000 in Saskatch-
ewan. Rates for Cypress, Kelsey Trail, Mamawetan
Churchill River, Prairie North, and Sunrise were
significantly higher than the provincial rate and
Five Hill and Saskatoon Regional Health Authori-
ties were significantly lower.
Fig: 6.17
Fig: 6.18
Fig: 6.19

Page 10 M o r b i d i t y
Diseases of Blood and Blood-forming Organs
and Immunity Disorders: This ICD chapter in-
cludes anemias, haemorrhagic conditions and im-
mune disorders. Hospital separation rates due to
diseases of blood and blood-forming organs de-
creased significantly from 1995 to 2008 in Sas-
katchewan. Although stable during 2001 to 2008,
a significant decrease in the rates was observed
between 1995 and 2000 so the rate significantly
decreased from 127.0 to 98.6 per 100,000 between
1995 and 2008 (Figure 6.20).
Hospital separation rates varied across age groups
over the period 1995-2008, with the highest rate in
those aged 75 years and older (Figure 6.21). The
age-specific rate of this group was just over double
the rate of the next highest group, the 65 to 74
year age group. The rates for all age groups have
remained fairly stable during the time period.
Hospitalization in those aged under 1 year was
rare over the observation period and, therefore, the
rates were not displayed.
In 2008, the age-specific hospital separation rates
per 100,000 population due to blood and immuni-
ty disorders were found for the following age
groups:
1-19 years 48.5
20-44 years 34.2
45-64 years 95.2
65-74 years 296.8
75+ years 673.6
Sex-specific hospital separation rates decreased for
both sexes over the time period 1995 to 2009
(Figure 6.22). In all years, the rate was slightly
higher for females than for males.
In 2008, the rate due to diseases of blood and
blood-forming organs & immunity disorders was
98.6/100,000 in Saskatchewan. Rates for Cy-
press, Keewatin Yatthé and Sunrise Regional
Health Authorities were statistically higher than
the provincial rate and Saskatoon had a signifi-
cantly lower rate.
Fig: 6.20
Fig: 6.21
Fig: 6.22
Page 11
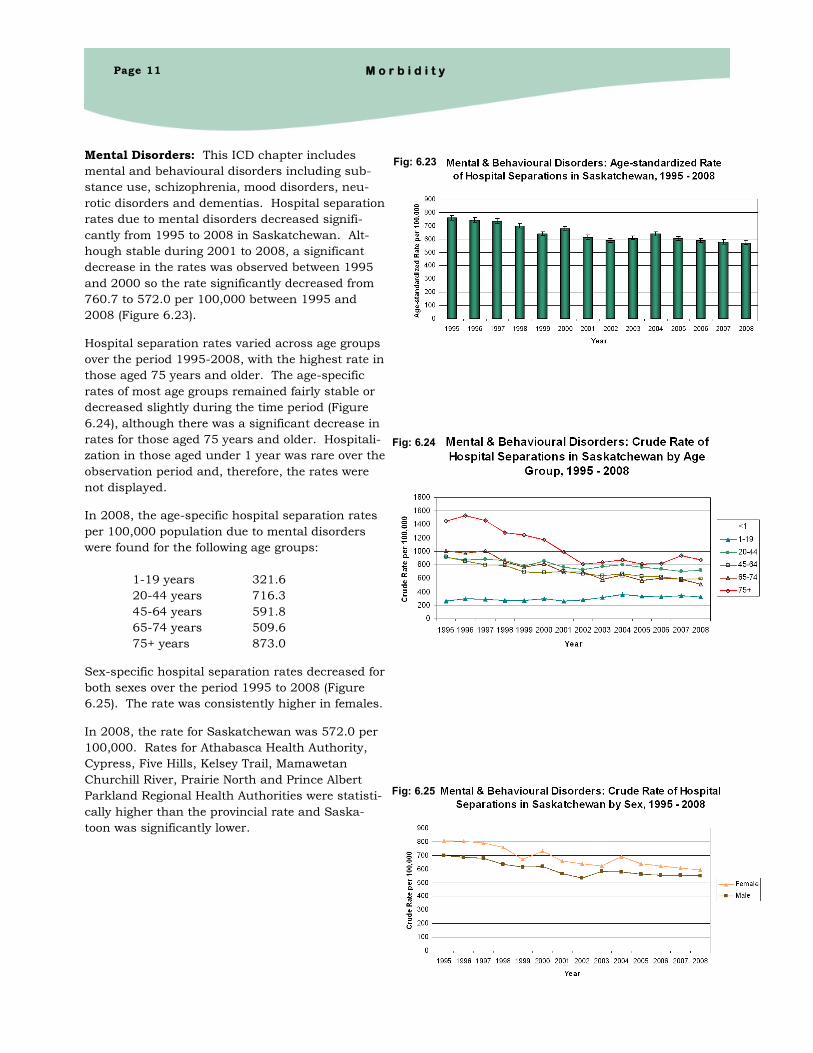
Mental Disorders: This ICD chapter includes
mental and behavioural disorders including sub-
stance use, schizophrenia, mood disorders, neu-
rotic disorders and dementias. Hospital separation
rates due to mental disorders decreased signifi-
cantly from 1995 to 2008 in Saskatchewan. Alt-
hough stable during 2001 to 2008, a significant
decrease in the rates was observed between 1995
and 2000 so the rate significantly decreased from
760.7 to 572.0 per 100,000 between 1995 and
2008 (Figure 6.23).
Hospital separation rates varied across age groups
over the period 1995-2008, with the highest rate in
those aged 75 years and older. The age-specific
rates of most age groups remained fairly stable or
decreased slightly during the time period (Figure
6.24), although there was a significant decrease in
rates for those aged 75 years and older. Hospitali-
zation in those aged under 1 year was rare over the
observation period and, therefore, the rates were
not displayed.
In 2008, the age-specific hospital separation rates
per 100,000 population due to mental disorders
were found for the following age groups:
1-19 years 321.6
20-44 years 716.3
45-64 years 591.8
65-74 years 509.6
75+ years 873.0
Sex-specific hospital separation rates decreased for
both sexes over the period 1995 to 2008 (Figure
6.25). The rate was consistently higher in females.
In 2008, the rate for Saskatchewan was 572.0 per
100,000. Rates for Athabasca Health Authority,
Cypress, Five Hills, Kelsey Trail, Mamawetan
Churchill River, Prairie North and Prince Albert
Parkland Regional Health Authorities were statisti-
cally higher than the provincial rate and Saska-
toon was significantly lower.
Fig: 6.25
Fig: 6.23
Fig: 6.24
M o r b i d i t y
Page 12
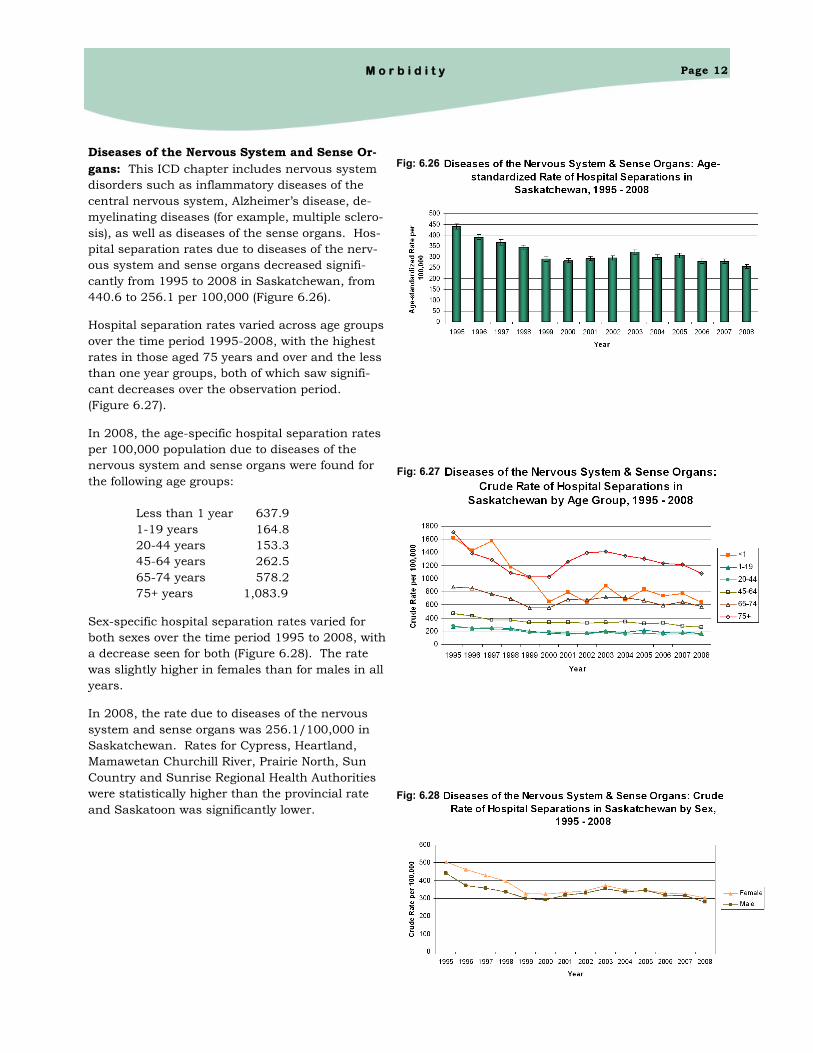
Diseases of the Nervous System and Sense Or-
gans: This ICD chapter includes nervous system
disorders such as inflammatory diseases of the
central nervous system, Alzheimer’s disease, de-
myelinating diseases (for example, multiple sclero-
sis), as well as diseases of the sense organs. Hos-
pital separation rates due to diseases of the nerv-
ous system and sense organs decreased signifi-
cantly from 1995 to 2008 in Saskatchewan, from
440.6 to 256.1 per 100,000 (Figure 6.26).
Hospital separation rates varied across age groups
over the time period 1995-2008, with the highest
rates in those aged 75 years and over and the less
than one year groups, both of which saw signifi-
cant decreases over the observation period.
(Figure 6.27).
In 2008, the age-specific hospital separation rates
per 100,000 population due to diseases of the
nervous system and sense organs were found for
the following age groups:
Less than 1 year 637.9
1-19 years 164.8
20-44 years 153.3
45-64 years 262.5
65-74 years 578.2
75+ years 1,083.9
Sex-specific hospital separation rates varied for
both sexes over the time period 1995 to 2008, with
a decrease seen for both (Figure 6.28). The rate
was slightly higher in females than for males in all
years.
In 2008, the rate due to diseases of the nervous
system and sense organs was 256.1/100,000 in
Saskatchewan. Rates for Cypress, Heartland,
Mamawetan Churchill River, Prairie North, Sun
Country and Sunrise Regional Health Authorities
were statistically higher than the provincial rate
and Saskatoon was significantly lower.
Fig: 6.26
Fig: 6.28
M o r b i d i t y
Fig: 6.27

Page 13
Diseases of the Circulatory System: This ICD
chapter includes conditions such as rheumatic
fever, hypertensive diseases, ischemic heart dis-
eases, and pulmonary heart disease. Hospital sep-
arations rates due to diseases of the circulatory
system decreased significantly from 1995 to 2008
in Saskatchewan, from 1751.8 to 1092.8 per
100,000 (Figure 6.29).
Hospital separation rates varied across age groups
over the time period 1995-2008. The highest rates
were in those aged 75 years and older which were
approximately two times that of the next highest
group, the 65 to 74 year age group and both age
groups decreased over the time period (Figure
6.30). Hospitalization in those aged under 1 year
was rare over the observation period and, there-
fore, the rates were not displayed.
In 2008, the age-specific hospital separation rates
per 100,000 population due to diseases of the cir-
culatory system were found for the following age
groups:
1-19 years 62.0
20-44 years 239.9
45-64 years 1,356.5
65-74 years 4,340.1
75+ years 9,048.4
Sex-specific hospital separation rates decreased
gradually for both sexes over the time period 1995
to 2008. The male rate was higher than female
rate in every year (Figure 6.31).
In 2008, the rate due to diseases of the circulatory
system was 1,092.8/100,000 in Saskatchewan.
Rates for Cypress, Prairie North, Sunrise and the
Northern Regional Health Authorities were signifi-
cantly higher than the provincial rate and Regina
Qu'Appelle and Saskatoon were statistically low-
er.
The three northern regions (Mamawetan Churchill
River, Keewatin Yatthé and the Athabasca Health
Authority) were combined due to small numbers
of separations in each region.
Diseases of the Circulatory System: Age-standardized
Rate of Hospital Separations in Saskatchewan, 1995 - 2008
0
200
400
600
800
1000
1200
1400
1600
1800
2000
1995 1996 1997 1998 1999 2000 2001 2002 2003 2004 2005 2006 2007 2008
Year
Ag
e-s
tan
dard
ized
Rate
per
100,0
00
Fig: 6.29
M o r b i d i t y
Diseases of the Circulatory System: Crude Rate of
Hospital Separations in Saskatchewan by Age Group,
1995 - 2008
0
2000
4000
6000
8000
10000
12000
14000
16000
1995 1996 1997 1998 1999 2000 2001 2002 2003 2004 2005 2006 2007 2008
Year
Cru
de R
ate
per
100,0
00
<1
1-19
20-44
45-64
65-74
75+
Fig: 6.30
Diseases of the Circulatory System: Crude Rate of
Hospital Separations in Saskatchewan by Sex, 1995 -
2008
0
500
1000
1500
2000
2500
1995 1996 1997 1998 1999 2000 2001 2002 2003 2004 2005 2006 2007 2008
Year
Cru
de R
ate
per
100,0
00
Female
Male
Fig: 6.31

Page 14
Diseases of the Respiratory System: This ICD
chapter includes the upper and lower respiratory
conditions such as asthma and COPD and acute
and chronic respiratory infections. Hospital sepa-
ration rates due to diseases of the respiratory sys-
tem decreased significantly from 1995 to 2008 in
Saskatchewan, especially between 1995 and 1997
and 1999 and 2001. Overall the rates decreased
from 1,969.8 to 1,097.0 per 100,000 (Figure 6.32).
Hospitalization rates for most age groups were sta-
ble over the time period 1995-2008, with the high-
est rate in those aged less than one year which
decreased over the time period. The age-specific
rate of this group was between 1.5 and 3.5 times
higher than the next highest group, the 75 year
and older age group (Figure 6.33).
In 2008, the age-specific hospital separation rates
per 100,000 population due to diseases of the res-
piratory system were found for the following age
groups:
Less than 1 year 7,977.5
1-19 years 1,143.2
20-44 years 336.1
45-64 years 715.0
65-74 years 2,387.1
75+ years 5,282.8
Sex-specific hospital separation rates decreased for
both females and males over the time period 1995
to 2008 (Figure 6.34). The rate was higher in
males than for females for all years.
In 2008, the rate due to diseases of the respiratory
system was 1,097.0/100,000 in Saskatchewan.
Rates for Cypress, Heartland, Kelsey Trail, Prince
Albert, Prairie North, Sunrise and the combined
three Northern Regional Health Authorities were
significantly higher than the provincial rate and
only Saskatoon was significantly lower.
Diseases of the Respiratory System: Crude Rate of Hospital Separations
in Saskatchewan by Sex, 1995 - 2008
0
500
1000
1500
2000
2500
1995 1996 1997 1998 1999 2000 2001 2002 2003 2004 2005 2006 2007 2008
Year
Cru
de R
ate
per
100,0
00
Female
Male
Fig: 6.34
M o r b i d i t y
Diseases of the Respiratory System: Age-standardized Rate of Hospital
Separations in Saskatchewan, 1995 - 2008
0
500
1000
1500
2000
2500
1995 1996 1997 1998 1999 2000 2001 2002 2003 2004 2005 2006 2007 2008
Year
Cru
de R
ate
per
100,0
00
Fig: 6.32
Diseases of the Respiratory System: Crude Rate of Hospital Separations
in Saskatchewan by Age Group, 1995 - 2008
0
5000
10000
15000
20000
25000
30000
1995 1996 1997 1998 1999 2000 2001 2002 2003 2004 2005 2006 2007 2008
Year
Cru
de R
ate
per
100,0
00
<1
1-19
20-44
45-64
65-74
75+
Fig: 6.33

Page 15
Diseases of the Digestive System: This ICD
chapter includes diseases and disorders of the
teeth, stomach, appendix, intestines, liver and oth-
er digestive system components. Hospital separa-
tion rates due to diseases of the digestive system
decreased significantly from 1995 to 2008 in Sas-
katchewan, from 1,829.0 per 100,000 in 1995 to
1,262.0 per 100,000 in 2008 (Figure 6.35).
Hospital separation rates varied across age groups
over the time period 1995-2008, with the highest
rates in those aged 75 years and older and was
approximately 25 percent to 50 percent higher
than the next highest rates in the 65 to 74 year
and less than one year age groups (Figure 6.36).
The rates decreased in all these categories during
the time period.
In 2008, the age-specific hospital separation rates
per 100,000 due to diseases of the digestive system
were found for the following age groups:
Less than 1 year 2,108.8
1-19 years 584.3
20-44 years 958.5
45-64 years 1,442.0
65-74 years 2,756.7
75+ years 4,623.3
Sex-specific hospital separation rates decreased
slightly over the time period 1995 to 2008 (Figure
6.37). The rate was similar for the sexes for most
years, with females slightly higher in each year.
In 2008, the rate due to diseases of the digestive
system was 1,262.0 per 100,000 in Saskatchewan.
Rates for Athabasca Health Authority, Cypress,
Five Hills, Heartland, Kelsey Trail, Mamawetan
Churchill River, Prairie North, Sun Country, and
Sunrise Health Regional Health Authorities were
statistically higher than the provincial rate and
Prince Albert Parkland and Saskatoon had lower
rates.
Diseases of the Digestive System: Crude Rate of Hospital
Separations in Saskatchewan by Sex, 1995 - 2008
0
500
1000
1500
2000
2500
1995 1996 1997 1998 1999 2000 2001 2002 2003 2004 2005 2006 2007 2008
Year
Cru
de R
ate
per
100,0
00
Female
Male
Fig: 6.37
Diseases of the Digestive System: Age-standardized Rate
of Hospital Separations in Saskatchewan, 1995 - 2008
0
200
400
600
800
1000
1200
1400
1600
1800
2000
1995 1996 1997 1998 1999 2000 2001 2002 2003 2004 2005 2006 2007 2008
Year
Ag
e-s
tan
dard
ized
Rate
per
100,0
00
Fig: 6.35
Diseases of the Digestive System: Crude Rate of
Hospital Separations in Saskatchewan by Age
Group, 1995 - 2008
0
1000
2000
3000
4000
5000
6000
7000
1995 1996 1997 1998 1999 2000 2001 2002 2003 2004 2005 2006 2007 2008
Year
Cru
de R
ate
per
100,0
00
<1
1-19
20-44
45-64
65-74
75+
Fig: 6.36
M o r b i d i t y

Page 16
Diseases of the Genitourinary System: This ICD
chapter includes diseases of the urinary system,
genital organs and breasts. Hospital separation
rates due to diseases of the genitourinary system
decreased significantly from 1995 to 2008 in Sas-
katchewan, from 988.3 per 100,000 in 1995 to
568.7 per 100,000 in 2008 (Figure 6.38).
Hospital separation rates varied across age groups
over the time period 1995-2008, with the highest
rate seen in those aged 75 years and older and the
rate of this group was approximately one and a
half times the next highest rate, the 65 to 74 year
age group. The rates decreased in all age groups
other than the less than one year old which dis-
played an increase (Figure 6.39).
In 2008, the age-specific hospital separation rates
per 100,000 due to diseases of the genitourinary
system were found for the following age groups:
Less than 1 year 915.6
1-19 years 160.2
20-44 years 470.6
45-64 years 744.9
65-74 years 1,250.2
75+ years 1,918.6
Sex-specific hospital separation rates decreased
over the time period 1995 to 2008 (Figure 6.40).
The rate was higher for females than for males for
every year.
In 2008, the age-standardized hospital separation
rate due to diseases of the genitourinary system
was 568.7 per 100,000 in Saskatchewan. Rates
for Cypress, Heartland, Keewatin Yatthé, Mamawe-
tan Churchill River, Prairie North, Sun Country
and Sunrise Regional Health Authorities were sig-
nificantly higher than the provincial rate and
Prince Albert Parkland, Regina Qu'Appelle and
Saskatoon were significantly lower.
Diseases of the Genitourinary System: Crude Rate
of Hospital Separations in Saskatchewan by Age
Group, 1995 - 2008
0
500
1000
1500
2000
2500
3000
1995 1996 1997 1998 1999 2000 2001 2002 2003 2004 2005 2006 2007 2008
Year
Cru
de R
ate
per
100,0
00
<1
1-19
20-44
45-64
65-74
75+
Diseases of the Genitourinary System: Crude Rate of
Hospital Separations in Saskatchewan by Sex, 1995 - 2008
0
200
400
600
800
1000
1200
1400
1995 1996 1997 1998 1999 2000 2001 2002 2003 2004 2005 2006 2007 2008
Year
Cru
de R
ate
per
100,0
00
Female
Male
Fig: 6.40
M o r b i d i t y
Diseases of the Genitourinary System: Age-standardized
Rate of Hospital Separations in Saskatchewan, 1995 - 2008
0
200
400
600
800
1000
1200
1995 1996 1997 1998 1999 2000 2001 2002 2003 2004 2005 2006 2007 2008
Year
Ag
e-s
tan
dard
ized
Rate
per
100,0
00
Fig: 6.38
Fig: 6.39

Page 17
Pregnancy, Childbirth and the Puerperium: Age-
standardized Rate of Hospital Separations among
Females in Saskatchewan, 1995 - 2008
0
1000
2000
3000
4000
5000
6000
7000
1995 1996 1997 1998 1999 2000 2001 2002 2003 2004 2005 2006 2007 2008
Year
Ag
e-s
tan
dard
ized
Rate
per
100,0
00
Fig: 6.41 Diseases of Pregnancy, Childbirth, and the Pu-
erperium: This ICD Chapter includes pregnancy,
childbirth and conditions arising during six weeks
post-partum (puerperium). Hospital separation
rate dues to diseases of pregnancy, childbirth and
the puerperium decreased slightly from 1995 to
2008, from 5,863.4 per 100,000 in 1995 to 5,144.5
per 100,000 in 2008 (Figure 6.41).
Hospital separation rates varied across age groups
over the time period 1995-2008, with the highest
rates in the 20 to 29 year age group. Rates de-
clined by 26.0 percent and 22.9 percent in the 10
to 19 and 20 to 29 year age groups, respectively. In
contrast, the rate in the 30 to 39 year age group
increased by 15.1 percent during the same time
period, while the rate in the 40 to 49 year age
group remained fairly stable. (Figure 6.42). Rates
for women aged 50 to 59 years are not reported
due to small numbers.
In 2008, the age-specific hospital separation rates
per 100,000 due to pregnancy, childbirth and pu-
erperium were found for the following age groups:
10-19 years 2,277.9
20-29 years 11,691.5
30-39 years 7,618.6
40-49 years 337.4
The annual crude rate for females in Saskatche-
wan decreased by 19.9 percent from 1995 to 2008
(Figure 6.43).
In 2008, the age-standardized hospital separation
rate due to pregnancy, childbirth and the puerperi-
um was 5,144.5 per 100,000. Rates for Athabasca
Health Authority and Keewatin Yatthé, Mamawe-
tan Churchill River, Prince Albert Parkland, and
Prairie North Regional Health Authorities were sig-
nificantly higher than the provincial rate and Cy-
press, Five Hills, Sunrise and Saskatoon Health
Regions were significantly lower.
.
Pregnancy, Childbirth and the Puerperium: Crude
Rate of Hospital Separations among Females in
Saskatchewan by Age Group, 1995 - 2008
0
2000
4000
6000
8000
10000
12000
14000
16000
1995 1996 1997 1998 1999 2000 2001 2002 2003 2004 2005 2006 2007 2008
Year
Cru
de R
ate
per
100,0
00
10-19
20-29
30-39
40-49
50-59
Fig: 6.42
M o r b i d i t y
Pregnancy, Childbirth and the Puerperium: Crude Rate of
Hospital Separations among Females in Saskatchewan,
1995 - 2008
0
1000
2000
3000
4000
5000
6000
1995 1996 1997 1998 1999 2000 2001 2002 2003 2004 2005 2006 2007 2008
Year
Cru
de R
ate
per
100,0
00
Female
Fig: 6.43

Page 18
Diseases of the Skin and Subcutaneous Tissue:
This ICD chapter includes diseases of the skin and
subcutaneous tissue. Hospitalization rates due to
of the skin and subcutaneous tissue decreased
slightly, but significantly, from 1995 to 2008 in
Saskatchewan, from 180.9 per 100,000 in 1995 to
166.2 per 100,000 in 2008 (Figure 6.44).
Hospital separations rates varied across age
groups over the time period 1995-2008, with the
highest rate in the less than one year and 75 and
older age groups. The lowest rates were in the one
to 19 years and the 20 to 44 year age groups.
(Figure 6.45).
In 2008, the age-specific hospital rates per
100,000 due to diseases of the skin and subcuta-
neous tissue were found for the following age
groups:
Less than 1 year 577.9
1-19 years 107.5
20-44 years 136.5
45-64 years 156.4
65-74 years 271.6
75+ years 526.6
Sex-specific hospital separation rates fluctuated
over the time period 1995 to 2008 (Figure 6.46).
The rate was slightly higher for males than for
males in every year, except in 2001.
In 2008, the age-standardized hospital separation
rate due to diseases of the skin and subcutaneous
tissue was 166.2 per 100,000 in Saskatchewan.
Rates for Keewatin Yatthé, Mamawetan Churchill
River, and Sunrise Regional Health Authorities
were significantly higher than the provincial rate
and Regina Qu'Appelle and Saskatoon were signifi-
cantly lower.
Diseases of the Skin and Subcutaneous Tissue: Crude
Rate of Hospital Separations in Saskatchewan by Sex,
1995 - 2008
0
50
100
150
200
250
1995 1996 1997 1998 1999 2000 2001 2002 2003 2004 2005 2006 2007 2008
Year
Cru
de R
ate
per
100,0
00
Female
Male
Fig: 6.46
M o r b i d i t y
Diseases of the Skin and Subcutaneous Tissue: Age-
standardized Rate of Hospital Separations in
Saskatchewan, 1995 - 2008
0
50
100
150
200
250
1995 1996 1997 1998 1999 2000 2001 2002 2003 2004 2005 2006 2007 2008
Year
Ag
e-s
tan
dard
ized
Rate
per
100,0
00
Fig: 6.44
Diseases of the Skin and Subcutaneous Tissue:
Crude Rate of Hospital Separations in
Saskatchewan by Age Group, 1995 - 2008
0
100
200
300
400
500
600
700
800
1995 1996 1997 1998 1999 2000 2001 2002 2003 2004 2005 2006 2007 2008
Year
Cru
de R
ate
per
100,0
00
<1
1-19
20-44
45-64
65-74
75+
Fig: 6.45

Page 19
Diseases of the Musculoskeletal System & Connective
Tissue: Age-standardized Rate of Hospital Separations in
Saskatchewan, 1995 - 2008
0
100
200
300
400
500
600
700
800
1995 1996 1997 1998 1999 2000 2001 2002 2003 2004 2005 2006 2007 2008
Year
Ag
e-s
tan
dard
ized
Rate
per
100,0
00
Fig: 6.47 Diseases of the Musculoskeletal System: This
ICD chapter includes the arthropathies, soft tissue
disorders, and osteopathies. Hospitalization rates
due to diseases of the musculoskeletal system and
connective tissue decreased significantly from
1995 to 2008 in Saskatchewan, from 721.9 in
1995 to 483.0 per 100,000 in 2008 (Figure 6.47).
Hospital separation rates varied across age groups
over the time period 1995-2008, with the highest
rate in those aged 75 years and older. The age-
specific rate of this age group was approximately
22 percent higher than the next highest rate which
was the 65 to 74 year age group (Figure 6.48).
Rates were not displayed for those under one years
due to small numbers.
In 2008, the age-specific hospital rates per
100,000 due to diseases of the musculoskeletal
system were found for the following age groups:
1-19 years 15.0
20-44 years 209.8
45-64 years 698.6
65-74 years 1,873.2
75+ years 2,414.5
Sex-specific hospital separation rates decreased
over the time period 1995 to 2008 (Figure 6.49).
The rates were higher for females than for males in
every year.
In 2008, the age-standardized hospital separation
rate due to diseases of the musculoskeletal system
was 483.0/100,000 in Saskatchewan. Rates for
Cypress, Sun Country and Sunrise Regional
Health Authorities were significantly higher than
the provincial rate and Prairie North and Saska-
toon were significantly lower.
Diseases of the Musculoskeletal System &
Connective Tissue: Crude Rate of Hospital
Separations in Saskatchewan by Age Group, 1995 -
2008
0
500
1000
1500
2000
2500
3000
1995 1996 1997 1998 1999 2000 2001 2002 2003 2004 2005 2006 2007 2008
Year
Cru
de R
ate
per
100,0
00
<1
1-19
20-44
45-64
65-74
75+
Fig: 6.48
M o r b i d i t y
Diseases of the Musculoskeletal System & Connective
Tissue: Crude Rate of Hospital Separations in
Saskatchewan by Sex, 1995 - 2008
0
100
200
300
400
500
600
700
800
900
1995 1996 1997 1998 1999 2000 2001 2002 2003 2004 2005 2006 2007 2008
Year
Cru
de R
ate
per
100,0
00
Female
Male
Fig: 6.49

Page 20
Congenital Anomalies: This ICD chapter in-
cludes congenital malformations and deformations,
and chromosomal abnormalities. There appeared
to be a significantly decreasing trend in hospitali-
zation rates due to congenital anomalies from 1995
to 2008 in Saskatchewan, from 107.4 in 1995 to
74.7 per 100,000 in 2008 (Figure 6.50).
Hospital separation rates varied by age group over
the time period 1995-2008, with the highest rate
in the less than one age group, which was over 47
times the rate for the one to 19 year age group,
which was over four times higher than the next
two age groups, 20 to 44 years and 45 to 64 years
(Figure 6.51 and 6.52). The remaining age groups
were not displayed due to small numbers.
In 2008, the age-specific hospital separation rates
due to congenital anomalies were found for the
following age groups:
Less than 1 year 3166.9
1-19 years 67.8
20-44 years 16.2
45-64 years 16.8
Figure 6.51 displays age groups from birth to 19
years. Only the age groups between 1-64 years are
displayed in Figure 6.52. Age groups for 65 years
and over were not displayed due to small numbers.
Sex-specific hospital separation rates exhibited a
decline over the time period 1995 to 2008 with
some fluctuations (Figure 6.53). The rate was
higher for males than for females for all the years.
In 2008, the age-standardized hospital separation
rate due to congenital anomalies was
74.7/100,000 in Saskatchewan. Rates for the Five
Hills Regional Health Authority was significantly
lower than the provincial rate.
M o r b i d i t y
Congenital Anomalies: Crude Rate of Hospital
Separations in Saskatchewan by Age Group, 1995 -
2008
0
20
40
60
80
100
120
1995 1996 1997 1998 1999 2000 2001 2002 2003 2004 2005 2006 2007 2008
Year
Cru
de R
ate
per
100,0
00
<1
1-19
20-44
45-64
65-74
75+
Fig: 6.52
Congenital Anomalies: Crude Rate of Hospital Separations in
Saskatchewan by Sex, 1995 - 2008
0
20
40
60
80
100
120
140
1995 1996 1997 1998 1999 2000 2001 2002 2003 2004 2005 2006 2007 2008
Year
Cru
de R
ate
per
100,0
00
Female
Male
Fig: 6.53
Congenital Anomalies: Age-standardized Rate of Hospital
Separations in Saskatchewan, 1995 - 2008
0
20
40
60
80
100
120
1995 1996 1997 1998 1999 2000 2001 2002 2003 2004 2005 2006 2007 2008
Year
Ag
e-s
tan
dard
ized
Rate
per
100,0
00
Fig: 6.50
0
1000
2000
3000
4000
5000
6000
1995 1996 1997 1998 1999 2000 2001 2002 2003 2004 2005 2006 2007 2008
Cru
de R
ate
per
100,0
00
Year
Congenital Anomalies: Crude Rate of Hospital Separations among Children and Youth Aged 0 to 19 Years in
Saskatchewan by Age Group, 1995 - 2008
<1
1 - 9
10 - 19
Fig: 6.51

Page 21 M o r b i d i t y
Certain Conditions Originating in the Perinatal Period:
Crude Rate of Hospital Separations in Saskatchewan by
Sex, 1995 - 2008
0
50
100
150
200
250
300
350
400
450
500
1995 1996 1997 1998 1999 2000 2001 2002 2003 2004 2005 2006 2007 2008
Year
Cru
de R
ate
per
100,0
00
Female
Male
Fig: 6.56
Certain Conditions Originating in the Perinatal
Period: This ICD chapter includes birth trauma,
complications of pregnancy, labour and delivery,
and perinatal infections. Hospitalization rates due
to certain conditions originating in the perinatal
period decreased significantly from 1995 to 2008
in Saskatchewan, from 473.9 per 100,000 in 1995
to 331.6 per 100,000 in 2008 (Figure 6.54).
Hospital separation rates were displayed for the
under one year of age group which decreased with
some fluctuations from 1995 through 2008 (Figure
6.55). The remaining age groups had less than 20
separations per year for the time period 1995-
2008.
In 2008, the age-specific hospital separation rate
due to certain conditions originating in the perina-
tal period for the less than one year old group was
23,084.4 per 100,000.
Sex-specific separation rates decreased over the
time period 1995 to 2008 (Figure 6.56). The rate
was higher for females than for males in every
year.
In 2008, the age-standardized hospital separation
rate due to certain conditions originating in the
perinatal period was 331.6/100,000 in Saskatche-
wan. Rates for Five Hills, Regina Qu'Appelle and
Sunrise Regional Health Authorities were signifi-
cantly higher than the provincial rate and Cypress,
Keewatin Yatthé and Saskatoon Health Regions
were significantly lower.
Certain Conditions Originating in the Perinatal Period:
Age-standardized Rate of Hospital Separations in
Saskatchewan, 1995 - 2008
0
100
200
300
400
500
600
1995 1996 1997 1998 1999 2000 2001 2002 2003 2004 2005 2006 2007 2008
Year
Ag
e-s
tan
dard
ized
Rate
per
100,0
00
Fig: 6.54
Certain Conditions Originating in the Perinatal Period:
Crude Rate of Hospital Separations in Saskatchewan
by Age Group, 1995 - 2008
0
5000
10000
15000
20000
25000
30000
35000
1995 1996 1997 1998 1999 2000 2001 2002 2003 2004 2005 2006 2007 2008
Year
Cru
de R
ate
per
100,0
00
<1
1-19
20-44
45-64
65-74
75+
Fig: 6.55

Page 22
Ill-Defined Conditions: This ICD chapter in-
cludes symptoms, signs and abnormal clinical and
laboratory findings not elsewhere classified. Hos-
pitalization rates due to symptoms, signs and ill-
defined conditions decreased significantly from
1995 to 2008 in Saskatchewan, from 920.0 per
100,000 in 1995 to 692.7 per 100,000 in 2008
(Figure 6.57).
Hospital separation rates varied across age groups
over the time period 1995-2008. Rates were high-
est in the less than one year and 75 or older age
groups. The rates declined in all age groups, ex-
cept the 75 or older age group which experienced a
7.4 percent increase. The less than one year age
group experienced the greatest decline, with a de-
crease of 53.0 percent during this period (Figure
6.58).
In 2008, the age-specific hospital separation rates
per 100,000 population due to ill-defined condi-
tions were found for the following age groups:
Less than 1 year 1,831.1
1-19 years 349.3
20-44 years 392.0
45-64 years 683.3
65-74 years 1,653.4
75+ years 3,627.5
Sex-specific hospital separation rates decreased
slightly over the time period 1995 to 2008 (Figure
6.59). The rates were higher for females than for
males in every year.
In 2008, the age-standardized hospital separation
rate due to ill-defined conditions was 692.7 per
100,000 in Saskatchewan. Rates for Cypress, Kel-
sey Trail, Keewatin Yatthé, Mamawetan Churchill
River, Sun Country, and Sunrise Regional Health
Authorities were significantly higher than the pro-
vincial rate and Five Hills, Prince Albert Parkland,
Prairie North and Saskatoon were significantly low-
er.
Symptoms, Signs and Ill-defined Conditions: Age-
standardized Rate of Hospital Separations in
Saskatchewan, 1995 - 2008
0
100
200
300
400
500
600
700
800
900
1000
1995 1996 1997 1998 1999 2000 2001 2002 2003 2004 2005 2006 2007 2008
Year
Ag
e-s
tan
dard
ized
Rate
per
100,0
00
Fig: 6.57
M o r b i d i t y
Symptoms, Signs and Ill-defined Conditions: Crude
Rate of Hospital Separations in Saskatchewan by
Age Group, 1995 - 2008
0
500
1000
1500
2000
2500
3000
3500
4000
4500
1995 1996 1997 1998 1999 2000 2001 2002 2003 2004 2005 2006 2007 2008
Year
Cru
de R
ate
per
100,0
00
<1
1-19
20-44
45-64
65-74
75+
Fig: 6.58
Symptoms, Signs and Ill-defined Conditions: Crude Rate of
Hospital Separations in Saskatchewan by Sex, 1995 - 2008
0
200
400
600
800
1000
1200
1995 1996 1997 1998 1999 2000 2001 2002 2003 2004 2005 2006 2007 2008
Year
Cru
de R
ate
per
100,0
00
Female
Male
Fig: 6.59
Page 23
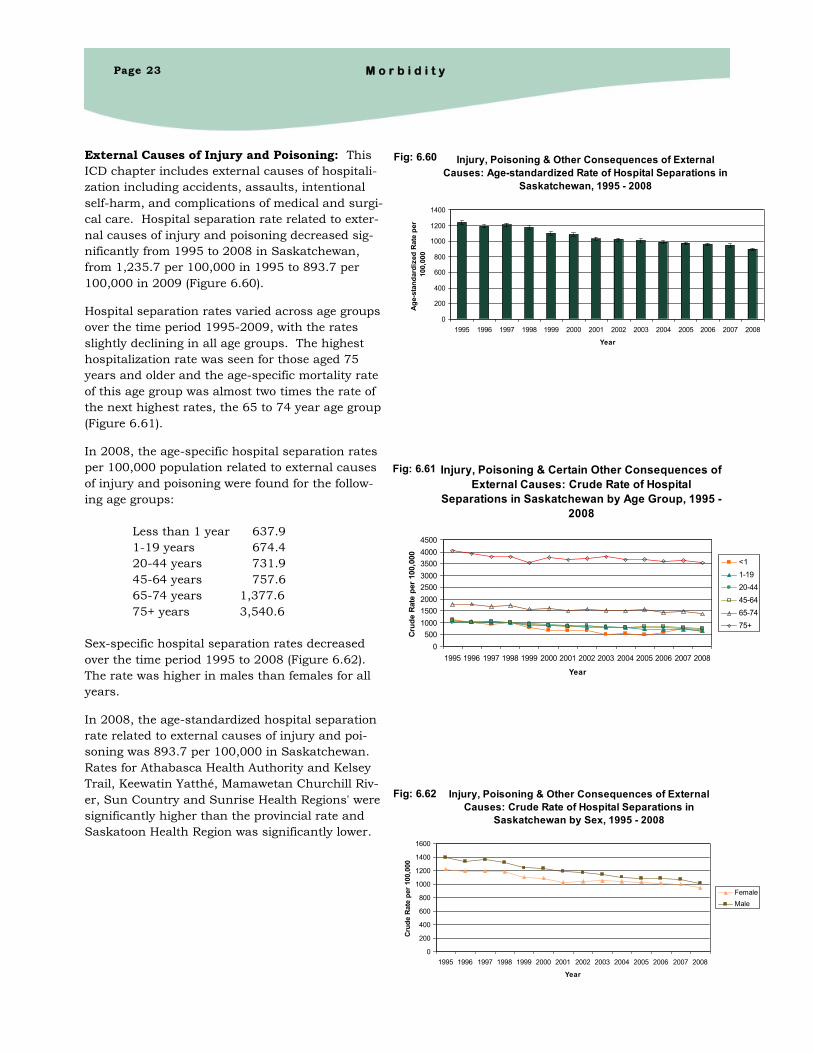
External Causes of Injury and Poisoning: This
ICD chapter includes external causes of hospitali-
zation including accidents, assaults, intentional
self-harm, and complications of medical and surgi-
cal care. Hospital separation rate related to exter-
nal causes of injury and poisoning decreased sig-
nificantly from 1995 to 2008 in Saskatchewan,
from 1,235.7 per 100,000 in 1995 to 893.7 per
100,000 in 2009 (Figure 6.60).
Hospital separation rates varied across age groups
over the time period 1995-2009, with the rates
slightly declining in all age groups. The highest
hospitalization rate was seen for those aged 75
years and older and the age-specific mortality rate
of this age group was almost two times the rate of
the next highest rates, the 65 to 74 year age group
(Figure 6.61).
In 2008, the age-specific hospital separation rates
per 100,000 population related to external causes
of injury and poisoning were found for the follow-
ing age groups:
Less than 1 year 637.9
1-19 years 674.4
20-44 years 731.9
45-64 years 757.6
65-74 years 1,377.6
75+ years 3,540.6
Sex-specific hospital separation rates decreased
over the time period 1995 to 2008 (Figure 6.62).
The rate was higher in males than females for all
years.
In 2008, the age-standardized hospital separation
rate related to external causes of injury and poi-
soning was 893.7 per 100,000 in Saskatchewan.
Rates for Athabasca Health Authority and Kelsey
Trail, Keewatin Yatthé, Mamawetan Churchill Riv-
er, Sun Country and Sunrise Health Regions' were
significantly higher than the provincial rate and
Saskatoon Health Region was significantly lower.
Injury, Poisoning & Other Consequences of External
Causes: Age-standardized Rate of Hospital Separations in
Saskatchewan, 1995 - 2008
0
200
400
600
800
1000
1200
1400
1995 1996 1997 1998 1999 2000 2001 2002 2003 2004 2005 2006 2007 2008
Year
Ag
e-s
tan
dard
ized
Rate
per
100,0
00
Fig: 6.60
Injury, Poisoning & Other Consequences of External
Causes: Crude Rate of Hospital Separations in
Saskatchewan by Sex, 1995 - 2008
0
200
400
600
800
1000
1200
1400
1600
1995 1996 1997 1998 1999 2000 2001 2002 2003 2004 2005 2006 2007 2008
Year
Cru
de R
ate
per
100,0
00
Female
Male
Fig: 6.62
Injury, Poisoning & Certain Other Consequences of
External Causes: Crude Rate of Hospital
Separations in Saskatchewan by Age Group, 1995 -
2008
0
500
1000
1500
2000
2500
3000
3500
4000
4500
1995 1996 1997 1998 1999 2000 2001 2002 2003 2004 2005 2006 2007 2008
Year
Cru
de R
ate
per
100,0
00
<1
1-19
20-44
45-64
65-74
75+
Fig: 6.61
M o r b i d i t y

Page 24 M o r b i d i t y
Sel f -Repor ted Heal th Self-rated health is used as a predictor of the over-
all health status of the population. The Canadian
Community Health Survey (CCHS) asks respond-
ents to rate his/her health as “excellent, very good,
good, fair or poor”.
The CCHS self-reported health indicators were as-
sessed; good, very good and excellent health, very
good and excellent health, and fair and poor
health. The indicator descriptions and detailed
findings are presented on page 25 with Figures
6.63 - 6.65 for good, very good and excellent
health, page 26 with Figures 6.66 - 6.68 for very
good and excellent health and page 27 with Fig-
ures 6.69 - 6.71 for fair and poor health.
The key findings are as follows:
In 2007/08, the percentages of Saskatchewan resi-
dents rating their health as “good, very good or
excellent”, “very good or excellent” and “fair or
poor” were similar to that found for Canada, and
all indicators remained fairly constant over the
survey time period from 2000/2001 to 2007/2008
(Figure 6.63, 6.64 and 6.65).
The age-specific percentages for the three age
groups, as well as, the detailed age analysis for
“good, very good and excellent health” indicated
that as age increases, ratings decreased for good,
very good and excellent health and a correspond-
ing increase in fair and poor health was seen
(Figure 6.64, 6.67, 6.70 and Table 6.1). The drop
in ratings began at age 40-49 years; however it
should be noted that over 30 percent of seniors
indicated that their health was “very good or excel-
lent” (Figure 6.64).
For all self rated health status indicators, male
and female percentages were similar and stayed
relatively constant over the survey period (Figure
6.65, 6.68 and 6.71).
Table 6-1: Age-specific percentages for self-rated health
status, 2007/08
Age (years) Good, Very
Good and
Excellent
Health (%)
Very Good and
Excellent
Health (%)
Fair and Poor
Health (%)
20-44 94.3 65.7 5.7
45-64 85.7 51.8 14.2
65+ 70.6 30.4 29.3

Page 25 M o r b i d i t y
Prevalence of self-rated good, very good and excellent health in all ages (12+
years), Canada and Saskatchewan, CCHS, 2000/01, 2003, 2005, 2007/2008.
0
10
20
30
40
50
60
70
80
90
100
CCHS year
Rate
, %
Canada 88.1 88.7 88.8 88.5
Saskatchewan 87.2 87.9 86.9 87.2
2000/01 2003 2005 2007/08
Prevalence of self-rated good, very good or excellent health in all ages (12+),
Saskatchewan, CCHS Cycles, 1.1 (2000/01), 2.1 (2003), 3.1 (2005), 4.1 and 5.1
(2007/2008).
0
20
40
60
80
100
Age group years by Survey years
Rate
, %
2000/01 94.3 93.8 93.8 92.9 94.8 92.4 92.0 89.6 87.4 83.6 79.5 77.8 71.5 62.1
2003 96.1 92.3 95.7 93.7 96.1 92.3 91.0 88.0 89.6 83.7 87.0 79.0 74.6 62.8
2005 95.7 94.8 94.9 93.3 91.5 94.2 90.5 89.2 86.1 84.3 77.4 81.3 72.6 62.2
2007/2008 91.3 93.4 94.6 95.6 95.1 93.8 91.9 86.3 87.6 86.7 79.6 78.7 75.7 63.3
12-
14
15-
19
20-
24
25-
29
30-
34
35-
39
40-
44
45-
49
50-
54
55-
59
60-
64
65-
69
70-
74 75+
Prevalence of self-rated good, very good and excellent health in 12+ year olds,
by Sex, Saskatchewan, CCHS Cycles, 1.1 (2000/01), 2.1 (2003), 3.1 (2005), 4.1
and 5.1 (2007/2008).
0
20
40
60
80
100
Sex by Year(s)
Rate
, %
Female 86.8 87.5 86.1 87.3
Male 87.7 88.2 87.8 87.2
2000/01 2003 2005 2007/2008
Self-rated good, very good and excellent health:
From 2000/01 to 2007/08, the proportion of
CCHS respondents (12 years and older) who re-
ported having good, very good or excellent health
remained fairly constant for Canada and Saskatch-
ewan. The Saskatchewan proportion remained
around 87 percent and the Canadian proportion
remained around 88 percent, with the difference
between Saskatchewan and Canada being signifi-
cant only for 2005 (Figure 6.63).
Self-reported proportions varied across age groups
over the survey time period. The proportions re-
mained relatively stable up to and including the
age group 35-39 years and then began to decline
with advancing age, with proportions falling to be-
low 80 percent in people aged 60 years and older
(Figure 6.64).
In 2007/08, the age-specific percentages of Sas-
katchewan residents that reported good, very good
or excellent health were found for the following age
groups:
30-34 years 95.1%
35-39 years 93.8%
40-44 years 91.9%
45-49 years 86.3%
50-54 years 87.6%
55-59 years 86.7%
60-64 years 79.6%
65-69 years 78.7%
70-74 years 75.7%
75+ years 63.3%
Sex-specific proportions of Saskatchewan residents
remained relatively similar and stable for both sex-
es (Figure 6.65).
In 2007/08, the proportion was 87.2 percent in
Saskatchewan. Most Regional Health Authority
percentages did not differ significantly from the
province, with the exception of Sunrise Health Re-
gion which was lower.
Fig: 6.63
Fig: 6.64
Fig: 6.65

Page 26 M o r b i d i t y
Prevalence of self-rated very good and excellent health in 12+ year olds, by
age group, Saskatchewan, CCHS Cycles, 1.1 (2000/01), 2.1 (2003), 3.1 (2005), 4.1
and 5.1 (2007/2008).
0
10
20
30
40
50
60
70
80
Age group by Year(s)
Rate
, %
20-44 65.9 70.8 66.0 65.7
45-64 52.8 55.7 56.7 51.8
65+ 33.3 33.2 32.4 30.4
2000/01 2003 2005 2007/2008
Self-rated very good and excellent health: As ex-
pected, the proportion of very good or excellent self
-reported health (two combined categories) was
significantly lower than those seen for self-reported
good, very good or excellent health (three combined
categories).
From 2000/01 to 2007/08, the proportion of
CCHS respondents (12 years and older) who re-
ported having very good or excellent health de-
clined slightly. The Saskatchewan rate was signifi-
cantly lower than the Canadian proportion in
2000/01, 2005 and 2007/08 (Figure 6.66). The
Saskatchewan proportion declined from 57.0 to
55.3 percent but the decline was not statistically
significant, while the Canadian proportion de-
creased significantly from 61.5 to 59.2 percent.
Self-reported proportions varied across age groups
over the survey time period and the proportions
declined significantly with advancing age (Figure
6.67).
In 2007/08, the age-specific percentages of Sas-
katchewan residents that reported very good or
excellent health were found for the following age
groups:
20-44 years 65.7%
45-64 years 51.8%
65+ years 30.4%
Sex-specific proportions remained relatively similar
for both sexes (Figure 6.68). The proportions
tended to decline from 2003 to 2007/08, but the
difference was not statistically significant.
In 2007/08, the self-reported proportions of very
good or excellent health was 55.3 percent in Sas-
katchewan. Most Regional Health Authority per-
centages did not differ significantly from the prov-
ince with the exception of Kelsey Trail and the
combined northern region being lower and Heart-
land being higher.
Fig: 6.67
Prevalence of self-rated very good and excellent health in all ages (12+ years),
Canada and Saskatchewan, CCHS, 2000/01, 2003, 2005, 2007/2008.
0.0
10.0
20.0
30.0
40.0
50.0
60.0
CCHS year
Rate
, %
Canada 61.5 58.6 60.2 59.2
Saskatchewan 57.0 59.5 57.8 55.3
2000/01 2003 2005 2007/2008
Fig: 6.66
Prevalence of self-rated very good and excellent health in 12+ olds, by Sex,
Saskatchewan, CCHS Cycles, 1.1 (2000/01), 2.1 (2003), 3.1 (2005), 4.1 and 5.1
(2007/2008).
0
10
20
30
40
50
60
70
Sex by Year(s)
Rate
, %
Female 55.9 59.4 57.4 55.2
Male 58.1 59.6 58.3 55.4
2000/01 2003 2005 2007/2008
Fig: 6.68
Page 27 M o r b i d i t y
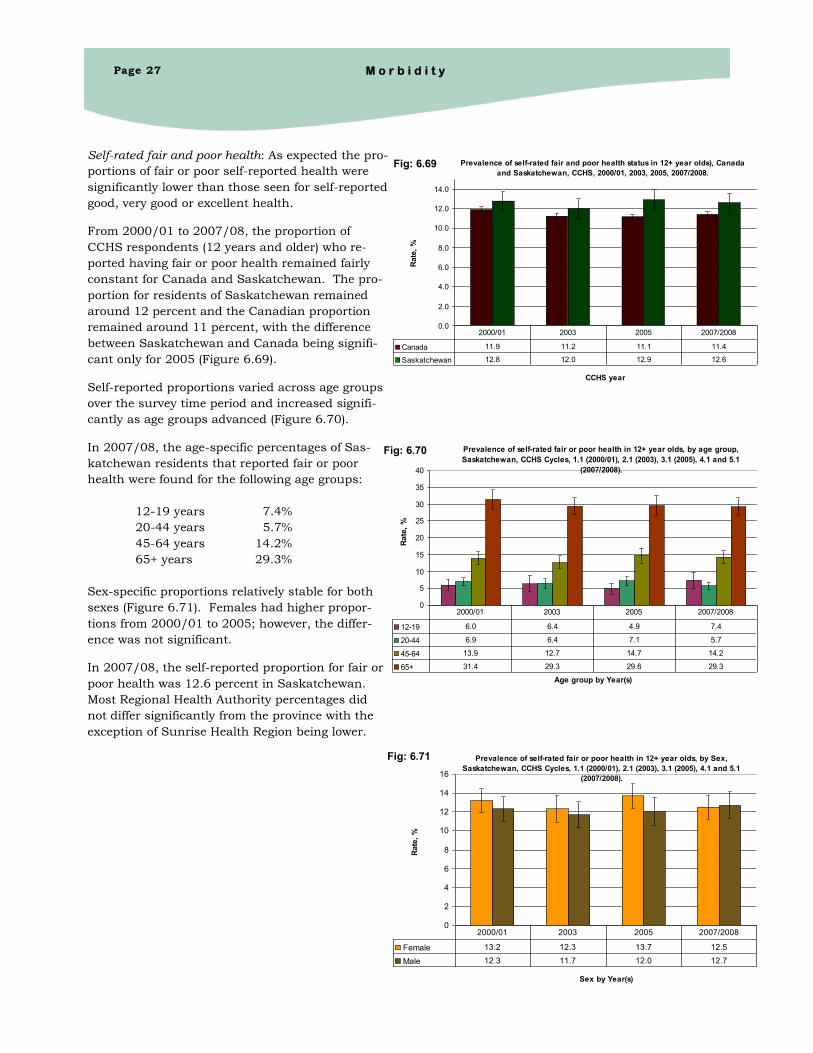
Self-rated fair and poor health: As expected the pro-
portions of fair or poor self-reported health were
significantly lower than those seen for self-reported
good, very good or excellent health.
From 2000/01 to 2007/08, the proportion of
CCHS respondents (12 years and older) who re-
ported having fair or poor health remained fairly
constant for Canada and Saskatchewan. The pro-
portion for residents of Saskatchewan remained
around 12 percent and the Canadian proportion
remained around 11 percent, with the difference
between Saskatchewan and Canada being signifi-
cant only for 2005 (Figure 6.69).
Self-reported proportions varied across age groups
over the survey time period and increased signifi-
cantly as age groups advanced (Figure 6.70).
In 2007/08, the age-specific percentages of Sas-
katchewan residents that reported fair or poor
health were found for the following age groups:
12-19 years 7.4%
20-44 years 5.7%
45-64 years 14.2%
65+ years 29.3%
Sex-specific proportions relatively stable for both
sexes (Figure 6.71). Females had higher propor-
tions from 2000/01 to 2005; however, the differ-
ence was not significant.
In 2007/08, the self-reported proportion for fair or
poor health was 12.6 percent in Saskatchewan.
Most Regional Health Authority percentages did
not differ significantly from the province with the
exception of Sunrise Health Region being lower.
Prevalence of self-rated fair and poor health status in 12+ year olds), Canada
and Saskatchewan, CCHS, 2000/01, 2003, 2005, 2007/2008.
0.0
2.0
4.0
6.0
8.0
10.0
12.0
14.0
CCHS year
Rate
, %
Canada 11.9 11.2 11.1 11.4
Saskatchewan 12.8 12.0 12.9 12.6
2000/01 2003 2005 2007/2008
Prevalence of self-rated fair or poor health in 12+ year olds, by age group,
Saskatchewan, CCHS Cycles, 1.1 (2000/01), 2.1 (2003), 3.1 (2005), 4.1 and 5.1
(2007/2008).
0
5
10
15
20
25
30
35
40
Age group by Year(s)
Rate
, %
12-19 6.0 6.4 4.9 7.4
20-44 6.9 6.4 7.1 5.7
45-64 13.9 12.7 14.7 14.2
65+ 31.4 29.3 29.6 29.3
2000/01 2003 2005 2007/2008
Prevalence of self-rated fair or poor health in 12+ year olds, by Sex,
Saskatchewan, CCHS Cycles, 1.1 (2000/01), 2.1 (2003), 3.1 (2005), 4.1 and 5.1
(2007/2008).
0
2
4
6
8
10
12
14
16
Sex by Year(s)
Rate
, %
Female 13.2 12.3 13.7 12.5
Male 12.3 11.7 12.0 12.7
2000/01 2003 2005 2007/2008
Fig: 6.69
Fig: 6.70
Fig: 6.71

Page 28
Health-adjusted life expectancy (HALE) - Health-
adjusted life expectancy (HALE) is the number of
years in full health that an individual can expect to
live given the current morbidity and mortality con-
ditions and is a summary measure of population
health that combines mortality and morbidity data
into a single index (Statistics Canada, 2012).
International Classification of Diseases (ICD) -
The International Classification of Diseases (ICD) is
the foundation for the identification of health
trends and statistics globally. It sets the interna-
tional standard for defining and reporting diseases
and health conditions by defining the universe of
diseases, disorders, injuries and other related
health conditions (World Health Organization,
2013).
Injury - A bodily lesion resulting from acute over-
exposure to energy (this can be mechanical, ther-
mal, electrical, chemical or radiant) interacting
with the body in amounts or rates that exceed the
threshold of physiological tolerance. Injuries may
be unintentional (i.e., not purposely inflicted, ei-
ther by the patient or anyone else) or intentional
injury (i.e., purposefully caused). In some cases
an injury results from an insufficiency of any of
the vital elements (e.g., oxygen, warmth). Acute
poisonings and toxic effects, including overdoses of
substances and wrong substances given or taken
in error are included. Psychological harm and as-
sault are excluded. Note that the scope of this defi-
nition is in accordance with the scope of the ICD-9
Supplementary Classification of External Causes of
Injury and Poisoning and ICD-10 CA Chapter XX.
(Public Health Agency of Canada 2005).
Life Expectancy - Life expectancy is an estimate
of the number of years a person would be expected
to live, either from birth or from age 65 years,
based on age- and sex-specific mortality rates for a
given period, under the assumption that these
mortality rates would stay constant over subse-
quent years (St-Arnaud, J, et al, 2005).
Morbidity - Illness.
Mortality - Death.
Potential Years of Life Lost (PYLL) - The num-
bers of years of life lost when a person dies prema-
turely from any cause, typically, before age 75.
The PYLL rate for a given period is the ratio of the
total years of life lost before age 75 to the total
population under 75 and is usually expressed per
1,000 population.
Rates - The rate is the proportion of a group affect-
ed over a period of time (such as a year). It ex-
presses the number of hospital separations or
deaths, usually per 100,000 population. Hospital
separation rates are calculated using Saskatche-
wan Ministry of Health Covered Population in the
denominator whereas Statistics Canada’s popula-
tion estimates are used for mortality rate calcula-
tions. To compare rates in populations or of the
same population in different years, age standardi-
zation is applied using the 1991 census population
of Canada as a standard population.
The crude rate is ratio of the total number of
hospital separations or deaths for selected
causes of injury relative to the total population
and is usually expressed per 100,000 popula-
tion.
The age-specific rate is the ratio of the total
number of hospital separations or deaths for
selected causes of injury in a given age group
to the total population in that age group and is
usually expressed per 100,000 population.
The age-standardized rate is the number of
hospital separations or deaths for selected
causes of injury per 100,000 population that
would occur in the population if it had the
same age distribution as the 1991 Canadian
census population. It is defined as the
weighted average of the age-specific rates
where the weights are taken from the standard
population. Confidence intervals for the age-
standardized rates were calculated using the
gamma method. (See: Fay PM and Feuer EJ.
Confidence intervals for directly standardized
rates - A method based on gamma distribu-
tion. Stat Med 1997;16:791-801).
D ef in i t io ns
M o r b i d i t y

A. Definitions:
Number of hospitaliza-
tions during a given cal-
endar year per 100,000
population. Annual
morbidity indicators in-
clude: 1) crude rate, 2)
sex- and age-specific rate
and 3) age-standardized
morbidity rate. Age-
standardized rates repre-
sent the rate that would
occur if the population
had the same age distri-
bution as the 1991 Cana-
dian population. ICD
codes: ICD9 320-389/
ICD10 G00-H95
B. Significance/Use:
These numbers represent
the number of individuals
hospitalized in a year.
Morbidity data are useful
in planning health ser-
vices and programs, set-
ting objectives and tar-
gets and comparing dis-
ease status over person,
place and time.
C. Limitations:
Hospitalizations do not
reflect disease severity.
The analyses are based
only on the underlying
cause of hospitalization
but there may be more
contributing causes.
Differences in reporting
may affect comparisons.
Saskatchewan residents
who were hospitalized
outside the province are
not included.
D. Source:
SK Ministry of Health,
Year-end hospital files
SUMMARY OF FINDINGS:
The age-specific hospital separation rates due to diseases of the nervous
system and sense organs were highest for the 75 years and older and
under one year age groups.
Sex-specific rates decreased for both males and females over the time
period 1995 to 2008 and were higher for females compared to males.
C H A R T 6 - 4 0 M O R B I D I T Y : I C D C H A P T E R - D I S E A S E S O F T H E
N E R V O U S S Y S T E M & S E N S E O R G A N S
B Y A G E A N D S E X
Diseases of the Nervous System & Sense Organs:
Crude Rate of Hospital Separations in
Saskatchewan by Age Group, 1995 - 2008
0
200
400
600
800
1000
1200
1400
1600
1800
1995 1996 1997 1998 1999 2000 2001 2002 2003 2004 2005 2006 2007 2008
Year
Cru
de R
ate
per
100,0
00
<1
1-19
20-44
45-64
65-74
75+
Diseases of the Nervous System & Sense Organs: Crude
Rate of Hospital Separations in Saskatchewan by Sex,
1995 - 2008
0
100
200
300
400
500
600
1995 1996 1997 1998 1999 2000 2001 2002 2003 2004 2005 2006 2007 2008
Year
Cru
de R
ate
per
100,0
00
Female
Male

Canadian Community Health Survey (CCHS), Sta-
tistics Canada
Saskatchewan Ministry of Health Vital Statistics
files.
Saskatchewan Ministry of Health year-end hospital
files (included both inpatient and day procedure
records)
Statistics Canada CANSIM tables (Population and
Demography). CANSIM Population estimates were
used from Statistics Canada for 1996 to 2009.
D ata Sou rces
Health Canada. Healthy Canadian - A Federal Re-
port on Comparable Health Indicators 2008. Ottawa:
Health Canada; 2009.
St-Arnaud J, Beaudet MP, Tully P. Life expectancy.
Health reports, Statistics Canada, Canadian Centre
for Health Information; 2005; 17(1): 43-7.
Statistics Canada, Health-adjusted life expectancy,
by sex. (2012) Retrieved 20130704, from http://
www.statcan.gc.ca/tables-tableaux/sum-som/l01/
cst01/hlth67-eng.htm
Association of Public Health Epidemiologist of On-
tario (APHEO), Potential Years of Life Lost (75)
(2006) Retrieved 20130704, from http://
www.apheo.ca/index.php?pid=90
World Health Organization, International Classifica-
tion of Diseases (ICD) Information Sheet. (2013) Re-
trieved 20130704, from http://www.who.int/
classifications/icd/factsheet/en/index.html
References
Page 29 M o r b i d i t y
The sex-specific rate is the ratio of the total
number of hospital separations or deaths for
selected causes of injury for a given sex to the
total population of that sex and is usually ex-
pressed per 100,000 population.
The age-sex specific rate is the ratio of the to-
tal number of hospital separations or deaths
for selected causes of injury in a given age-sex
group to the total population of the age-sex
group and is usually expressed per 100,000
population.