morbidity and mortality weekly report - cdc.gov “red tide” is a harmful algal bloom that occurs...
TRANSCRIPT

Morbidity and Mortality Weekly Report www.cdc.gov/mmwr
Weekly July 4, 2008 / Vol. 57 / No. 26
Illness Associated with Red Tide — Nassau County, Florida, 2007 A “red tide” is a harmful algal bloom that occurs when toxic,
microscopic algae in seawater proliferate to a higher-thannormal concentration (i.e., bloom), often discoloring the water red, brown, green, or yellow. Red tides can kill fish, birds, and marine mammals and cause illness in humans (1). Florida red tide is caused by the dinoflagellate Karenia brevis, which produces toxins called brevetoxins and is most commonly found in the Gulf of Mexico; however, K. brevis blooms also can occur along the Atlantic coast. On September 25, 2007, a cluster of respiratory illnesses was reported to the Nassau County Health Department (NCHD) in northeastern Florida. All of the ill persons were employed at a beach restoration worksite by a dredging company operating at Fernandina Beach; they reported symptoms of eye or respiratory irritation (e.g., coughing, sneezing, sniffling, and throat irritation). NCHD and the Florida Department of Health promptly conducted epidemiologic and environmental investigations and determined the illnesses likely were associated with exposure to a red tide along the Atlantic coast. These actions highlight the importance of rapid investigation of health concerns with potential environmental causes to enable timely notification of the public and prevent further illness.
Epidemiologic Investigation The dredging company had been contracted by the U.S.
Army Corps of Engineers to clear a channel for military submarines to navigate the Amelia River. During September 25– 29, as part of this operation, the company was dredging material off the ocean floor from a ship located 3 miles offshore, near the mouth of the river. The dredged material was pumped through a pipe from the ship to the beach worksite. Approximately 50 dredging company workers were stationed aboard the ship and 13 at the beach worksite, where they redistributed the piped mix of sediment on the beach. All of the dredging company employees worked 12-hour shifts. Ship
workers spent a greater portion of their shifts working indoors than did beach workers and had varying levels of exposure to outdoor elements.
On September 25, after receiving the initial reports of respiratory illness among the dredging company workers, NCHD staff members suspected the cause might be exposure to a chemical toxin. However, when staff members visited the Fernandina Beach worksite on the same day, they observed dead fish and detected the characteristic odor of brevetoxin, the toxin produced naturally by K. brevis. During September 25–26, NCHD conducted interviews with workers in two groups: those working at the beach worksite and those working aboard the company ship. The interviews used a standard questionnaire for outbreaks to assess exposure to dredging materials, occupational and recreational water exposure, travel history, medical history, and current health status. Ten of the 13 beach workers with daytime exposure history (the other three worked only at night) were interviewed, followed by the first 10 workers who were available on the ship. Because of logistical difficulties, additional workers on the ship could not be interviewed.
Mean age of the 20 dredging company workers was 45 years (range: 23–66 years); 90% were male. Six workers reported preexisting health conditions, including two with asthma. Nine of the 20 reported a recent history of smoking. The 20 workers reported experiencing symptoms of respiratory or eye irritation beginning September 16, when the dredging operation began. Predominant symptoms were coughing (12 workers), throat irritation (12), eye irritation (11), sneezing (11), and sniffling (10) (Table 1). None of the workers required medical care or experienced impairment of their ability to do their
INSIDE
720 West Nile Virus Activity — United States, 2007 723 QuickStats
depardepardepardepardepartment of health and human sertment of health and human sertment of health and human sertment of health and human sertment of health and human servicesvicesvicesvicesvices Centers for Disease Control and PreventionCenters for Disease Control and PreventionCenters for Disease Control and PreventionCenters for Disease Control and PreventionCenters for Disease Control and Prevention

718 MMWR July 4, 2008
The MMWR series of publications is published by the Coordinating Center for Health Information and Service, Centers for Disease Control and Prevention (CDC), U.S. Department of Health and Human Services, Atlanta, GA 30333.
Suggested Citation: Centers for Disease Control and Prevention. [Article title]. MMWR 2008;57:[inclusive page numbers].
Centers for Disease Control and Prevention Julie L. Gerberding, MD, MPH
Director Tanja Popovic, MD, PhD
Chief Science Officer James W. Stephens, PhD
Associate Director for Science Steven L. Solomon, MD
Director, Coordinating Center for Health Information and Service Jay M. Bernhardt, PhD, MPH
Director, National Center for Health Marketing Katherine L. Daniel, PhD
Deputy Director, National Center for Health Marketing
Editorial and Production Staff Frederic E. Shaw, MD, JD
Editor, MMWR Series Susan F. Davis, MD
(Acting) Assistant Editor, MMWR Series Teresa F. Rutledge
(Acting) Managing Editor, MMWR Series Douglas W. Weatherwax
Lead Technical Writer-Editor Donald G. Meadows, MA
Jude C. Rutledge Writers-Editors
Peter M. Jenkins (Acting) Lead Visual Information Specialist
Lynda G. Cupell Malbea A. LaPete
Visual Information Specialists Quang M. Doan, MBA
Erica R. Shaver Information Technology Specialists
Editorial Board William L. Roper, MD, MPH, Chapel Hill, NC, Chairman
Virginia A. Caine, MD, Indianapolis, IN David W. Fleming, MD, Seattle, WA
William E. Halperin, MD, DrPH, MPH, Newark, NJ Margaret A. Hamburg, MD, Washington, DC
King K. Holmes, MD, PhD, Seattle, WA Deborah Holtzman, PhD, Atlanta, GA
John K. Iglehart, Bethesda, MD Dennis G. Maki, MD, Madison, WI
Sue Mallonee, MPH, Oklahoma City, OK Stanley A. Plotkin, MD, Doylestown, PA
Patricia Quinlisk, MD, MPH, Des Moines, IA Patrick L. Remington, MD, MPH, Madison, WI
Barbara K. Rimer, DrPH, Chapel Hill, NC John V. Rullan, MD, MPH, San Juan, PR
Anne Schuchat, MD, Atlanta, GA Dixie E. Snider, MD, MPH, Atlanta, GA
John W. Ward, MD, Atlanta, GA
TABLE 1. Number of interviewed dredging company workers who reported eye or respiratory symptoms during red tide (Karenia brevis) algal bloom, by worksite — Nassau County, Florida, 2007
Total Beach Aboard ship Symptom (N = 20) (n = 10) (n = 10)
Coughing 12 10 2 Throat irritation 12 9 3 Eye irritation 11 10 1 Sneezing 11 9 2 Sniffling 10 9 1 Mucous with cough 9 7 2 Breathing difficulty 5 4 1
jobs. Several reported abrupt onset and resolution of their symptoms upon arrival and departure each day from the beach worksite.
During September 25–29, additional reports of respiratory irritation were received by public health agencies from persons along Florida’s Atlantic coast, up to 200 miles south of Fernandina Beach. Also during this period, approximately 15– 20 reports were received daily by NCHD from beachgoers with symptoms of respiratory illness.
Environmental Assessment On September 25, water samples were collected from the
Atlantic Ocean near the Fernandina Beach shoreline for evaluation by the Fish and Wildlife Research Institute of the Florida Fish and Wildlife Conservation Commission. Light microscopy was performed to assess algal species composition and abundance.
The water samples from near the Fernandina Beach worksite first revealed K. brevis on September 25. Within 2 weeks, samples with K. brevis had been collected from additional locations up to 200 miles to the south (2). The initial water samples had “medium” levels of K. brevis (100,000 to <1,000,000 cells/L), which can cause respiratory irritation and fish kills (Table 2). However, September 26, water samples collected in Jacksonville, 35 miles south of Fernandina Beach, had “high” levels (>1,000,000 cells/L), which can cause seawater discoloration in addition to respiratory irritation and probable fish kills. Onshore wind patterns likely facilitated the transport of aerosolized brevetoxins, resulting in exposure to beachgoers.
On September 29, a storm with prolonged wind, rain, and flooding struck northeast Florida, and public reports of respiratory symptoms began to decline. Water samples collected after September 29 detected “low a” levels of K. brevis (>1,000 to <5,000 cells/L) and “present” levels (<1,000 cells/L), indicating that the storm likely contributed to dissipation of the red tide (Table 2). On November 8, all five water samples collected in Nassau County had cell counts of zero (3).

TABLE 2. Laboratory classifications and possible effects of Karenia brevis, by cell count — Fish and Wildlife Research Institute, Florida Fish and Wildlife Conservation Commission Classification K. brevis (cells/L) Possible effects (K. brevis only)
Present background levels of <1,000 cells None Very low a >1,000 to <5,000 Possible respiratory irritation
Very low b 5,000 to 10,000 Possible respiratory irritation and requisite shellfish harvesting closures Low a >10,000 to <50,000 Respiratory irritation, but chlorophyll levels too low to be detected by satellites Low b 50,000 to <100,000 Respiratory irritation, possible fish kills, and bloom chlorophyll probably detected by satellites Medium 100,000 to <1,000,000 Respiratory irritation and probable fish kills High >1,000,000 As above, plus discoloration
719 Vol. 57 / No. 26 MMWR
Public Health Actions During the red tide event, NCHD issued several beach ad
visories, beginning September 25, alerting the public to the health risks of exposure to brevetoxins, especially for persons with preexisting respiratory conditions. Advisories were disseminated using Nassau County Emergency Management (NCEM) and NCHD communications systems and “blast faxes” to local physicians, veterinarians, schools, governmental organizations, hotels, and restaurants. In addition, advisories were posted at beach locations, in local newspapers, and on NCHD and NCEM websites. Persons who experienced respiratory irritation or sought additional red tide information were instructed to contact NCHD or the Florida Poison Control Center’s Aquatic Toxins Hotline. Reported by: A Reich, MS, MSPH, Aquatic Toxins Program, Bur of Community Environmental Health; C Blackmore, PhD, DVM, Div of Environmental Health; R Hopkins, MD, Bur of Epidemiology; R Lazensky, MPH, Florida Dept of Health. K Geib, MSN, E Ngo-Seidel, MD, Nassau County Health Dept, Fernandina Beach, Florida.
Editorial Note: The initial detection of the 2007 northeast Florida red tide described in this report was unusual because public health authorities were first alerted by a cluster of reported symptoms of human respiratory illness among dredging workers rather than by more common means (e.g., observation of dead fish or birds, detection of contaminated seafood, or use of satellite imagery or routine beach water sampling). Upon initial investigation of the human illnesses, NCHD observed dead fish and detected the odor of brevetoxin, both indications of red tide. Water sampling confirmed that an ongoing red tide bloom was in the proximity. Because only a small convenience sample of workers could be interviewed on the dredging ship, no conclusions can be drawn about the relative prevalence of red tide symptoms at the two worksites. However, the results suggest that symptoms occurred more frequently among beach workers. During red tides, symptoms are frequently more intense in persons exposed on beaches, because of aerosolization of brevetoxins in beach surf (4).
Wildlife species have been particularly valuable sentinels for human brevetoxin illness. In the past, the Florida Department of Health has used reports of dead fish or birds (which eat contaminated fish) as an early warning mechanism for red
tide blooms (5). During the red tide event described in this report, dead sea turtles were observed on Nassau County beaches. Brevetoxin also accumulates in molluscan shellfish and is associated with human neurotoxic shellfish poisoning when contaminated seafood is ingested (6). Shellfish beds in Florida coastal waters are sampled routinely for brevetoxin.
Studies attempting to assess the human health effects of red tide blooms have been reported. One study, in Sarasota, Florida, found a 19% increase in the rate of pneumonia cases diagnosed during a 3-month onshore red tide event and, among coastal residents, a 54% higher rate of diagnoses of respiratory illness (pneumonia, bronchitis, asthma, and upper airway disease) (7). Other studies have found significant measureable adverse changes in the lung function of asthma patients after exposure to brevetoxins (6,8).
Red tide blooms have been uncommon in northeastern Florida, occurring with much greater frequency in the Gulf of Mexico. Florida red tide was first documented on the Atlantic coast in 1972, south of Fernandina Beach, and further south in Jacksonville in 1980 and 1999 (9). Florida records indicate that, before the 2007 bloom, K. brevis had not been detected in Nassau County since 1953; that detection was not associated with a red tide event.
In addition to the limited number of interviews with the ship workers, the findings in this report are subject to at least two other limitations. First, assessment of symptom onset dates was not possible because symptom-specific onset dates were not collected. Second, systematic collection of data on symptoms of other persons in the area of the bloom was not possible; therefore, the effects of the red tide event among populations other than the dredging company workers (e.g., beachgoers) could not be assessed.
During this red tide event, prompt investigation of a small cluster of symptoms led to quick identification of the K. brevis bloom. This public health vigilance enabled authorities to take immediate action to issue advisories and otherwise alert the public to an illness of environmental etiology.
References 1. Fish and Wildlife Research Institute. Red tides in Florida. St. Peters
burg, FL: Florida Fish and Wildlife Conservation Commission, Fish and Wildlife Research Institute; 2008. Available at http:// www.floridamarine.org/features/view_article.asp?id=24936.

720 MMWR July 4, 2008
2. Fish and Wildlife Research Institute. Karenia brevis counts, September 24–28, 2007. St. Petersburg, FL: Florida Fish and Wildlife Conservation Commission, Fish and Wildlife Research Institute; 2007. Available at http://research.myfwc.com/gallery/image_details.asp?id=27000.
3. Fish and Wildlife Research Institute. Karenia brevis counts, November 3–9, 2007. St. Petersburg, FL: Florida Fish and Wildlife Conservation Commission, Fish and Wildlife Research Institute; 2007. Available at http://research.myfwc.com/gallery/image_details.asp?id=27104.
4. Backer LC, Kirkpatrick B, Fleming LE, et al. Occupational exposure to aerosolized brevetoxins during Florida red tide events: effects on a healthy worker population. Environ Health Perspect 2005;113:644–9.
5. Fish and Wildlife Research Institute. Fish kill database search. St. Petersburg, FL: Florida Fish and Wildlife Conservation Commission, Fish and Wildlife Research Institute; 2007. Available at http://research.myfwc.com/fishkill.
6. Fleming LE, Kirkpatrick B, Backer LC, et al. Initial evaluation of the effects of aerosolized Florida red tide toxins (brevetoxins) in persons with asthma. Environ Health Perspect 2005;113:650–7.
7. Kirkpatrick B, Fleming LE, Backer LC, et al. Environmental exposures to Florida red tides: effects on emergency room respiratory diagnoses admissions. Harmful Algae 2006;5:526–33.
8. Fleming LE, Kirkpatrick B, Backer LC, et al. Aerosolized red-tide toxins (brevetoxins) and asthma. Chest 2007;131:187–94.
9. Fish and Wildlife Research Institute. East Coast red tide history. St. Petersburg, FL: Florida Fish and Wildlife Conservation Commission, Fish and Wildlife Research Institute; 2007. Available at http:// research.myfwc.com/engine/download_redirection_process.asp? file=east_coast_red_tide_summary.pdf&objid=8939&dltype=article.
West Nile Virus Activity — United States, 2007
West Nile virus (WNV) is the leading cause of arboviral encephalitis in the United States. Originally identified in Africa in 1937, WNV was first detected in the western hemisphere in 1999 in New York City. Since then, WNV has caused seasonal epidemics of febrile illness and neurologic disease in the United States. This report summarizes national WNV surveillance data for 2007. WNV transmission to humans or animals expanded into 19 counties that had not reported transmission previously and recurred in 1,148 counties where transmission had been reported in previous years. A total of 1,227 cases of WNV neuroinvasive disease (WNND) and 117 deaths were reported. These findings highlight the need for ongoing surveillance, mosquito control, promotion of personal protection from mosquito bites, and research into additional prevention strategies, including a WNV human vaccine.
WNV data are reported to CDC through ArboNET, an Internet-based arbovirus surveillance system managed by state health departments and CDC. State and local health departments 1) collect reports from health-care providers and clinical laboratories regarding cases of WNV disease in humans; 2) collect reports of WNV presumptive viremic blood donors
(PVDs)* from blood collection agencies; 3) collect and test dead birds, often focusing on corvids (e.g., crows, jays, and magpies), which have high mortality attributed to WNV infection; 4) collaborate with veterinarians to collect reports of WNV infection in nonhuman mammals; and 5) collect mosquitoes to test for evidence of WNV infection. Human WNV disease cases are classified as 1) WNND (i.e., meningitis, encephalitis, or acute flaccid paralysis); 2) West Nile fever (WNF), which is symptomatic WNV disease that does not affect the nervous system; or 3) an unspecified clinical syndrome. WNF reporting is highly variable by jurisdiction, depending on the level of interest in reporting and use of diagnostic testing; therefore, most of this report focuses on WNND cases, which are thought to be more consistently identified and reported because of the severity of the illness.
Human Surveillance During 2007, a total of 3,630 cases of WNV disease in
humans were reported from 775 counties in 44 states (i.e., 25% of the 3,142 counties in the United States). Of these cases, 1,227 (34%) were WNND, 2,350 (65%) were WNF, and 53 (1%) were unspecified clinical syndromes. A total of 352 PVDs were identified through routine screening of the blood supply. Of these PVDs, 281 (80%) were asymptomatic, five (1%) subsequently developed WNND, and 66 (19%) subsequently had WNF.
Overall, the incidence of WNND in the United States was 0.4 per 100,000 population. The highest incidence of WNND occurred primarily in the west-central United States (Figure 1); the five states with highest incidence were North Dakota (7.7 cases per 100,000 residents), South Dakota (6.2), Wyoming (4.6), Montana (4.0), and Colorado (2.2). Among all states, WNND peaked during the first week in August, and 1,086 (89%) cases were reported during July–September (Figure 2). This seasonality was consistent with trends observed in the preceding 7 years.
Of the 1,227 WNND cases, 729 (59%) occurred in males. The median age of patients was 57 years (range: 1 month–97 years), with increasing incidence among older age groups (Figure 3). Overall, 1,089 (89%) patients were hospitalized (median age: 59 years; range: 1 month–97 years), and 117 (10%) died (median age: 77 years; range: 43–96 years). A total of 765 (62%) WNND cases were classified as encephalitis, 452 (37%) as meningitis, and 63 (5%) as acute flaccid
* A PVD is a person whose blood tested positive when screened for the presence of WNV. PVDs are followed up by the blood collection agency with additional tests to verify their infection. Some PVDs go on to develop symptoms after donation, at which point they are considered to have WNV disease.

721 Vol. 57 / No. 26 MMWR
FIGURE 1. Incidence* of West Nile virus neuroinvasive disease, by area — United States, 2007†
0 0.01–0.99 1.00–9.99 >10.00
* Per 100,000 population.†Includes meningitis, encephalitis, and acute flaccid paralysis.
FIGURE 2. Number* of West Nile virus neuroinvasive disease cases, by week of illness onset — United States, 2007†
160
140
120
100
80
60
40
20
0 1 3 5 7 9 11 13 15 17 19 21 23 25 27 29 31 33 35 37 39 41 43 45 47 49 51
Jan Feb Mar Apr May Jun Jul Aug Sep Oct Nov Dec
Week of illness onset
* N = 1,227.†Includes meningitis, encephalitis, and acute flaccid paralysis.
paralysis; 53 of these cases were classified as acute flaccid paralysis coincident with encephalitis or meningitis.
Animal Surveillance In 2007, a total of 2,182 dead WNV-
infected birds were reported from 315 counties in 35 states and Puerto Rico; 157 counties in 28 states and Puerto Rico reported infected birds but no clinically apparent human disease. The number of reported WNV-infected birds peaked during the first week of September. Corvids accounted for 1,690 (77%) of the birds; most states targeted corvids for surveillance. Since 1999, WNV infection has been reported in 321 avian species, including four species (Bronzed Cowbird, Cackling Goose, Le Conte’s Thrasher, and Northern Pintail) in which WNV was identified for the first time during 2007.
Of 507 reported cases of WNV disease among nonhuman mammals, 471 (93%) occurred in equines, and 36 (7%) occurred in other species (squirrels [27], canines [five], and unspecified species [four]). Equine cases were reported from 320 counties in 35 states and Puerto Rico; Texas reported 20% of all equine cases. The number of reported WNV-infected equines peaked in mid-August.
Mosquito Surveillance A total of 8,215 mosquito pools† from
371 counties in 39 states, the District of Columbia, and Puerto Rico tested positive for WNV. Among the WNV-positive pools, 6,286 (77%) were made up of Culex mosquitoes thought to be the principal vectors of WNV transmission (e.g., Cx. pipiens, Cx. quinquefasciatus, Cx. restuans, Cx. salinarius, and Cx. tarsalis). Unidentified or other species
† A sample of mosquitoes (usually no more than 50) of the same species and sex, collected within a defined sampling area and period.

722 MMWR July 4, 2008
FIGURE 3. Incidence* of West Nile virus neuroinvasive disease, by age group — United States, 2007†
1.6
1.4
1.2
1.0
0.8
0.6
0.4
0.2
0 0 9 10 19 20 29 30 39 40 49 50 59 60 69 70 79 >80
Age group (yrs)
* Per 100,000 population.†
Includes meningitis, encephalitis, and acute flaccid paralysis.
of Culex mosquitoes made up 1,746 (21%) pools, and non-Culex species (e.g., Aedes spp., Anopheles spp., Coquillettidia perturbans, Culiseta spp., and Uranotaenia sapphirina) made up 106 (1%) pools. Data from 2007 included the first report of WNV infection in Culex bahamensis, which was collected in Puerto Rico. The number of reported WNV-infected mosquito pools peaked during mid-August. Reported by: NP Lindsey, MS, JA Lehman, JE Staples, MD, N Komar, ScD, E Zielinski-Gutierrez, DrPh, EB Hayes, MD, RS Nasci, PhD, M Fischer, MD, Div of Vector-Borne Infectious Diseases, National Center for Zoonotic, Vector-Borne, and Enteric Diseases; M Duffy, DVM, EIS Officer, CDC.
Editorial Note: In 2007, the reported incidence of WNND in the United States was 0.4 per 100,000 population. This incidence is similar to that reported in 2004 (0.4), 2005 (0.4), and 2006 (0.5), but substantially lower than the reported incidence for 2002 (1.0) and 2003 (1.0) (1,2). The relative stability in the number of reported WNND cases during the past 4 years likely represents endemic WNV transmission in the continental United States. However, because of variation in vectors, avian amplifying hosts, human activity, and environmental factors (e.g., temperature and rainfall), predicting future WNV transmission intensity is difficult (3,4).
Reported cases of WNND are thought to be the most accurate indicator of WNV activity in humans. WNND reporting is thought to be more complete because of substantial associated morbidity and mortality, whereas WNF likely is underdiagnosed and underreported. Serologic surveys indicate that approximately 20% of WNV infections result in WNF and 0.7% of WNV infections result in WNND (5). Based on these estimates, approximately 175,000 WNV infections and 35,000 WNF cases occurred in the United States
in 2007. Only 2,350 WNF cases were reported to ArboNET in 2007, representing <10% of the estimated number of WNF cases.
In 2007, evidence of WNV human disease again was detected in all geographic regions of the continental United States. Although the highest incidence of WNND continued to occur in the west-central United States (6), Idaho reported only 10 WNND cases in 2007, a 93% decrease from the 139 cases reported in 2006 (7). This illustrates the wide annual variability and focality of WNV transmission. Human WNV infection was identified for the first time in Puerto Rico in 2007 among three asymptomatic blood donors (8).
ArboNET integrates arboviral diagnostic testing and reporting to produce timely, actionable data that public health professionals use to tailor effective prevention and control messages at the local level. Continued surveillance is important in monitoring potential changes in WNV epidemiology and for providing early warning for local WNND outbreaks. In addition, ArboNET is well positioned to help identify and manage future introductions of exotic arboviruses. For example, cases of ill travelers entering the United States who are likely viremic with nonendemic arboviruses (e.g., dengue virus and chikungunya virus) are reported to ArboNET (9).
WNV vaccines are licensed for use in horses and are being evaluated currently in phase 2 human clinical trials (10). Because no WNV vaccine is available currently for use in humans, prevention depends on personal protective measures. Use of repellents containing DEET, picaridin, oil of lemon eucalyptus, or IR3535 provides effective protection against mosquitoes. Long-sleeved shirts, long pants, and socks provide barrier protection against mosquito bites, and many fabrics can be treated with permethrin to provide an additional level of protection. Avoiding outdoor exposure during dusk and dawn, when Culex mosquito species are more active, will decrease the likelihood of WNV exposure. Household measures, such as installing and repairing window screens and covering or draining water-holding containers to reduce mosquito breeding sites, can decrease further the risk for WNV exposure.
Additional information on effective prevention of WNV infection is available from CDC at http://www.cdc.gov/ ncidod/dvbid/westnile/index.htm. An overview of current year WNV transmission activity is available at http://diseasemaps. usgs.gov/wnv_us_human.html.
Acknowledgments This report is based, in part, on data provided by ArboNET sur
veillance coordinators in local and state health departments and ArboNET technical staff, Div of Vector-Borne Infectious Diseases, National Center for Zoonotic, Vector-Borne, and Enteric Diseases, CDC.

723 Vol. 57 / No. 26 MMWR
References 1. CDC. West Nile virus: maps and human cases. Atlanta, GA: US
Department of Health and Human Services, CDC; 2008. Available at http://www.cdc.gov/ncidod/dvbid/westnile/index.htm.
2. US Census Bureau. Annual population estimates 2000 to 2007. Washington, DC: US Census Bureau; 2008. Available at http:// www.census.gov/popest/states/NST-ann-est.html.
3. Komar N. West Nile virus: epidemiology and ecology in North America. Adv Virus Res 2003;61:185–234.
4. Hayes EB, Komar N, Nasci RS, Montgomery SP, O’Leary DR, Campbell GL. Epidemiology and transmission dynamics of West Nile virus disease. Emerg Infect Dis 2005;11:1167–73.
5. Mostashari F, Bunning ML, Kitsutani PT, et al. Epidemic West Nile encephalitis, New York, 1999: results of a household-based seroepidemiological survey. Lancet 2001;358:261–4.
6 Lindsey NP, Kuhn S, Campbell GL, Hayes EB. West Nile virus neuroinvasive disease incidence in the United States, 2002–2006. Vector Borne Zoonotic Dis 2008;8:35–9.
7. CDC. West Nile virus activity—United States, 2006. MMWR 2007;56:556–9.
8. CDC. Detection of West Nile virus in blood donations—Puerto Rico, 2007. MMWR 2008;57:577–80.
9. CDC. Update: chikungunya fever diagnosed among international travelers—United States, 2006. MMWR 2007;56:276–7.
10. Monath TP, Liu J, Kanesa-Thasan N, et al. A live, attenuated recombinant West Nile virus vaccine. Proc Natl Acad Sci U S A 2006;103:6694–9.
Erratum: Vol. 57, No. RR-4 In the MMWR Recommendations and Reports (Vol. 57,
No. RR-4), “Prevention of Pertussis, Tetanus, and Diphtheria Among Pregnant and Postpartum Women and Their Infants: Recommendations of the Advisory Committee on Immunization Practices (ACIP),” an error occurred on page 4 in Table 1. For the vaccine ADACEL®, the fimbriae component of the formulation was omitted; it should be 5 µg, followed by the ¶¶¶ footnote symbol.
QuickStats from the national center for health statisticsfrom the national center for health statisticsfrom the national center for health statistics from the national center for health statisticsfrom the national center for health statistics
Percentage of Adults Aged >65 Years Who Ever Received a Pneumococcal Vaccination,* by Sex, Age Group, and Race/Ethnicity — National Health
Interview Survey, United States, 2007†
* Based on response to the question, “Have you ever had a pneumonia shot? This shot is usually given only once or twice in a person's lifetime and is different from the flu shot. It is also called the pneumococcal vaccine.”
† Estimates are based on household interviews of a sample of the civilian, noninstitutionalized U.S. population.
§ 95% confidence interval.
In 2007, approximately 58% of adults aged >65 years had ever received a pneumococcal vaccination. In this population, statistically significant differences by sex, age group, and race/ethnicity were observed. Women were more likely than men to have ever received a pneumococcal vaccination. Adults aged >75 years were more likely to have ever received a pneumococcal vaccination compared with adults aged 65–74 years. Non-Hispanic white adults aged >65 years were more likely than Hispanic and non-Hispanic black adults in that age group to have received the vaccination.
SOURCE: Heyman KM, Schiller JS, Barnes P. Early release of selected estimates based on data from the 2007 National Health Interview Survey. US Department of Health and Human Services, CDC, National Center for Health Statistics; 2008. Available at http://www.cdc.gov/nchs/about/major/nhis/released200806.htm.
0
10
20
30
40
50
60
70
80
Total Men Women 65 74 >75 Hispanic White, non-
Hispanic
Black, non-
HispanicSex, age group (yrs), and race/ethnicity
§

724 MMWR July 4, 2008
TABLE I. Provisional cases of infrequently reported notifiable diseases (<1,000 cases reported during the preceding year) — United States, week ending June 28, 2008 (26th Week)*
Current Cum 5-year weekly Total cases reported for previous years
Disease week 2008 average† 2007 2006 2005 2004 2003 States reporting cases during current week (No.) Anthrax — — — 1 1 — — — Botulism:
foodborne — 4 0 32 20 19 16 20 infant — 32 2 85 97 85 87 76 other (wound & unspecified) — 6 1 27 48 31 30 33
Brucellosis 2 39 2 130 121 120 114 104 CA (2) Chancroid 1 23 1 23 33 17 30 54 NY (1) Cholera — — 0 7 9 8 6 2 Cyclosporiasis§ 4 45 10 92 137 543 160 75 FL (3), TN (1) Diphtheria — — — — — — — 1 Domestic arboviral diseases§,¶:
California serogroup — — 3 53 67 80 112 108 eastern equine — — 0 4 8 21 6 14 Powassan — — 0 7 1 1 1 — St. Louis — — 0 9 10 13 12 41 western equine — — — — — — — —
Ehrlichiosis/Anaplasmosis§,**: Ehrlichia chaffeensis 7 94 17 828 578 506 338 321 MD (3), VA (2), FL (1), AL (1) Ehrlichia ewingii — — — — — — — — Anaplasma phagocytophilum — 33 22 834 646 786 537 362 undetermined — 2 11 337 231 112 59 44
Haemophilus influenzae, ††
invasive disease (age <5 yrs): serotype b — 17 0 23 29 9 19 32 nonserotype b — 89 3 197 175 135 135 117 unknown serotype 2 115 3 181 179 217 177 227 MO (1), CO (1)
Hansen disease§ — 33 2 101 66 87 105 95 Hantavirus pulmonary syndrome§ — 6 1 32 40 26 24 26 Hemolytic uremic syndrome, postdiarrheal§ 7 60 6 292 288 221 200 178 OH (1), MO (2), OK (1), CA (3) Hepatitis C viral, acute 6 351 15 856 766 652 720 1,102 NY (1), OH (1), MI (1), VA (1), OK (1), CA (1) HIV infection, pediatric (age <13 yrs)§§ — — 4 — — 380 436 504 Influenza-associated pediatric mortality§,¶¶ 2 87 1 70 43 45 — N KY (1), TX (1) Listeriosis 7 237 17 808 884 896 753 696 OH (1), NC (1), TN (1), OK (3), CA (1) Measles*** 1 113 2 43 55 66 37 56 CA (1) Meningococcal disease, invasive†††:
A, C, Y, & W-135 3 154 5 323 318 297 — — NC (1), OK (1), WA (1) serogroup B — 87 4 166 193 156 — — other serogroup — 18 0 34 32 27 — — unknown serogroup 9 361 11 553 651 765 — — OH (1), NC (2), SC (1), FL (1), AL (1), CA (3)
Mumps 2 236 20 799 6,584 314 258 231 NY (1), KS (1) Novel influenza A virus infections — — — 1 N N N N Plague — 1 0 7 17 8 3 1 Poliomyelitis, paralytic — — — — — 1 — — Poliovirus infection, nonparalytic§ — — — — N N N N Psittacosis§ — 4 0 12 21 16 12 12 Q fever§,§§§ total: — 46 3 171 169 136 70 71
acute — 42 — — — — — — chronic — 4 — — — — — —
Rabies, human — — 0 1 3 2 7 2 Rubella¶¶¶ 1 7 0 12 11 11 10 7 ND (1) Rubella, congenital syndrome — — — — 1 1 — 1 SARS-CoV§,**** — — — — — — — 8
—: No reported cases. N: Not notifiable. Cum: Cumulative year-to-date counts. * Incidence data for reporting years 2007 and 2008 are provisional, whereas data for 2003, 2004, 2005, and 2006 are finalized. † Calculated by summing the incidence counts for the current week, the 2 weeks preceding the current week, and the 2 weeks following the current week, for a total of 5
preceding years. Additional information is available at http://www.cdc.gov/epo/dphsi/phs/files/5yearweeklyaverage.pdf. § Not notifiable in all states. Data from states where the condition is not notifiable are excluded from this table, except in 2007 and 2008 for the domestic arboviral diseases and
influenza-associated pediatric mortality, and in 2003 for SARS-CoV. Reporting exceptions are available at http://www.cdc.gov/epo/dphsi/phs/infdis.htm. ¶ Includes both neuroinvasive and nonneuroinvasive. Updated weekly from reports to the Division of Vector-Borne Infectious Diseases, National Center for Zoonotic, Vector-
Borne, and Enteric Diseases (ArboNET Surveillance). Data for West Nile virus are available in Table II. ** The names of the reporting categories changed in 2008 as a result of revisions to the case definitions. Cases reported prior to 2008 were reported in the categories:
Ehrlichiosis, human monocytic (analogous to E. chaffeensis); Ehrlichiosis, human granulocytic (analogous to Anaplasma phagocytophilum), and Ehrlichiosis, unspecified, or other agent (which included cases unable to be clearly placed in other categories, as well as possible cases of E. ewingii).
†† Data for H. influenzae (all ages, all serotypes) are available in Table II. §§ Updated monthly from reports to the Division of HIV/AIDS Prevention, National Center for HIV/AIDS, Viral Hepatitis, STD, and TB Prevention. Implementation of HIV
reporting influences the number of cases reported. Updates of pediatric HIV data have been temporarily suspended until upgrading of the national HIV/AIDS surveillance data management system is completed. Data for HIV/AIDS, when available, are displayed in Table IV, which appears quarterly.
¶¶ Updated weekly from reports to the Influenza Division, National Center for Immunization and Respiratory Diseases. Eighty-five cases occurring during the 2007–08 influenza season have been reported.
*** The one measles case reported for the current week was imported. ††† Data for meningococcal disease (all serogroups) are available in Table II. §§§ In 2008, Q fever acute and chronic reporting categories were recognized as a result of revisions to the Q fever case definition. Prior to that time, case counts were not
differentiated with respect to acute and chronic Q fever cases. ¶¶¶ The one rubella case reported for the current week was unknown.
**** Updated weekly from reports to the Division of Viral and Rickettsial Diseases, National Center for Zoonotic, Vector-Borne, and Enteric Diseases.

CASES CURRENT
DISEASE DECREASE INCREASE 4 WEEKS
Hepatitis A, acute
Giardiasis 707
103
Hepatitis B, acute 144
Hepatitis C, acute 38
Legionellosis 149
Measles
Meningococcal disease
21
46
Mumps 10
Pertussis 262
0.125
Ratio (Log scale)*
Beyond historical limits
0.25 0.5 1 2 4 8
725 Vol. 57 / No. 26 MMWR
TABLE I. (Continued) Provisional cases of infrequently reported notifiable diseases (<1,000 cases reported during the preceding year) — United States, week ending June 28, 2008 (26th Week)*
5-year Current Cum weekly Total cases reported for previous years
Disease week 2008 average† 2007 2006 2005 2004 2003 States reporting cases during current week (No.) Smallpox§ — — — — — — — — Streptococcal toxic-shock syndrome§ 2 80 2 132 125 129 132 161 CT (2) Syphilis, congenital (age <1 yr) — 84 8 427 349 329 353 413 Tetanus — 2 1 27 41 27 34 20 Toxic-shock syndrome (staphylococcal)§ 3 31 2 92 101 90 95 133 CA (3) Trichinellosis — 4 0 5 15 16 5 6 Tularemia 1 23 5 137 95 154 134 129 OR (1) Typhoid fever 3 173 7 434 353 324 322 356 WA (1), CA (2) Vancomycin-intermediate Staphylococcus aureus§ — 4 0 28 6 2 — N Vancomycin-resistant Staphylococcus aureus§ — — — 2 1 3 1 N Vibriosis (noncholera Vibrio species infections)§ 7 85 3 421 N N N N MD (1), VA (2), FL (4) Yellow fever — — — — — — — —
—: No reported cases. N: Not notifiable. Cum: Cumulative year-to-date counts. * Incidence data for reporting years 2007 and 2008 are provisional, whereas data for 2003, 2004, 2005, and 2006 are finalized. † Calculated by summing the incidence counts for the current week, the 2 weeks preceding the current week, and the 2 weeks following the current week, for a total of 5
preceding years. Additional information is available at http://www.cdc.gov/epo/dphsi/phs/files/5yearweeklyaverage.pdf. § Not notifiable in all states. Data from states where the condition is not notifiable are excluded from this table, except in 2007 and 2008 for the domestic arboviral diseases and
influenza-associated pediatric mortality, and in 2003 for SARS-CoV. Reporting exceptions are available at http://www.cdc.gov/epo/dphsi/phs/infdis.htm.
FIGURE I. Selected notifiable disease reports, United States, comparison of provisional 4-week totals June 28, 2008, with historical data
* Ratio of current 4-week total to mean of 15 4-week totals (from previous, comparable, and subsequent 4-week periods for the past 5 years). The point where the hatched area begins is based on the mean and two standard deviations of these 4-week totals.
Notifiable Disease Data Team and 122 Cities Mortality Data Team Patsy A. Hall
Deborah A. Adams Rosaline Dhara Willie J. Anderson Michael S. Wodajo Lenee Blanton Pearl C. Sharp

726 MMWR July 4, 2008
TABLE II. Provisional cases of selected notifiable diseases, United States, weeks ending June 28, 2008, and June 30, 2007 (26th Week)*
Chlamydia† Coccidioidomycosis Cryptosporidiosis Previous Previous Previous
Current 52 weeks Cum Cum Current 52 weeks Cum Cum Current 52 weeks Cum Cum Reporting area week Med Max 2008 2007 week Med Max 2008 2007 week Med Max 2008 2007
United States 11,074 21,368 28,892 516,470 537,740 50 127 341 3,241 3,894 49 84 975 1,691 1,578
New England 796 676 1,516 17,203 17,167 — 0 1 1 2 — 6 17 107 128 Connecticut 303 201 1,093 4,767 4,976 N 0 0 N N — 0 15 15 42 Maine§ — 47 67 1,181 1,286 N 0 0 N N — 1 5 10 14 Massachusetts 414 313 660 8,631 7,871 N 0 0 N N — 2 11 31 37 New Hampshire — 39 73 982 983 — 0 1 1 2 — 1 4 25 16 Rhode Island§ 60 56 98 1,445 1,548 — 0 0 — — — 0 3 4 5 Vermont§ 19 16 36 197 503 N 0 0 N N — 1 4 22 14
Mid. Atlantic 2,217 2,749 4,843 71,405 70,435 — 0 0 — — 10 12 120 226 192 New Jersey 252 405 528 8,422 10,727 N 0 0 N N — 1 8 10 11 New York (Upstate) 460 561 2,177 13,543 12,802 N 0 0 N N 4 5 20 73 54 New York City 1,084 987 3,148 28,853 25,126 N 0 0 N N — 2 8 38 33 Pennsylvania 421 803 1,031 20,587 21,780 N 0 0 N N 6 6 103 105 94
E.N. Central 948 3,496 4,373 82,857 89,701 — 1 3 20 16 9 22 134 410 351 Illinois 17 1,002 1,711 20,649 25,599 N 0 0 N N — 2 13 36 41 Indiana 298 390 656 10,193 10,754 N 0 0 N N — 2 41 67 26 Michigan 419 754 1,222 22,460 19,232 — 0 2 13 12 2 4 11 79 72 Ohio 93 868 1,530 20,596 24,323 — 0 1 7 4 4 6 60 113 87 Wisconsin 121 378 615 8,959 9,793 N 0 0 N N 3 7 60 115 125
W.N. Central 806 1,228 1,693 31,151 30,953 — 0 77 — 5 7 17 125 300 231 Iowa 222 163 251 4,249 4,257 N 0 0 N N 3 4 61 63 43 Kansas 195 161 529 4,588 4,012 N 0 0 N N 2 1 15 22 32 Minnesota — 261 373 5,971 6,634 — 0 77 — — — 5 34 81 47 Missouri 372 468 577 12,104 11,381 — 0 1 — 5 1 3 14 67 43 Nebraska§ — 89 162 2,064 2,577 N 0 0 N N 1 2 24 43 14 North Dakota 17 33 65 832 862 N 0 0 N N — 0 51 2 1 South Dakota — 54 81 1,343 1,230 N 0 0 N N — 1 16 22 51
S. Atlantic 1,748 3,984 7,609 93,968 103,789 — 0 1 2 2 13 19 65 339 358 Delaware 61 65 150 1,855 1,679 — 0 0 — — 1 0 4 7 3 District of Columbia — 117 202 3,041 2,957 — 0 1 — — — 0 2 3 1 Florida 817 1,302 1,555 33,819 25,695 N 0 0 N N 5 8 35 155 158 Georgia 7 649 1,338 4,273 20,387 N 0 0 N N 3 4 14 103 80 Maryland§ — 469 683 10,786 10,277 — 0 1 2 2 2 0 3 11 13 North Carolina 425 215 4,783 10,142 14,627 N 0 0 N N — 0 18 11 39 South Carolina§ — 472 3,070 13,391 14,021 N 0 0 N N — 1 15 19 28 Virginia§ 427 524 1,062 15,166 12,550 N 0 0 N N 2 1 6 23 32 West Virginia 11 60 96 1,495 1,596 N 0 0 N N — 0 5 7 4
E.S. Central 768 1,517 2,394 38,687 41,358 — 0 0 — — 1 4 64 50 69 Alabama§ 67 478 605 10,889 12,579 N 0 0 N N — 1 14 18 24 Kentucky 225 222 361 5,506 3,867 N 0 0 N N — 1 40 10 21 Mississippi — 314 1,048 8,769 10,936 N 0 0 N N — 1 11 6 12 Tennessee§ 476 515 715 13,523 13,976 N 0 0 N N 1 1 18 16 12
W.S. Central 2,038 2,715 4,426 71,119 58,530 — 0 1 1 1 1 6 29 70 87 Arkansas§ 336 234 455 7,050 4,430 N 0 0 N N — 1 8 13 12 Louisiana — 380 851 7,909 9,099 — 0 1 1 1 — 0 4 4 27 Oklahoma 209 235 416 5,848 6,148 N 0 0 N N 1 1 11 20 15 Texas§ 1,493 1,809 3,923 50,312 38,853 N 0 0 N N — 3 18 33 33
Mountain 329 1,396 1,836 29,454 36,915 34 90 170 2,249 2,378 7 10 567 156 121 Arizona 89 477 679 10,651 12,081 33 88 168 2,200 2,301 — 1 4 21 21 Colorado — 304 488 5,082 8,811 N 0 0 N N 5 2 26 37 33 Idaho§ — 55 233 1,483 1,925 N 0 0 N N — 2 71 29 7 Montana§ 31 50 363 1,466 1,407 N 0 0 N N 2 1 7 20 11 Nevada§ 128 185 416 4,814 4,656 1 1 7 31 33 — 0 6 6 5 New Mexico§ 81 140 561 3,252 4,742 — 0 3 13 16 — 2 9 23 33 Utah — 115 209 2,695 2,675 — 0 7 4 28 — 1 484 12 3 Wyoming§ — 12 34 11 618 — 0 1 1 — — 0 8 8 8
Pacific 1,424 3,378 4,676 80,626 88,892 16 30 217 968 1,490 1 2 20 33 41 Alaska 84 94 129 2,287 2,433 N 0 0 N N — 0 2 1 1 California 1,172 2,825 4,115 70,509 69,253 16 30 217 968 1,490 — 0 0 — — Hawaii 5 110 152 2,716 2,859 N 0 0 N N — 0 4 1 — Oregon§ 163 184 402 5,001 4,775 N 0 0 N N 1 2 16 31 40 Washington — 248 498 113 9,572 N 0 0 N N — 0 0 — —
American Samoa 8 0 22 70 73 N 0 0 N N N 0 0 N N C.N.M.I. — — — — — — — — — — — — — — — Guam — 12 26 93 424 — 0 0 — — — 0 0 — — Puerto Rico 94 116 612 3,551 3,835 N 0 0 N N N 0 0 N N U.S. Virgin Islands — 6 21 292 102 — 0 0 — — — 0 0 — —
C.N.M.I.: Commonwealth of Northern Mariana Islands. U: Unavailable. —: No reported cases. N: Not notifiable. Cum: Cumulative year-to-date counts. Med: Median. Max: Maximum. * Incidence data for reporting years 2007 and 2008 are provisional. Data for HIV/AIDS, AIDS, and TB, when available, are displayed in Table IV, which appears quarterly.†
Chlamydia refers to genital infections caused by Chlamydia trachomatis.§
Contains data reported through the National Electronic Disease Surveillance System (NEDSS).
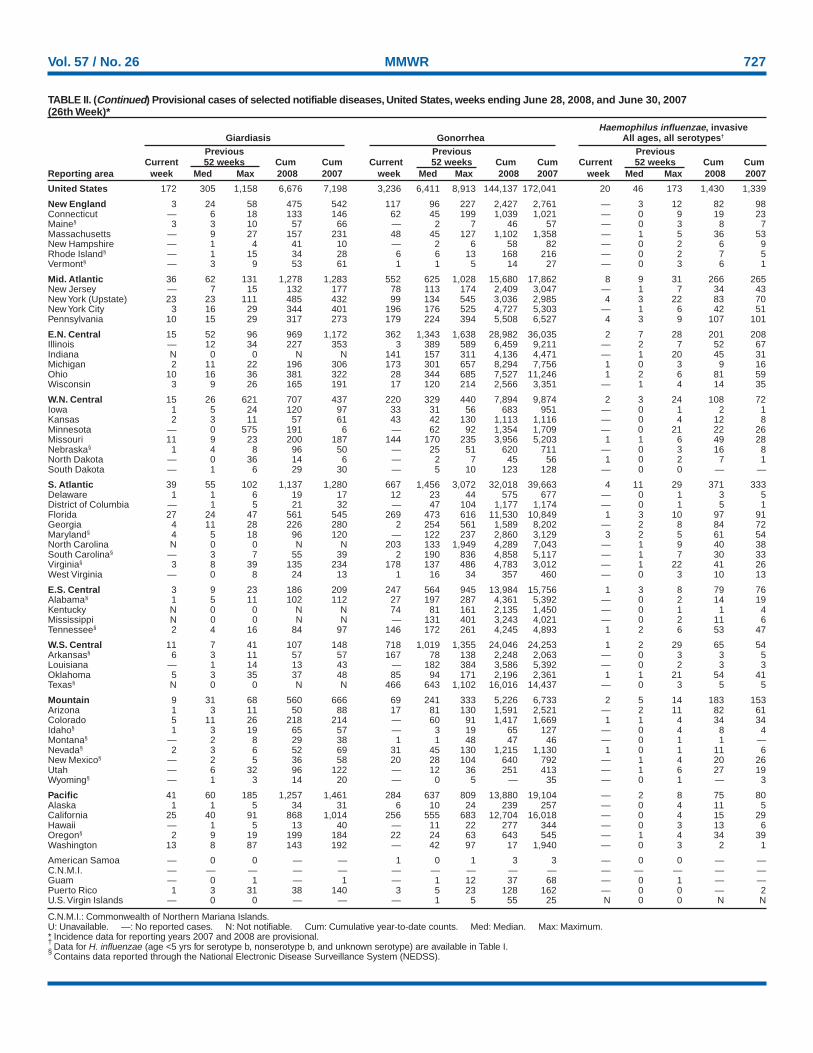
727 Vol. 57 / No. 26 MMWR
TABLE II. (Continued) Provisional cases of selected notifiable diseases, United States, weeks ending June 28, 2008, and June 30, 2007 (26th Week)*
Haemophilus influenzae, invasive Giardiasis Gonorrhea All ages, all serotypes†
Previous Previous Previous Current 52 weeks Cum Cum Current 52 weeks Cum Cum Current 52 weeks Cum Cum
Reporting area week Med Max 2008 2007 week Med Max 2008 2007 week Med Max 2008 2007
United States 172 305 1,158 6,676 7,198 3,236 6,411 8,913 144,137 172,041 20 46 173 1,430 1,339
New England 3 24 58 475 542 117 96 227 2,427 2,761 — 3 12 82 98 Connecticut — 6 18 133 146 62 45 199 1,039 1,021 — 0 9 19 23 Maine§ 3 3 10 57 66 — 2 7 46 57 — 0 3 8 7 Massachusetts — 9 27 157 231 48 45 127 1,102 1,358 — 1 5 36 53 New Hampshire — 1 4 41 10 — 2 6 58 82 — 0 2 6 9 Rhode Island§ — 1 15 34 28 6 6 13 168 216 — 0 2 7 5 Vermont§ — 3 9 53 61 1 1 5 14 27 — 0 3 6 1
Mid. Atlantic 36 62 131 1,278 1,283 552 625 1,028 15,680 17,862 8 9 31 266 265 New Jersey — 7 15 132 177 78 113 174 2,409 3,047 — 1 7 34 43 New York (Upstate) 23 23 111 485 432 99 134 545 3,036 2,985 4 3 22 83 70 New York City 3 16 29 344 401 196 176 525 4,727 5,303 — 1 6 42 51 Pennsylvania 10 15 29 317 273 179 224 394 5,508 6,527 4 3 9 107 101
E.N. Central 15 52 96 969 1,172 362 1,343 1,638 28,982 36,035 2 7 28 201 208 Illinois — 12 34 227 353 3 389 589 6,459 9,211 — 2 7 52 67 Indiana N 0 0 N N 141 157 311 4,136 4,471 — 1 20 45 31 Michigan 2 11 22 196 306 173 301 657 8,294 7,756 1 0 3 9 16 Ohio 10 16 36 381 322 28 344 685 7,527 11,246 1 2 6 81 59 Wisconsin 3 9 26 165 191 17 120 214 2,566 3,351 — 1 4 14 35
W.N. Central 15 26 621 707 437 220 329 440 7,894 9,874 2 3 24 108 72 Iowa 1 5 24 120 97 33 31 56 683 951 — 0 1 2 1 Kansas 2 3 11 57 61 43 42 130 1,113 1,116 — 0 4 12 8 Minnesota — 0 575 191 6 — 62 92 1,354 1,709 — 0 21 22 26 Missouri 11 9 23 200 187 144 170 235 3,956 5,203 1 1 6 49 28 Nebraska§ 1 4 8 96 50 — 25 51 620 711 — 0 3 16 8 North Dakota — 0 36 14 6 — 2 7 45 56 1 0 2 7 1 South Dakota — 1 6 29 30 — 5 10 123 128 — 0 0 — —
S. Atlantic 39 55 102 1,137 1,280 667 1,456 3,072 32,018 39,663 4 11 29 371 333 Delaware 1 1 6 19 17 12 23 44 575 677 — 0 1 3 5 District of Columbia — 1 5 21 32 — 47 104 1,177 1,174 — 0 1 5 1 Florida 27 24 47 561 545 269 473 616 11,530 10,849 1 3 10 97 91 Georgia 4 11 28 226 280 2 254 561 1,589 8,202 — 2 8 84 72 Maryland§ 4 5 18 96 120 — 122 237 2,860 3,129 3 2 5 61 54 North Carolina N 0 0 N N 203 133 1,949 4,289 7,043 — 1 9 40 38 South Carolina§ — 3 7 55 39 2 190 836 4,858 5,117 — 1 7 30 33 Virginia§ 3 8 39 135 234 178 137 486 4,783 3,012 — 1 22 41 26 West Virginia — 0 8 24 13 1 16 34 357 460 — 0 3 10 13
E.S. Central 3 9 23 186 209 247 564 945 13,984 15,756 1 3 8 79 76 Alabama§ 1 5 11 102 112 27 197 287 4,361 5,392 — 0 2 14 19 Kentucky N 0 0 N N 74 81 161 2,135 1,450 — 0 1 1 4 Mississippi N 0 0 N N — 131 401 3,243 4,021 — 0 2 11 6 Tennessee§ 2 4 16 84 97 146 172 261 4,245 4,893 1 2 6 53 47
W.S. Central 11 7 41 107 148 718 1,019 1,355 24,046 24,253 1 2 29 65 54 Arkansas§ 6 3 11 57 57 167 78 138 2,248 2,063 — 0 3 3 5 Louisiana — 1 14 13 43 — 182 384 3,586 5,392 — 0 2 3 3 Oklahoma 5 3 35 37 48 85 94 171 2,196 2,361 1 1 21 54 41 Texas§ N 0 0 N N 466 643 1,102 16,016 14,437 — 0 3 5 5
Mountain 9 31 68 560 666 69 241 333 5,226 6,733 2 5 14 183 153 Arizona 1 3 11 50 88 17 81 130 1,591 2,521 — 2 11 82 61 Colorado 5 11 26 218 214 — 60 91 1,417 1,669 1 1 4 34 34 Idaho§ 1 3 19 65 57 — 3 19 65 127 — 0 4 8 4 Montana§ — 2 8 29 38 1 1 48 47 46 — 0 1 1 — Nevada§ 2 3 6 52 69 31 45 130 1,215 1,130 1 0 1 11 6 New Mexico§ — 2 5 36 58 20 28 104 640 792 — 1 4 20 26 Utah — 6 32 96 122 — 12 36 251 413 — 1 6 27 19 Wyoming§ — 1 3 14 20 — 0 5 — 35 — 0 1 — 3
Pacific 41 60 185 1,257 1,461 284 637 809 13,880 19,104 — 2 8 75 80 Alaska 1 1 5 34 31 6 10 24 239 257 — 0 4 11 5 California 25 40 91 868 1,014 256 555 683 12,704 16,018 — 0 4 15 29 Hawaii — 1 5 13 40 — 11 22 277 344 — 0 3 13 6 Oregon§ 2 9 19 199 184 22 24 63 643 545 — 1 4 34 39 Washington 13 8 87 143 192 — 42 97 17 1,940 — 0 3 2 1
American Samoa — 0 0 — — 1 0 1 3 3 — 0 0 — — C.N.M.I. — — — — — — — — — — — — — — — Guam — 0 1 — 1 — 1 12 37 68 — 0 1 — — Puerto Rico 1 3 31 38 140 3 5 23 128 162 — 0 0 — 2 U.S. Virgin Islands — 0 0 — — — 1 5 55 25 N 0 0 N N
C.N.M.I.: Commonwealth of Northern Mariana Islands. U: Unavailable. —: No reported cases. N: Not notifiable. Cum: Cumulative year-to-date counts. Med: Median. Max: Maximum. * Incidence data for reporting years 2007 and 2008 are provisional.†
Data for H. influenzae (age <5 yrs for serotype b, nonserotype b, and unknown serotype) are available in Table I. §
Contains data reported through the National Electronic Disease Surveillance System (NEDSS).

728 MMWR July 4, 2008
TABLE II. (Continued) Provisional cases of selected notifiable diseases, United States, weeks ending June 28, 2008, and June 30, 2007 (26th Week)*
Hepatitis (viral, acute), by type†
A B Legionellosis Previous Previous Previous
Current 52 weeks Cum Cum Current 52 weeks Cum Cum Current 52 weeks Cum Cum Reporting area week Med Max 2008 2007 week Med Max 2008 2007 week Med Max 2008 2007
United States 33 54 167 1,228 1,350 29 77 262 1,589 2,110 38 50 117 910 882
New England — 2 7 48 54 — 1 6 24 61 4 3 14 36 46 Connecticut — 0 3 11 8 — 0 5 9 23 4 1 4 12 5 Maine§ — 0 1 3 1 — 0 2 7 3 — 0 2 1 1 Massachusetts — 1 5 18 27 — 0 3 3 25 — 0 3 1 21 New Hampshire — 0 2 4 10 — 0 1 1 4 — 0 2 4 1 Rhode Island§ — 0 2 11 6 — 0 3 3 5 — 0 5 14 15 Vermont§ — 0 1 1 2 — 0 1 1 1 — 0 2 4 3
Mid. Atlantic 3 6 18 130 211 2 9 18 188 284 13 14 37 216 243 New Jersey — 1 6 22 63 — 2 7 36 85 — 1 13 17 31 New York (Upstate) — 1 6 31 35 1 2 7 37 41 4 4 15 66 70 New York City 1 2 7 41 70 — 2 5 36 65 — 2 11 21 58 Pennsylvania 2 1 6 36 43 1 3 7 79 93 9 6 21 112 84
E.N. Central — 6 15 142 158 2 8 17 161 237 5 11 35 184 198 Illinois — 2 10 45 64 — 1 6 36 82 — 1 16 19 39 Indiana — 0 4 7 4 — 0 8 18 20 — 1 7 17 15 Michigan — 2 7 56 39 1 2 6 47 64 — 3 11 44 65 Ohio — 1 3 22 33 1 2 7 57 71 5 4 17 100 69 Wisconsin — 0 2 12 18 — 0 1 3 — — 0 5 4 10
W.N. Central — 5 29 165 82 1 2 9 48 56 2 2 10 45 36 Iowa — 1 7 72 18 — 0 2 7 12 — 0 2 6 3 Kansas — 0 3 8 3 — 0 3 6 6 — 0 1 1 5 Minnesota — 0 23 18 42 — 0 5 4 9 — 0 6 4 5 Missouri — 1 3 28 9 1 1 4 27 20 2 1 3 24 18 Nebraska§ — 1 5 37 6 — 0 1 4 6 — 0 2 9 3 North Dakota — 0 2 — — — 0 1 — — — 0 2 — — South Dakota — 0 1 2 4 — 0 2 — 3 — 0 1 1 2
S. Atlantic 12 9 22 169 232 9 16 60 424 522 8 8 28 184 180 Delaware — 0 1 3 3 — 0 3 6 9 — 0 2 5 6 District of Columbia — 0 0 — — — 0 0 — — — 0 1 6 7 Florida 3 3 8 73 69 4 6 12 167 171 3 3 10 72 66 Georgia — 1 5 23 43 3 3 8 61 73 — 1 3 12 20 Maryland§ — 1 3 18 41 1 2 6 36 61 4 2 6 43 31 North Carolina 9 0 9 26 20 — 0 17 48 70 — 0 7 11 21 South Carolina§ — 0 4 6 5 1 1 6 34 37 — 0 2 5 8 Virginia§ — 1 5 17 48 — 2 16 49 74 1 1 6 26 18 West Virginia — 0 2 3 3 — 0 30 23 27 — 0 3 4 3
E.S. Central — 2 9 38 47 2 7 13 164 171 3 2 7 55 44 Alabama§ — 0 4 4 8 — 2 5 46 62 — 0 1 5 5 Kentucky — 0 2 14 9 1 2 7 48 29 1 1 3 27 20 Mississippi — 0 1 2 6 — 0 3 16 19 — 0 1 1 — Tennessee§ — 1 6 18 24 1 2 8 54 61 2 1 4 22 19
W.S. Central — 5 51 110 98 6 17 134 328 416 — 2 23 31 43 Arkansas§ — 0 1 3 6 — 1 3 17 38 — 0 2 5 6 Louisiana — 0 3 4 15 — 1 8 20 54 — 0 2 — 2 Oklahoma — 0 7 4 3 2 2 37 45 24 — 0 3 3 1 Texas§ — 5 49 99 74 4 11 110 246 300 — 2 18 23 34
Mountain 3 4 10 105 130 2 3 7 83 116 — 2 6 39 38 Arizona — 2 6 47 93 — 1 4 19 50 — 1 5 11 9 Colorado 2 0 3 22 17 2 0 3 12 18 — 0 2 3 9 Idaho§ 1 0 3 15 2 — 0 2 4 6 — 0 1 2 4 Montana§ — 0 2 — 4 — 0 1 — — — 0 1 2 1 Nevada§ — 0 1 3 7 — 1 3 20 27 — 0 2 6 3 New Mexico§ — 0 3 14 3 — 0 2 7 9 — 0 1 3 4 Utah — 0 2 2 2 — 0 5 19 4 — 0 3 12 5 Wyoming§ — 0 1 2 2 — 0 1 2 2 — 0 0 — 3
Pacific 15 13 51 321 338 5 9 30 169 247 3 4 18 120 54 Alaska — 0 1 2 2 1 0 2 8 4 — 0 1 1 — California 14 11 42 262 301 3 6 19 117 183 2 3 14 93 43 Hawaii — 0 2 4 5 — 0 2 3 5 — 0 1 4 1 Oregon§ — 1 3 20 13 1 1 4 22 33 — 0 2 8 3 Washington 1 1 7 33 17 — 1 9 19 22 1 0 3 14 7
American Samoa — 0 0 — — — 0 0 — 14 N 0 0 N N C.N.M.I. — — — — — — — — — — — — — — — Guam — 0 0 — — — 0 1 — 2 — 0 0 — — Puerto Rico 1 0 4 9 41 — 1 5 21 40 — 0 1 1 3 U.S. Virgin Islands — 0 0 — — — 0 0 — — — 0 0 — —
C.N.M.I.: Commonwealth of Northern Mariana Islands. U: Unavailable. —: No reported cases. N: Not notifiable. Cum: Cumulative year-to-date counts. Med: Median. Max: Maximum. * Incidence data for reporting years 2007 and 2008 are provisional.†
Data for acute hepatitis C, viral are available in Table I. §
Contains data reported through the National Electronic Disease Surveillance System (NEDSS).

729 Vol. 57 / No. 26 MMWR
TABLE II. (Continued) Provisional cases of selected notifiable diseases, United States, weeks ending June 28, 2008, and June 30, 2007 (26th Week)*
Meningococcal disease, invasive†
Lyme disease Malaria All serogroups Previous Previous Previous
Current 52 weeks Cum Cum Current 52 weeks Cum Cum Current 52 weeks Cum Cum Reporting area week Med Max 2008 2007 week Med Max 2008 2007 week Med Max 2008 2007
United States 284 276 1,627 4,497 8,881 15 22 136 369 535 12 19 52 620 621
New England 4 28 675 287 2,898 — 1 35 10 26 — 0 3 16 32 Connecticut — 6 280 — 1,369 — 0 27 5 1 — 0 1 1 5 Maine§ — 6 61 70 40 — 0 2 — 3 — 0 1 3 5 Massachusetts — 6 280 28 1,096 — 0 3 2 17 — 0 3 12 15 New Hampshire — 9 96 157 348 — 0 4 1 5 — 0 0 — 3 Rhode Island§ — 0 77 — 1 — 0 8 — — — 0 1 — 1 Vermont§ 4 2 13 32 44 — 0 2 2 — — 0 1 — 3
Mid. Atlantic 219 164 662 2,675 3,279 — 6 18 82 148 — 2 6 68 72 New Jersey — 26 220 322 1,393 — 0 7 — 31 — 0 1 3 10 New York (Upstate) 162 63 453 897 652 — 1 8 13 28 — 0 3 20 21 New York City — 2 27 4 139 — 3 9 56 77 — 0 2 13 16 Pennsylvania 57 54 293 1,452 1,095 — 1 4 13 12 — 1 5 32 25
E.N. Central 1 6 221 39 865 — 2 7 52 72 1 3 9 94 94 Illinois — 0 16 2 61 — 1 6 23 36 — 1 3 28 38 Indiana — 0 7 2 13 — 0 1 2 5 — 0 4 16 13 Michigan — 0 5 11 13 — 0 2 8 9 — 0 2 13 16 Ohio 1 0 4 10 5 — 0 3 16 12 1 1 4 28 22 Wisconsin — 4 201 14 773 — 0 3 3 10 — 0 2 9 5
W.N. Central — 3 740 199 142 — 1 8 22 19 — 2 8 59 40 Iowa — 1 8 13 63 — 0 1 2 2 — 0 3 11 9 Kansas — 0 1 1 8 — 0 1 3 1 — 0 1 1 2 Minnesota — 0 731 168 63 — 0 8 6 11 — 0 7 16 10 Missouri — 0 3 12 5 — 0 4 6 2 — 0 3 20 12 Nebraska§ — 0 1 3 3 — 0 2 5 2 — 0 2 9 2 North Dakota — 0 9 1 — — 0 2 — — — 0 1 1 2 South Dakota — 0 1 1 — — 0 0 — 1 — 0 1 1 3
S. Atlantic 52 62 221 1,123 1,595 10 5 15 105 114 5 3 7 91 92 Delaware 11 12 34 343 320 — 0 1 1 3 — 0 1 1 1 District of Columbia 2 2 8 53 60 — 0 1 — 2 — 0 0 — — Florida 1 1 4 18 2 — 1 7 24 22 1 1 5 32 31 Georgia — 0 3 3 4 — 1 3 20 16 — 0 3 12 10 Maryland§ 20 30 136 529 893 — 1 5 28 33 — 0 2 10 17 North Carolina — 0 8 2 19 7 0 2 11 12 3 0 4 8 11 South Carolina§ — 0 4 7 11 — 0 1 3 4 1 0 3 13 9 Virginia§ 18 13 68 160 280 3 1 7 18 22 — 0 2 13 13 West Virginia — 0 9 8 6 — 0 1 — — — 0 1 2 —
E.S. Central — 1 7 19 27 — 0 3 7 17 1 1 6 36 33 Alabama§ — 0 3 8 9 — 0 1 3 2 1 0 2 4 7 Kentucky — 0 2 1 — — 0 1 3 4 — 0 2 7 6 Mississippi — 0 1 — — — 0 1 — 1 — 0 2 9 8 Tennessee§ — 0 5 10 18 — 0 2 1 10 — 0 3 16 12
W.S. Central — 1 11 24 33 — 1 64 16 43 1 2 13 64 64 Arkansas§ — 0 1 — — — 0 1 — — — 0 1 6 7 Louisiana — 0 0 — 2 — 0 1 — 13 — 0 3 12 21 Oklahoma — 0 1 — — — 0 4 2 3 1 0 5 10 11 Texas§ — 1 10 24 31 — 1 60 14 27 — 1 7 36 25
Mountain 1 0 3 10 13 — 1 5 12 29 — 1 4 33 44 Arizona — 0 1 2 — — 0 1 5 5 — 0 2 5 11 Colorado 1 0 1 2 — — 0 2 3 11 — 0 2 8 14 Idaho§ — 0 2 4 4 — 0 2 — — — 0 2 2 4 Montana§ — 0 2 1 1 — 0 1 — 2 — 0 1 4 1 Nevada§ — 0 2 1 6 — 0 3 4 1 — 0 2 6 3 New Mexico§ — 0 2 — 1 — 0 1 — 1 — 0 1 4 2 Utah — 0 1 — 1 — 0 1 — 9 — 0 2 2 7 Wyoming§ — 0 1 — — — 0 0 — — — 0 1 2 2
Pacific 7 4 8 121 29 5 3 10 63 67 4 4 17 159 150 Alaska — 0 2 1 2 1 0 2 3 2 — 0 2 3 1 California 4 3 8 103 25 4 2 8 50 44 3 3 17 118 110 Hawaii N 0 0 N N — 0 1 2 2 — 0 2 1 4 Oregon§ 3 0 3 17 2 — 0 2 4 12 — 0 3 21 21 Washington — 0 7 — — — 0 3 4 7 1 0 5 16 14
American Samoa N 0 0 N N — 0 0 — — — 0 0 — — C.N.M.I. — — — — — — — — — — — — — — — Guam — 0 0 — — — 0 1 1 — — 0 0 — — Puerto Rico N 0 0 N N — 0 1 1 1 — 0 1 2 5 U.S. Virgin Islands N 0 0 N N — 0 0 — — — 0 0 — —
C.N.M.I.: Commonwealth of Northern Mariana Islands. U: Unavailable. —: No reported cases. N: Not notifiable. Cum: Cumulative year-to-date counts. Med: Median. Max: Maximum. * Incidence data for reporting years 2007 and 2008 are provisional.†
Data for meningococcal disease, invasive caused by serogroups A, C, Y, & W-135; serogroup B; other serogroup; and unknown serogroup are available in Table I. §
Contains data reported through the National Electronic Disease Surveillance System (NEDSS).
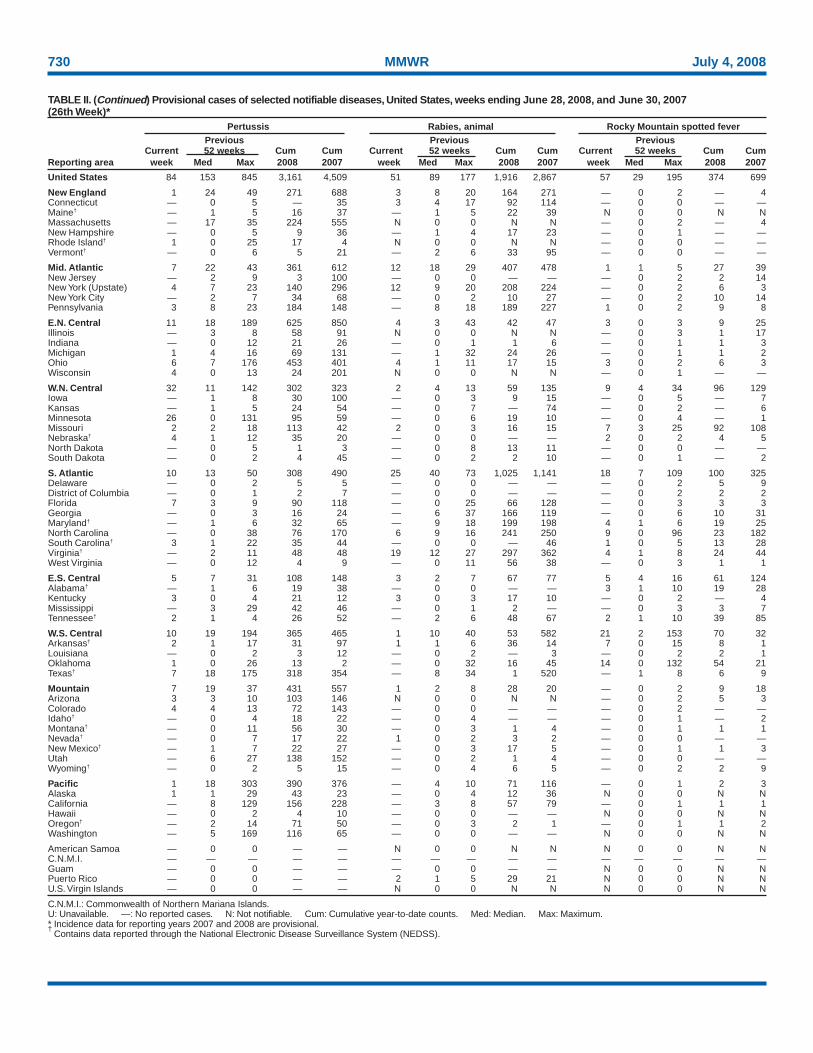
730 MMWR July 4, 2008
TABLE II. (Continued) Provisional cases of selected notifiable diseases, United States, weeks ending June 28, 2008, and June 30, 2007 (26th Week)*
Pertussis Rabies, animal Rocky Mountain spotted fever Previous Previous Previous
Current 52 weeks Cum Cum Current 52 weeks Cum Cum Current 52 weeks Cum Cum Reporting area week Med Max 2008 2007 week Med Max 2008 2007 week Med Max 2008 2007
United States 84 153 845 3,161 4,509 51 89 177 1,916 2,867 57 29 195 374 699
New England 1 24 49 271 688 3 8 20 164 271 — 0 2 — 4 Connecticut — 0 5 — 35 3 4 17 92 114 — 0 0 — — Maine† — 1 5 16 37 — 1 5 22 39 N 0 0 N N Massachusetts — 17 35 224 555 N 0 0 N N — 0 2 — 4 New Hampshire — 0 5 9 36 — 1 4 17 23 — 0 1 — — Rhode Island† 1 0 25 17 4 N 0 0 N N — 0 0 — — Vermont† — 0 6 5 21 — 2 6 33 95 — 0 0 — —
Mid. Atlantic 7 22 43 361 612 12 18 29 407 478 1 1 5 27 39 New Jersey — 2 9 3 100 — 0 0 — — — 0 2 2 14 New York (Upstate) 4 7 23 140 296 12 9 20 208 224 — 0 2 6 3 New York City — 2 7 34 68 — 0 2 10 27 — 0 2 10 14 Pennsylvania 3 8 23 184 148 — 8 18 189 227 1 0 2 9 8
E.N. Central 11 18 189 625 850 4 3 43 42 47 3 0 3 9 25 Illinois — 3 8 58 91 N 0 0 N N — 0 3 1 17 Indiana — 0 12 21 26 — 0 1 1 6 — 0 1 1 3 Michigan 1 4 16 69 131 — 1 32 24 26 — 0 1 1 2 Ohio 6 7 176 453 401 4 1 11 17 15 3 0 2 6 3 Wisconsin 4 0 13 24 201 N 0 0 N N — 0 1 — —
W.N. Central 32 11 142 302 323 2 4 13 59 135 9 4 34 96 129 Iowa — 1 8 30 100 — 0 3 9 15 — 0 5 — 7 Kansas — 1 5 24 54 — 0 7 — 74 — 0 2 — 6 Minnesota 26 0 131 95 59 — 0 6 19 10 — 0 4 — 1 Missouri 2 2 18 113 42 2 0 3 16 15 7 3 25 92 108 Nebraska† 4 1 12 35 20 — 0 0 — — 2 0 2 4 5 North Dakota — 0 5 1 3 — 0 8 13 11 — 0 0 — — South Dakota — 0 2 4 45 — 0 2 2 10 — 0 1 — 2
S. Atlantic 10 13 50 308 490 25 40 73 1,025 1,141 18 7 109 100 325 Delaware — 0 2 5 5 — 0 0 — — — 0 2 5 9 District of Columbia — 0 1 2 7 — 0 0 — — — 0 2 2 2 Florida 7 3 9 90 118 — 0 25 66 128 — 0 3 3 3 Georgia — 0 3 16 24 — 6 37 166 119 — 0 6 10 31 Maryland† — 1 6 32 65 — 9 18 199 198 4 1 6 19 25 North Carolina — 0 38 76 170 6 9 16 241 250 9 0 96 23 182 South Carolina† 3 1 22 35 44 — 0 0 — 46 1 0 5 13 28 Virginia† — 2 11 48 48 19 12 27 297 362 4 1 8 24 44 West Virginia — 0 12 4 9 — 0 11 56 38 — 0 3 1 1
E.S. Central 5 7 31 108 148 3 2 7 67 77 5 4 16 61 124 Alabama† — 1 6 19 38 — 0 0 — — 3 1 10 19 28 Kentucky 3 0 4 21 12 3 0 3 17 10 — 0 2 — 4 Mississippi — 3 29 42 46 — 0 1 2 — — 0 3 3 7 Tennessee† 2 1 4 26 52 — 2 6 48 67 2 1 10 39 85
W.S. Central 10 19 194 365 465 1 10 40 53 582 21 2 153 70 32 Arkansas† 2 1 17 31 97 1 1 6 36 14 7 0 15 8 1 Louisiana — 0 2 3 12 — 0 2 — 3 — 0 2 2 1 Oklahoma 1 0 26 13 2 — 0 32 16 45 14 0 132 54 21 Texas† 7 18 175 318 354 — 8 34 1 520 — 1 8 6 9
Mountain 7 19 37 431 557 1 2 8 28 20 — 0 2 9 18 Arizona 3 3 10 103 146 N 0 0 N N — 0 2 5 3 Colorado 4 4 13 72 143 — 0 0 — — — 0 2 — — Idaho† — 0 4 18 22 — 0 4 — — — 0 1 — 2 Montana† — 0 11 56 30 — 0 3 1 4 — 0 1 1 1 Nevada† — 0 7 17 22 1 0 2 3 2 — 0 0 — — New Mexico† — 1 7 22 27 — 0 3 17 5 — 0 1 1 3 Utah — 6 27 138 152 — 0 2 1 4 — 0 0 — — Wyoming† — 0 2 5 15 — 0 4 6 5 — 0 2 2 9
Pacific 1 18 303 390 376 — 4 10 71 116 — 0 1 2 3 Alaska 1 1 29 43 23 — 0 4 12 36 N 0 0 N N California — 8 129 156 228 — 3 8 57 79 — 0 1 1 1 Hawaii — 0 2 4 10 — 0 0 — — N 0 0 N N Oregon† — 2 14 71 50 — 0 3 2 1 — 0 1 1 2 Washington — 5 169 116 65 — 0 0 — — N 0 0 N N
American Samoa — 0 0 — — N 0 0 N N N 0 0 N N C.N.M.I. — — — — — — — — — — — — — — — Guam — 0 0 — — — 0 0 — — N 0 0 N N Puerto Rico — 0 0 — — 2 1 5 29 21 N 0 0 N N U.S. Virgin Islands — 0 0 — — N 0 0 N N N 0 0 N N
C.N.M.I.: Commonwealth of Northern Mariana Islands. U: Unavailable. —: No reported cases. N: Not notifiable. Cum: Cumulative year-to-date counts. Med: Median. Max: Maximum. * Incidence data for reporting years 2007 and 2008 are provisional.†
Contains data reported through the National Electronic Disease Surveillance System (NEDSS).

Vol. 57 / No. 26 MMWR 731
TABLE II. (Continued) Provisional cases of selected notifiable diseases, United States, weeks ending June 28, 2008, and June 30, 2007 (26th Week)*
Salmonellosis Shiga toxin-producing E. coli (STEC)† Shigellosis Previous Previous Previous
Current 52 weeks Cum Cum Current 52 weeks Cum Cum Current 52 weeks Cum Cum Reporting area week Med Max 2008 2007 week Med Max 2008 2007 week Med Max 2008 2007
United States 614 809 2,109 14,981 17,767 47 76 244 1,598 1,487 239 395 1,235 7,981 7,201
New England 1 20 222 591 1,257 — 4 19 68 150 — 3 22 66 143 Connecticut — 0 193 193 431 — 0 15 15 71 — 0 20 20 44 Maine§ — 2 14 60 54 — 0 4 4 17 — 0 1 3 12 Massachusetts — 14 60 221 623 — 2 9 24 45 — 2 8 34 75 New Hampshire — 3 10 46 66 — 0 5 13 9 — 0 1 1 4 Rhode Island§ 1 1 13 37 46 — 0 3 7 3 — 0 9 7 6 Vermont§ — 1 6 34 37 — 0 3 5 5 — 0 1 1 2
Mid. Atlantic 71 87 212 1,846 2,463 2 8 194 340 173 15 26 78 933 257 New Jersey — 16 48 283 531 — 1 7 6 45 — 6 16 188 57 New York (Upstate) 38 25 73 530 585 1 4 190 279 55 14 7 36 321 50 New York City 4 22 48 449 536 — 1 5 21 19 — 8 35 369 108 Pennsylvania 29 30 83 584 811 1 2 11 34 54 1 2 65 55 42
E.N. Central 41 88 263 1,751 2,556 5 10 36 176 189 44 73 145 1,425 926 Illinois — 24 187 454 895 — 1 13 18 31 — 17 37 392 262 Indiana — 9 34 183 245 — 1 12 15 17 — 10 83 365 29 Michigan 7 16 43 296 399 1 2 10 36 31 — 1 7 31 27 Ohio 33 26 65 593 555 3 2 17 67 53 42 21 104 433 302 Wisconsin 1 14 37 225 462 1 3 16 40 57 2 11 39 204 306
W.N. Central 32 52 95 1,098 1,203 10 13 38 249 232 2 23 57 431 1,030 Iowa 2 9 18 179 207 — 2 13 48 50 — 2 9 69 38 Kansas 5 6 21 126 191 1 1 4 18 23 — 0 2 8 16 Minnesota — 13 39 285 285 — 3 15 60 71 — 4 11 112 122 Missouri 14 15 29 316 317 6 3 12 74 42 1 9 37 135 803 Nebraska§ 8 5 13 115 103 3 2 6 31 25 — 0 3 — 12 North Dakota 3 0 35 22 16 — 0 20 2 5 1 0 15 32 3 South Dakota — 2 11 55 84 — 1 5 16 16 — 2 31 75 36
S. Atlantic 240 236 442 3,907 4,189 12 12 40 272 254 51 75 149 1,617 2,370 Delaware 2 3 8 62 60 — 0 2 7 10 — 0 2 7 4 District of Columbia — 1 4 21 29 — 0 1 5 — — 0 3 5 7 Florida 134 92 181 1,832 1,704 4 2 18 82 65 14 26 75 466 1,323 Georgia 49 37 86 627 657 2 1 6 25 28 23 27 47 635 850 Maryland§ 17 15 44 286 311 1 2 5 45 36 1 2 7 26 47 North Carolina 22 19 228 376 563 4 1 24 28 37 4 1 12 51 33 South Carolina§ 6 20 52 329 331 — 0 3 17 5 6 8 32 342 43 Virginia§ 10 19 49 304 474 1 2 9 49 70 3 4 14 78 62 West Virginia — 4 25 70 60 — 0 3 14 3 — 0 61 7 1
E.S. Central 37 54 144 978 1,153 1 5 26 108 65 11 52 178 982 690 Alabama§ 9 15 50 272 324 — 1 19 36 13 2 13 43 222 260 Kentucky 13 9 23 163 212 — 1 12 17 18 3 11 35 174 136 Mississippi — 14 57 252 277 — 0 1 3 3 — 18 112 221 201 Tennessee§ 15 16 34 291 340 1 2 12 52 31 6 11 32 365 93
W.S. Central 48 105 893 1,430 1,496 1 5 25 87 106 67 55 756 1,617 902 Arkansas§ 23 13 50 216 220 — 1 4 21 20 2 2 19 194 45 Louisiana 1 9 44 80 314 — 0 1 — 6 1 5 22 78 271 Oklahoma 24 11 72 247 170 1 0 14 14 12 3 3 32 49 47 Texas§ — 56 793 887 792 — 3 11 52 68 61 39 710 1,296 539
Mountain 40 56 83 1,308 1,124 3 8 42 166 169 31 18 40 332 354 Arizona 16 17 40 384 366 1 1 8 27 49 14 9 30 151 177 Colorado 16 11 44 388 260 — 2 17 45 29 4 2 6 42 49 Idaho§ 1 3 10 74 53 2 2 16 36 31 — 0 2 5 6 Montana§ — 1 10 36 45 — 0 3 13 — — 0 1 1 13 Nevada§ 7 5 12 100 121 — 0 3 11 14 13 2 10 103 15 New Mexico§ — 6 26 175 115 — 0 5 16 22 — 1 6 17 56 Utah — 5 17 129 122 — 1 9 14 24 — 1 5 10 13 Wyoming§ — 1 5 22 42 — 0 1 4 — — 0 2 3 25
Pacific 104 110 399 2,072 2,326 13 9 40 132 149 18 30 79 578 529 Alaska 1 1 5 24 46 — 0 1 3 — — 0 1 — 7 California 70 78 286 1,522 1,747 7 5 34 79 86 17 26 61 501 427 Hawaii 1 5 14 100 116 2 0 5 5 14 — 1 43 19 15 Oregon§ 3 6 15 161 154 — 1 11 13 17 — 1 6 24 33 Washington 29 12 103 265 263 4 1 13 32 32 1 2 20 34 47
American Samoa — 0 1 1 — — 0 0 — — — 0 1 1 3 C.N.M.I. — — — — — — — — — — — — — — — Guam — 0 2 6 11 — 0 0 — — — 0 3 11 10 Puerto Rico 1 12 55 152 364 — 0 1 2 — — 0 2 4 18 U.S. Virgin Islands — 0 0 — — — 0 0 — — — 0 0 — —
C.N.M.I.: Commonwealth of Northern Mariana Islands. U: Unavailable. —: No reported cases. N: Not notifiable. Cum: Cumulative year-to-date counts. Med: Median. Max: Maximum. * Incidence data for reporting years 2007 and 2008 are provisional.†
Includes E. coli O157:H7; Shiga toxin-positive, serogroup non-O157; and Shiga toxin-positive, not serogrouped. §
Contains data reported through the National Electronic Disease Surveillance System (NEDSS).

732 MMWR July 4, 2008
TABLE II. (Continued) Provisional cases of selected notifiable diseases, United States, weeks ending June 28, 2008, and June 30, 2007 (26th Week)*
Streptococcus pneumoniae, invasive disease, nondrug resistant†
Streptococcal disease, invasive, group A Age <5 years Previous Previous
Current 52 weeks Cum Cum Current 52 weeks Cum Cum Reporting area week Med Max 2008 2007 week Med Max 2008 2007
United States 49 99 258 3,182 3,245 8 35 166 935 1,004
New England — 6 31 207 255 — 2 14 41 82 Connecticut — 0 28 71 70 — 0 11 — 11 Maine§ — 0 3 16 18 — 0 1 1 1 Massachusetts — 2 7 83 130 — 1 5 30 54 New Hampshire — 0 2 16 20 — 0 1 7 8 Rhode Island§ — 0 6 12 2 — 0 1 2 6 Vermont§ — 0 2 9 15 — 0 1 1 2
Mid. Atlantic 9 16 43 656 641 — 4 19 115 185 New Jersey — 3 9 101 120 — 1 6 21 37 New York (Upstate) 5 6 18 228 191 — 2 14 61 61 New York City — 3 10 116 159 — 1 12 33 87 Pennsylvania 4 5 16 211 171 N 0 0 N N
E.N. Central 10 17 59 655 667 — 6 23 188 184 Illinois — 5 16 175 203 — 1 6 43 45 Indiana — 2 11 87 69 — 0 14 23 11 Michigan — 3 10 85 140 — 1 5 42 54 Ohio 5 4 15 187 163 — 1 5 35 37 Wisconsin 5 1 38 121 92 — 1 9 45 37
W.N. Central — 5 39 256 218 1 2 16 79 54 Iowa — 0 0 — — — 0 0 — — Kansas — 0 6 33 24 — 0 3 13 — Minnesota — 0 35 116 107 — 0 13 28 33 Missouri — 2 10 62 56 — 1 2 23 15 Nebraska§ — 0 3 24 15 1 0 3 6 5 North Dakota — 0 5 9 10 — 0 2 4 1 South Dakota — 0 2 12 6 — 0 1 5 —
S. Atlantic 14 21 51 626 742 3 6 13 147 172 Delaware — 0 2 6 5 — 0 0 — — District of Columbia — 0 2 12 15 — 0 1 1 2 Florida 3 6 11 148 170 2 1 4 41 36 Georgia 4 4 10 127 148 1 1 5 10 39 Maryland§ 1 4 9 113 130 — 1 5 37 42 North Carolina 3 3 22 86 94 N 0 0 N N South Carolina§ — 1 5 35 71 — 1 4 29 20 Virginia§ 3 3 12 80 91 — 0 6 24 29 West Virginia — 0 3 19 18 — 0 1 5 4
E.S. Central 1 4 13 103 118 — 2 11 62 53 Alabama§ N 0 0 N N N 0 0 N N Kentucky — 1 3 20 30 N 0 0 N N Mississippi N 0 0 N N — 0 3 15 4 Tennessee§ 1 3 13 83 88 — 2 9 47 49
W.S. Central 8 8 84 257 185 4 5 66 142 135 Arkansas§ — 0 2 4 15 — 0 2 5 9 Louisiana — 0 1 3 13 — 0 2 2 24 Oklahoma 3 1 19 68 43 1 1 7 46 30 Texas§ 5 5 64 182 114 3 3 58 89 72
Mountain 6 11 22 349 343 — 5 12 151 130 Arizona 4 4 9 126 127 — 2 8 77 64 Colorado 1 3 8 98 88 — 1 4 41 31 Idaho§ 1 0 2 11 6 — 0 1 3 2 Montana§ N 0 0 N N — 0 1 2 — Nevada§ — 0 2 6 3 N 0 0 N N New Mexico§ — 2 7 66 61 — 0 3 13 27 Utah — 1 5 37 53 — 0 4 14 6 Wyoming§ — 0 2 5 5 — 0 1 1 —
Pacific 1 3 10 73 76 — 0 2 10 9 Alaska — 0 3 20 15 N 0 0 N N California — 0 0 — — N 0 0 N N Hawaii 1 2 10 53 61 — 0 2 10 9 Oregon§ N 0 0 N N N 0 0 N N Washington N 0 0 N N N 0 0 N N
American Samoa 8 0 12 30 4 N 0 0 N N C.N.M.I. — — — — — — — — — — Guam — 0 3 — 5 — 0 0 — — Puerto Rico N 0 0 N N N 0 0 N N U.S. Virgin Islands — 0 0 — — N 0 0 N N
C.N.M.I.: Commonwealth of Northern Mariana Islands. U: Unavailable. —: No reported cases. N: Not notifiable. Cum: Cumulative year-to-date counts. Med: Median. Max: Maximum. * Incidence data for reporting years 2007 and 2008 are provisional.†
Includes cases of invasive pneumococcal disease, in children aged <5 years, caused by S. pneumoniae, which is susceptible or for which susceptibility testing is not available (NNDSS event code 11717).
§ Contains data reported through the National Electronic Disease Surveillance System (NEDSS).

733 Vol. 57 / No. 26 MMWR
TABLE II. (Continued) Provisional cases of selected notifiable diseases, United States, weeks ending June 28, 2008, and June 30, 2007 (26th Week)*
Streptococcus pneumoniae, invasive disease, drug resistant†
All ages Age <5 years Syphilis, primary and secondary Previous Previous Previous
Current 52 weeks Cum Cum Current 52 weeks Cum Cum Current 52 weeks Cum Cum Reporting area week Med Max 2008 2007 week Med Max 2008 2007 week Med Max 2008 2007
United States 18 49 262 1,497 1,502 2 9 43 238 300 112 230 351 5,395 5,184
New England — 1 41 28 82 — 0 8 5 12 5 6 14 144 116 Connecticut — 0 37 — 51 — 0 7 — 4 — 0 6 10 14 Maine§ — 0 2 11 7 — 0 1 1 1 — 0 2 6 2 Massachusetts — 0 0 — — — 0 0 — 2 5 4 11 119 70 New Hampshire — 0 0 — — — 0 0 — — — 0 3 6 11 Rhode Island§ — 0 3 7 13 — 0 1 2 3 — 0 3 2 17 Vermont§ — 0 2 10 11 — 0 1 2 2 — 0 5 1 2
Mid. Atlantic 1 3 10 128 90 — 0 2 15 22 19 32 45 866 787 New Jersey — 0 0 — — — 0 0 — — — 4 10 99 97 New York (Upstate) — 1 4 31 29 — 0 2 4 8 2 3 13 68 68 New York City — 0 5 39 — — 0 0 — — 12 17 30 554 488 Pennsylvania 1 1 8 58 61 — 0 2 11 14 5 5 12 145 134
E.N. Central 6 13 50 426 412 — 2 14 67 68 9 16 31 413 427 Illinois — 2 15 56 75 — 0 6 12 24 — 6 19 70 224 Indiana — 3 28 132 94 — 0 11 16 12 1 2 6 68 21 Michigan — 0 2 7 1 — 0 1 1 1 5 2 17 107 56 Ohio 6 7 15 231 242 — 1 4 38 31 3 4 14 145 94 Wisconsin — 0 0 — — — 0 0 — — — 1 4 23 32
W.N. Central 1 2 106 102 106 — 0 9 7 22 4 8 15 194 153 Iowa — 0 0 — — — 0 0 — — — 0 2 10 8 Kansas — 1 5 43 58 — 0 1 2 4 — 0 5 19 8 Minnesota — 0 105 — 1 — 0 9 — 14 — 1 4 41 34 Missouri 1 1 8 59 39 — 0 1 2 — 4 5 10 121 97 Nebraska§ — 0 0 — 2 — 0 0 — — — 0 1 3 3 North Dakota — 0 0 — — — 0 0 — — — 0 1 — — South Dakota — 0 2 — 6 — 0 1 3 4 — 0 3 — 3
S. Atlantic 7 20 42 612 648 — 4 10 103 142 21 48 215 1,120 1,117 Delaware — 0 1 2 5 — 0 1 — 1 2 0 4 8 6 District of Columbia — 0 3 12 12 — 0 0 — 1 — 2 11 50 98 Florida 4 11 26 337 353 — 2 6 66 74 10 18 34 442 370 Georgia 3 7 19 202 235 — 1 6 30 58 — 10 175 138 163 Maryland§ — 0 2 3 1 — 0 1 1 — — 6 13 144 146 North Carolina N 0 0 N N N 0 0 N N 6 6 18 162 175 South Carolina§ — 0 0 — — — 0 0 — — — 2 5 43 50 Virginia§ N 0 0 N N N 0 0 N N 3 5 17 133 103 West Virginia — 1 7 56 42 — 0 2 6 8 — 0 0 — 6
E.S. Central 3 4 12 158 88 2 1 4 29 17 9 20 31 519 396 Alabama§ N 0 0 N N N 0 0 N N 4 8 17 222 158 Kentucky 2 1 4 43 17 — 0 2 8 2 1 1 7 45 34 Mississippi — 0 0 — — — 0 0 — — — 2 15 69 57 Tennessee§ 1 3 12 115 71 2 1 3 21 15 4 8 14 183 147
W.S. Central — 1 5 26 50 — 0 2 7 7 35 39 62 982 854 Arkansas§ — 0 2 9 1 — 0 1 2 2 19 2 10 72 57 Louisiana — 0 5 17 49 — 0 2 5 5 — 10 22 189 223 Oklahoma N 0 0 N N N 0 0 N N — 1 5 40 34 Texas§ — 0 0 — — — 0 0 — — 16 26 49 681 540
Mountain — 1 6 17 26 — 0 2 4 8 3 9 29 186 206 Arizona — 0 0 — — — 0 0 — — — 5 21 78 107 Colorado — 0 0 — — — 0 0 — — — 1 7 53 23 Idaho§ N 0 0 N N N 0 0 N N — 0 1 1 1 Montana§ — 0 0 — — — 0 0 — — — 0 3 — 1 Nevada§ N 0 0 N N N 0 0 N N 2 2 6 37 44 New Mexico§ — 0 1 1 — — 0 0 — — 1 1 3 17 22 Utah — 0 6 16 15 — 0 2 4 7 — 0 2 — 7 Wyoming§ — 0 1 — 11 — 0 1 — 1 — 0 1 — 1
Pacific — 0 0 — — — 0 1 1 2 7 40 71 971 1,128 Alaska N 0 0 N N N 0 0 N N — 0 1 — 5 California N 0 0 N N N 0 0 N N 3 36 59 865 1,049 Hawaii — 0 0 — — — 0 1 1 2 — 0 2 11 5 Oregon§ N 0 0 N N N 0 0 N N — 0 2 7 8 Washington N 0 0 N N N 0 0 N N 4 3 13 88 61
American Samoa N 0 0 N N N 0 0 N N — 0 0 — 4 C.N.M.I. — — — — — — — — — — — — — — — Guam — 0 0 — — — 0 0 — — — 0 0 — — Puerto Rico — 0 0 — — — 0 0 — — 6 2 10 90 74 U.S. Virgin Islands — 0 0 — — — 0 0 — — — 0 0 — —
C.N.M.I.: Commonwealth of Northern Mariana Islands. U: Unavailable. —: No reported cases. N: Not notifiable. Cum: Cumulative year-to-date counts. Med: Median. Max: Maximum. * Incidence data for reporting years 2007 and 2008 are provisional.†
Includes cases of invasive pneumococcal disease caused by drug-resistant S. pneumoniae (DRSP) (NNDSS event code 11720). §
Contains data reported through the National Electronic Disease Surveillance System (NEDSS).

734 MMWR July 4, 2008
TABLE II. (Continued) Provisional cases of selected notifiable diseases, United States, weeks ending June 28, 2008, and June 30, 2007 (26th Week)*
West Nile virus disease†
Varicella (chickenpox) Neuroinvasive Nonneuroinvasive§
Previous Previous Previous Current 52 weeks Cum Cum Current 52 weeks Cum Cum Current 52 weeks Cum Cum
Reporting area week Med Max 2008 2007 week Med Max 2008 2007 week Med Max 2008 2007
United States 284 645 1,654 16,739 25,438 — 1 143 4 45 — 1 307 10 86 New England 4 17 68 296 1,547 — 0 2 — — — 0 2 — — Connecticut — 9 38 — 890 — 0 1 — — — 0 1 — — Maine¶ — 0 26 — 205 — 0 0 — — — 0 0 — — Massachusetts — 0 0 — — — 0 2 — — — 0 2 — — New Hampshire — 5 18 132 212 — 0 0 — — — 0 0 — — Rhode Island¶ — 0 0 — — — 0 0 — — — 0 1 — — Vermont¶ 4 6 17 164 240 — 0 0 — — — 0 0 — — Mid. Atlantic 30 57 117 1,395 3,089 — 0 3 — 1 — 0 3 — 1 New Jersey N 0 0 N N — 0 1 — — — 0 0 — — New York (Upstate) N 0 0 N N — 0 2 — — — 0 1 — — New York City N 0 0 N N — 0 3 — — — 0 3 — — Pennsylvania 30 57 117 1,395 3,089 — 0 1 — 1 — 0 1 — 1 E.N. Central 24 155 378 3,859 7,413 — 0 19 — 3 — 0 12 — 2 Illinois — 13 124 618 648 — 0 14 — 3 — 0 8 — 1 Indiana — 0 222 — — — 0 4 — — — 0 2 — — Michigan 10 59 154 1,504 2,800 — 0 5 — — — 0 1 — — Ohio 13 55 128 1,492 3,192 — 0 4 — — — 0 3 — 1 Wisconsin 1 7 32 245 773 — 0 2 — — — 0 2 — — W.N. Central 3 22 145 730 1,090 — 0 41 — 6 — 0 118 1 43 Iowa N 0 0 N N — 0 4 — 1 — 0 3 — 1 Kansas — 6 36 253 407 — 0 3 — 1 — 0 7 — 1 Minnesota — 0 0 — — — 0 9 — 1 — 0 12 — — Missouri 3 11 47 411 620 — 0 8 — — — 0 3 — — Nebraska¶ N 0 0 N N — 0 5 — — — 0 16 — 14 North Dakota — 0 140 48 — — 0 11 — 3 — 0 49 1 15 South Dakota — 0 5 18 63 — 0 9 — — — 0 32 — 12 S. Atlantic 33 93 161 2,708 3,201 — 0 12 — 1 — 0 6 — 1 Delaware 4 1 4 24 24 — 0 1 — — — 0 0 — — District of Columbia — 0 3 17 21 — 0 0 — — — 0 0 — — Florida 25 30 87 1,094 726 — 0 1 — — — 0 0 — — Georgia N 0 0 N N — 0 8 — — — 0 5 — 1 Maryland¶ N 0 0 N N — 0 2 — — — 0 2 — — North Carolina N 0 0 N N — 0 1 — — — 0 2 — — South Carolina¶ 4 16 66 522 679 — 0 2 — — — 0 1 — — Virginia¶ — 21 73 639 1,053 — 0 1 — 1 — 0 1 — — West Virginia — 15 66 412 698 — 0 0 — — — 0 0 — — E.S. Central 4 16 97 759 313 — 0 11 3 8 — 0 14 3 3 Alabama¶ 4 16 97 751 312 — 0 2 — — — 0 1 — 1 Kentucky N 0 0 N N — 0 1 — — — 0 0 — — Mississippi — 0 2 8 1 — 0 7 3 7 — 0 12 2 2 Tennessee¶ N 0 0 N N — 0 1 — 1 — 0 2 1 — W.S. Central 180 171 886 5,744 7,003 — 0 36 — 6 — 0 19 5 5 Arkansas¶ 7 11 42 347 442 — 0 5 — 1 — 0 2 — — Louisiana — 1 7 27 89 — 0 5 — — — 0 3 — — Oklahoma N 0 0 N N — 0 11 — 1 — 0 8 2 — Texas¶ 173 161 852 5,370 6,472 — 0 19 — 4 — 0 11 3 5 Mountain 5 39 105 1,219 1,758 — 0 36 1 8 — 0 148 — 17 Arizona — 0 0 — — — 0 8 1 7 — 0 10 — 1 Colorado 2 16 43 550 677 — 0 17 — — — 0 67 — 7 Idaho¶ N 0 0 N N — 0 3 — — — 0 22 — 5 Montana¶ 3 6 25 176 270 — 0 10 — — — 0 30 — — Nevada¶ N 0 0 N N — 0 1 — — — 0 3 — 1 New Mexico¶ — 4 22 128 274 — 0 8 — — — 0 6 — — Utah — 9 55 360 519 — 0 8 — 1 — 0 9 — 2 Wyoming¶ — 0 9 5 18 — 0 8 — — — 0 34 — 1 Pacific 1 1 4 29 24 — 0 18 — 12 — 0 23 1 14 Alaska 1 1 4 29 24 — 0 0 — — — 0 0 — — California — 0 0 — — — 0 18 — 12 — 0 20 1 13 Hawaii — 0 0 — — — 0 0 — — — 0 0 — — Oregon¶ N 0 0 N N — 0 3 — — — 0 4 — 1 Washington N 0 0 N N — 0 0 — — — 0 0 — — American Samoa N 0 0 N N — 0 0 — — — 0 0 — — C.N.M.I. — — — — — — — — — — — — — — — Guam — 2 17 55 173 — 0 0 — — — 0 0 — — Puerto Rico 2 10 37 255 429 — 0 0 — — — 0 0 — — U.S. Virgin Islands — 0 0 — — — 0 0 — — — 0 0 — —
C.N.M.I.: Commonwealth of Northern Mariana Islands. U: Unavailable. —: No reported cases. N: Not notifiable. Cum: Cumulative year-to-date counts. Med: Median. Max: Maximum. * Incidence data for reporting years 2007 and 2008 are provisional.†
Updated weekly from reports to the Division of Vector-Borne Infectious Diseases, National Center for Zoonotic, Vector-Borne, and Enteric Diseases (ArboNET Surveillance). Data § for California serogroup, eastern equine, Powassan, St. Louis, and western equine diseases are available in Table I.
Not notifiable in all states. Data from states where the condition is not notifiable are excluded from this table, except in 2007 for the domestic arboviral diseases and influenza-associated pediatric mortality, and in 2003 for SARS-CoV. Reporting exceptions are available at http://www.cdc.gov/epo/dphsi/phs/infdis.htm. ¶ Contains data reported through the National Electronic Disease Surveillance System (NEDSS).

735 Vol. 57 / No. 26 MMWR
TABLE III. Deaths in 122 U.S. cities,* week ending June 28, 2008 (26th Week) All causes, by age (years) All causes, by age (years)
Reporting Area All
Ages >65 45-64 25-44 1-24 <1 P&I†
Total Reporting Area All
Ages >65 45-64 25-44 1-24 <1 P&I†
Total
New England 458 310 110 15 12 11 40 S. Atlantic 1,333 786 346 113 52 34 69 Boston, MA 118 65 35 7 7 4 16 Atlanta, GA 122 70 39 7 3 3 1 Bridgeport, CT 30 24 5 — 1 — 4 Baltimore, MD 128 62 46 12 7 1 11 Cambridge, MA 12 7 4 1 — — 2 Charlotte, NC 115 72 24 14 5 — 10 Fall River, MA 29 23 6 — — — 1 Jacksonville, FL 139 86 30 14 8 1 11 Hartford, CT 42 29 10 1 2 — 3 Miami, FL 105 69 22 11 3 — 18 Lowell, MA 29 23 5 1 — — 1 Norfolk, VA 52 26 17 5 2 2 1 Lynn, MA 5 4 1 — — — — Richmond, VA 42 27 13 1 — 1 1 New Bedford, MA 21 15 5 — — 1 — Savannah, GA 67 45 15 5 2 — 1 New Haven, CT U U U U U U U St. Petersburg, FL 51 37 5 2 3 4 2 Providence, RI 45 29 14 — 1 1 — Tampa, FL 218 149 44 13 7 5 10 Somerville, MA 1 — 1 — — — — Washington, D.C. 282 134 88 29 12 17 3 Springfield, MA 33 20 7 1 1 4 4 Wilmington, DE 12 9 3 — — — — Waterbury, CT Worcester, MA
27 66
21 4 2 — 50 13 2 —
— 1
2 7 E.S. Central 923
Birmingham, AL 190 583 221 68 29 119 38 21 4
22 8
88 26
Mid. Atlantic 1,876 1,265 443 108 36 24 83 Chattanooga, TN 94 66 17 5 6 — 7 Albany, NY 43 27 9 4 1 2 5 Knoxville, TN 112 68 32 9 1 2 8 Allentown, PA 26 24 2 — — — 2 Lexington, KY 77 52 16 4 — 5 4 Buffalo, NY 69 51 14 3 1 — 7 Memphis, TN 160 112 32 9 4 3 22 Camden, NJ 33 15 9 6 1 2 1 Mobile, AL 90 47 31 5 6 1 6 Elizabeth, NJ 12 6 5 — 1 — 3 Montgomery, AL 49 29 15 2 1 2 3 Erie, PA 46 37 7 — 1 1 — Nashville, TN 151 90 40 13 7 1 12 Jersey City, NJ New York City, NY Newark, NJ Paterson, NJ Philadelphia, PA Pittsburgh, PA§
Reading, PA Rochester, NY Schenectady, NY Scranton, PA Syracuse, NY Trenton, NJ Utica, NY Yonkers, NY
U 1,038
59 22
167 43 30
103 20 35 60 35 16 19
U U U U 707 247 61 13
27 20 5 2 12 8 1 1 93 48 15 9 29 10 3 1 24 4 1 — 72 28 — 3 15 5 — — 31 3 1 — 44 13 2 1 22 7 4 1 14 1 1 — 15 3 1 —
U 10
5 — 2
— 1
— — — — 1
— —
U 32
5 2 5 1 1
11 1 2 2
— 2 1
W.S. Central 1,591 Austin, TX 90 Baton Rouge, LA 70 Corpus Christi, TX 50 Dallas, TX 226 El Paso, TX 113 Fort Worth, TX 108 Houston, TX 403 Little Rock, AR 78 New Orleans, LA¶ U San Antonio, TX 246 Shreveport, LA 75 Tulsa, OK 132
978 392 136 41 49 23 12 2 40 15 10 — 31 15 3 1
114 67 21 13 81 19 8 5 69 28 4 5
247 96 40 10 53 16 6 — U U U U
146 67 22 4 56 14 4 — 92 32 6 1
44 4 5
— 11 — 2
10 3 U 7 1 1
75 4
— 2
12 1 7
20 — U
14 4
11
E.N. Central Akron, OH Canton, OH Chicago, IL Cincinnati, OH Cleveland, OH Columbus, OH Dayton, OH Detroit, MI Evansville, IN Fort Wayne, IN
1,895 58 44
329 85
199 178 116 164
34 50
1,208 465 130 38 39 13 3 1 33 8 — 1
184 96 27 11 59 16 5 2
134 48 12 4 117 40 15 4
77 25 10 1 83 51 22 3 26 6 2 — 30 12 4 1
54 2 2
11 3 1 2 3 5
— 3
121 — 3
29 9 6
12 11
5 1 5
Mountain 1,090 Albuquerque, NM 121 Boise, ID 61 Colorado Springs, CO 57 Denver, CO 85 Las Vegas, NV 239 Ogden, UT 38 Phoenix, AZ 160 Pueblo, CO 36 Salt Lake City, UT 117 Tucson, AZ 176
697 262 81 24 72 33 12 3 35 15 9 2 34 18 3 1 52 22 6 —
167 54 10 3 26 11 — — 90 42 15 8 28 4 3 1 69 22 14 4
124 41 9 2
25 1
— 1 5 5 1 4
— 8
—
68 7 3 4
10 18
3 8 4 4 7
Gary, IN 13 9 2 2 — — 2 Pacific 1,585 1,070 361 93 42 19 156 Grand Rapids, MI 49 35 8 2 1 3 3 Berkeley, CA 12 10 — 2 — — 1 Indianapolis, IN 174 102 45 14 8 5 10 Fresno, CA 87 55 20 5 4 3 7 Lansing, MI 30 22 6 1 — 1 1 Glendale, CA 34 28 5 1 — — 4 Milwaukee, WI 77 51 21 4 1 — 9 Honolulu, HI 69 48 14 4 3 — 7 Peoria, IL 49 37 6 — — 6 2 Long Beach, CA 63 36 16 7 4 — 14 Rockford, IL 42 29 9 2 — 2 2 Los Angeles, CA 238 136 70 20 7 5 33 South Bend, IN 51 36 15 — — — 3 Pasadena, CA 30 20 6 1 3 — 5 Toledo, OH 96 61 26 4 — 5 3 Portland, OR 115 81 26 7 — 1 7 Youngstown, OH 57 44 12 1 — — 5 Sacramento, CA 180 123 37 10 8 2 20
W.N. Central Des Moines, IA Duluth, MN Kansas City, KS Kansas City, MO Lincoln, NE Minneapolis, MN
629 80 29 44
109 35 58
409 158 36 13 57 18 5 — 22 7 — — 23 13 6 2 68 31 4 2 28 6 — — 38 11 4 1
13 — — — 4 1 4
44 7 3 2 9
— 7
San Diego, CA 133 San Francisco, CA 119 San Jose, CA 202 Santa Cruz, CA 38 Seattle, WA 106 Spokane, WA 70 Tacoma, WA 89
97 27 5 3 78 30 8 2
153 37 7 3 30 6 2 — 65 29 7 2 47 18 2 2 63 20 5 1
1 1 2
— 3 1
—
3 17 19
5 7 4 3
Omaha, NE 71 53 16 1 — 1 8 Total 11,380** 7,306 2,758 780 287 246 744 St. Louis, MO 103 42 40 13 6 2 2 St. Paul, MN 32 28 1 2 — 1 3 Wichita, KS 68 50 15 1 2 — 3
U: Unavailable. —:No reported cases. * Mortality data in this table are voluntarily reported from 122 cities in the United States, most of which have populations of >100,000. A death is reported by the place of its
occurrence and by the week that the death certificate was filed. Fetal deaths are not included. † Pneumonia and influenza. § Because of changes in reporting methods in this Pennsylvania city, these numbers are partial counts for the current week. Complete counts will be available in 4 to 6 weeks. ¶ Because of Hurricane Katrina, weekly reporting of deaths has been temporarily disrupted.
** Total includes unknown ages.

736 MMWR July 4, 2008
The Morbidity and Mortality Weekly Report (MMWR) Series is prepared by the Centers for Disease Control and Prevention (CDC) and is available free of charge in electronic format. To receive an electronic copy each week, send an e-mail message to [email protected]. The body content should read SUBscribe mmwrtoc. Electronic copy also is available from CDC’s Internet server at http://www.cdc.gov/mmwr or from CDC’s file transfer protocol server at ftp://ftp.cdc.gov/pub/ publications/mmwr. Paper copy subscriptions are available through the Superintendent of Documents, U.S. Government Printing Office, Washington, DC 20402; telephone 202-512-1800.
Data in the weekly MMWR are provisional, based on weekly reports to CDC by state health departments. The reporting week concludes at close of business on Friday; compiled data on a national basis are officially released to the public on the following Friday. Data are compiled in the National Center for Public Health Informatics, Division of Integrated Surveillance Systems and Services. Address all inquiries about the MMWR Series, including material to be considered for publication, to Editor, MMWR Series, Mailstop E-90, CDC, 1600 Clifton Rd., N.E., Atlanta, GA 30333 or to [email protected].
All material in the MMWR Series is in the public domain and may be used and reprinted without permission; citation as to source, however, is appreciated.
Use of trade names and commercial sources is for identification only and does not imply endorsement by the U.S. Department of Health and Human Services.
References to non-CDC sites on the Internet are provided as a service to MMWR readers and do not constitute or imply endorsement of these organizations or their programs by CDC or the U.S. Department of Health and Human Services. CDC is not responsible for the content of these sites. URL addresses listed in MMWR were current as of the date of publication.
✩U.S. Government Printing Office: 2008-723-026/41105 Region IV ISSN: 0149-2195