moon et al2012
DESCRIPTION
aaaTRANSCRIPT

European Journal of Operational Research 222 (2012) 191–203
Contents lists available at SciVerse ScienceDirect
European Journal of Operational Research
journal homepage: www.elsevier .com/locate /e jor
Production, Manufacturing and Logistics
An instrument for measuring supply chain flexibility for the textileand clothing companies
Karen Ka-Leung Moon a,⇑, Candace Ying Yi b, E.W.T. Ngai c,1
a Department of Clothing and Textiles, Seoul National University, Seoul, Republic of Koreab Institute of Textiles and Clothing, The Hong Kong Polytechnic University, Hung Hom, Kowloon, Hong Kongc Department of Management and Marketing, The Hong Kong Polytechnic University, Hung Hom, Kowloon, Hong Kong
a r t i c l e i n f o
Article history:Received 25 February 2011Accepted 19 April 2012Available online 11 May 2012
Keywords:Supply chain managementSupply chain flexibilityInstrument developmentScale validationMeasurement model
0377-2217/$ - see front matter � 2012 Elsevier B.V. Ahttp://dx.doi.org/10.1016/j.ejor.2012.04.027
⇑ Corresponding author. Address: Department ofNational University, 1 Gwanak-ro, Gwanak-gu, SeoulTel.: +82 2 880 6871; fax: +82 2 880 6841.
E-mail addresses: [email protected], [email protected] (C.Y. Yi), [email protected]
1 Tel.: +852 2766 7296; fax: +852 2765 0611.
a b s t r a c t
Supply chain flexibility (SCF) represents the capability of firms to respond to unanticipated changes incustomer needs and competitor actions. Given the growing research interest in flexibility strategies,the development of a valid and reliable instrument to measure organizational responses toward environ-mental uncertainties or risks is imperative. However, no systematic and scientific research has been con-ducted to develop such an instrument. The present study adopts a comprehensive and rigorous procedureto develop a multifaceted scale for SCF through an empirical investigation. The results of a confirmatoryfactor analysis suggest that SCF can be operationalized as a second-order factor model comprising fourdimensions, namely: sourcing flexibility, operating system flexibility, distribution flexibility, and infor-mation system flexibility. A series of goodness-of-fit indices further demonstrates that this scale is inter-nally consistent, reliable, and valid. The various findings suggested in the present study provide a moresuccinct picture of SCF, and the well-validated scale could be used as a basis for further research and the-oretical groundwork in the field of supply chain management.
� 2012 Elsevier B.V. All rights reserved.
1. Introduction
Given the ever-changing business environment, resources thathave historically sustained an organization’s competitive advan-tage in business may no longer be viable. In today’s globalizedworld, competition has gone beyond the boundaries of single firmsand extended across the full supply chain spectrum. It is thereforeessential that supply chain members adjust and reconfigure them-selves to achieve a balance between the responsiveness of theirorganizations and changes in the marketplace by increasing theirflexibility in all operational activities. Supply chain flexibility(SCF) involves the application of supply chain resources accordingto marketing dynamics, and requires firms to develop cross-func-tional and cross-company strategies that eliminate bottlenecksand create a level of performance that allows firms to strengthentheir competitive advantage in an uncertain market. From the viewof supply chain management (SCM), a number of strategic optionscan be utilized to increase SCF; for example, multiple supplier rela-tionships could be set up to enable organizations to find another
ll rights reserved.
Clothing and Textiles, Seoul151-742, Republic of Korea.
[email protected] (K.K.-L. Moon),olyu.edu.hk (E.W.T. Ngai).
backup supplier in case of supply breakdown, or to activate addi-tional logistics channels if peaks (Garavelli, 2003).
Although research on flexibility is considerable and its impor-tance has been recognized for some time, much of the researchhas concentrated on intra organizational flexibility and has focuslargely on manufacturing systems (e.g., Gerwin, 1993; Koste andMalhotra, 1999; Slack, 1983; Upton, 1994; Vokurka and O’Leary-Kelly, 2000; Gupta and Somers, 1996). Flexibility studies fromthe supply chain perspective, however, have thus far been limited.The lack of a theoretical base and the wide array of measures usedby individual researchers have been identified as major causes ofthe incomplete state of knowledge of SCF (Beach et al., 2000;Stevenson and Spring, 2007; De Toni and Tonchia, 1998). Giventhese problems, we undertook an empirical study among firmswithin the textile and clothing industry in China to determinehow an instrument with a set of multi-item measurement scalesrepresenting the SCF construct could be developed and validated.
The remainder of this paper is organized as follows. Section 2outlines the theoretical background based on relevant literature.Section 3 discusses the development of the scale items, and thusthe research instrument, while Section 4 explains how requireddata was collected. In Section 5, we present the procedure for puri-fying the measurement models and identifying the component fac-tors of the scales. We then report the results of a validation processfor each of the component factors and a model test of the SCF scale.In Sections 6 and 7, concluding remarks are made, and theoretical
192 K.K.-L. Moon et al. / European Journal of Operational Research 222 (2012) 191–203
and managerial implications are analyzed, and limitations and fu-ture research are discussed.
2. Theoretical background and literature review
For decades, flexibility as a research topic has been discussedfrom both economic (e.g., Devereux and Engel, 2003; Jones and Os-troy, 1984) and organizational (e.g., Boynton and Victor, 1991;Golden and Powell, 2000) perspectives. In this section, we first re-view the literature regarding manufacturing flexibility and theemerging studies on SCF. We then measure the inadequacy ofthe extant research on SCF against our objective to develop a vali-dated SCF scale.
2.1. Manufacturing flexibility
In the area of operations management, flexibility was initiallyproposed for the manufacturing sector to see how manufacturerscould deal with unexpected changes in their production processes,such as equipment breakdowns, variable task times, queuing de-lays, and re-workings (Sethi and Sethi, 1990; Dixon, 1992; Guptaand Goyal, 1989). In this regard, manufacturing flexibility concernsthe degree to which an organization possesses a variety of actualand/or potential procedures, as well as the rapidity with which itcan implement these procedures to increase its control capabilityover its environment (Bernardes and Hanna, 2009; De Leeuw andVolberda, 1996; Zhang et al., 2003). Manufacturing flexibility istypically defined in terms of range, mobility, and uniformity; spe-cifically, it refers the various states a system can adopt, the abilityto move from making one product to another, and the ability toperform comparably well when making any product within a spec-ified range (Slack, 1983; Upton, 1994; Gupta and Somers, 1992).
The various components of manufacturing flexibility have beenbuilt up over time and presented hierarchically from shop floor upto firm level. Slack (1983) described five types of manufacturingflexibility (i.e., new product, product mix, quality, volume, anddelivery), while Gerwin (1993) examined seven types (i.e., mix,changeover, modification, volume, rerouting, material, and respon-siveness). Later, Vokurka and O’Leary-Kelly (2000) extended theseto 15 (i.e., machine, material handling, operations, automation, la-bor, process, routing, product, new design, delivery, volume, expan-sion, program, production, and market). Despite their differenttaxonomies, these studies all examined the principal proceduresof manufacturing systems, within which strong interdependenciesamong many of the suggested components were found; for exam-ple, mix and routing flexibility were both influenced by the degreeof machine flexibility.
2.2. Supply chain flexibility
With inter-firm competition being extended to inter-chaincompetition, in which upstream suppliers and downstream distrib-utors cooperate to deliver value to customers, the concept of flex-ibility needed to be expanded from manufacturing to supply chainscenarios. This required ‘‘inter-functional’’ and ‘‘partnership’’ per-spectives, and an avoidance of approaches that were inward-look-ing and self-focused (Holmberg, 2000). The concept of SCF wasthen proposed and has been studied ever since (e.g., Beamon,1999; Duclos et al., 2003; Vickery et al., 1999; Das, 2011). Lummuset al. (2003) contend that SCF refers to the promptness of a supplychain in responding to customer demand and the degree to whichit can adjust its speed, destinations, and volume in response to var-ious market changes. The Supply Chain Council (2006, p.7) alsocame up with a performance-based definition of SCF: ‘‘The agilityof a supply chain in responding to marketplace changes to gainor maintain competitive advantage’’.
Several studies have adopted the approach of relating compo-nents found in the literature on manufacturing flexibility to thewider context of the supply chain. Vickery et al. (1999) outline fivecomponents of SCF from an ‘‘integrative, customer-oriented per-spective’’, namely, volume flexibility, product flexibility, distribu-tion flexibility, access flexibility, and new product introductionflexibility. Among these components, the first two are related tomanufacturing systems, the next two are used to investigate mar-keting, and the last is related to new product research and design.However, although these studies attempt to extend the investiga-tive boundary from a single department/process to multipledepartments/processes, they remain focused on the internal per-spective of a particular firm.
Other research has contributed to the flexibility literature byfocusing on internal issues inherent at the plant or firm level, to-gether with a wider range of external processes, including sourcing,procurement, and logistics (Stevenson and Spring, 2007). Garavelli(2003) and Sánchez and Pérez (2005) examined two main aspectsof SCF: process flexibility and logistics flexibility. Process flexibilityconcerns the number of product types that can be manufactured ateach production site, regardless of where they are located. Logisticsflexibility refers to the different logistics strategies that can beadopted to release a product into a marketplace or to procure a com-ponent from a supplier. Similarly, Swafford et al. (2006) proposed athree-dimensional SCF that includes procurement/sourcing flexibil-ity, manufacturing flexibility, and distribution/logistics flexibility.
2.3. SCF scale – a research gap
SCM and flexibility may have been among the leading concernsof operations management in recent years, but the studies that fo-cus on SCF remain inadequate (Garavelli, 2003; Gong, 2008). Onemajor limitation of the previous studies is that most of them havebeen conducted within the confines of a single firm, therebyneglecting other important aspects of a supply chain, especiallythose related to upstream suppliers and downstream distributors.Consequently, the proposed flexibility options are incapable ofincluding the multiple interdependencies that exist among supplychain partners. Another restriction of existing research is its lack ofinsight into the application by organizations of information tech-nology (IT) to adapt to changing circumstances. Because of theimportant role of information systems in a supply chain, the inclu-sion of IT in the study of SCM is inevitable.
Furthermore, a comprehensive and widely accepted theoreticalframework for measuring SCF has yet to be formulated (Bernardesand Hanna, 2009; De Toni and Tonchia, 1998). Without a reliableand well-validated scale, it is impossible to adequately measurethe flexibility of a supply chain in responding to the fickle demandsof today’s market or to compare the level of flexibility of one sup-ply chain with that of another (Stevenson and Spring, 2007). More-over, it is difficult to understand how flexibility affects a supplychain’s performance and/or other organizational attributes. It wastherefore our intention to study the basic nature of SCF and to inte-grate its various dimensions to form a reliable and well-validatedmeasurement scale. We anticipate that through a comprehensiveand rigorous validation process, a well-defined measurement mod-el and a highly validated research instrument can be obtained,which can be applied to empirical studies and, in turn, may gener-ate substantive theories. Particularly, our results can be of help inproviding a means for measuring the intensity of flexibility for thecompanies in the textile and clothing industry.
3. Development of a research instrument for SCF
The methodology we used to develop the research instrumentfor SCF followed the recommendations outlined by Churchill
K.K.-L. Moon et al. / European Journal of Operational Research 222 (2012) 191–203 193
(1979). The conceptualization and operationalization of the SCFconstruct and its component factors are discussed in this section,while the processes and results of the model test are reported inSections 4 and 5.
3.1. Defining the domain of SCF
Notwithstanding its limitations, previous literature has pro-vided us with a theoretical and operational basis for the conceptu-alization of SCF. Synthesizing the definitions in the extantliterature (Koste and Malhotra, 1999; Lummus et al., 2003;Sánchez and Pérez, 2005; Sawhney, 2006; Sethi and Sethi, 1990;Swafford et al., 2006; Fredericks, 2005), we define SCF as ‘‘thecapability of an organization to respond to internal and externalchanges in order to gain or maintain a competitive advantage’’.We also maintain that SCF is a multifaceted concept with four flex-ibility dimensions, which are needed by supply chain participantsto develop superior responsiveness in order to meet the challengesof a volatile marketplace (Duclos et al., 2003).
The first dimension of SCF is sourcing flexibility (SF), which wedefine as the availability of qualified materials and services and theability to effectively purchase them in response to changingrequirements (Duclos et al., 2003; Lummus et al., 2003). In general,sourcing comprises the pre-activities of an enterprise’s core busi-ness. These activities provide crucial links between supplier firmsand buyer firms and result in the procurement of materials, com-ponents, products, or services to support the buyer firm’s dailybusiness (Lummus et al., 2003; Swafford et al., 2006; Tachizawaand Giménez, 2009). The major determinant of SF is how well afirm can manage its upstream supply flows.
The second dimension of SCF is operating system flexibility(OSF), which we define as the ability to exploit the use of obtainedresources to produce a range of products and services effectively inorder to meet various market demands. In other words, it is theability to provide qualified products with a wide range of features,mixes, and volumes according to various customer specifications(D’Souza and Williams, 2000; Koste et al., 2004; Sethi and Sethi,1990). OSF enables firms to produce needed products timelythrough setup time reduction, cellular manufacturing layouts, pre-ventive maintenance, and/or quality improvement efforts (Kosteand Malhotra, 1999; Sarker et al., 1994; Shewchuk and Moodie,1998). The key determinant of OSF is a firm’s ability to produceproducts in response to the demands of its clients. At the plant le-vel, OSF can be predicated on machining, labor and materialsarrangement, and process routing flexibilities.
Distribution flexibility (DF), the third dimension, refers to acompany’s ability to control the movement and storage of materi-als, components, finished goods, and/or services under constantlyevolving marketplace conditions (Duclos et al., 2003; Swaffordet al., 2006). DF facilitates production and marketing by smoothingthe flow of incoming materials and outgoing products (Lin andShaw, 1998). It is promoted by the close coordination of upstreamand downstream operations along the supply chain (Vickery et al.,1999). The primary determinant of DF is the ability of a firm tomanage its distributors, warehouses, loading capacity, and otherdistribution facilities effectively and efficiently.
Finally, information system flexibility (ISF) represents the abil-ity of the organization’s information system to adapt to changingcircumstances, especially in situations of unexpected disturbance(Duclos et al., 2003; Fredericks, 2005). With the physical flow ofproducts across different supply chain echelons, relevant informa-tion should be transferred frequently and accurately across eachinvolved party. Lucas and Olson (1994) believe that IT affects sys-tem flexibility in three ways: by changing or blurring the bound-aries of an enterprise’s system; by reducing working time in thesystem and connecting time among different organizations; and
by enhancing working properties and rhythm. The key componentof ISF relates to the capability of an organization to set up an effec-tive information system to support the operations and communi-cations among different internal functions/departments andexternal trading partners (Lee and Whang, 2000).
3.2. Generation of scale items for evaluating SCF
In line with the literature reviewed in Section 2 and the fourdimensions of SCF identified above, this subsection describeshow we identified the measurement items for each factor compo-nent of SCF. An initial set of 18 items was generated by the authors,including five items for SF, five items for OSF, five items for DF, andthree items for ISF, to capture the theoretical and conceptual do-main of SCF (see Table 1).
Sourcing flexibility (SF) is determined by the ability of the pur-chasing function to manage available suppliers and to influencethese suppliers’ performance in providing quality materials andservices. In this regard, we believe that a firm who has more andgreater variety of supply sources, has wider range of materials/components/products available from the major suppliers, and hasthe ability to add and remove suppliers freely; it might be morecompetent to secure a smooth supply flow to support their dailyoperations (Lummus et al., 2003; Swafford et al., 2006). For exam-ple, if a firm can easily find new suppliers, the risk of productionhalt caused by an interruption of necessary materials is greatly re-duced. Inter-firm uncertainties are then minimized.
Operating system flexibility (OSF) is used to examine the oper-ational processes of a supply chain, especially in manufacturing.We expect that the greater a firm’s ability to vary its output vol-umes, to develop more new products, to change products and ser-vices mix, and to adjust manufacturing facilities and processes; thegreater its ability to reorganize production agilely and to produceproducts that meet the evolving standards of customer demand,production design, process technology, and materials supply(Koste et al., 2004; Pagell and Krause, 1999; Sawhney, 2006; Sethiand Sethi, 1990; Gupta and Somers, 1996). For example, if a firmcan easily control its production capacity, then it can reduce or in-crease its output quickly to deal with sudden changes in marketdemand.
Distribution flexibility (DF) is used to examine the process ofdelivery of goods and supplies among member firms of a supplychain. We anticipate that if a firm wants to enhance its flexibilityin delivery, it should have more available warehouses, loadingcapacity, and other distribution/logistics facilities, have the abilityto change these facilities’ functional structure, delivery modes, andschedules, and have less restrictions to add or remove distributorsand/or logistics providers (Swafford et al., 2006). For example, hav-ing relationships with a variety of carriers for each delivery modeensures that product delivery will not be adversely affected whenthe primary carrier is unable to meet delivery requirements.
Information system flexibility (ISF) is the fourth dimension ofSCF and is operationalized by the use of IT to facilitate informationsharing across multiple functions and departments and with othermembers along the supply chain (Lee and Whang, 2000). If a firm’sinformation system has the ability to support transportation anddistribution, inventory management, and other logistical and oper-ational activities, then the firm can respond more quickly to themarket (Lee, 2000; Lee and Whang, 2000; Fredericks, 2005). Forexample, an integrative information system linking membersalong the entire supply chain enables members to make timelyresponsive decisions in accord with the sales conditions from theshop floor of frontline retailers. Therefore, a supportive informa-tion system reduces uncertainties in the supply chain and contrib-utes to overall SCF.
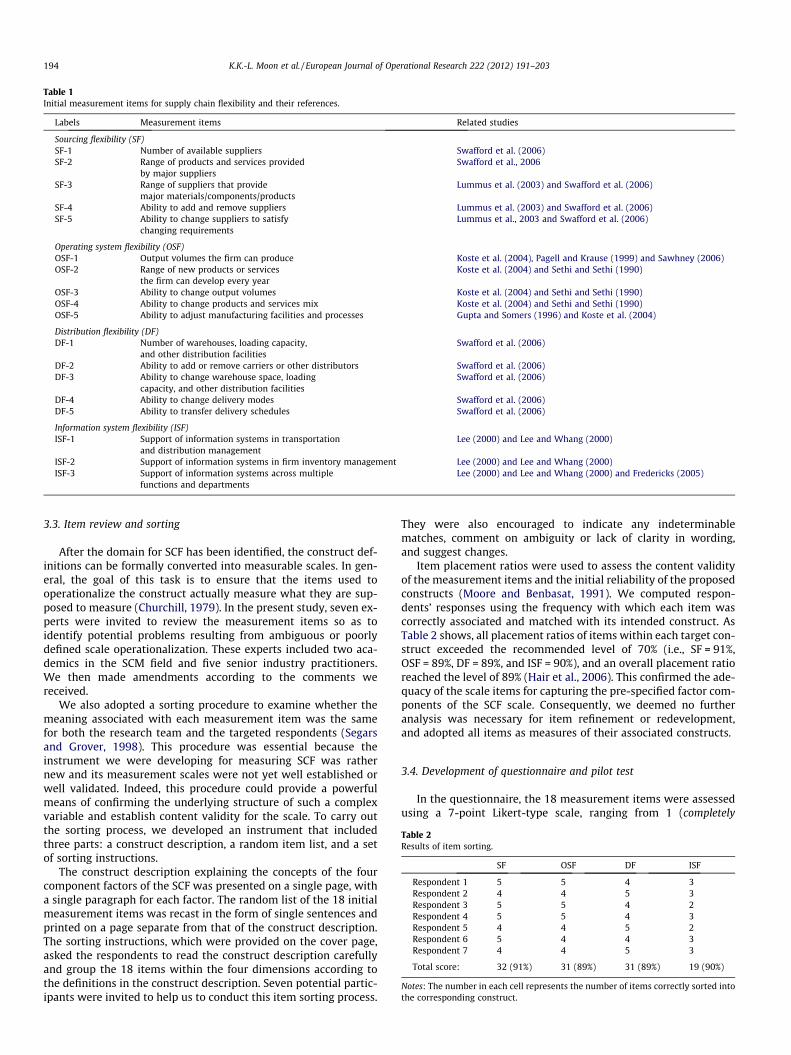
Table 1Initial measurement items for supply chain flexibility and their references.
Labels Measurement items Related studies
Sourcing flexibility (SF)SF-1 Number of available suppliers Swafford et al. (2006)SF-2 Range of products and services provided
by major suppliersSwafford et al., 2006
SF-3 Range of suppliers that providemajor materials/components/products
Lummus et al. (2003) and Swafford et al. (2006)
SF-4 Ability to add and remove suppliers Lummus et al. (2003) and Swafford et al. (2006)SF-5 Ability to change suppliers to satisfy
changing requirementsLummus et al., 2003 and Swafford et al. (2006)
Operating system flexibility (OSF)OSF-1 Output volumes the firm can produce Koste et al. (2004), Pagell and Krause (1999) and Sawhney (2006)OSF-2 Range of new products or services
the firm can develop every yearKoste et al. (2004) and Sethi and Sethi (1990)
OSF-3 Ability to change output volumes Koste et al. (2004) and Sethi and Sethi (1990)OSF-4 Ability to change products and services mix Koste et al. (2004) and Sethi and Sethi (1990)OSF-5 Ability to adjust manufacturing facilities and processes Gupta and Somers (1996) and Koste et al. (2004)
Distribution flexibility (DF)DF-1 Number of warehouses, loading capacity,
and other distribution facilitiesSwafford et al. (2006)
DF-2 Ability to add or remove carriers or other distributors Swafford et al. (2006)DF-3 Ability to change warehouse space, loading
capacity, and other distribution facilitiesSwafford et al. (2006)
DF-4 Ability to change delivery modes Swafford et al. (2006)DF-5 Ability to transfer delivery schedules Swafford et al. (2006)
Information system flexibility (ISF)ISF-1 Support of information systems in transportation
and distribution managementLee (2000) and Lee and Whang (2000)
ISF-2 Support of information systems in firm inventory management Lee (2000) and Lee and Whang (2000)ISF-3 Support of information systems across multiple
functions and departmentsLee (2000) and Lee and Whang (2000) and Fredericks (2005)
Table 2Results of item sorting.
SF OSF DF ISF
Respondent 1 5 5 4 3Respondent 2 4 4 5 3Respondent 3 5 5 4 2Respondent 4 5 5 4 3Respondent 5 4 4 5 2Respondent 6 5 4 4 3Respondent 7 4 4 5 3
Total score: 32 (91%) 31 (89%) 31 (89%) 19 (90%)
Notes: The number in each cell represents the number of items correctly sorted intothe corresponding construct.
194 K.K.-L. Moon et al. / European Journal of Operational Research 222 (2012) 191–203
3.3. Item review and sorting
After the domain for SCF has been identified, the construct def-initions can be formally converted into measurable scales. In gen-eral, the goal of this task is to ensure that the items used tooperationalize the construct actually measure what they are sup-posed to measure (Churchill, 1979). In the present study, seven ex-perts were invited to review the measurement items so as toidentify potential problems resulting from ambiguous or poorlydefined scale operationalization. These experts included two aca-demics in the SCM field and five senior industry practitioners.We then made amendments according to the comments wereceived.
We also adopted a sorting procedure to examine whether themeaning associated with each measurement item was the samefor both the research team and the targeted respondents (Segarsand Grover, 1998). This procedure was essential because theinstrument we were developing for measuring SCF was rathernew and its measurement scales were not yet well established orwell validated. Indeed, this procedure could provide a powerfulmeans of confirming the underlying structure of such a complexvariable and establish content validity for the scale. To carry outthe sorting process, we developed an instrument that includedthree parts: a construct description, a random item list, and a setof sorting instructions.
The construct description explaining the concepts of the fourcomponent factors of the SCF was presented on a single page, witha single paragraph for each factor. The random list of the 18 initialmeasurement items was recast in the form of single sentences andprinted on a page separate from that of the construct description.The sorting instructions, which were provided on the cover page,asked the respondents to read the construct description carefullyand group the 18 items within the four dimensions according tothe definitions in the construct description. Seven potential partic-ipants were invited to help us to conduct this item sorting process.
They were also encouraged to indicate any indeterminablematches, comment on ambiguity or lack of clarity in wording,and suggest changes.
Item placement ratios were used to assess the content validityof the measurement items and the initial reliability of the proposedconstructs (Moore and Benbasat, 1991). We computed respon-dents’ responses using the frequency with which each item wascorrectly associated and matched with its intended construct. AsTable 2 shows, all placement ratios of items within each target con-struct exceeded the recommended level of 70% (i.e., SF = 91%,OSF = 89%, DF = 89%, and ISF = 90%), and an overall placement ratioreached the level of 89% (Hair et al., 2006). This confirmed the ade-quacy of the scale items for capturing the pre-specified factor com-ponents of the SCF scale. Consequently, we deemed no furtheranalysis was necessary for item refinement or redevelopment,and adopted all items as measures of their associated constructs.
3.4. Development of questionnaire and pilot test
In the questionnaire, the 18 measurement items were assessedusing a 7-point Likert-type scale, ranging from 1 (completely

K.K.-L. Moon et al. / European Journal of Operational Research 222 (2012) 191–203 195
disagree) to 7 (completely agree). Since the present study wasadministered among Chinese informants, the questionnaire wasfirst translated from English into Chinese and then back-translatedfrom Chinese into English to ensure that all items in the Chineseversion meant the same as in the English version. Prior to conduct-ing the large-scale postal survey, we carried out a pilot test tocheck and refine the measurement instrument. This pilot testwas conducted among 25 respondents through a convenience sam-ple; five were part-time MBA students at the Hong Kong Polytech-nic University who were practitioners in the field of SCM, and theother 20 were senior supply chain executives of textile and cloth-ing manufacturers in China. These respondents were asked to indi-cate the extent to which they agreed with each item and providesuggestions for improving the content and format of the question-naire. This pilot test resulted in some minor modifications to thewording and several editorial issues related to the questionnaireformat. No serious problems were reported by these respondentsin filling out the questionnaire.
4. Data collection
After the final refinement of the research instrument, we con-ducted a postal survey to collect data from the industry for validat-ing the conceptual framework of the SCF scale.
4.1. Selection of textile and clothing industry as a case
We collected the data for the survey study exclusively fromcompanies involved in the textile and clothing industry in mainlandChina. The focus on such a single industry was based on the follow-ing considerations. First, a single industry eliminates noise from anumber of potentially confounding factors, such as macroeconomicconditions, the competitive environment, the complexity of pro-duction processes, and the volatility of market demand. Second,in the single-industry design, a smaller sample size is sufficientfor making comparisons across identified cases (Dixon, 1992).Third, the textile and apparel industry is a typical consumer-drivenindustry with product demands (e.g., fibers, yarns, and garments)being determined mostly by the demands of the final consumers.This derived demand results in mandating flexibility as an impor-tant strategic component for the participants across the entire sup-ply chain. The characteristics of this industry, therefore, determinedits appropriateness for our investigation. Finally, we selected sam-ples from China because of China’s important role in the global tex-tile and clothing trade. The export record of US$169 billion in 2009(World Trade Organization, 2009) and the stunning growth of thedomestic market (Fong and Dodes, 2006) have made China theworld’s largest exporter and manufacturer of textiles and clothing.
The single-industry design does, however, have weaknesses aswell. One is that the results are not necessarily generalizable (Desset al., 1990). Nonetheless, though many processes, required tech-niques, and equipment are unique to the industry, textile and ap-parel supply chains also share numerous difficulties andopportunities with other industries. The variety in product charac-teristics – for example, standard yarns and basic apparel versusfancy yarns and fashion apparel – results in variations in supplychain characteristics, such as customer demand, complexity ofmanufacturing processes, and product distribution. In this regard,we believe that selecting this single industry as a case for the pres-ent study is appropriate, yet we also recognize the need to haveadequately diversified samples for comparison across cases.
4.2. Survey administration
We used the Directory of Chinese Enterprises (China CommunityNet, 2007) issued by the Ministry of Commerce of the People’s
Republic of China as the sample framework. Companies underthe categories of garment, knitting and crocheted textile, chemicalfiber, fur and leather, home textile and apparel, and yarn andthread were included in the survey. The target respondents werethe senior staff within their respective firms, with titles such aschief executive, vice president, director of supply chain or opera-tions, general manager, plant manager, and product manager.These informants were preferred because of their knowledge inoperations and strategic management of the supply chain. Toencourage more responses and enhance the reply quality, wepromised each potential participant a copy of the survey results.The second round of mailing was sent out to those non-respon-dents one month after the first round. In cases an undeliverablequestionnaire was received, a replacement firm was added. A totalof 1,330 firms were mailed to and 207 returned questionnaireswere received, with 156 from the first mailing and 51 from the sec-ond. Fifteen were unusable because of significant missing data orincompleteness. The remaining 192 responses accounted for14.44% of the total number of mailed questionnaires. Table 3 dis-plays the profiles of the informants and their companies.
One way to examine non-response bias is to test for statisticallysignificant differences between the earlier (those responding to thefirst mailing) and later (responding to the second mailing) waves ofreturned questionnaires (Armstrong and Overton, 1977). For thisstudy, we performed a t-test to examine the differences amongthe 18 scale items between the two groups. The results showedno significant difference at the 0.05 level, suggesting that thenon-response bias was negligible.
5. Data analysis and results
As developed from previous literature, each item cluster in Table1 represents an a priori measurement model of the theoretical con-struct of SCF. Given the theory-driven approach to construct devel-opment, the analytical framework of confirmatory factor analysis(CFA) in structural equation modeling (SEM) provides an efficientmeans of assessing the consistency of measurement among scaleitems and of the pre-specified model with its associated networkof theoretical concepts (Jöreskog, 1993). In this regard, we adoptedCFA to test and confirm the measurement model of the SCF scale.The following subsections report the results of the model specifica-tion and purification; the descriptive statistics regarding the scalecharacteristics; a statistical validation process including the testingof unidimensionality, reliability, convergent validity, and discrimi-nant validity; and the comparison of the efficacy of alterative com-peting models for confirming the final measurement model for SCF.
5.1. Model specification and purification
To develop a reliable, valid, and parsimonious scale for SCF, wefirst specified and purified the measurement models for each com-ponent factor. The modification index (MI) is a useful tool fordetecting model misspecification (Byrne, 2001); that is, a value of3.84 or greater in an MI indicates that the chi-square (v2) wouldstatistically be significantly reduced if the coefficient was esti-mated (i.e., freed) (Hair et al., 2006). In this process, the analysisresults of the MIs across the paired tests suggested that six items(SF-4, SF-5, OSF-1, DF-1, DF-2 and ISF-3) had high cross-loadingswith other factors they were not supposed to measure and werethus deleted.
Cross-loadings might be attributed to a statistical artifact;therefore, removing offending items to improve the v2 value andto permit one item load on one factor should be done with cautionso as not to violate the theory. In the deletion process, we scruti-nized the concept and nature of each of these problematic items
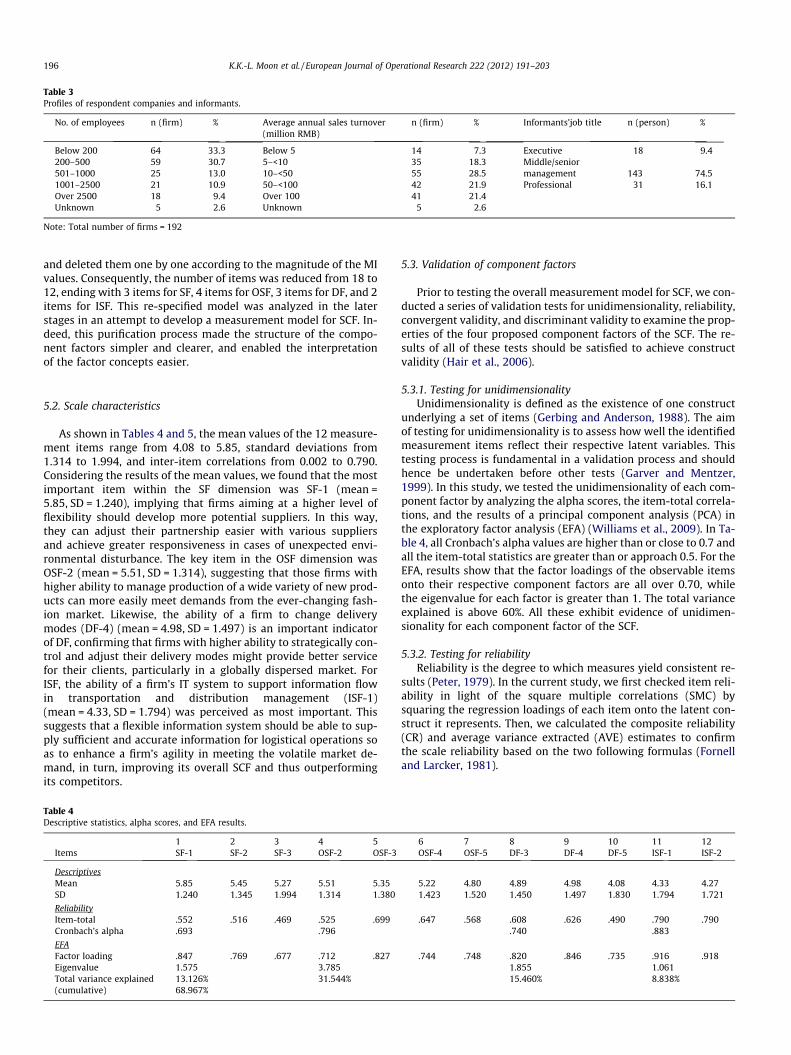
Table 3Profiles of respondent companies and informants.
No. of employees n (firm) % Average annual sales turnover(million RMB)
n (firm) % Informants’job title n (person) %
Below 200 64 33.3 Below 5 14 7.3 Executive 18 9.4200–500 59 30.7 5–<10 35 18.3 Middle/senior501–1000 25 13.0 10–<50 55 28.5 management 143 74.51001–2500 21 10.9 50–<100 42 21.9 Professional 31 16.1Over 2500 18 9.4 Over 100 41 21.4Unknown 5 2.6 Unknown 5 2.6
Note: Total number of firms = 192
196 K.K.-L. Moon et al. / European Journal of Operational Research 222 (2012) 191–203
and deleted them one by one according to the magnitude of the MIvalues. Consequently, the number of items was reduced from 18 to12, ending with 3 items for SF, 4 items for OSF, 3 items for DF, and 2items for ISF. This re-specified model was analyzed in the laterstages in an attempt to develop a measurement model for SCF. In-deed, this purification process made the structure of the compo-nent factors simpler and clearer, and enabled the interpretationof the factor concepts easier.
5.2. Scale characteristics
As shown in Tables 4 and 5, the mean values of the 12 measure-ment items range from 4.08 to 5.85, standard deviations from1.314 to 1.994, and inter-item correlations from 0.002 to 0.790.Considering the results of the mean values, we found that the mostimportant item within the SF dimension was SF-1 (mean =5.85, SD = 1.240), implying that firms aiming at a higher level offlexibility should develop more potential suppliers. In this way,they can adjust their partnership easier with various suppliersand achieve greater responsiveness in cases of unexpected envi-ronmental disturbance. The key item in the OSF dimension wasOSF-2 (mean = 5.51, SD = 1.314), suggesting that those firms withhigher ability to manage production of a wide variety of new prod-ucts can more easily meet demands from the ever-changing fash-ion market. Likewise, the ability of a firm to change deliverymodes (DF-4) (mean = 4.98, SD = 1.497) is an important indicatorof DF, confirming that firms with higher ability to strategically con-trol and adjust their delivery modes might provide better servicefor their clients, particularly in a globally dispersed market. ForISF, the ability of a firm’s IT system to support information flowin transportation and distribution management (ISF-1)(mean = 4.33, SD = 1.794) was perceived as most important. Thissuggests that a flexible information system should be able to sup-ply sufficient and accurate information for logistical operations soas to enhance a firm’s agility in meeting the volatile market de-mand, in turn, improving its overall SCF and thus outperformingits competitors.
Table 4Descriptive statistics, alpha scores, and EFA results.
1 2 3 4 5Items SF-1 SF-2 SF-3 OSF-2 OSF-3
DescriptivesMean 5.85 5.45 5.27 5.51 5.35SD 1.240 1.345 1.994 1.314 1.380
ReliabilityItem-total .552 .516 .469 .525 .699Cronbach’s alpha .693 .796
EFAFactor loading .847 .769 .677 .712 .827Eigenvalue 1.575 3.785Total variance explained 13.126% 31.544%(cumulative) 68.967%
5.3. Validation of component factors
Prior to testing the overall measurement model for SCF, we con-ducted a series of validation tests for unidimensionality, reliability,convergent validity, and discriminant validity to examine the prop-erties of the four proposed component factors of the SCF. The re-sults of all of these tests should be satisfied to achieve constructvalidity (Hair et al., 2006).
5.3.1. Testing for unidimensionalityUnidimensionality is defined as the existence of one construct
underlying a set of items (Gerbing and Anderson, 1988). The aimof testing for unidimensionality is to assess how well the identifiedmeasurement items reflect their respective latent variables. Thistesting process is fundamental in a validation process and shouldhence be undertaken before other tests (Garver and Mentzer,1999). In this study, we tested the unidimensionality of each com-ponent factor by analyzing the alpha scores, the item-total correla-tions, and the results of a principal component analysis (PCA) inthe exploratory factor analysis (EFA) (Williams et al., 2009). In Ta-ble 4, all Cronbach’s alpha values are higher than or close to 0.7 andall the item-total statistics are greater than or approach 0.5. For theEFA, results show that the factor loadings of the observable itemsonto their respective component factors are all over 0.70, whilethe eigenvalue for each factor is greater than 1. The total varianceexplained is above 60%. All these exhibit evidence of unidimen-sionality for each component factor of the SCF.
5.3.2. Testing for reliabilityReliability is the degree to which measures yield consistent re-
sults (Peter, 1979). In the current study, we first checked item reli-ability in light of the square multiple correlations (SMC) bysquaring the regression loadings of each item onto the latent con-struct it represents. Then, we calculated the composite reliability(CR) and average variance extracted (AVE) estimates to confirmthe scale reliability based on the two following formulas (Fornelland Larcker, 1981).
6 7 8 9 10 11 12OSF-4 OSF-5 DF-3 DF-4 DF-5 ISF-1 ISF-2
5.22 4.80 4.89 4.98 4.08 4.33 4.271.423 1.520 1.450 1.497 1.830 1.794 1.721
.647 .568 .608 .626 .490 .790 .790.740 .883
.744 .748 .820 .846 .735 .916 .9181.855 1.06115.460% 8.838%
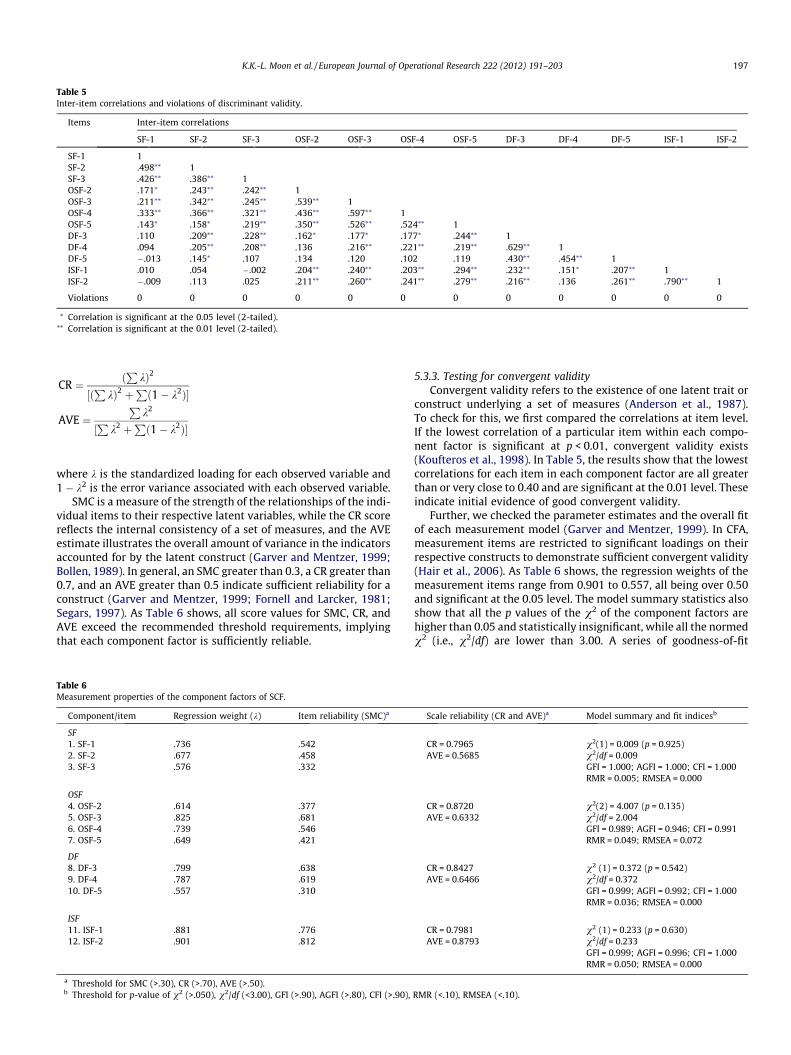
Table 5Inter-item correlations and violations of discriminant validity.
Items Inter-item correlations
SF-1 SF-2 SF-3 OSF-2 OSF-3 OSF-4 OSF-5 DF-3 DF-4 DF-5 ISF-1 ISF-2
SF-1 1SF-2 .498⁄⁄ 1SF-3 .426⁄⁄ .386⁄⁄ 1OSF-2 .171⁄ .243⁄⁄ .242⁄⁄ 1OSF-3 .211⁄⁄ .342⁄⁄ .245⁄⁄ .539⁄⁄ 1OSF-4 .333⁄⁄ .366⁄⁄ .321⁄⁄ .436⁄⁄ .597⁄⁄ 1OSF-5 .143⁄ .158⁄ .219⁄⁄ .350⁄⁄ .526⁄⁄ .524⁄⁄ 1DF-3 .110 .209⁄⁄ .228⁄⁄ .162⁄ .177⁄ .177⁄ .244⁄⁄ 1DF-4 .094 .205⁄⁄ .208⁄⁄ .136 .216⁄⁄ .221⁄⁄ .219⁄⁄ .629⁄⁄ 1DF-5 �.013 .145⁄ .107 .134 .120 .102 .119 .430⁄⁄ .454⁄⁄ 1ISF-1 .010 .054 �.002 .204⁄⁄ .240⁄⁄ .203⁄⁄ .294⁄⁄ .232⁄⁄ .151⁄ .207⁄⁄ 1ISF-2 �.009 .113 .025 .211⁄⁄ .260⁄⁄ .241⁄⁄ .279⁄⁄ .216⁄⁄ .136 .261⁄⁄ .790⁄⁄ 1
Violations 0 0 0 0 0 0 0 0 0 0 0 0
⁄ Correlation is significant at the 0.05 level (2-tailed).⁄⁄ Correlation is significant at the 0.01 level (2-tailed).
K.K.-L. Moon et al. / European Journal of Operational Research 222 (2012) 191–203 197
CR ¼ ðP
kÞ2
½ðP
kÞ2 þPð1� k2Þ�
AVE ¼P
k2
½P
k2 þPð1� k2Þ�
where k is the standardized loading for each observed variable and1 � k2 is the error variance associated with each observed variable.
SMC is a measure of the strength of the relationships of the indi-vidual items to their respective latent variables, while the CR scorereflects the internal consistency of a set of measures, and the AVEestimate illustrates the overall amount of variance in the indicatorsaccounted for by the latent construct (Garver and Mentzer, 1999;Bollen, 1989). In general, an SMC greater than 0.3, a CR greater than0.7, and an AVE greater than 0.5 indicate sufficient reliability for aconstruct (Garver and Mentzer, 1999; Fornell and Larcker, 1981;Segars, 1997). As Table 6 shows, all score values for SMC, CR, andAVE exceed the recommended threshold requirements, implyingthat each component factor is sufficiently reliable.
Table 6Measurement properties of the component factors of SCF.
Component/item Regression weight (k) Item reliability (SMC)a
SF1. SF-1 .736 .5422. SF-2 .677 .4583. SF-3 .576 .332
OSF4. OSF-2 .614 .3775. OSF-3 .825 .6816. OSF-4 .739 .5467. OSF-5 .649 .421
DF8. DF-3 .799 .6389. DF-4 .787 .61910. DF-5 .557 .310
ISF11. ISF-1 .881 .77612. ISF-2 .901 .812
a Threshold for SMC (>.30), CR (>.70), AVE (>.50).b Threshold for p-value of v2 (>.050), v2/df (<3.00), GFI (>.90), AGFI (>.80), CFI (>.90),
5.3.3. Testing for convergent validityConvergent validity refers to the existence of one latent trait or
construct underlying a set of measures (Anderson et al., 1987).To check for this, we first compared the correlations at item level.If the lowest correlation of a particular item within each compo-nent factor is significant at p < 0.01, convergent validity exists(Koufteros et al., 1998). In Table 5, the results show that the lowestcorrelations for each item in each component factor are all greaterthan or very close to 0.40 and are significant at the 0.01 level. Theseindicate initial evidence of good convergent validity.
Further, we checked the parameter estimates and the overall fitof each measurement model (Garver and Mentzer, 1999). In CFA,measurement items are restricted to significant loadings on theirrespective constructs to demonstrate sufficient convergent validity(Hair et al., 2006). As Table 6 shows, the regression weights of themeasurement items range from 0.901 to 0.557, all being over 0.50and significant at the 0.05 level. The model summary statistics alsoshow that all the p values of the v2 of the component factors arehigher than 0.05 and statistically insignificant, while all the normedv2 (i.e., v2/df) are lower than 3.00. A series of goodness-of-fit
Scale reliability (CR and AVE)a Model summary and fit indicesb
CR = 0.7965 v2(1) = 0.009 (p = 0.925)AVE = 0.5685 v2/df = 0.009
GFI = 1.000; AGFI = 1.000; CFI = 1.000RMR = 0.005; RMSEA = 0.000
CR = 0.8720 v2(2) = 4.007 (p = 0.135)AVE = 0.6332 v2/df = 2.004
GFI = 0.989; AGFI = 0.946; CFI = 0.991RMR = 0.049; RMSEA = 0.072
CR = 0.8427 v2 (1) = 0.372 (p = 0.542)AVE = 0.6466 v2/df = 0.372
GFI = 0.999; AGFI = 0.992; CFI = 1.000RMR = 0.036; RMSEA = 0.000
CR = 0.7981 v2 (1) = 0.233 (p = 0.630)AVE = 0.8793 v2/df = 0.233
GFI = 0.999; AGFI = 0.996; CFI = 1.000RMR = 0.050; RMSEA = 0.000
RMR (<.10), RMSEA (<.10).

198 K.K.-L. Moon et al. / European Journal of Operational Research 222 (2012) 191–203
indices, namely, CFI, GFI, and AGFI are greater than the threshold le-vel of 0.9; and RMR and RMSEA are lower than 0.08. All these revealstronger evidence for the existence of convergent validity; that is,the observed indicators are good representatives of their respectivelatent constructs (Hair et al., 2006).
5.3.4. Testing for discriminant validityDiscriminant validity represents the degree to which a dimen-
sion in a theoretical system differs from other dimensions in thesame system (Churchill, 1979). In the present study, we used threetests to confirm the discriminant validity of the four componentfactors of the SCF: (1) correlations comparison (Koufteros et al.,1998), (2) the pair-construct test (Segars and Grover, 1998), and(3) the AVE versus shared variance test (Farrell, 2010).
We checked the initial discriminant validity by comparing thelowest correlation for a particular item and any other items withinthe same factor (within-factor correlations) with the correlationsof that item and all items outside the factor (between-factor corre-lations) (Koufteros et al., 1998). If the within-factor correlation wasless than any between-factor correlation, then a violation wouldhave occurred. In examining the correlation matrix in Table 5, wefound no violation to this rule among the 106 possible compari-sons. Initial evidence of discriminant validity was hence supported.
In the pair-construct test, we compared the v2 values of each ofthe unconstrained models, which estimated (or freed) the correla-tion between a pair of constructs of the four component factors ofSCF, with the nested constrained models, which fixed the value ofthe construct correlation to one (Segars and Grover, 1998). If therewas a significant v2 difference between the two models, theunconstrained model would be a better fit for the data and therebysupport the existence of discriminant validity. Table 7 shows theresults of this test, in which the v2 differences range from 5.378to 28.875 and all are significant at the 0.05 level, providing furtherevidence of discriminant validity.
Finally, we examined the discriminant validity by comparingthe AVE of each construct with the shared variance between con-structs. Shared variance is the amount of variance that one con-struct is able to explain in another construct (Farrell, 2010). It isrepresented by the square of the correlation between any two con-structs. Discriminant validity can be supported if the AVE for eachconstruct is greater than its shared variance with any other con-struct. Table 7 shows that all AVE estimates of SF, OSF, DF, andISF are higher than each of the shared variance values betweeneach pair of constructs. Such results provide further evidence ofconfirming the discriminant validity of the four component factorsof SCF (Fornell and Larcker, 1981).
5.4. Developing and testing the overall measurement model for SCF
To achieve our ultimate goal of proposing a reliable and validmeasurement model for SCF, we set up five alternative competing
Table 7Pair-construct test and AVE versus shared variance test.
Pairs Pair-construct test
v2 Values v2 D
Constrained model Unconstrained model
SF with OSF 46.126 (df = 14) 20.997 (df = 13) 25.12SF with DF 33.774 (df = 9) 9.562 (df = 8) 24.21SF with ISF 33.568 (df = 5) 4.693 (df = 4) 28.87OSF with DF 35.620 (df = 14) 9.464 (df = 13) 26.15OSF with ISF 19.276 (df = 9) 8.191 (df = 8) 11.08DF with ISF 13.456 (df = 5) 8.078 (df = 4) 5.37
a Correlations are below the diagonal, shared variances are above the diagonal, and A⁄⁄ v2 difference is significant at the 0.05 level.⁄⁄⁄ v2 difference is significant at the 0.01 level.
models (see Fig. 1) based on the approach of Xia and Lee (2005).Likewise, we examined the model fitness in line with the concep-tualization of the SCF construct using CFA in SEM. The five modelsare as follows: (1) a null model in which all measures were uncor-related to one another, (2) a model in which all measures wereloaded onto a single first-order factor, (3) a model in which themeasures were loaded onto four uncorrelated first-order factors,(4) a model in which the measures were loaded onto four corre-lated first-order factors, and (5) a model in which the four first-or-der factors were loaded onto a second-order factor of SCF. Thesemodels were tagged as Model 1 to Model 5, respectively.
Table 8 shows the results of these five competing models. Mod-els 1, 2, and 3 were unacceptable because most of their goodness-of-fit indices failed to meet the threshold criteria. In contrast, wecould preliminarily accept Models 4 and 5, namely, the correlatedfour-factor first-order model and the four-factor second-ordermodel, because all fit indices satisfy the threshold criteria. The re-sults of the estimation of these two models are also shown in Figs.2 and 3, respectively.
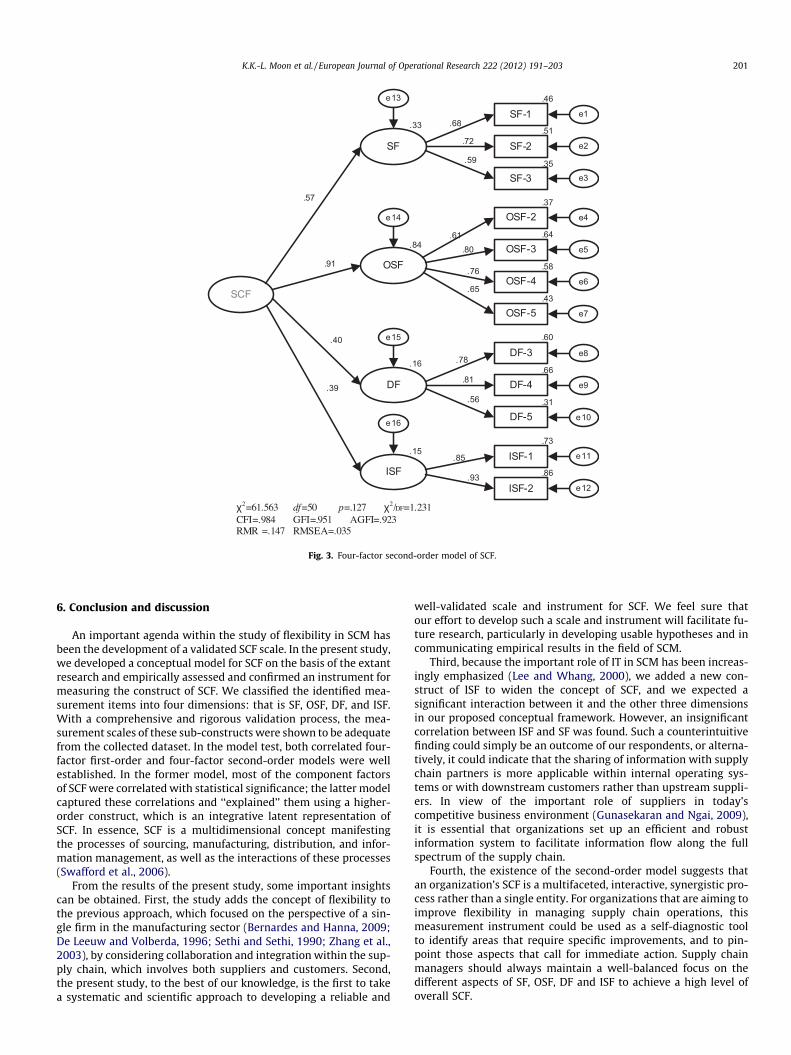
For the correlated four-factor first-order model, the scales of SF,OSF, DS, and ISF are correlated but not governed by a common la-tent factor, yet all the model summary statistics and the goodness-of-fit indices suggest a sound fit for it. The v2 statistic is 51.41(df = 48; p = 0.342) and is insignificant at the 0.05 level; normedv2 is 1.071, well below 3.00. Meanwhile, CFI (0.995), GFI (0.958),and AGFI (.932) are all higher than 0.9, and RMR (0.102) andRMSEA (0.019) are below or close to 0.1. For the four-factorsecond-order model, the test results illustrate that a higher-orderlatent factor, that is, the overall trait of SCF, governs the correla-tions among the constructs of SF, OSF, DF, and ISF. The v2 statisticis 61.563 (df = 50; p = 0.127) and normed v2 is 1.231. The good-ness-of-fit indices of CFI (0.984), GFI (0.951), AGFI (0.923), RMR(0.147), and RMSEA (0.035) all meet or are close to the thresholdcriteria. As a whole, the four proposed factors fit the dataset welland that the two measurement models can represent the scale ofSCF.
To compare the efficacy of these two acceptasble models, wecontinued to check the values of the consistent Akaike informationcriterion (CAIC), which is an assessment for improvement overcompeting models. In general, lower CAIC values reflect the modelwith better fit (Milfont and Duckitt, 2004). The results in Table 8show that the CAIC of the second-order model (236.773) is lowerthan that of the correlated first-order model (239.134), suggestingthat the second-order model possesses better parsimony.Subsequently, we checked the target (T) coefficient, which is acomparison of the v2 statistics of the lower-order model and thehigher-order model (Marsh and Hocevar, 1985). This coefficienthas a ceiling value of one, with a higher value implying thatthe relationship among lower-order factors is sufficiently cap-tured by the higher-order factor (Segars and Grover, 1998). Inour study, the T coefficient is rather high (0.835), indicating that
AVE vs. shared variance testa
ifference
SF OSF DF ISF
9⁄⁄⁄ SF .5685 .293 .099 .0042⁄⁄⁄ OSF .541 .6332 .110 .1385⁄⁄⁄ DF .315 .332 .6466 .0826⁄⁄⁄ ISF .062 .372 .286 .87935⁄⁄⁄
8⁄⁄
VE estimates are presented on the diagonal.
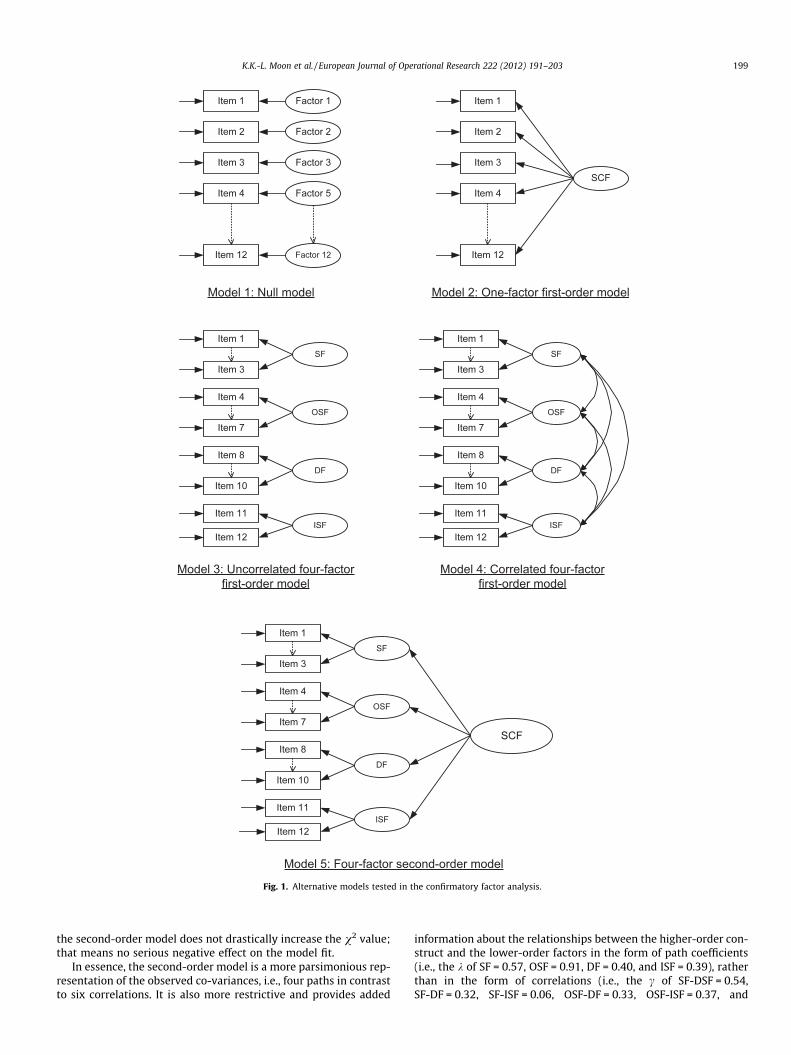
Fig. 1. Alternative models tested in the confirmatory factor analysis.
K.K.-L. Moon et al. / European Journal of Operational Research 222 (2012) 191–203 199
the second-order model does not drastically increase the v2 value;that means no serious negative effect on the model fit.
In essence, the second-order model is a more parsimonious rep-resentation of the observed co-variances, i.e., four paths in contrastto six correlations. It is also more restrictive and provides added
information about the relationships between the higher-order con-struct and the lower-order factors in the form of path coefficients(i.e., the k of SF = 0.57, OSF = 0.91, DF = 0.40, and ISF = 0.39), ratherthan in the form of correlations (i.e., the c of SF-DSF = 0.54,SF-DF = 0.32, SF-ISF = 0.06, OSF-DF = 0.33, OSF-ISF = 0.37, and
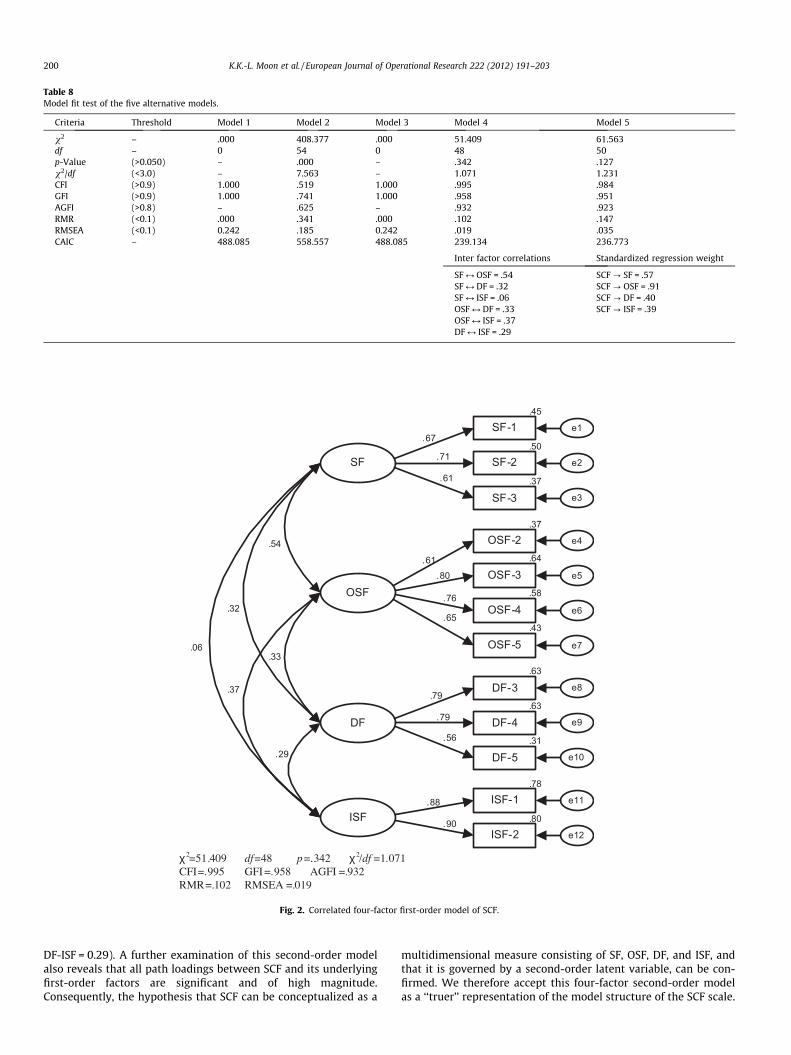
Table 8Model fit test of the five alternative models.
Criteria Threshold Model 1 Model 2 Model 3 Model 4 Model 5
v2 – .000 408.377 .000 51.409 61.563df – 0 54 0 48 50p-Value (>0.050) – .000 – .342 .127v2/df (<3.0) – 7.563 – 1.071 1.231CFI (>0.9) 1.000 .519 1.000 .995 .984GFI (>0.9) 1.000 .741 1.000 .958 .951AGFI (>0.8) – .625 – .932 .923RMR (<0.1) .000 .341 .000 .102 .147RMSEA (<0.1) 0.242 .185 0.242 .019 .035CAIC – 488.085 558.557 488.085 239.134 236.773
Inter factor correlations Standardized regression weight
SF M OSF = .54 SCF ? SF = .57SF M DF = .32 SCF ? OSF = .91SF M ISF = .06 SCF ? DF = .40OSF M DF = .33 SCF ? ISF = .39OSF M ISF = .37DF M ISF = .29
SF-1
OSF-4
OSF-3
OSF-2
SF-3
SF-2SF
ISF-1
DF-5
DF-4
DF-3
OSF-5
e1
ISF-2
OSF
DF
e2
e12
e11
e10
e9
e8
e7
e6
e5
e4
e3
ISF
.54
.32
.06
.37
.71
.67
.29
.33
.61
.79
.65
.76
.80.61
.80
.45
.90
.88
.56
.79
.50
.37
.37
.64
.58
.43
.63
.63
.31
.78
χ2=51.409 df=48 p=.342 χ2/df =1.071CFI=.995 GFI =.958 AGFI =.932 RMR=.102 RMSEA =.019
Fig. 2. Correlated four-factor first-order model of SCF.
200 K.K.-L. Moon et al. / European Journal of Operational Research 222 (2012) 191–203
DF-ISF = 0.29). A further examination of this second-order modelalso reveals that all path loadings between SCF and its underlyingfirst-order factors are significant and of high magnitude.Consequently, the hypothesis that SCF can be conceptualized as a
multidimensional measure consisting of SF, OSF, DF, and ISF, andthat it is governed by a second-order latent variable, can be con-firmed. We therefore accept this four-factor second-order modelas a ‘‘truer’’ representation of the model structure of the SCF scale.
SF-1
OSF-4
OSF-3
OSF-2
SF-3
SF-2SF
ISF-1
DF-5
DF-4
DF-3
OSF-5
e1
ISF-2
OSF
DF
e2
e12
e11
e10
e9
e8
e7
e6
e5
e4
e3
ISF
.72
.68
.59
.78
.65
.76
.80.61
.86
.46
.93
.85
.56
.81
.51
.35
.37
.64
.58
.43
.60
.66
.31
.73
e13
e14
e15
e16
SCF
.33
.84
.16
.15
.57
.91
.40
.39
χ2=61.563 df=50 p=.127 χ2/ =1.231CFI=.984 GFI=.951 AGFI=.923 RMR =.147 RMSEA=.035
Fig. 3. Four-factor second-order model of SCF.
K.K.-L. Moon et al. / European Journal of Operational Research 222 (2012) 191–203 201
6. Conclusion and discussion
An important agenda within the study of flexibility in SCM hasbeen the development of a validated SCF scale. In the present study,we developed a conceptual model for SCF on the basis of the extantresearch and empirically assessed and confirmed an instrument formeasuring the construct of SCF. We classified the identified mea-surement items into four dimensions: that is SF, OSF, DF, and ISF.With a comprehensive and rigorous validation process, the mea-surement scales of these sub-constructs were shown to be adequatefrom the collected dataset. In the model test, both correlated four-factor first-order and four-factor second-order models were wellestablished. In the former model, most of the component factorsof SCF were correlated with statistical significance; the latter modelcaptured these correlations and ‘‘explained’’ them using a higher-order construct, which is an integrative latent representation ofSCF. In essence, SCF is a multidimensional concept manifestingthe processes of sourcing, manufacturing, distribution, and infor-mation management, as well as the interactions of these processes(Swafford et al., 2006).
From the results of the present study, some important insightscan be obtained. First, the study adds the concept of flexibility tothe previous approach, which focused on the perspective of a sin-gle firm in the manufacturing sector (Bernardes and Hanna, 2009;De Leeuw and Volberda, 1996; Sethi and Sethi, 1990; Zhang et al.,2003), by considering collaboration and integration within the sup-ply chain, which involves both suppliers and customers. Second,the present study, to the best of our knowledge, is the first to takea systematic and scientific approach to developing a reliable and
well-validated scale and instrument for SCF. We feel sure thatour effort to develop such a scale and instrument will facilitate fu-ture research, particularly in developing usable hypotheses and incommunicating empirical results in the field of SCM.
Third, because the important role of IT in SCM has been increas-ingly emphasized (Lee and Whang, 2000), we added a new con-struct of ISF to widen the concept of SCF, and we expected asignificant interaction between it and the other three dimensionsin our proposed conceptual framework. However, an insignificantcorrelation between ISF and SF was found. Such a counterintuitivefinding could simply be an outcome of our respondents, or alterna-tively, it could indicate that the sharing of information with supplychain partners is more applicable within internal operating sys-tems or with downstream customers rather than upstream suppli-ers. In view of the important role of suppliers in today’scompetitive business environment (Gunasekaran and Ngai, 2009),it is essential that organizations set up an efficient and robustinformation system to facilitate information flow along the fullspectrum of the supply chain.
Fourth, the existence of the second-order model suggests thatan organization’s SCF is a multifaceted, interactive, synergistic pro-cess rather than a single entity. For organizations that are aiming toimprove flexibility in managing supply chain operations, thismeasurement instrument could be used as a self-diagnostic toolto identify areas that require specific improvements, and to pin-point those aspects that call for immediate action. Supply chainmanagers should always maintain a well-balanced focus on thedifferent aspects of SF, OSF, DF and ISF to achieve a high level ofoverall SCF.
202 K.K.-L. Moon et al. / European Journal of Operational Research 222 (2012) 191–203
7. Limitations and future research
Establishing a valid and reliable scale for SCF contributes to abetter understanding of the nature of SCM. However, the presentstudy has some limitations. First, it focuses only on the textileand clothing industry in China; thus, a wider scope of researchmerits further attention. More studies are needed to refine, vali-date, and test the proposed instrument across different industriesand settings. Second, future research could also focus on examiningthe relationships between SCF and other organizational attributes,such as perceived environmental uncertainties or supply chainperformance. The instrument developed in the present study pro-vides a sound approach for testing such relationships. Third, theunit of analysis of this study is a focal firm rather than a specificsupply chain. This unit of analysis has enabled us to focus onlyon organization-wide patterns of SCF. Thus, readers should beaware of this when interpreting the results.
All in all, our study adds to the body of knowledge regardingSCF, giving other researchers a valuable tool to measure the inten-sity of flexibility in various aspects of an organization. We believethat future qualitative or quantitative studies that collect data fromdifferent members in a specific supply chain might provide moreinformative results. We also expect additional new approaches togenerating and managing SCF on the basis of a more critical inves-tigation into industrial practices and an intensive review of the ex-tant literature, which would enrich both theoretical andmanagerial development. With further refinement of the mea-sures, research in SCF could progress into new areas that may havea higher probability of building and confirming substantivetheories.
References
Anderson, J.C., Gerbing, D.W., Hunter, J.E., 1987. On the assessment ofunidimensional measurement: internal and external consistency, and overallconsistency criteria. Journal of Marketing Research 24 (4), 432–437.
Armstrong, J.S., Overton, T.S., 1977. Estimating nonresponse bias in mail surveys.Journal of Marketing Research 14 (3), 396–402.
Beach, R., Muhlemann, A.P., Price, D.H.R., Paterson, A., Sharp, J.A., 2000. A review ofmanufacturing flexibility. European Journal of Operational Research 122 (1),41–57.
Beamon, B.M., 1999. Measuring supply chain performance. International Journal ofOperations & Production Management 19 (3), 275–292.
Bernardes, E.S., Hanna, M.D., 2009. A theoretical review of flexibility, agility andresponsiveness in the operations management literature: toward a conceptualdefinition of customer responsiveness. International Journal of Operations &Production Management 29 (1), 30–53.
Bollen, K.A., 1989. Structural Equations with Latent Variables. Wiely, New York.Boynton, A.C., Victor, B., 1991. Beyond flexibility: building and managing the
dynamically stable organization. California Management Review 34 (1), 53–66.Byrne, B.M., 2001. Structural Equation Modeling with AMOS: Basic Concepts, and
Programming, Applications. Lawrence Erlbaum Associates, Mahwah, NewJersey.
China Community Net, 2007. Directory of Chinese Enterprises. <http://ccn.mofcom.gov.cn/index.htm> (cited February 2008).
Churchill, G.A., 1979. A paradigm for developing better measures of marketingconstructs. Journal of Marketing Research 16 (1), 64–73.
Das, K., 2011. Integrating effective flexibility measures into a strategic supply chainplanning model. European Journal of Operational Research 211 (1), 170–183.
De Leeuw, A.C.J., Volberda, H.W., 1996. On the concept of flexibility: a dual controlperspective. Omega 24 (2), 121–139.
Dess, G.G., Ireland, R.D., Hitt, M.A., 1990. Industry effects and strategic managementresearch. Journal of Management 16 (1), 7–27.
De Toni, A., Tonchia, S., 1998. Manufacturing flexibility: a literature review.International Journal of Production Research 36 (6), 1587–1617.
Devereux, M.B., Engel, C., 2003. Monetary policy in the open economy revisited:price setting and exchange-rate flexibility. Review of Economic Studies 70(245), 765–783.
Dixon, J.R., 1992. Measuring manufacturing flexibility: an empirical investigation.European Journal of Operational Research 60 (2), 131–143.
D’Souza, D.E., Williams, F.P., 2000. Toward a taxonomy of manufacturing flexibilitydimensions. Journal of Operations Management 18 (5), 577–593.
Duclos, L.K., Vokurka, R.J., Lummus, R.R., 2003. A conceptual model of supply chainflexibility. Industrial Management & Data Systems 103 (6), 446–456.
Farrell, A.M., 2010. Insufficient discriminant validity: a comment on Bove, Pervan,Beatty, and Shiu (2009). Journal of Business Research 63 (3), 324–327.
Fong, M., Dodes, R., 2006. Style & substance: some apparel makers now see China asa customer. Wall Street Journal B.1.
Fornell, C., Larcker, D.F., 1981. Evaluating structural equation models withunobservable variables and measurement error. Journal of MarketingResearch 18 (1), 39–50.
Fredericks, E., 2005. Infusing flexibility into business-to-business firms: acontingency theory and resource-based view perspective and practicalimplications. Industrial Marketing Management 34 (6), 555–565.
Garavelli, A.C., 2003. Flexibility configurations for the supply chain management.International Journal of Production Economics 85 (2), 141–153.
Garver, M.S., Mentzer, J.T., 1999. Logistics research methods: employing structuralequation modeling to test for construct validity. Journal of Business Logistics 20(1), 33–57.
Gerbing, D.W., Anderson, J.C., 1988. An updated paradigm for scale developmentincorporating unidimensionality and its assessment. Journal of MarketingResearch 25 (2), 186–192.
Gerwin, D., 1993. Manufacturing flexibility: a strategic perspective. ManagementScience 39 (4), 395–410.
Golden, W., Powell, P., 2000. Towards a definition of flexibility: in search of the HolyGrail? Omega 28 (4), 373–384.
Gong, Z., 2008. An economic evaluation model of supply chain flexibility. EuropeanJournal of Operational Research 184 (2), 745–758.
Gunasekaran, A., Ngai, E.W.T., 2009. Modeling and analysis of build-to-order supplychains. European Journal of Operational Research 195 (2), 319–334.
Gupta, Y.P., Goyal, S., 1989. Flexibility of manufacturing systems: concepts andmeasurements. European Journal of Operational Research 43 (2), 119–135.
Gupta, Y.P., Somers, T.M., 1992. The measurement of manufacturing flexibility.European Journal of Operational Research 60 (2), 166–182.
Gupta, Y.P., Somers, T.M., 1996. Business strategy, manufacturing flexibility, andorganizational performance relationships: a path analysis approach. Productionand Operations Management 5 (3), 204–233.
Hair, J.F., Black, W.C., Babin, B.J., Anderson, R.E., Tatham, R.L., 2006. MultivariateData Analysis, sixth ed. Pearson/Prentice Hall, Upper Saddle River, NJ.
Holmberg, S., 2000. A systems perspective on supply chain measurements.International Journal of Physical Distribution & Logistics Management 30 (10),847–868.
Jones, R.A., Ostroy, J.M., 1984. Flexibility and uncertainty. The Review of EconomicStudies 51 (164), 13–32.
Jöreskog, K.G., 1993. Testing structural equation models. In: Bollen, K.A., Long, J.S.(Eds.), Testing Structural Equation Models. Sage Publications, Newbury Park, CA,pp. 294–316.
Koste, L.L., Malhotra, M.K., 1999. A theoretical framework for analyzing thedimensions of manufacturing flexibility. Journal of Operations Management18 (1), 75–93.
Koste, L.L., Malhotra, M.K., Sharma, S., 2004. Measuring dimensions ofmanufacturing flexibility. Journal of Operations Management 22 (2),171–196.
Koufteros, X.A., Vonderembse, M.A., Doll, W.J., 1998. Developing measures of time-based manufacturing. Journal of Operations Management 16 (1),21–41.
Lee, H.L., 2000. Creating value through supply chain integration. Supply ChainManagement Review 4 (4), 30–36.
Lee, H.L., Whang, S., 2000. Information sharing in a supply chain. InternationalJournal of Manufacturing Technology Management 1 (1), 79–93.
Lin, F.R., Shaw, M.J., 1998. Reengineering the order fulfillment process in supplychain networks. International Journal of Flexible Manufacturing Systems 10 (3),197–229.
Lucas Jr., H.C., Olson, M., 1994. The impact of information technology onorganizational flexibility. Journal of Organizational Computing and ElectronicCommerce 4 (2), 155–177.
Lummus, R.R., Duclos, L.K., Vokurka, R.J., 2003. Supply chain flexibility: building anew model. Global Journal of Flexible Systems Management 4 (4),1–13.
Marsh, H.W., Hocevar, D., 1985. Application of comfirmatory factor analysis to thestudy of self-concept: first- and higher order factor models and their invarianceacross groups. Psychological Bulletin 97 (3), 562–582.
Milfont, T.L., Duckitt, J., 2004. The structure of environmental attitudes: a first- andsecond-order confirmatory factor analysis. Journal of EnvironmentalPsychology 24 (3), 289–303.
Moore, G.C., Benbasat, I., 1991. Development of an instrument to measure theperceptions of adopting an information technology innovation. InformationSystems Research 2 (3), 192–222.
Pagell, M., Krause, D.R., 1999. A multiple-method study of environmentaluncertainty and manufacturing flexibility. Journal of Operations Management17 (3), 307–325.
Peter, J.P., 1979. Reliability: a review of psychometric basics and recent marketingpractices. Journal of Marketing Research 16 (1), 6–17.
Sánchez, A.M., Pérez, M.P., 2005. Supply chain flexibility and firm performance: aconceptual model and empirical study in the automotive industry. InternationalJournal of Operations & Production Management 25 (7), 681–700.
Sarker, B.R., Krishnamurthy, S., Kuthethur, S.G., 1994. A survey and critical review offlexibility measures in manufacturing systems. Production Planning & Control 5(6), 512–523.
Sawhney, R., 2006. Interplay between uncertainty and flexibility across the value-chain: towards a transformation model of manufacturing flexibility. Journal ofOperations Management 24 (5), 476–493.

K.K.-L. Moon et al. / European Journal of Operational Research 222 (2012) 191–203 203
Segars, A.H., 1997. Assessing the unidimensionality of measurement: a paradigmand illustration within the context of information systems research. Omega 25(1), 107–121.
Segars, A.H., Grover, V., 1998. Strategic information systems planning success: aninvestigation of the construct and its measurement. MIS Quarterly 22 (2), 139–163.
Sethi, A.K., Sethi, S.P., 1990. Flexibility in manufacturing: a survey. InternationalJournal of Flexible Manufacturing Systems 2 (4), 289–328.
Shewchuk, J.P., Moodie, C.L., 1998. Definition and classification of manufacturingflexibility types and measures. International Journal of Flexible ManufacturingSystems 10 (4), 325–349.
Slack, N., 1983. Flexibility as a manufacturing objective. International Journal ofOperations and Production Management 3 (3), 4–13.
Stevenson, M., Spring, M., 2007. Flexibility from a supply chain perspective:definition and review. International Journal of Operations & ProductionManagement 27 (7), 685–713.
Swafford, P.M., Ghosh, S., Murthy, N., 2006. The antecedents of supply chain agilityof a firm: scale development and model testing. Journal of OperationsManagement 24 (2), 170–188.
Tachizawa, E.M., Giménez, C., 2009. Assessing the effectiveness of supply flexibilitysources: an empirical research. International Journal of Production Research 47(20), 5791–5809.
The Supply Chain Council, 2006. Supply-Chain Operations Reference-Model SCORVersion 8.0.
Upton, D.M., 1994. The management of manufacturing flexibility. CaliforniaManagement Review 36 (2), 72–89.
Vickery, S., Calantone, R., Dröge, C., 1999. Supply chain flexibility: an empiricalstudy. Journal of Supply Chain Management 35 (3), 16–24.
Vokurka, R.J., O’Leary-Kelly, S.W., 2000. A review of empirical research onmanufacturing flexibility. Journal of Operations Management 18 (4),485–501.
Williams, Z., Ponder, N., Autry, C.W., 2009. Supply chain security culture: measuredevelopment and validation. The International Journal of Logistics Management20 (2), 243–260.
World Trade Organization, 2009. International Trade Statistics. <http://www.wto.org/english/res_e/statis_e/its2010_e/its10_merch_trade_product_e.htm> [citedAugust 2010].
Xia, W., Lee, G., 2005. Complexity of information systems development projects:conceptualization and measurement development. Journal of ManagementInformation Systems 22 (1), 45–83.
Zhang, Q., Vonderembse, M.A., Lim, J-S., 2003. Manufacturing flexibility: definingand analyzing relationships among competence, capability, and customersatisfaction. Journal of Operations Management 21 (2), 173–191.