monthly state of the market report - spp.org msom report 201003.pdf · spp market monitoring unit...
TRANSCRIPT

Monthly State of the Market
Report
March 2010
published April 15, 2010
produced by SPP Market Monitoring Unit
Copyright © 2009 by Southwest Power Pool, Inc. All rights reserved.
SPP Market Monitoring Unit
Monthly State of the Market Report 2 March 2010
Table of Contents
Executive Summary .............................................................................................................................................. 3
Figures .................................................................................................................................................................... 4
Figure 1 – SPP EIS Price Contour Map ................................................................................................... 4
Figure 2 – Congestion by Shadow Price Impact – March 2010 ............................................................... 5
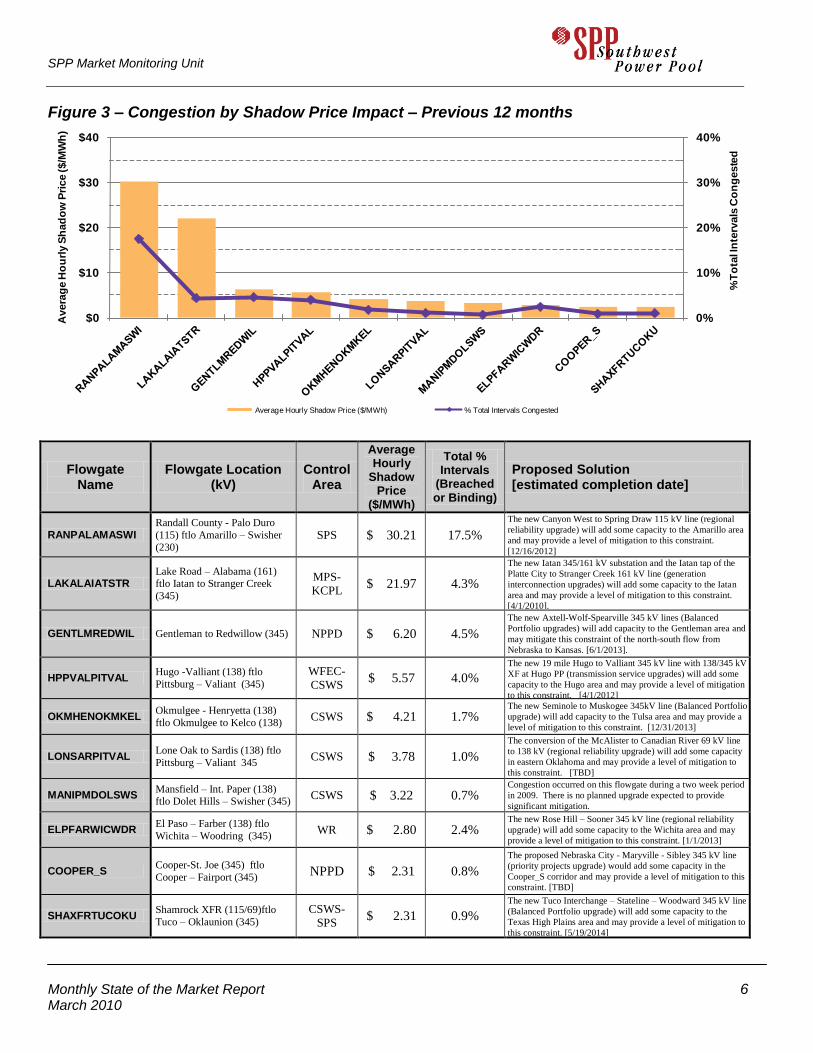
Figure 3 – Congestion by Shadow Price Impact – Previous 12 months .................................................. 6
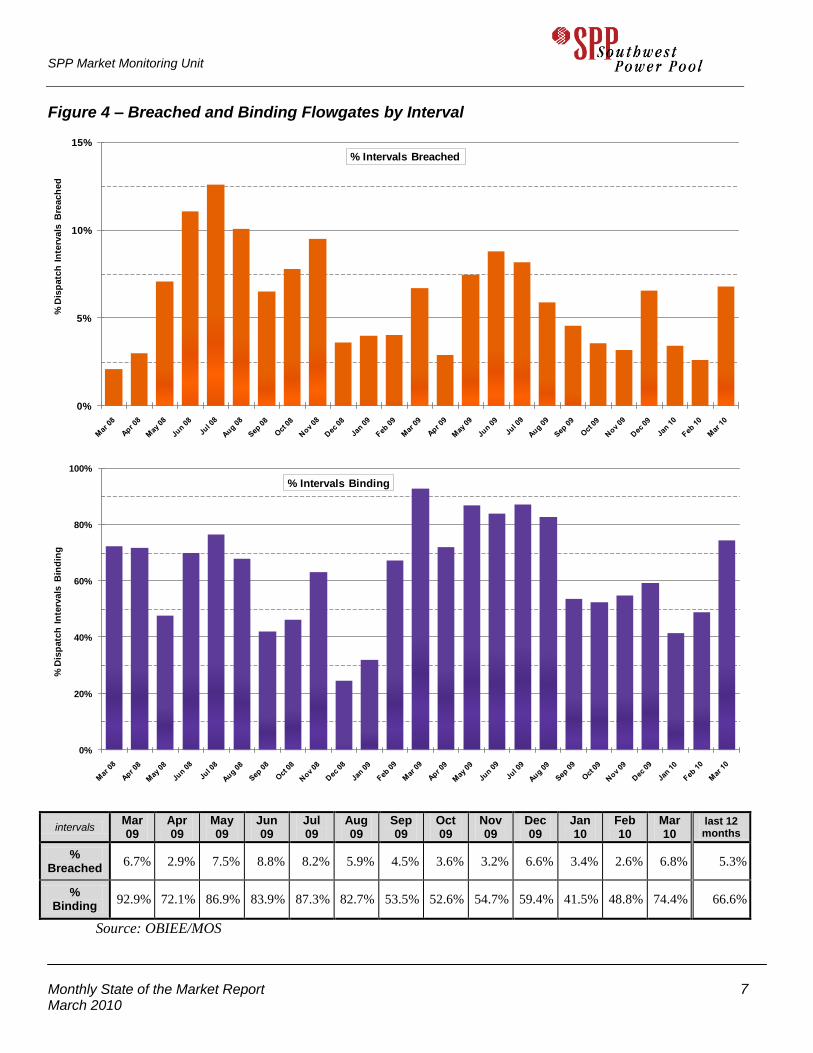
Figure 4 – Breached and Binding Flowgates by Interval ......................................................................... 7
Figure 5 – LIP / Gas Cost Comparison .................................................................................................... 8
Figure 6 – Hourly Price Ranges by Market Participant – March 2010 .................................................... 9
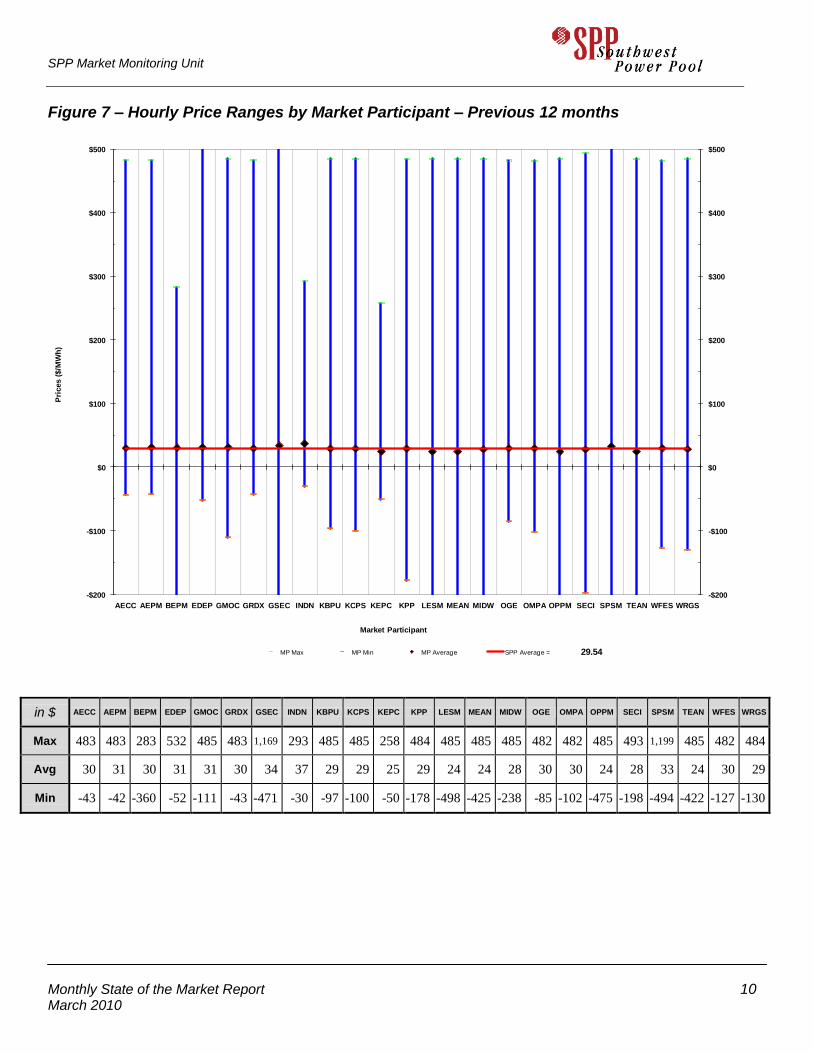
Figure 7 – Hourly Price Ranges by Market Participant – Previous 12 months ..................................... 10
Figure 8 – Regional Monthly Prices ...................................................................................................... 11
Figure 9 – Energy Generation by Fuel Type .......................................................................................... 12
Figure 10 – Wind Generation & Capacity ............................................................................................. 13
Figure 11 – Fuel on the Margin .............................................................................................................. 14
Figure 12 – EIS Settlements - GWh ....................................................................................................... 15
Figure 13 – EIS Settlements - $ ............................................................................................................. 16
Figure 14 – Depth of Energy Market for Resources Only – by Status .................................................. 17
Figure 15 – Resource Five Minute Ramp Rates .................................................................................... 18
Figure 16 – Monthly Summary of Market Ramp Rate Deficiency ........................................................ 19
Figure 17 – Dispatchable Range ............................................................................................................ 20
Figure 18 – Transmission Owner Revenue ............................................................................................ 21
Figure 19 – Average Transmission Reservations and Schedules ........................................................... 22
Figure 20 – RNU Components ............................................................................................................... 23
Disclaimer
The data and analysis in this report are provided for informational purposes only and shall not be considered or relied upon as market advice or market settlement data. The Southwest Power Pool Market Monitoring Unit (SPP MMU) makes no representation or warranties of any kind, express or implied, with respect to the accuracy or adequacy of the information contained herein. The SPP MMU shall have no liability to recipients of this information or third parties for the consequences arising from errors or discrepancies in this information, or for any claim, loss or damage of any kind or nature whatsoever arising out of or in connection with (i) the deficiency or inadequacy of this information for any purpose, whether or not known or disclosed to the authors, (ii) any error or discrepancy in this information, (iii) the use of this information, or (iv) a loss of business or other consequential loss or damage whether or not resulting from any of the foregoing
SPP Market Monitoring Unit
Monthly State of the Market Report 3 March 2010
Executive Summary
Prices in the Southwest Power Pool (SPP) Energy Imbalance Services (EIS) market averaged
$27.72/MWh for March 2010, a decrease of $12.84 (32%) in the last month. As observed previously,
SPP EIS prices follow closely with spot gas prices. Figure 5 shows this correlation quite vividly, showing
the EIS price of electricity with the price of spot gas at the Panhandle hub. This month’s EIS price is
comparable to the $27.38 price one year ago in March 2009. SPP prices follow similar trends in MISO
and ERCOT as shown in Figure 8.
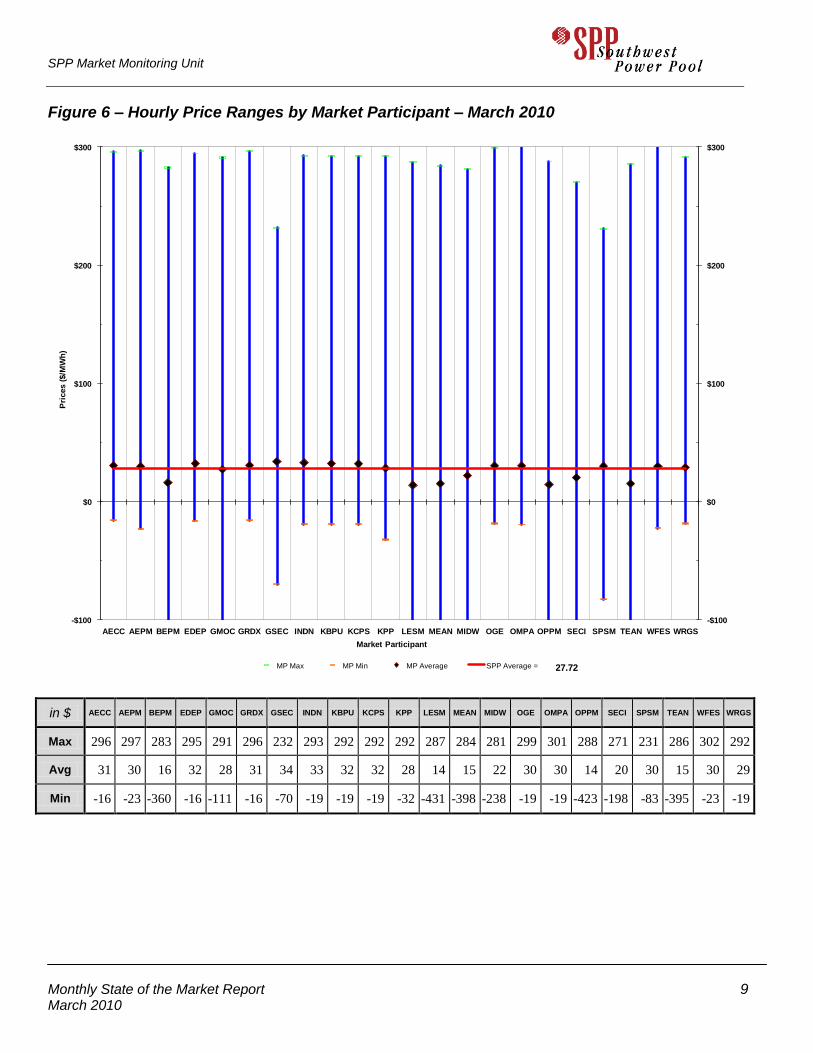
Although the average price was low in March 2010, several market participants experienced extremely
high price volatility. Almost all market participants experienced a highest hourly price between $280-
$300. However, a handful of participants experienced a lowest hourly price of around -$300. Although
total price volatility for SPP was 60% (Figure 8), those market participants with the largest spread in their
high and low prices saw their price volatility for March exceed 300%.
Congestion increased somewhat in March as shown in the average shadow price of our top two flowgates
in Figure 2. This congestion can be seen as price separation in the Texas panhandle and in northwestern
Missouri in Figure 1. Congestion tends to limit the general flow of electricity from north to south.
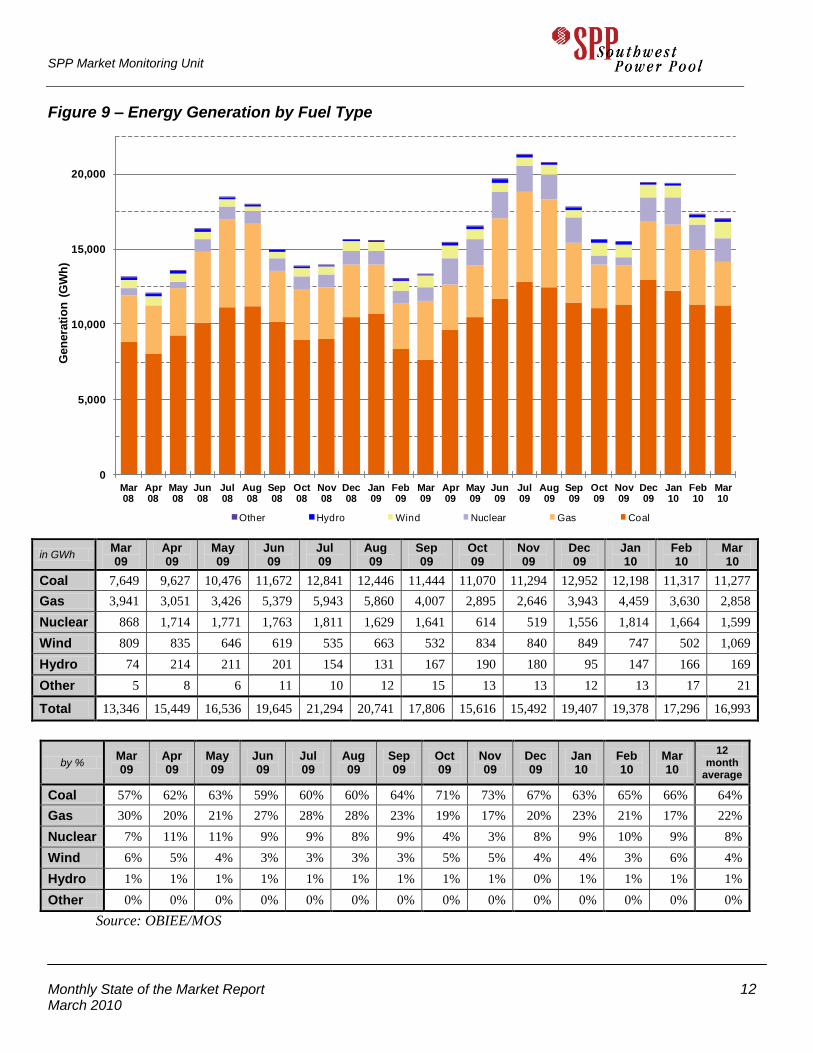
March saw an all-time high in wind production. This is evident in the sharp increase shown in Figure 10.
March and April are the traditional windy months, but March 2010 represents a 32% increase in wind
production from March 2009, a period when wind capacity increased by only 21%. This increase in wind
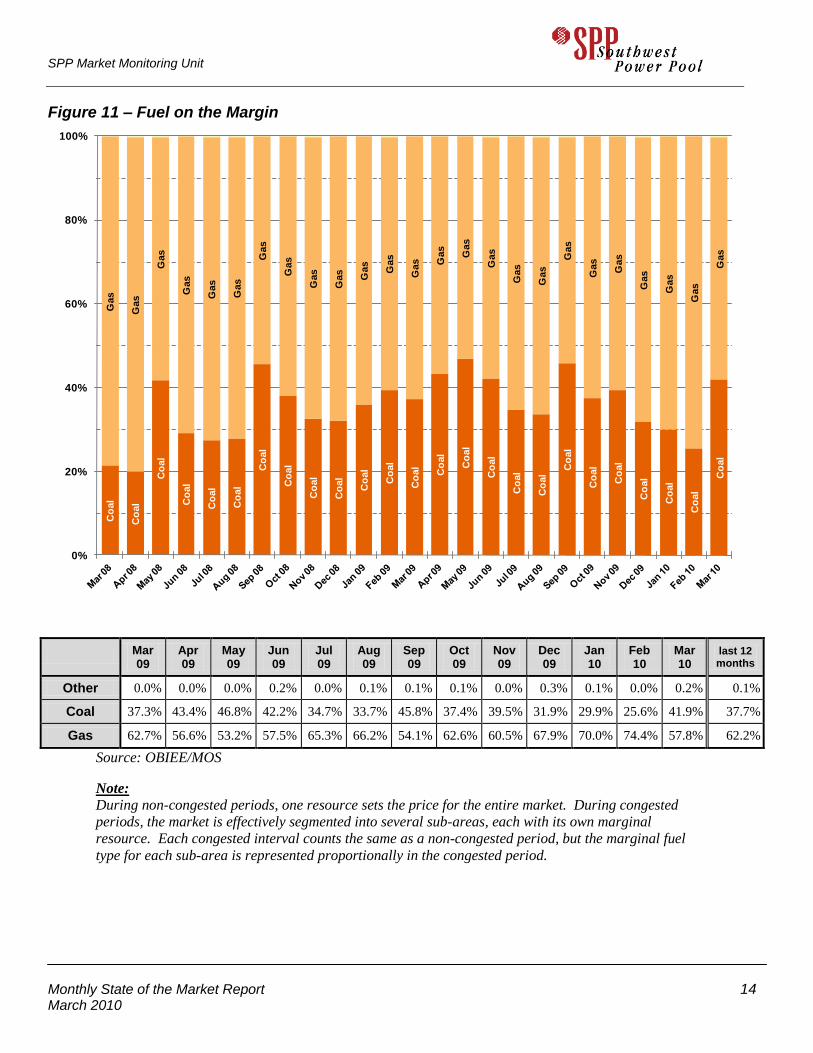
production tends to displace production from gas, accounting for a greater amount of coal on the margin
as seen in Figure 11.
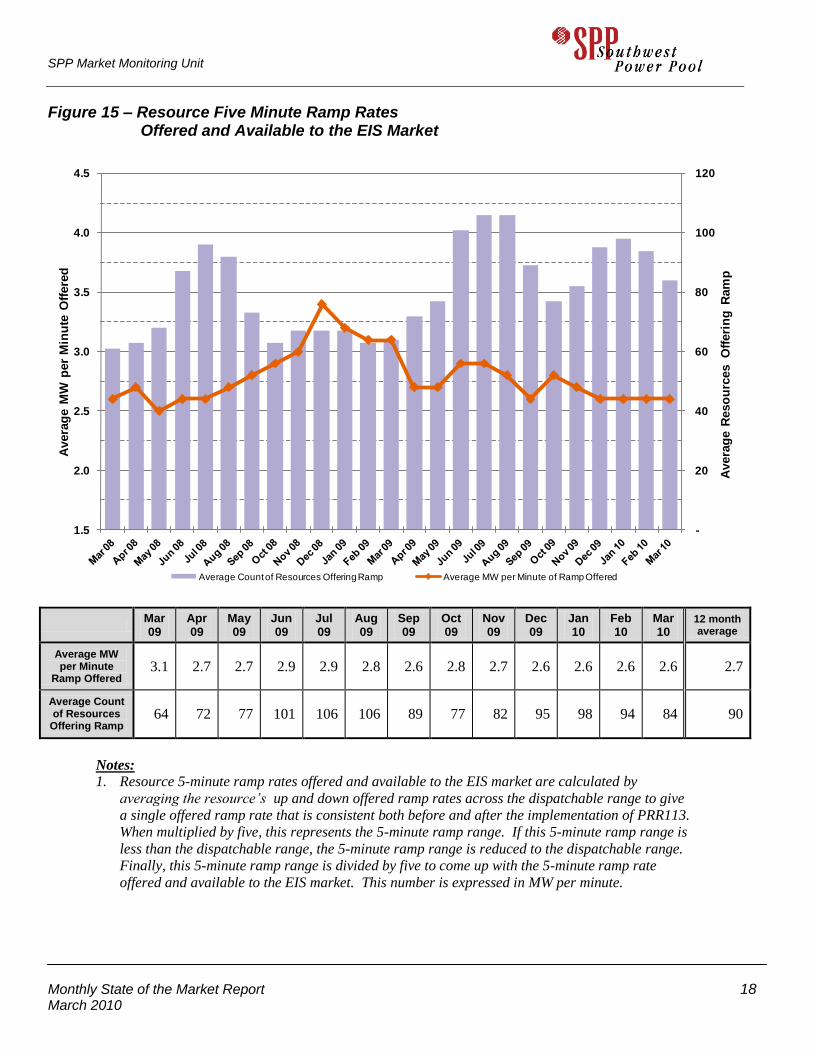
Participation in the EIS market is reflected in three metrics (resource status, available ramp and
dispatchable range), seen in Figures 14, 15, and 17. Figure 14 shows that the percentage of energy
produced under market dispatch is at 76%, just below the 12-month average of 77%. Resource ramp rate
is 2.6 MW per minute on Figure 15, just below the 12-month average of 2.7 MW per minute. The
dispatchable range is at 42.17% on Figure 17, just shy of the all-time low, which was set last month. The
low level of offered dispatchable range is the most troubling trend identified in the current set of market
metrics.

SPP Market Monitoring Unit
Monthly State of the Market Report 4 March 2010
Figures
Figure 1 – SPP EIS Price Contour Map
March 2010
500 kV
345 kV
230 kV
161 kV
138 kV
115 kV
69 kV
12 Month EIS Price Contour Map
500 kV
345 kV
230 kV
161 kV
138 kV
115 kV
69 kV

SPP Market Monitoring Unit
Monthly State of the Market Report 5 March 2010
Figure 2 – Congestion by Shadow Price Impact – March 2010
0%
20%
40%
60%
80%
$0
$20
$40
$60
$80
%T
ota
l In
terv
als
Co
ng
este
d
Avera
ge H
ou
rly S
had
ow
Pri
ce
($/M
Wh
)
Average Hourly Shadow Price ($/MWh) % Total Intervals Congested
Flowgate Name Flowgate Location
(kV) Control
Area
Average Hourly
Shadow Price
($/MWh)
Total % Intervals
(Breached or Binding)
Detailed Description
TEMP01_15940 Osage Switch - Canyon East
(115) ftlo Bushland - Deaf
Smith (230) SPS $ 76.45 39.6%
First flowgate to run into North – South flow in
Panhandle of Texas. EAST of 345 kV from SECI..
Max Gen. = 7000, Max Load = 5300 MW.
RANPALAMASWI Randall County - Palo Duro (115) ftlo Amarillo –
Swisher (230) SPS $ 75.95 30.2%
First flowgate to run into North – South flow in Panhandle of Texas. WEST of 345 kV from SECI..
Max Gen. = 7000, Max Load = 5300 MW.
TEMP25_16260 Lake Road – Alabama (161)
ftlo St. Joe - Hawthorn (345)
MPS-
KCPL $ 38.79 7.0%
External impacts mainly from MISO quickly load up
flowgates TEMP_25, LAKALAIATSTR,
SJHALKNAIASC, and COOPER_S causing multiple
violations of SPP flowgates. The SPP Market was unable to absorb the increase of external impacts
quickly enough. Relief came from MISO Market, SPP
Market, and non-firm curtailments. High positive LIPs around LAKALAIATSTR at the same time high
negative LIPs around COOPER_S.
LAKALAIATSTR Lake Road – Alabama (161)
ftlo Iatan to Stranger Creek (345)
MPS-
KCPL $ 30.05 7.0%
SJHALKNAIASC St. Joe – Hawthorn(345)
Lake Road Nashua(161) ftlo
Iatan – Stranger Creek (345)
MPS-
KCPL $ 16.48 7.5%
TEMP26_16045 Neosho – Columbus (161) ftlo Neosho – Delaware
(345) CSWS $ 13.70 7.3%
Decreases in generation in southwest Missouri cause loading in this line. Congestion was mostly confined to
a two day period at the end of March.
COOPER_S Cooper-St. Joe (345) ftlo Cooper – Fairport (345)
NPPD $ 12.32 3.6% See explanation for TEMP25_16260, LAKALAIATSTR and SJHALKNAIASC above.
TEMP24_16244 Circ - Reno (115) ftlo
Empec - Wich (345)
MIDW-
SECI $ 9.54 5.0%
High wind generation in West Kansas. About 1000 MW
wind coming from SECI along with generation outage. Unable to provide for counter flow.
SHAXFRTUCOKU Shamrock XFR (115/69)ftlo Tuco – Oklaunion (345)
CSWS-
SPS $ 7.69 2.5%
Higher loading due to transformer outage nearby. Low
voltages in the Shamrock area if Tuco – Oklaunion 345
kV is lost.
TEMP20_16147 Neosho – Columbus (161) ftlo Neosho – Oneta (345)
CSWS $ 5.29 3.0% See TEMP26_16045.
SPP Market Monitoring Unit
Monthly State of the Market Report 6 March 2010
Figure 3 – Congestion by Shadow Price Impact – Previous 12 months
0%
10%
20%
30%
40%
$0
$10
$20
$30
$40
%T
ota
l In
terv
als
Co
ng
este
d
Avera
ge H
ou
rly S
had
ow
Pri
ce ($/M
Wh
)
Average Hourly Shadow Price ($/MWh) % Total Intervals Congested
Flowgate Name
Flowgate Location (kV)
Control Area
Average Hourly
Shadow Price
($/MWh)
Total % Intervals
(Breached or Binding)
Proposed Solution [estimated completion date]
RANPALAMASWI Randall County - Palo Duro
(115) ftlo Amarillo – Swisher
(230) SPS $ 30.21 17.5%
The new Canyon West to Spring Draw 115 kV line (regional
reliability upgrade) will add some capacity to the Amarillo area
and may provide a level of mitigation to this constraint.
[12/16/2012]
LAKALAIATSTR Lake Road – Alabama (161)
ftlo Iatan to Stranger Creek
(345)
MPS-
KCPL $ 21.97 4.3%
The new Iatan 345/161 kV substation and the Iatan tap of the
Platte City to Stranger Creek 161 kV line (generation
interconnection upgrades) will add some capacity to the Iatan
area and may provide a level of mitigation to this constraint.
[4/1/2010].
GENTLMREDWIL Gentleman to Redwillow (345) NPPD $ 6.20 4.5%
The new Axtell-Wolf-Spearville 345 kV lines (Balanced
Portfolio upgrades) will add capacity to the Gentleman area and
may mitigate this constraint of the north-south flow from
Nebraska to Kansas. [6/1/2013].
HPPVALPITVAL Hugo -Valliant (138) ftlo
Pittsburg – Valiant (345)
WFEC-
CSWS $ 5.57 4.0%
The new 19 mile Hugo to Valliant 345 kV line with 138/345 kV
XF at Hugo PP (transmission service upgrades) will add some
capacity to the Hugo area and may provide a level of mitigation
to this constraint. [4/1/2012]
OKMHENOKMKEL Okmulgee - Henryetta (138)
ftlo Okmulgee to Kelco (138) CSWS $ 4.21 1.7%
The new Seminole to Muskogee 345kV line (Balanced Portfolio
upgrade) will add capacity to the Tulsa area and may provide a
level of mitigation to this constraint. [12/31/2013]
LONSARPITVAL Lone Oak to Sardis (138) ftlo
Pittsburg – Valiant 345 CSWS $ 3.78 1.0%
The conversion of the McAlister to Canadian River 69 kV line
to 138 kV (regional reliability upgrade) will add some capacity
in eastern Oklahoma and may provide a level of mitigation to
this constraint. [TBD]
MANIPMDOLSWS Mansfield – Int. Paper (138) ftlo Dolet Hills – Swisher (345)
CSWS $ 3.22 0.7% Congestion occurred on this flowgate during a two week period
in 2009. There is no planned upgrade expected to provide
significant mitigation.
ELPFARWICWDR El Paso – Farber (138) ftlo
Wichita – Woodring (345) WR $ 2.80 2.4%
The new Rose Hill – Sooner 345 kV line (regional reliability
upgrade) will add some capacity to the Wichita area and may
provide a level of mitigation to this constraint. [1/1/2013]
COOPER_S Cooper-St. Joe (345) ftlo
Cooper – Fairport (345) NPPD $ 2.31 0.8%
The proposed Nebraska City - Maryville - Sibley 345 kV line
(priority projects upgrade) would add some capacity in the
Cooper_S corridor and may provide a level of mitigation to this
constraint. [TBD]
SHAXFRTUCOKU Shamrock XFR (115/69)ftlo
Tuco – Oklaunion (345)
CSWS-
SPS $ 2.31 0.9%
The new Tuco Interchange – Stateline – Woodward 345 kV line
(Balanced Portfolio upgrade) will add some capacity to the
Texas High Plains area and may provide a level of mitigation to
this constraint. [5/19/2014]
SPP Market Monitoring Unit
Monthly State of the Market Report 7 March 2010
Figure 4 – Breached and Binding Flowgates by Interval
0%
5%
10%
15%
% D
isp
atc
h I
nte
rvals
Bre
ach
ed
% Intervals Breached
0%
20%
40%
60%
80%
100%
% D
isp
atc
h I
nte
rvals
Bin
din
g
% Intervals Binding
intervals Mar 09
Apr 09
May 09
Jun 09
Jul 09
Aug 09
Sep 09
Oct 09
Nov 09
Dec 09
Jan 10
Feb 10
Mar 10
last 12 months
% Breached
6.7% 2.9% 7.5% 8.8% 8.2% 5.9% 4.5% 3.6% 3.2% 6.6% 3.4% 2.6% 6.8% 5.3%
% Binding
92.9% 72.1% 86.9% 83.9% 87.3% 82.7% 53.5% 52.6% 54.7% 59.4% 41.5% 48.8% 74.4% 66.6%
Source: OBIEE/MOS

SPP Market Monitoring Unit
Monthly State of the Market Report 8 March 2010
Figure 5 – LIP / Gas Cost Comparison
$20
$30
$40
$50
$60
$70
$80
$2
$4
$6
$8
$10
$12
$14
Ele
ctr
icit
y P
rice (
LIP
)
Gas C
ost
Gas (Panhandle) Electricity (LIP)
Mar 09
Apr 09
May09
Jun 09
Jul 09
Aug 09
Sep 09
Oct 09
Nov 09
Dec 09
Jan 10
Feb 10
Mar 10
12 month
average
Electricity (LIP)
[$/MWh] 27.38 22.21 23.67 25.83 27.77 25.73 23.27 29.91 28.29 37.86 42.18 40.56 27.72 29.54
Gas Panhandle [$/MMBtu]
2.60 2.72 3.05 2.82 3.07 2.96 2.88 3.99 3.48 5.21 5.72 5.22 4.17 3.77
SPP Market Monitoring Unit
Monthly State of the Market Report 9 March 2010
Figure 6 – Hourly Price Ranges by Market Participant – March 2010
27.72
-$100
$0
$100
$200
$300
AECC AEPM BEPM EDEP GMOC GRDX GSEC INDN KBPU KCPS KPP LESM MEAN MIDW OGE OMPA OPPM SECI SPSM TEAN WFES WRGS
-$100
$0
$100
$200
$300
Pri
ces (
$/M
Wh
)
Market Participant
MP Max MP Min MP Average SPP Average =
in $ AECC AEPM BEPM EDEP GMOC GRDX GSEC INDN KBPU KCPS KPP LESM MEAN MIDW OGE OMPA OPPM SECI SPSM TEAN WFES WRGS
Max 296 297 283 295 291 296 232 293 292 292 292 287 284 281 299 301 288 271 231 286 302 292
Avg 31 30 16 32 28 31 34 33 32 32 28 14 15 22 30 30 14 20 30 15 30 29
Min -16 -23 -360 -16 -111 -16 -70 -19 -19 -19 -32 -431 -398 -238 -19 -19 -423 -198 -83 -395 -23 -19
SPP Market Monitoring Unit
Monthly State of the Market Report 10 March 2010
Figure 7 – Hourly Price Ranges by Market Participant – Previous 12 months
29.54
-$200
-$100
$0
$100
$200
$300
$400
$500
AECC AEPM BEPM EDEP GMOC GRDX GSEC INDN KBPU KCPS KEPC KPP LESM MEAN MIDW OGE OMPA OPPM SECI SPSM TEAN WFES WRGS
-$200
-$100
$0
$100
$200
$300
$400
$500
Pri
ces (
$/M
Wh
)
Market Participant
MP Max MP Min MP Average SPP Average =
in $ AECC AEPM BEPM EDEP GMOC GRDX GSEC INDN KBPU KCPS KEPC KPP LESM MEAN MIDW OGE OMPA OPPM SECI SPSM TEAN WFES WRGS
Max 483 483 283 532 485 483 1,169 293 485 485 258 484 485 485 485 482 482 485 493 1,199 485 482 484
Avg 30 31 30 31 31 30 34 37 29 29 25 29 24 24 28 30 30 24 28 33 24 30 29
Min -43 -42 -360 -52 -111 -43 -471 -30 -97 -100 -50 -178 -498 -425 -238 -85 -102 -475 -198 -494 -422 -127 -130

SPP Market Monitoring Unit
Monthly State of the Market Report 11 March 2010
Figure 8 – Regional Monthly Prices
$0
$20
$40
Mar 09 Apr 09 May 09 Jun 09 Jul 09 Aug 09 Sep 09 Oct 09 Nov 09 Dec 09 Jan 10 Feb 10 Mar 10
$/M
Wh
SPP MISO ERCOT
Region Average
Price Maximum
Price Minimum
Price Volatility
Average On-Peak
Price
Average Off-Peak
Price
SPP $ 27.72 $ 285.85 $ -65.54 60% $ 33.09 $ 23.40
MISO $ 28.53 $ 135.86 $ -42.76 48% $ 33.25 $ 23.90
ERCOT $ 29.83 $ 457.13 $ -13.36 124% $ 29.25 $ 30.40
Note: This table is a “rough comparison” because of inherent differences in the structure of the three markets and also because of the differences in how prices for SPP, MISO, and ERCOT are calculated. For SPP, load weighted averages are used, while the data from MISO and ERCOT are not load weighted. Volatility is measured by the Coefficient of Variation, which is the standard deviation across all hours divided by the average of all hours.
0%
50%
100%
150%
200%
250%
Mar 09 Apr 09 May 09 Jun 09 Jul 09 Aug 09 Sep 09 Oct 09 Nov 09 Dec 09 Jan 10 Feb 10 Mar 10
Regional Price Volatility
SPP Volatility
MISO Volatility
ERCOT Volatility
SPP Market Monitoring Unit
Monthly State of the Market Report 12 March 2010
Figure 9 – Energy Generation by Fuel Type
0
5,000
10,000
15,000
20,000
Mar 08
Apr 08
May 08
Jun 08
Jul 08
Aug 08
Sep 08
Oct 08
Nov 08
Dec 08
Jan 09
Feb 09
Mar 09
Apr 09
May 09
Jun 09
Jul 09
Aug 09
Sep 09
Oct 09
Nov 09
Dec 09
Jan 10
Feb 10
Mar 10
Gen
era
tio
n (
GW
h)
Other Hydro Wind Nuclear Gas Coal
in GWh Mar 09
Apr 09
May 09
Jun 09
Jul 09
Aug 09
Sep 09
Oct 09
Nov 09
Dec 09
Jan 10
Feb 10
Mar 10
Coal 7,649 9,627 10,476 11,672 12,841 12,446 11,444 11,070 11,294 12,952 12,198 11,317 11,277
Gas 3,941 3,051 3,426 5,379 5,943 5,860 4,007 2,895 2,646 3,943 4,459 3,630 2,858
Nuclear 868 1,714 1,771 1,763 1,811 1,629 1,641 614 519 1,556 1,814 1,664 1,599
Wind 809 835 646 619 535 663 532 834 840 849 747 502 1,069
Hydro 74 214 211 201 154 131 167 190 180 95 147 166 169
Other 5 8 6 11 10 12 15 13 13 12 13 17 21
Total 13,346 15,449 16,536 19,645 21,294 20,741 17,806 15,616 15,492 19,407 19,378 17,296 16,993
by % Mar 09
Apr 09
May 09
Jun 09
Jul 09
Aug 09
Sep 09
Oct 09
Nov 09
Dec 09
Jan 10
Feb 10
Mar 10
12 month
average
Coal 57% 62% 63% 59% 60% 60% 64% 71% 73% 67% 63% 65% 66% 64%
Gas 30% 20% 21% 27% 28% 28% 23% 19% 17% 20% 23% 21% 17% 22%
Nuclear 7% 11% 11% 9% 9% 8% 9% 4% 3% 8% 9% 10% 9% 8%
Wind 6% 5% 4% 3% 3% 3% 3% 5% 5% 4% 4% 3% 6% 4%
Hydro 1% 1% 1% 1% 1% 1% 1% 1% 1% 0% 1% 1% 1% 1%
Other 0% 0% 0% 0% 0% 0% 0% 0% 0% 0% 0% 0% 0% 0%
Source: OBIEE/MOS

SPP Market Monitoring Unit
Monthly State of the Market Report 13 March 2010
Figure 10 – Wind Generation & Capacity
0
500
1,000
1,500
0
500
1,000
1,500
2,000
2,500
3,000
3,500
Win
d G
en
era
tio
n (
GW
h)
Win
d C
ap
acit
y (M
W)
Wind Capacity (MW) Wind Generation (GWh)
Mar 09
Apr 09
May 09
Jun 09
Jul 09
Aug 09
Sep 09
Oct 09
Nov 09
Dec 09
Jan 10
Feb 10
Mar 10
Capacity (MW)
2,743 2,917 2,933 2,939 2,939 3,040 3,103 3,202 3,202 3,313 3,313 3,313 3,313
Generation (GWh)
809 835 646 619 535 663 532 834 840 849 747 502 1,069
Capacity Factor
40% 40% 30% 29% 24% 29% 24% 35% 36% 34% 30% 23% 43%
# of Resources
38 42 45 46 46 47 48 49 49 51 51 51 51
Source: OBIEE/MOS
SPP Market Monitoring Unit
Monthly State of the Market Report 14 March 2010
Figure 11 – Fuel on the Margin C
oal
Co
al
Co
al
Co
al
Co
al
Co
al
Co
al
Co
al
Co
al
Co
al
Co
al
Co
al
Co
al
Co
al
Co
al
Co
al
Co
al
Co
al
Co
al
Co
al
Co
al
Co
al
Co
al
Co
al
Co
al
Gas
Gas
Gas
Gas
Gas
Gas
Gas
Gas
Gas
Gas
Gas
Gas
Gas G
as
Gas
Gas
Gas
Gas
Gas
Gas
Gas
Gas
Gas
Gas
Gas
0%
20%
40%
60%
80%
100%
Mar 09
Apr 09
May 09
Jun 09
Jul 09
Aug 09
Sep 09
Oct 09
Nov 09
Dec 09
Jan 10
Feb 10
Mar 10
last 12 months
Other 0.0% 0.0% 0.0% 0.2% 0.0% 0.1% 0.1% 0.1% 0.0% 0.3% 0.1% 0.0% 0.2% 0.1%
Coal 37.3% 43.4% 46.8% 42.2% 34.7% 33.7% 45.8% 37.4% 39.5% 31.9% 29.9% 25.6% 41.9% 37.7%
Gas 62.7% 56.6% 53.2% 57.5% 65.3% 66.2% 54.1% 62.6% 60.5% 67.9% 70.0% 74.4% 57.8% 62.2%
Source: OBIEE/MOS
Note:
During non-congested periods, one resource sets the price for the entire market. During congested
periods, the market is effectively segmented into several sub-areas, each with its own marginal
resource. Each congested interval counts the same as a non-congested period, but the marginal fuel
type for each sub-area is represented proportionally in the congested period.

SPP Market Monitoring Unit
Monthly State of the Market Report 15 March 2010
Figure 12 – EIS Settlements - GWh
0%
5%
10%
15%
20%
0
10,000
20,000
30,000
40,000
EIS
Tra
nsacti
on
s a
s %
of
To
tal
GW
h
Scheduled Transactions (GWh) Load EI GWh Resource EI GWh % EIS Transactions
in GWh Mar 09
Apr 09
May 09
Jun 09
Jul 09
Aug 09
Sep 09
Oct 09
Nov 09
Dec 09
Jan 10
Feb 10
Mar 10
Resource EI 2,396 3,204 3,327 3,691 3,293 2,875 2,541 2,333 2,483 2,840 2,805 2,159 2,565
Load EI 588 888 1,245 1,491 1,056 630 526 476 546 642 623 532 551
Scheduled Transaction
23,548 25,892 27,646 33,451 37,608 37,726 31,407 28,392 27,970 35,158 35,469 31,864 30,644
Total Energy 26,533 29,983 32,217 38,633 41,956 41,232 34,474 31,201 31,000 38,641 38,896 34,555 33,760
by % Mar 09
Apr 09
May09
Jun 09
Jul 09
Aug 09
Sep 09
Oct 09
Nov09
Dec 09
Jan 10
Feb 10
Mar 10
Last 12 Months
Resource EI 9.0% 10.7% 10.3% 9.6% 7.8% 7.0% 7.4% 7.5% 8.0% 7.3% 7.2% 6.2% 7.6% 8.0%
Load EI 2.2% 3.0% 3.9% 3.9% 2.5% 1.5% 1.5% 1.5% 1.8% 1.7% 1.6% 1.5% 1.6% 2.2%
Scheduled Transactions
88.8% 86.4% 85.8% 86.6% 89.6% 91.5% 91.1% 91.0% 90.2% 91.0% 91.2% 92.2% 90.8% 89.8%
Totals may not equal 100% due to rounding.

SPP Market Monitoring Unit
Monthly State of the Market Report 16 March 2010
Figure 13 – EIS Settlements - $
$0
$100
$200
$300
Mil
lio
ns
Resource EI Load EI
in million $ Mar 09
Apr 09
May 09
Jun 09
Jul 09
Aug 09
Sep 09
Oct 09
Nov 09
Dec 09
Jan 10
Feb 10
Mar 10
12 Month Average
Resource EI 64 71 81 100 92 74 59 69 70 107 122 87 76 84
Load EI 17 20 32 41 31 17 13 15 16 26 28 23 17 23
Total EI 80 92 112 141 122 92 72 84 85 133 150 111 93 107

SPP Market Monitoring Unit
Monthly State of the Market Report 17 March 2010
Figure 14 – Depth of Energy Market for Resources Only – by Status
-
5,000
10,000
15,000
20,000
GW
h P
rod
ucti
on
Other Manual (other) Manual (intermittent) Nuclear Self-Dispatch Market Dispatch
in GWh Mar 09
Apr 09
May 09
Jun 09
Jul 09
Aug 09
Sep 09
Oct 09
Nov 09
Dec 09
Jan 10
Feb 10
Mar 10
Market Dispatch
10,554 11,230 12,233 15,300 16,721 15,789 13,393 12,576 12,733 15,490 15,139 13,699 13,020
Self-Dispatch 580 648 851 719 984 1,636 1,173 741 534 470 407 336 399
Nuclear 875 1,720 1,769 1,764 1,817 1,633 1,639 614 514 1,561 1,832 1,675 1,614
Manual (intermittent)
854 926 684 697 615 705 587 894 922 898 833 573 1,175
Manual (other) 544 1,013 1,060 1,235 1,245 1,030 1,077 863 811 1,052 1,369 1,119 974
Other (6) (18) (13) 2 (6) 0 (12) (11) (6) 4 (2) (7) (9)
TOTAL 13,400 15,518 16,584 19,717 21,375 20,794 17,857 15,677 15,549 19,475 19,578 17,395 17,174
by % of total
Mar 09
Apr 09
May 09
Jun 09
Jul 09
Aug 09
Sep 09
Oct 09
Nov 09
Dec 09
Jan 10
Feb 10
Mar 10
Last 12 Months
Market Dispatch 79% 72% 74% 78% 78% 76% 75% 80% 82% 80% 77% 79% 76% 77%
Self-Dispatch 4% 4% 5% 4% 5% 8% 7% 5% 3% 2% 2% 2% 2% 4%
Nuclear 7% 11% 11% 9% 9% 8% 9% 4% 3% 8% 9% 10% 9% 8%
Manual (intermittent) 6% 6% 4% 4% 3% 3% 3% 6% 6% 5% 4% 3% 7% 4%
Manual (other) 4% 7% 6% 6% 6% 5% 6% 6% 5% 5% 7% 6% 6% 6%
Other 0% 0% 0% 0% 0% 0% 0% 0% 0% 0% 0% 0% 0% 0%
Note: May not total to 100% due to rounding. Source: MOS
SPP Market Monitoring Unit
Monthly State of the Market Report 18 March 2010
Figure 15 – Resource Five Minute Ramp Rates
Offered and Available to the EIS Market
-
20
40
60
80
100
120
1.5
2.0
2.5
3.0
3.5
4.0
4.5
Avera
ge R
eso
urc
es O
fferi
ng
Ram
p
Avera
ge M
W p
er
Min
ute
Off
ere
d
Average Count of Resources Offering Ramp Average MW per Minute of Ramp Offered
Mar 09
Apr 09
May09
Jun 09
Jul 09
Aug09
Sep09
Oct 09
Nov 09
Dec 09
Jan 10
Feb 10
Mar 10
12 month average
Average MW per Minute
Ramp Offered 3.1 2.7 2.7 2.9 2.9 2.8 2.6 2.8 2.7 2.6 2.6 2.6 2.6 2.7
Average Count of Resources
Offering Ramp 64 72 77 101 106 106 89 77 82 95 98 94 84 90
Notes:
1. Resource 5-minute ramp rates offered and available to the EIS market are calculated by
averaging the resource’s up and down offered ramp rates across the dispatchable range to give
a single offered ramp rate that is consistent both before and after the implementation of PRR113.
When multiplied by five, this represents the 5-minute ramp range. If this 5-minute ramp range is
less than the dispatchable range, the 5-minute ramp range is reduced to the dispatchable range.
Finally, this 5-minute ramp range is divided by five to come up with the 5-minute ramp rate
offered and available to the EIS market. This number is expressed in MW per minute.

SPP Market Monitoring Unit
Monthly State of the Market Report 19 March 2010
Figure 16 – Monthly Summary of Market Ramp Rate Deficiency
-
40
80
120
160
200
240
280
320
360
-
20
40
60
80
MW
Ram
p A
vail
ab
le p
er
Min
ute
Ram
p D
efi
cie
ncy I
nte
rvals
UP Ramp Deficiency Intervals DOWN Ramp Deficiency Intervals Total MW Ramp Available per Minute
Mar 09
Apr 09
May 09
Jun 09
Jul 09
Aug 09
Sep 09
Oct 09
Nov 09
Dec 09
Jan 10
Feb 10
Mar 10
12 month average
UP Ramp Deficiency Intervals
28 16 9 10 3 7 12 37 43 35 25 22 11 19
DOWN Ramp Deficiency Intervals
4 22 80 32 0 5 4 0 5 0 0 0 3 13
Total Ramp Deficiency Intervals
32 38 89 42 3 12 16 37 48 35 25 22 14 32
% of Total Market
Dispatch Intervals
0.4% 0.5% 1.0% 0.5% 0.0% 0.1% 0.1% 0.4% 0.5% 0.4% 0.3% 0.3% 0.1% 0.4%
MW Ramp Available per
Minute 198 195 208 293 307 300 231 216 221 247 255 244 218 244

SPP Market Monitoring Unit
Monthly State of the Market Report 20 March 2010
Figure 17 – Dispatchable Range
42%
46%
50%
Mar 09
Apr 09
May 09
Jun 09
Jul 09
Aug 09
Sep 09
Oct 09
Nov 09
Dec 09
Jan 10
Feb 10
Mar 10
last 12 mo
Average 48.2% 44.9% 46.6% 46.8% 47.0% 46.4% 45.0% 42.8% 43.3% 43.5% 42.9% 42.3% 42.7% 44.5%
AdjMax = Resource Plan Max, adjusted for ancillary service.
AdjMin = Resource Plan Min, adjusted for ancillary service.
Dispatchable Range = (AdjMax – AdjMin) / AdjMax for a particular resource.
For example:
Resource A: AdjMax = 200, AdjMin = 100; (200 – 100) / 200 = 50% Range
Resource B: AdjMax = 200, AdjMin = 180; (200 – 180) / 200 = 10% Range

SPP Market Monitoring Unit
Monthly State of the Market Report 21 March 2010
Figure 18 – Transmission Owner Revenue
$0
$10
$20
$30
$40
$50
Mil
lio
ns
in millions $ JAN FEB MAR APR MAY JUN JUL AUG SEP OCT NOV DEC
2008 32.1 34.6 33.1 33.0 32.9 32.1 32.6 33.8 37.7 34.7 35.0 36.3
2009 35.7 34.2 33.4 43.8 41.0 43.1 43.4 43.7 42.7 41.3 40.0 43.5
2010 44.7 43.9 46.6
SPP Market Monitoring Unit
Monthly State of the Market Report 22 March 2010
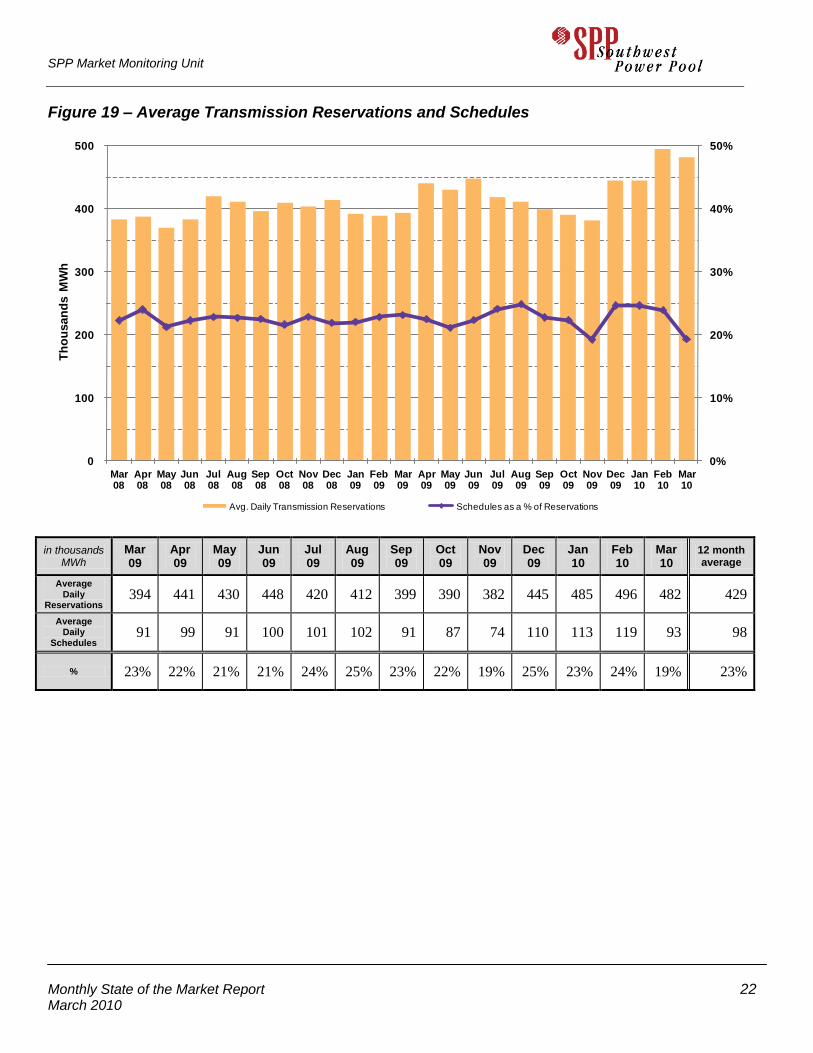
Figure 19 – Average Transmission Reservations and Schedules
0%
10%
20%
30%
40%
50%
0
100
200
300
400
500
Mar 08
Apr 08
May 08
Jun 08
Jul 08
Aug 08
Sep 08
Oct 08
Nov 08
Dec 08
Jan 09
Feb 09
Mar 09
Apr 09
May 09
Jun 09
Jul 09
Aug 09
Sep 09
Oct 09
Nov 09
Dec 09
Jan 10
Feb 10
Mar 10
Th
ou
san
ds M
Wh
Avg. Daily Transmission Reservations Schedules as a % of Reservations
in thousands MWh
Mar 09
Apr 09
May09
Jun 09
Jul 09
Aug09
Sep 09
Oct 09
Nov 09
Dec 09
Jan 10
Feb 10
Mar 10
12 month average
Average Daily
Reservations 394 441 430 448 420 412 399 390 382 445 485 496 482 429
Average Daily
Schedules 91 99 91 100 101 102 91 87 74 110 113 119 93 98
% 23% 22% 21% 21% 24% 25% 23% 22% 19% 25% 23% 24% 19% 23%

SPP Market Monitoring Unit
Monthly State of the Market Report 23 March 2010
Figure 20 – RNU Components
-$6
-$4
-$2
$0
$2
$4
Mil
lio
ns
SP LOSS UDC U/S O/S EIS Total RNU
$ (thousands) Mar 09
Apr 09
May 09
Jun 09
Jul 09
Aug 09
Sep 09
Oct 09
Nov 09
Dec 09
Jan 10
Feb 10
Mar 10
EIS 3,574 188 2,036 1,816 1,336 760 1,051 2,737 -245 -923 -1,166 1,347 589
O/S -139 -80 -147 -1,183 -164 -89 -71 -95 -99 -101 -45 -26 -96
U/S -645 -155 -886 -540 -259 -51 -41 -31 -177 -257 -91 -52 -78
UDC -79 -40 -61 -135 -134 -84 -64 -71 -56 -136 -138 -81 -35
SP Loss -33 0 -15 -21 -28 1 -7 -8 -2 -17 -5 -6 -3
Total RNU 2,678 -87 928 -63 752 538 869 2,531 -579 -1,434 -1,444 1,181 377
EIS (Energy Imbalance Charge/Credit) – All energy deviations between actual generation or load and schedules are settled as (EIS).
O/S (Over-Scheduling Charge) - During any hour, if Locational Imbalance Prices diverge and a Market Participant’s Load imbalance is more than 4% (but at least 2 MW) at an applicable Settlement Location in that hour, that MP may be subject to an Over-Scheduling Charge.
U/S (Under-Scheduling Charge) - During any hour, if Locational Imbalance Prices diverge and a Market Participant’s Load imbalance is more than 4% (but at least 2 MW) at an applicable Settlement Location in that hour, that MP may be subject to an Under-Scheduling Charge.
UDC (Uninstructed Resource Deviation) – the difference between the dispatch instructions and the actual performance of a Resource.
SP Loss - Self-Provided Losses