monthly review · the textile industry is no stranger to swings in its activity. in fact, cyclical...
TRANSCRIPT
MONTHLY REVIEW
IN THIS ISSUE:
• The R ecen t T extile
R ecession and Recovery
• 1968 Crop A creages Up?
• M ississippi: Industrialization
Brings Interdependence
• D istrict B u sin ess Conditions
F E D E R A L R E S E R V E B A N K O F A T L A N T A
M A Y 1 9 6 8Digitized for FRASER http://fraser.stlouisfed.org/ Federal Reserve Bank of St. Louis

T h e R e c e n t T e x t i l e
R e c e s s i o n a n d R e c o v e r y
T e x tile m an u factu rers are sp ortin g brighter costu m es th is spring, co lored b y im p roved p rod uction , sa le s , an d prices. A n d th e p ictu re look s even brighter, com pared w ith th a t o f la s t year, w h en th e in d u stry w as ju st p u llin g o u t o f a recession w h ich b egan in m id -1966. W h at h as cau sed th e im p rovem en t in te x t ile a c tiv ity ? A nd how h a v e recen t te x t ile d eve lop m en ts affected th e in d u stry in th e D istr ic t? A n ex a m in a tio n of th e la s t tex t ile recess ion sh ou ld revea l th e reason s for th e upturn.
T h e te x t ile in d u stry is n o stranger to sw in gs in its a c tiv ity . In fact, c y c lica l flu ctu a tion s in tex tile s are m ore p ersisten t and larger, re la tive to ch an ges in final d em an d for th e in d u stry ’s products, th an for oth er in d u str ies . In large part, th ese flu ctu a tion s are the resu lt o f th e ex trem ely p rice-com p etitive n atu re o f th e in d u stry an d th e k ey ro le p la y ed b y p u rchasers’ in ven tor ies in d eterm in in g produ cers’ sa le s an d prod uction . A m ore sta b le econ om y and co n so lid a tio n and vertica l in tegra tion w ith in th e in d u stry h a v e red u ced th e freq u en cy an d ex ten t o f th e te x t ile cy c le . Y et, th e c y c le rem ains.
R e c e s s io n
D u rin g 1966 th e in d u stry exp er ien ced reduced sa le s to it s four m ajor m arkets— ap parel, carpets, in d u str ia l, an d m ilitary . In F ebruary reta il sa les of ap p arel lev e led off, resu ltin g in a sharp in crease in ap p arel in ven tories. W h ile th e d ec lin e s in ap p arel sa le s w ere tem porary, th e effects on tex tile b u y in g m u ltip lied through th e d istr ib u tion chain , from reta iler to w h olesa ler to apparel m anufactu rer to te x t ile m anufacturer.
Monthly Review, Vol. LIII, No. 5. Free subscription and additional copies available upon request to the Research Department, Federal Reserve Bank of Atlanta, Atlanta, Georgia 30303.
D u rin g th e sum m er an d fa ll, h o u sin g starts con tracted sh arp ly an d red u ced th e d em an d for carpets. D u r in g O ctober 1966 th e rate o f h ou sin g starts p lu n ged to th e lo w est lev e l s in ce 1946. B etw een fiscal 1966 (J u ly 1965-J u n e 1966) an d fisca l 1967, m ilita ry p rocu rem en t o f w oven yard good s fe ll from $400 to $273 m illio n . T h is con traction occurred b eca u se o f th e recovery o f in ven tor ies from th eir earlier d ep le ted le v e ls and sp en d in g con stra in ts b rought o n b y th e F ed era l deficit. L ater, in d u str ia l p rod u ction lev e led o u t and th en d ec lin ed durin g th e first h a lf o f 1967. L ow er in d u str ia l o u tp u t cu rta iled th e in d u str ia l d em an d for fabrics. In 1966 an d 1967 w eak a u to m ob ile sa le s retarded p u rch ases o f te x t ile p rodu cts for car u p h o lstery an d tire cord.
R ea c tin g to fa llin g sa les , te x t ile m anufacturers b egan to cu t back p rod u ction in J u ly 1966 and em p lo y m en t th e fo llo w in g S ep tem b er. T h e d e c lin e in em p lo y m en t w as m od erate, how ever, b ecau se m an u facturers feared th a t la id -o ff w orkers w ou ld n o t be a v a ila b le for reh ir in g o n ce th e recess io n ended . P ro d u ctio n cu tb ack s d id n o t prev en t th e d ecrease in te x t ile p rod u ct p r ices b eg in n in g in A u gu st. D e c lin in g p r ices a lw a y s threaten th e te x t ile in d u stry , b eca u se m a n y p urchasers red u ce th e ir b u y in g w h en p r ices w eak en in h op es o f further p rice cuts.
P rofits, a s u su a l, fe lt th e largest im p a ct from th e fa llin g le v e l o f b u sin ess. C orporate profits after ta x es for te x t ile firm s w ere c u t in h a lf from fourth quarter 1965 to first quarter 1967. T h e reduced profits resu lted n o t o n ly from d ec lin in g d em an d b u t a lso in creased costs. D u r in g th is p eriod average h o u r ly te x t ile e a m in g s w en t up 5 percent.
T e x t ile p la n t ow ners q u ick ly a ltered th e ir in v estm en t p lan s, a s th e in d u stry ’s m arkets w eak ened . P la n t an d eq u ip m en t sp en d in g for tex tile s shrank b y 36 p ercen t b etw een seco n d quarter1966 an d first quarter 1968.
58 M O N T H LY R E V IE WDigitized for FRASER http://fraser.stlouisfed.org/ Federal Reserve Bank of St. Louis

The R ecent D ec line and Recovery in T ex tile A c tiv ity
National SeriesPeak
MonthTroughMonth
PercentDecline
Peak-Trough
PercentAdvance
fromTrough
Corporate Profits After Taxes* 12-65 3-67 47.8 62.9
Average Workweek 3-66 3-67 5.2 2.7Production 6-66 6-67 5.4 8.9Capital Spending* 6-66 ** ** **
Wholesale Prices 7-66 7-67 3.6 5.0Employment 8-66 7-67 1.8 3.5Inventories 8-66 12-66 0.5 8.2Shipments 8-66 2-67 9.3 13.2Bank Loans*** 1-67 9-67 8.2 5.9Cotton Consumption 10-66 7-67 12.0 4.9
District SeriesEmployment 1-67 7-67 1.0 1.9Bank Loans*** 9-66 2-67 10.1 9.9Cotton Consumption 1-66 11-67 12.9 12.2
♦Quarterly series with turning points denoted by last month of the quarter.
**Series has not yet turned upward.***Also includes loans to apparel and leather manufacturers.
T h e effect o f decreasin g tex t ile a c tiv ity on bank len d in g occurred w ith a lag b ecau se tex tile lo a n s gen era lly are m ad e to finance accou n ts receivab le and inven tories, both o f w h ich u su a lly con tract a fter d ec lin es in sa les an d production . N a tio n a lly , th e drop w as 8 p ercen t for bank loans to tex tile , apparel, and lea th er firm s b etw een J a n uary and Sep tem b er 1967. A ccord ing to F ed eral T rad e C om m ission — S ecu rities and E xch an ge C om m ission data , tex tile loan s m ad e b y banks in creased $190 m illio n from year-ago Septem ber, w h ile apparel loan s fe ll $150 m illion . A p p aren tly , th e d ecrease in tex t ile loan d em and, resu ltin g from sm aller accou n ts receivab le, w as offset b y th e loan d em and generated b y h igh er in ven tory leve ls.
R eco v ery an d O u tlook
T h e in crease in tex tile sh ip m en ts in M arch 1967 w as o n e o f th e in d u stry ’s first s ign s o f recovery. M an u factu rers len g th en ed th e w orkw eek th e fo llo w in g m onth , b u t n o t u n til J u ly d id prod u ction turn around. H ow ever, th e recovery p roceed ed rap id ly , an d b y O ctober ou tp u t reach ed a new h igh . A t year-en d w h o lesa le p rices o f tex tile p rod u cts w ere p articu larly b u o y a n t b ecau se of h igh er dem and , in creasin g labor costs, an d th e sm all co tto n crop. B y ea r ly 1968 m o st m easu res o f te x t ile a c t iv ity surp assed th e h igh m arks of th e prev iou s exp an sion .
T h e o u tlook for th e te x t ile in d u stry is favor
ab le, d e sp ite ser iou s prob lem s su ch a s th e h igh vo lu m e o f im ports, rap id ly in creasin g labor costs, an d a sh ortage o f lon g sta p le cotton . A fter a d isap p o in tin g fourth quarter, reta il ap parel sa les reboun ded sh arp ly in ea r ly 1968. M oreover, th e ou tlook for co n tin u ed grow th in app arel sa le s is favorable b ecau se o f r is in g p ersonal in com e an d th e m arked in crease in th e p op u la tion o f th e “c lo th es con sc iou s” age groups. H o u sin g starts durin g first quarter 1968 w ere a t a 1.5 m illio n ann u al rate, u p from o n ly 900 ,000 in fourth quarter 1966. T h e grow ing vo lu m e o f h ou sin g a c tiv ity and th e con tin u in g exp an sion o f carp ets in to oth er flooring m arkets w ill su p port exp an d ed carp e t production . M a n y h om e furn ish in gs w ith tex t i le m ateria ls w ill share in h igh er sa le s brought b y im proved h ou sin g a c tiv ity .
A u tom ob ile sa le s in ea r ly 1968 rose con sid era b ly ab ove th e com parab le 1967 period , an d higher sa les for th e y ea r are p red icted b y in du stry officials, d e sp ite a fa ll in sa les during A pril. E xp an d in g in d u str ia l a c tiv ity w ill require a h igh er vo lu m e o f tex tile products. T h e m ilita ry step p ed u p procurem ent o f w oven y a m goods during th e la s t h a lf o f th is fisca l year. T h u s, a ll four o f th e m ajor tex tile m arkets h ave in creased their purchases.
If th e D ep a rtm en t o f C om m erce p rojection s for 1968 tex tile sh ip m en ts are accurate, tex tile m anufactu rers w ill exp erience an 11-p ercent in crease from th e dep ressed 1967 leve ls.
D istr ic t D e v e lo p m e n ts
M o st o f th e D is tr ic t te x t ile a c tiv ity is con cen tra ted in G eorgia, w ith 50 percen t o f th e reg ion ’s tex tile jobs; A labam a, w ith 20 percent; and T en -
The District’s textile industries shared in national declines.
M AY 1968 59Digitized for FRASER http://fraser.stlouisfed.org/ Federal Reserve Bank of St. Louis
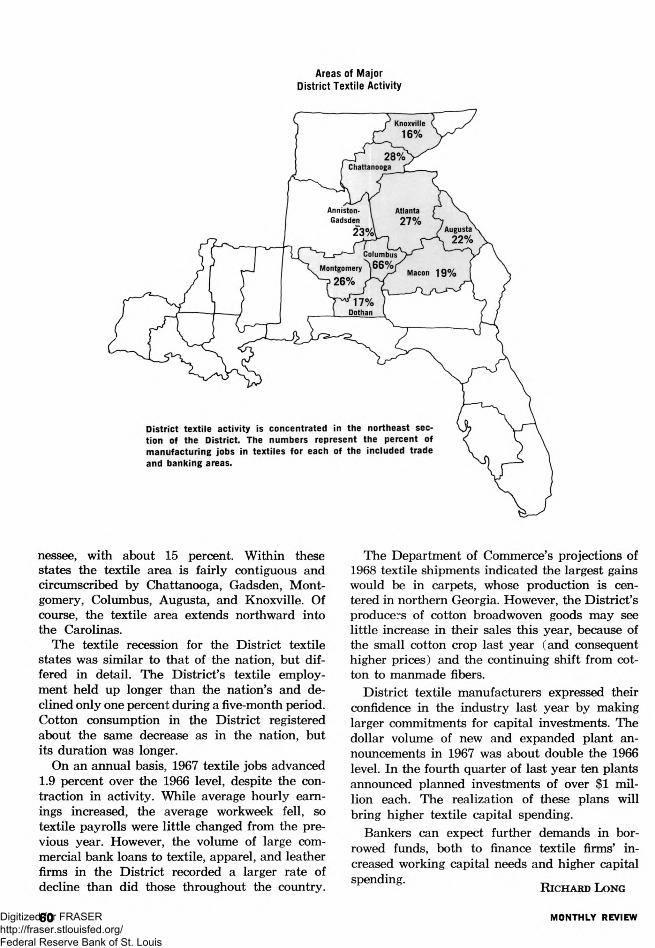
Areas of Major District Textile Activity
n essee , w ith ab ou t 15 percent. W ith in th ese s ta tes th e tex tile area is fa ir ly con tigu ou s and circum scribed b y C h attanooga, G ad sden , M o n tgom ery, C olum bus, A u gu sta , an d K n oxv ille . Of course, th e te x t ile area ex ten d s northw ard in to th e C arolinas.
T h e te x t ile recession for th e D is tr ic t tex t ile sta tes w as s im ilar to th a t o f th e n ation , b u t d iffered in d eta il. T h e D is tr ic t’s te x t ile em p lo y m en t h e ld up longer than th e n a tio n ’s and d e c lin ed o n ly o n e p ercen t during a five-m onth period . C otton con su m p tion in th e D is tr ic t reg istered ab ou t th e sam e d ecrease a s in th e n ation , b u t it s du ration w as longer.
On an an n u a l basis, 1967 te x t ile job s ad van ced 1.9 p ercen t over th e 1966 leve l, d e sp ite th e con traction in a c tiv ity . W h ile average h ou rly earn in gs in creased , th e average w orkw eek fe ll, so te x t ile p ayro lls w ere lit t le ch an ged from th e prev io u s year. H ow ever, th e vo lu m e o f large com m ercia l bank loan s to tex tile , apparel, an d leath er firm s in th e D is tr ic t recorded a larger rate of d ec lin e than d id th ose th roughou t th e country .
T h e D ep a rtm en t o f C om m erce’s p ro jection s o f1968 te x t ile sh ip m en ts in d ica ted th e largest ga in s w ou ld be in carp ets, w h ose p rod u ction is cen tered in northern G eorgia. H ow ever, th e D is tr ic t’s producers o f co tton broad w oven good s m a y see l it t le in crease in th eir sa le s th is year , b eca u se of th e sm a ll co tton crop la s t year (a n d con seq u en t high er p r ices) and th e co n tin u in g sh ift from co tton to m an m ad e fibers.
D is tr ic t te x t ile m an u factu rers exp ressed their con fid en ce in th e in d u stry la s t yea r b y m aking larger com m itm en ts for ca p ita l in vestm en ts. T h e d ollar vo lu m e o f n ew an d ex p an d ed p la n t an n ou n cem en ts in 1967 w as ab ou t d ou b le th e 1966 level. In th e fourth quarter o f la s t year ten p lan ts an n ou n ced p lan n ed in v estm en ts o f over $1 m illion each . T h e rea liza tio n o f th e se p lan s w ill bring h igh er te x t ile cap ita l sp en d in g .
B an k ers can ex p ect further d em an d s in borrow ed funds, both to finance te x t ile firm s’ in creased w ork in g cap ita l n eed s an d h igh er cap ita l sp en d ing .
R ic h a r d L o n g
60 M O N T H L Y R E V IE WDigitized for FRASER http://fraser.stlouisfed.org/ Federal Reserve Bank of St. Louis

1 9 6 8 C r o p A c r e a g e s U p ?
A creages o f m ajor crops in th e D is tr ic t w ill e x ceed la s t y ea r ’s p lan tin gs b y 1 percen t if farm ers carry ou t their in ten tio n s sta ted in a recen t U . S. D ep a rtm en t o f A gricu ltu re report. A n exp ected 18- to 20-p ercen t in crease in co tton and rice acreages, p lu s sm aller ga ins for soyb ean s and p ea n u ts , sh ou ld m ore th an counter oth er crop losses. S in ce th ese e stim a tes w ere m ad e ear ly in th e grow ing season , actu a l p lan tin gs m ay b e a ltered b y la ter d ec is io n s con cern in g G overn m en t program s, w eather effects, labor prospects, and other econ om ic factors. A t th e n a tion a l lev e l acreages of17 m ajor crops are ex p ected to be 2 percent, or about 6 m illio n acres, le ss than in 1967. Sharp red u ction s in feed grain p la n tin g s w ill o ffset m ore m od est ga ins in cotton , soyb ean s, som e sm all grains, and other crops.
Cotton P erh ap s th e m ost sign ifican t ch an ge in th e sou thern farm scen e is th e ex p ected 18-percent, or 447,000-acre, gain in co tton p lan tin gs. T h is rep resen ts a reversal in th e dow ntrend o f co tton a creages th at b egan in 1962 and cu lm in a ted in v ery large cutbacks in 1966 an d 1967. In th e la s t tw o years a large num ber o f farm ers p artic ip ated in th e acreage d iversion p rov ision s o f th e 1965 F ood an d A gricu ltura l A ct. T h e y w ere required to d ivert a m in im u m of 12.5 p ercen t o f th eir a llo tm en t and cou ld d ivert up to 35 percent. T h is diversion , com b in ed w ith poor grow ing season s, cau sed co tton production to drop w ell b elow to ta l con su m p tion , resu ltin g in a “run-off” o f co tton surp luses. T h is year, w ith carryover stock s n ear or below desired lev e ls , th e G overnm ent co tton
program h as been m odified to encou rage h igh er production .
F or th e 1968 grow ing season , farm ers m u st d ivert o n ly 5 percen t o f th eir b asic a llo tm en t b u t m a y take a fu ll 35 p ercen t ou t o f production . B u t p a y m en t for vo lu n tary d iversion w ill b e o n ly 6 cen ts per pou nd tim es th e norm al y ie ld o f th e diverted acreages, com pared w ith 10.78 cen ts per poun d in 1967. M a n y farm ers w ill n ow find it m ore profitab le to exp an d p la n tin g s an d k eep d iverted acreages n ear m in im u m leve ls. F urther in d u cem en ts to farm ers are h igh er m ark et prices, ranging ab ove p rice su p port loan p a y m en ts in recen t m onths, and a m od ifica tion o f ru les p erta in in g to th e m easu rem en t o f acreage a llo tm en ts p lan ted in variou s sk ip-row patterns.
W ith in th e D istr ic t , th e degree to w h ich farm ers are respond ing to th e lib era lized co tton p la n tin g regu la tion s varies. F arm ers in M iss is s ip p i w ill p la n t 1.2 m illio n acres, up 26 percen t from a year earlier. G ains in L ou isian a and T en n essee m ay reach 22 an d 18 percent, resp ective ly . C otton p lan tin gs w ill advan ce m uch le ss rap id ly in A la bam a and G eorgia. M a n y producers in th ese sta tes are le ss resp on sive to th e program m odifica tion s b ecau se th ey exp erienced near d isastrous crop fa ilu res from ad verse w eather an d in sec t in festa tio n s la s t year. In ad d ition , th e low er qu ality of co tton produced in som e areas is su b ject to h ea v y p rice d iscou n ts, so it m ay be m ore profitab le to m a in ta in h igh er d iversion rates.
Soybeans P roducers o f soyb ean s in D is tr ic t sta tes plan to p lan t ap p rox im ately 3 p ercen t m ore beans
MAY 1968 61Digitized for FRASER http://fraser.stlouisfed.org/ Federal Reserve Bank of St. Louis

in 1968 th an in 1967. T h is rate o f in crease is equal to th e U . S . ad van ce an d w ou ld m ark th e seven th co n secu tiv e an n u a l ga in in th e S ou th east. B y1967, so y b ea n s o ccu p ied m ore acreage on D is tr ic t farm s th an a n y oth er crop, an d th e tren d is e x p ected to con tin u e.
T h e p rojected 3 -p ercen t g a in in soyb ean p la n tin g represen ts th e sm a lle s t rate o f in crease s in ce th e sou th ern “so y b ea n ru sh ” began in 1963. T h is d ec lin e in th e ex p ected grow th rate w as cau sed in part b y greater co m p etitio n for tilla b le farm land from co tton an d rice, p rice d ec lin e s in 1967, a p o ten tia l o n e b illio n b u sh el crop in 1968, an d th e p rosp ect for co n tin u ed dow nw ard p rice pressures, cau sed b y large carryover stocks.
M iss is s ip p i farm ers, w ho p la n t over one-th ird o f th e D is tr ic t’s b ean acreages, in d ica te th ey w ill redu ce p la n tin g s b y 4 p ercen t. S im ila r ly , G eorgia producers are ex p ected to cu t acreages b y th e sam e am oun t, w h ile F lorid a farm ers w ill expand acreages b y one-fourth . S o y b ea n acreages w ill a d v an ce ap p rox im ate ly 15 p ercen t in A labam a, and7 percen t in b oth L ou isian a and T en n essee .
S in ce th ese d ata are b ased on farm ers’ M arch 1 p lan tin g in ten tion s , th e p o ss ib ility o f ch an ge is great. A d verse w eather an d in sec t d am age cou ld a lter acreages o f o th er crops. H ow ever, th ese acreages m a y be rep lan ted to soyb ean s, s in ce th is crop can be p lan ted la ter in th e year.
R ice R ic e acreages in L ou isian a and M iss is s ip p i are ex p ected to ad van ce 124,000 acres, or 20 percen t. T h is gain reflects en tire ly a 20-p ercen t in crease in r ice acreage a llo tm en ts, a 5 -cen t per cw t. rise in th e p rice su pp ort loan rate, and m ark et p rices w ell above su pport levels.
T h ese very b u llish co n d itio n s in th e d o m estic rice m arket are cau sed b y m o d est ad van ces in U . S . con su m p tion an d very strong exp ort de-
Soybeans, the District’s leading agricultural crop, continues its uptrend, while cotton reverses a downtrend.
Millions of Acres
1960 1962 1964 1966 1968
An increase of over 250,000 acres of major District crop? is led by soybeans, cotton, and rice.
M illions o f A cres
m ands. In 1966, th e d o m estic m ark et a ccou n ted for o n ly on e-th ird of th e to ta l U .S . r ice d isa p pearance. T h e b a lan ce w as exported , w ith com m ercia l sa le s for d o llars eq u a lin g n ea r ly 60 percen t o f a ll r ice exp orts in th e 12-m onth p eriod en d in g J u ly 31, 1967. F o o d a id sh ip m en ts , p rim arily to S o u th V ie tn a m an d In d ia , rep resen t th e b a lan ce o f th e sh ip m en ts abroad.
P e an u ts A creages o f p ea n u ts in th e D is tr ic t w ill rem ain v ir tu a lly u n ch an ged in 1968. M ark et con d it io n s reflect a large carryover o f p ea n u t su p p lie s , cau sin g th e average p rice to rem ain near th e su p p ort lev e l o f $227 p er ton th rou gh ou t 1967. For 1968, th e p rosp ects for p r ice in creases are sligh t, an d th e b a sic acreage a llo tm en ts w ill rem ain u n ch an ged . G eorgia farm ers w ill grow n early on e-h a lf m illio n acres o f p ean u ts, m a in ta in in g th eir n um ber o n e p o s itio n as producer of th is crop in th e D is tr ic t . A lab am a ranks second , w ith 185 ,000 acres o f goobers.
Corn L ik e th eir U . S . cou n terp arts, D is tr ic t farm ers w ill p rob ab ly cu rta il acreages b y 8 percen t. In creased p artic ip a tion in th e feed grains program in th e S ou th and U .S . acco u n ts for m ost o f th e redu ction .
In 1967 th e n a tio n ’s farm ers p rod u ced a record 4 .7 b illio n b u sh els o f corn. T h is large crop cau sed p rices to d ec lin e la s t fa ll an d w inter. In ad d ition , carryover su p p lie s o f corn an d other feed grains ad van ced sh arp ly . T h u s, th e feed grain program w as m od ified to a llo w p artic ip an ts to d ivert 25 acres or u p to o n e-h a lf th eir corn acreage a llo tm en t, w h ich ever is larger. A lso , farm ers w ill rece iv e d ivers ion p a y m en ts o f ab out 60 cen ts p er b u sh e l tim es th e farm s’ p rojected y ie ld on a ll d iverted acres above th e m an d atory 20 p ercen t o f th eir a llo tm en t.
In th e S o u th th e in cen tiv e to red u ce corn acreages is re in forced b y m ore favorab le lan d u se a ltern a tiv e s offered b y co m p etitiv e crops.
62 M O N T H LY R E V IE WDigitized for FRASER http://fraser.stlouisfed.org/ Federal Reserve Bank of St. Louis

G reater acreages o f co tton , soyb ean s, and r ice w ill in te n s ify th e co m p etitio n for corn lan d in m an y areas.
D is tr ic t p la n tin g s o f o ther feed grains, su ch as oats, are ex p ected to fa ll b y 6 percen t, w h ile sorghum prod u ction m a y in crease s lig h tly . M o st o f th e ad van ce w ill occur in L ou isian a .
Tobacco D is tr ic t tobacco produ cers a n tic ip a te cu tt in g acreages b y over on e-ten th , an d v ir tu a lly a ll o f th e ad ju stm en t w ill be in th e G eorgia-F lor- id a flue-cured p rodu cing regions. A s in th e cotton , rice, an d feed grain areas, th e red u ction can be exp la in ed b y a d ju stm en ts in G overnm ent program s.
C u rren tly , producers o f flue-cured tob acco are op eratin g under an acreage-p ou n d age program p assed in 1965. T h is law sta tes th a t each grow er is a ss ig n ed a b asic acreage a llo tm en t an d a quota, in p ou n d s, o f tob acco h e can se ll each year. I f an in d iv id u a l ex p ec ts good y ie ld s per acre, h e m ay v o lu n ta r ily p la n t few er acres th an h is a llo tm en t an d s t ill grow en ough tobacco to fill h is sa les quota.
In 1966 th e grow ing season w as poor, so m an y producers d id n o t fill th eir quota. S in ce th ey cou ld carry th e u n u sed portion o f th e quota in to th e n ex t grow ing season , th ey exp an d ed acreages la s t year. W ith a good grow ing season in 1967, m a n y prod ucers n o t o n ly u sed a ll th eir qu otas b u t took ad van tage o f an overm ark etin g p rov ision
of th e law . In 1968 flue-cured tobacco grow ers are exp ected to cu t acreages to m ore n ea r ly m atch produ ction to their quotas.
In fire-cured b urley , and dark air-cured prod u cin g reg ion s o f T en n essee , to ta l acreages w ill equal la s t y ea r ’s leve l, reflecting m inor ad ju stm en ts in a llo tm en ts an d p ess im ism tow ard 1968price prosp ects. „ „
R o b e r t E . Sw e e n e y
B a n k A n n o u n c e m e n t s
The Claxton Bank, Claxton, Georgia, a nonmember bank, began to rem it at par on April 1 fo r checks drawn on it when received from the Federal Reserve Bank.
On the same date the Plaquemine Bank and Trust Company, Plaquemine, Louisiana, opened as a nonmember bank and began to rem it at par. Vernon E. LaCour is president; other officers are to be named. Capital is $250,000; surplus and other capital funds, $250,000.
1967 Operating Ratios of Sixth District Member Banksis a summary report of various ratios computed for1967 from the Reports of Condition and Income and Dividends Reports. Member bank groupings are by deposit size fo r the D istric t and by state. Now available upon request to the Research Department, Federal Reserve Bank of Atlanta, Atlanta, Georgia 30303.
M AY 1968 63Digitized for FRASER http://fraser.stlouisfed.org/ Federal Reserve Bank of St. Louis

M i s s i s s i p p i :
I n d u s t r i a l i z a t i o n
B r i n g s
I n t e r d e p e n d e n c e
F actor ies sta n d in g w here co tton o n ce grew sy m b o lize M is s is s ip p i’s efforts to co m p lem en t her agricu ltu re w ith in d u stry . A s w orkers h a v e b een p u sh ed off th e farm b y ad van ced agricu ltu ra l tech n o lo g y , th e y h a v e n eed ed n ew jobs, a s h ave oth er M iss is s ip p ia n s en ter in g th e labor m arket for th e first tim e. P rov id in g th ese job s h a s been th e focu s and co n tin u in g ch a llen g e o f th e sta te ’s “B a la n ce A gricu ltu re w ith In d u stry ” program (B A W I ) , con ce ived in 1937.
C reating en ou gh n ew n on farm jobs h a s b een difficult for M iss is s ip p i, b eca u se o f h er large num ber o f d isp la ced farm w orkers. S in c e 1960,34 ,000 a d d itio n a l w orkers h a v e le f t th e farm . A lth ou gh som e o f th em h a v e m igra ted to o ther sta tes , m a n y h ave b een absorbed in to nonfarm jobs, w h ich h a v e grow n b y 126 ,000 in th e sam e period.
M an u factu r in g p rov id ed 4 7 ,0 0 0 o f th e se jobs, w h ile th e rem ain d er w as con trib u ted b y th e trade, con stru ction , serv ices, fin an ce an d governm en t sectors. A s a resu lt, m ore th an 90 percen t o f M is s is s ip p i’s w orkforce is n ow em p lo y ed in nonfarm jobs, com p ared w ith 82 p ercen t in 1960. O ne o u t o f every four current nonfarm job s h as b een created sin ce then .
I n te r d e p e n d e n c e W ith Industry
A s M is s is s ip p i h a s b ecom e in d u str ia lized , it s econ om y h a s tied it s e lf to d ev e lo p m en ts ou ts id e th e sta te . T h is is p a rticu la r ly true for m a n y o f th e sta te ’s m an u factu r in g firm s w ho se ll th eir prod u cts in reg ion a l an d n a tio n a l m arkets an d are a ffected d irec tly b y ch a n g es in th e in co m es and fin an cia l resou rces o f buyers.
T h e grow ing apparel, furn iture, an d p rocessed food s in d u str ies are very s e n s it iv e to ch an ges in n a tio n a l and reg ion a l con su m er d em and . U p s an d d ow ns in th e lum ber in d u stry ten d to fo llow d ev elo p m en ts in con stru ction , w h ich is in turn in flu en ced b y th e a v a ila b ility o f m ortgage fu n d s and b y th e in v estm en t d ec is io n s o f n a tio n a l firm s. E m p lo y m en t a t M is s is s ip p i’s co a sta l sh ip b u ild in g com plex , a s w ell a s in h er e lec tr ica l eq u ip m en t factories, p a rtly reflects th e lev e l o f n a tio n a l d efen se sp en d in g . T h e se s ix n a tio n a lly o rien ted in d u str ies togeth er e m p lo y tw o-th ird s o f th e sta te ’s m an u factu rin g w orkers.
O ther nonfarm b u sin esses serv in g lo ca l m arkets are b y no m ean s in su la ted from ou t-o f-sta te eco n o m ic co n d itio n s, a lth ou gh th e lin k s are n o t a s d irect as in m an u factu rin g . L oca l m erch an ts, su p p liers, and contractors are a ffected in d irec tly , a s w orkers in n a tio n a lly or ien ted in d u str ie s sp en d
64 M O N T H LY R E V IE WDigitized for FRASER http://fraser.stlouisfed.org/ Federal Reserve Bank of St. Louis

The continued growth of nonfarm jobs since 1960 has more than made up for the shrinkage of farm jobs. As a result, over 90 percent of Mississippi’s workers are now employed off the farm.
Employment (Thousands, Annual Averages)FARM NONFARM
100 0 200 400 60pt--------1--------1--------r
their p aych eck s. W h en n a tion a l econ om ic w in d s blow , m o st M iss is s ip p ia n s fee l th e breeze.
P a u s e an d G row th in 1 9 6 7
T h e s ta te ’s em p lo y m en t pattern in 1967 il lu s tra tes th is in terd ep en d en ce. F or th e year, m an u factu rin g em p lo y m en t in creased b y le s s th an on e p ercen t— th e sm a lle s t exp a n sio n in s ix years. S ea so n a lly ad ju sted figures revea l th a t an 8-per- cen t an n u al rate o f d ec lin e during th e first h a lf o f th e y ea r w as fo llow ed b y a 10-percent increase in th e secon d half. T h is is a n ex p ected p attern s in c e n a tion a l in co m e and prod u ction w ere s im ila r ly w eak in th e first h a lf an d strong in th e secon d . T h e sam e general p attern occurred in m ost o f M is s is s ip p i’s m an u factu rin g in d u str ies .
T h e in creased in terd ep en d en ce a lso sh ow ed up in th e con stru ction in d u stry , w here job s rose a t a 3 -p ercen t ra te in 1967. H ere a p ronounced 25- p ercen t an n u al rate o f d ec lin e in th e first h a lf p reced ed an ev en bolder 35-p ercen t in crease in th e secon d . A cu tback in th e F ed era l h ig h w a y program con trib u ted to th e first-half slow dow n, w h ile th e ea r ly sta g es o f P a sca g o u la ’s $130-m il- lio n sh ip yard ad d itio n b oosted th e secon d -h a lf
M is s is s ip p i’s E m ploym ent
FirstHalf1967
SecondHalf1967
Total1967
Jan.-Mar.1968
Civilian Employment + 0.1 + 1.0 + 0.5 + 6.8Nonfarm Employment* - 2.9 + 7.4 + 2.2 + 3.0
Manufacturing - 8.1 + 9.8 + 0.7 + 1.1Construction -25 .0 +34.9 + 2.8 + 19.4
Farm Employment -23 .8 + 1.1 -11 .4 +39.9
‘ Includes services, trade, finance, government, and other fields not separately shown.
NOTE: Seasonally adjusted data expressed as annual rates of change.
figures som ew hat. I t w ou ld b e m islea d in g to a ttr ibu te th e con stru ction em p lo y m en t p attern en tir e ly to in terd ep en d en ce o n th e n a tio n a l scene, how ever, s in ce th e tim in g o f loca l con tract com p le tio n s w as a lso im portant.
C on sid erin g th e d irect con trib u tion to th e to ta l num ber o f n onfarm job s m ad e b y n a tio n a lly orien ted factories and con stru ction firm s, togeth er w ith th eir in d irect in flu en ce on m ore lo ca lly orien ted b u sin esses , it is n o t surprisin g th a t th e sam e 1967 p attern o f p au se and grow th a lso a p peared in sea so n a lly ad ju sted nonfarm em p lo y m ent. T h e to ta l num ber o f nonfarm job s fe ll a t a 3 -p ercent rate in th e first h a lf o f 1967, th en grew a t a 7 -percen t rate in th e second . F or th e year a s a w hole, nonfarm jobs in creased 2 percent.
T h is exp an sion rep resen ted th e w eak est grow th in an y year s in ce 1960. In oth er w ords, M is s is s ip p i w as n o t as su ccessfu l in ba lan cin g agr icu lture w ith in d u stry in 1967 as sh e h as b een in other y ears b ecau se o f her s lu gg ish perform ance during th e first s ix m onths.
A gricu ltu re S till Im p ortant
D e sp ite M is s is s ip p i’s in creased in d u str ia liza tion , grow ing d ep en d en ce on econ om ic d eve lop m en ts ou ts id e th e sta te , and d ec lin in g farm w orkforce— agricu lture rem ain s im portant. C otton is s t ill th e m ajor cash crop, a s a recen t Review (F eb ru ary 1968) p o in ted out. C otton p lan tin gs in 1967 w ere su b sta n tia lly redu ced b y th e G overnm ent’s acreage d iversion program , an d poor w eather redu ced y ie ld s . S o y b ea n grow ers, truck gardeners, an d liv esto ck producers fared better, h ow ever, w ith h igh er prices and good y ie ld s .
P r o sp e c ts for 1 9 6 8
T h e n a tion a l eco n o m y h a s h ad an in creasin g in fluence on M iss iss ip p i. S in ce m o st exp erts are p red ictin g strong n a tion a l in com e grow th in 1968, a good year seem s in th e offing.
A v a ilab le figures for ea r ly 1968, w h ile s t ill sk etch y , app ear to bear o u t our op tim ism . A h earten in g factor is th e con stru ction o f th e $130- m illio n sh ip yard a d d itio n a t P ascagou la , w hich is a lread y provid ing con sid erab le im p etu s to th e sta te ’s econ om y.
W i l l i a m N . C o x , I I I
This is one of a series of articles in which economic developm ents in each of the S ix th D istric t s ta tes are discussed. D evelopm ents in Georgia’s econom y were analyzed in the A p ril 1968 R E V IE W , and a discussion of T ennessee’s econom y is scheduled for a forth coming issue.
MAY 1968 65Digitized for FRASER http://fraser.stlouisfed.org/ Federal Reserve Bank of St. Louis

S i x t h D i s t r i c t S t a t i s t i c sSeasonally Adjusted
(All data are indexes, 1 9 5 7 -5 9 = IOO, u n less indicated otherw ise.)
SIXTH DISTRICT
INCOME AND SPENDING
Crops
L atest Month (1968)
OneMonth
Ago
TwoMonths
Ago
OneYearAgo
. Feb. 63,766 61,616r 60,030r 58,760
. Mar. 230 229 220 210
. Feb. 146 158 134 137
. Feb. 154 167 131 125
. Feb. 152 156 145 146
. Mar. 305 322 286 295
. Mar. 269 266 256 254169p 158 175 158
Instalm ent Credit a t Banks* (Mil. $)
PRODUCTION AND EMPLOYMENTNonfarm E m p lo y m e n t ............................Mar. 140 141 140 136
M anufacturing ..................................... Mar. 140 140 140 137Apparel ...................................................Mar. 170 169 169 169C h e m i c a l s .............................................. Mar. 134 132 132 131Fabricated M e ta l s .................................Mar. 156 157 157 151F o o d ............................................................ Mar. 114 116 116 113Lbr., Wood Prod., Furn. & Fix. . . . Mar. 105 106 106 106P a p e r ........................................................Mar. 121 120 120 119Primary M e t a l s ..................................... Mar. 133 132 132 129Textiles ...................................................Mar. 109 109 109 108Transportation Equipment . . . . Mar. 180 181 183 174
N o n m an u fac tu rin g ..................................... Mar. 141 141 140 136C o n s t r u c t io n ..........................................Mar. 133 135 130 128
Farm E m p lo y m en t..................................... Mar. 64 67 66 68Unem ploym ent Rate
(Percent of Work F o r c e ) ...................Mar. 3.6 3.6 3.7 3.5Insured Unemployment
(Percent of Cov. E m p .) ........................Mar. 2.0 2.1 2.4 2.1Avg. Weekly Hrs. in Mfg. (Hrs.) . . . Mar. 41.0 41.2 40.4 41.0Construction C o n t r a c t s * ....................... Mar. 184 173 196 146r
R e s id e n t i a l ...............................................Mar. 222 186 224 172rAll O t h e r ................................................... Mar. 151 162 173 124
Electric Power Production** . . . . Feb. 155 152 150 145Cotton C o n su m p tio n * * ............................ Mar. 118 109 112 118Petrol. Prod, in Coastal La. and Miss.** Mar. 223 222 265 223
FINANCE AND BANKING
Loans*All M ember B a n k s .................................Mar. 268 267 266 247Large B a n k s .......................................... Mar. 237 238 239 223
Deposits*All M ember B a n k s .................................Mar. 204 204 203 185Large B a n k s .......................................... Mar. 178 181 181 167
Bank D e b its* /* * .......................................... Mar. 225 210 213 194
ALABAMA
INCOME
Personal Income (Mil. $ Annual Rate) . Feb. 8,393 8,179r 7,978r 7,830M anufacturing P a y ro lls ............................ Mar. 205 202 198 182Farm Cash R e c e ip t s .................................Feb. 150 156 113 148
PRODUCTION AND EMPLOYMENT
Nonfarm E m p lo y m e n t ............................ Mar. 127 127 127 125M anufacturing ......................................Mar. 128 128 127 124N o n m a n u fa c tu rin g .................................Mar. 126 127 127 125
C o n s t r u c t io n ......................................Mar. 117 119 112 119Farm E m p lo y m en t......................................Mar. 62 68 65 75Unem ploym ent Rate
(Percent of Work F o r c e ) ...................Mar. 4.3 4.5 4.3 4.3Avg. Weekly Hrs. in Mfg. (Hrs.) . . . Mar. 41.6 41.3 41.3 41.2
FINANCE AND BANKING
M ember Bank L o a n s .................................Mar. 251 251 247 233M ember Bank D e p o s i t s ........................Mar. 196 195 194 184Bank Debits** .......................................... Mar. 216 199 205 183
FLORIDA
INCOME
Personal Incom e (Mil. % Annual Rate) . Feb. 17,634 17,256r 16,982r 16,182M anufacturing P a y ro lls ............................ Mar. 273 274 277 259Farm Cash R e c e ip t s ................................. Feb. 163 164 160 126
PRODUCTION AND EMPLOYMENT
Nonfarm E m p lo y m e n t ............................ Mar. 154 154 153 149
Latest Month (1968)
M a n u f a c tu r i n g ...................................... Mar. 159N o n m a n u fa c tu rin g ..................................Mar. 153
C o n s t r u c t io n ...................................... Mar. 102Farm E m p lo y m e n t...................................... Mar. 83
U nem ploym ent Rate(P ercent of Work F o r c e ) ................... Mar. 2.9
Avg. Weekly Hrs. in Mfg. (Hr*.) . . . Mar. 40.6
FINANCE AND BANKING
M ember Bank L o a n s ..................................Mar. 280Member Bank D e p o s i ts .............................Mar. 216Bank D e b its* * ................................................Mar. 214
One Two One Month Months Year
Ago Ago Ago
160 161153 152103 103
96 77
2.941.1
3.041.5
279 279 215 216 205 216
155148103
2.642.4
256189185
GEORGIA
INCOMEPersonal Incom e (Mil. $ Annual Rate) . Feb. 12,531 12,083r 11,945 11,359M anufacturing P a y r o lls .............................Mar. 226 226 212 206Farm Cash R e c e ip t s ..................................Feb. 134 159 152 137
PRODUCTION AND EMPLOYMENTNonfarm E m p lo y m e n t .............................Mar. 141 141 140 137
M a n u f a c tu r i n g ...................................... M ar. 133 133 133 132N o n m a n u fa c tu rin g ..................................Mar. 145 145 143 140
C o n s t r u c t io n ...................................... Mar. 152 153 144 145Farm E m p lo y m e n t...................................... Mar. 56 58 64Unem ploym ent Rate , .
(P ercent of Work F o r c e ) ....................Mar. 3.3 3.2 3.2Avg. Weekly Hrs. in Mfg. (Hrs.) . . . Mar. 40.6 40.9 39.6 40.4
FINANCE AND BANKINGMember Bank L o a n s ..................................Mar. 282 279 276 258M ember Bank D e p o s i ts .............................M ar. 224 225 224 204Bank D e b its* * ................................................Mar. 256 236 237 220
LOUISIANA
INCOMEPersonal Incom a (Mil. $ Annual Rata) . Feb. 10,094M anufacturing P a y ro lls .............................Mar. 200Farm Cash R e c e ip t s ..................................Feb. 161
PRODUCTION AND EMPLOYMENT
Nonfarm E m p lo y m e n t .............................Mar. 131M a n u f a c tu r i n g ...................................... Mar. 121N o n m a n u fa c tu rin g ..................................Mar. 133
C o n s t r u c t io n ...................................... Mar. 153Farm E m p lo y m e n t...................................... Mar. 60U nem ploym ent Rate
(Percent of Work F o r c e ) ................... Mar. 4.3Avg. Weekly Hrs. in Mfg. (Hrs.) . . . Mar. 42.4
FINANCE AND BANKINGM ember Bank L o a n s * .............................Mar. 232M ember Bank D e p o s i t s * ........................ Mar. 170Bank D e b its* /* * ...........................................Mar. 182
9,805199183
13212113415661
4.443.8
9,374198150
MISSISSIPPI
INCOMEPersonal Incom e (Mil. $ Annual Rate) . Fab.
M anufacturing P a y ro lls .............................Mar.Farm Cash R e c e ip t s ..................................Fab.
PRODUCTION AND EMPLOYMENT
Nonfarm E m p lo y m e n t .............................Mar.M anufacturing ...................................... Mar.N o n m a n u fa c tu rin g ..................................Mar.
C o n s t r u c t io n ...................................... Mar.Farm E m p lo y m e n t...................................... Mar.
U nem ploym ent Rate(Percent of Work F o r c e ) ................... Mar.
Avg. Weekly Hrs. in Mfg. (Hrs.) . . . Mar.
FINANCE AND BANKING
M ember Bank L o a n s * ............................. Mar.M ember Bank D e p o s i t s * ........................ Mar.Bank D ebits* /• * ........................................... Mar.
5,024258143
14315114015564
4,726254182
14315114016059
4.1 4.5 4.6
41.2 41.0 40.3
332 340 330
235 242 241
246 226 217
9,303188147
131 127120 117134 129153 14755 60
4.4 4.142.5 42.5
229 235 220169 170 158
176 173 163
4,561 240 223113
14215113915660
145
14014913615361
4 2 40.6
294224207
66 M O N TH LY REV IEWDigitized for FRASER http://fraser.stlouisfed.org/ Federal Reserve Bank of St. Louis

One Two One One Two OneL atest M onth M onth M onths Year Latest Month Month M onths Year
(1968) Ago Ago Ago (1968) Ago Ago Ago
TENNESSEE N o n m a n u fa c tu rin g ........................ 136 136 135 132C o n s t r u c t io n ............................ 182 189 172 158
INCOME Farm E m p lo y m e n t............................ 63 70 69 77Personal Income (Mil. $, Ann. Rete) Feb. 10,091 9,567 9,190 9.351 U nem ploym ent RateManufacturing P a y ro lls ........................ . Mar. 220 219 206 196 (P ercent of Work Force) . . . . . Mar. 4.5 3.6 3.9 3.3Farm Cash R e c e ip ts ............................ . Feb. 124 107 104 127 Avg. Weekly Hrs. in Mfg. (Hrs.) . . . Mar. 40.6 40.6 39.2 40.0
FINANCE ANO BANKINGPRODUCTION ANO EMPLOYMENT M ember Bank L o a n s * ................... 260 257 260 240
Nonfarm E m p lo y m e n t........................ . Mar. 140 141 139 136 M ember Bank Deposits* . . . . 189 188 186 173M anufacturing .................. . . . Mar. 149 149 149 146 Bank D e b i t s * / * * ............................ 253 223 221 215
’For Sixth District area only. O ther to ta ls for e n tire six s ta te s . “ Daily average basis . r-Revised. p-Prelim inary estim ate .Sources: Personal income estim ated by th is Bank; nonfarm , mfg. and nonm fg. em p., mfg. payrolls an d hours, and unem p., U. S. D ep t of Labor and cooperating s ta te «*enci«s; cotton consum ption, U. S. Bureau of C ensus; co nstruc tion co n trac ts , F. W. Dodge Corp.; petrol, prod., U. S. Bureau of Mines; industria l use of e lec. power. Fed. Power Comm.; farm cash rece ip ts and farm em p., U.S.DA. O ther indexes b ased on d a ta co llected by th is Bank. All indexes ca lcu lated by th is Bank.
D e b i t s t o D e m a n d D e p o s i t A c c o u n t sInsured Com m ercial Banks in the Sixth District
(In T housands of Dollars)
Mar.1968
standard m etr o po l ita n STATISTICAL AREASt
Birmingham#Gadsden . .Huntsville .Mobile .Montgomery Tuscaloosa .
Ft Lauderdale Plywood
Jacksonville Miami .Orlando . Pensacola Tallahassee Tampa-
St. Petersburg Palm Beach .
Albany Atlanta Augusta Columbus Macon Savannah
Baton Rouge layette Uke Charles Ne* Orleans
Jackson .
ChattanoogaKnoxvilleNashville
OTHER CENTERS
Anniston . Dothan Selma .
BartowBradenton ! Brevard County °«ytona Beach
Myers- N. Ft Myers
Ga,nesviiie .
Feb.1968
P ercen t C hang*
Year-to-Date 3 m o n th s
Mar. 1968 from 1968 Feb. Mar. from
17 1968 1967 1967
P ercen t Change
Year-to-Date 3 m onths
b#nks in « • Sixth D istrict portion of th e s ta te . tP a rtia lly e s tim a ted . tE stim ated . #Birm ingham d a ta revised to reflect expansion of th is SMSA * to th ree co u n ties . r-Revised.
1,736,159 1.544,069 1.576,176 +12 +10 + 959,143 57,953 59,370 +2 -0 + 4
179.606 173,969 186,993 + 3 - 4 +2481,726 491.036 471,514r -2 +2 + 9313,364 300,810 306,223 + 4 +2 +6
94,677 98,966 96,340 - 4 - 4 + 9
747.567 737,822r 691,024r +1 +8 + 171.556,403 1,447,095 1,644,258 + d - 5 + 32,623,786 2.490,100 2,429,516r + 5 +8 + 1 9
574,387 571,439 555,654 +1 + 3 + 14199,461 202,015 197,844 -1 + 1 + 9142,315 147,886 128,230 - 4 + 11 + 9
1,578,606 l,506,426r 1,380,371 + 5 + 14 + 1 9487,564 487.148 446,687 +0 + 9 + 1 6
91,481 88,281 86,005 + 4 +6 +125,304,003 4,847,883 4,944,846r + 9 + 7 + 1 3
301,762 282,774 287,852 + 7 + 5 +6223,814 218,235 214,762r + 3 + 4 +10258,090 247,939 254,615 + 4 +1 +11283,214 268,713 282,970 + 5 +0 +8558,276 558,917 549,869 -0 +1 + 9132,834 127,728 112,850 + 4 + 1 8 + 15153,089 147,024 141,788 + 4 +8 + 9
2,512,241 2,396,283 2,484,461 + 5 +1 +6714,623 673,221 619,416 +6 + 1 5 + 1 5
624,020 578,437 632.411 +8 -1 + 5464,750 433,595 451,693 + 7 + 3 + 7
1,794,494 1,593,531 1,627,292 + 1 3 +10 + 14
66,721 65,930 63,473 +1 + 5 +1063,177 59,725 62,285 +6 + 1 + 944,725 45,956 44,288 - 3 +1 +832,996 30,634 38,273 +8 - 1 4 -882,389 77,400 75,188 +6 +10 + 1 7
222,436 215,415 217,750 + 3 +2 +884,736 87,400 96,394 - 3 -12 +699,547 106,650 82,466 - 7 +21 + 3 094,424 8 M 9 8 86,679 + 7 + 9 + 1 3
Mar. 1968 from 1968Mar. Feb. Mar. Feb. Mar. from1968 1968 1967 1968 1967 1967
Lakeland ................... 123,114 125,377 124,741 -2 -1 +6Monroe County . . . 39,786 35,181 38,706 + 13 + 3 + 4
58,586 63,590 56,492 -8 + 4 +8S t A ugustine . . . 18,915 18,597 19,615 +2 - 4 +0S t P e tersburg . . . 387,648 341,539 361,940 + 1 4 + 7 + 12Sarasota ........................ 116,076 120,732 101,679 - 4 + 14 +25Tam pa ........................ 856,145 803,939 692,594 +6 + 24 +24W inter Haven . . . 69,945 67,367 62,688 + 4 +12 + 9
Athens ........................ 78,308 77,751 73,710 + 1 +6 +12B r u n s w i c k ................... 42,071 40,863 40,492 + 3 + 4 +13Dalton ........................ 95,329 87,379 78,412 + 9 +22 +21E l b e r t o n ........................ 14,420 12,486 18,552 + 15 -22 -8G a in e s v i l le ................... 67,370 62,228 71,082 +8 - 5 - 3
35,273 33,886 31,530 +4 + 12 + 7LaG range ................... 23,738 19,833 23,694 +20 +0 - 3
25,929 24,974 21,438 + 4 +21 +1272,699 70,844 71,564 + 3 +2 +6
V a l d o s t a ........................ 54,661 51,369 54,475 +6 +0 +611,903 12,094 11,659 -2 +2 +11
A le x a n d r ia ................... 135,110 123,665 139,084 + 9 - 3 -1Bunkie ........................ 6,089 6,145 6,784 -1 -10 + 5
41,963 35.602 38,171 + 1 8 +10 + 5New I b e r i a ................... 36,330 31,801 33,581 + 1 4 +8 +2Plaquem ine . . . . 12,476 11.995 10,694 + 4 +17 +12T h i b o d a u x ................... 20,781 21,181 22,879 -2 - 9 +2Biloxi-Gulfport . . . 106,122 107,493 108,221 -1 -2 + 9H attiesburg . . . . 55,755 54,545 55,421 +2 +1 + 7Laurel ........................ 36,873 37,016 33,963 -0 + 9 +12M e r id ia n ........................ 63,380 63,355 64,132 +0 -1 + 3N a t c h e z ........................ 38,537 37,895 39,747 +2 - 3 + 4Pascagou la—
MOSS P oint . . . . 59,632 58,209 54,014 +2 +10 + 1 6V i c k s b u r g ................... 41,007 43,764 40,828 -6 +0 + 4
Yazoo C i t y ................... 29,650 27,232 26,447 + 9 +12 + 13
79,463 78,407 65,384 +1 +22 +23Johnson City . . . . 76,663 70,907 77,289 +8 -1 + 4
K i n g s p o r t ................... 181,021 145,247 170,164 + 25 +6 + 9
SIXTH DISTRICT, Total 32,789,673 31,052,264r 30,997,710r +6 +6 +11A labam a!F lo r id a } . .Georgia}Louisiana!*M ississ ip p i*T ennesseet*
4,155,641 10,214,377 8.366,971 4,149,504
. 1,492,029
. 4,411,151
3,931,013 3,850,904r +69,778,768r 9,641,603r + 47,819,002 7,890,053r + 74,102,170 4,089,564r +11,439,634 1,385,980 + 43,981,677 4,139,606r +11
+8 + 9+6 + 14+6 +12+1 +6+8 +11+ 7 +11
m a y 1968 67Digitized for FRASER http://fraser.stlouisfed.org/ Federal Reserve Bank of St. Louis

D i s t r i c t B u s i n e s s C o n d i t i o n s
M o st o f the D istr ic t ’s e con om ic in d ica to rs po inted strong ly upw ard recently, su g g e s t in g con tinu e d ex
pan sion . Large b a n k s experienced a sharp rise of b u s in e s s lo an s in April. C o n su m e r sp e n d in g increased
in M arch , financed by larger in co m e s and heavier in sta lm e n t credit ex tensions. D istr ic t fa rm e rs reported
h igher rece ip ts and expenses. R e s id e n t ia l con stru ction rem ained sturdy, su p ported by a h igh level of
co m m itm e n ts and new m ortgage le n d in g in the s in g le -fam ily secto r by sa v in g s and loan a sso c ia t io n s.
B a n k lend ing, e sp e c ia lly to b u s in e sse s , rose
s ign ific an t ly in A pril, ju d g in g from the su rge in
loan activ ity a t large com m e rc ia l banks. F irm s en gaged in reta il trade, serv ices, and tex t ile m an u factu rin g w ere am ong th e h ea v ies t borrow ers. A t m id-m onth , run-offs o f large d en om in ation certifica tes o f d ep o sit w ere m in im a l in con trast w ith th ose in so m e o ther parts o f th e coun try . E ffectiv e A p ril 19, 1968, th e B oard o f G overnors o f the F ed era l R eserv e S y stem in stitu ted a n ew gradua ted sca le o f m axim u m rates a llow ab le on tim e certifica tes o f d ep o sit o f over $100,000. T h e d is cou n t ra te o f th e F ed era l R eserv e B an k o f A tlan ta w as in creased from 5 to 5^2 p ercent, e ffec tive A p ril 22, 1968.
C on su m e r sp e n d in g becam e more v igo rou s in
the first quarter o f 1968. A u tom ob ile sa les , w h ich ad van ced in F ebruary, rem ain ed a t a h igh ra te in M arch . In sta lm en t cred it ex ten sio n s a t com m ercia l banks rose rap id ly , reflecting in creased sp en d in g .
M a n u fa c tu re rs pa id m ore to the ir w orkers in
M arch , de sp ite a som ew hat shorter average w ork
week. N on farm em p lo y m en t w as h e ld d ow n by str ik es a t A tla n ta au to a ssem b ly p lan ts.
T hrough M arch , the price index and farm ca sh
rece ip ts were w ell above year-ago levels. C itrus products, h ogs, ca tt le and ca lves, an d r ice le d the ad van ce in p rices, w h ile eg g an d co tton prices co n tin u ed to fa ll. T h e co st o f farm ing in creased further, w ith th e r ise in w ages, in tere st rates, and taxes. D ro u g h t co n d itio n s in F lo r id a an d S o u th G eorgia forced farm ers to rep la n t som e acreages.
Sou thern h o u s in g sta rts were up sh a rp ly in
February and d ip pe d on ly s l ig h t ly in M arch . T h ep a ce o f n ew con stru ction con tract aw ard s rem ain s v igorou s, le d b y ex p a n sio n in b oth s in g le fa m ily an d m u lti-fa m ily re s id en tia l vo lu m e. In th e first quarter, sav in g s an d lo a n a sso c ia tio n s exp erien ced a con sid erab le s low in g o f n e t sav in gs in flow s, re la tiv e to la s t y ea r ’s h ig h lev e ls , b ut m a in ta in ed m ortgage len d in g v o lu m e an d future com m itm en ts w ell.
NOTE: Data on which statements are based have been adjusted whenever possible to eliminate seasonal influences.
68 M O N T H LY R E V IE WDigitized for FRASER http://fraser.stlouisfed.org/ Federal Reserve Bank of St. Louis