monthly healthcare update - coker...
TRANSCRIPT

NOVEMBER 2016
COKER CAPITAL ADVISORS
Atlanta Charlotte New York - 1 -
MONTHLY HEALTHCARE M&A UPDATE
SECTOR SPOTLIGHT: TELEHEALTH
COKER CAPITAL ADVISORS│ NOVEMBER 2016

NOVEMBER 2016
COKER CAPITAL ADVISORS
Atlanta Charlotte New York - 2 -
Telehealth: Executive Summary
The origins of telehealth date to the space program in the 1960s. NASA was looking to gain insight into how a zero-gravity
environment would impact astronauts' vital signs. NASA's efforts to monitor astronaut health fostered interest in “Earth-bound
physicians trying to diagnose or treat a patient in a remote location,” according to a 1996 essay in the Bulletin of the Medical
Library Association.
Today, the federal Health Resources and Services Administration (HRSA) defines telehealth as “the use of electronic information
and telecommunications technologies to support and promote long distance clinical health care, patient and professional health-
related education, public health, and health administration.”
Said differently, telehealth is a concept that utilizes technology to deliver remote healthcare services. While the applications,
services, end markets, and technologies vary, a fundamental strategy for nearly all telehealth business models encompass the
goals of achieving better healthcare at lower costs. The adoption of telehealth across the healthcare landscape has increased
dramatically in recent years and is changing the way patients and their families interact with physicians and healthcare systems.
Themes including the rising cost of U.S. healthcare, increasing patient financial responsibility for care, and consumer demand
for convenience have been important drivers in the rapid adoption of telehealth.
Complex and evolving reimbursement dynamics across public and private payors continues to be the key factor restraining
sector growth. Public payors are inconsistent in their approach as Medicare’s coverage policies lag due to restrictive statutes and
regulations, and while Medicaid programs generally include telehealth, coverage varies significantly by state. In contrast, most
private payors have expanded reimbursement in recent years as many states have passed laws requiring coverage, though
approaches taken by private payors remain inconsistent.
The recent push into telehealth from stakeholders across the healthcare industry is part of a wider digital health movement that
includes areas such as consumer engagement applications, analytics and Big Data, wearables and biosensing, population health
management, and others. For the purpose of this report, we classify telehealth into four domains: (1) Real-time, (2) Store and
Forward, (3) Remote Patient Monitoring and (4) mHealth (mobile health).
Telehealth versus Telemedicine
One small source of confusion in the market has been the use of the terms telehealth versus telemedicine. Market participants,
including Medicare, state Medicaid programs and other stakeholders often use telehealth and telemedicine interchangeably. In
general, telemedicine is a subset of telehealth and describes a narrower range of healthcare services. It includes many medical
sub-specialties, such as telepediatrics, telepsychiatry, teleradiology and telecardiology. Telemedicine is considered the clinical
application of technology while telehealth generally refers to a broader scope of services including non-clinical services such as
training and education that can be delivered from afar. For this report, we use the term telehealth, but don’t make a distinction
between the two.
NOVEMBER 2016
COKER CAPITAL ADVISORS
Atlanta Charlotte New York - 3 -
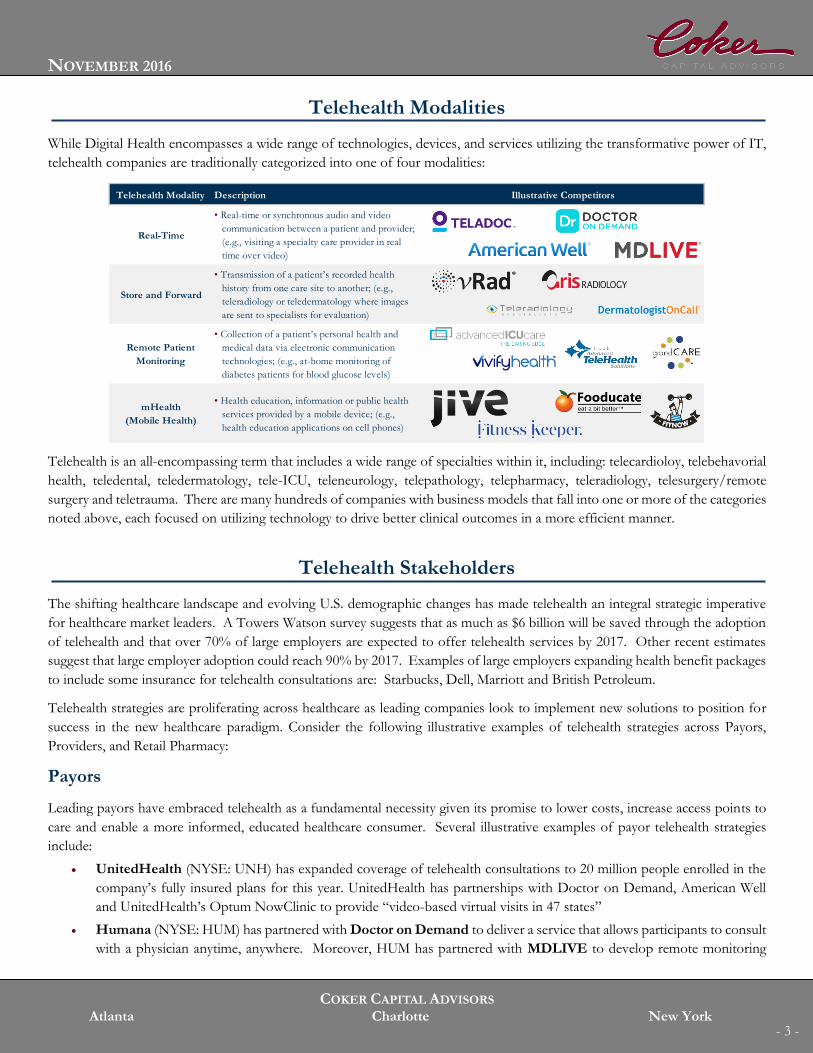
Telehealth Modalities
While Digital Health encompasses a wide range of technologies, devices, and services utilizing the transformative power of IT,
telehealth companies are traditionally categorized into one of four modalities:
Telehealth is an all-encompassing term that includes a wide range of specialties within it, including: telecardioloy, telebehavorial
health, teledental, teledermatology, tele-ICU, teleneurology, telepathology, telepharmacy, teleradiology, telesurgery/remote
surgery and teletrauma. There are many hundreds of companies with business models that fall into one or more of the categories
noted above, each focused on utilizing technology to drive better clinical outcomes in a more efficient manner.
Telehealth Stakeholders
The shifting healthcare landscape and evolving U.S. demographic changes has made telehealth an integral strategic imperative
for healthcare market leaders. A Towers Watson survey suggests that as much as $6 billion will be saved through the adoption
of telehealth and that over 70% of large employers are expected to offer telehealth services by 2017. Other recent estimates
suggest that large employer adoption could reach 90% by 2017. Examples of large employers expanding health benefit packages
to include some insurance for telehealth consultations are: Starbucks, Dell, Marriott and British Petroleum.
Telehealth strategies are proliferating across healthcare as leading companies look to implement new solutions to position for
success in the new healthcare paradigm. Consider the following illustrative examples of telehealth strategies across Payors,
Providers, and Retail Pharmacy:
Payors
Leading payors have embraced telehealth as a fundamental necessity given its promise to lower costs, increase access points to
care and enable a more informed, educated healthcare consumer. Several illustrative examples of payor telehealth strategies
include:
UnitedHealth (NYSE: UNH) has expanded coverage of telehealth consultations to 20 million people enrolled in the
company’s fully insured plans for this year. UnitedHealth has partnerships with Doctor on Demand, American Well
and UnitedHealth’s Optum NowClinic to provide “video-based virtual visits in 47 states”
Humana (NYSE: HUM) has partnered with Doctor on Demand to deliver a service that allows participants to consult
with a physician anytime, anywhere. Moreover, HUM has partnered with MDLIVE to develop remote monitoring
Telehealth Modality Description Illustrative Competitors
Real-Time
• Real-time or synchronous audio and video
communication between a patient and provider;
(e.g., visiting a specialty care provider in real
time over video)
Store and Forward
• Transmission of a patient’s recorded health
history from one care site to another; (e.g.,
teleradiology or teledermatology where images
are sent to specialists for evaluation)
Remote Patient
Monitoring
• Collection of a patient’s personal health and
medical data via electronic communication
technologies; (e.g., at-home monitoring of
diabetes patients for blood glucose levels)
mHealth
(Mobile Health)
• Health education, information or public health
services provided by a mobile device; (e.g.,
health education applications on cell phones)

NOVEMBER 2016
COKER CAPITAL ADVISORS
Atlanta Charlotte New York - 4 -
pilots focused on better managing high acuity patients, including remote monitoring of patients with chronic conditions,
motion sensors in the home, case management e-visits, and other services
Anthem (NYSE: ANTM) has an online care service, LiveHealth Online, in partnership with American Well. This is
a 24/7 telehealth services available to any plan member
Cigna (NYSE: CI) began a partnership with MDLIVE in 2013 that covers approximately 30% of its U.S. group medical
population. The company recently announced an expansion of its telehealth offering by adding AMWELL (by
American Well) to this existing offering. Finally, beginning in January 2017, CI will offer health plan participants access
to a network of remote behavioral health professionals through MDLive
Aetna (NYSE: AET) is making a big push into wellness tracking and care management by recently announcing an
initiative to be the first major healthcare company to subsidize purchases of the Apple Watch. The company announced
that it would be supplying free Apple Watches to its nearly 50,000 employees
Providers
In today’s value-based reimbursement environment, providers must identify new ways to drive volume to leverage large fixed
infrastructure costs. Telehealth is a powerful tool that enables providers to extend their reach into their community as well as
to access patients who were previously out of reach, thereby allowing the opportunity to build scale to offset lower inpatient
volumes. Moreover, providers benefit from telehealth’s ability to improve patient compliance via daily monitoring and early
intervention strategies. Finally, telehealth enables physicians, nurses and other caregivers to become more collaborative by
centralizing data and increasing the efficiency of communication. Several illustrative examples of provider telehealth strategies
include:
UHS (NYSE: UHS) implemented a basic telehealth behavioral program back in 2009, and have now expanded their
capabilities to incorporate general telehealth services nationally to cover over 80 facilities offering care in a variety of
settings including ER departments, outpatient clinics and military bases
Post-acute provider Kindred (NYSE: KND) actively uses remote monitoring for a large number of home care patients
and has consistently experienced readmission rates below state and national averages
HCA (NYSE: HCA) has recently reengineered its sprawling telehealth program which spans nearly 400 sites across 20
states. The company has ‘transitioned from a technology-focused telehealth to clinically focused, technology enabled
telehealth.’ The system also has an extensive telebehavorial service offering and last year conducted 17,000
telebehavorial health visits using psychologists, LCSWs and psychiatrists
Thomas Jefferson University Hospital in Philadelphia now requires physicians to be telehealth trained and perform
at least one telehealth session per month to receive incentives
Mercy Hospital in Saint Louis opened a Virtual Care center in 2015, a ‘hospital without beds’ that has over 300
physicians and staff members dedicated entirely to delivering telehealth services. Since this opening, the expected
inpatient length of stay and mortality rates have declined 40%, and the average cost of care has declined substantially
Retail Pharmacy
Retail pharmacies including Walgreens (Nasdaq: WBA) and CVS Health (NYSE: CVS) have also been active in developing
telehealth strategies to improve customer care.
Walgreens first partnered with MDLive in 2014, expanded its telehealth offering to 20 more states in 2015 and recently
broadened this partnership again in 2016 by adding behavioral health to its service offering. The company also has a
partnership with WebMD (Nasdaq: WBMD) whereby it offers a virtual wellness coach on Walgreens.com and
Walgreens Balance Rewards and e-prescription services are integrated into the WebMD mobile app to track and reward
healthy behavior

NOVEMBER 2016
COKER CAPITAL ADVISORS
Atlanta Charlotte New York - 5 -
CVS Health is working with three telehealth companies – American Well, Doctor On Demand and Teladoc
(NYSE:TDOC) – to explore how direct-to-consumer telehealth providers, retail pharmacy and retail clinic providers
can collaborate to improve patient care. This represents an expansion of CVS Health’s existing telehealth approach
Market Size and Growth
Given the dynamic nature of technology, disparate adoption rates, applicability to an evolving range of specialties and care
settings and widely varying reimbursement protocols, the market size and growth prospects for the telehealth industry can be
difficult to estimate with precision. Moreover, analysts and other industry participants have differing market definitions of
telehealth, further making market size and growth comparisons challenging.
The largest public telehealth provider, Teladoc defines its market opportunity as the delivery of healthcare in an on demand,
patient / consumer facing service offering and defines two segments – (1) Ambulatory Care and (2) Behavioral Health – in a
nearly $30 billion industry. This company’s model is categorized in the Real Time modality defined previously. Consider
TDOC’s methodology in arriving at this market size estimate:
Source: Teladoc Investor Presentation, October 2016
While there are many competitors occupying this specific segment of the telehealth market, a number have reached a scale and
profile to stand out as market leaders with models of delivering healthcare in an on-demand, patient / consumer facing service
offering. While by no means an exhaustive list, leading competitors to Teladoc in this segment of telehealth include:
Source: Teladoc Investor Presentation, October 2016
Annual VisitsEstimated % Treatable
through Telehealth
Annual
Telehealth Visits
Cost per
Telehealth Visit
Total Addressable
Market
Ambulatory
Care
Market
1.25
Billion33%
417
MillionUp to $40
$17
Billion
TAM
Behavioral
Health
Market
168
Million78%
131
Million~$89
$12
Billion
TAM
# of
Visits
Market
Share
Mode
of VisitMonetization
Doc
Network
576k ~70% Choice of Video or PhoneAccess Fee
("PEPM")
+3,100MD, BH, Derm
profesionals
125k – 150k ~15% Choice of Video or Phone
Access Fee
("PEPM") or
License Fee
+2,300MD, BH profesionals
60k – 80k ~10% Video OnlyLicense or
Other Fee
MD, BH,
and Dieticians
<50k ~5% Video OnlyVisit Fee
Only
1,500MD, Psych,
and other
NOVEMBER 2016
COKER CAPITAL ADVISORS
Atlanta Charlotte New York - 6 -
Other telehealth verticals are also very sizable beyond the patient / physician consultation market defined in part by Teladoc.
As an example, Grand View Research recently published a report estimating the size of the global teleradiology market at $8.2
billion. Kalorama Information recently sized the global patient monitoring market at $31.4 billion encompassing devices,
software and mobile application. Finally, Frost & Sullivan recently estimated that the global healthcare market for wearable
devices will grow from $5.1 billion in 2015 to nearly $19 billion by 2020.
Finally, estimates for telehealth sector growth range dramatically, though are generally in the 20% – 40%+ area, and the adoption
rate is by far the biggest driver of this growth. As noted, Towers Watson recently estimated that approximately 22% of large
employers offered telehealth benefits in 2014, a figure they expected to increase to 37% in 2015 and to 70%+ by 2016 or 2017.
Other recent estimates suggest that large employer adoption could reach 90% in 2017. Moreover, smaller employers are expected
to follow suit and analysts predict that telehealth will become a standard insurance benefit by the end of the decade.
Rules and Reimbursement
U.S. telehealth is impacted by laws and regulations at both the federal and state levels. Unfortunately, there is no uniform
approach to reimbursement and this represents a major challenge as both private insurers and public programs continue to limit
the implementation and use of telehealth services. When services are not reimbursed or are reimbursed at lower levels than in-
person services, adoption slows and the utilization decreases.
The federal government plays a role in shaping telehealth services for Medicare programs, though it has generally restricted
payment to a narrow set of services and only in rural areas. This legacy bias was due in part to a belief that telehealth would
increase spending due to higher utilization. CMS has recently allowed for expanded use of telehealth by waiving the geographic
and practice setting limitations for providers participating in certain experimental Medicare payment initiatives. While this is a
positive step, the overall Medicare approach to reimbursement provides a confusing model for states to follow when developing
their own policies and protocols. Also, while CMS provides some incentives through the ACA to develop telehealth services at
the state level, including grants and reimbursement incentives, it leaves decisions about implementing or reimbursing in Medicaid
programs to the states.
States have significant control over reimbursement for telehealth services, both within their Medicaid programs as well as
through laws governing private insurers. Thus, coverage is almost universal (49 states and D.C. offered some coverage through
Medicaid in 2015), though the criteria for coverage varies dramatically by state. For example, California’s Medicaid program
permits telehealth services to be provided to anyone in any setting while Idaho Medicaid will pay only if the patient is in a rural
area with a shortage of providers.
In addition, while many states have adopted policies related to private payors, the state laws governing private payors vary. For
example, some states stipulate certain criteria if a payor decides to cover telehealth, some require coverage for certain defined
services, certain populations or all beneficiaries and some states require payment terms for telehealth.

NOVEMBER 2016
COKER CAPITAL ADVISORS
Atlanta Charlotte New York - 7 -
Source: National Conference of State Legislatures Website, (2016)
Another issue limiting growth are parity laws that require reimbursement by health plans for telehealth services at an equivalent
rate as paid for in-person services. Without parity laws, health plans can pay for telehealth services at a percentage of what they
pay for in-person services. Many coverage laws passed by states fail to include parity language so while states have provided for
coverage, they have not properly incentivized physicians to provide telehealth services over in-person services. Currently, 32
states and Washington D.C. have passed parity laws. Congress is now considering a nationwide telehealth parity act (i.e. Medicare
Telehealth Parity Act) that is intended to expand coverage for Medicare beneficiaries. While the act would expand the number
of qualifying geographic locations and expand coverage, its prospects for passage are unclear.
In summary, while momentum exists to expand and streamline telehealth reimbursement across the healthcare landscape,
progress remains slow, and without a uniform approach to reimbursement healthcare cannot fully realize the sector’s potential.
M&A and Capital Raising Environment
The proliferation of technology investment across healthcare, the dramatic changes in healthcare delivery driven in part by the
Affordable Care Act and the increased consumerism of healthcare are all drivers of telehealth’s recent dramatic growth. Not
surprisingly this growth profile has attracted a very broad range of investors who annually invest billions into the sector.
Source: CB Insights
Medicaid and Private Payor Coverage and Reimbursement Policies
Medicaid and Private Payor Coverage and Reimbursement Policies
$1,779$2,452
$5,420 $5,747
$3,566
488
686
825
996
471
(100)
100
300
500
700
900
1,100
0
1,000
2,000
3,000
4,000
5,000
6,000
7,000
2012 2013 2014 2015 1H'16
Amount Invested ($ in millions) Deals

NOVEMBER 2016
COKER CAPITAL ADVISORS
Atlanta Charlotte New York - 8 -
Additionally, new platforms and business models are constantly forming and fundraising to take advantage of opportunities to
meet the changing demands across healthcare. Hundreds of telehealth related companies receive funding each year. While an
exhaustive list of these companies is beyond the scope of this report, an illustrative list of innovative telehealth models that have
received new capital investments over the past year include:
PlushCare, a direct-to-consumer online urgent care provider, raised $8 million in a Series A financing in November
2016 led by GGV Capital
Owlet Baby Care, a developer of a monitor that tracks a baby’s oxygen and heart rate and sends notifications via Wi-
Fi to a smart phone, raised an additional $15 million in funding in November 2016 led by Eclipse and Eniac Ventures
PetCoach, a provider of online petcare service combining personal advice and 24/7 access to certified pet professionals,
raised $2 million in November 2016 led by Comcast Ventures
Cohero Health, a developer of care connected devices and mobile applications that actively engage and empower
respiratory patients by measuring lung function and tracking adherence, raised $9 million in a Series A financing in
November 2016 led by Three Leaf Ventures
Heal, an on demand provider of physicians for house calls, raised nearly $27 million Series A in October 2016 led by
Tull Investment Group
Aligned Telehealth, a provider of psychiatric specialty physician consultations to acute care hospitals, ERs, skilled
nursing facilities and correctional institutions, raised $12 million in a Series A funding in August 2016 led by SV Life
Sciences
Nomad Health, an on-line marketplace connecting doctors with freelance clinical work, raised $4 million in a Series A
funding in July 2016 led by First Round Capital and RRE Ventures
Azalea Health, a software company focused on rural practices and mobile tools, raised nearly $11 million in Series B
funding in July 2016 led by Kayne Anderson Capital Advisors
Avizia, a spin out from Cisco offers an end-to-end managed telehealth offering for providers, raised $11 million in a
Series A funding in July 2016 led by Blue Heron Capital and a $6 million add-on investment in November 2016 led by
HealthQuest Capital
Caremerge, a business platform that facilitates communication between older patients and their hospitals, ACOs,
physicians, long-term care providers and their families through a common portal, raised $14 million in July 2016 led by
Insight Venture Partners
Endotronix, a maker of devices to manage heart failure and remotely monitor cardiac patients, raised $32 million in
new funding in July 2016 led by BioVentures, SV Life Sciences, Lumira Capital, Aperture Venture Partners and OSF
Ventures
Talkspace, a mental health-focused telehealth company, raised $15 million in a funding in June 2016 round led by
Norwest Venture Partners
WeCounsel, a company that offers patients video visits with behavioral health providers, raised nearly $4 million in
May 2016 in a round led by Longmeadow Capital Partners
Brighter, an online dental marketplace, raised $21 million in April 2016 in a round led by General Catalyst Partners
Lantern, a company that offers web and mobile programs using cognitive behavioral therapy for anxiety and stress,
raised $17 million in February 2016 led by UPMC Enterprises
Vivify Health, a remote patient monitoring company, raised $17 million in February 2016 led by strategic investor
UPMC with participation from strategic investors Labcorp and Envision
Healthline Media, a consumer health website, raised $95 million in January 2016 from Summit Partners as part of a
spin-off from its parent company, Healthline Networks

NOVEMBER 2016
COKER CAPITAL ADVISORS
Atlanta Charlotte New York - 9 -
Hometeam, a senior-focused, home care company that allows families to send a caregiver to a senior’s home, raised
nearly $28 million in January 2016 from Oak HC/FT as well as existing investors Lux Capital, IA Ventures, and Recruit
Strategic Partners
Higi, a health kiosk company with a presence in nearly 10,000 retail locations that tracks metrics like weight, body mass
index (BMI) pulse and blood pressure, received a $40 million investment in January 2016 from existing investors
Vidyo, a visual communications company that integrates high definition video communications into EHR systems and
workflow, closed a $15 million round in December 2015 led by Kaiser Permanente Ventures
A seminal event in the telehealth industry occurred on June 30, 2015 when Teladoc (NYSE: TDOC) priced its IPO at $19 per
share, raising over $150 million. Since pricing, the stock has declined 5.8% overall (as of 11/11/16) and has been highly variable,
trading up to $35.42 on 08/05/15 and down to $9.08 on 03/28/16.
Teladoc is a telehealth market leader with a model that focuses on delivering remote patient consultations. Business highlights
include:
Offers a comprehensive product portfolio across General Medical, Pediatrics, Behavioral, Dermatology and Smoking
Cessation
Generates roughly 85% of sales from per-member, per-month (PMPM) access fees, with the remaining 15% of sales
dependent on (relatively predictable) patient visits
Over 6,000 clients including 200+ Fortune 1000 companies, 25+ health plans and 80+ hospital / and other provider
clients
Guiding to achieve EBITDA breakeven by the 4th quarter 2017
Teladoc (NYSE: TDOC)
Stock Price $17.90
Shares Outstanding 46.0
Market Capitalization $824.0
Plus: Net Debt ($30.5)
Firm Value $793.5
Metric Multiple
2016E Revenue: $122.3 6.5x
2017E Revenue: $184.7 4.3x(70%)
(50%)
(30%)
(10%)
10%
30%
50%
70%
90%
6/30/15 10/8/15 1/16/16 4/25/16 8/3/16 11/11/16
TDOC vs. Market Indices
S&P 500 +4.9%
NASDAQ +5.0%
TDOC -5.8%

NOVEMBER 2016
COKER CAPITAL ADVISORS
Atlanta Charlotte New York - 10
-
Additionally, iRhythm Technologies (Nasdaq: IRTC) is a telehealth company with a very different business model that priced
an IPO at $17 per share on 10/20/16, raising over $100 million. This company has a model focused on wearables that combine
biosensing technology with cloud based analytics and machine learning capabilities. Since pricing, the stock has increased 42.5%
(as of 11/11/16) and has traded up to $28.00 on 10/20/16 and down to $22.16 on 11/03/16.
iRhythm is a commercial-stage digital healthcare company that is meant to be a less cumbersome alternative to the Holter
monitor that doctors prescribe to patients they suspect may have atrial fibrillation. Business highlights include:
Company platform, the Zio Service, received FDA clearance in 2009 and has been provided to over 500,000 patients,
accumulating more than 125 million hours of curated heartbeat data within iRhythm’s data repository
The ambulatory cardiac monitoring market is well-established with an estimated 4.6 million diagnostic tests performed
annually in the U.S. translating to a $1.4 billion market opportunity
Revenue was $36.1 million and $21.7 million for the years ended December 31, 2015 and 2014, respectively, a 66%
growth rate and $28.6 million and $15.9 million for the six months ended June 30, 2016 and 2015, respectively, an 80%
growth rate
Telehealth Outlook
Telehealth is evolving rapidly. The pace of adoption and integration of telehealth concepts into the patient / physician
relationship has never been higher. Moreover, the increased investment in technology across the healthcare continuum over the
past decade has created a unique opportunity for telehealth to continue to dramatically change the way in which healthcare
services are delivered. Stakeholders across healthcare continue to rapidly adopt telehealth solutions capable of delivering better
care in a more convenient setting at lower costs. While we are in the very early innings of realizing the opportunities afforded
by these solutions, it is clear that this dynamic, fast paced and complex sector has a unique opportunity to fundamentally and
positively change healthcare.
iRhythm Technologies (NasdaqGM: IRTC)
Stock Price $24.23
Shares Outstanding 21.1
Market Capitalization $511.8
Plus: Net Debt $22.4
Firm Value $534.2
Metric Multiple
2015A Revenue: $36.1 14.8x
2016 Run Rate Revenue: $60.3 8.9x(5%)
5%
15%
25%
35%
45%
55%
65%
10/20/16 10/23/16 10/26/16 10/29/16 11/1/16 11/4/16 11/7/16 11/10/16
IRTC vs. Market Indices
S&P 500 +1.1%
NASDAQ -0.1%
IRTC +42.5%

NOVEMBER 2016
COKER CAPITAL ADVISORS
Atlanta Charlotte New York - 11
-
Middle Market Healthcare M&A Activity
Middle market healthcare transaction activity remains robust. Strategic acquirors continue to put cash reserves built up during
the recession to work via acquisitions, and financial buyers continue to seek opportunities to put uninvested capital to work.
Friendly credit conditions and leverage levels continue to drive valuations for both buyer types. Within the healthcare industry,
the services sector, including provider services and clinical support, remains the sector with the most transaction activity for
strategic and financial investors alike. This is due to the fragmented nature of many services subsectors and the impact of
legislative actions, both positive and negative, that are driving continued deal activity.
Healthcare Public Equity Markets Update
Public equity market valuations remain strong for most healthcare subsectors.
154
198 195
145
190 192
133
-
50
100
150
200
250
2010 2011 2012 2013 2014 2015 2016YTD
Tra
nsa
ctio
n V
olu
me
$25-150m $150-400m $400-750m
$25.8
$36.3
$29.3
$23.4
$32.4 $32.6
$22.4
$0.0
$10.0
$20.0
$30.0
$40.0
2010 2011 2012 2013 2014 2015 2016YTD
Tra
nsa
ctio
n V
alue
$25-150m $150-400m $400-750m
19.3x
14.7x
13.3x 13.0x12.5x
12.0x11.4x
10.6x 10.5x 10.0x 9.6x 9.5x8.9x 8.8x 8.8x 8.8x
8.1x7.5x 7.4x 7.2x 7.1x
6.5x
0.0x
5.0x
10.0x
15.0x
20.0x
25.0x
En
terp
rise
Val
ue
/2016P
E
BIT
DA
Publicly Traded Healthcare Sector Valuations
Middle Market Healthcare M&A Volume by Deal Size Middle Market Healthcare M&A Value by Deal Size

NOVEMBER 2016
COKER CAPITAL ADVISORS
Atlanta Charlotte New York - 12
-
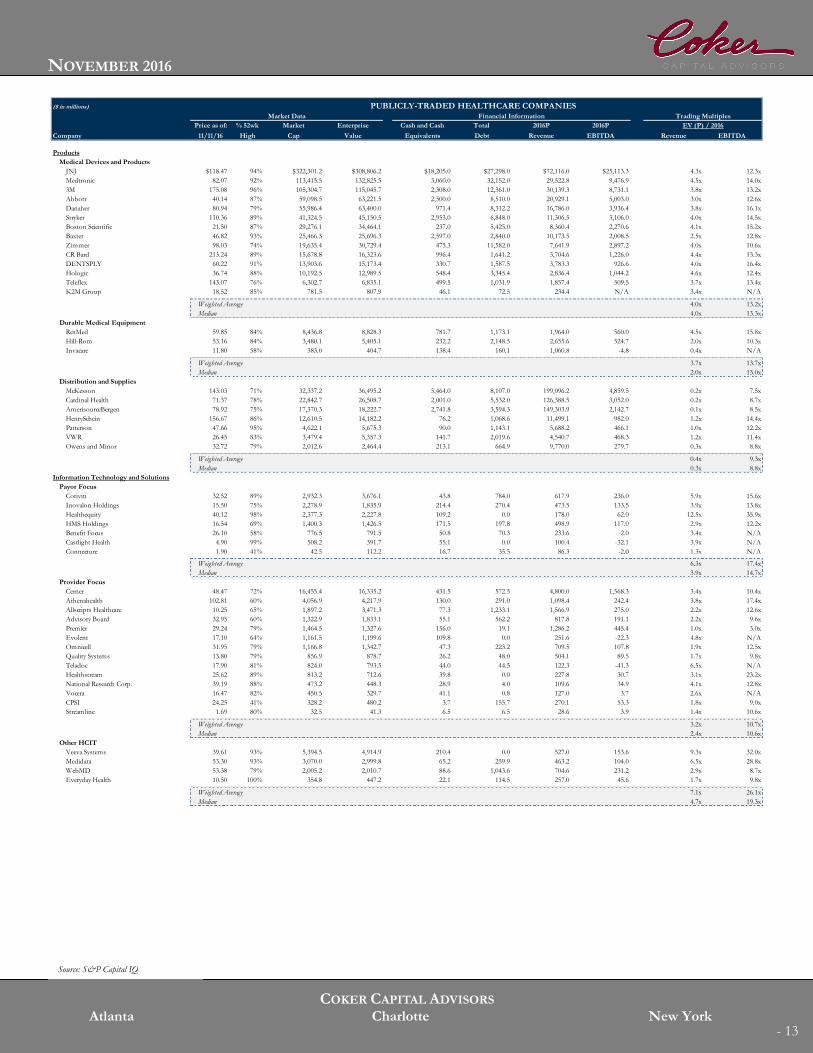
($ in millions) PUBLICLY-TRADED HEALTHCARE COMPANIES
Market Data Financial Information Trading Multiples
Price as of: % 52wk Market Enterprise Cash and Cash Total 2016P 2016P EV (P) / 2016
Company 11/11/16 High Cap Value Equivalents Debt Revenue EBITDA Revenue EBITDA
Provider Services
Acute-Care Hospitals
HCA $69.58 83% $26,070.6 $58,468.6 $677.0 $31,524.0 $41,557.0 $8,208.6 1.4x 7.1x
UHS 118.74 85% 11,512.4 15,168.5 61.7 3,640.2 9,758.6 1,697.0 1.6x 8.9x
Lifepoint Health 52.55 69% 2,110.2 4,933.5 240.9 2,910.7 6,392.1 748.9 0.8x 6.6x
Tenet Healthcare 14.55 41% 1,449.7 18,251.7 649.0 14,507.0 19,719.9 2,425.1 0.9x 7.5x
Community Health 4.87 16% 553.7 16,494.7 133.0 15,415.0 18,386.0 2,184.6 0.9x 7.6x
Quorum Health Corporation 4.72 27% 139.2 1,386.5 25.1 1,251.8 2,170.5 183.1 N/A N/A
Weighted Average 1.4x 7.6x
Median 0.9x 7.5x
Assisted Living and Long-Term Care
Brookdale Capital Senior 12.05 50% 2,242.0 8,398.5 74.2 6,230.9 4,981.6 802.2 1.7x 10.5x
Ensign Group 20.71 83% 1,048.8 1,172.5 40.4 170.6 1,658.0 157.4 0.7x 7.4x
National Healthcare Group 67.53 97% 1,023.0 1,007.9 19.2 151.1 N/A N/A N/A N/A
Kindred 6.55 42% 557.8 3,888.5 139.4 3,344.1 7,204.6 950.6 0.5x 4.1x
Capital Senior Living 14.73 62% 441.8 1,318.3 29.8 906.3 445.7 91.4 3.0x 14.4x
Five Star Quality Care 2.65 67% 131.2 133.6 43.2 60.9 1,381.2 28.0 0.1x 4.8x
Adcare Health Systems 1.58 49% 31.5 171.3 3.2 83.8 N/A N/A N/A N/A
Weighted Average 1.1x 7.4x
Median 0.7x 7.4x
ASC and Other Alternate Sites
VCA 60.79 82% 4,932.4 6,256.8 72.9 1,278.6 2,516.6 490.3 2.5x 12.8x
Amsurg 60.74 70% 3,265.0 6,651.7 106.1 2,613.9 3,160.0 593.8 2.1x 11.2x
SCA 40.61 77% 1,640.6 3,271.2 41.1 974.6 1,282.0 200.7 2.6x 16.3x
Surgery Partners 15.05 67% 729.8 2,569.7 55.2 0.0 1,139.0 182.1 2.3x 14.1x
Adeptus 9.71 13% 159.2 399.0 6.1 160.8 315.7 70.7 1.3x 5.6x
Nobilis 2.35 50% 234.5 284.9 19.6 48.2 284.3 50.4 1.0x 5.7x
Weighted Average 2.3x 12.7x
Median 2.2x 12.0x
Behavioral Health
UHS 118.74 85% 11,512.4 15,168.5 61.7 3,640.2 9,758.6 1,697.0 1.6x 8.9x
Acadia 38.78 55% 3,393.3 7,045.1 27.8 3,661.5 2,824.9 610.5 2.5x 11.5x
Civitas Solutions 19.85 66% 737.1 1,370.0 19.2 652.2 1,435.7 157.8 1.0x 8.7x
Providence Service Corp 37.93 69% 537.3 885.0 52.4 322.9 1,634.9 77.5 0.5x 11.4x
AAC 8.87 35% 210.3 378.4 13.3 189.9 278.0 48.0 1.4x 7.9x
Weighted Average 1.7x 9.5x
Median 1.4x 8.9x
Dialysis
Fresenius 73.31 86% 22,442.3 31,589.8 629.8 9,043.2 17,962.6 3,439.0 1.8x 9.2x
DaVita Healthcare 59.53 76% 11,952.3 20,683.5 913.5 9,124.8 14,766.3 2,561.4 1.4x 8.1x
American Renal Associates 19.57 66% 604.1 1,246.1 105.1 563.6 754.6 213.7 1.7x 5.8x
Weighted Average 1.6x 8.7x
Median 1.7x 8.1x
Physician Services and Management
Mednax 61.56 80% 5,702.1 7,427.6 52.8 1,788.8 3,196.9 670.1 2.3x 11.1x
Envision Healthcare 20.11 71% 3,767.0 6,726.9 190.0 3,080.3 6,564.5 706.7 1.0x 9.5x
Team Health 41.20 71% 3,068.0 5,744.7 15.3 2,689.1 4,666.9 490.0 1.2x 11.7x
Heathcare Services Group 36.15 86% 2,624.0 2,519.1 24.3 0.0 1,564.5 126.5 1.6x 19.9x
Weighted Average 1.7x 12.4x
Median 1.4x 11.4x
Rehabilitation
Healthsouth 39.58 91% 3,554.1 6,785.4 76.4 3,010.8 3,691.2 792.4 1.8x 8.6x
Select Medical 11.85 83% 1,568.1 4,512.2 68.2 2,675.0 4,288.0 473.0 1.1x 9.5x
US Physical Therapy 60.00 92% 751.3 826.1 15.0 41.5 356.3 54.5 2.3x 15.2x
The Joint Corp 2.54 37% 32.3 26.7 6.1 0.6 20.4 0.0 1.3x N/A
Agility Health - 0% 10.0 19.0 1.5 6.3 N/A N/A N/A N/A
Weighted Average 1.7x 9.6x
Median 1.6x 9.5x
Hospice and Home Care
Chemed 147.13 92% 2,387.0 2,476.4 21.3 110.6 1,582.3 236.3 1.6x 10.5x
Amedisys 41.12 75% 1,380.4 1,466.5 8.9 94.1 1,439.1 107.6 1.0x 13.6x
LHC Group 43.00 89% 781.6 875.2 16.5 92.6 913.8 87.0 1.0x 10.1x
Almost Family 41.10 92% 426.3 567.3 6.8 146.3 629.4 54.1 0.9x 10.5x
Addus 32.95 94% 374.5 360.0 39.4 25.0 399.6 30.8 0.9x 11.7x
Weighted Average 1.2x 11.3x
Median 1.0x 10.5x
Imaging
Radnet 6.80 85% 316.0 967.7 0.4 648.4 886.9 134.0 1.1x 7.2x
Alliance Healthcare 7.45 77% 80.0 687.6 19.6 533.9 N/A N/A N/A N/A
Weighted Average 0.9x 5.8x
Median 1.1x 7.2x
Source: S&P Capital IQ
NOVEMBER 2016
COKER CAPITAL ADVISORS
Atlanta Charlotte New York - 13
-
($ in millions) PUBLICLY-TRADED HEALTHCARE COMPANIESMarket Data Financial Information Trading Multiples
Price as of: % 52wk Market Enterprise Cash and Cash Total 2016P 2016P EV (P) / 2016
Company 11/11/16 High Cap Value Equivalents Debt Revenue EBITDA Revenue EBITDA
Products
Medical Devices and Products
JNJ $118.47 94% $322,301.2 $308,806.2 $18,205.0 $27,298.0 $72,116.0 $25,113.3 4.3x 12.3x
Medtronic 82.07 92% 113,415.5 132,825.5 3,060.0 32,152.0 29,522.8 9,476.9 4.5x 14.0x
3M 175.08 96% 105,304.7 115,045.7 2,308.0 12,361.0 30,139.3 8,731.1 3.8x 13.2x
Abbott 40.14 87% 59,098.5 63,221.5 2,500.0 8,510.0 20,929.1 5,003.0 3.0x 12.6x
Danaher 80.94 79% 55,986.4 63,400.0 971.4 8,312.2 16,786.0 3,936.4 3.8x 16.1x
Stryker 110.36 89% 41,324.5 45,150.5 2,953.0 6,848.0 11,306.5 3,106.0 4.0x 14.5x
Boston Scientific 21.50 87% 29,276.1 34,464.1 237.0 5,425.0 8,360.4 2,270.6 4.1x 15.2x
Baxter 46.82 93% 25,466.3 25,696.3 2,597.0 2,840.0 10,173.5 2,008.5 2.5x 12.8x
Zimmer 98.03 74% 19,635.4 30,729.4 475.3 11,582.0 7,641.9 2,897.2 4.0x 10.6x
CR Bard 213.24 89% 15,678.8 16,323.6 996.4 1,641.2 3,704.6 1,226.0 4.4x 13.3x
DENTSPLY 60.22 91% 13,903.6 15,173.4 330.7 1,587.5 3,783.3 926.6 4.0x 16.4x
Hologic 36.74 88% 10,192.5 12,989.5 548.4 3,345.4 2,836.4 1,044.2 4.6x 12.4x
Teleflex 143.07 76% 6,302.7 6,835.1 499.5 1,031.9 1,857.4 509.5 3.7x 13.4x
K2M Group 18.52 85% 781.5 807.9 46.1 72.5 234.4 N/A 3.4x N/A
Weighted Average 4.0x 13.2x
Median 4.0x 13.3x
Durable Medical Equipment
ResMed 59.85 84% 8,436.8 8,828.3 781.7 1,173.1 1,964.0 560.0 4.5x 15.8x
Hill-Rom 53.16 84% 3,480.1 5,405.1 232.2 2,148.5 2,655.6 524.7 2.0x 10.3x
Invacare 11.80 58% 383.0 404.7 138.4 160.1 1,060.8 -4.8 0.4x N/A
Weighted Average 3.7x 13.7x
Median 2.0x 13.0x
Distribution and Supplies
McKesson 143.03 71% 32,337.2 36,495.2 5,464.0 8,107.0 199,096.2 4,859.5 0.2x 7.5x
Cardinal Health 71.37 78% 22,842.7 26,508.7 2,001.0 5,532.0 126,388.5 3,052.0 0.2x 8.7x
AmerisourceBergen 78.92 75% 17,370.3 18,222.7 2,741.8 3,594.3 149,303.9 2,142.7 0.1x 8.5x
HenrySchein 156.67 86% 12,610.5 14,182.2 76.2 1,068.6 11,499.1 982.0 1.2x 14.4x
Patterson 47.66 95% 4,622.1 5,675.3 90.0 1,143.1 5,688.2 466.1 1.0x 12.2x
VWR 26.45 83% 3,479.4 5,357.3 141.7 2,019.6 4,540.7 468.3 1.2x 11.4x
Owens and Minor 32.72 79% 2,012.6 2,464.4 213.1 664.9 9,770.0 279.7 0.3x 8.8x
Weighted Average 0.4x 9.3x
Median 0.3x 8.8x
Information Technology and Solutions
Payor Focus
Cotiviti 32.52 89% 2,932.3 3,676.1 43.8 784.0 617.9 236.0 5.9x 15.6x
Inovalon Holdings 15.50 75% 2,278.9 1,835.9 214.4 270.4 473.5 133.5 3.9x 13.8x
Healthequity 40.12 98% 2,377.3 2,227.8 109.2 0.0 178.0 62.0 12.5x 35.9x
HMS Holdings 16.54 69% 1,400.3 1,426.5 171.5 197.8 498.9 117.0 2.9x 12.2x
Benefit Focus 26.10 58% 776.5 791.5 50.8 70.3 233.6 -2.0 3.4x N/A
Castlight Health 4.90 99% 508.2 391.7 55.1 0.0 100.4 -32.1 3.9x N/A
Connecture 1.90 41% 42.5 112.2 16.7 35.5 86.3 -2.0 1.3x N/A
Weighted Average 6.3x 17.4x
Median 3.9x 14.7x
Provider Focus
Cerner 48.47 72% 16,455.4 16,335.2 431.5 572.5 4,800.0 1,568.3 3.4x 10.4x
Athenahealth 102.81 60% 4,056.9 4,217.9 130.0 291.0 1,098.4 242.4 3.8x 17.4x
Allscripts Healthcare 10.25 65% 1,897.2 3,471.3 77.3 1,233.1 1,566.9 275.0 2.2x 12.6x
Advisory Board 32.95 60% 1,322.9 1,833.1 55.1 562.2 817.8 191.1 2.2x 9.6x
Premier 29.24 79% 1,464.5 1,327.6 156.0 19.1 1,286.2 445.4 1.0x 3.0x
Evolent 17.10 64% 1,161.5 1,199.6 109.8 0.0 251.6 -22.3 4.8x N/A
Omnicell 31.95 79% 1,166.8 1,342.7 47.3 223.2 709.5 107.8 1.9x 12.5x
Quality Systems 13.80 79% 856.9 878.7 26.2 48.0 504.1 89.5 1.7x 9.8x
Teladoc 17.90 81% 824.0 793.5 44.0 44.5 122.3 -41.3 6.5x N/A
Healthstream 25.62 89% 813.2 712.6 39.8 0.0 227.8 30.7 3.1x 23.2x
National Research Corp. 39.19 88% 473.2 448.3 28.9 4.0 109.6 34.9 4.1x 12.8x
Vocera 16.47 82% 450.5 329.7 41.1 0.8 127.0 3.7 2.6x N/A
CPSI 24.25 41% 328.2 480.2 3.7 155.7 270.1 53.3 1.8x 9.0x
Streamline 1.69 80% 32.5 41.3 6.5 6.5 28.6 3.9 1.4x 10.6x
Weighted Average 3.2x 10.7x
Median 2.4x 10.6x
Other HCIT
Veeva Systems 39.61 93% 5,394.5 4,914.9 210.4 0.0 527.0 153.6 9.3x 32.0x
Medidata 53.30 93% 3,070.0 2,999.8 65.2 259.9 463.2 104.0 6.5x 28.8x
WebMD 53.38 79% 2,005.2 2,010.7 88.6 1,043.6 704.6 231.2 2.9x 8.7x
Everyday Health 10.50 100% 354.8 447.2 22.1 114.5 257.0 45.6 1.7x 9.8x
Weighted Average 7.1x 26.1x
Median 4.7x 19.3x
Source: S&P Capital IQ

NOVEMBER 2016
COKER CAPITAL ADVISORS
Atlanta Charlotte New York - 14
-
($ in millions) PUBLICLY-TRADED HEALTHCARE COMPANIESMarket Data Financial Information Trading Multiples
Price as of: % 52wk Market Enterprise Cash and Cash Total 2016P 2016P EV (P) / 2016
Company 11/11/16 High Cap Value Equivalents Debt Revenue EBITDA Revenue EBITDA
Clinical and Patient Support Services
Clinical Laboratories
Labcorp $124.82 88% $12,856.5 $18,475.9 $567.6 $6,171.4 $9,401.3 $1,913.9 2.0x 9.7x
Quest Diagnostics 81.46 94% 11,293.6 14,821.6 406.0 3,827.0 7,510.0 1,480.5 2.0x 10.0x
Sonic Healthcare 21.45 89% 8,922.5 11,276.9 290.4 2,575.0 5,091.1 898.0 2.2x 12.6x
Psychemedics 23.95 94% 130.8 131.9 4.1 5.2 N/A N/A N/A N/A
Weighted Average 2.0x 10.5x
Median 2.0x 10.0x
Contract Research Organizations
Quintiles Transnational 77.13 95% 18,988.0 20,419.7 1,209.7 2,449.8 5,382.9 1,161.0 3.8x 17.6x
Icon 80.19 94% 4,476.8 4,574.5 219.3 401.4 1,674.3 380.0 2.7x 12.0x
Pantheon 27.71 89% 4,020.0 5,994.0 738.8 2,712.8 1,920.2 432.8 3.1x 13.9x
PRA Health 55.17 91% 3,387.9 4,141.6 130.3 884.1 1,571.5 291.0 2.6x 14.2x
Charles River 74.63 84% 3,532.1 4,697.8 105.7 1,259.2 1,656.5 403.7 2.8x 11.6x
Parexel 55.73 78% 2,976.3 3,229.1 0.0 501.4 2,119.3 369.1 1.5x 8.7x
INC Reaseach 50.50 88% 2,707.6 3,102.6 102.9 497.9 1,036.3 243.4 3.0x 12.7x
MedPace 34.35 98% 1,398.7 1,567.7 14.6 183.6 N/A N/A N/A N/A
Albany Molecular 17.26 84% 717.8 1,315.0 44.8 606.1 603.7 107.8 2.2x 12.2x
Weighted Average 3.1x 14.3x
Median 2.8x 12.5x
Staffing
On Assignment 40.16 83% 2,126.0 2,767.6 17.0 658.6 2,433.4 287.1 1.1x 9.6x
AMN Health Services 30.05 67% 1,443.9 1,813.2 15.7 385.0 1,890.5 232.5 1.0x 7.8x
Cross Country Healthcare 14.00 75% 462.2 508.5 26.7 72.5 821.2 46.2 0.6x 11.0x
Weighted Average 1.0x 9.1x
Median 1.0x 9.6x
Commercial Payors
United Healthcare 146.42 99% 139,364.9 161,631.9 12,796.0 33,224.0 183,921.0 15,179.9 0.9x 10.6x
Aetna 119.28 96% 41,855.4 43,512.2 19,066.2 20,662.2 63,184.4 5,684.2 0.7x 7.7x
Anthem 133.68 90% 35,216.0 49,639.5 2,546.0 16,969.5 83,658.5 5,283.9 0.6x 9.4x
Cigna 133.67 90% 34,318.3 36,221.3 3,224.0 5,051.0 39,508.5 4,102.2 0.9x 8.8x
Humana 193.19 98% 28,804.9 26,310.9 6,769.0 4,275.0 55,053.0 3,292.9 0.5x 8.0x
Weighted Average 0.8x 9.5x
Median 0.7x 8.8x
Government Payors
Centene 50.68 67% 8,660.7 10,429.7 2,982.0 4,589.0 39,706.0 1,604.7 0.3x 6.5x
Wellcare 120.85 93% 5,352.4 2,471.4 3,878.4 997.4 14,260.2 675.3 0.2x 3.7x
Molina 47.53 70% 2,700.7 1,493.7 2,842.0 1,635.0 17,817.5 572.7 0.1x 2.6x
Magellan Health 64.80 90% 1,506.0 1,814.2 0.0 476.7 4,881.1 276.2 0.4x 6.6x
Universal American 8.44 99% 495.7 363.2 264.0 131.5 1,419.5 5.5 0.3x 65.7x
Weighted Average 0.2x 6.7x
Median 0.3x 6.5x
Other Outsourced Services
Magellan Healthcare 64.80 90% 1,506.0 1,814.2 0.0 476.7 4,881.1 276.2 0.4x 6.6x
Air Methods 31.60 69% 1,150.0 2,078.2 7.4 935.7 1,170.8 291.2 1.8x 7.1x
Healthways 22.50 82% 870.4 1,120.3 0.7 250.5 501.5 103.1 2.2x 10.9x
Corvel 32.00 60% 623.8 582.9 40.9 0.0 N/A N/A N/A N/A
Weighted Average 1.1x 6.6x
Median 1.8x 7.1x
Specialty Pharmacy Services
CVS Health 75.09 70% 80,078.9 104,553.9 2,189.0 26,733.0 178,036.0 12,994.0 0.6x 8.0x
Express Scripts 74.59 84% 45,993.8 59,806.3 2,304.7 16,108.5 101,670.5 7,261.3 0.6x 8.2x
Diplomat Pharmacy 14.63 38% 964.5 1,102.4 17.1 154.4 4,501.5 108.2 0.2x 10.2x
PharMerica 24.15 68% 743.4 1,127.4 6.5 390.5 2,084.7 128.2 0.5x 8.8x
BioScrip 1.36 40% 160.0 663.1 2.8 436.2 931.0 28.3 0.7x 23.4x
Weighted Average 0.6x 8.2x
Median 0.6x 8.8x
Source: S&P Capital IQ

ABOUT OUR FIRM
Coker Capital Advisors is a healthcare-focused
investment banking firm. With offices in Atlanta,
Charlotte, and New York, we provide mergers and
acquisitions, capital raising, and strategic advisory
services to middle market healthcare companies. Our
team combines investment banking, private equity,
legal, and management consulting experience within the
healthcare industry. Our senior professionals average
more than a decade of healthcare transaction
experience and have completed over 200 transactions
across a wide range of healthcare subsectors with an
aggregate transaction value in excess of $25 billion.
CONTACT US
For more information on market activity throughout
the healthcare industry, or to discuss how Coker
Capital Advisors may be able to add value to your
company, please contact any member of our team:
www.cokercapital.com/index.php/leadership
N
Atlanta 2400 Lakeview Parkway, Suite 400
Alpharetta, GA 30009 (678) 832-2000
Charlotte 121 W. Trade Street, Suite 2175
Charlotte, NC 28202 (704) 812-1299
New York 125 Park Avenue, 25th Floor
New York, NY 10017 (212) 776-4935