monthly cocoa report - intl fcstone · pdf filemonthly cocoa report november 2016 translated...
TRANSCRIPT
Monthly Cocoa Report
November 2016
Translated from its original source in Portuguese

FUTURES MARKET
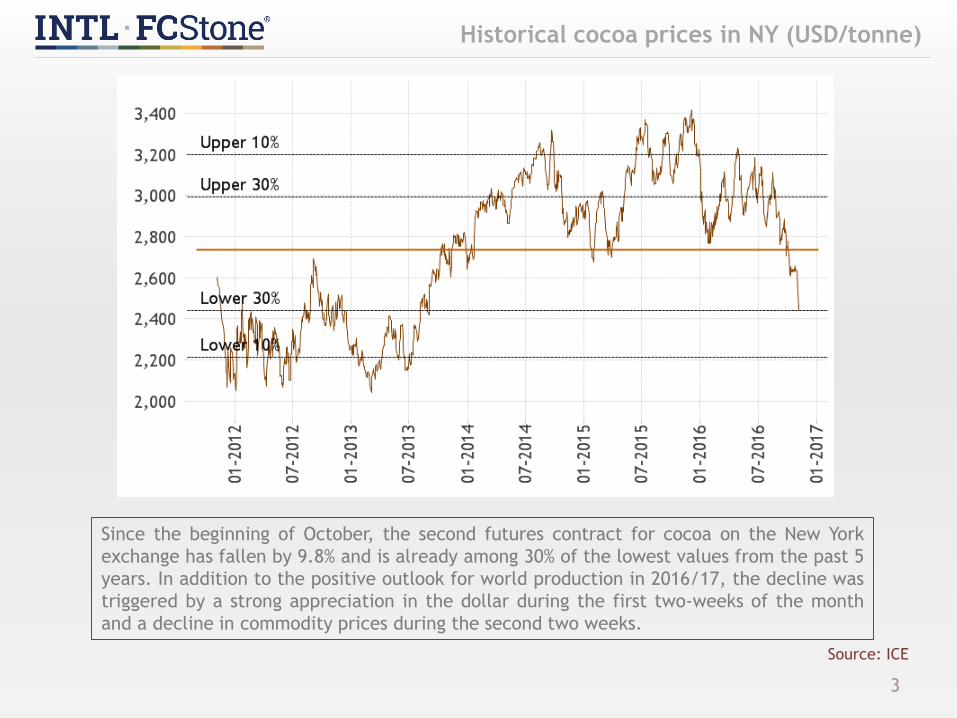
Historical cocoa prices in NY (USD/tonne)
3
Source: ICE
Since the beginning of October, the second futures contract for cocoa on the New York
exchange has fallen by 9.8% and is already among 30% of the lowest values from the past 5
years. In addition to the positive outlook for world production in 2016/17, the decline was
triggered by a strong appreciation in the dollar during the first two-weeks of the month
and a decline in commodity prices during the second two weeks.

Seasonality of cocoa prices in NY (USD/tonne)
4
Source: ICE
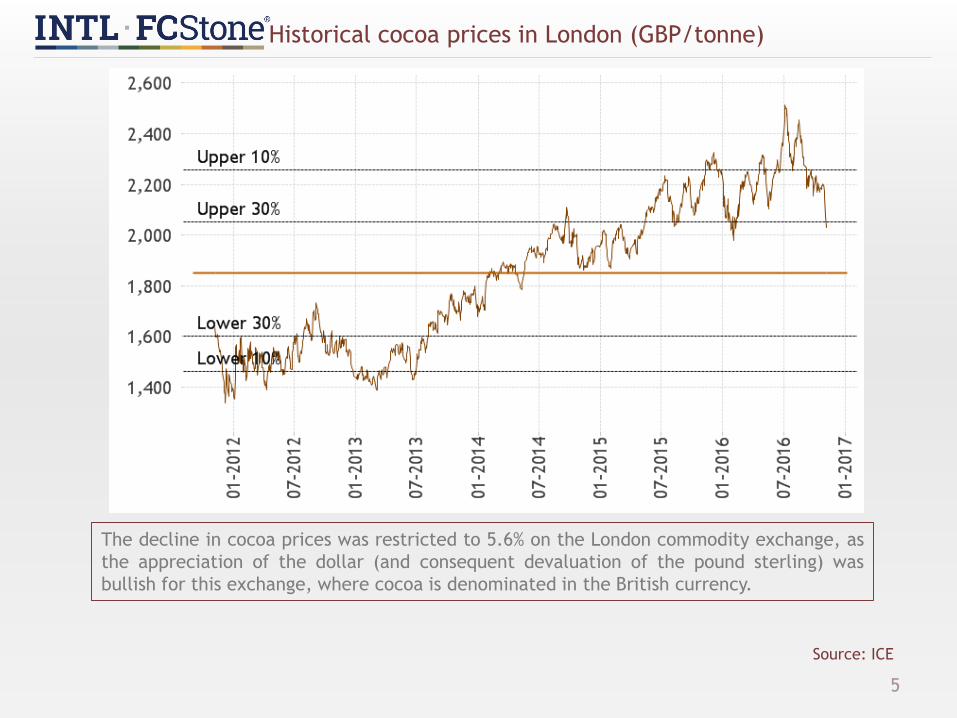
Historical cocoa prices in London (GBP/tonne)
5
Source: ICE
The decline in cocoa prices was restricted to 5.6% on the London commodity exchange, as
the appreciation of the dollar (and consequent devaluation of the pound sterling) was
bullish for this exchange, where cocoa is denominated in the British currency.
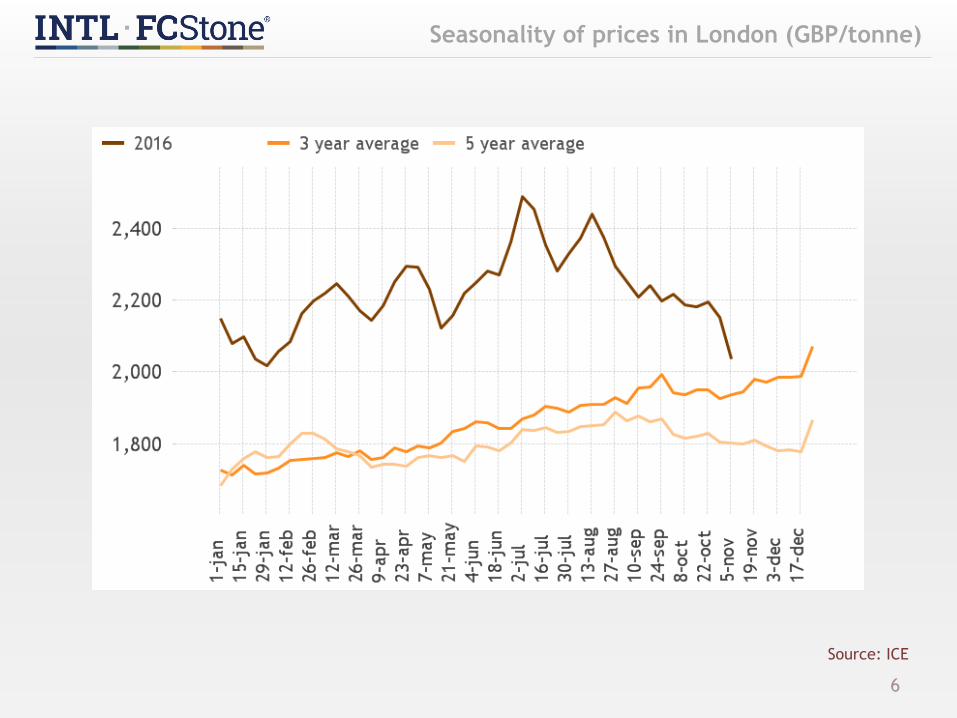
Seasonality of prices in London (GBP/tonne)
6
Source: ICE
Future contracts curve
7
Source: ICE
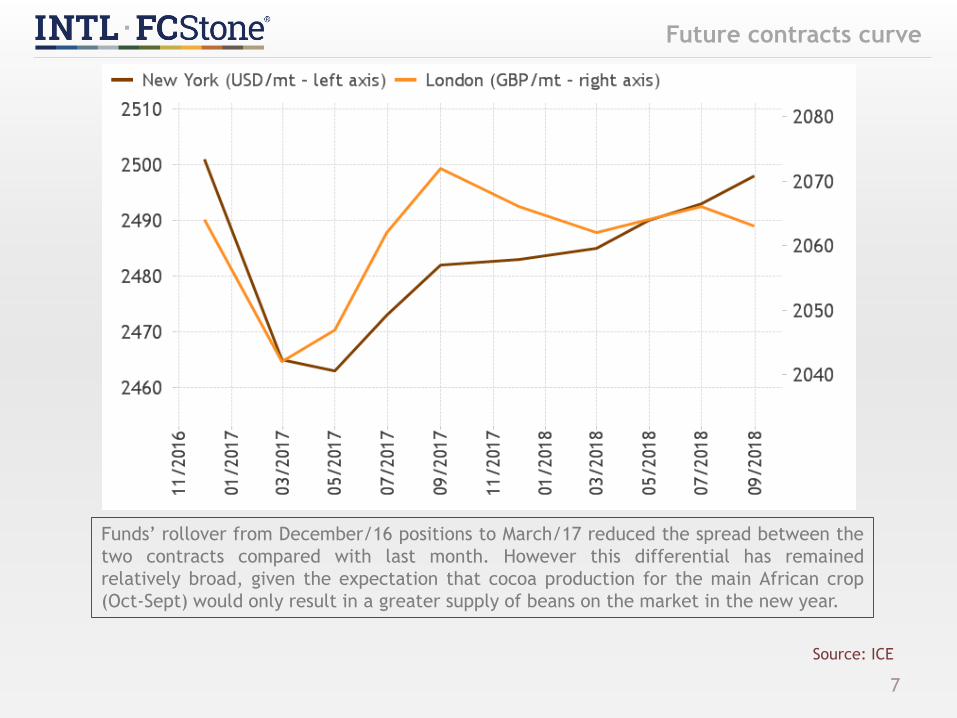
Funds’ rollover from December/16 positions to March/17 reduced the spread between the
two contracts compared with last month. However this differential has remained
relatively broad, given the expectation that cocoa production for the main African crop
(Oct-Sept) would only result in a greater supply of beans on the market in the new year.
London Arbitrage - New York (USD/tonne)
8
Source: ICE
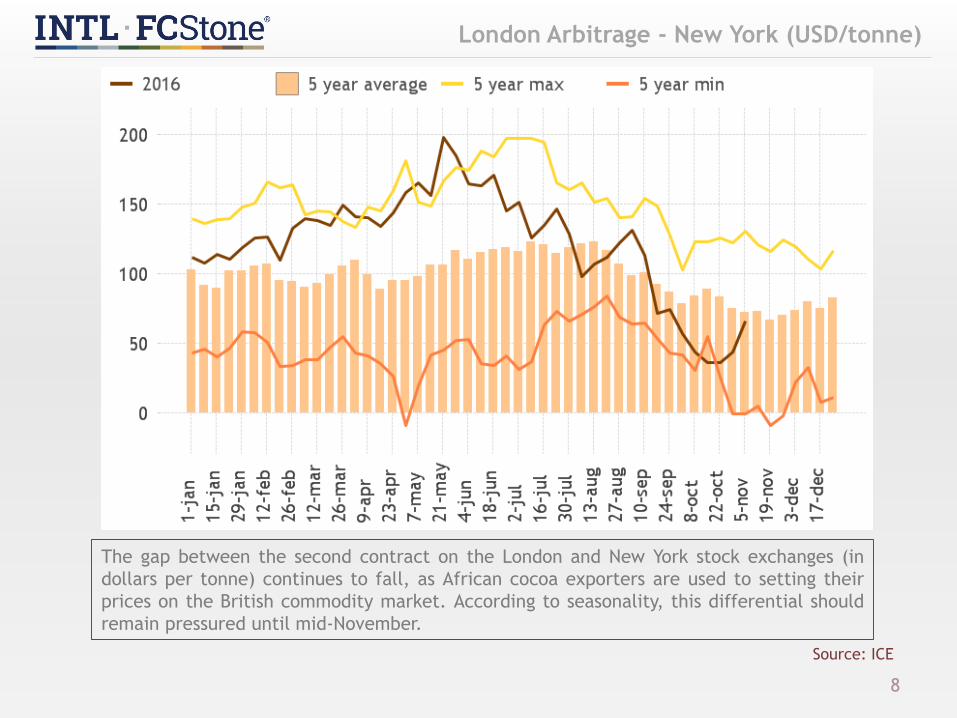
The gap between the second contract on the London and New York stock exchanges (in
dollars per tonne) continues to fall, as African cocoa exporters are used to setting their
prices on the British commodity market. According to seasonality, this differential should
remain pressured until mid-November.

Position of Funds - ICE
9
Source: ICE, CFTC, INTL FCStone
SPECULATIVES COMMERCIALS
Posi
ção líq
uid
a
Pre
ço
Posi
ção líq
uid
a
Pre
ço
Following the decline in quotes in September, the speculative funds expanded their long
positions in cocoa by 11,174 lots during October, accumulating a total of 82,323 contracts
by November 1st. This has been the longest exposure to long cocoa contracts from the
funds since May, a time when supply fundamentals were much more bullish. This strong
exposure at a time of consolidation of surplus expectations and a possible record in world
production opens the door for intense liquidation movements and with that, a decline in
prices (which was probably the cause of the sudden devaluation in beans between 4th and
7th of November, a period which has not yet considered by CFTC data).
The short position of the funds also advanced, but by 8,732 lots, totaling 64,265 contracts.
Cocoa Correlation v CRB Reuters
10
Source: INTL FCStone, Reuters
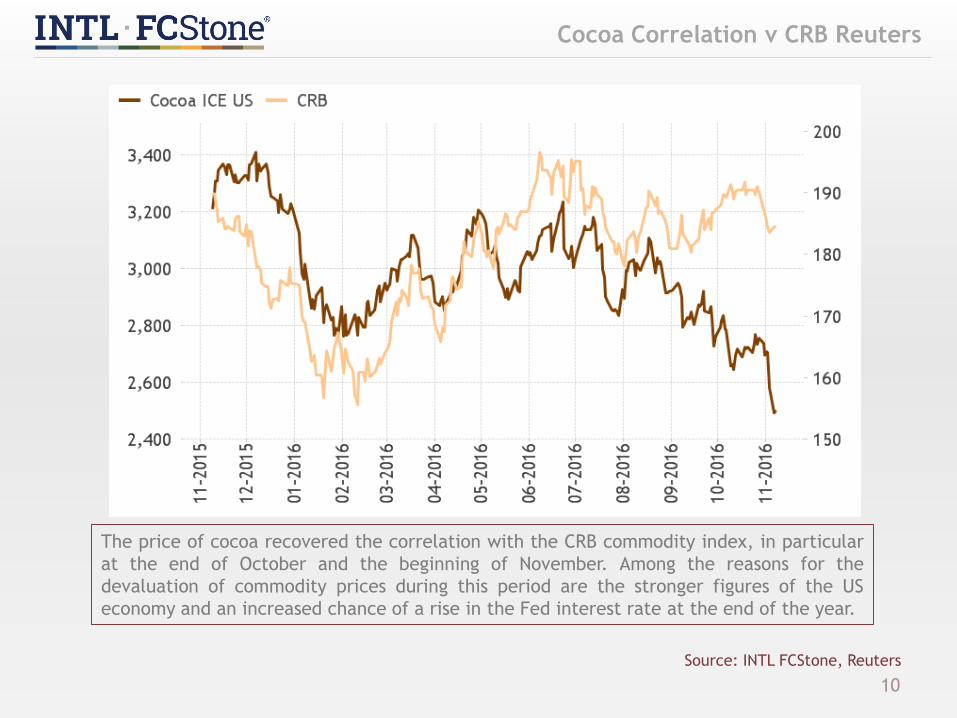
The price of cocoa recovered the correlation with the CRB commodity index, in particular
at the end of October and the beginning of November. Among the reasons for the
devaluation of commodity prices during this period are the stronger figures of the US
economy and an increased chance of a rise in the Fed interest rate at the end of the year.
Correlation Cocoa v Euro
11
Source: INTL FCStone, Reuters

Correlation Cocoa v Pound
12
Source: INTL FCStone, Reuters

MARKET FUNDAMENTALS

Fundamentals of the Cocoa Market
14
BEARISH FACTORS
• Favorable weather for the
development of cocoa in Africa and
Indonesia.
• Surplus outlook in the supply and
demand balance for 2016/17 crop.
• Devaluation of Pound Sterling
following "Brexit" and an increased
US and UK interest rate differential.
BULLISH FACTORS
• Demand growth for grinding in
Europe, North America and Asia.
• Grinders project that shortages of
cocoa stocks should persist until the
end of the year.
• 2015/16 has the lowest carryover
stock in 30 years.
• Fourth quarter should see growth in
chocolate consumption.
• Start of harvest slower than
expected in Africa.
Weather - West Africa
15
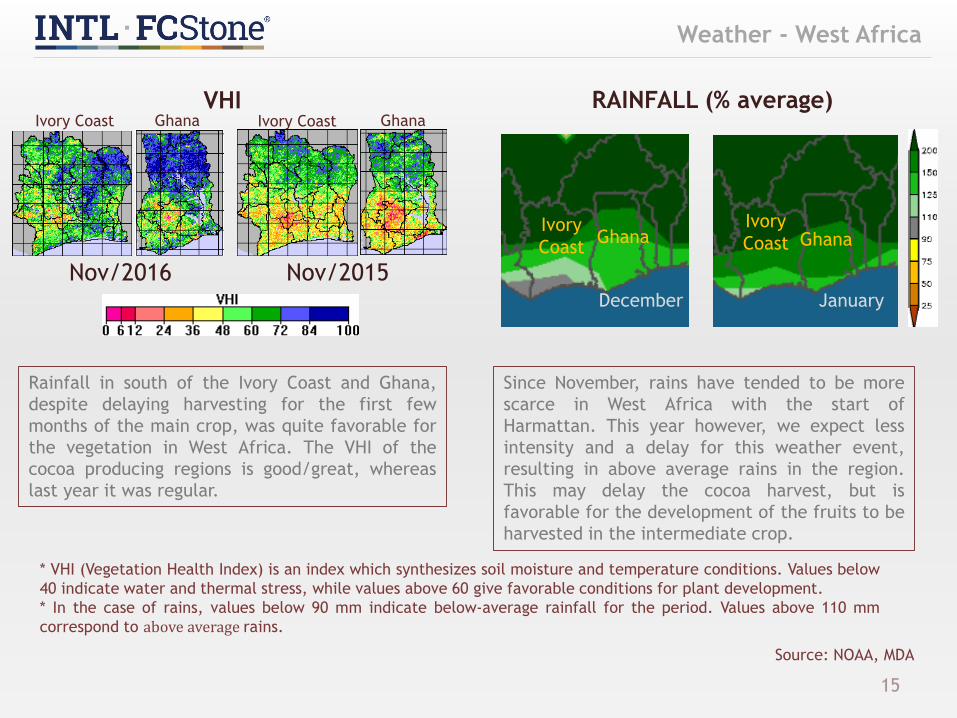
Rainfall in south of the Ivory Coast and Ghana,
despite delaying harvesting for the first few
months of the main crop, was quite favorable for
the vegetation in West Africa. The VHI of the
cocoa producing regions is good/great, whereas
last year it was regular.
Source: NOAA, MDA
VHI RAINFALL (% average)
Since November, rains have tended to be more
scarce in West Africa with the start of
Harmattan. This year however, we expect less
intensity and a delay for this weather event,
resulting in above average rains in the region.
This may delay the cocoa harvest, but is
favorable for the development of the fruits to be
harvested in the intermediate crop.
* VHI (Vegetation Health Index) is an index which synthesizes soil moisture and temperature conditions. Values below
40 indicate water and thermal stress, while values above 60 give favorable conditions for plant development.
* In the case of rains, values below 90 mm indicate below-average rainfall for the period. Values above 110 mm
correspond to above average rains.
Nov/2016 Nov/2015December January
Ivory
Coast
Ivory
CoastGhana Ghana
Ivory Coast Ivory CoastGhana Ghana
Weather – Indonésia
16
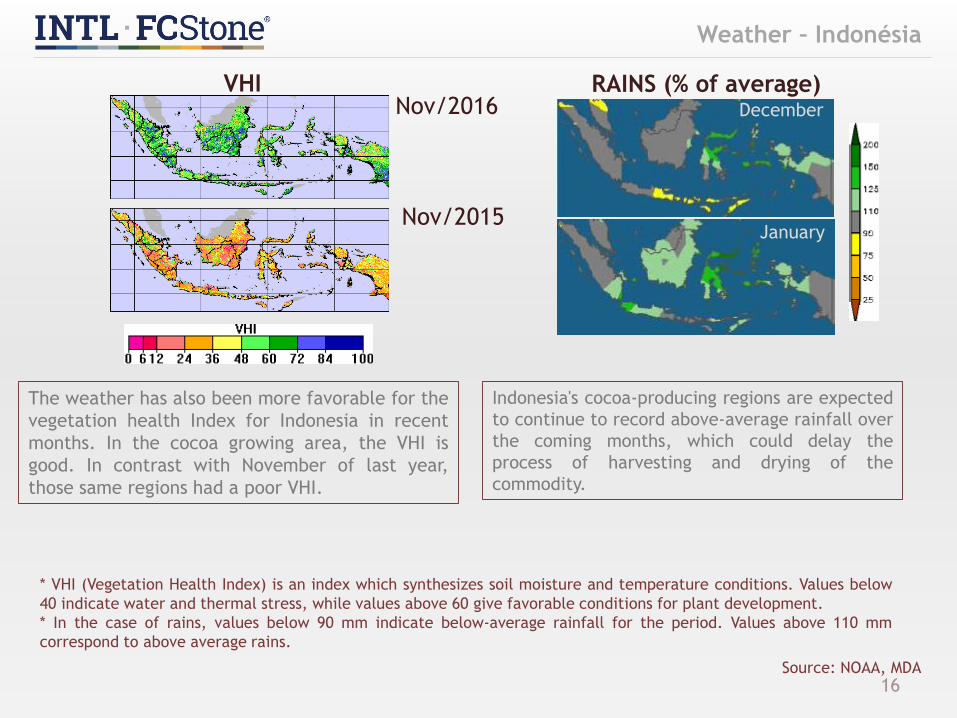
The weather has also been more favorable for the
vegetation health Index for Indonesia in recent
months. In the cocoa growing area, the VHI is
good. In contrast with November of last year,
those same regions had a poor VHI.
Source: NOAA, MDA
VHI RAINS (% of average)
Indonesia's cocoa-producing regions are expected
to continue to record above-average rainfall over
the coming months, which could delay the
process of harvesting and drying of the
commodity.
* VHI (Vegetation Health Index) is an index which synthesizes soil moisture and temperature conditions. Values below
40 indicate water and thermal stress, while values above 60 give favorable conditions for plant development.
* In the case of rains, values below 90 mm indicate below-average rainfall for the period. Values above 110 mm
correspond to above average rains.
December
January
Nov/2016
Nov/2015
Balance of Supply & Demand
17
Source: LMC, USDA, ICCO, FAO, INTL FCStone.
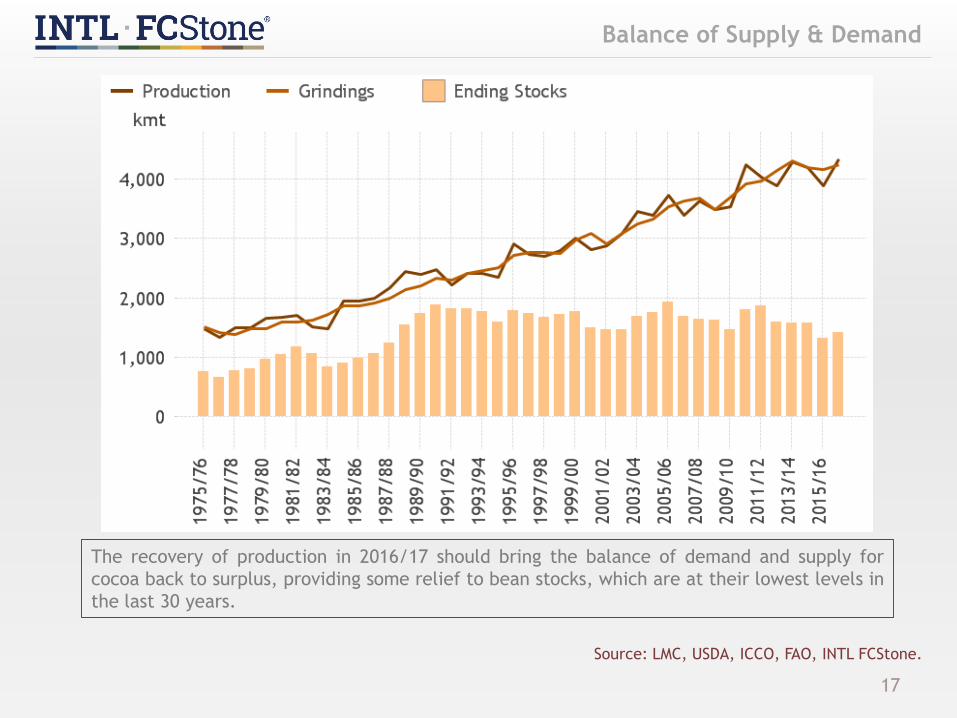
The recovery of production in 2016/17 should bring the balance of demand and supply for
cocoa back to surplus, providing some relief to bean stocks, which are at their lowest levels in
the last 30 years.
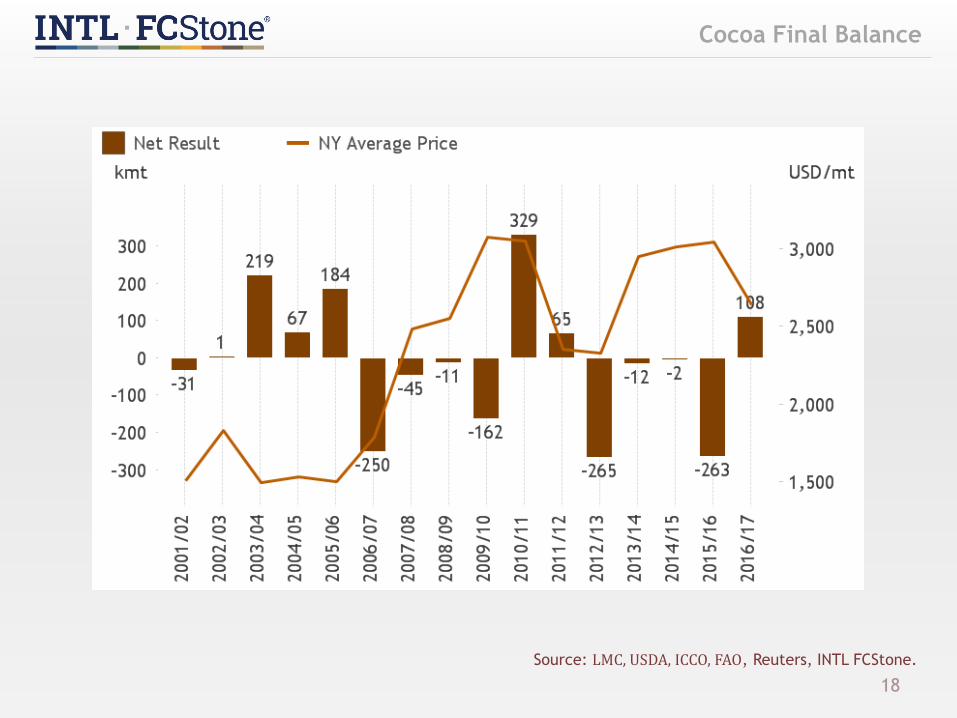
Cocoa Final Balance
18
Source: LMC, USDA, ICCO, FAO, Reuters, INTL FCStone.
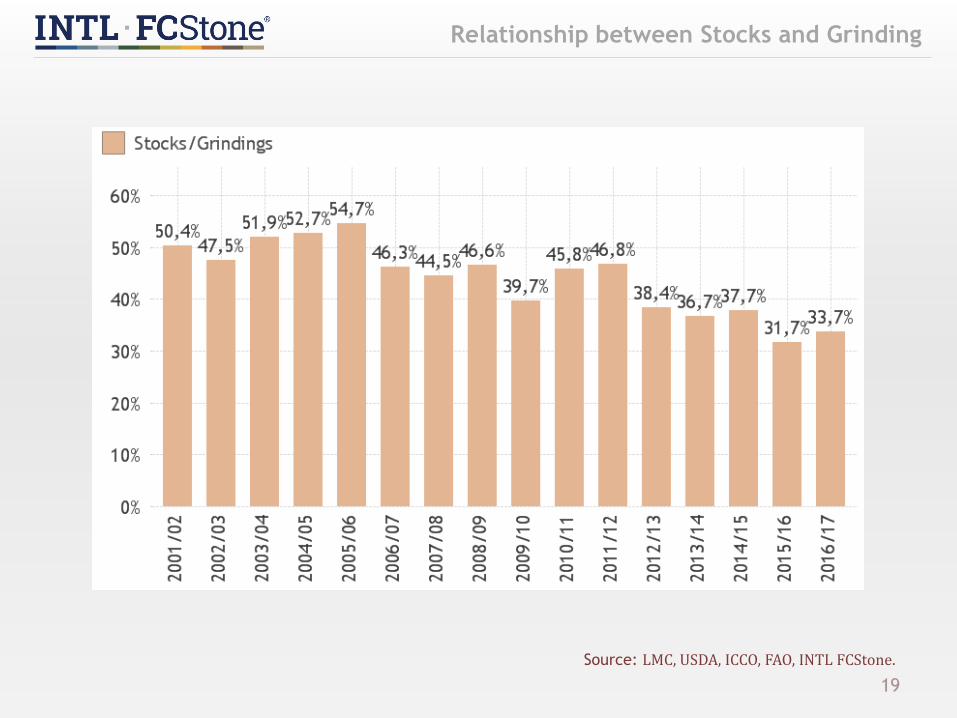
Relationship between Stocks and Grinding
19
Source: LMC, USDA, ICCO, FAO, INTL FCStone.
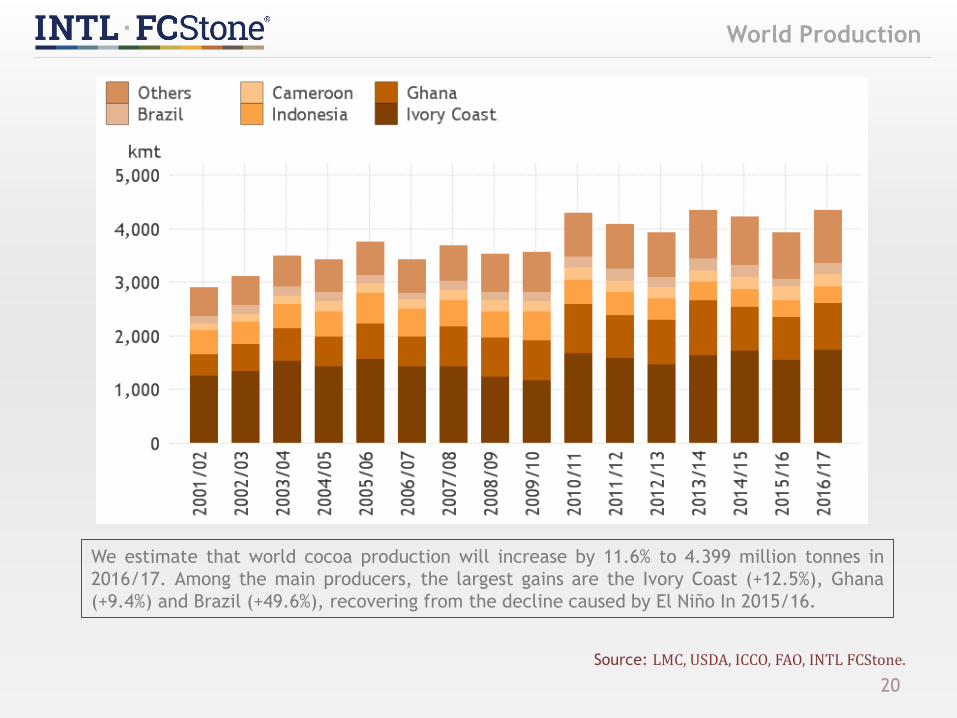
World Production
20
Source: LMC, USDA, ICCO, FAO, INTL FCStone.
We estimate that world cocoa production will increase by 11.6% to 4.399 million tonnes in
2016/17. Among the main producers, the largest gains are the Ivory Coast (+12.5%), Ghana
(+9.4%) and Brazil (+49.6%), recovering from the decline caused by El Niño In 2015/16.

Cocoa deliveries to ports in Ivory Coast
21
Source: INTL FCStone, CCC, Reuters, LMC International
0
200
400
600
800
1000
1200
1400
1600
1800
7-O
ct
21-O
ct
4-N
ov
18-N
ov
2-D
ec
16-D
ec
30-D
ec
13-J
an
27-J
an
10-F
eb
24-F
eb
10-M
ar
24-M
ar
7-A
pr
21-A
pr
5-M
ay
19-M
ay
2-J
un
16-J
un
30-J
un
14-J
ul
28-J
ul
11-A
ug
25-A
ug
8-S
ep
22-S
ep
(1,0
00 t
onnes)
3 year average 2015/16 2016/17
Crop (thousand
tonnes)2011/12 2011/12 2013/14 2014/15 2015/16
Ivory Coast 1476 1435 1743 1794 1568
Abidjan 590 574 697 718 628
San Pedro 885 861 1046 1076 940
Ghana 879 835 897 740 790
Brazil 219 179 228 226 146
Bahia 155 133 169 157 99
Other States 64 46 59 68 48
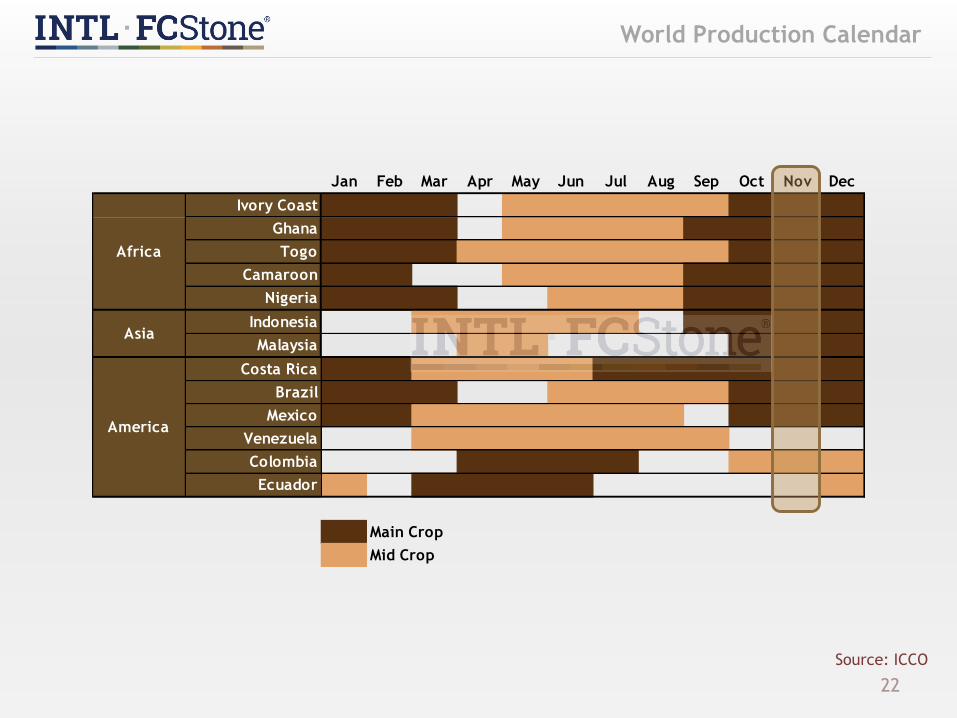
World Production Calendar
22
Source: ICCO
Jan Feb Mar Apr May Jun Jul Aug Sep Oct Nov Dec
Ivory Coast
Ghana
Togo
Camaroon
Nigeria
Indonesia
Malaysia
Costa Rica
Brazil
Mexico
Venezuela
Colombia
Ecuador
Main Crop
Mid Crop
America
Africa
Asia

World Crushing
23
Source: LMC, USDA, ICCO, FAO, INTL FCStone.
After a 0.7% decline between 2014/15 and 2015/16, we estimate that worldwide demand for
cocoa for crushing will increase by 1.8% in 2016/17 to hit 4,231 million tonnes.
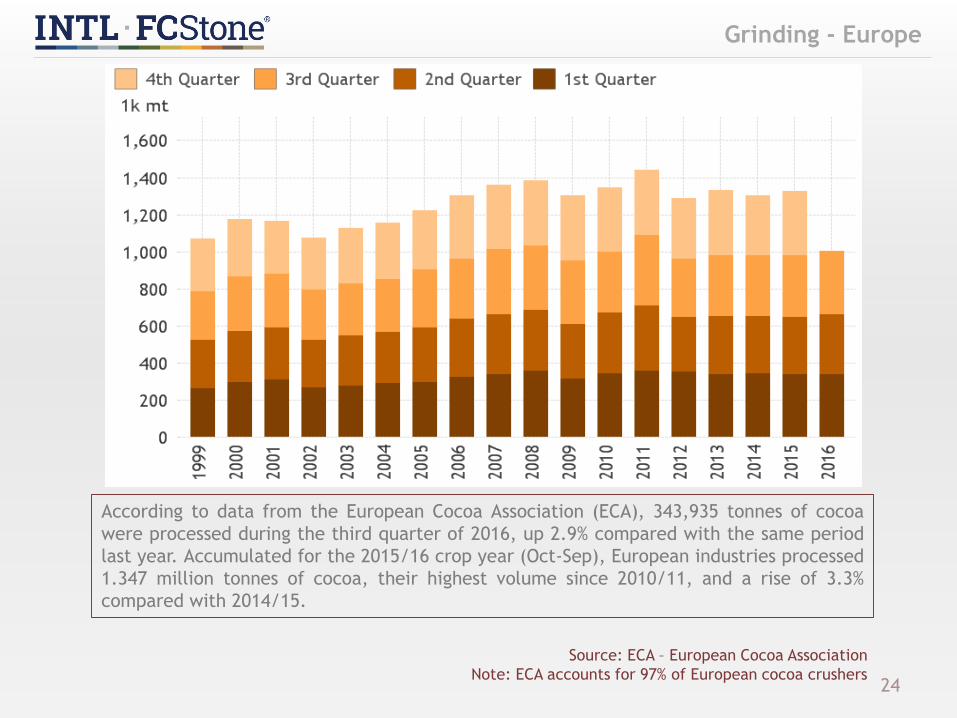
Grinding - Europe
24
Source: ECA – European Cocoa Association
Note: ECA accounts for 97% of European cocoa crushers
According to data from the European Cocoa Association (ECA), 343,935 tonnes of cocoa
were processed during the third quarter of 2016, up 2.9% compared with the same period
last year. Accumulated for the 2015/16 crop year (Oct-Sep), European industries processed
1.347 million tonnes of cocoa, their highest volume since 2010/11, and a rise of 3.3%
compared with 2014/15.
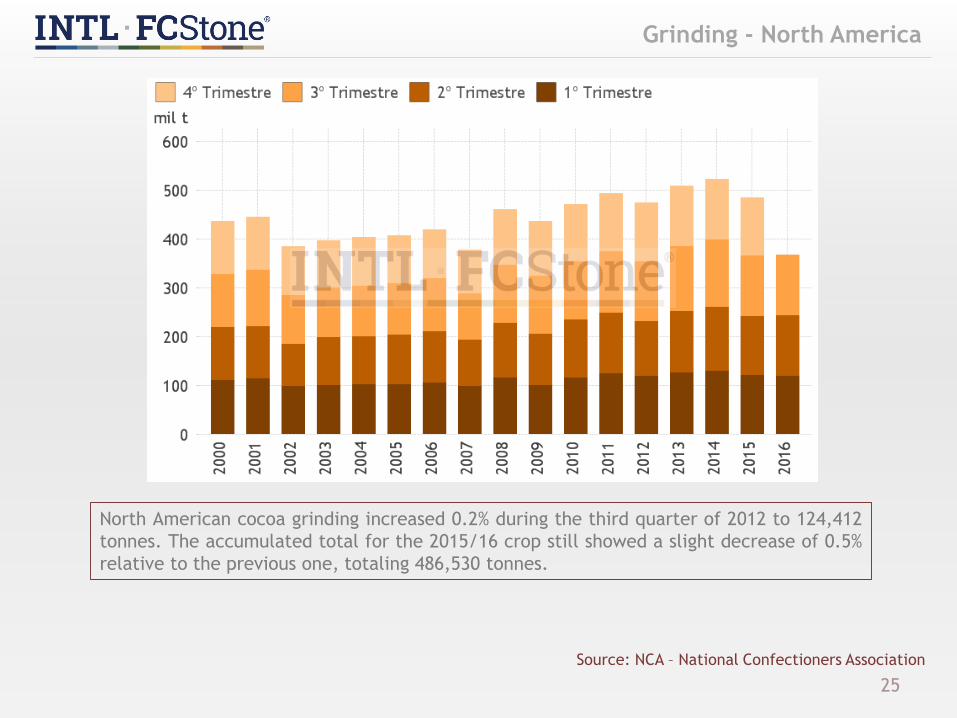
Grinding - North America
25
Source: NCA – National Confectioners Association
North American cocoa grinding increased 0.2% during the third quarter of 2012 to 124,412
tonnes. The accumulated total for the 2015/16 crop still showed a slight decrease of 0.5%
relative to the previous one, totaling 486,530 tonnes.
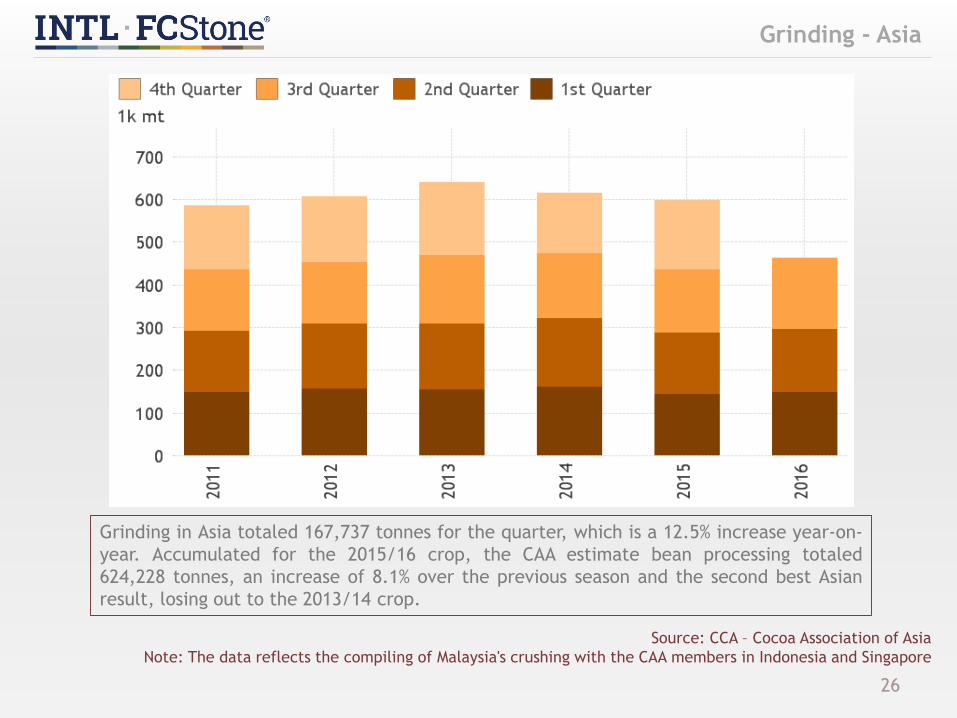
Grinding - Asia
26
Source: CCA – Cocoa Association of Asia
Note: The data reflects the compiling of Malaysia's crushing with the CAA members in Indonesia and Singapore
Grinding in Asia totaled 167,737 tonnes for the quarter, which is a 12.5% increase year-on-
year. Accumulated for the 2015/16 crop, the CAA estimate bean processing totaled
624,228 tonnes, an increase of 8.1% over the previous season and the second best Asian
result, losing out to the 2013/14 crop.
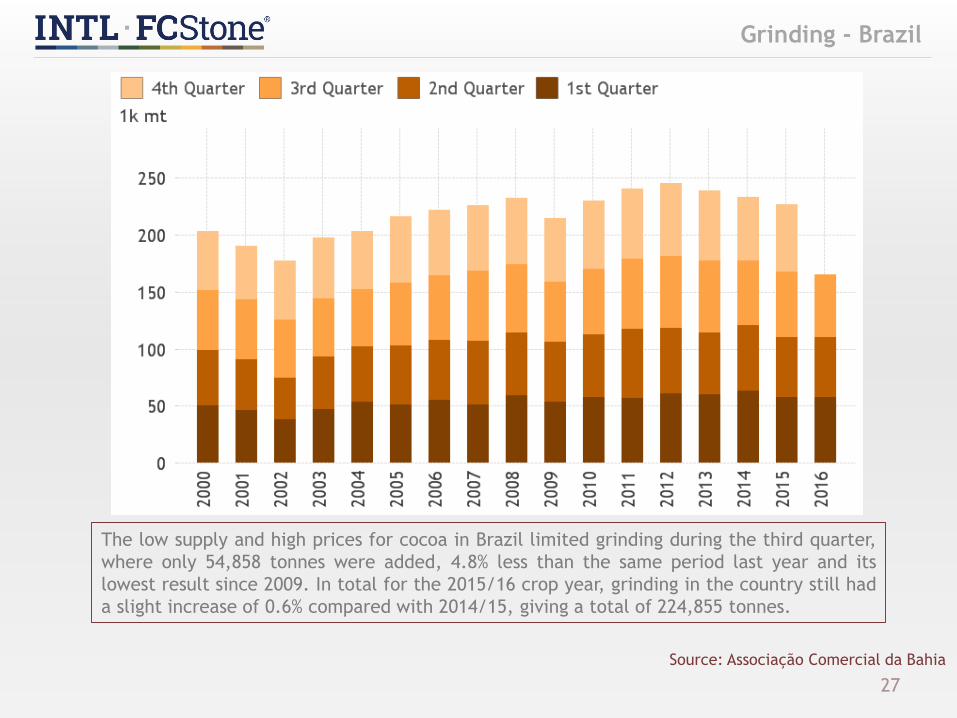
Grinding - Brazil
27
Source: Associação Comercial da Bahia
The low supply and high prices for cocoa in Brazil limited grinding during the third quarter,
where only 54,858 tonnes were added, 4.8% less than the same period last year and its
lowest result since 2009. In total for the 2015/16 crop year, grinding in the country still had
a slight increase of 0.6% compared with 2014/15, giving a total of 224,855 tonnes.

PHYSICAL MARKET
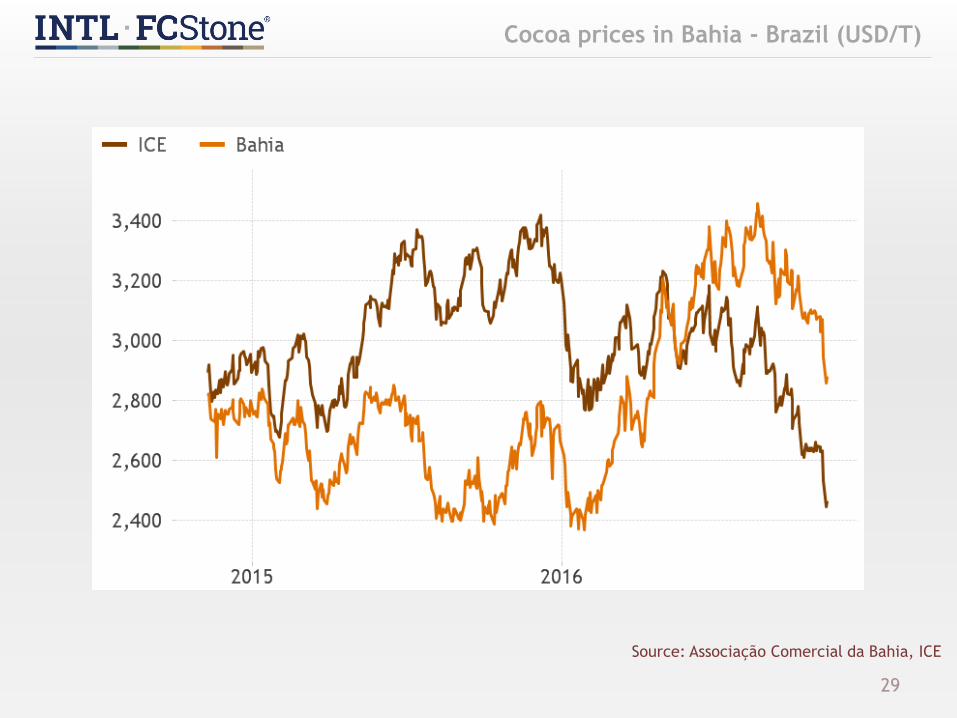
Cocoa prices in Bahia - Brazil (USD/T)
29
Source: Associação Comercial da Bahia, ICE
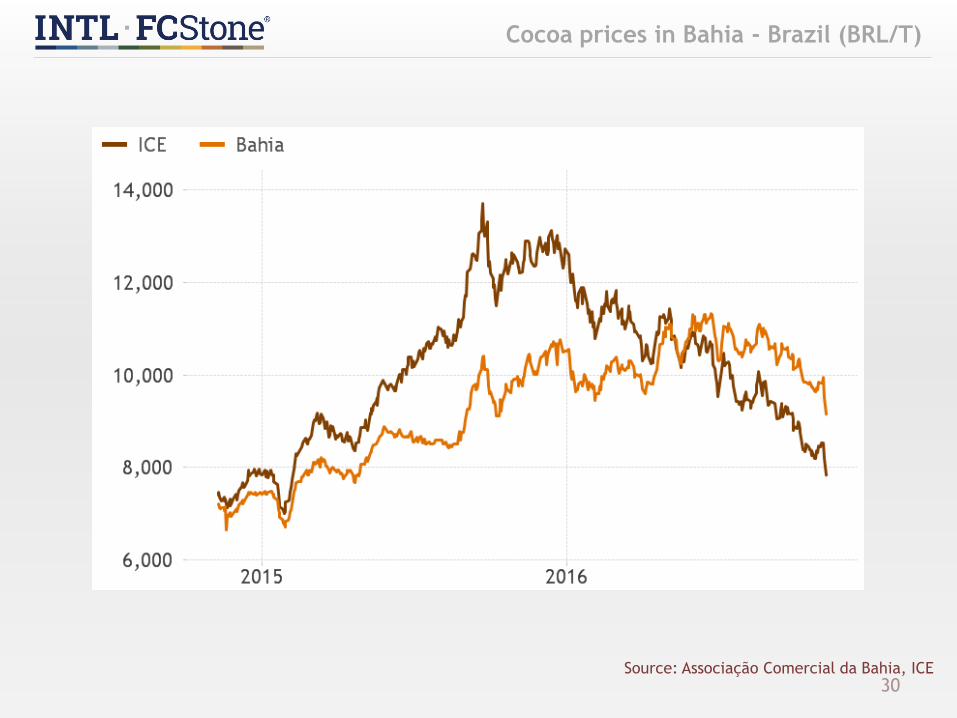
Cocoa prices in Bahia - Brazil (BRL/T)
30Source: Associação Comercial da Bahia, ICE

Cacao Premium in Bahia - Brazil (USD/T)
31Source: Associação Comercial da Bahia, ICE
The price of cocoa in Brazil continues to show high premiums relative to the international
market, due to a weak harvest in early 2016. Between the months of April and August of
this year, it was estimated that the Brazilian production of cocoa was at 59,000 tonnes, in
comparison with 125,000 tonnes during the same period in 2015, a decrease of 52.8%.
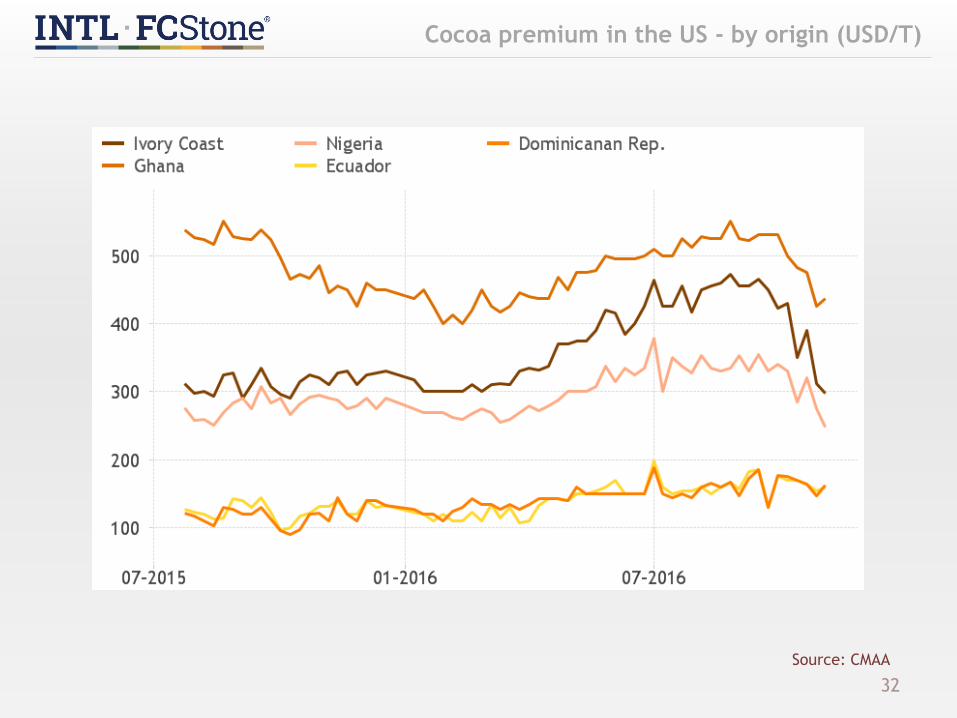
Cocoa premium in the US - by origin (USD/T)
32
Source: CMAA

COCOA BY-PRODUCTS

By-product ratios - US
34
The values indicate the ratio between the price of the product and the price of cocoa in beans.
The percentages in the product names indicates the amount of butter.
Source: CMAA, Milling and Baking News
Product Oct-16 Sep-16 Change
Butterfat 2,65 2,75 -0,10
Cake 0,79 0,74 0,05
10-12% Natural Powder 0,83 0,81 0,03
16-18% Natural Powder 1,00 0,97 0,03
22-24% Natural Powder 1,04 1,01 0,04
10-12% Alkalized Powder 0,96 0,93 0,03
Red Alkalized Powder 1,00 0,97 0,03
Black Alkalized Powder 1,28 1,23 0,04
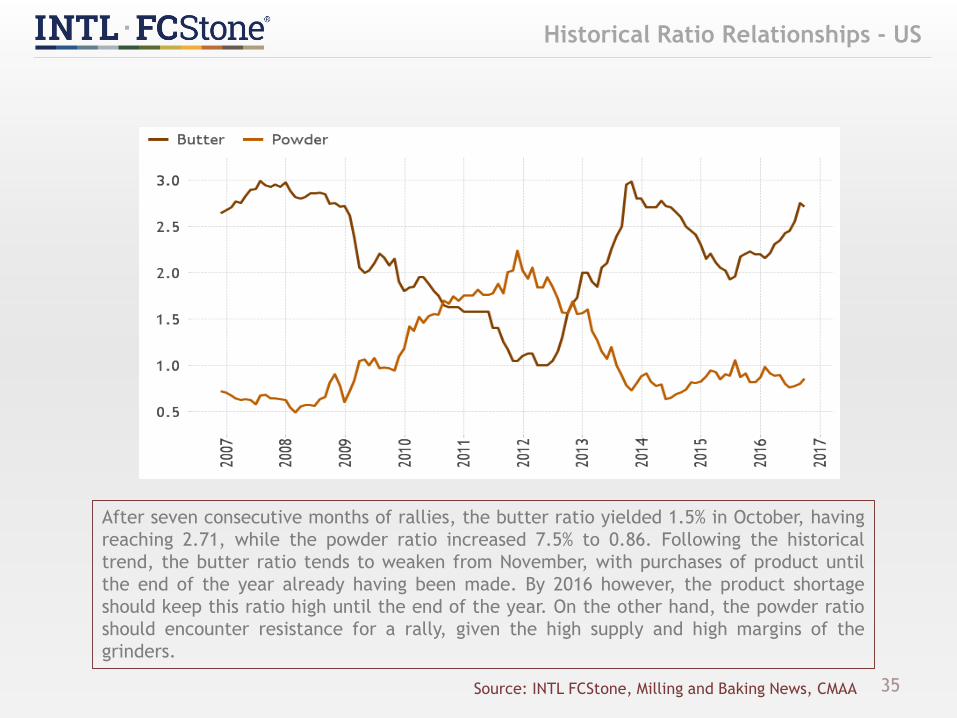
Historical Ratio Relationships - US
35Source: INTL FCStone, Milling and Baking News, CMAA
After seven consecutive months of rallies, the butter ratio yielded 1.5% in October, having
reaching 2.71, while the powder ratio increased 7.5% to 0.86. Following the historical
trend, the butter ratio tends to weaken from November, with purchases of product until
the end of the year already having been made. By 2016 however, the product shortage
should keep this ratio high until the end of the year. On the other hand, the powder ratio
should encounter resistance for a rally, given the high supply and high margins of the
grinders.
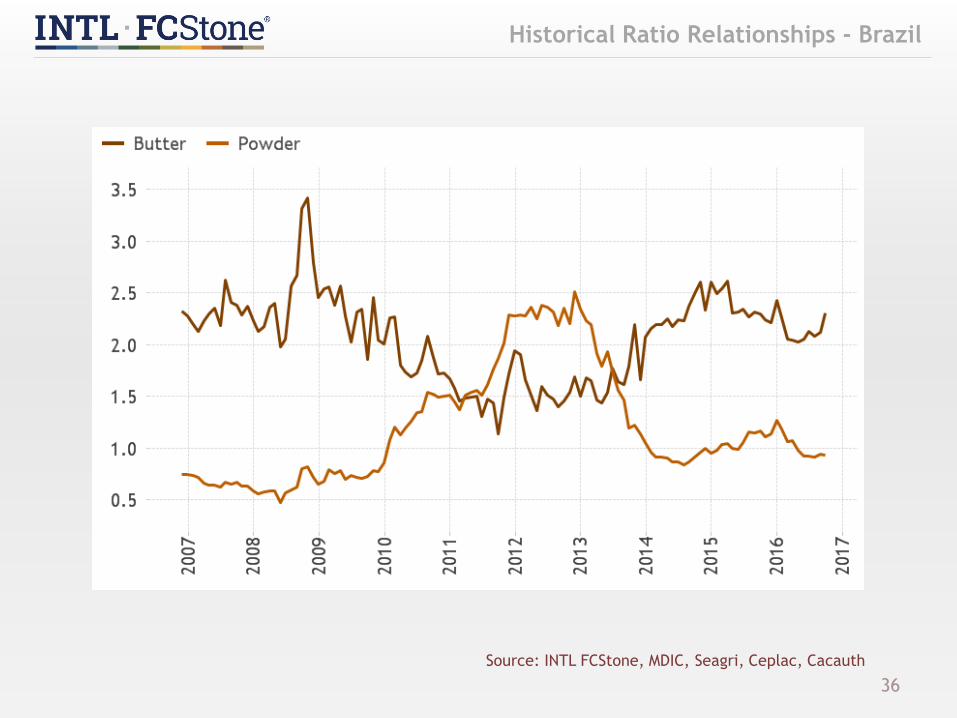
Historical Ratio Relationships - Brazil
36
Source: INTL FCStone, MDIC, Seagri, Ceplac, Cacauth

Cocoa Butter Ratio - US
37
Source: INTL FCStone, Milling and Baking News, CMAA
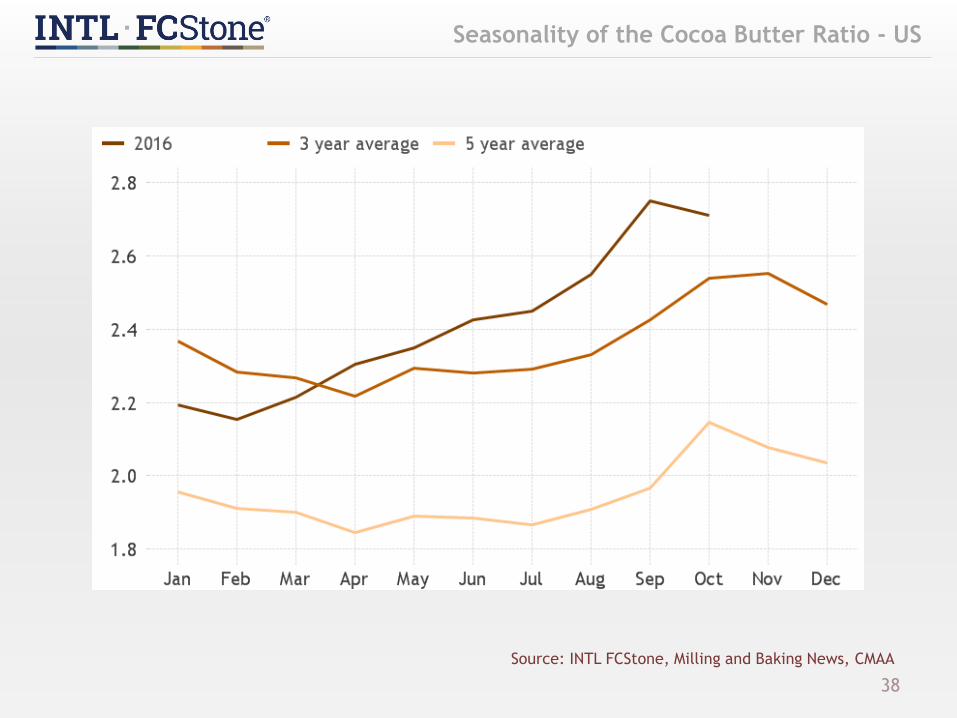
Seasonality of the Cocoa Butter Ratio - US
38
Source: INTL FCStone, Milling and Baking News, CMAA

Cocoa Powder Ratio - US
39
Source: INTL FCStone, Milling and Baking News, CMAA
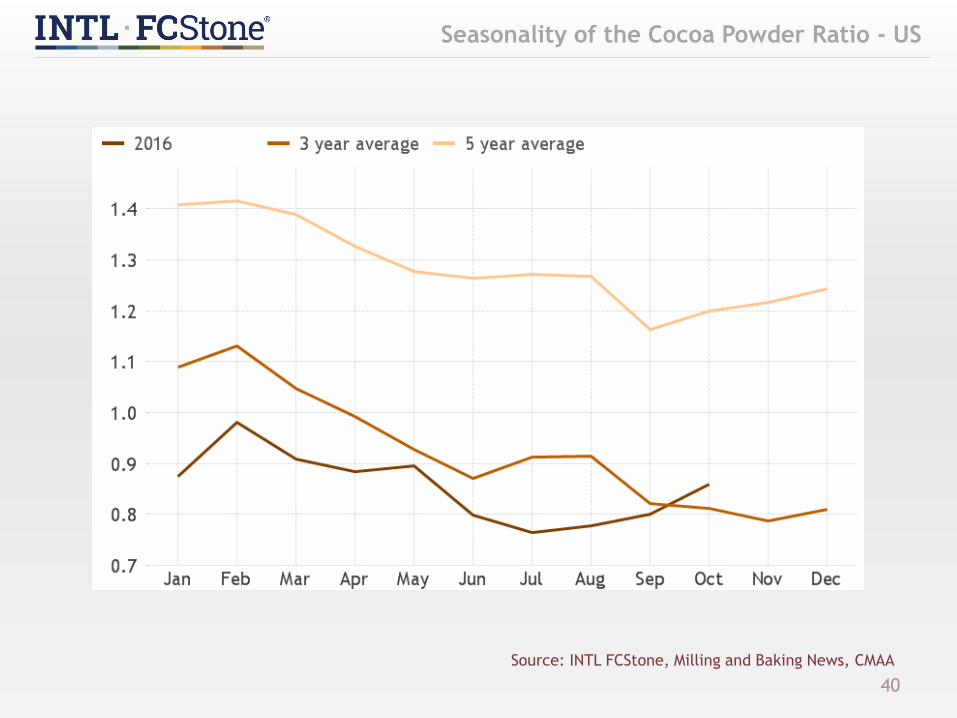
Seasonality of the Cocoa Powder Ratio - US
40
Source: INTL FCStone, Milling and Baking News, CMAA
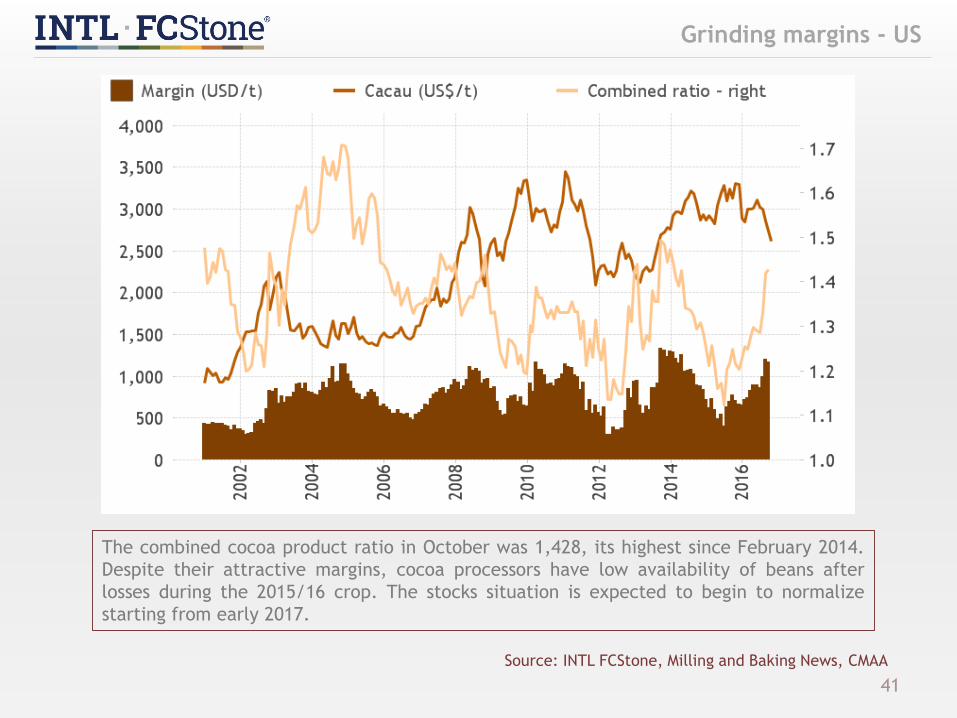
Grinding margins - US
41
Source: INTL FCStone, Milling and Baking News, CMAA
The combined cocoa product ratio in October was 1,428, its highest since February 2014.
Despite their attractive margins, cocoa processors have low availability of beans after
losses during the 2015/16 crop. The stocks situation is expected to begin to normalize
starting from early 2017.

INTERNATIONAL TRADE
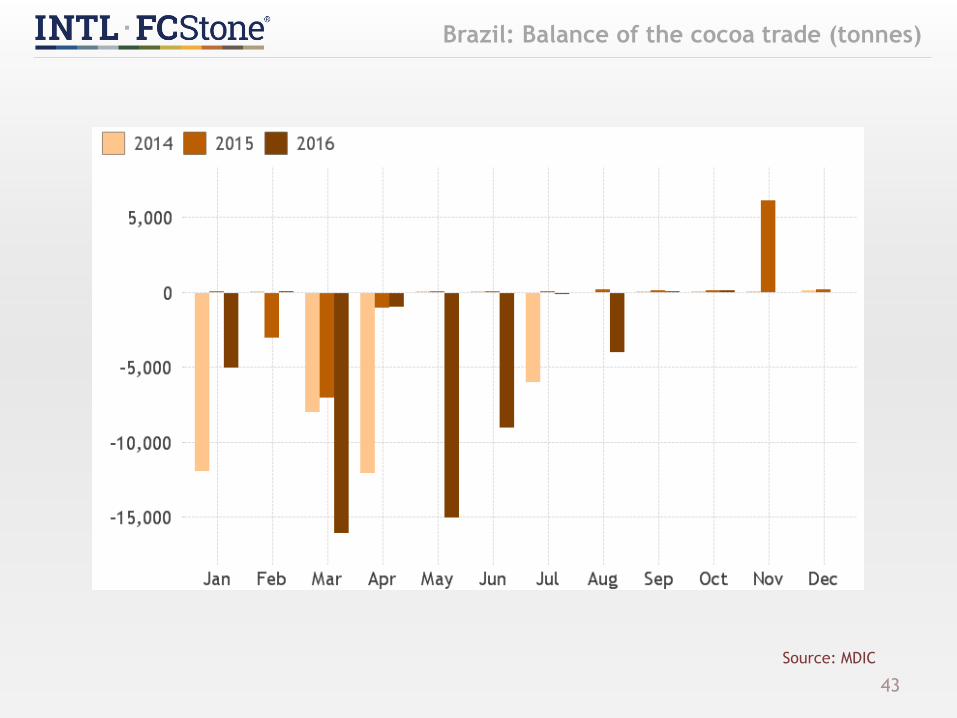
Brazil: Balance of the cocoa trade (tonnes)
43
Source: MDIC
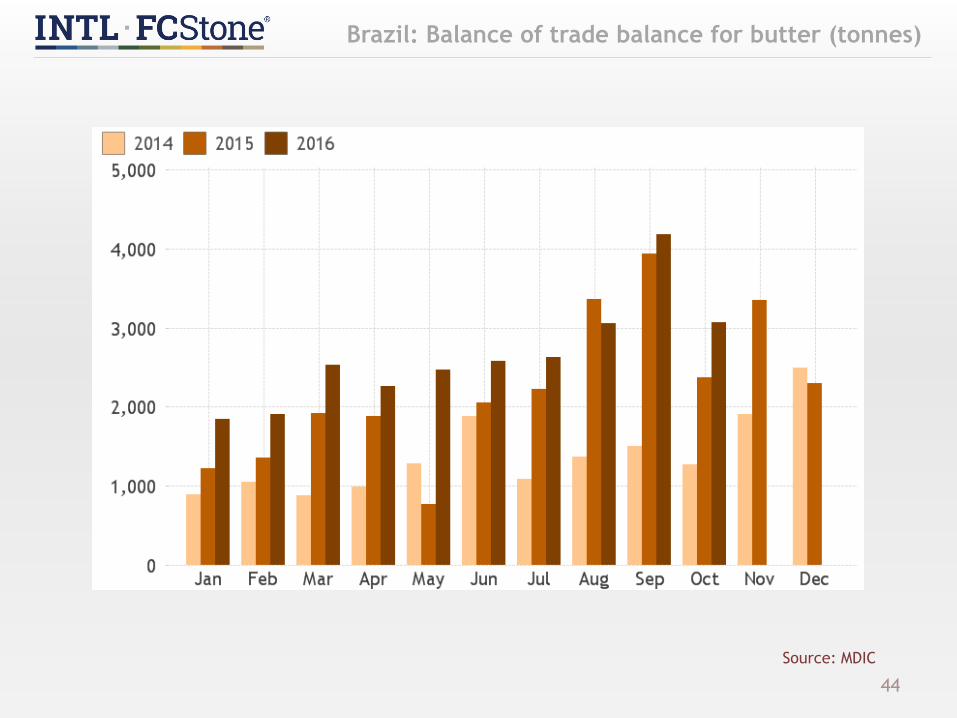
Brazil: Balance of trade balance for butter (tonnes)
44
Source: MDIC
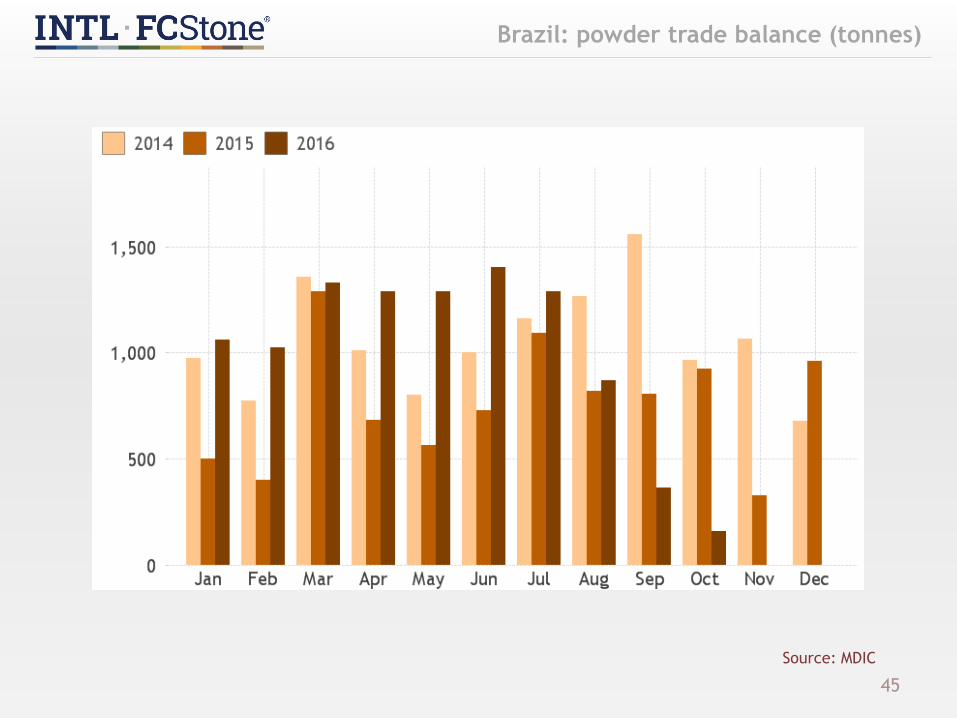
Brazil: powder trade balance (tonnes)
45
Source: MDIC

Butter Exports - Europe and the United States
46
Source: LMC International
0
100
200
300
400
500
2007/08 2008/09 2009/10 2010/11 2011/12 2012/13 2013/14 2014/15
(1,0
00 t
onnes)
United States
UnitedKingdom
Germany
France
Netherlands
2016 Jan-Mar 2016 Apr-Jun
Netherlands 47,48 45,91
France 14,75 15,10
Germany 12,63 10,56
United Kingdom 2,91 3,07
United States 6,43 6,59
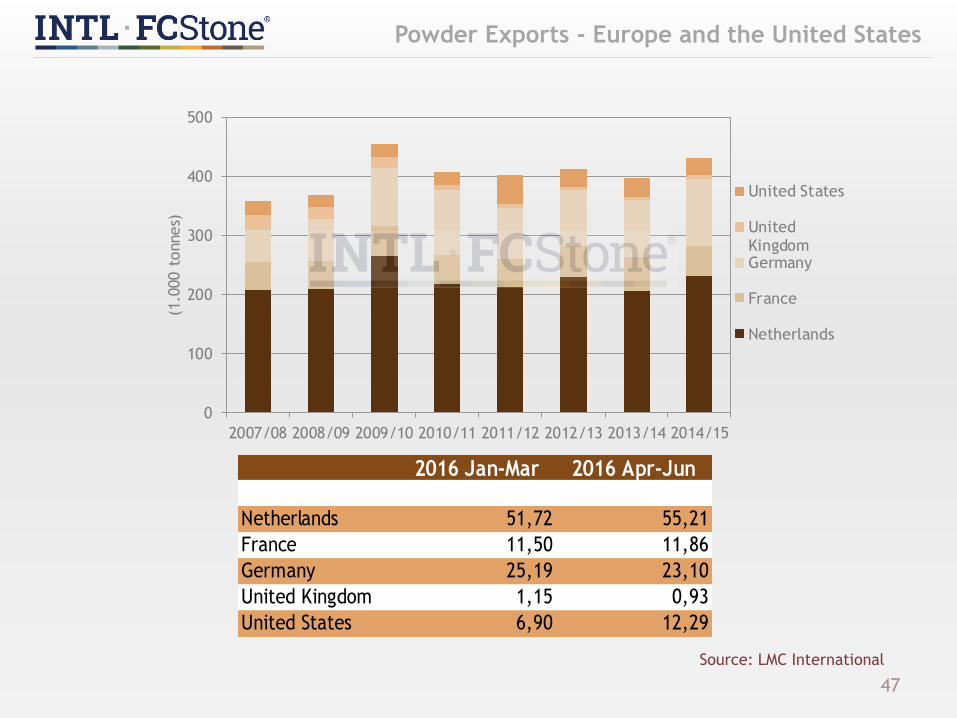
Powder Exports - Europe and the United States
47
Source: LMC International
0
100
200
300
400
500
2007/08 2008/09 2009/10 2010/11 2011/12 2012/13 2013/14 2014/15
(1.0
00 t
onnes)
United States
UnitedKingdomGermany
France
Netherlands
2016 Jan-Mar 2016 Apr-Jun
Netherlands 51,72 55,21
France 11,50 11,86
Germany 25,19 23,10
United Kingdom 1,15 0,93
United States 6,90 12,29

Liquor Exports - Europe and the United States
48
Source: LMC International
0
50
100
150
200
250
300
2007/08 2008/09 2009/10 2010/11 2011/12 2012/13 2013/14 2014/15
(1,0
00 t
onnes)
United States
UnitedKingdom
Germany
France
Netherlands
2016 Jan-Mar 2016 Apr-Jun
Netherlands 23,10 21,02
France 9,86 7,90
Germany 15,04 13,55
United Kingdom 0,08 0,07
United States 4,59 5,89

Butter Exports - West Africa
49Source: LMC International
0
20
40
60
80
100
120
140
2007/08 2008/09 2009/10 2010/11 2011/12 2012/13 2013/14 2014/15
(1.0
00 t
onnes)
Nigeria
Cameroon
Ghana
Ivory Coast
2016 Jan-Mar 2016 Apr-Jun
Ivory Coast 14,71 15,65
Ghana 5,26 7,48
Cameroon 2,32 2,53
Nigeria 2,73 2,27
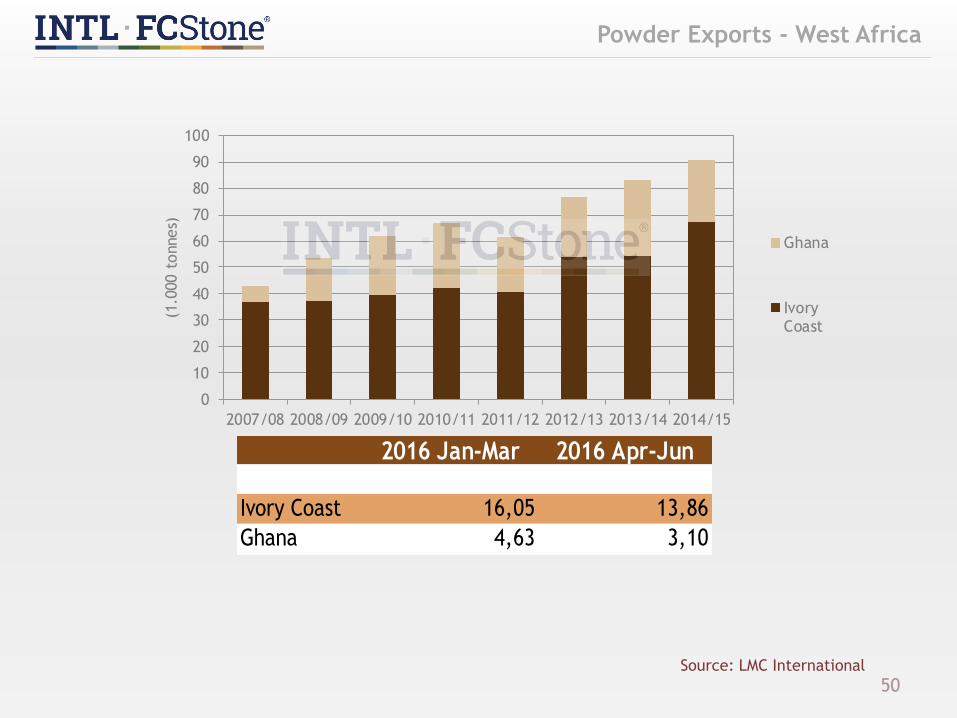
Powder Exports - West Africa
50Source: LMC International
0
10
20
30
40
50
60
70
80
90
100
2007/08 2008/09 2009/10 2010/11 2011/12 2012/13 2013/14 2014/15
(1.0
00 t
onnes)
Ghana
IvoryCoast
2016 Jan-Mar 2016 Apr-Jun
Ivory Coast 16,05 13,86
Ghana 4,63 3,10
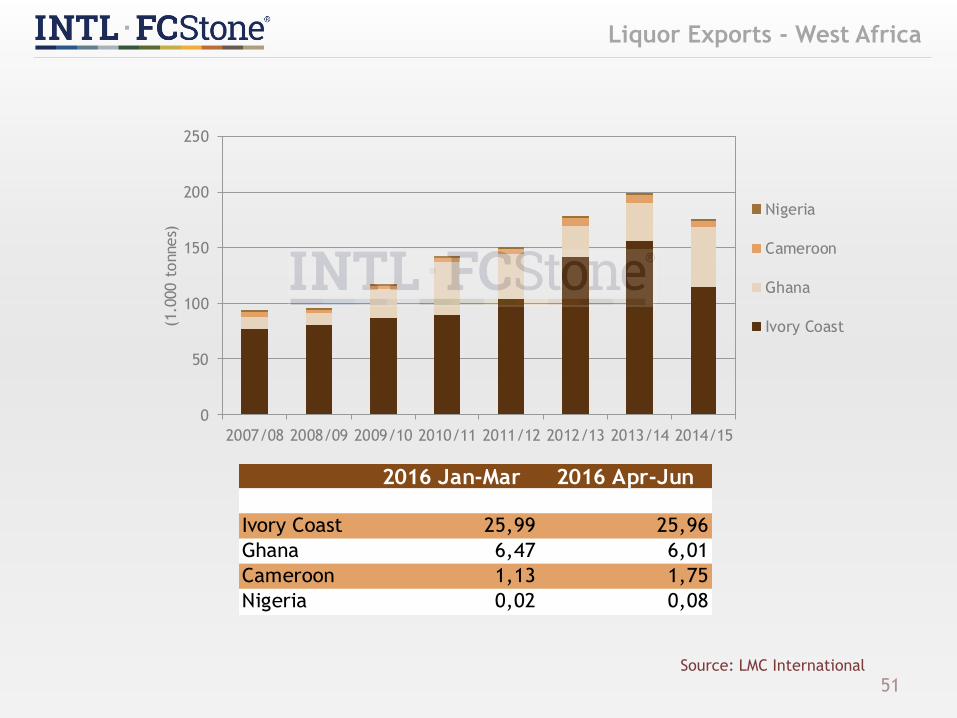
Liquor Exports - West Africa
51Source: LMC International
0
50
100
150
200
250
2007/08 2008/09 2009/10 2010/11 2011/12 2012/13 2013/14 2014/15
(1.0
00 t
onnes)
Nigeria
Cameroon
Ghana
Ivory Coast
2016 Jan-Mar 2016 Apr-Jun
Ivory Coast 25,99 25,96
Ghana 6,47 6,01
Cameroon 1,13 1,75
Nigeria 0,02 0,08
Fábio RezendeMarket Intelligence
(55 19) [email protected]
FCStone do Brasil Ltda.Av. José Bonifácio Coutinho Nogueira, 150
Ala Oeste – Sala 203 Jardim MadalenaCampinas-SP 13091-611
33 offices around the world | 1,000 professionals | 20,000 customers in more than 100 countries