monthly air quality forecast report for november 2012 · monthly air quality report for . november...
TRANSCRIPT
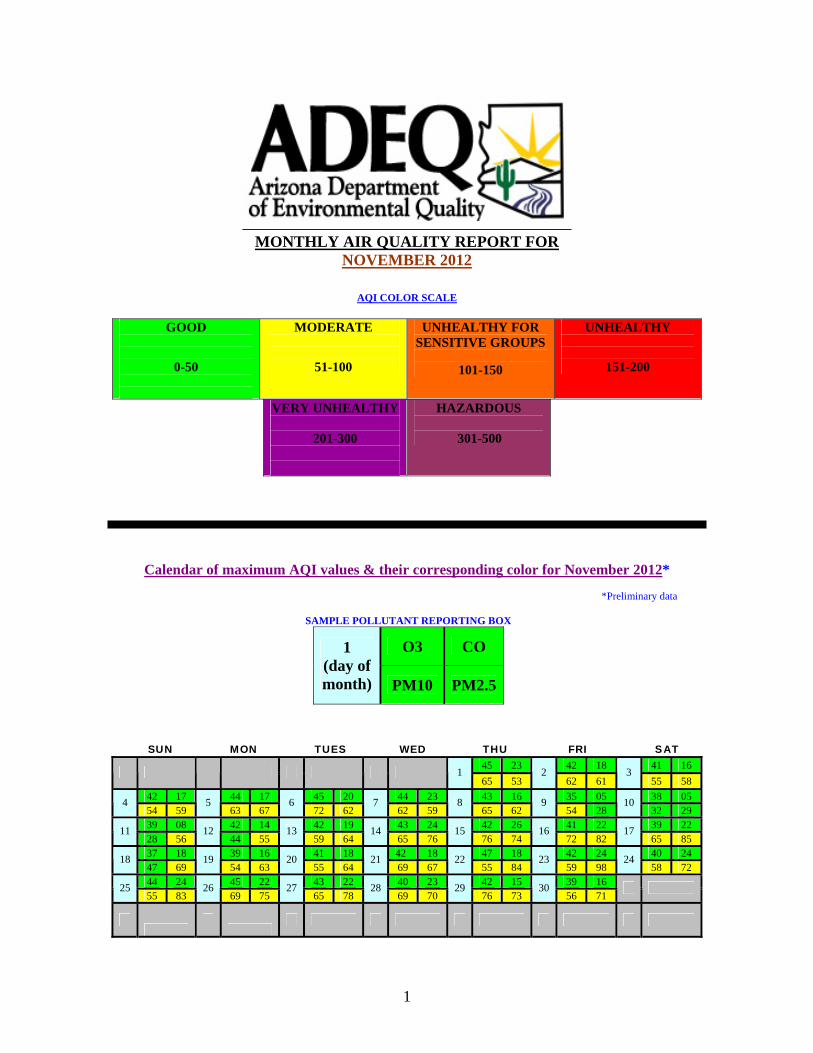
MONTHLY AIR QUALITY REPORT FOR
NOVEMBER 2012
AQI COLOR SCALE
GOOD
0-50
MODERATE
51-100
UNHEALTHY FOR SENSITIVE GROUPS
101-150
UNHEALTHY
151-200
VERY UNHEALTHY
201-300
HAZARDOUS 301-500
Calendar of maximum AQI values & their corresponding color for November 2012*
*Preliminary data
SAMPLE POLLUTANT REPORTING BOX
O3 CO 1 (day of month) PM10 PM2.5
SUN MON TUES WED THU FRI SAT 45 23 42 18 41 16
1 65 53
2 62 61
3 55 58
42 17 44 17 45 20 44 23 43 16 35 05 38 05 4
54 59 5
63 67 6
72 62 7
62 59 8
65 62 9
54 28 10
32 29 39 08 42 14 42 19 43 24 42 26 41 22 39 22
11 28 56
12 44 55
13 59 64
14 65 76
15 76 74
16 72 82
17 65 85
37 18 39 16 41 18 42 18 47 18 42 24 40 24 18
47 69 19
54 63 20
55 64 21
69 67 22
55 84 23
59 98 24
58 72 44 24 45 22 43 22 40 23 42 15 39 16
25 55 83
26 69 75
27 65 78
28 69 70
29 76 73
30 56 71
1
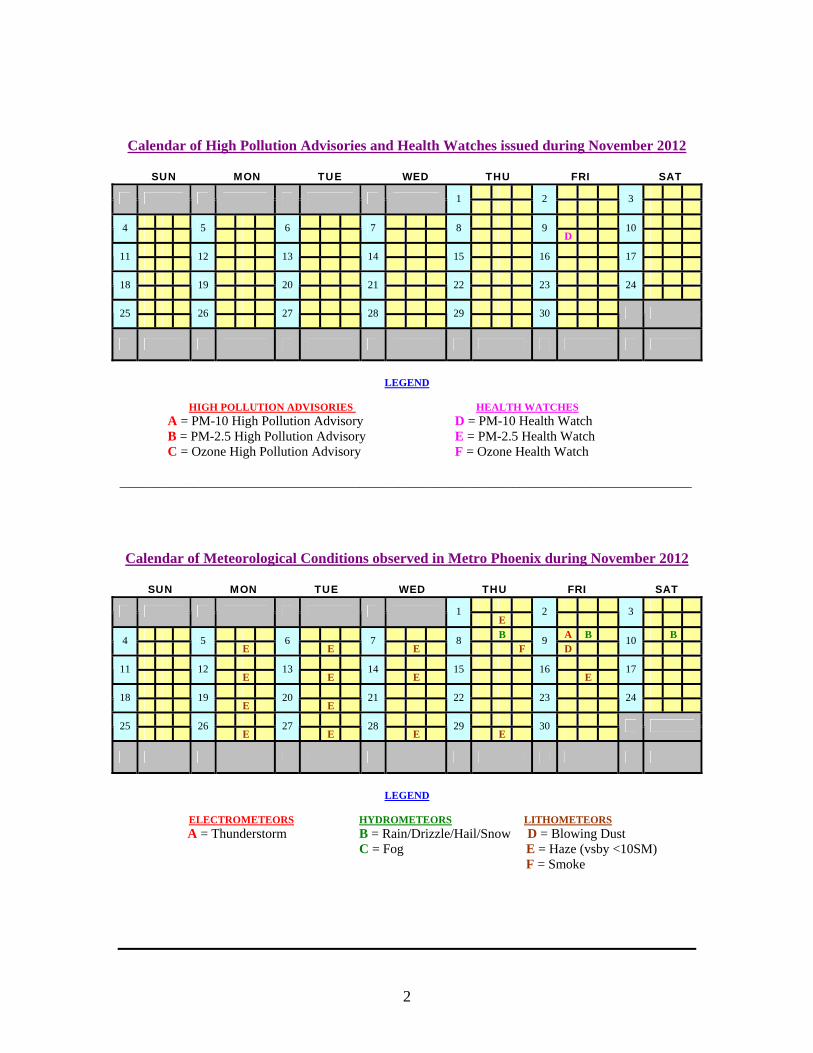
Calendar of High Pollution Advisories and Health Watches issued during November 2012
SUN MON TUE WED THU FRI SAT
1
2
3
4
5
6
7
8
9 D
10
11
12
13
14
15
16
17
18
19
20
21
22
23
24
25
26
27
28
29
30
LEGEND
HIGH POLLUTION ADVISORIES HEALTH WATCHES A = PM-10 High Pollution Advisory D = PM-10 Health Watch B = PM-2.5 High Pollution Advisory E = PM-2.5 Health Watch C = Ozone High Pollution Advisory F = Ozone Health Watch
______________________________________________________________________________________
Calendar of Meteorological Conditions observed in Metro Phoenix during November 2012
SUN MON TUE WED THU FRI SAT
1
E 2
3
B A B B
4
5 E
6 E
7 E
8 F
9 D
10
11
12
E 13
E 14
E 15
16
E 17
18
19 E
20 E
21
22
23
24
25
26
E 27
E 28
E 29
E 30
LEGEND
ELECTROMETEORS HYDROMETEORS LITHOMETEORS A = Thunderstorm B = Rain/Drizzle/Hail/Snow D = Blowing Dust C = Fog E = Haze (vsby <10SM) F = Smoke
2
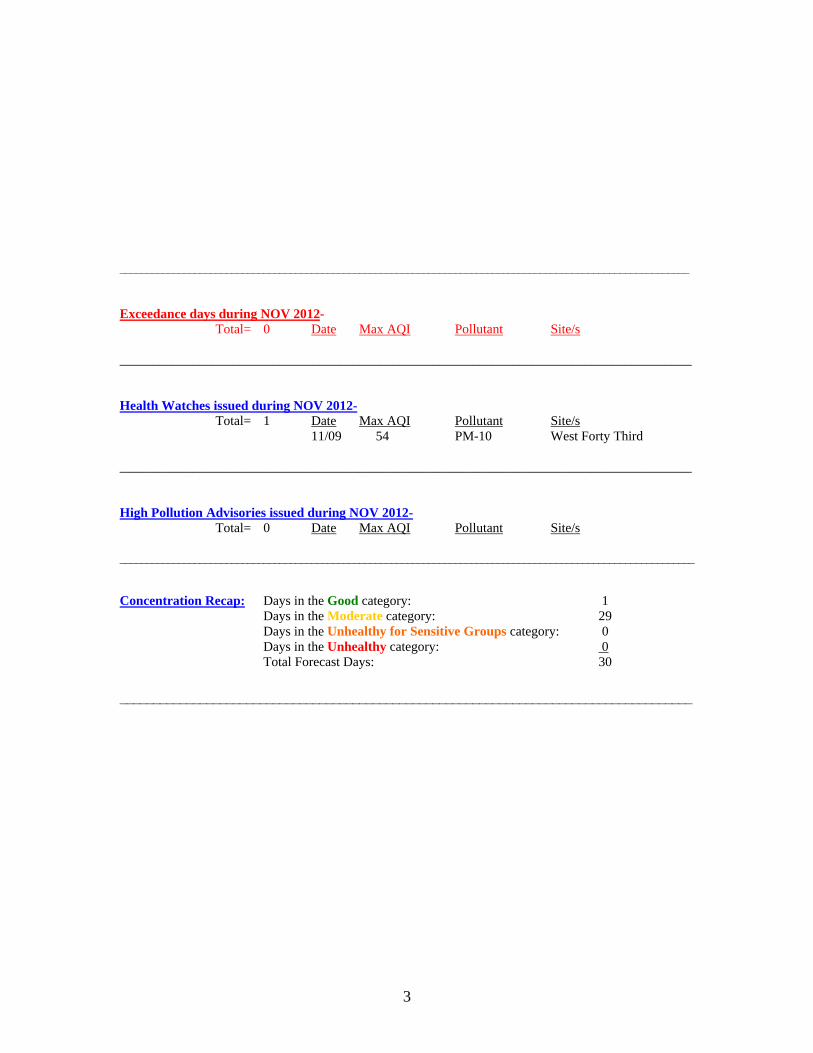
___________________________________________________________________________________________________________ Exceedance days during NOV 2012-
Total= 0 Date Max AQI Pollutant Site/s
______________________________________________________________________________________ Health Watches issued during NOV 2012-
Total= 1 Date Max AQI Pollutant Site/s 11/09 54 PM-10 West Forty Third
______________________________________________________________________________________ High Pollution Advisories issued during NOV 2012-
Total= 0 Date Max AQI Pollutant Site/s
____________________________________________________________________________________________________________
Concentration Recap: Days in the Good category: 1 Days in the Moderate category: 29 Days in the Unhealthy for Sensitive Groups category: 0 Days in the Unhealthy category: 0 Total Forecast Days: 30 ______________________________________________________________________________________
3
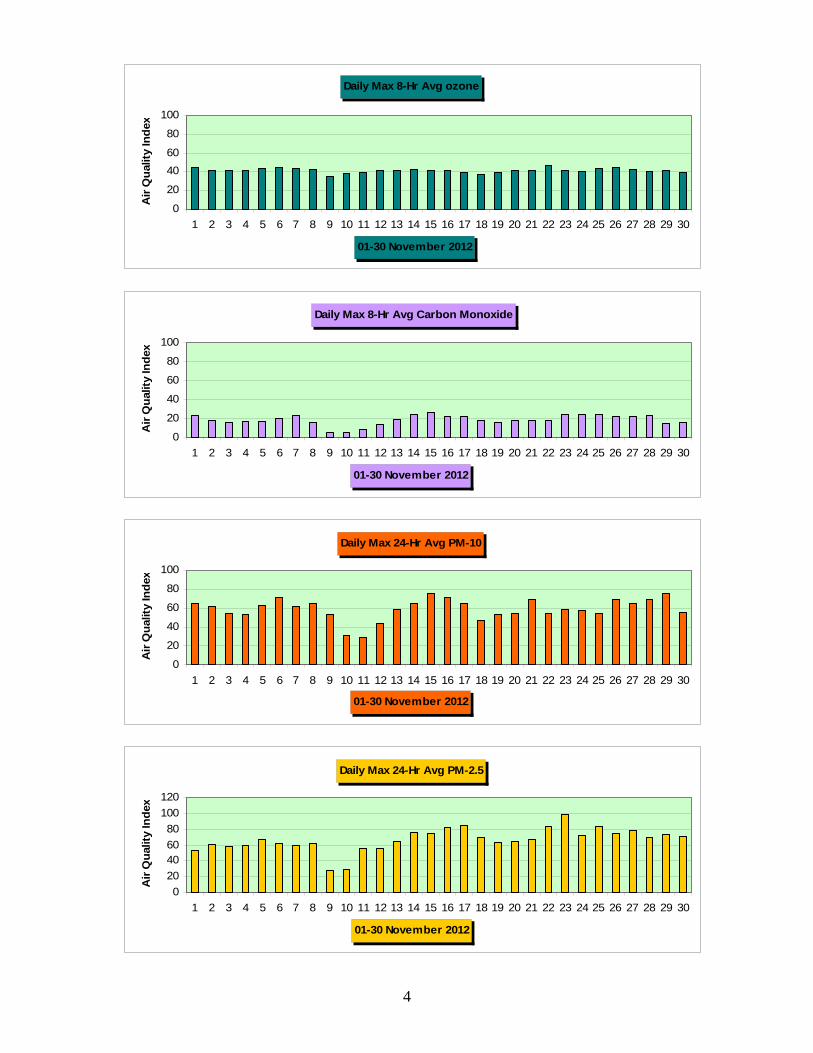
Daily Max 8-Hr Avg ozone
0
20
40
60
80
100
1 2 3 4 5 6 7 8 9 10 11 12 13 14 15 16 17 18 19 20 21 22 23 24 25 26 27 28 29 30
01-30 November 2012
Air
Qu
alit
y In
dex
Daily Max 8-Hr Avg Carbon Monoxide
0
20
40
60
80
100
1 2 3 4 5 6 7 8 9 10 11 12 13 14 15 16 17 18 19 20 21 22 23 24 25 26 27 28 29 30
01-30 November 2012
Air
Qu
alit
y In
dex
Daily Max 24-Hr Avg PM-10
0
20
40
60
80
100
1 2 3 4 5 6 7 8 9 10 11 12 13 14 15 16 17 18 19 20 21 22 23 24 25 26 27 28 29 30
01-30 November 2012
Air
Qu
alit
y In
dex
Daily Max 24-Hr Avg PM-2.5
0
20
4060
80
100
120
1 2 3 4 5 6 7 8 9 10 11 12 13 14 15 16 17 18 19 20 21 22 23 24 25 26 27 28 29 30
01-30 November 2012
Air
Qu
alit
y In
dex
4
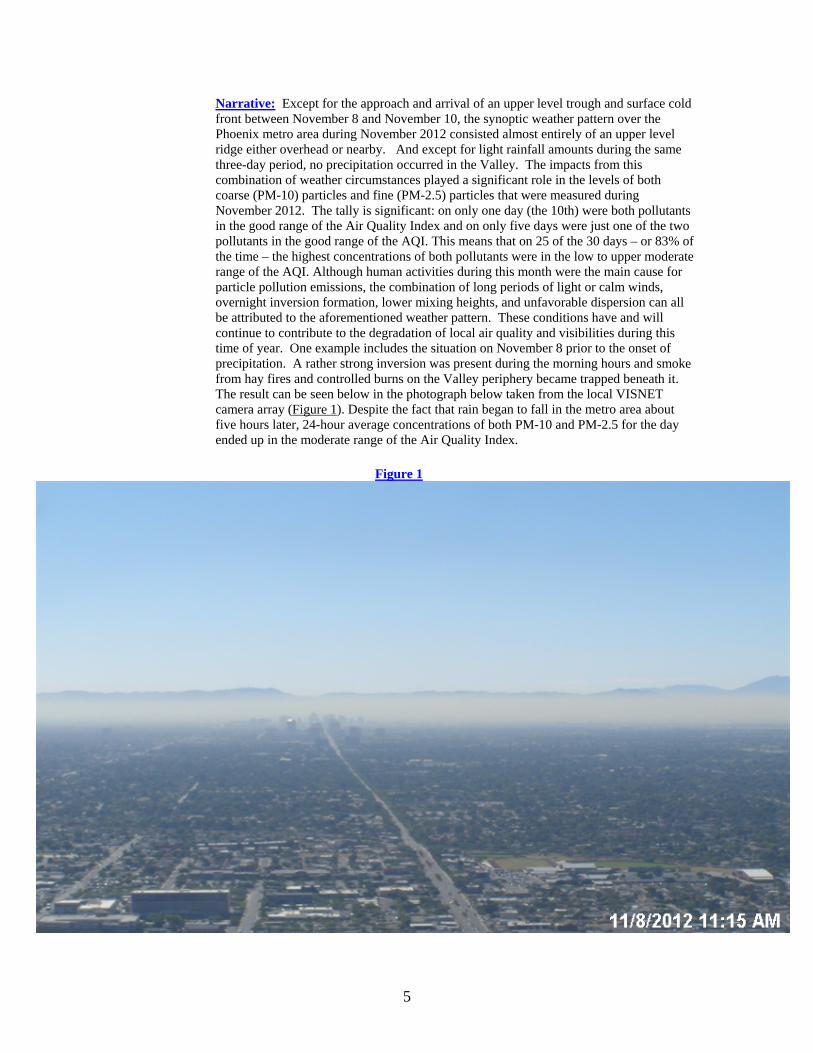
Narrative: Except for the approach and arrival of an upper level trough and surface cold front between November 8 and November 10, the synoptic weather pattern over the Phoenix metro area during November 2012 consisted almost entirely of an upper level ridge either overhead or nearby. And except for light rainfall amounts during the same three-day period, no precipitation occurred in the Valley. The impacts from this combination of weather circumstances played a significant role in the levels of both coarse (PM-10) particles and fine (PM-2.5) particles that were measured during November 2012. The tally is significant: on only one day (the 10th) were both pollutants in the good range of the Air Quality Index and on only five days were just one of the two pollutants in the good range of the AQI. This means that on 25 of the 30 days – or 83% of the time – the highest concentrations of both pollutants were in the low to upper moderate range of the AQI. Although human activities during this month were the main cause for particle pollution emissions, the combination of long periods of light or calm winds, overnight inversion formation, lower mixing heights, and unfavorable dispersion can all be attributed to the aforementioned weather pattern. These conditions have and will continue to contribute to the degradation of local air quality and visibilities during this time of year. One example includes the situation on November 8 prior to the onset of precipitation. A rather strong inversion was present during the morning hours and smoke from hay fires and controlled burns on the Valley periphery became trapped beneath it. The result can be seen below in the photograph below taken from the local VISNET camera array (Figure 1). Despite the fact that rain began to fall in the metro area about five hours later, 24-hour average concentrations of both PM-10 and PM-2.5 for the day ended up in the moderate range of the Air Quality Index.
Figure 1
5
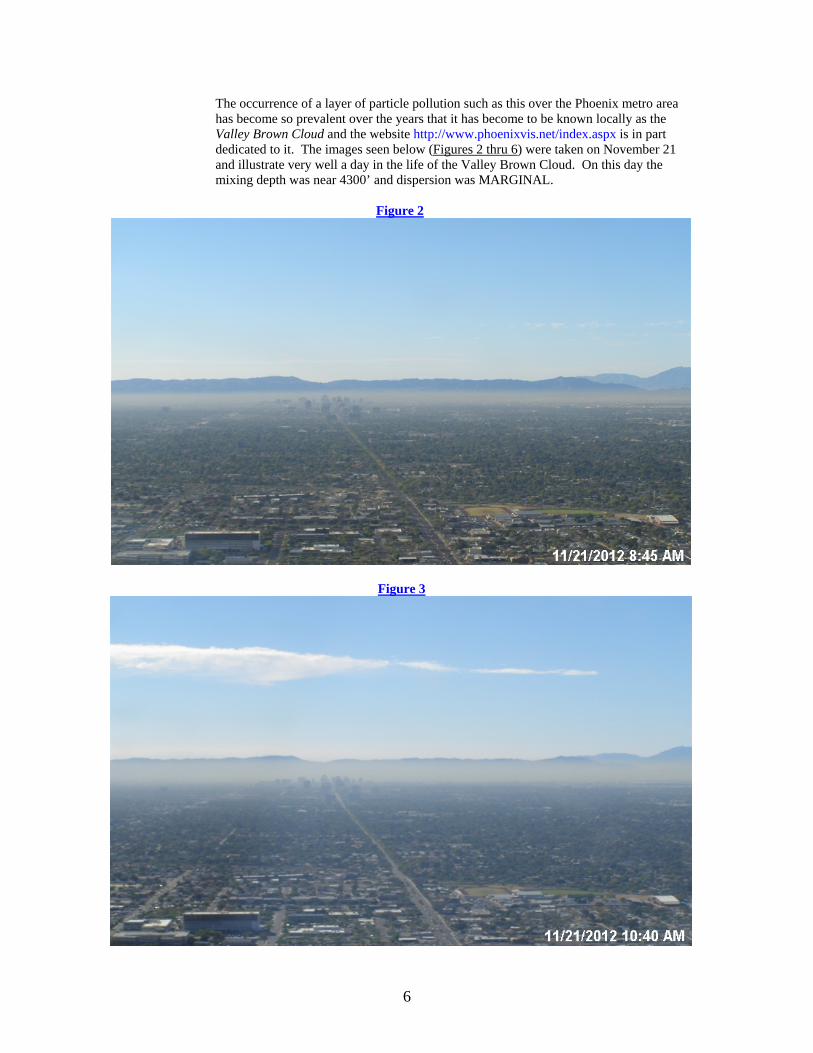
The occurrence of a layer of particle pollution such as this over the Phoenix metro area has become so prevalent over the years that it has become to be known locally as the Valley Brown Cloud and the website http://www.phoenixvis.net/index.aspx is in part dedicated to it. The images seen below (Figures 2 thru 6) were taken on November 21 and illustrate very well a day in the life of the Valley Brown Cloud. On this day the mixing depth was near 4300’ and dispersion was MARGINAL.
Figure 2
Figure 3
6
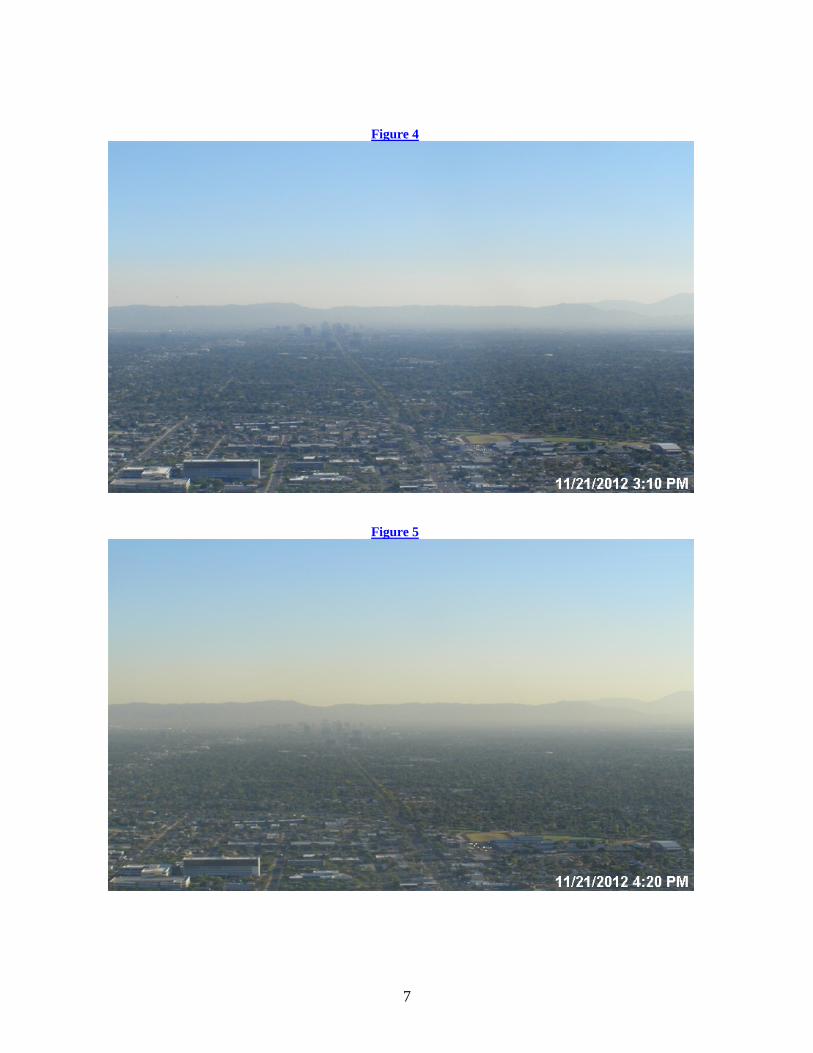
Figure 4
Figure 5
7
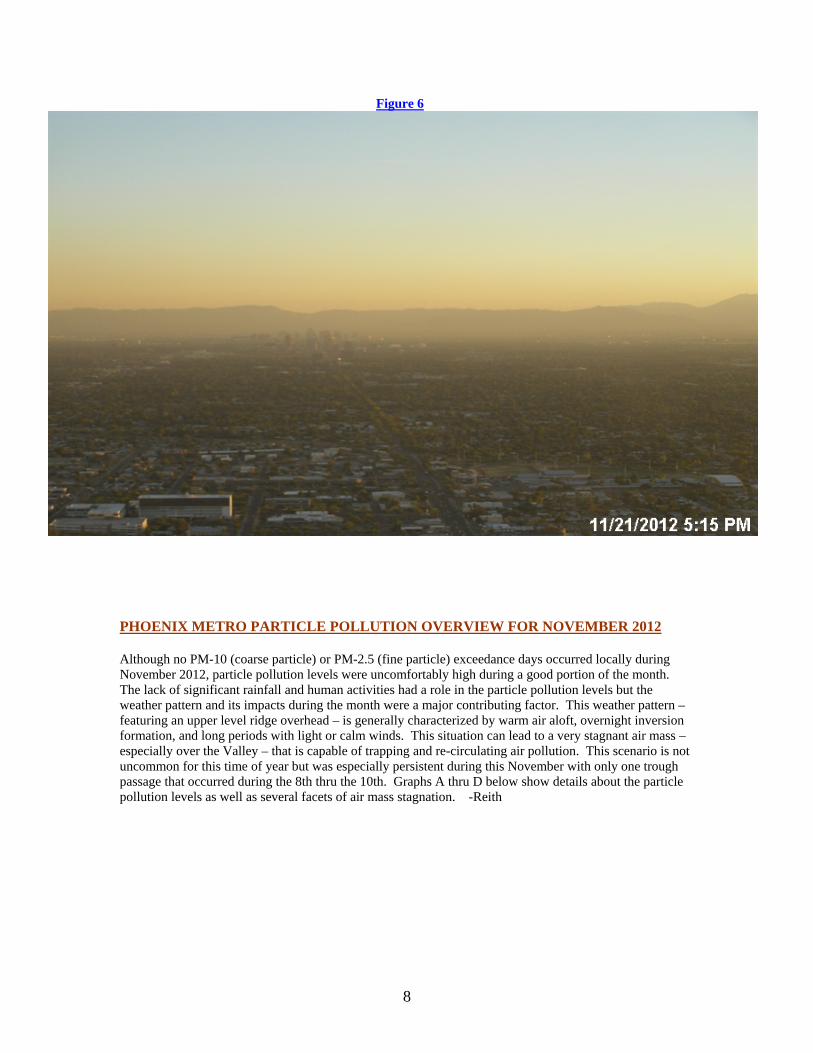
Figure 6
PHOENIX METRO PARTICLE POLLUTION OVERVIEW FOR NOVEMBER 2012 Although no PM-10 (coarse particle) or PM-2.5 (fine particle) exceedance days occurred locally during November 2012, particle pollution levels were uncomfortably high during a good portion of the month. The lack of significant rainfall and human activities had a role in the particle pollution levels but the weather pattern and its impacts during the month were a major contributing factor. This weather pattern – featuring an upper level ridge overhead – is generally characterized by warm air aloft, overnight inversion formation, and long periods with light or calm winds. This situation can lead to a very stagnant air mass – especially over the Valley – that is capable of trapping and re-circulating air pollution. This scenario is not uncommon for this time of year but was especially persistent during this November with only one trough passage that occurred during the 8th thru the 10th. Graphs A thru D below show details about the particle pollution levels as well as several facets of air mass stagnation. -Reith
8
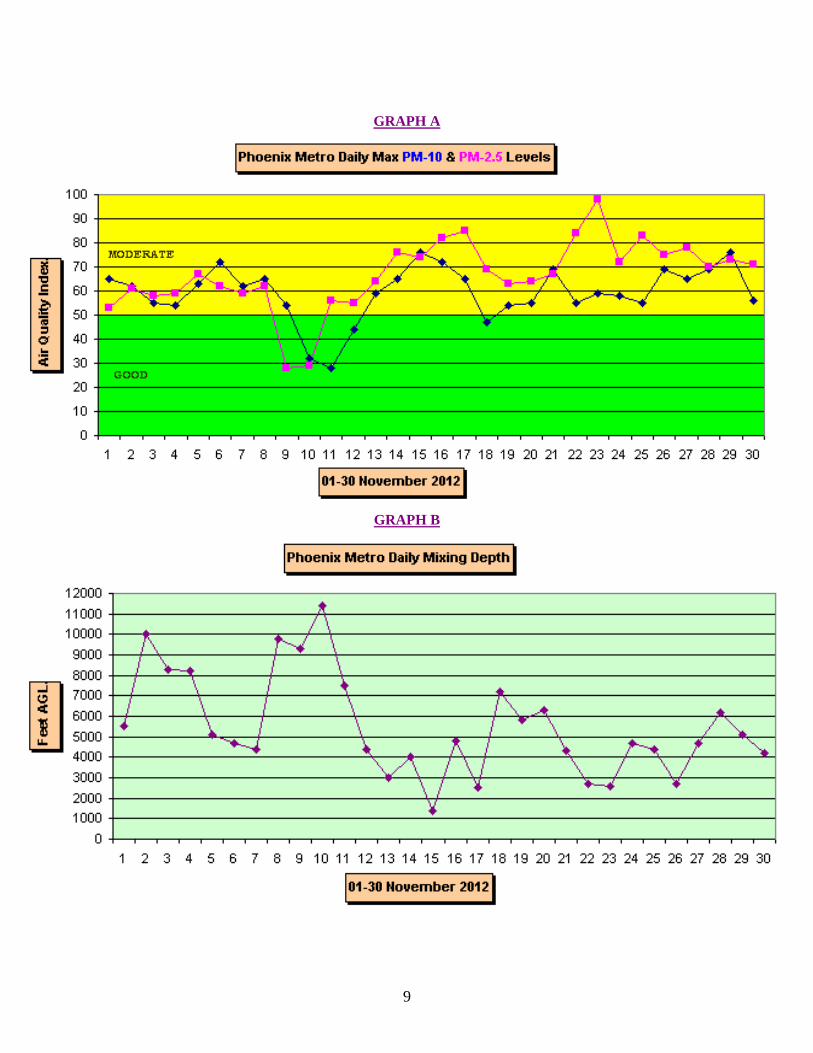
GRAPH A
GRAPH B
9
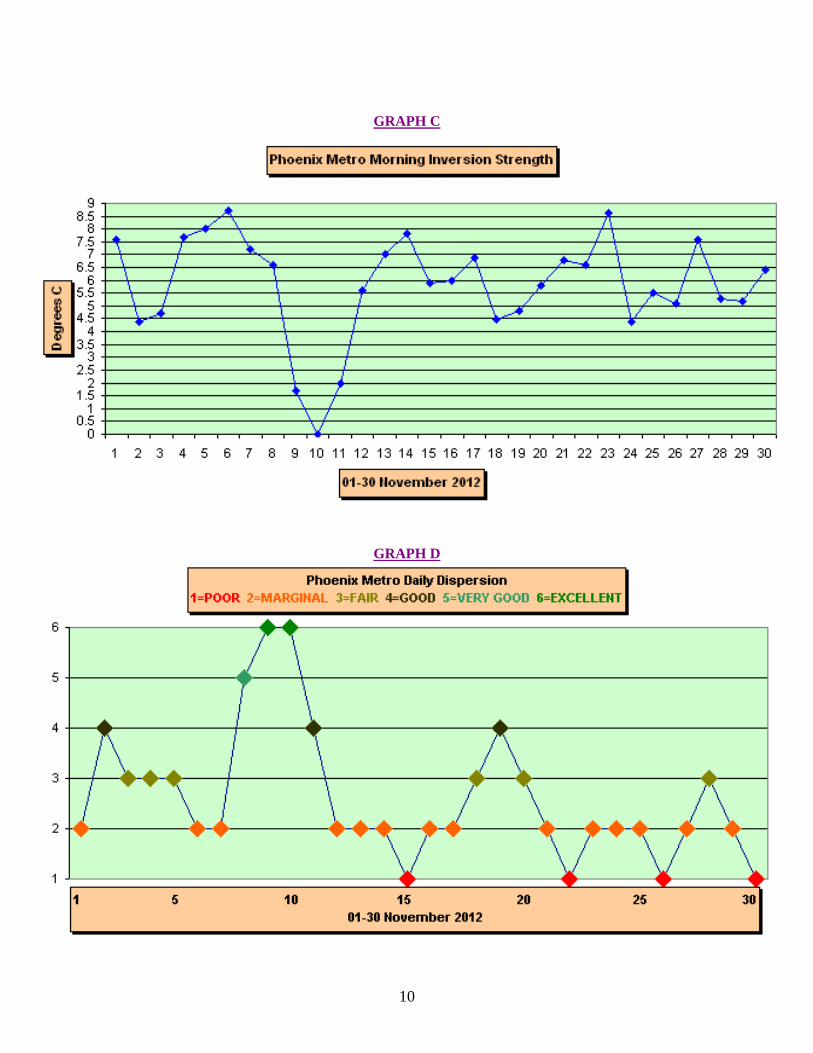
GRAPH C
GRAPH D
10