monterey - salinas transit · monterey-salinas transit – marina area service study moore &...
TRANSCRIPT

MONTEREY - SALINAS TRANSIT
MARINA AREA SERVICE STUDY
FINAL REPORT
SEPTEMBER 2009

MONTEREY-SALINAS TRANSIT – MARINA AREA SERVICE STUDY
MOORE & ASSOCIATES
1. EXECUTIVE SUMMARY 01
2. CUSTOMER SURVEY ANALYSIS 05
3. COMMUNITY SURVEY ANALYSIS 35
TABLE OF CONTENTS 4. CSUMB SURVEY ANALYSIS 57
5. PATRONAGE ANALYSIS 83
6. SERVICE PLAN 91
MONTEREY-SALINAS TRANSIT – MARINA AREA SERVICE STUDY
MOORE & ASSOCIATES
Exhibit No. Exhibit Title Page
Exhibit 2.1 Four-Month MST Ridership 8
Exhibit 2.2 On-Board Survey Sampling 8
Exhibit 2.3 Respondent Residence Location 10
Exhibit 2.4 Route Selection 11
Exhibit 2.5 Transfer Used 12
Exhibit 2.6 Trip Purpose 13
Exhibit 2.7 Typical Route vs. Trip Purpose 14
Exhibit 2.8 Number of Children under the Age of 16 Traveling with Rider 15
Exhibit 2.9 Ridership Frequency 15
Exhibit 2.10 Typical Route vs. Ridership Frequency 16
Exhibit 2.11 Length of Use 17
Exhibit 2.12 Typical Route vs. Length of Use 18
Exhibit 2.13 Transportation Alternatives 19
Exhibit 2.14 Typical Route vs. Transportation Alternatives 20
Exhibit 2.15 Transit Stop Access 21
Exhibit 2.16 Fare Type 22
Exhibit 2.17 Alternative Fare Payment Preference 23
Exhibit 2.18 Trip Purpose vs. Awareness of CSUMB Free Bus Zone 24
Exhibit 2.19 Typical Route vs. Awareness of CSUMB Free Bus Zone 25
Exhibit 2.20 Initial Source of Rider’s Awareness 26
Exhibit 2.21 Initial Source of Rider’s Awareness – Other 26
Exhibit 2.22 Language vs. Initial Source of Awareness 27
Exhibit 2.23 Rider Information Outlets 28
Exhibit 2.24 Rider Information Outlets – Other 28
Exhibit 2.25 Language vs. Information Outlets 29
Exhibit 2.26 Customer Information Telephone Service Rating 30
Exhibit 2.27 Website Rating 31
Exhibit 2.28 Service Attribute Rating 31

MONTEREY-SALINAS TRANSIT – MARINA AREA SERVICE STUDY
MOORE & ASSOCIATES
Exhibit 2.29 Selection Motivator 33
Exhibit 3.1 Respondent Residence Location 38
Exhibit 3.2 Respondent Residence Location – Other 39
Exhibit 3.3 Barriers to Usage 41
Exhibit 3.4 Propensity to Ride vs. Employment Category 42
Exhibit 3.5 Propensity to Ride vs. Household Income 43
Exhibit 3.6 Preferred Enhancement 43
Exhibit 3.7 Alternate Public-Transit Services Used 45
Exhibit 3.8 Awareness of CSUMB Free Bus Zone vs. Employment 46
Exhibit 3.9 Service Attribute Importance 47
Exhibit 3.10 Advertising Source 48
Exhibit 3.11 Preferred Mode 49
Exhibit 3.12 Print Outlet 49
Exhibit 3.13 Age Distribution 50
Exhibit 3.14 Persons Under the Age of 16 Traveling With Respondent 51
Exhibit 3.15 Household Income 52
Exhibit 3.16 Employment Status 53
Exhibit 3.17 Education 54
Exhibit 4.1 Respondent Residence Location 60
Exhibit 4.2 Respondent Category vs. Residence Location 61
Exhibit 4.3 Patronized MST in Last 60 Days 62
Exhibit 4.4 Respondent Category vs. Patronized MST in Last 60 Days 63
Exhibit 4.5 Reason for Not Using MST 64
Exhibit 4.6 Residence Location vs. Reason for Not Using MST 65
Exhibit 4.7 Respondent Category vs. Reason for Not Using MST 66
Exhibit 4.8 Propensity to Ride MST 67
Exhibit 4.9 Respondent Category vs. Propensity to Ride MST 68
Exhibit 4.10 Preferred Service Enhancement 69
Exhibit 4.11 Characteristic Preference 70
Exhibit 4.12 Other Transit Service 71
Exhibit 4.13 CSUMB Fare-Free Zone 71
Exhibit 4.14 Nearest Bus Stop 72
MONTEREY-SALINAS TRANSIT – MARINA AREA SERVICE STUDY
MOORE & ASSOCIATES
Exhibit 4.15 Ride-Dependency 73
Exhibit 4.16 Respondent Category 74
Exhibit 4.17 Days on Campus 74
Exhibit 4.18 Time Arriving on Campus 75
Exhibit 4.19 Time Departing Campus 76
Exhibit 4.20 Use of CSUMB Shuttle 76
Exhibit 4.21 CSUMB Shuttle Frequency of Use 77
Exhibit 4.22 Most Frequent Off-Campus Destinations 78
Exhibit 4.23 Off-Campus Mode 79
Exhibit 4.24 Access to Campus 80
Exhibit 4.25 Discount Fare Option 81
Exhibit 5.1 Marina On-Call Common Origins 85
Exhibit 5.2 Marina On-Call Common Origins Map 87
Exhibit 5.3 Marina On-Call Common Destinations Map 88
Exhibit 5.4 Customer Survey Respondent Home Zip Codes 89
Exhibit 6.1 Current Route 2X 93
Exhibit 6.2 Current Route 12 94
Exhibit 6.3 Current Route 16 95
Exhibit 6.4 Current Route 20 96
Exhibit 6.5 Current Route 27 97
Exhibit 6.6 Current MST On-Call Marina 98
Exhibit 6.7 Current CSUMB Shuttle 99
Exhibit 6.8 Current Service in Marina 100
Exhibit 6.9 Current Service in Marina with Quarter-Mile Buffers 101
Exhibit 6.10 Proposed Marina Circulator 105
Exhibit 6.11 Proposed Marina Circulator Sample Schedule 106
Exhibit 6.12 Near-Term Service in Marina 107
Exhibit 6.13 Near-Term Service in Marina with Quarter-Mile Buffers 108
Exhibit 6.14 Proposed Route 25 110
Exhibit 6.15 Proposed Route 25 Sample Schedule 111
Exhibit 6.16 Route 16 Sample Schedule 113
Exhibit 6.17 Route 20 Sample Schedule 115

MONTEREY-SALINAS TRANSIT – MARINA AREA SERVICE STUDY
MOORE & ASSOCIATES
Exhibit 6.18 Proposed Route 25 Sample Schedule 116
Exhibit 6.19 Mid-Term Service in Marina 117
Exhibit 6.20 Mid-Term Service in Marina with Quarter-Mile Buffers 118
Exhibit 6.21 Proposed Route 27 121
Exhibit 6.22 Long-Term Service in Marina 123
Exhibit 6.23 Long-Term Service in Marina with Quarter-Mile Buffers 124

MONTEREY-SALINAS TRANSIT – MARINA AREA SERVICE STUDY
MOORE & ASSOCIATES
This Page Intentionally Left Blank.
MONTEREY-SALINAS TRANSIT – MARINA AREA SERVICE STUDY
MOORE & ASSOCIATES PAGE 1
1. EXECUTIVE SUMMARY
MONTEREY-SALINAS TRANSIT – MARINA AREA SERVICE STUDY
MOORE & ASSOCIATES PAGE 2
CHAPTER 1 – EXECUTIVE SUMMARY
The goal of the Marina Area Service Study is to evaluate how well MST’s
Marina-area fixed-route service meets current demand, assess how well it
is likely to meet future demand, and develop service modifications to better
serve public transit customers in the near-term as well as forecast future.
To this end, Moore & Associates fielded three separate surveys: a
passenger survey conducted onboard MST buses traveling throughout the
service area; a community survey conducted at several high-traffic points
within Marina; and a web-based survey open to the Cal State University –
Monterey Bay faculty, staff, and student body. The purpose of these efforts
was to codify perceptions, travel patterns, desired enhancements, and
respondent demographics. These market research efforts were
supplemented with interviews with stakeholders, MST staff, and riders.
Market research efforts completed in conjunction with this study were
fruitful. The community-intercept survey yielded 266 valid responses, the
onboard survey 755, and the web-based CSUMB survey 519. The
respective response rates allowed for a high degree of confidence in the
results. Given the three different surveys each targeted a separate segment
of the population, the results proved valuable in analyzing the differences
between riders, non-riders, and members of the CSUMB community (i.e.,
students, faculty, and staff). Results from the customer survey revealed
existing transit travel patterns and demographics, service satisfaction, as
well as channels through which MST can improve service delivery and
retain customers. The community and CSUMB surveys each provided
valuable information about riders and non-riders within Marina as well as
the CSUMB campus. Results helped target service planning efforts more
accurately and allowed for the development of effective market-driven
service enhancements.
MONTEREY-SALINAS TRANSIT – MARINA AREA SERVICE STUDY
MOORE & ASSOCIATES PAGE 3
To supplement the preceding market research efforts, Moore & Associates
also analyzed patronage patterns onboard MST buses. We examined
origin and destination data for MST’s Marina On-Call service for the
months of August 2008 and February 2009 as well as origin data from the
customer survey conducted onboard MST buses in March 2009. The data
was used to determine where trips are currently being made, ensuring
service planning efforts to effectively address demand patterns.
Recommendations arising from the market research activities and analysis
of patronage patterns were split into near, mid, and long-term strategies.
The three time frames serve different purposes. Near-Term
recommendations focus on addressing immediate needs, mid-term
recommendations are aimed at crafting a comprehensive approach
toward service delivery within the Marina Service Sector, and long-term
recommendations address forecast demand for transit service associated
with the continued build-out of the former Fort Ord community. Taken
collectively, the recommendations are designed to enhance MST’s service
delivery strategy in the Marina Service Sector, though given the Marina
Transit Exchange functions as a gateway for many routes linking Salinas
and Monterey, other portions of the service area stand to realize benefits
as well. Primary obstacles to implementation including availability of
funding (both capital and operating) and restrictive turning movements out
of the Dunes Shopping Center (i.e., vehicles cannot make a left turn from
the Shopping Center parking lot northbound onto Second Avenue).

MONTEREY-SALINAS TRANSIT – MARINA AREA SERVICE STUDY
MOORE & ASSOCIATES PAGE 4
This Page Intentionally Left Blank.

MONTEREY-SALINAS TRANSIT – MARINA AREA SERVICE STUDY
MOORE & ASSOCIATES PAGE 5
2. CUSTOMER SURVEY ANALYSIS

MONTEREY-SALINAS TRANSIT – MARINA AREA SERVICE STUDY
MOORE & ASSOCIATES PAGE 6
CHAPTER 2 – CUSTOMER SURVEY ANALYSIS
This chapter presents key findings and analysis from the customer survey
conducted onboard Monterey-Salinas Transit (MST) in March 2009. The
survey sought to collect data regarding demographics, assess rider
satisfaction, perceptions and characteristics, and identify preferred service
enhancements.
Moore & Associates conducted an intercept survey of MST customers on-
board MST vehicles traveling throughout Marina during the week of March
2, 2009. Survey instruments were developed to solicit information from
current MST riders. The survey was designed to:
• Identify the needs, perceptions, concerns, and any barriers to use
of Marina’s transit rider population;
• Identify service improvements associated with existing users;
• Identify marketing strategies and appropriate media outlets
designed to maximize impact; and
• Develop a profile of transit patrons traveling through Marina,
including travel patterns and demographics.
Methodology
For the purposes of the study, the Marina area is defined as the area along
Military Avenue from the south, extending north through California State
University at Monterey Bay (CSUMB) north to Marina. It stretches from
Highway 1 on the coast to the East Garrison community. Included in the
study area are MST’s Marina Transit Exchange and Edgewater Transit
Exchange.
Survey instruments were developed to develop a comprehensive analysis of
transportation demand as well as travel patterns within the Marina area.
To complement the information gathered in MST’s 2006 Short Range
Transit Plan (SRTP), this survey was also designed to evaluate how well
MONTEREY-SALINAS TRANSIT – MARINA AREA SERVICE STUDY
MOORE & ASSOCIATES PAGE 7
MST’s bus service in and around the Marina/CSUMB area is meeting
patron demand with respect to on-time performance, safety, and
convenience. Data collected through the on-board survey will be used to:
• Analyze present and anticipated development and travel patterns,
• Support development of a series of new and revised alignments
that would better serve existing and future transit customers, and
• Attract additional ridership.
The on-board survey instrument was crafted using specific transit-based
query recommendations from MST staff in concert with Moore &
Associates. The survey was developed in English and Spanish and included
information regarding the rider’s trip that day as well as feedback
regarding MST’s services in general. Though secondary, the survey also
contained demographic information to help gain insight on such items as
the rider’s approximate residential location and access to other mobility
options. This information will support analysis of where service is found to
be most effective, while also assisting in the development of service
enhancements aimed at increasing MST ridership.
The on-board surveys were completed over the course of four days:
Monday, March 2 through Thursday, March 5, 2009. All surveyors
boarded and disembarked for their survey shift at the Marina Transit
Station located at Reservation Road and De Forest Road. Data was
collected via a self-administered approach and included four Moore &
Associates’ field supervisors and a team of 20 trained, bilingual surveyors.
To ensure survey results were relevant, only which traveled to, from or
through Marina were surveyed. All persons 16 years of age or older
boarding a MST bus on the designated routes were invited to participate.
Surveyor staff introduced themselves on behalf of Monterey-Salinas Transit
and requested each respondent’s permission before initiating the survey.
Each respondent was given the option of completing the survey themselves
or having assistance from one of the bilingual surveyors on-board. Self-

MONTEREY-SALINAS TRANSIT – MARINA AREA SERVICE STUDY
MOORE & ASSOCIATES PAGE 8
administered surveys were reviewed to ensure each was completed
properly before deeming it valid. After each survey was completed, the
surveyor thanked each respondent for their participation and concluded
the survey session.
A total of 755 surveys were collected across the five routes traveling
through Marina: Routes 2X, 16, 20, 27, and the MST On-Call Marina. The
sample targets for each route were calculated using recent ridership data,
wherein those routes with higher ridership were assigned a higher quota
than those with lower ridership. Survey administration was modified slightly
for Route 20 as it accounted for more than 75 percent of the aggregate
ridership amongst the target routes. Though Route 20 still accounted for
the highest number of valid surveys, Moore & Associates adjusted surveyor
staffing levels to ensure the other routes were sufficiently sampled. It should
also be noted that although Routes 6 and 12 provide some service within
parts of the Marina area, ridership was not considered significant, and
therefore excluded from the sampling plan.
Exhibit 2.1 Four-Month MST Ridership
Route Sept-Dec 2008 Ridership Ridership PercentageMonterey-Salinas (20) 202,612 76.5%Monterey-Marina (16) 46,900 17.7%Watsonville-Marina (27) 6,816 2.6%MST On Call Marina 4,430 1.7%Pebble Beach Express (2X) 4,141 1.6%
Exhibit 2.2 On-Board Survey Sampling
Route Survey Respondents Percentage of RespondentsMonterey-Salinas (20) 371 49.1%Monterey-Marina (16) 271 35.9%Watsonville-Marina (27) 60 7.9%MST On Call Marina 35 4.6%Pebble Beach Express (2X) 18 2.4%
Based on 2007 Census data, Marina has a population of approximately
25,378, yielding a 95-percent confidence level and a ±3.51 percent

MONTEREY-SALINAS TRANSIT – MARINA AREA SERVICE STUDY
MOORE & ASSOCIATES PAGE 9
margin of error. As expected, the highest number of surveys were
completed on Routes 20 (371) and 16 (271), and the lowest on Route 2X
(18). Of the 755 valid responses, 687 surveys were completed in English
(91 percent) and 68 in Spanish (9 percent).
Rider Profile
In analyzing the most frequently occurring responses, a profile of the
“typical” Monterey-Salinas Transit customer was developed. While this
profile does not reflect any single customer, it is representative of the
responses provided by MST riders during the survey period. Though the
primary intent of this survey was not to gain demographic insight into
current MST riders, some demographic information was obtained.
Based on the on-board survey data, the “typical” MST Marina rider lives
within Marina’s 93933 zip code (39.2 percent) and first became aware of
MST service by seeing the vehicles traveling around town (45.1 percent).
Once becoming a rider, they have ridden consistently at a rate of
approximately four or more days per week (62.4 percent) for at least a
year (59.8 percent). In the absence of MST service, they would rely on a
friend or family member for travel (42.3 percent). While traveling on the
most frequently used route – Route 20 (50.7 percent) – they typically walk
less than three blocks to reach the originating bus stop (50.2 percent).
Boarding the bus, they typically use cash fare (61.6 percent) and are most
likely traveling to either school (34.2 percent) or work (32.8 percent).
Although they have internet access at home (65 percent), they have not
likely visited the MST website (69.2 percent), nor have they used “Google
Transit” to plan a trip or access information regarding MST’s services (83.8
percent). Instead, the “typical” rider obtains information about MST on-
board the bus (44.4 percent) and has probably never used MST’s customer
information telephone service (57.2 percent). Given the profile rider
probably does not have a driver license (56 percent) or access to a
personal vehicle (63.8 percent), they rely on MST and are therefore
considered ride-dependent.

MONTEREY-SALINAS TRANSIT – MARINA AREA SERVICE STUDY
MOORE & ASSOCIATES PAGE 10
Though this Marina Area Service Study focuses primarily on the Marina
community, results from the on-board survey reveals a wide range of
residential location distribution. Respondents were asked to specify
residence zip code. Given the survey was conducted on routes primarily
serving the Marina area, the majority of respondents indicated residing in
Marina (39.2 percent). Within Exhibit 2.3 are other locations that yielded
significant results including Seaside (17.4 percent), Salinas (aggregate
16.9 percent across three zip codes), Monterey (6.8 percent), Castroville
(3.8 percent), Watsonville (3.2 percent) and Pacific Grove (1.7 percent). It
should be noted there were a total of 43 other zip codes indicated by
respondents. However, each yielded less than a one-percent response rate
and therefore was not considered statistically significant. Those 43 were
combined and included in Exhibit 2.3 under “Total Other” (11.1 percent).
Exhibit 2.3 Respondent Residence Location
City Zip Code Respondents PercentageMarina 93933 209 39.2%Seaside 93955 93 17.4%Monterey 93940 36 6.8%Salinas 93901 34 6.4%Salinas 93906 33 6.2%Salinas 93905 23 4.3%Castroville 95012 20 3.8%Watsonville 93950 17 3.2%Pacific Grove 95076 9 1.7%Total Other Various 59 11.1%
Travel Patterns
Several questions were posed regarding travel patterns. The resulting
information will help MST develop service improvements best suited to their
customers’ needs. Riders were asked which MST route/service do you ride
most often and were provided seven options to choose from: Pebble Beach
Express (Route 2X), Monterey-Salinas (Route 20), Marina On-Call,
Edgewater-Ryan Ranch (Route 6), Watsonville-Marina (Route 27),
Monterey-Marina (Route 16), and Other. Exhibit 2.4 indicates the

MONTEREY-SALINAS TRANSIT – MARINA AREA SERVICE STUDY
MOORE & ASSOCIATES PAGE 11
Monterey-Salinas Route 20 (50.7 percent) and Monterey-Marina Route 16
(33.7 percent) yielded the highest results, which is comparable to the
results found in both the 2008 ridership data (Exhibit 2.1) and the Survey
Sampling (Exhibit 2.2). It should be noted the information gained from
responses to this question provides additional insight into travel patterns
given the route the respondent most often uses can vary significantly from
the route the respondent was on at the time of the survey. Only 34
respondents selected the other option and the results were too diverse to
develop meaningful conclusions. Of those other routes selected, Route 1
(17.6 percent) and Routes 9, 23, and 28 (14.7 percent each) were the
most commonly-cited.
Exhibit 2.4 Route Selection
1.6%
50.7%
5.1%
1.1%
7.8%
33.7%
0.0%
10.0%
20.0%
30.0%
40.0%
50.0%
60.0%
Pebble BeachExpress (2X)
Monterey-Salinas (20) MST On Call Marina Edgewater-RyanRanch (6)
Watsonville-Marina(27)
Monterey-Marina (16)
Riders were asked if the surveyed trip included a transfer, and were then
asked to specify their selection if yes was their response. Participants were
given four options: Another MST bus/line, Santa Cruz Metro, RIDES (MST’s
ADA transportation service), or other. More than half of all respondents
indicated their trip did include a transfer (57.4 percent). Among those
responding yes, the vast majority originated from another MST/bus line
MONTEREY-SALINAS TRANSIT – MARINA AREA SERVICE STUDY
MOORE & ASSOCIATES PAGE 12
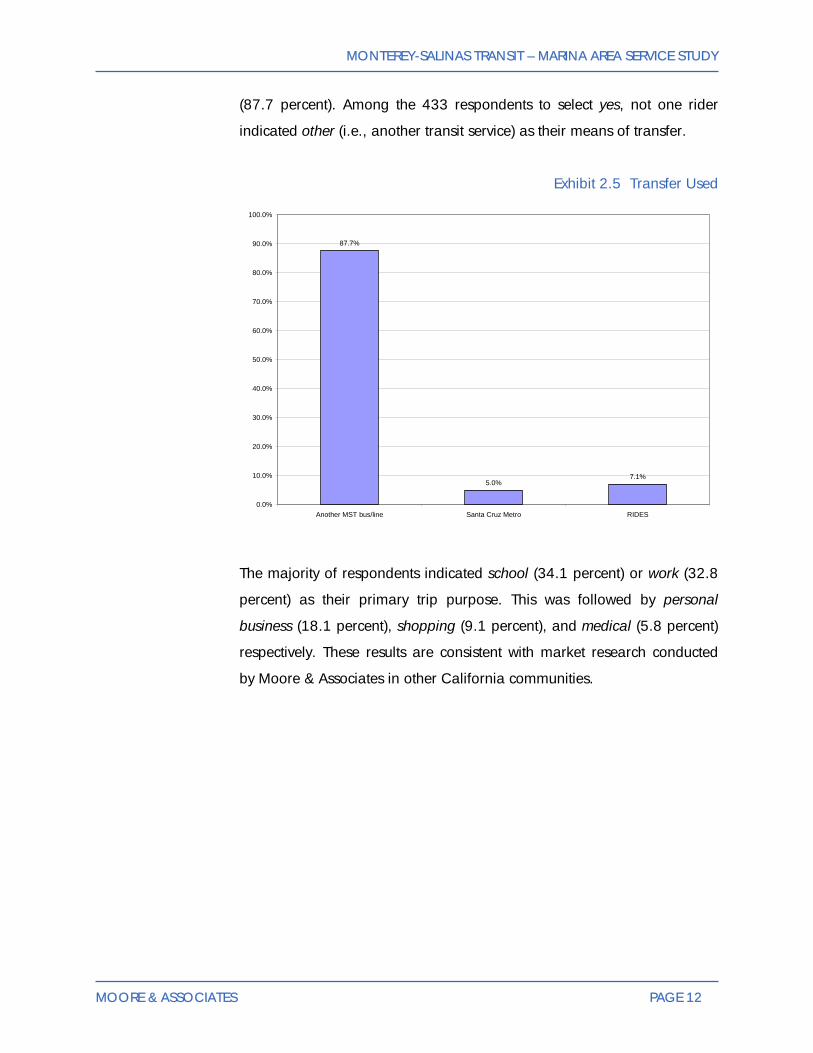
(87.7 percent). Among the 433 respondents to select yes, not one rider
indicated other (i.e., another transit service) as their means of transfer.
Exhibit 2.5 Transfer Used
87.7%
5.0%7.1%
0.0%
10.0%
20.0%
30.0%
40.0%
50.0%
60.0%
70.0%
80.0%
90.0%
100.0%
Another MST bus/line Santa Cruz Metro RIDES
The majority of respondents indicated school (34.1 percent) or work (32.8
percent) as their primary trip purpose. This was followed by personal
business (18.1 percent), shopping (9.1 percent), and medical (5.8 percent)
respectively. These results are consistent with market research conducted
by Moore & Associates in other California communities.

MONTEREY-SALINAS TRANSIT – MARINA AREA SERVICE STUDY
MOORE & ASSOCIATES PAGE 13
Exhibit 2.6 Trip Purpose
32.8%
18.1%
5.8%
9.1%
34.1%
0.0%
5.0%
10.0%
15.0%
20.0%
25.0%
30.0%
35.0%
40.0%
Work Personal Business School Shopping Medical
To gain further insight into patron travel behavior, we performed a data
cross-tabulation comparing respondents’ typical route and trip purpose.
The results reveal Route 16 is used overwhelmingly for school-related trips
(43.2 percent), which can be attributed to the fact it is the only traditional
fixed-route serving CSUMB that operates across the entire service day.
Routes 2X and 6 are typically used for work-related purposes (50.0 percent
for both). Marina On-Call is used equally often for personal business and
school-related trips (25.8 percent for each), while never used for medical
reasons. Route 20 is used nearly equally as-often for work and school-
related trips (33.6 and 33.2 percent, respectively).

MONTEREY-SALINAS TRANSIT – MARINA AREA SERVICE STUDY
MOORE & ASSOCIATES PAGE 14
Exhibit 2.7 Typical Route vs. Trip Purpose
50.0%
33.6%
35.5%
50.0%
38.3%
29.0%
10.0%
20.2%
25.8%
16.7%
21.3%
10.1%
10.0%
33.2%
25.8%
16.7%
23.4%
43.2%
10.0%
8.4%
12.9%
14.2%
20.0%
4.6%
16.7%
17.0%
3.6%
0% 10% 20% 30% 40% 50% 60% 70% 80% 90% 100%
Pebble Beach Express (2X)
Monterey-Salinas (20)
MST On Call Marina
Edgewater-Ryan Ranch (6)
Watsonville-Marina (27)
Monterey-Marina (16)
Work Personal Business School Shopping Medical
Riders were asked whether or not they were traveling with any person
under the age of 16, and if so, to specify how many. This query was posed
to assist in the development of service alternatives which may be beneficial
to riders traveling with children, as well as to further understand the travel
patterns of current riders. Though the majority of respondents indicated
they were not traveling with any children (88.4 percent), those stating they
were cited only one child as the most common response (40.5 percent).
Four or more was cited least often (12.6 percent).

MONTEREY-SALINAS TRANSIT – MARINA AREA SERVICE STUDY
MOORE & ASSOCIATES PAGE 15
Exhibit 2.8 Number of Children under the Age of 16 Traveling with Rider
1 40.5%2 30.3%3 16.4%4 or more 12.6%
Participants were also asked how often they typically ride MST. The top
response was four or more days per week (62.3 percent), followed by 2-3
days per week (22.1 percent). This reveals riders are not only using the
service consistently, but view MST as the “preferred” transportation option
for a significant share of their trips. This is considered to be a positive
finding in that MST is having success retaining existing riders.
Exhibit 2.9 Ridership Frequency
62.3%
22.1%
4.3% 4.0%
7.3%
0.0%
10.0%
20.0%
30.0%
40.0%
50.0%
60.0%
70.0%
4 or more days per week 2-3 days per month 2-3 days per week 1 day per week 1 day per month or less
A data cross-tabulation was run to compare frequency of usage with trip
purpose. This revealed riders using the service to travel to work are most
likely to ride four or more days per week (42.2 percent). Riders using MST
to travel to school were also more likely to use the service four or more
times per week (38.7 percent). Shopping (4.4 percent) and medical (4.4
MONTEREY-SALINAS TRANSIT – MARINA AREA SERVICE STUDY
MOORE & ASSOCIATES PAGE 16
percent) trip purposes yielded the lowest responses for persons most likely
to ride four or more days per week.
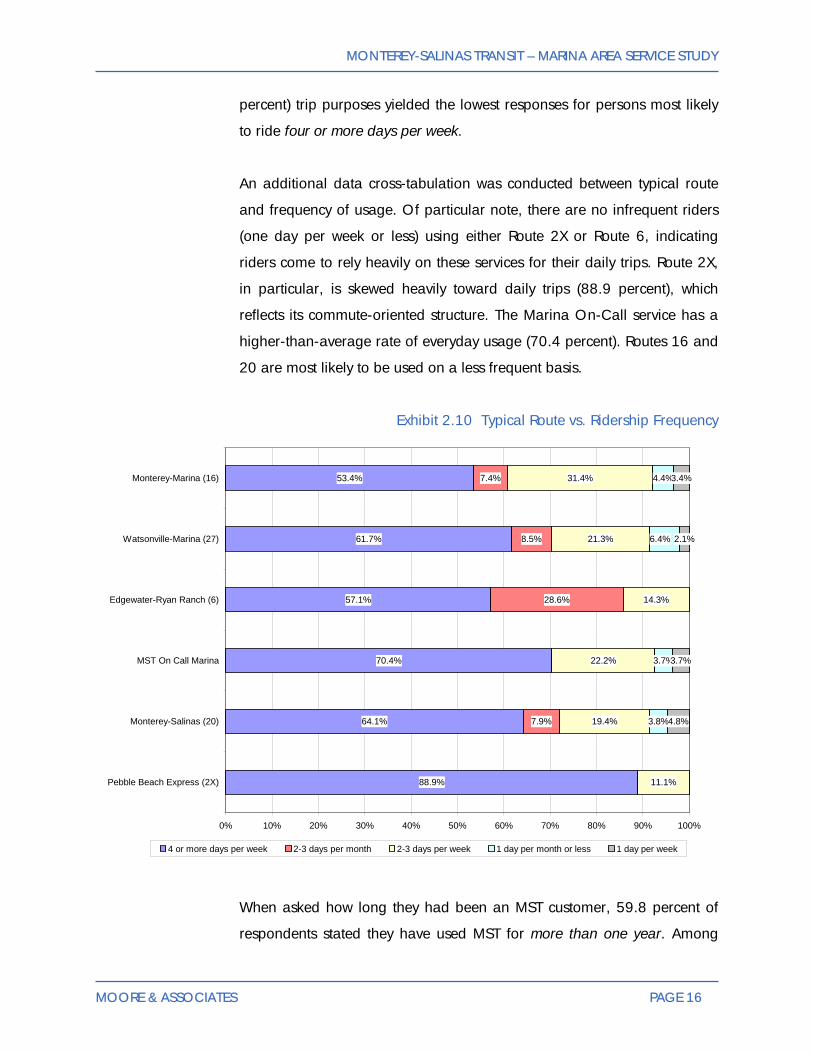
An additional data cross-tabulation was conducted between typical route
and frequency of usage. Of particular note, there are no infrequent riders
(one day per week or less) using either Route 2X or Route 6, indicating
riders come to rely heavily on these services for their daily trips. Route 2X,
in particular, is skewed heavily toward daily trips (88.9 percent), which
reflects its commute-oriented structure. The Marina On-Call service has a
higher-than-average rate of everyday usage (70.4 percent). Routes 16 and
20 are most likely to be used on a less frequent basis.
Exhibit 2.10 Typical Route vs. Ridership Frequency
88.9%
64.1%
70.4%
57.1%
61.7%
53.4%
7.9%
28.6%
8.5%
7.4%
11.1%
19.4%
22.2%
14.3%
21.3%
31.4%
3.8%
3.7%
4.4%
4.8%
3.7%
2.1%
3.4%
6.4%
0% 10% 20% 30% 40% 50% 60% 70% 80% 90% 100%
Pebble Beach Express (2X)
Monterey-Salinas (20)
MST On Call Marina
Edgewater-Ryan Ranch (6)
Watsonville-Marina (27)
Monterey-Marina (16)
4 or more days per week 2-3 days per month 2-3 days per week 1 day per month or less 1 day per week
When asked how long they had been an MST customer, 59.8 percent of
respondents stated they have used MST for more than one year. Among

MONTEREY-SALINAS TRANSIT – MARINA AREA SERVICE STUDY
MOORE & ASSOCIATES PAGE 17
the less frequent responses were less than three months (14.4 percent) and
3-6 months (9.2 percent). These results, much like those regarding service
frequency, reveal MST excels at retaining patrons.
Exhibit 2.11 Length of Use
14.4%16.5%
9.2%
59.8%
0.0%
10.0%
20.0%
30.0%
40.0%
50.0%
60.0%
70.0%
Less than 3 months 6-12 months 3-6 months More than 1 year
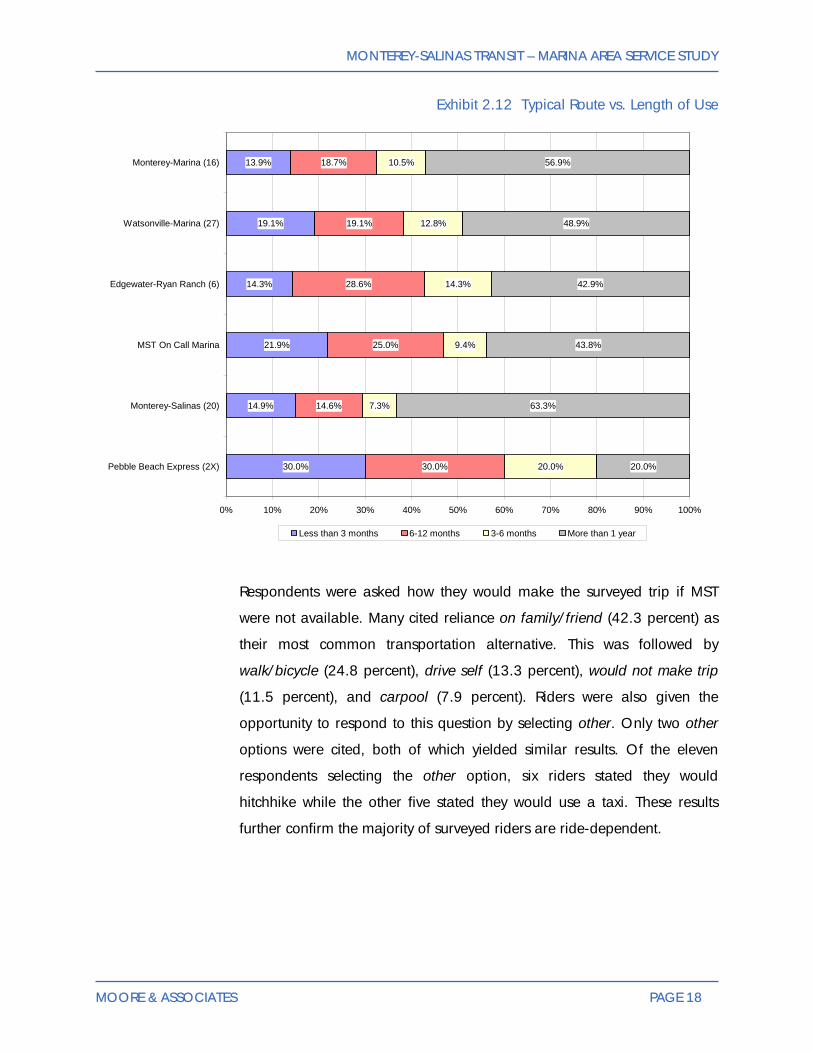
To analyze patron length of use more deeply, we conducted a data cross-
tabulation between typical route used and length of use. Results reveal
more respondents have been riding Route 20 for more than a year (63.3
percent), while the highest concentrations of new riders can be found on
Route 2X. This highlights that service’s value as a potential tool for
attracting new riders (i.e., new riders find it approachable and easy-to-
use), though it also has the lowest concentration of long-term riders (20.0
percent). Route 6 has the lowest concentration of new riders among the six
routes surveyed (14.3 percent), followed closely by Route 20 (14.9
percent). It should be noted, however, that while Route 20 has a relatively
low incidence of new riders, it has the highest ridership in the MST system,
and as such the total number of riders is significantly greater than Route
2X.
MONTEREY-SALINAS TRANSIT – MARINA AREA SERVICE STUDY
MOORE & ASSOCIATES PAGE 18
Exhibit 2.12 Typical Route vs. Length of Use
30.0%
14.9%
21.9%
14.3%
19.1%
13.9%
30.0%
14.6%
25.0%
28.6%
19.1%
18.7%
20.0%
7.3%
9.4%
14.3%
12.8%
10.5%
20.0%
63.3%
43.8%
42.9%
48.9%
56.9%
0% 10% 20% 30% 40% 50% 60% 70% 80% 90% 100%
Pebble Beach Express (2X)
Monterey-Salinas (20)
MST On Call Marina
Edgewater-Ryan Ranch (6)
Watsonville-Marina (27)
Monterey-Marina (16)
Less than 3 months 6-12 months 3-6 months More than 1 year
Respondents were asked how they would make the surveyed trip if MST
were not available. Many cited reliance on family/friend (42.3 percent) as
their most common transportation alternative. This was followed by
walk/bicycle (24.8 percent), drive self (13.3 percent), would not make trip
(11.5 percent), and carpool (7.9 percent). Riders were also given the
opportunity to respond to this question by selecting other. Only two other
options were cited, both of which yielded similar results. Of the eleven
respondents selecting the other option, six riders stated they would
hitchhike while the other five stated they would use a taxi. These results
further confirm the majority of surveyed riders are ride-dependent.

MONTEREY-SALINAS TRANSIT – MARINA AREA SERVICE STUDY
MOORE & ASSOCIATES PAGE 19
Exhibit 2.13 Transportation Alternatives
13.3%
7.9%
42.3%
11.5%
24.8%
0.0%
5.0%
10.0%
15.0%
20.0%
25.0%
30.0%
35.0%
40.0%
45.0%
Drive Self Carpool Rely on family/friend Would not make trip Walk/bicycle
To further analyze respondent transportation alternatives, we conducted a
data cross-tabulation with “typical route.” The results reveal the highest
concentrations of “choice” riders (i.e., respondents having access to
mobility options and transit) are on Routes 2X and 6 (25.0 percent and
33.3 percent). The highest concentrations of ride-dependent patrons were
on Routes 16 and 27 (7.1 and 11.6 percent, respectively).
Delving further into the results, assuming patrons indicating they would
walk or bicycle are using MST for shorter trips, the routes most often used
for short trips include Route 27 and Marina On-Call (32.6 percent and
30.8 percent, respectively). Given it has a high concentration of
respondents who would drive themselves, no one on Route 6 indicated
they would walk or bicycle if the service was unavailable.

MONTEREY-SALINAS TRANSIT – MARINA AREA SERVICE STUDY
MOORE & ASSOCIATES PAGE 20
Exhibit 2.14 Typical Route vs. Transportation Alternatives
25.0%
15.3%
15.4%
33.3%
11.6%
7.1%
12.5%
8.2%
7.7%
16.7%
4.7%
6.5%
50.0%
44.7%
38.5%
50.0%
34.9%
45.8%
10.6%
7.7%
16.3%
11.9%
12.5%
21.2%
30.8%
32.6%
28.6%
0% 10% 20% 30% 40% 50% 60% 70% 80% 90% 100%
Pebble Beach Express (2X)
Monterey-Salinas (20)
MST On Call Marina
Edgewater-Ryan Ranch (6)
Watsonville-Marina (27)
Monterey-Marina (16)
Drive Self Carpool Rely on family/friend Would not make trip Walk/bicycle
Survey participants were asked how they typically access MST at the
individual stop level. Among the responses specified, walked less than
three blocks was cited as the most common response (50.2 percent). The
next highest response was walked more than three blocks (39.5 percent),
yielding similar results. A modest number indicated they either rode a bike
(5.3 percent) or drove self (4.9 percent) as their means of accessing the
bus stop. Though many riders board and alight buses at multiple stops, we
observed the Marina Transit Exchange had little or no designated long-
term parking for transit riders. Parking at this station is primarily either
handicapped restricted or 15-minute parking (i.e., pick up/ drop off), both
of which are monitored by on-site security personnel. While it may be
difficult to quantify the direct effects this has on patronage, we believe it is
reasonable to assume this policy could act as a barrier to possible transit
use.

MONTEREY-SALINAS TRANSIT – MARINA AREA SERVICE STUDY
MOORE & ASSOCIATES PAGE 21
Respondents were also given the option to select transferred from another
bus and then were asked to specify the route from which they transferred.
Only 45 respondents selected this option, noting 19 different route/transfer
combinations including two transferring from the CSUMB shuttle (4.4
percent of transfers) and one respondent transferring from MST’s DART
service (2.2 percent of transfers). Though all numerically modest, the two
most noteworthy transfers were cited as Route 20 (22.2 percent of
transfers) and Route 27 (11.1 percent of transfers). All other cited transfers
were well below 10 percent and not considered significant enough to
warrant further analysis.
Exhibit 2.15 Transit Stop Access
4.9% 5.3%
39.5%
50.2%
0.0%
10.0%
20.0%
30.0%
40.0%
50.0%
60.0%
Drove self Rode bike Walked more than 3 blocks Walked less than 3 blocks
Fare Preferences
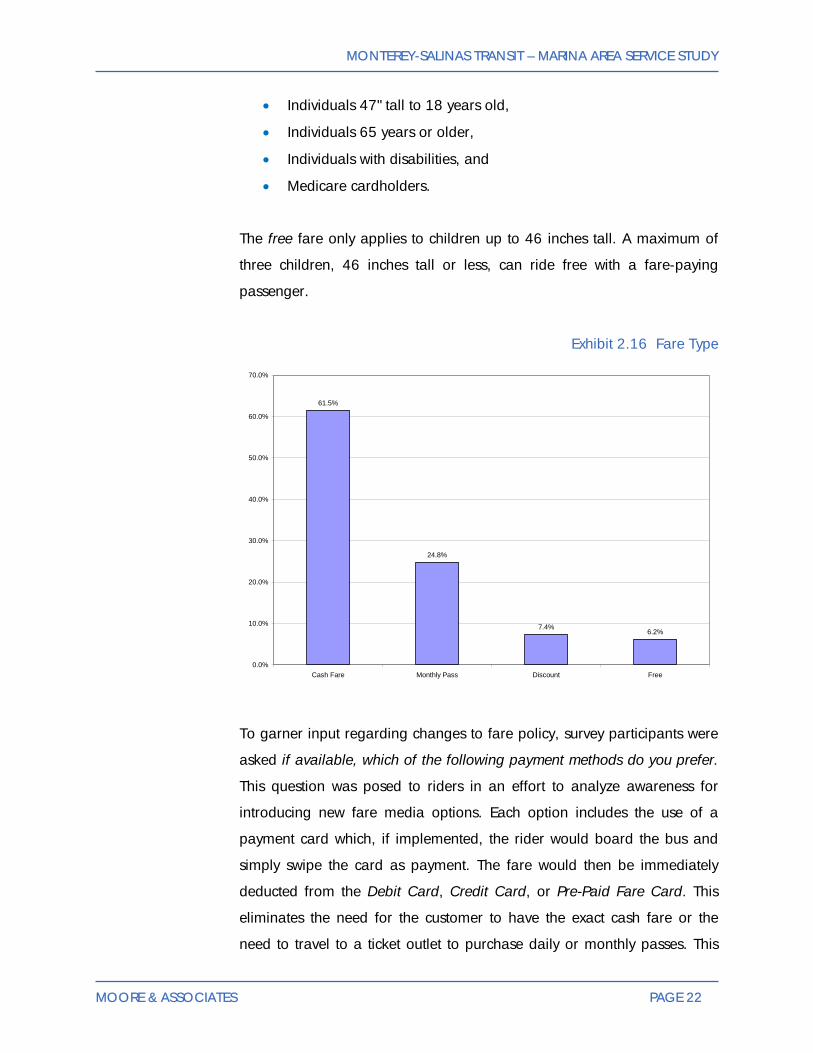
More than 60 percent of respondents cited paying their fare using the
standard cash fare. Payment through the use of a monthly pass (24.8
percent) was the next most commonly cited fare used, followed by discount
fare (7.4 percent) and free fare (6.2 percent). Discounted fares are about
half of the regular fare and are available to:
MONTEREY-SALINAS TRANSIT – MARINA AREA SERVICE STUDY
MOORE & ASSOCIATES PAGE 22
• Individuals 47" tall to 18 years old,
• Individuals 65 years or older,
• Individuals with disabilities, and
• Medicare cardholders.
The free fare only applies to children up to 46 inches tall. A maximum of
three children, 46 inches tall or less, can ride free with a fare-paying
passenger.
Exhibit 2.16 Fare Type
61.5%
24.8%
7.4%6.2%
0.0%
10.0%
20.0%
30.0%
40.0%
50.0%
60.0%
70.0%
Cash Fare Monthly Pass Discount Free
To garner input regarding changes to fare policy, survey participants were
asked if available, which of the following payment methods do you prefer.
This question was posed to riders in an effort to analyze awareness for
introducing new fare media options. Each option includes the use of a
payment card which, if implemented, the rider would board the bus and
simply swipe the card as payment. The fare would then be immediately
deducted from the Debit Card, Credit Card, or Pre-Paid Fare Card. This
eliminates the need for the customer to have the exact cash fare or the
need to travel to a ticket outlet to purchase daily or monthly passes. This

MONTEREY-SALINAS TRANSIT – MARINA AREA SERVICE STUDY
MOORE & ASSOCIATES PAGE 23
form of fare payment is relatively new to the transit industry and provides
greater convenience to patrons while minimizing administrative burden.
Among the options respondents were given, the pre-paid fare card was the
most commonly-cited (54.7 percent), followed by debit card (33.3
percent), and credit card (11.8 percent).
Exhibit 2.17 Alternative Fare Payment Preference
33.3%
11.8%
54.7%
0.0%
10.0%
20.0%
30.0%
40.0%
50.0%
60.0%
Debit Card Credit Card Pre-paid Fare Card
Information Awareness
At the request of MST, we queried riders regarding their awareness of the
free bus zone at CSUMB, which allows anyone to board MST buses for free
at any stop in the CSUMB central and east residential campuses. Noting
that 34.1 percent of respondents indicated their primary trip purpose as
school, the data revealed the majority of riders were aware of this service
(53.2 percent). A data cross-tabulation was run to compare respondent
trip purpose with service awareness. Sixty-three percent stated their primary
trip purpose was school knew about this CSUMB service, which was the
highest result of the cross-tabulation. Those least likely to know about this
service were respondents citing personal business as their primary trip
purpose (61.9 percent responding no).

MONTEREY-SALINAS TRANSIT – MARINA AREA SERVICE STUDY
MOORE & ASSOCIATES PAGE 24
Exhibit 2.18 Trip Purpose vs. Awareness of CSUMB Free Bus Zone
50.9%
63.0%60.9%
44.4%
49.1%
61.9%
39.1%
55.6%
38.1% 37.0%
0.0%
10.0%
20.0%
30.0%
40.0%
50.0%
60.0%
70.0%
Work Personal Business School Shopping Medical
Yes No
To clarify the results of this question, another data cross-tabulation was
conducted between awareness of the CSUMB fare-free zone and typical
route used. Results reveal awareness of the free-fare zone varies
dramatically depending upon which route the patron typically uses. Patrons
using Route 2X are virtually unaware of the zone (11.1 percent), while
patrons on Route 16 are much more familiar (78.5 percent). Patrons using
other routes are generally split evenly.

MONTEREY-SALINAS TRANSIT – MARINA AREA SERVICE STUDY
MOORE & ASSOCIATES PAGE 25
Exhibit 2.19 Typical Route vs. Awareness of CSUMB Free Bus Zone
11.1%
36.5%
53.8%
50.0%
48.8%
78.5%
88.9%
63.5%
46.2%
50.0%
51.2%
21.5%
0% 10% 20% 30% 40% 50% 60% 70% 80% 90% 100%
Pebble Beach Express (2X)
Monterey-Salinas (20)
MST On Call Marina
Edgewater-Ryan Ranch (6)
Watsonville-Marina (27)
Monterey-Marina (16)
Yes No
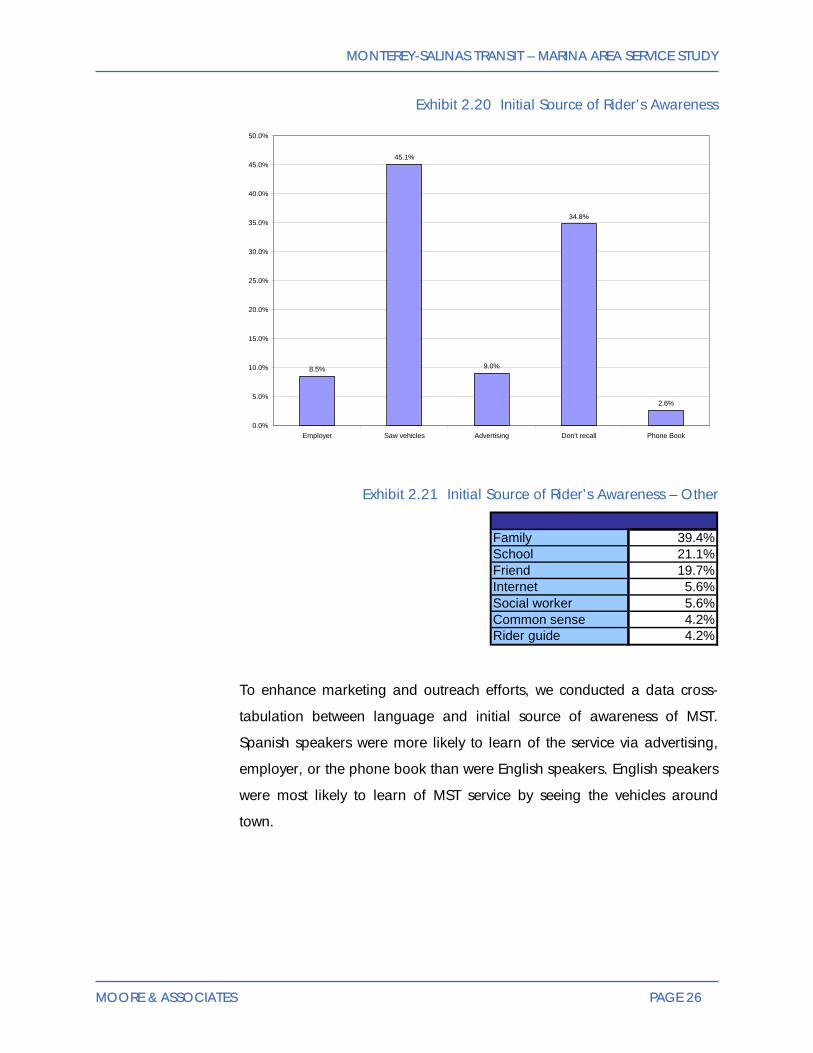
Riders were questioned as to how they first became aware of MST and
were then given five possible choices (88.9 percent): employer, saw
vehicles, advertising, don’t recall, phone book, and other (11.1 percent).
Of the 88.9 percent selecting the stipulated options, the most common
response was saw vehicles (45.1 percent) followed by don’t recall (34.8
percent), advertising (9.0 percent), employer (8.5 percent), and phone
book (2.6 percent). The 11.1 percent selecting other cited various other
information sources, family being the most common (39.4 percent). It is
clear MST is its own best current advertising platform.
MONTEREY-SALINAS TRANSIT – MARINA AREA SERVICE STUDY
MOORE & ASSOCIATES PAGE 26
Exhibit 2.20 Initial Source of Rider’s Awareness
8.5%
45.1%
9.0%
34.8%
2.6%
0.0%
5.0%
10.0%
15.0%
20.0%
25.0%
30.0%
35.0%
40.0%
45.0%
50.0%
Employer Saw vehicles Advertising Don't recall Phone Book
Exhibit 2.21 Initial Source of Rider’s Awareness – Other
Family 39.4%School 21.1%Friend 19.7%Internet 5.6%Social worker 5.6%Common sense 4.2%Rider guide 4.2%
To enhance marketing and outreach efforts, we conducted a data cross-
tabulation between language and initial source of awareness of MST.
Spanish speakers were more likely to learn of the service via advertising,
employer, or the phone book than were English speakers. English speakers
were most likely to learn of MST service by seeing the vehicles around
town.

MONTEREY-SALINAS TRANSIT – MARINA AREA SERVICE STUDY
MOORE & ASSOCIATES PAGE 27
Exhibit 2.22 Language vs. Initial Source of Awareness
7.9%
14.0%
46.5%
30.0%
7.9%
20.0%
35.3%
30.0%
2.3%
6.0%
0% 10% 20% 30% 40% 50% 60% 70% 80% 90% 100%
English
Spanish
Employer Saw vehicles Advertising Don't recall Phone Book
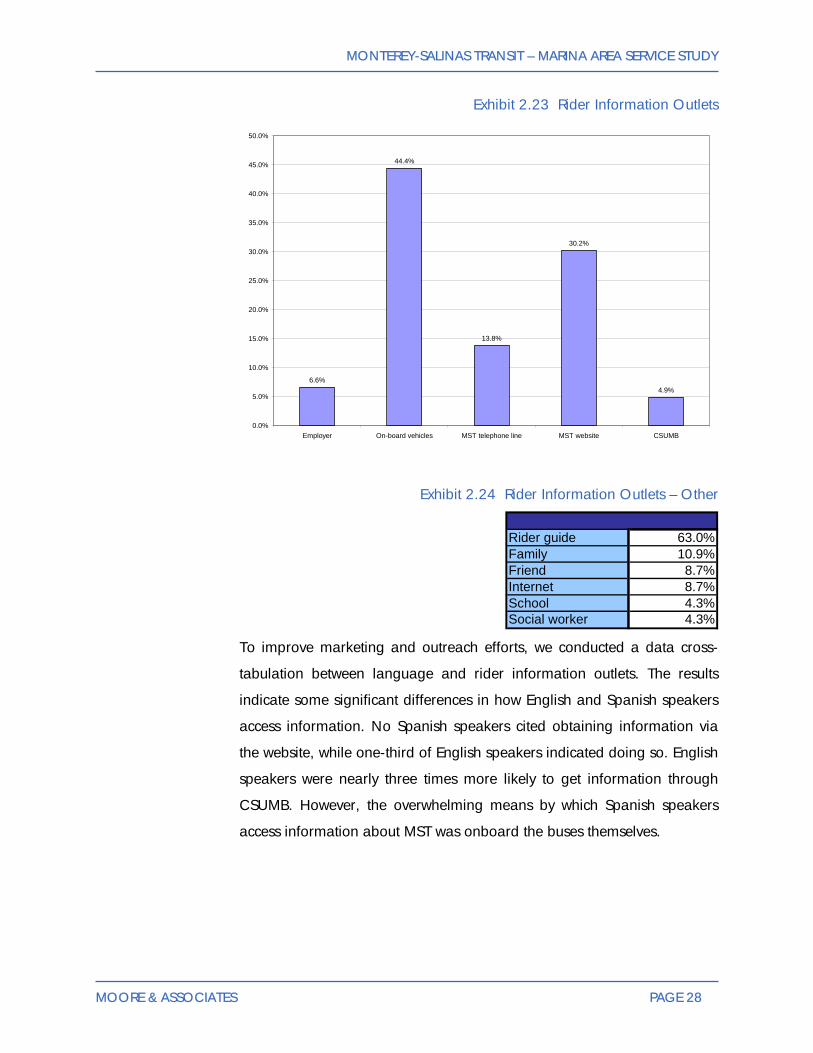
Riders were questioned about where they typically obtain information
regarding MST services. Similar to transit market research conducted in
other California communities, respondents indicated they find MST
information on-board vehicles (44.4 percent). This was followed by MST
website (30.2 percent), MST telephone line (13.8 percent), employer (6.6
percent), and CSUMB (4.9 percent). Respondents were also given the
option to select other, and then specify a different promotional outlet. A
total of 7.4 percent selected other as an option and the MST rider guide
was the most commonly-cited other response (63.0 percent).
MONTEREY-SALINAS TRANSIT – MARINA AREA SERVICE STUDY
MOORE & ASSOCIATES PAGE 28
Exhibit 2.23 Rider Information Outlets
6.6%
44.4%
13.8%
30.2%
4.9%
0.0%
5.0%
10.0%
15.0%
20.0%
25.0%
30.0%
35.0%
40.0%
45.0%
50.0%
Employer On-board vehicles MST telephone line MST website CSUMB
Exhibit 2.24 Rider Information Outlets – Other
Rider guide 63.0%Family 10.9%Friend 8.7%Internet 8.7%School 4.3%Social worker 4.3%
To improve marketing and outreach efforts, we conducted a data cross-
tabulation between language and rider information outlets. The results
indicate some significant differences in how English and Spanish speakers
access information. No Spanish speakers cited obtaining information via
the website, while one-third of English speakers indicated doing so. English
speakers were nearly three times more likely to get information through
CSUMB. However, the overwhelming means by which Spanish speakers
access information about MST was onboard the buses themselves.

MONTEREY-SALINAS TRANSIT – MARINA AREA SERVICE STUDY
MOORE & ASSOCIATES PAGE 29
Exhibit 2.25 Language vs. Information Outlets
6.7%
5.6%
41.6%
72.2%
13.2%
20.4%
33.3% 5.2%
1.9%
0% 10% 20% 30% 40% 50% 60% 70% 80% 90% 100%
English
Spanish
Employer On-board vehicles MST telephone line MST website CSUMB
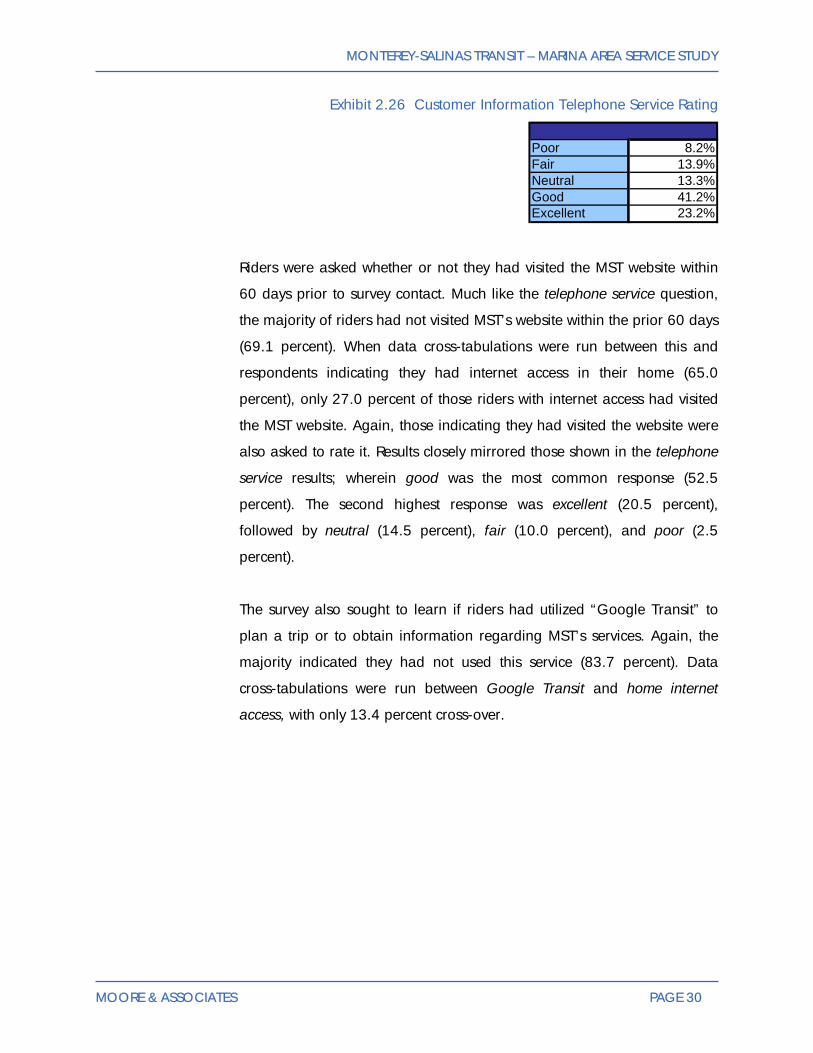
Respondents were queried whether or not they have utilized the MST
customer information telephone service. The majority indicated they had
not (57.2 percent). This data is consistent with findings that the majority of
riders state they receive their information on-board vehicles (44.4 percent).
Those indicating using the service (42.7 percent) were asked to rate it. The
results reveal the majority of those using the telephone service consider it
to be good (41.2 percent) or excellent (23.2 percent). These results reveal
MST’s customer information telephone service is meeting customers’
needs, but may also have room for improvement. Those that were neutral
comprised 13.3 percent, while those believing the service to be fair made
up 13.9 percent. Poor garnered the fewest responses (8.2 percent).
MONTEREY-SALINAS TRANSIT – MARINA AREA SERVICE STUDY
MOORE & ASSOCIATES PAGE 30
Exhibit 2.26 Customer Information Telephone Service Rating
Poor 8.2%Fair 13.9%Neutral 13.3%Good 41.2%Excellent 23.2%
Riders were asked whether or not they had visited the MST website within
60 days prior to survey contact. Much like the telephone service question,
the majority of riders had not visited MST’s website within the prior 60 days
(69.1 percent). When data cross-tabulations were run between this and
respondents indicating they had internet access in their home (65.0
percent), only 27.0 percent of those riders with internet access had visited
the MST website. Again, those indicating they had visited the website were
also asked to rate it. Results closely mirrored those shown in the telephone
service results; wherein good was the most common response (52.5
percent). The second highest response was excellent (20.5 percent),
followed by neutral (14.5 percent), fair (10.0 percent), and poor (2.5
percent).
The survey also sought to learn if riders had utilized “Google Transit” to
plan a trip or to obtain information regarding MST’s services. Again, the
majority indicated they had not used this service (83.7 percent). Data
cross-tabulations were run between Google Transit and home internet
access, with only 13.4 percent cross-over.

MONTEREY-SALINAS TRANSIT – MARINA AREA SERVICE STUDY
MOORE & ASSOCIATES PAGE 31
Exhibit 2.27 Website Rating
Poor 2.5%Fair 10.0%Neutral 14.5%Good 52.5%Excellent 20.5%
Service Attributes
Respondents were asked to rate, on a scale on one to five (wherein one
equals poor and five equals excellent), an array of service attributes.
Ratings equate to the following satisfaction indicators:
• 5=Excellent
• 4=Good
• 3=Neutral
• 2=Fair
• 1=Poor
All responses were rated similarly and no response fell below three
(neutral). The highest rated attribute was safety on-board (4.07), which was
rated slightly higher than “good.” The lowest rated attribute was cost
(3.09) which fell slightly higher than “neutral.” Though the majority of
respondents indicated they opt to ride MST given absence of a personal
vehicle (63.8 percent) over cost (10.7 percent), cost still seems to be a
significant influencer in how current riders view the service.
Exhibit 2.28 Service Attribute Rating
Attribute AverageOn-time performance 3.84Cost 3.09Convenience 3.79Hours of operation 3.60Comfort on-board 3.94Safety on-board 4.07Seating availability 3.95Frequency of service 3.63Proximity of bus stop to your destination 3.91Connectivity with other transit 3.88
MONTEREY-SALINAS TRANSIT – MARINA AREA SERVICE STUDY
MOORE & ASSOCIATES PAGE 32
While the data reveal the majority of patrons are satisfied with MST’s
service attributes, attention still needs to be paid to the perception that
certain attributes carry with them. Though cost may not necessarily be a
deciding factor for current riders, the perception is that fares could always
be lower. Issues such as this can benefit from simple marketing techniques
presenting the customer with costs associated with other, less cost-efficient
means of transportation or services. By providing the rider with insight into
MST’s cost-value, this perception may be neutralized.
Demographics
Because this survey was designed to be as “non-intrusive” to MST riders as
possible, minimal demographic information was requested. Of the few
demographic-based questions, riders were queried as to internet access at
home. The majority of respondents stated that they did have internet
access (65 percent), which can be useful when developing new and
innovative forms of marketing and online services for current and future
riders. As previously detailed in this chapter, the rider was also asked to
provide their home zip code, to which 93933 (Marina) was the most
commonly-cited response (39.2 percent). Refer to Exhibit 2.3 for a more
detailed account of the data.
Respondents were queried as to the principle motivating factor influencing
their selection of MST. The majority selected lack of car (63.8 percent).

MONTEREY-SALINAS TRANSIT – MARINA AREA SERVICE STUDY
MOORE & ASSOCIATES PAGE 33
Exhibit 2.29 Selection Motivator
10.7%
18.6%
63.8%
6.8%
0.0%
10.0%
20.0%
30.0%
40.0%
50.0%
60.0%
70.0%
Cost Proximity to my destination Lack of car Avoid traffic/parking
Respondents were also asked whether or not they have a valid driver
license and whether or not they had access to a personal vehicle. The
majority of respondents had neither a valid driver license (56.0 percent),
nor access to a personal vehicle (73.7 percent). Data cross-tabulations for
both of these responses were run against their stated motivation. A total of
84.2 percent cited their selection of MST was motivated by a lack of car
also had no access to a personal vehicle, while only 59.2 percent of
respondents who cited the same influences had no valid driver license.
Of the total survey sample, only 19 percent of respondents cited that they
had both a valid driver license and access to a personal vehicle.
Approximately 48 percent were found to be completely ride-dependent,
meaning they have neither a valid driver license nor access to a personal
vehicle.

MONTEREY-SALINAS TRANSIT – MARINA AREA SERVICE STUDY
MOORE & ASSOCIATES PAGE 34
This Page Intentionally Left Blank.

MONTEREY-SALINAS TRANSIT – MARINA AREA SERVICE STUDY
MOORE & ASSOCIATES PAGE 35
3. COMMUNITY SURVEY ANALYSIS

MONTEREY-SALINAS TRANSIT – MARINA AREA SERVICE STUDY
MOORE & ASSOCIATES PAGE 36
CHAPTER 3 – COMMUNITY SURVEY ANALYSIS
This chapter presents key findings and analysis from the community
intercept survey conducted on behalf of Monterey-Salinas Transit (MST) in
March 2009. Key survey findings focus on demographics, non-rider
perceptions and characteristics, as well as barriers to possible use of MST.
Moore & Associates conducted a community intercept survey at retail
locations of persons residing specifically in Marina, across the week of
March 2, 2009. Survey instruments were developed to solicit information
chiefly from the transit non-rider population. The instruments were
developed through a process that maintained a set of distinct goals specific
to the population of Marina. These goals included:
• Transition non-riders into potential and regular users of MST
services;
• Identify the needs, perceptions, concerns, and barriers to use of
Marina’s transit non-rider population;
• Identify service enhancements aimed at attracting new transit riders
and improving mobility for existing transit users;
• Identify marketing strategies and appropriate media outlets aimed
at maximizing service communication; and
• Develop a valid community-based profile of the Marina area
including demographics, perceptions, travel patterns, and lifestyle.
Methodology
During our project initiation meeting, Moore & Associates and MST staff
determined that a minimum of 200 community-based intercept surveys
were necessary to achieve the project’s goals and provide a valid and
detailed profile of Marina’s non-rider population. The intercept survey
instrument was developed and tested for validity by requiring the
respondent to verify he or she was at least 16 years of age. After the
minimum age was verified, respondents were asked to complete the rest of

MONTEREY-SALINAS TRANSIT – MARINA AREA SERVICE STUDY
MOORE & ASSOCIATES PAGE 37
the survey in either English or Spanish. Though the intercept survey was
primarily developed to gain insight into the perceptions of the non-rider
community in the Marina area, non-rider and rider questions were both
included. On an aggregate basis, sixty percent had not used MST’s
services within 60 days of the survey contact, while the remaining forty
percent indicated doing so.
The intercept surveys were completed over the course of two days:
Tuesday, March 3 and Wednesday, March 4. It was also determined
through discussions with MST staff that two key locations would yield the
greatest probable participation:
• Wal-Mart – located at 150 Beach Road, and
• Save Mart – located at 210 Reservation Road.
In an effort to maximize participation, each respondent was offered the
opportunity to be entered into a random drawing for a one hundred dollar
gift certificate from the respective location depending on where the survey
was administered. To be entered into the drawing, respondents were asked
to simply provide their names and phone numbers and were assured the
information gathered would not be used for any other purposes other than
notification of award. Over the two-day period, 266 valid surveys were
completed between the two locations. Based on 2007 Census data,
Marina has a population of approximately 25,378, yielding 95-percent
confidence level and a ±5.98 percent margin of error.
Though this Marina Area Service Study focuses primarily on the Marina
community, results from the survey show a wide range of residential
location distribution. Respondents were queried as to the location of their
residence and were given six options: Marina, Sand City, Salinas, Seaside,
Monterey, and “Other.” Eighty-six percent of respondents selected one of
the five specified location options while the remaining fourteen percent
selected “Other” option. Given the location at which the community
surveys were administered, Marina yielded the highest response of the five

MONTEREY-SALINAS TRANSIT – MARINA AREA SERVICE STUDY
MOORE & ASSOCIATES PAGE 38
specified location options (70.9 percent); followed by Seaside (12.4
percent), Salinas (8.3 percent), Monterey (6.9 percent) and Sand City (1.4
percent).
Exhibit 3.1 Respondent Residence Location
70.9%
1.4%
8.3%
12.4%
6.9%
0.0%
10.0%
20.0%
30.0%
40.0%
50.0%
60.0%
70.0%
80.0%
Marina Sand City Salinas Seaside Monterey
Those respondents selecting “Other” were asked to specify their residential
location. The data from respondents that selected this option yielded a
wide array of locations.

MONTEREY-SALINAS TRANSIT – MARINA AREA SERVICE STUDY
MOORE & ASSOCIATES PAGE 39
Exhibit 3.2 Respondent Residence Location – Other
Location PercentCarmel 1.5%Castroville 5.6%Fort Orsa 0.4%Gonzales 0.8%Montgomery 0.4%Moss Landing 0.8%Pacific Grove 1.5%Prundale 0.4%San Francisco 0.4%Santa Cruz 0.4%Scotts Valley 0.4%Soledad 0.4%Watsonville 0.8%Total 13.5%
Community Profile
By compiling the most frequently-cited responses, a profile of a “typical”
Marina resident was developed. It should be noted this profile does not
represent any single community respondent, but rather is a microcosm of
responses received.
The “typical” Marina area non-rider is female (52.5 percent) between the
ages of 45 and 54 years (26.0 percent). She speaks English (93.6
percent), which also happens to be the primary language spoken in her
household (87 percent). She is employed full-time (33.1 percent) and
though she declined to state her personal income (25.6 percent), her
approximate household income is $20,000 or less per year (24.4 percent).
Her highest level of education is twelfth grade (22.2 percent). She has a
valid driver license (81.8 percent) and access to a vehicle for personal use
(84.1 percent). Although she probably does not subscribe to a newspaper
(72.4 percent), if she did it would be the Monterey County “Herald.” When
she listens to the radio, she prefers 102.5 FM (16.2 percent), has internet
access at home (69.8 percent), but has never visited the MST website (80.4
percent), nor planned a trip using “Google Transit” (86.6 percent).
Because she is a non-rider with a valid driver license and access to a
vehicle, she relies on her vehicle as her preferred mode (75.3 percent).

MONTEREY-SALINAS TRANSIT – MARINA AREA SERVICE STUDY
MOORE & ASSOCIATES PAGE 40
Non-Rider Responses
Fewer respondents identified themselves as “non-riders” than identified in
similar intercept surveys conducted by Moore & Associates in other
California communities. Combined responses from both Save Mart and
Wal-Mart revealed only sixty percent of respondents had not ridden MST
within the prior 60 days. Community intercept surveys are aimed primarily
at the non-rider population by selecting intercept locations that are
generally auto-friendly, with high traffic and large parking lots. Though
these locations selected by MST and Moore & Associates met those criteria,
we learned many respondents were no stranger to MST’s services. Though
non-riders were still in the majority, it was important to identify the barriers
to usage that exist among Marina residents.
Survey results regarding barriers to use revealed responses common
among transit non-riders throughout California. It is no secret many
individuals still prefer their personal vehicle versus public transit. This
pattern was evident in Marina. When queried as to the primary reason the
respondent had not used MST within the prior 60 days, the most
frequently-cited response was vehicle for personal use (76.4 percent).
When we compared this with the incidence of respondents – both riders
and non-riders – who were asked whether or not they simply had access to
a vehicle, the response was comparable (81.6 percent of the combined
rider and non-rider responses indicated they did have access to a vehicle
for personal use). The next most frequently-cited reason for not using
transit was does not go where I need it to go (14.0 percent). It should be
noted respondents were also given the option to check the other category
and then specify their response. However, only four respondents selected
this option and all cited different reasons for not riding transit. Therefore,
such responses were not considered significant enough to make a valid
finding.

MONTEREY-SALINAS TRANSIT – MARINA AREA SERVICE STUDY
MOORE & ASSOCIATES PAGE 41
Exhibit 3.3 Barriers to Usage
14.0%
3.4% 2.2%0.6%
3.4%
76.4%
0.0%
10.0%
20.0%
30.0%
40.0%
50.0%
60.0%
70.0%
80.0%
90.0%
Does not go where Ineed it to go
Does not runfrequently enough
Does not travel whereI need it to
Is unreliable Costs too much Have a vehicle forpersonal use
Non-rider respondents were then asked to indicate the whether or not they
would consider using MST if their normal method of travel was not
available. The majority of respondents cited yes (81.0 percent), followed by
maybe (12.2 percent), and finally no (6.9 percent). Respondents were next
asked to indicate the likelihood of using MST within the three months by
using a five-point scale, wherein one equaled “not likely” and five “very
likely”.
The average response, or mean score, was calculated so as to assign an
aggregate value to “transit propensity.” The average rating was 2.71,
revealed the “profile” respondent is between “somewhat unlikely” and
“neutral” (or undecided). These results are slightly higher than responses
received from other similar transit market research efforts, wherein findings
suggest the average respondent is usually “unlikely” to ride public transit if
they identify themselves as non-riders.
Data cross-tabulations were run in an effort to gain further insight
regarding respondents’ tendency to choose whether or not to ride MST.

MONTEREY-SALINAS TRANSIT – MARINA AREA SERVICE STUDY
MOORE & ASSOCIATES PAGE 42
Using demographic data gathered through the intercept surveys, we
compared certain answers with the rating scale detailed above. The first
comparison we made was the respondents’ likelihood to use MST versus
their employment status. Exhibit 3.4 shows respondents employed part-time
have the greatest likelihood of using MST’s services within the next three
months (3.5 rating). Those least likely to use MST were respondents
identifying themselves as retired (2.11 rating). It should be noted that some
questions in the intercept survey, including the employment question, also
provided respondents the option to decline to respond, to which some (but
very few) cited as their response. Therefore, these responses were not
included in this analysis.
Exhibit 3.4 Propensity to Ride vs. Employment Category
Category RatingEmployed-part time 3.50Homemaker 2.92Self-employed 2.84Unemployed, looking for work 2.72Employed-full time 2.56Student 2.33Retired 2.11
Next we compared the respondents’ likelihood to ride with household
income. Fairly typical results were realized, finding that respondents more
likely to use MST’s services within the next few months indicated an income
in the lower categories provided. Results indicated that those more likely to
ride MST have a lower household income than those less likely to ride,
which is often the case in other transit market research efforts. Though
usually found in the lowest income bracket, respondents most likely to use
MST were found to be in the second lowest category, earning an
approximate household income of $20,001-$30,000 (3.38 rating). Again,
decline to respond was also offered as an option when questioned as to
household income. In this case, the majority of respondents selected this
response over any other option (25.6 percent). The data generated in

MONTEREY-SALINAS TRANSIT – MARINA AREA SERVICE STUDY
MOORE & ASSOCIATES PAGE 43
Exhibit 3.5 only includes those responses where an income amount was
cited.
Exhibit 3.5 Propensity to Ride vs. Household Income
Category Rating$20,000 and below 3.06$20,001-$30,000 3.38$30,001-$40,000 2.07$40,001-$50,000 3$50,001-$75,000 2.5$75,001-$100,000 2.73More than $100,000 2.67
One of the primary goals of this survey was to identify service
enhancements, which, if introduced, could result in increased ridership.
Here again, the survey yielded responses similar to those realized with
other California transit programs. Respondents indicated if they had a bus
stop closer to their house, they might be more willing to ride MST (26.3
percent). The data also indicate a high percentage of respondents could
not be attracted regardless of potential improvement.
Exhibit 3.6 Preferred Enhancement
26.3%
11.6%
10.1%
7.6%
11.6%
8.1%
24.7%
0.0%
5.0%
10.0%
15.0%
20.0%
25.0%
30.0%
Bus stop closer tomy house
More frequentservice
Shorter travel time Earlier operatinghours
Later operatinghours
More weekendservice
Nothing wouldchange my mind

MONTEREY-SALINAS TRANSIT – MARINA AREA SERVICE STUDY
MOORE & ASSOCIATES PAGE 44
This question also provided respondents with the option to indicate if a
different destination might encourage their use of MST, and then to specify
their response. Though most respondents did not select this option, the few
that did cited that service to Big Sur, Carmel, Old Lighthouse, Scotts Valley,
Wal-Mart (location unspecified) and Target (location unspecified) could
encourage their use of MST.
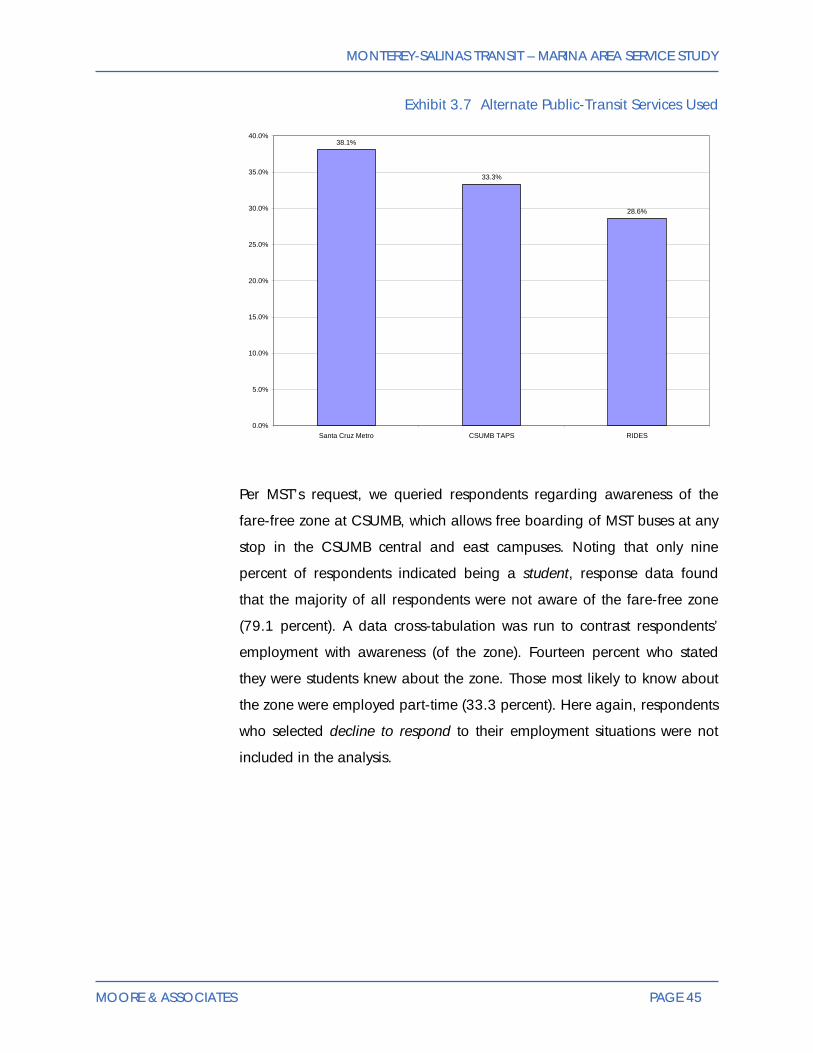
Respondents were then invited to compare MST with other transit services
in the region. First, respondents were asked if they had ridden any other
transit service besides MST within the prior 90 days. The majority had not
(77.5 percent). If the respondent indicated positively, they were then asked
to select one of three options: Santa Cruz Metro, California State
University—Monterey Bay Transportation and Parking Services (CSUMB
TAPS), or RIDES (MST’s ADA service). Respondents were then asked to
compare these alternate services with MST. Of the 22.5 percent of non-
riders indicating use of one of these alternative transit services, Santa Cruz
Metro was the most common response (38.1 percent). Though the majority
of respondents responded don’t know (44.9 percent), those that did
compare the services cited MST as better (27.5 percent).
MONTEREY-SALINAS TRANSIT – MARINA AREA SERVICE STUDY
MOORE & ASSOCIATES PAGE 45
Exhibit 3.7 Alternate Public-Transit Services Used
38.1%
33.3%
28.6%
0.0%
5.0%
10.0%
15.0%
20.0%
25.0%
30.0%
35.0%
40.0%
Santa Cruz Metro CSUMB TAPS RIDES
Per MST’s request, we queried respondents regarding awareness of the
fare-free zone at CSUMB, which allows free boarding of MST buses at any
stop in the CSUMB central and east campuses. Noting that only nine
percent of respondents indicated being a student, response data found
that the majority of all respondents were not aware of the fare-free zone
(79.1 percent). A data cross-tabulation was run to contrast respondents’
employment with awareness (of the zone). Fourteen percent who stated
they were students knew about the zone. Those most likely to know about
the zone were employed part-time (33.3 percent). Here again, respondents
who selected decline to respond to their employment situations were not
included in the analysis.

MONTEREY-SALINAS TRANSIT – MARINA AREA SERVICE STUDY
MOORE & ASSOCIATES PAGE 46
Exhibit 3.8 Awareness of CSUMB Free Bus Zone vs. Employment
20.0%
9.1%
73.9%71.4%
80.0%
90.9%
28.6%
14.3%
26.1%33.3%
22.0%
85.7%
78.0%
66.7%
0.0%
10.0%
20.0%
30.0%
40.0%
50.0%
60.0%
70.0%
80.0%
90.0%
100.0%
Employed-full time Employed-parttime
Self-employed Student Retired Homemaker Unemployed,looking for work
Yes No
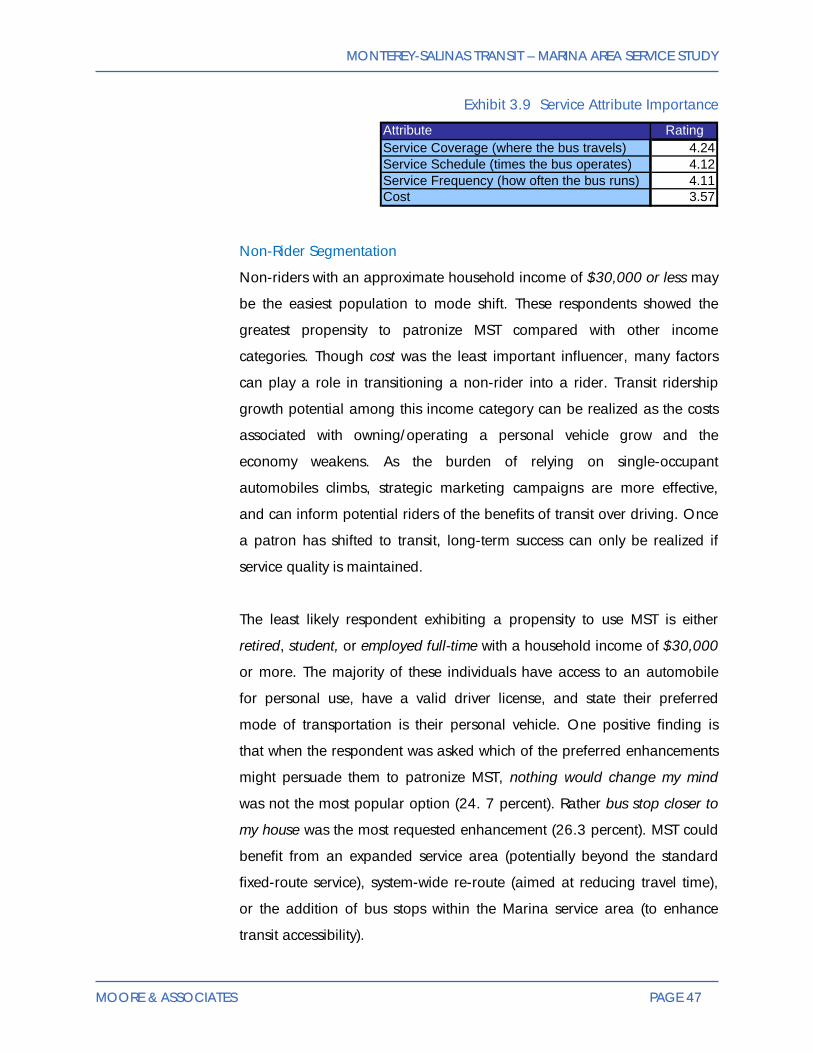
To both attract new riders and enhance mobility for existing ones, it is
critical to determine which specific transit-related variables are most
important. With this in mind, the intercept survey included another rating
scale, much like the one detailed above. This scale was aimed at soliciting
preferences as to which transit-based factors respondents consider most
important.
• Cost,
• Service frequency (how often the bus operates),
• Service schedule (times the bus operates), and
• Service coverage (where the bus travels).
Respondents were asked to indicate on a five-point scale (one being “not
important” and five being “very important”), to rate each variable (as they
pertain to the respondents selection of MST as a travel option). Though
similar as to relative importance, the findings suggest cost is the least
important to non-riders in deciding whether or not to use MST (3.57
rating), while service coverage is the most important (4.24 rating).
MONTEREY-SALINAS TRANSIT – MARINA AREA SERVICE STUDY
MOORE & ASSOCIATES PAGE 47
Exhibit 3.9 Service Attribute Importance
Attribute RatingService Coverage (where the bus travels) 4.24Service Schedule (times the bus operates) 4.12Service Frequency (how often the bus runs) 4.11Cost 3.57
Non-Rider Segmentation
Non-riders with an approximate household income of $30,000 or less may
be the easiest population to mode shift. These respondents showed the
greatest propensity to patronize MST compared with other income
categories. Though cost was the least important influencer, many factors
can play a role in transitioning a non-rider into a rider. Transit ridership
growth potential among this income category can be realized as the costs
associated with owning/operating a personal vehicle grow and the
economy weakens. As the burden of relying on single-occupant
automobiles climbs, strategic marketing campaigns are more effective,
and can inform potential riders of the benefits of transit over driving. Once
a patron has shifted to transit, long-term success can only be realized if
service quality is maintained.
The least likely respondent exhibiting a propensity to use MST is either
retired, student, or employed full-time with a household income of $30,000
or more. The majority of these individuals have access to an automobile
for personal use, have a valid driver license, and state their preferred
mode of transportation is their personal vehicle. One positive finding is
that when the respondent was asked which of the preferred enhancements
might persuade them to patronize MST, nothing would change my mind
was not the most popular option (24. 7 percent). Rather bus stop closer to
my house was the most requested enhancement (26.3 percent). MST could
benefit from an expanded service area (potentially beyond the standard
fixed-route service), system-wide re-route (aimed at reducing travel time),
or the addition of bus stops within the Marina service area (to enhance
transit accessibility).

MONTEREY-SALINAS TRANSIT – MARINA AREA SERVICE STUDY
MOORE & ASSOCIATES PAGE 48
Rider/Non-Rider Responses
As previously noted, the intercept survey also included questions applicable
to Marina residents at-large, regardless of their transit usage. This section
included querying the respondent as to whether or not they had seen any
advertising for MST within 90 days of the survey. Respondents cited a fairly
even distribution, with the majority noting some MST advertising (53.4
percent). Among those who responded positively, they were then asked to
specify where they had seen such advertising. While the results were
varied, the most common responses were T.V. (40.3 percent) or on the bus
(37.7 percent). Other responses were numerically modest.
Exhibit 3.10 Advertising Source
Source PercentTV 40.3%Bus 37.7%Print 7.8%Marina 3.9%Radio 3.9%KSBW 2.6%Downtown Monterey 1.3%Online 1.3%Work 1.3%
Next respondents were asked whether or not they knew the location of the
MST bus stop nearest to their residence. The majority indicated they knew
where the nearest stop was located (83.2 percent). This is a very positive
finding, given it reveals residents recognize the MST bus stop signs and
express unaided awareness of the service.
As noted above, the majority of respondents indicated they drove a car as
their preferred mode of transportation (75.3 percent). Respondents were
queried as to other preferred forms of transportation. Though not as
significant as the personal automobile, respondents indicated their next
transportation option used by bus/rail (13.1 percent).

MONTEREY-SALINAS TRANSIT – MARINA AREA SERVICE STUDY
MOORE & ASSOCIATES PAGE 49
Exhibit 3.11 Preferred Mode
75.3%
2.8%1.2%
13.1%
1.2% 0.4%
6.0%
0.0%
10.0%
20.0%
30.0%
40.0%
50.0%
60.0%
70.0%
80.0%
Drive own vehicle Carpool Vanpool Bus, rail Bicycle Motorcycle Walk
Respondents were then asked if they currently subscribe to a newspaper, to
which to the majority indicated in the negative (72.4 percent). This may be
attributed to the proliferation of online news forums. Those indicating
subscribing to a newspaper (27.6 percent) were asked to specify which
paper. The majority cited The Herald – Monterey County’s local newspaper
(81.5 percent). The respondents were then asked which radio stations they
listened to most often. The two most common responses were 102.5 FM
(22.9 percent) and 105.1 FM (11.7 percent).
Exhibit 3.12 Print Outlet
Print Media Outlet PercentSalinas Californian 9.3%Financial Times 1.9%Monterey County Herald 81.5%San Jose Mercury News 7.4%
Survey participants were asked to share information regarding their online
usage. First, they were asked to indicate whether or not they had access to
the internet at home, to which the majority indicated positively (69.8

MONTEREY-SALINAS TRANSIT – MARINA AREA SERVICE STUDY
MOORE & ASSOCIATES PAGE 50
percent). Among those indicating having internet access at home, they
were then asked if they had visited the MST website within the prior 30
days, and/or if they had ever used “Google Transit” to plan a MST trip or
obtain other MST service information. Most had not visited MST’s website
within the prior 30 days (80.4 percent), and less than 14 percent had used
Google Transit.
Demographics
The final set of questions focused on demographic information.
Information such as age, gender, income, language, employment,
education, driver license and vehicle access were included to develop a
profile of the Marina non-transit rider. The typical respondent is between
the ages of 45-54 years old (26.0 percent) and female (52.5 percent). Age
and gender were fairly evenly distributed, which is similar to other transit
market research and confirms a valid non-biased sample.
Exhibit 3.13 Age Distribution
15.5%
18.5%
14.0%
26.0%
14.0%
9.8%
2.3%
0.0%
5.0%
10.0%
15.0%
20.0%
25.0%
30.0%
16-24 years old 25-34 years old 35-44 years old 45-54 years old 55-64 years old 65 and older Decline to respond
Critical to our analysis was information regarding persons traveling with
children 16 years and younger. Respondents were asked for this

MONTEREY-SALINAS TRANSIT – MARINA AREA SERVICE STUDY
MOORE & ASSOCIATES PAGE 51
information and if a yes was stated, they were then asked to specify how
many children were traveling with them. The majority of respondents
indicated they were not traveling with children under the age of 16 (71.8
percent). Of the balance (28.2 percent), respondents were usually only
traveling with one child (59.2 percent).
Exhibit 3.14 Persons Under the Age of 16 Traveling With Respondent
Number Percent1 59.2%2 16.9%3 7.0%4 or more 16.9%
Though household income has been discussed throughout this chapter, it
has only been noted when comparing the likelihood to use MST versus the
respondents’ stated income. Exhibit 3.15 illustrates the complete
breakdown of the respondents’ household income, including those who
indicated decline to state. This information reveals the majority of
respondents either decline to state (25.6 percent) or indicated an income
of $20,000 or less (24.4 percent). The fewest number of respondents
indicated making more than $100,000 (2.6 percent), which is reflective of
other transit market research conducted in California.

MONTEREY-SALINAS TRANSIT – MARINA AREA SERVICE STUDY
MOORE & ASSOCIATES PAGE 52
Exhibit 3.15 Household Income
24.4%
9.4%
12.8%
10.2%
7.5% 7.5%
2.6%
25.6%
0.0%
5.0%
10.0%
15.0%
20.0%
25.0%
30.0%
$20,000 andbelow
$20,001-$30,000
$30,001-$40,000
$40,001-$50,000
$50,001-$75,000
$75,001-$100,000
More than$100,000
Decline torespond
Respondents were also asked to indicate the primary language spoken
within their household. English was the most common response (87.0
percent), followed by Spanish (11.5 percent). It should be noted
respondents were also given the option to respond with other, and then
specify any language. Though a few respondents did select this option,
each language specified was under a half percent and not considered
statistically significant. These results suggest that there are minimal
language barriers to non-riders understanding MST materials as MST
provides all public information in both English and Spanish.
The majority of respondents indicated being employed full-time (33.1
percent). The remaining 66.9 percent were all fairly evenly distributed as
Exhibit 3.16 illustrates. These employment categories reflect reported
income and age distribution.

MONTEREY-SALINAS TRANSIT – MARINA AREA SERVICE STUDY
MOORE & ASSOCIATES PAGE 53
Exhibit 3.16 Employment Status
33.1%
10.2% 10.2%9.0%
12.4%
6.8%
11.7%
6.8%
0.0%
5.0%
10.0%
15.0%
20.0%
25.0%
30.0%
35.0%
Employed-fulltime
Employed-parttime
Self-employed Student Retired Homemaker Unemployed,looking for work
Decline torespond
Education statistics were included to gain insight into the non-rider profile;
assessing who, where, and in what manner transit information should be
presented to the target customer. The typical Marina non-rider has the
equivalent of a high school degree (22.2 percent), followed by a 2-year
college degree (18.8 percent), grade school/some high school (16.2
percent), 4-year college degree (13.5 percent), graduate/professional/or
doctoral degree (10.9 percent), technical/vocational school degree (7.5
percent), and some graduate school (3.8 percent).

MONTEREY-SALINAS TRANSIT – MARINA AREA SERVICE STUDY
MOORE & ASSOCIATES PAGE 54
Exhibit 3.17 Education
16.2%
22.2%
7.5%
18.8%
13.5%
3.8%
10.9%
7.1%
0.0%
5.0%
10.0%
15.0%
20.0%
25.0%
Grade s
choo
l/som
e high
scho
ol
High sc
hool
gradu
ate
Techn
ical/v
ocati
onal
scho
ol
2-yea
r coll
ege d
egree
4-yea
r coll
ege d
egree
Some g
radua
te sc
hool
Gradua
te, pr
ofess
ional,
or do
ctoral
degre
e
Declin
e to r
espo
nd
Lastly, respondents were queried as to whether or not they hold a valid
driver license and had access to a vehicle for personal use. As expected,
the majority of respondents indicated they did have a driver license (81.1
percent) and also access to a vehicle for personal use (84.1 percent).
These two variables may be the greatest barriers to transit usage in the
Marina service area. A data cross-tabulation of persons without a license
nor access to a vehicle for personal use was conducted to calculate a
percentage of respondents considered to be completely ride-dependent.
Of the total survey sample, 78 percent revealed they had both a valid
driver license and access to a vehicle for personal use. This information is
reflective of data discussed within the employment, education, and income
level categories. Only 12 percent were found to be completely ride-
dependent, meaning they have neither a valid driver license nor access to
a vehicle for personal use. Ride-dependent individuals who do not use
public transit often have few mobility options. They typically rely on others
for personal travel or use other, non-motorized modes of transportation
such as walking or bicycling. Many times, barriers common to the ride-

MONTEREY-SALINAS TRANSIT – MARINA AREA SERVICE STUDY
MOORE & ASSOCIATES PAGE 55
dependent can be as simple as lack of knowledge or understanding of
transit services or schedules. This lack of knowledge can create a lack of
confidence by the ride-dependent, discouraging their use of otherwise
viable transit options. In many cases, these persons can be educated
about transit services around them and can transition smoothly into riders
who eventually become regular transit patrons. Effective transit-training
paired with effective marketing and public outreach can be the answer to
gaining “choice” riders and retaining current users.

MONTEREY-SALINAS TRANSIT – MARINA AREA SERVICE STUDY
MOORE & ASSOCIATES PAGE 56
This Page Intentionally Left Blank.
MONTEREY-SALINAS TRANSIT – MARINA AREA SERVICE STUDY
MOORE & ASSOCIATES PAGE 57
4. CSUMB SURVEY ANALYSIS
MONTEREY-SALINAS TRANSIT – MARINA AREA SERVICE STUDY
MOORE & ASSOCIATES PAGE 58
CHAPTER 4 – CSUMB SURVEY ANALYSIS
This chapter presents key findings and analysis from the web survey of
California State University at Monterey Bay (CSUMB) students, faculty, and
staff conducted on behalf of Monterey-Salinas Transit (MST) in May 2009.
Key survey findings focus on mobility patterns, non-rider perceptions and
characteristics, and potential barriers to use of MST services.
Moore & Associates fielded a web survey of CSUMB students, faculty, and
staff across a two-week span beginning May 1 and ending May 15, 2009.
The survey instrument was designed to solicit information from the CSUMB
community, containing both a mix of rider and non-rider opinions and
perceptions. The instrument was developed through a process that
maintained a set of distinct goals specific to enhancing mobility for the
university’s sizeable population of both residents (students) and employees.
These goals included:
• Transition non-riders into regular users of MST services;
• Identify the needs, perceptions, concerns, and barriers to use of
CSUMB’s non transit-rider population;
• Identify service enhancements aimed at attracting new transit riders
and improving mobility for existing transit users; and
• Develop a valid community-based profile of CSUMB students,
faculty, and staff including perceptions and travel patterns.
Methodology
During the project initiation meeting, Moore & Associates and MST staff
agreed a survey of CSUMB students, faculty, and staff would be critical in
identifying service enhancements aimed at improving mobility within the
Marina study area. It was determined a web-based survey would be the
most cost-effective method of distribution. Working closely with CSUMB
and MST staff, Moore & Associates determined the most effective avenue
for driving traffic to the survey would be through the use of the university’s
MONTEREY-SALINAS TRANSIT – MARINA AREA SERVICE STUDY
MOORE & ASSOCIATES PAGE 59
sizeable database of email addresses. Text was developed and emails
were sent to all current students, faculty, and staff advising of the
availability of the survey, including a link to the website hosting the survey.
Prior to fielding, the instrument was pre-tested. The effort included a
qualifier question requiring the respondent to verify he or she was at least
16 years of age. Though the survey was primarily developed to gain
insight into the perceptions of the CSUMB non-rider community, non-rider
and rider questions were both included. A sample of 519 valid responses
was realized.
Although this Marina Area Service Study focuses primarily on the Marina
community, results from the survey show a wide range of residential
locations. Respondents were queried as to the location of their residence
and were given seven options: Marina, Salinas, Seaside, Monterey,
Residence Halls, East Campus Housing, and Other. Nearly 88 percent of
respondents selected one of the six specified location options while the
remainder selected the other option. Given the survey’s target audience,
Residence Halls was the most commonly-cited response (32 percent),
followed by Marina (21.8 percent). Other common responses included
Seaside (14.1 percent) and East Campus Housing (15.7 percent).

MONTEREY-SALINAS TRANSIT – MARINA AREA SERVICE STUDY
MOORE & ASSOCIATES PAGE 60
Exhibit 4.1 Respondent Residence Location
21.8%
6.0%6.9%
23.0%
15.7%
12.5%
14.1%
0.0%
5.0%
10.0%
15.0%
20.0%
25.0%
Marina Seaside Monterey Salinas Residence Halls East CampusHousing
Other
To provide a clearer picture of the relationship between respondent
category and residence location, we performed a data cross-tabulation
between the two. The results are largely predictable, with only students
living in residence halls; older students, staff, and faculty living in east
campus housing and off campus. Among off-campus locations, Seaside
and Marina were the most common. Younger students, in general, prefer
Seaside over Marina, while older students prefer Marina over Seaside.

MONTEREY-SALINAS TRANSIT – MARINA AREA SERVICE STUDY
MOORE & ASSOCIATES PAGE 61
Exhibit 4.2 Respondent Category vs. Residence Location
3.4%
6.4%
4.5%
27.3%
5.6%
18.5%
26.3%
11.4%
12.8%
9.1%
28.8%
30.6%
29.6%
28.9%
35.8%
26.1%
23.4%
15.9%
7.6%
13.9%
7.4%
5.3%
6.8%
5.6%
11.1%
10.5%
11.4%
4.3%
9.1%
6.1%
5.6%
14.8%
7.9%
11.4%
67.0%
51.1%
29.5%
12.1%
11.1%
2.1%
25.0%
16.7%
27.8%
18.5%
21.1%
25.2%
0% 10% 20% 30% 40% 50% 60% 70% 80% 90% 100%
Freshman
Sophomore
Junior
Senior
5th Year
Graduate Student
Faculty
Staff
Other Marina Seaside Monterey Salinas Residence Halls East Campus Housing
On an aggregate basis, nearly seventy percent had not ridden MST within
60 days prior to the survey contact.

MONTEREY-SALINAS TRANSIT – MARINA AREA SERVICE STUDY
MOORE & ASSOCIATES PAGE 62
Exhibit 4.3 Patronized MST in Last 60 Days
30.4%
69.6%
Yes
No
To analyze these results more effectively, we conducted a data cross-
tabulation between respondent category and exposure to MST in last 60
days. The results reveal freshmen and juniors were most likely to have used
MST within the last two months (52.3 percent and 45.5 percent,
respectively). Staff were the least likely to have used MST in that period
(17.7 percent).

MONTEREY-SALINAS TRANSIT – MARINA AREA SERVICE STUDY
MOORE & ASSOCIATES PAGE 63
Exhibit 4.4 Respondent Category vs. Patronized MST in Last 60 Days
52.3%
31.9%
45.5%
19.7%
27.8%
22.2%
26.3%
17.7%
47.7%
68.1%
54.5%
80.3%
72.2%
77.8%
73.7%
82.3%
0% 10% 20% 30% 40% 50% 60% 70% 80% 90% 100%
Freshman
Sophomore
Junior
Senior
5th Year
Graduate Student
Faculty
Staff
Yes No

MONTEREY-SALINAS TRANSIT – MARINA AREA SERVICE STUDY
MOORE & ASSOCIATES PAGE 64
Non-Riders
A follow-up question was posed to those respondents indicating not having
ridden MST within the 60 days prior to the survey contact. The most
frequent response was access to a vehicle for personal use (67 percent).
This figure represents the percentage of the surveyed population not
dependent upon transit for basic mobility. Such respondents could prove
particularly resistant to efforts to attract them as customers moving
forward. However, the remaining 33 percent represent potential future
“choice” riders. Such respondents would ride MST should certain
adjustments be made, such as new or altered alignments (6.3 percent),
fare reductions (2.9 percent), or increased frequency (13.5 percent). These
responses provide valuable insight into future service enhancements which
MST could address to increase ridership within the CSUMB community.
“Choice” riders tend to be more affluent, better educated, and more
interested in using transit for its environmental benefits than many ride-
dependent persons.
Exhibit 4.5 Reason for Not Using MST
6.3%3.2% 2.9%
13.5%
0.9%
6.3%
67.0%
0.0%
10.0%
20.0%
30.0%
40.0%
50.0%
60.0%
70.0%
80.0%
Does not go wherei need it to
Does not travelwhere I need it to
Cost to much Does not runfrequently enough
Unreliable Vehicle forpersonal use
Other
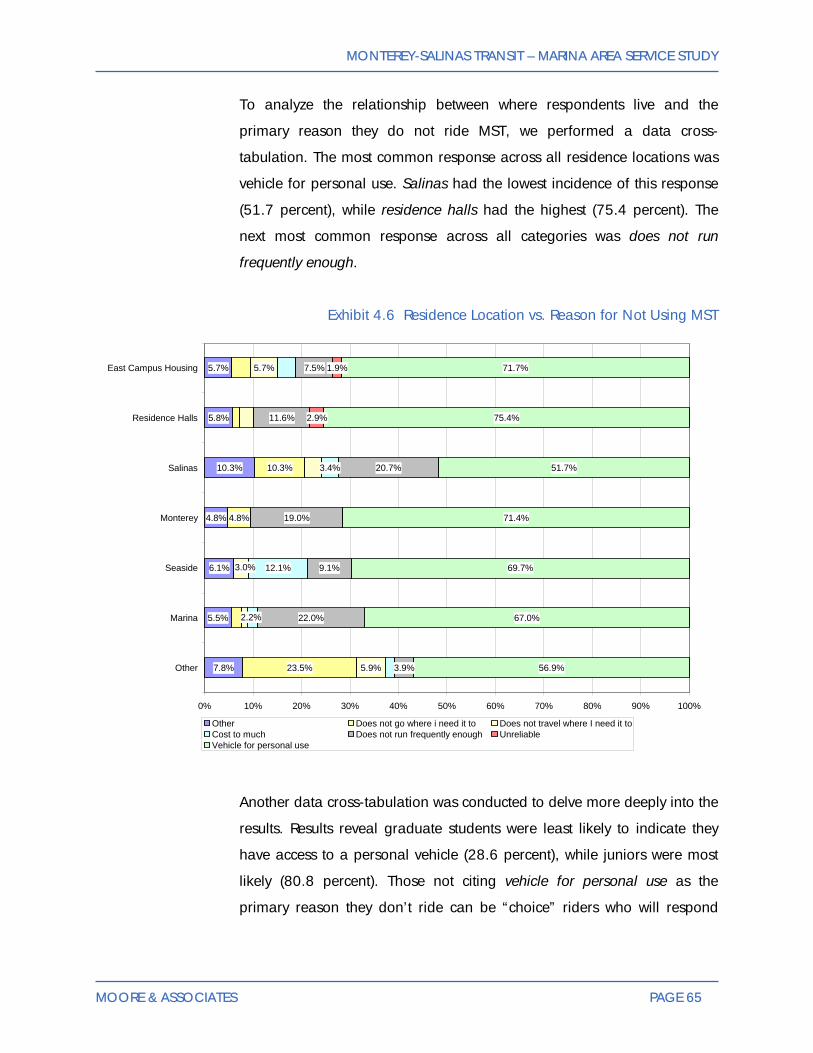
MONTEREY-SALINAS TRANSIT – MARINA AREA SERVICE STUDY
MOORE & ASSOCIATES PAGE 65
To analyze the relationship between where respondents live and the
primary reason they do not ride MST, we performed a data cross-
tabulation. The most common response across all residence locations was
vehicle for personal use. Salinas had the lowest incidence of this response
(51.7 percent), while residence halls had the highest (75.4 percent). The
next most common response across all categories was does not run
frequently enough.
Exhibit 4.6 Residence Location vs. Reason for Not Using MST
7.8%
5.5%
6.1%
4.8%
10.3%
5.8%
5.7%
23.5%
4.8%
10.3%
5.9%
5.7%
12.1%
3.4%
3.9%
22.0%
9.1%
19.0%
20.7%
11.6%
7.5%
2.9%
1.9%
56.9%
67.0%
69.7%
71.4%
51.7%
75.4%
71.7%
3.0%
2.2%
0% 10% 20% 30% 40% 50% 60% 70% 80% 90% 100%
Other
Marina
Seaside
Monterey
Salinas
Residence Halls
East Campus Housing
Other Does not go where i need it to Does not travel where I need it toCost to much Does not run frequently enough UnreliableVehicle for personal use
Another data cross-tabulation was conducted to delve more deeply into the
results. Results reveal graduate students were least likely to indicate they
have access to a personal vehicle (28.6 percent), while juniors were most
likely (80.8 percent). Those not citing vehicle for personal use as the
primary reason they don’t ride can be “choice” riders who will respond

MONTEREY-SALINAS TRANSIT – MARINA AREA SERVICE STUDY
MOORE & ASSOCIATES PAGE 66
favorably to service enhancements aimed at addressing their mobility
needs.
Exhibit 4.7 Respondent Category vs. Reason for Not Using MST
6.8%
9.4%
3.7%
11.5%
9.5%
14.8%
4.9%
3.8%
7.4%
19.0%
14.8%
6.8%
3.7%
3.8%
14.3%
4.5%
6.3%
3.8%
4.8%
3.7%
4.5%
12.5%
7.7%
14.8%
26.9%
23.8%
22.2%
9.7%
75.0%
71.9%
80.8%
68.5%
57.7%
28.6%
44.4%
73.8%
4.5%
0% 10% 20% 30% 40% 50% 60% 70% 80% 90% 100%
Freshman
Sophomore
Junior
Senior
5th Year
Graduate Student
Faculty
Staff
Other Does not go where i need it to Does not travel where I need it to Cost to muchDoes not run frequently enough Unreliable Vehicle for personal use
Respondents were then asked whether they would ride MST if their typical
mode of travel was unavailable. The results of this question were
encouraging, with 70.4 percent responding affirmatively. Interestingly, only
5.1 percent responded negatively. We believe this reveals area residents
choose not to use MST due to reasons related to a preference for their
current mode of travel versus a fear of using transit. MST remains an
attractive alternative should their current mode not be available. A targeted
marketing campaign could convince some of these respondents to “try
transit” for at least a portion of their local travel.

MONTEREY-SALINAS TRANSIT – MARINA AREA SERVICE STUDY
MOORE & ASSOCIATES PAGE 67
Exhibit 4.8 Propensity to Ride MST
70.4%
5.1%
24.5%
Yes
No
Maybe
To more effectively analyze the relationship between respondent category
and whether they would consider using MST, we performed a data cross-
tabulation. Results reveal Faculty are the most likely to not consider using
the service (10.5 percent), while all fifth-year students would at least
consider it. Graduate students were the most likely to consider using the
service (77.8 percent), and seniors were the least likely (62.1 percent).
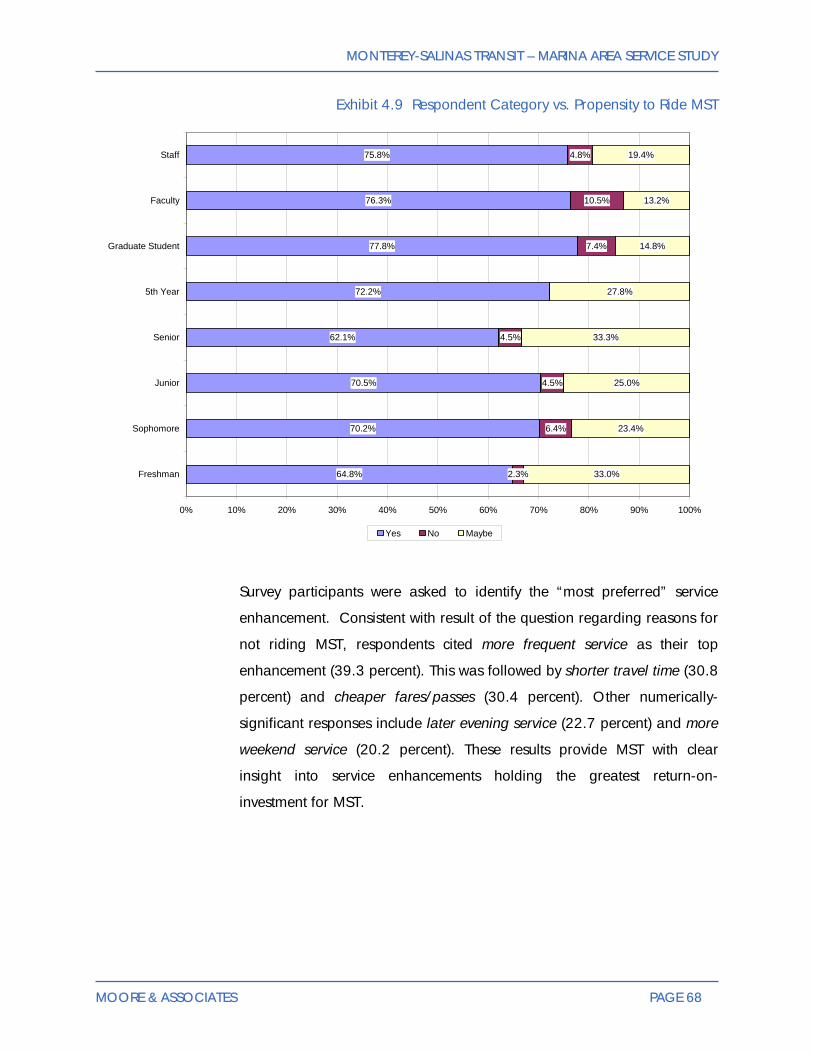
MONTEREY-SALINAS TRANSIT – MARINA AREA SERVICE STUDY
MOORE & ASSOCIATES PAGE 68
Exhibit 4.9 Respondent Category vs. Propensity to Ride MST
64.8%
70.2%
70.5%
62.1%
72.2%
77.8%
76.3%
75.8%
2.3%
6.4%
4.5%
4.5%
7.4%
10.5%
4.8%
33.0%
23.4%
25.0%
33.3%
27.8%
14.8%
13.2%
19.4%
0% 10% 20% 30% 40% 50% 60% 70% 80% 90% 100%
Freshman
Sophomore
Junior
Senior
5th Year
Graduate Student
Faculty
Staff
Yes No Maybe
Survey participants were asked to identify the “most preferred” service
enhancement. Consistent with result of the question regarding reasons for
not riding MST, respondents cited more frequent service as their top
enhancement (39.3 percent). This was followed by shorter travel time (30.8
percent) and cheaper fares/passes (30.4 percent). Other numerically-
significant responses include later evening service (22.7 percent) and more
weekend service (20.2 percent). These results provide MST with clear
insight into service enhancements holding the greatest return-on-
investment for MST.

MONTEREY-SALINAS TRANSIT – MARINA AREA SERVICE STUDY
MOORE & ASSOCIATES PAGE 69
Exhibit 4.10 Preferred Service Enhancement
39.3%
30.8%
7.5%
22.7%
20.2%
30.4%
13.1%13.7%
0.0%
5.0%
10.0%
15.0%
20.0%
25.0%
30.0%
35.0%
40.0%
45.0%
Stop closer tohome
More frequentservice
Shorter traveltime
Earlier morningservice
Later eveningservice
More weekendservice
Cheaperfares/passes
Nothing wouldchange my
mind
Respondents identifying themselves as non-riders were asked to rank four
service characteristics (cost, service frequency, service schedule, and
service coverage) on a four-point scale (where one equals not important
and four equals very important). The averages for the four attributes were
similar, ranging from 2.42 for cost and 3.08 for coverage. Marketing MST
as a low-cost alternative to car travel would appear to have less impact
than communicating the convenience of new services/service
enhancements.

MONTEREY-SALINAS TRANSIT – MARINA AREA SERVICE STUDY
MOORE & ASSOCIATES PAGE 70
Exhibit 4.11 Characteristic Preference
2.73 2.74
3.08
2.42
0.00
0.50
1.00
1.50
2.00
2.50
3.00
3.50
Cost Service Frequency Service Schedule Service Coverage
To gain additional insight into current travel patterns among “non-riders,”
the survey asked whether they had used another transit service (other than
MST) within the 90 days prior to survey contact. More than thirty percent
responded positively. Therefore, this subgroup is likely the best target for
future service enhancements and marketing efforts targeting the CSUMB
community.
Respondents indicating affirmatively were then asked to cite the specific
service used. Among the most commonly-cited responses were CSUMB
TAPS (39.2 percent), BART (19.6 percent), Santa Cruz Metro (15.0
percent), and RIDES (5.2 percent).

MONTEREY-SALINAS TRANSIT – MARINA AREA SERVICE STUDY
MOORE & ASSOCIATES PAGE 71
Exhibit 4.12 Other Transit Service
31.3%
68.7%
Yes
No
Nearly 60 percent of survey participants were aware of MST’s fare-free
zone at CSUMB, which includes the CSUMB central and east residential
campuses.
Exhibit 4.13 CSUMB Fare-Free Zone
58.8%
41.2%
Yes
No

MONTEREY-SALINAS TRANSIT – MARINA AREA SERVICE STUDY
MOORE & ASSOCIATES PAGE 72
More than 75 percent knew the location of the MST bus stop closest to
their house. The fact that 25 percent indicated they didn’t know the
location of the nearest bus stop reveals a continued unfamiliarity regarding
MST service specifics.
Exhibit 4.14 Nearest Bus Stop
77.4%
22.6%
Yes
No
Riders and Non-Riders
Among all survey respondents, the most common language cited was
English (88.1 percent), followed by bilingual (6.4 percent), and Spanish
(3.4 percent). This reveals there is less demand for bilingual collateral
within the CSUMB subset of the overall Marina service area.
Nearly 80 percent indicated having both a valid driver license as well as
access to a vehicle for personal use. Approximately 10 percent indicated
having neither access to a personal vehicle nor a valid driver license,
revealing total ride-dependency. The balance (12 percent) revealed they
were partially ride-dependent (i.e., lack either a valid driver license or
access to a vehicle). These results do not reflect findings from either the
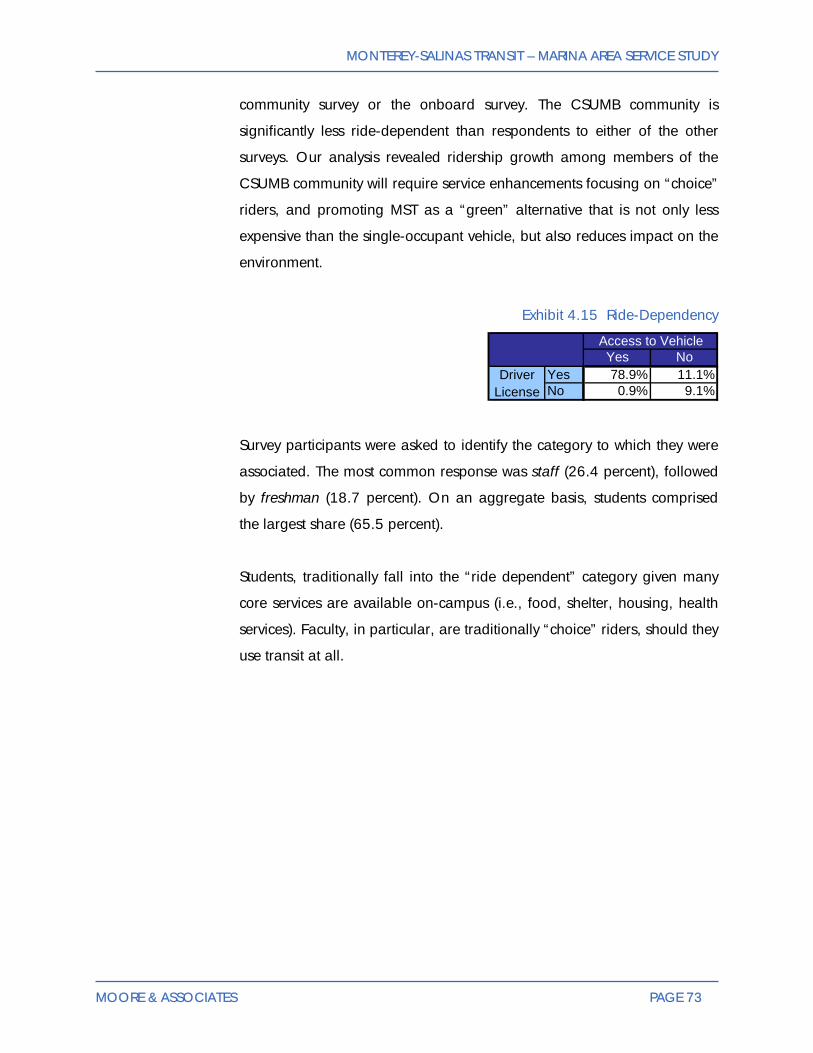
MONTEREY-SALINAS TRANSIT – MARINA AREA SERVICE STUDY
MOORE & ASSOCIATES PAGE 73
community survey or the onboard survey. The CSUMB community is
significantly less ride-dependent than respondents to either of the other
surveys. Our analysis revealed ridership growth among members of the
CSUMB community will require service enhancements focusing on “choice”
riders, and promoting MST as a “green” alternative that is not only less
expensive than the single-occupant vehicle, but also reduces impact on the
environment.
Exhibit 4.15 Ride-Dependency
Yes NoYes 78.9% 11.1%No 0.9% 9.1%
Access to Vehicle
Driver License
Survey participants were asked to identify the category to which they were
associated. The most common response was staff (26.4 percent), followed
by freshman (18.7 percent). On an aggregate basis, students comprised
the largest share (65.5 percent).
Students, traditionally fall into the “ride dependent” category given many
core services are available on-campus (i.e., food, shelter, housing, health
services). Faculty, in particular, are traditionally “choice” riders, should they
use transit at all.

MONTEREY-SALINAS TRANSIT – MARINA AREA SERVICE STUDY
MOORE & ASSOCIATES PAGE 74
Exhibit 4.16 Respondent Category
18.7%
10.0%
7.7%
5.7%
8.1%
26.4%
9.4%
14.0%
0.0%
5.0%
10.0%
15.0%
20.0%
25.0%
30.0%
Freshman Sophomore Junior Senior 5th Year GraduateStudent
Faculty Staff
Given the nature of the CSUMB academic calendar, the vast majority of
respondents typically attend/teach classes or work on campus on
weekdays, particularly Monday through Thursday.
Exhibit 4.17 Days on Campus
75.0%
45.1%
3.1% 3.9%
76.3%76.3%77.7%
0.0%
10.0%
20.0%
30.0%
40.0%
50.0%
60.0%
70.0%
80.0%
90.0%
Monday Tuesday Wednesday Thursday Friday Saturday Sunday

MONTEREY-SALINAS TRANSIT – MARINA AREA SERVICE STUDY
MOORE & ASSOCIATES PAGE 75
The majority arrive on campus between 7:30 a.m. and 9:00 a.m. (45.5
percent), with nearly all arriving prior to noon (86.4 percent).
Exhibit 4.18 Time Arriving on Campus
14.9%
45.5%
26.0%
6.9%
2.2%
4.6%
0.0%
5.0%
10.0%
15.0%
20.0%
25.0%
30.0%
35.0%
40.0%
45.0%
50.0%
6:00 a.m. to 7:30 a.m. 7:30 a.m. to 9:00 a.m. 9:00 a.m. to 12:00p.m.
12:00 p.m. to 3:00p.m.
3:00 p.m. to 5:00 p.m. 5:00 p.m. or later
The most commonly-cited departure time cited was between 4:00 p.m.
and 6:00 p.m., with nearly all (87 percent) leaving after 4:00 p.m. These
data, combined with preceding data, reveal commute patterns to and from
campus resemble those of the traditional workweek, with clearly-defined
weekday peak-hours.

MONTEREY-SALINAS TRANSIT – MARINA AREA SERVICE STUDY
MOORE & ASSOCIATES PAGE 76
Exhibit 4.19 Time Departing Campus
0.9% 1.3%2.6%
39.6%
24.5%22.9%
8.2%
0.0%
5.0%
10.0%
15.0%
20.0%
25.0%
30.0%
35.0%
40.0%
45.0%
6:00 a.m. to 10:00p.m.
10:00 a.m. to12:00 p.m.
12:00 p.m. to 2:00p.m.
2:00 p.m. to 4:00p.m.
4:00 p.m. to 6:00p.m.
6:00 p.m. to 8:00p.m.
8:00 p.m. or later
Among all survey respondents, 26.6 percent indicated they had used the
CSUMB shuttle within the month prior to the survey contact.
Exhibit 4.20 Use of CSUMB Shuttle
26.6%
73.4%
Yes
No

MONTEREY-SALINAS TRANSIT – MARINA AREA SERVICE STUDY
MOORE & ASSOCIATES PAGE 77
As a follow-up, survey participants were then asked how often they
typically use the on-campus shuttle. The most common response was one
day per week or less (57.9 percent), revealing a dearth of regular users
among the respondent sample. The CSUMB shuttle is not frequently used
for respondents’ day-to-day mobility needs.
Exhibit 4.21 CSUMB Shuttle Frequency of Use
17.5%
24.6%57.9%
4 or more days per week
2-3 days per week
1 day per week or less
Survey participants were asked about their most frequent off-campus
destination. Among the most frequently-cited locations were Monterey
(30.9 percent) and Marina (22.1 percent). Neighboring Santa Cruz
garnered 5.7 percent.
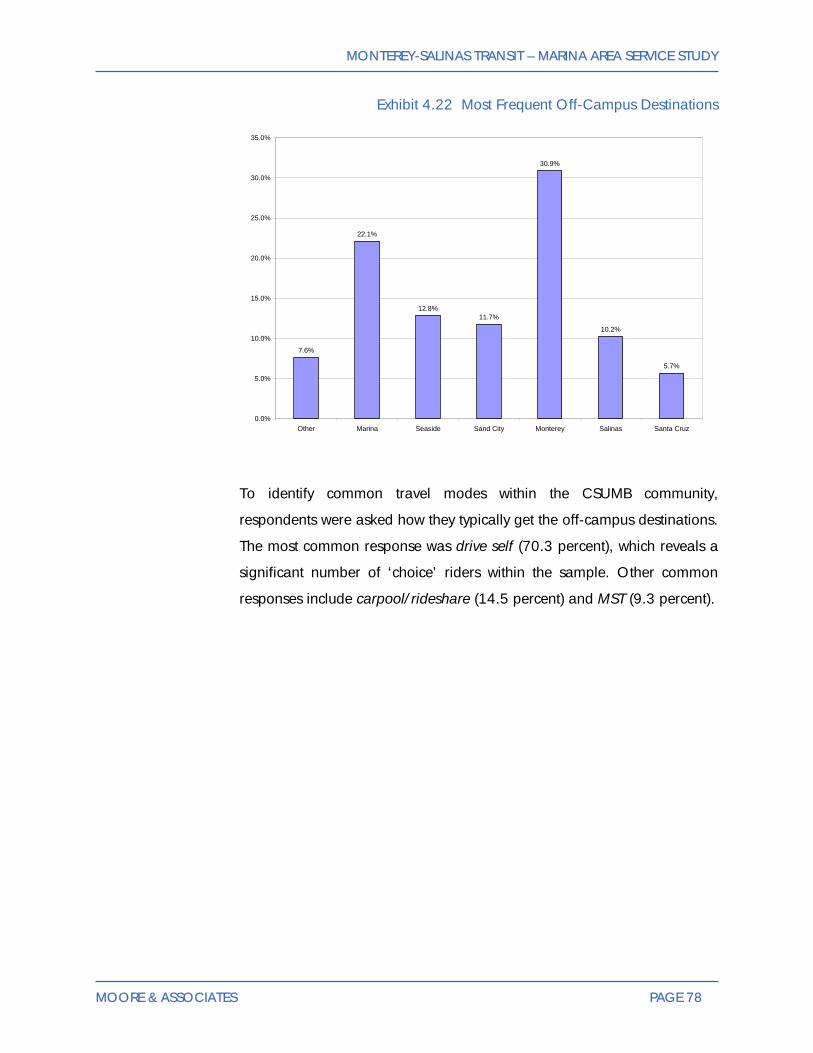
MONTEREY-SALINAS TRANSIT – MARINA AREA SERVICE STUDY
MOORE & ASSOCIATES PAGE 78
Exhibit 4.22 Most Frequent Off-Campus Destinations
7.6%
22.1%
12.8%11.7%
30.9%
10.2%
5.7%
0.0%
5.0%
10.0%
15.0%
20.0%
25.0%
30.0%
35.0%
Other Marina Seaside Sand City Monterey Salinas Santa Cruz
To identify common travel modes within the CSUMB community,
respondents were asked how they typically get the off-campus destinations.
The most common response was drive self (70.3 percent), which reveals a
significant number of ‘choice’ riders within the sample. Other common
responses include carpool/rideshare (14.5 percent) and MST (9.3 percent).

MONTEREY-SALINAS TRANSIT – MARINA AREA SERVICE STUDY
MOORE & ASSOCIATES PAGE 79
Exhibit 4.23 Off-Campus Mode
70.3%
14.5%
3.0%0.7%
9.3%
2.0%0.2%
0.0%
10.0%
20.0%
30.0%
40.0%
50.0%
60.0%
70.0%
80.0%
Drive Self Carpool/rideshare Walk/bicycle CSUMB Shuttle MST RIDES Other
Respondents were also asked about how they typically travel to campus.
Again, the most common response was drive self (59.2 percent). The
variance between this response and the one analyzed above is due likely
to a disproportionate response rate from students residing on campus,
traveling between class and their residence halls. This conclusion is borne
out by increases in walk/bicycle and CSUMB Shuttle coupled with a
decrease in the use of MST.

MONTEREY-SALINAS TRANSIT – MARINA AREA SERVICE STUDY
MOORE & ASSOCIATES PAGE 80
Exhibit 4.24 Access to Campus
59.2%
15.6%
5.0% 5.4%
1.5%
4.8%
8.5%
0.0%
10.0%
20.0%
30.0%
40.0%
50.0%
60.0%
70.0%
Drive Self Carpool/rideshare Walk/bicycle CSUMB Shuttle MST RIDES Other
Finally, respondents were asked if they would be more likely to ride MST
to/from campus (versus using their personal vehicle) if CSUMB offered a
low-cost bus pass to students, faculty, and staff. Nearly 50 percent
indicated they would definitely use MST should a discount fare option be
made available. Another 34.6 percent indicated they would consider using
MST for at least a portion of their “local” trips (should the low-cost pass
become available). Taken together, these data reveal an important
ridership growth opportunity for MST.
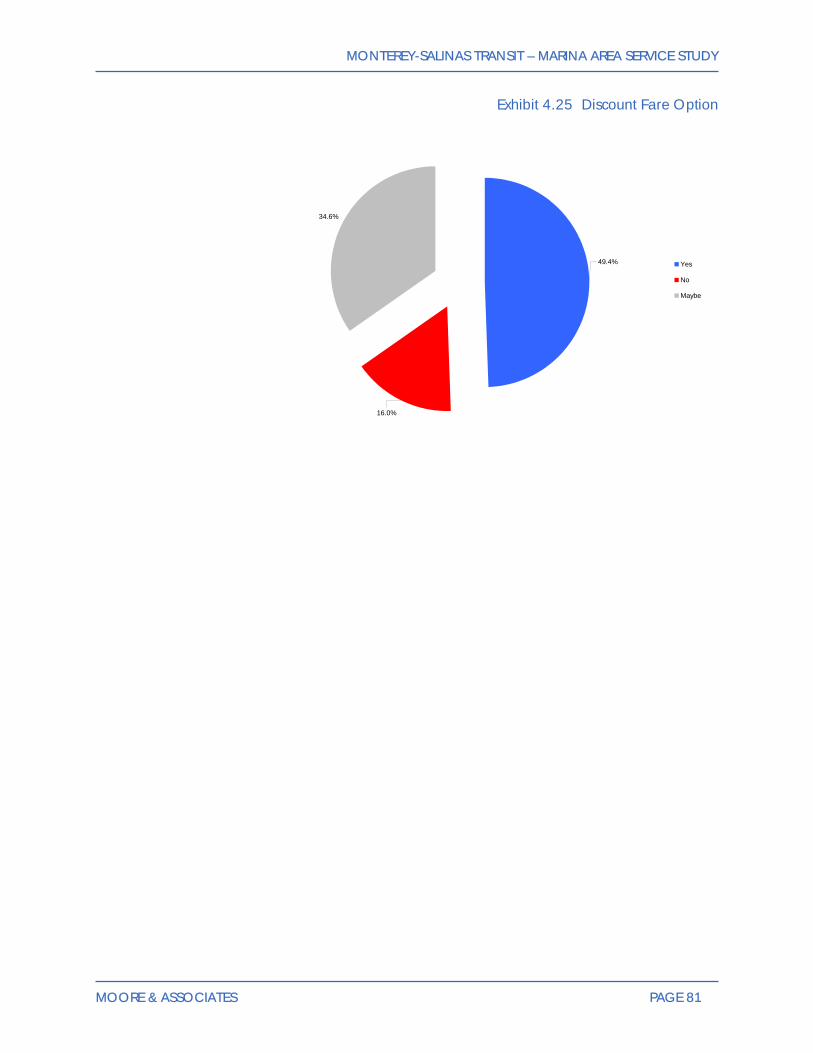
MONTEREY-SALINAS TRANSIT – MARINA AREA SERVICE STUDY
MOORE & ASSOCIATES PAGE 81
Exhibit 4.25 Discount Fare Option
49.4%
16.0%
34.6%
Yes
No
Maybe

MONTEREY-SALINAS TRANSIT – MARINA AREA SERVICE STUDY
MOORE & ASSOCIATES PAGE 82
This Page Intentionally Left Blank.

MONTEREY-SALINAS TRANSIT – MARINA AREA SERVICE STUDY
MOORE & ASSOCIATES PAGE 83
5. PATRONAGE ANALYSIS
MONTEREY-SALINAS TRANSIT – MARINA AREA SERVICE STUDY
MOORE & ASSOCIATES PAGE 84
CHAPTER 5 – PATRONAGE ANALYSIS
This chapter analyses origin and destination data culled from MST’s
Marina On-Call service for the months of August 2008 and February 2009
as well as origin data from the customer survey conducted onboard MST
buses in March 2009.
Marina On-Call Common Origins and Destinations
In analyzing patronage patterns on the Marina On-Call service, Moore &
Associates acquired trip sheets for two non-consecutive months. Every trip
made during the two months was analyzed, resulting in a clear picture of
how patrons use the service spatially.
The five most common origins identified through our analysis were:
• Marina Transit Exchange,
• Third Avenue and Imjin Parkway,
• Dunes Shopping Center,
• CSUMB Quad, and
• Department of Defense building.
These locations are all significant trip generators. The Marina Transit
Exchange is the only time-point used by the Marina On-Call service and
the only location served by another MST route on a regular basis (Route 16
travels through CSUMB, but doesn’t serve the Quad). Route 12 and 2X
serve the Dunes Shopping Center and the Department of Defense
building, but only make a handful of trips a day, leaving the Marina On-
Call services as the only “Route” to serve them for a full service day.
The five most common destinations identified through our analysis were:
• Marina Transit Exchange,
• Third Avenue and Imjin Parkway,
• Dunes Shopping Center,

MONTEREY-SALINAS TRANSIT – MARINA AREA SERVICE STUDY
MOORE & ASSOCIATES PAGE 85
• Department of Defense building, and
• Fort Ord Commissary.
The list of the 24 most frequent origins and destinations is below.
Exhibit 5.1 Marina On-Call Common Origins
LocationOrigin Count
Destination Count Total
Marina Transit Exchange 917 795 17123rd Avenue & Imjin Parkway 321 285 606The Dunes Shopping Center 168 167 335Department of Defense 102 148 250CSUMB Quad 111 98 209Commissary 71 120 191California Road & Reservation Road 81 50 131Wal-Mart 71 31 102V.A. Clinic 31 58 89Carmel Avenue & Crescent Avenue 52 36 883306 Del Monte Boulevard 26 60 866th Avenue & A Street 64 8 72Reindollar Avenue & Eddy Street 28 27 55Del Monte Boulevard & Palm Avenue 18 24 42Library 17 23 40Save Mart 13 22 35Del Monte Boulevard & Cosky Drive 14 19 33Hillcrest Avenue & Sunset Avenue 16 12 28Reindollar Avenue & Sunrise Circle 16 8 24Cardoza Avenue & Abdy Way 17 5 22Reindollar Avenue & Redwood Drive 5 14 19Reservation Road & Crescent Avenue 13 4 17Reindollar Avenue & Kennedy Court 5 12 17Reservation Road & Bayer Street 3 12 15
The geographical distribution of common trip origins can be split into three
areas: Marina proper, the Dunes Shopping Center, and CSUMB/DOD.
There are no popular commonly-occurring origins outside of those three
areas.

MONTEREY-SALINAS TRANSIT – MARINA AREA SERVICE STUDY
MOORE & ASSOCIATES PAGE 86
The following common origins and destinations within Marina proper are
not currently covered by MST fixed-routes (or within one-quarter mile of a
traditional fixed-route):
• Reindollar Avenue & Eddy Street,
• Reindollar Avenue & Sunrise Circle,
• Reindollar Avenue & Redwood Drive, and
• Reindollar Avenue & Kennedy Court.
Third Avenue and Imjin Parkway is the only location in the Dunes Shopping
Center area not covered by a fixed route, though the Dunes Shopping
Center itself is only served by Routes 2X and 12, which do not operate for
a complete service day.
The CSUMB/DOD area in particular lacks access to MST fixed-routes. The
following origins/destinations are not covered:
• Department of Defense building,
• Commissary, and
• CSUMB Quad.
Service planning efforts should focus on delivering new mobility options to
significant Marina On-Call origins/destinations not currently covered by
MST fixed-routes. Taken collectively, these data provide a clear picture of
the demand for transit service in those areas.
Exhibits 5.2 and 5.3 display the geographic distribution of common origins
and destinations, respectively.

MONTEREY-SALINAS TRANSIT – MARINA AREA SERVICE STUDY
MOORE & ASSOCIATES PAGE 87
Exhibit 5.2 Marina On-Call Common Origins Map

MONTEREY-SALINAS TRANSIT – MARINA AREA SERVICE STUDY
MOORE & ASSOCIATES PAGE 88
Exhibit 5.3 Marina On-Call Common Destinations Map

MONTEREY-SALINAS TRANSIT – MARINA AREA SERVICE STUDY
MOORE & ASSOCIATES PAGE 89
Customers by Zip Code
Onboard customer survey respondents were asked to cite their home zip
code. Given the surveyed routes travel primarily between Marina,
Monterey, and Salinas, 93933 (Marina) was the most frequently-cited
response. Other common responses included 93955 (Seaside/Sand City),
93901 (Southwestern Salinas), and 93906 (North Salinas).
Results reinforce the fact that the corridor between Salinas and Monterey
(with Marina at the midpoint) is the most common commute pattern in the
region. The results are displayed in the map below.
Exhibit 5.4 Customer Survey Respondent Home Zip Codes

MONTEREY-SALINAS TRANSIT – MARINA AREA SERVICE STUDY
MOORE & ASSOCIATES PAGE 90
This Page Intentionally Left Blank.

MONTEREY-SALINAS TRANSIT – MARINA AREA SERVICE STUDY
MOORE & ASSOCIATES PAGE 91
6. SERVICE PLAN

MONTEREY-SALINAS TRANSIT – MARINA AREA SERVICE STUDY
MOORE & ASSOCIATES PAGE 92
CHAPTER 6 – MARINA AREA SERVICE PLAN
The Strategic Development Center (SDC) of Marina Development Services
Department has predicted rapid growth within the Marina area of
Monterey County across the next ten to fifteen years. In September 2008,
the SDC forecast 11,000 new residents, 12,400 new jobs, and 4,500 new
housing units, as well as 1,400 acres of redeveloped land during that time
period. While the current recession has stalled some of the forecast
development, it remains critical Monterey-Salinas Transit account for this
growth through the development of a comprehensive service plan.
MST currently offers a variety of service options within the Marina Service
Sector. The options are detailed below:
• Marina On-Call: Demand-response service with coverage between
Martina, the Dunes, and CSUMB.
• Route 2X: Limited-stop express route operating between Pebble
Beach and Salinas with stops at the Marina Transit Exchange and
the Dunes.
• Route 12: Military-oriented route operating between the southern
portion of the Marina Service Sector (including the Dunes) and the
Naval School.
• Route 16: Fixed-route operating between Marina and Monterey,
with service to CSUMB.
• Route 20: Fixed-route providing local service between Salinas and
Monterey. It is the most productive route in the MST system.
• Route 27: Fixed-route operating between Watsonville and Marina.
• Route 71: Military-oriented route operating between Marina and
the Presidio of Monterey.
• Route 72: Military-oriented route operating between North Salinas
and the Presidio of Monterey.
• Route 74: Military-oriented route operating between Preston Park
and the Presidio of Monterey.

MONTEREY-SALINAS TRANSIT – MARINA AREA SERVICE STUDY
MOORE & ASSOCIATES PAGE 93
Exhibit 6.1 Current Route 2X

MONTEREY-SALINAS TRANSIT – MARINA AREA SERVICE STUDY
MOORE & ASSOCIATES PAGE 94
Exhibit 6.2 Current Route 12
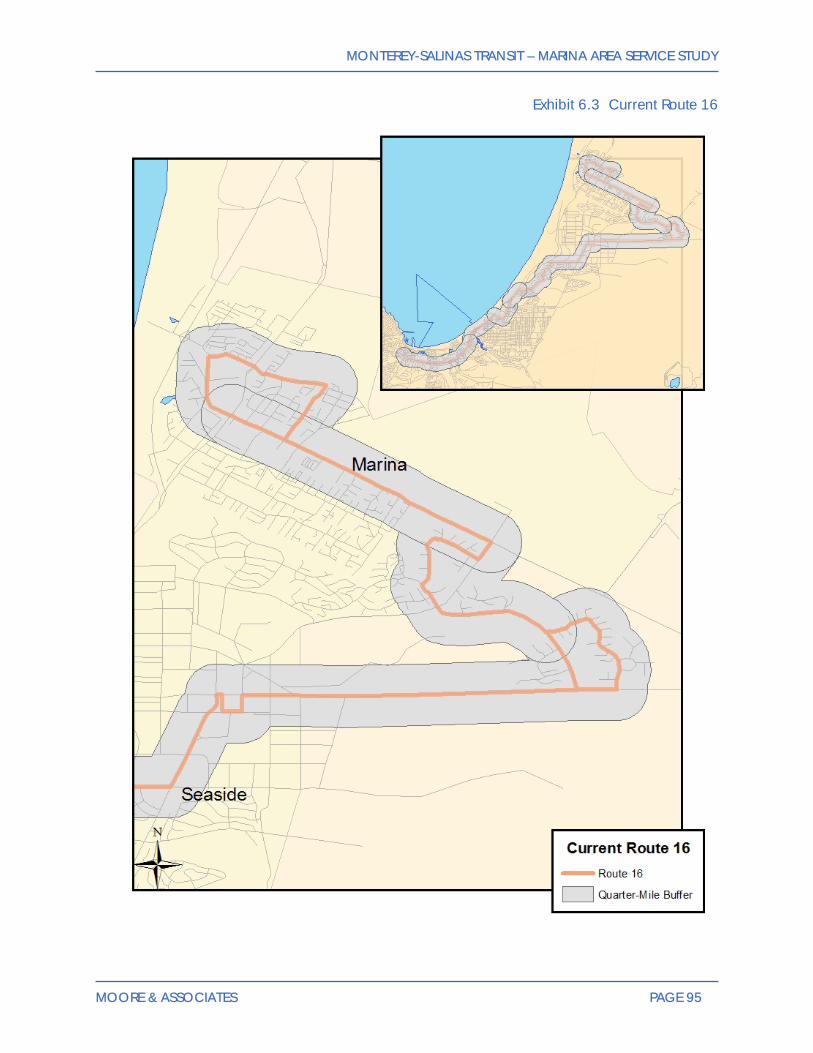
MONTEREY-SALINAS TRANSIT – MARINA AREA SERVICE STUDY
MOORE & ASSOCIATES PAGE 95
Exhibit 6.3 Current Route 16
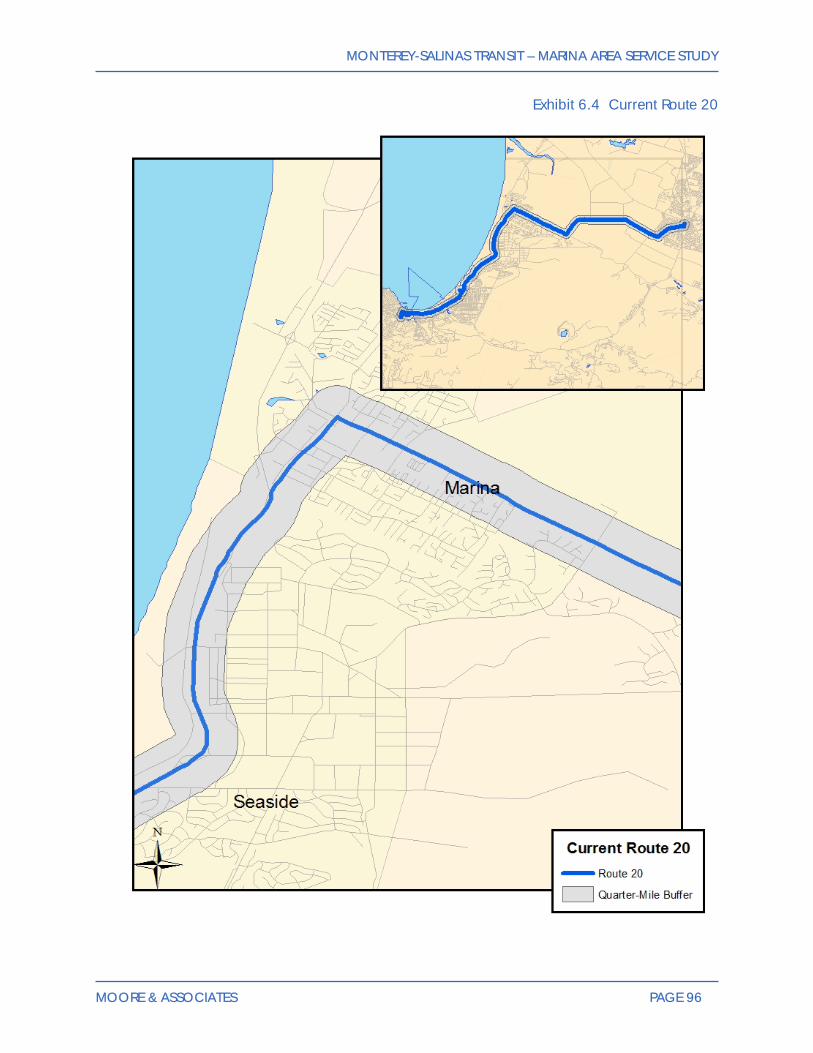
MONTEREY-SALINAS TRANSIT – MARINA AREA SERVICE STUDY
MOORE & ASSOCIATES PAGE 96
Exhibit 6.4 Current Route 20

MONTEREY-SALINAS TRANSIT – MARINA AREA SERVICE STUDY
MOORE & ASSOCIATES PAGE 97
Exhibit 6.5 Current Route 27

MONTEREY-SALINAS TRANSIT – MARINA AREA SERVICE STUDY
MOORE & ASSOCIATES PAGE 98
Exhibit 6.6 Current MST On-Call Marina

MONTEREY-SALINAS TRANSIT – MARINA AREA SERVICE STUDY
MOORE & ASSOCIATES PAGE 99
Exhibit 6.7 Current CSUMB Shuttle
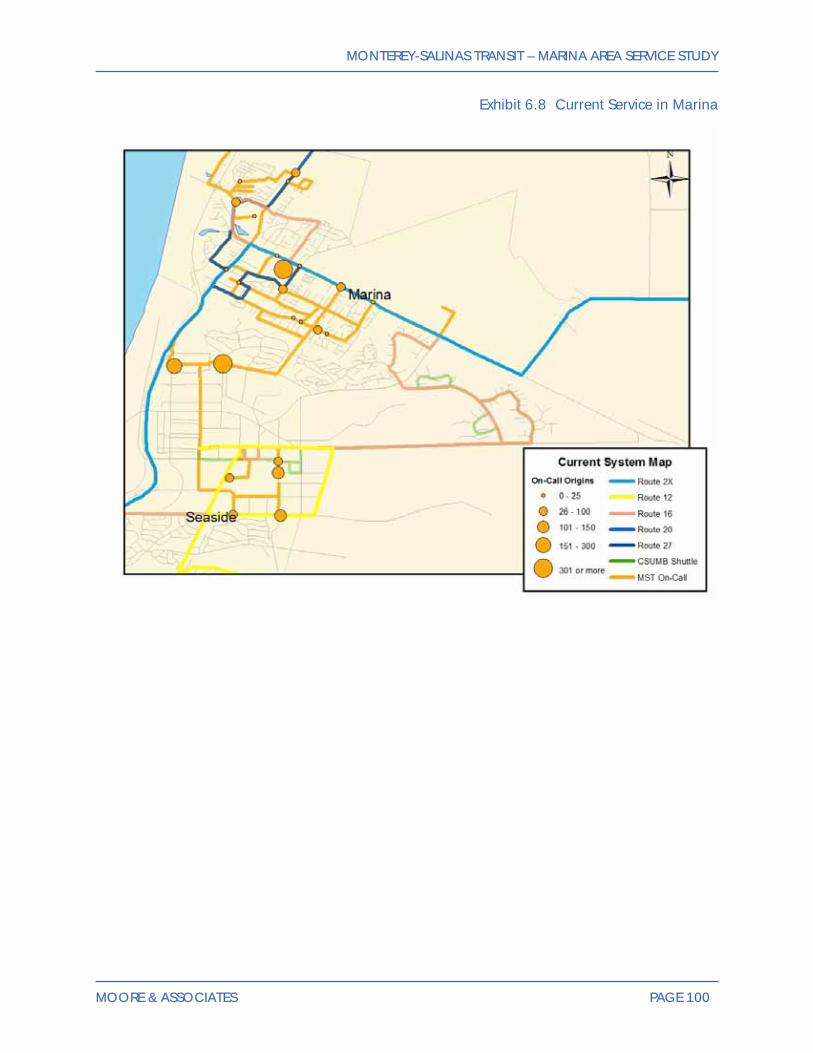
MONTEREY-SALINAS TRANSIT – MARINA AREA SERVICE STUDY
MOORE & ASSOCIATES PAGE 100
Exhibit 6.8 Current Service in Marina

MONTEREY-SALINAS TRANSIT – MARINA AREA SERVICE STUDY
MOORE & ASSOCIATES PAGE 101
Exhibit 6.9 Current Service in Marina with Quarter-Mile Buffers
This chapter details a series of proposed service enhancements aimed at
improving mobility, enhancing the efficiency of transit service delivery, and
increasing ridership within the Marina Service Sector. It is split into three
sections:
• Near-term recommendations (Implemented by July 1, 2011)
• Mid-term recommendations (implemented by July 1, 2014)
• Long-term recommendations (Implemented in FY 2014/15 and
after).
The three time frames serve different purposes. Near-Term
recommendations focus on addressing immediate needs, mid-term
recommendations are aimed at crafting a comprehensive approach

MONTEREY-SALINAS TRANSIT – MARINA AREA SERVICE STUDY
MOORE & ASSOCIATES PAGE 102
toward service delivery within the Marina Service Sector, and long-term
recommendations are designed to address forecast demand for transit
service associated with the continued build-out of Fort Ord. Taken
collectively, the recommendations are designed to enhance MST’s service
delivery strategy in the Marina Service Sector, though given Marina serves
as a gateway for many routes heading between Salinas and Monterey,
other portions of the service area stand to realize benefits as well.
Working with MST staff, we identified the following priorities for service
development (in no particular order):
• Strengthen MST long-line service.
• Leverage value of Marina Transit Exchange.
• Enhance mobility for Marina residents.
• Increase market share in/to CSUMB.
• Increase productivity of service between Salinas and Marina.
• Increase productivity of service between Marina and Monterey.
Near-Term Recommendations
Looking at the Marina Transit Exchange as the primary nexus for transit
service within the Marina Service Sector, it is important to understand the
relative demand of other destinations/origins. Other significant trip
generators in MST’s service area that are of interest to members of the
Marina community are:
• Salinas,
• Monterey,
• The Dunes Shopping Center,
• CSUMB, and
• Castroville/Watsonville.
Service delivery between the Marina Transit Exchange and these locations
vary. Connections between Salinas and Marina as well as Monterey and
Marina are strong: Routes 2X and 20 serve Salinas; and Routes 2X, 16,

MONTEREY-SALINAS TRANSIT – MARINA AREA SERVICE STUDY
MOORE & ASSOCIATES PAGE 103
and 20 serve Monterey. Castroville and Watsonville are served by Route
27, which makes trips every two hours between Watsonville in Santa Cruz
County and the Marina Transit Exchange (with some local service in
Marina). Service between the Marina Transit Exchange and CSUMB is only
available via Route 16, which provides local service between Marina and
downtown Monterey. The only service between Marina and the Dunes
Shopping Center is Route 2X, which makes three one-way, peak-direction
trips in the morning and three in the evening. The Dunes and CSUMB are
also served by the Marina On-Call demand-response service.
The most pressing needs identified through market research and
discussions with MST staff are:
• Transfer required for trips between CSUMB and Salinas,
• Limited transit service to the Dunes, and
• Ineffectiveness of Marina On-Call service.
These needs present an exciting opportunity to begin reconfiguring MST’s
service delivery strategy in and around Marina. Given funding for the
Marina On-Call service is set to expire within the horizon for near-term
recommendations, it is logical to consider a comprehensive approach
toward improving local service within Marina; enhancing connections
between CSUMB and Salinas; bringing CSUMB intra-campus transit
service under MST’s umbrella; and creating a more frequent connection
between CSUMB, the Dunes Shopping Center, and Marina.
The near-term recommendations will focus on improving connections
between CSUMB, the Dunes Shopping Center, and Marina. We propose
the introduction of a new alignment, Route 25. We propose a two-phase
introduction of Route 25 given funding constraints. The first phase of Route
25’s implementation consists of a “Marina Circulator” traveling between
the Marina Transit Exchange and CSUMB via the Dunes Shopping Center.
The second phase of the route’s implementation is included within the
“Mid-Term Recommendations” section of this chapter. The route would

MONTEREY-SALINAS TRANSIT – MARINA AREA SERVICE STUDY
MOORE & ASSOCIATES PAGE 104
travel from the Marina Transit Exchange to CSUMB via the Dunes
Shopping Center. It begins its trip at the Marina Transit Exchange and then
takes Crescent Avenue south to Carmel Avenue East. The bus would then
travel south along California until taking Imjin Parkway west to the Dunes
Shopping Center. Given limited turning motions available within the Dunes
parking lot, the bus would be forced to then travel south along Second
Avenue until it reaches the CSUMB campus. The bus would then do a loop
through the campus and then follow the alignment in reverse back to the
Marina Transit Exchange.
Notably absent from the return trip is a stop at the Dunes Shopping
Center. This can be attributed to the limited nature of turning movements
out of the Dunes parking lot where the MST stop is located. Buses are
forced to make a right-hand turn onto Second Avenue from the parking
lot, taking them toward CSUMB. This works well on the Marina to CSUMB
trip, but would require the bus to travel a significant distance out of its way
(i.e., southbound) on the northbound return trip. This is due to the
presence of a median blocking left-hand turns onto northbound Second
Avenue from the Dunes parking lot. This streetscape design decision
severely impacts MST’s ability to effectively serve the Dunes Shopping
Center. We recommend clearing a path through the median for left-hand
turns onto northbound Second Avenue, if only for buses. This would allow
for significantly improved access to the Dunes Shopping Center. In the
interim, we recommend buses traveling northbound on Second Avenue
intending to serve the Dunes Shopping Center include a stop on Second
Avenue. While this alternative would require a significant walk into the
Dunes Shopping Center, it is the most effective means of serving that
location coming from the south.

MONTEREY-SALINAS TRANSIT – MARINA AREA SERVICE STUDY
MOORE & ASSOCIATES PAGE 105
Exhibit 6.10 Proposed Marina Circulator

MONTEREY-SALINAS TRANSIT – MARINA AREA SERVICE STUDY
MOORE & ASSOCIATES PAGE 106
Estimated total mileage for a round trip is 10.4 miles, with an approximate
running time of fifty-five minutes. The proposed route would operate every
hour from 6:30 a.m. to 7:00 p.m. on weekdays. No Saturday service
would be offered initially. This level of service translates to 12.5 Vehicle
Service Hours each weekday. At MST’s NTD-report rate of $101.66/VSH in
2007, this would amount to approximately $6,353 per week or $324,041
annually.
Exhibit 6.11 Proposed Marina Circulator Sample Schedule
Divarty/ Engineer
Durham/ 6th
Divarty/ Engineer
6:30 AM 6:40 AM 6:50 AM 6:57 AM 7:07 AM 7:25 AM7:30 AM 7:40 AM 7:50 AM 7:57 AM 8:07 AM 8:25 AM8:30 AM 8:40 AM 8:50 AM 8:57 AM 9:07 AM 9:25 AM9:30 AM 9:40 AM 9:50 AM 9:57 AM 10:07 AM 10:25 AM
10:30 AM 10:40 AM 10:50 AM 10:57 AM 11:07 AM 11:25 AM11:30 AM 11:40 AM 11:50 AM 11:57 AM 12:07 PM 12:25 PM12:30 PM 12:40 PM 12:50 PM 12:57 PM 1:07 PM 1:25 PM1:30 PM 1:40 PM 1:50 PM 1:57 PM 2:07 PM 2:25 PM2:30 PM 2:40 PM 2:50 PM 2:57 PM 3:07 PM 3:25 PM3:30 PM 3:40 PM 3:50 PM 3:57 PM 4:07 PM 4:25 PM4:30 PM 4:40 PM 4:50 PM 4:57 PM 5:07 PM 5:25 PM5:30 PM 5:40 PM 5:50 PM 5:57 PM 6:07 PM 6:25 PM6:30 PM 6:40 PM 6:50 PM 6:57 PM 7:07 PM 7:25 PM
Marina Transit
Exchange
Marina Transit
Exchange
The Dunes
CSUMB

MONTEREY-SALINAS TRANSIT – MARINA AREA SERVICE STUDY
MOORE & ASSOCIATES PAGE 107
Exhibit 6.12 Near-Term Service in Marina

MONTEREY-SALINAS TRANSIT – MARINA AREA SERVICE STUDY
MOORE & ASSOCIATES PAGE 108
Exhibit 6.13 Near-Term Service in Marina with Quarter-Mile Buffers
Mid-Term Recommendations
The primary goal of mid-term recommendations is to bolster service
delivery within Marina through improvements to existing services. This
would reduce service gaps within the Marina Service Sector and promote
increased ridership, thus leading to increased fare revenue and improved
farebox recovery.
Given near-term recommendations focus on the introduction of new
service, mid-term recommendations will focus on responding to customer
desire for increased frequency and improved connections. We propose
accomplishing this through replacing the Marina Circulator with Route 25

MONTEREY-SALINAS TRANSIT – MARINA AREA SERVICE STUDY
MOORE & ASSOCIATES PAGE 109
operating between Salinas and CSUMB as well as increased frequency
along existing routes.
The Marina Circulator discussed in the “Near-Term Recommendations”
section of this chapter is an intermediary step leading to the ultimate goal
of improving connections between Salinas and CSUMB. Route 25 serves as
the complete realization of that goal, expanding upon the local service
between Marina and CSUMB with service to Salinas.
Route 25 would, however, suffer from the same connection problem to the
Dunes Shopping Center as does the Marina Circulator. Buses are forced to
make a right-hand turn onto Second Avenue from the parking lot, taking
them toward CSUMB. This works well on the Marina to CSUMB trip, but
would require the bus to travel a significant distance out of its way (i.e.,
southbound) on the northbound return trip. This is due to the presence of a
median blocking left-hand turns onto northbound Second Avenue from the
Dunes parking lot. This streetscape design decision severely impacts MST’s
ability to effectively serve the Dunes Shopping Center. We recommend
clearing a path through the median for left-hand turns onto northbound
Second Avenue, if only for buses. This would allow for significantly
improved access to the Dunes Shopping Center.

MONTEREY-SALINAS TRANSIT – MARINA AREA SERVICE STUDY
MOORE & ASSOCIATES PAGE 110
Exhibit 6.14 Proposed Route 25
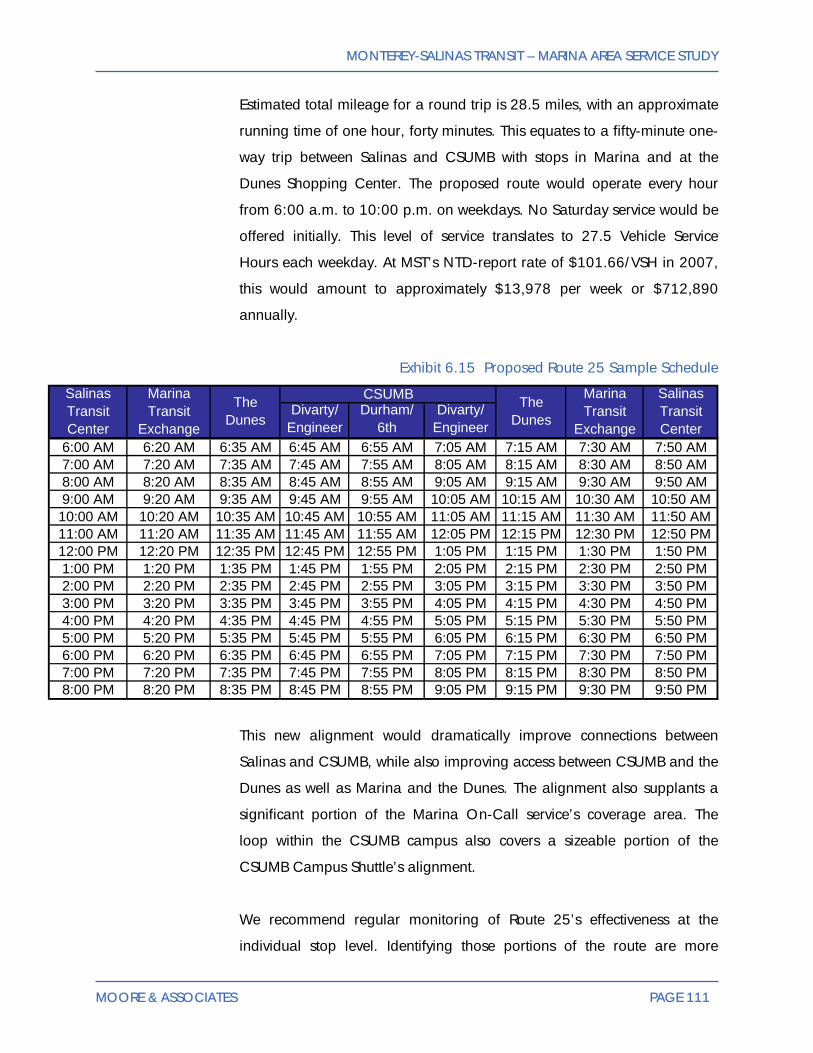
MONTEREY-SALINAS TRANSIT – MARINA AREA SERVICE STUDY
MOORE & ASSOCIATES PAGE 111
Estimated total mileage for a round trip is 28.5 miles, with an approximate
running time of one hour, forty minutes. This equates to a fifty-minute one-
way trip between Salinas and CSUMB with stops in Marina and at the
Dunes Shopping Center. The proposed route would operate every hour
from 6:00 a.m. to 10:00 p.m. on weekdays. No Saturday service would be
offered initially. This level of service translates to 27.5 Vehicle Service
Hours each weekday. At MST’s NTD-report rate of $101.66/VSH in 2007,
this would amount to approximately $13,978 per week or $712,890
annually.
Exhibit 6.15 Proposed Route 25 Sample Schedule
Divarty/ Engineer
Durham/ 6th
Divarty/ Engineer
6:00 AM 6:20 AM 6:35 AM 6:45 AM 6:55 AM 7:05 AM 7:15 AM 7:30 AM 7:50 AM7:00 AM 7:20 AM 7:35 AM 7:45 AM 7:55 AM 8:05 AM 8:15 AM 8:30 AM 8:50 AM8:00 AM 8:20 AM 8:35 AM 8:45 AM 8:55 AM 9:05 AM 9:15 AM 9:30 AM 9:50 AM9:00 AM 9:20 AM 9:35 AM 9:45 AM 9:55 AM 10:05 AM 10:15 AM 10:30 AM 10:50 AM10:00 AM 10:20 AM 10:35 AM 10:45 AM 10:55 AM 11:05 AM 11:15 AM 11:30 AM 11:50 AM11:00 AM 11:20 AM 11:35 AM 11:45 AM 11:55 AM 12:05 PM 12:15 PM 12:30 PM 12:50 PM12:00 PM 12:20 PM 12:35 PM 12:45 PM 12:55 PM 1:05 PM 1:15 PM 1:30 PM 1:50 PM1:00 PM 1:20 PM 1:35 PM 1:45 PM 1:55 PM 2:05 PM 2:15 PM 2:30 PM 2:50 PM2:00 PM 2:20 PM 2:35 PM 2:45 PM 2:55 PM 3:05 PM 3:15 PM 3:30 PM 3:50 PM3:00 PM 3:20 PM 3:35 PM 3:45 PM 3:55 PM 4:05 PM 4:15 PM 4:30 PM 4:50 PM4:00 PM 4:20 PM 4:35 PM 4:45 PM 4:55 PM 5:05 PM 5:15 PM 5:30 PM 5:50 PM5:00 PM 5:20 PM 5:35 PM 5:45 PM 5:55 PM 6:05 PM 6:15 PM 6:30 PM 6:50 PM6:00 PM 6:20 PM 6:35 PM 6:45 PM 6:55 PM 7:05 PM 7:15 PM 7:30 PM 7:50 PM7:00 PM 7:20 PM 7:35 PM 7:45 PM 7:55 PM 8:05 PM 8:15 PM 8:30 PM 8:50 PM8:00 PM 8:20 PM 8:35 PM 8:45 PM 8:55 PM 9:05 PM 9:15 PM 9:30 PM 9:50 PM
Salinas Transit Center
CSUMBSalinas Transit Center
Marina Transit
Exchange
The Dunes
The Dunes
Marina Transit
Exchange
This new alignment would dramatically improve connections between
Salinas and CSUMB, while also improving access between CSUMB and the
Dunes as well as Marina and the Dunes. The alignment also supplants a
significant portion of the Marina On-Call service’s coverage area. The
loop within the CSUMB campus also covers a sizeable portion of the
CSUMB Campus Shuttle’s alignment.
We recommend regular monitoring of Route 25’s effectiveness at the
individual stop level. Identifying those portions of the route are more

MONTEREY-SALINAS TRANSIT – MARINA AREA SERVICE STUDY
MOORE & ASSOCIATES PAGE 112
productive would allow MST to tweak the alignment in out years to better
serve the community. This should be done on at least a quarterly basis
using either ride checks or APC data.
Frequency plays a significant role in whether a transit program can attract
new “choice” riders. Increased frequency translates to increased flexibility
for patrons in regards to choosing a travel time. The customer survey
(Chapter 2) revealed nearly 64 percent of riders choose MST because they
lack access to a motor vehicle. Only 13 percent indicated they would drive
themselves if MST was not available. This indicates a high level of ride-
dependence among transit customers within Marina.
To expand its customer base and increase its share of the trips made within
Marina, MST should implement service enhancements targeted toward
“choice” riders. “Choice” riders have access to a personal vehicle, but
would elect to use transit for some or all of their trips should service be
more convenient. “Choice” riders demand more amenities (onboard
vehicles and at bus stops), more frequent service, more convenient fare
media, and are typically more technologically savvy than ride-dependent
patrons. They also respond well to targeted marketing efforts highlighting
the convenience, environmental sustainability, and cost-related benefits of
transit.
To attract new riders from a broader spectrum of the population, we
recommend MST increase frequency along Routes 16, 20, and 25.
To increase MST’s share of trips made within the Marina Service Sector, we
propose increasing weekday frequency along three major alignments:
Routes 16, 20, and proposed Route 25. These routes serve significant
destinations and population centers and serve as the backbone of transit
service within the Marina Service Sector.

MONTEREY-SALINAS TRANSIT – MARINA AREA SERVICE STUDY
MOORE & ASSOCIATES PAGE 113
We propose doubling the frequency of service along Route 16. Given
frequent requests for shorter headways within the Marina and CSUMB
communities, this step would result in significant increases in ridership and
fare revenue. Doubling frequency to 30 minutes would require an
additional two buses until 7:15 p.m., at which point headways would
revert to hourly.
A sample schedule for the proposed enhancement is below.
Exhibit 6.16 Route 16 Sample Schedule
Monterey Transit Plaza
Edgewater Transit
Exchange
CSUMB 4th/Divarty
Imjin/ Reservation
Marina Transit Exchange
Marina Transit Exchange
Imjin/ Reservation
CSUMB 4th/Divarty
Edgewater Transit
Exchange
Monterey Transit Plaza
-- 6:11 AM 6:28 AM 6:47 AM 6:56 AM 6:36 AM 6:41 AM 6:58 AM 7:15 AM 7:25 AM6:30 AM 6:41 AM 6:58 AM 7:17 AM 7:26 AM 7:06 AM 7:11 AM 7:28 AM 7:45 AM 7:55 AM7:00 AM 7:11 AM 7:28 AM 7:47 AM 7:56 AM 7:36 AM 7:41 AM 7:58 AM 8:15 AM 8:25 AM7:30 AM 7:41 AM 7:58 AM 8:17 AM 8:26 AM 8:06 AM 8:11 AM 8:28 AM 8:45 AM 8:55 AM8:00 AM 8:11 AM 8:28 AM 8:47 AM 8:56 AM 8:36 AM 8:41 AM 8:58 AM 9:15 AM 9:25 AM8:30 AM 8:41 AM 8:58 AM 9:17 AM 9:26 AM 9:06 AM 9:11 AM 9:28 AM 9:45 AM 9:55 AM9:00 AM 9:11 AM 9:28 AM 9:47 AM 9:56 AM 9:36 AM 9:41 AM 9:58 AM 10:15 AM 10:25 AM9:30 AM 9:41 AM 9:58 AM 10:17 AM 10:26 AM 10:06 AM 10:11 AM 10:28 AM 10:45 AM 10:55 AM
10:00 AM 10:11 AM 10:28 AM 10:47 AM 10:56 AM 10:36 AM 10:41 AM 10:58 AM 11:15 AM 11:25 AM10:30 AM 10:41 AM 10:58 AM 11:17 AM 11:26 AM 11:06 AM 11:11 AM 11:28 AM 11:45 AM 11:55 AM11:00 AM 11:11 AM 11:28 AM 11:47 AM 11:56 AM 11:36 AM 11:41 AM 11:58 AM 12:15 PM 12:25 PM11:30 AM 11:41 AM 11:58 AM 12:17 PM 12:26 PM 12:06 PM 12:11 PM 12:28 PM 12:45 PM 12:55 PM12:00 PM 12:11 PM 12:28 PM 12:47 PM 12:56 PM 12:36 PM 12:41 PM 12:58 PM 1:15 PM 1:25 PM12:30 PM 12:41 PM 12:58 PM 1:17 PM 1:26 PM 1:06 PM 1:11 PM 1:28 PM 1:45 PM 1:55 PM1:00 PM 1:11 PM 1:28 PM 1:47 PM 1:56 PM 1:36 PM 1:41 PM 1:58 PM 2:15 PM 2:25 PM1:30 PM 1:41 PM 1:58 PM 2:17 PM 2:26 PM 2:06 PM 2:11 PM 2:28 PM 2:45 PM 2:55 PM2:00 PM 2:11 PM 2:28 PM 2:47 PM 2:56 PM 2:36 PM 2:41 PM 2:58 PM 3:15 PM 3:25 PM2:30 PM 2:41 PM 2:58 PM 3:17 PM 3:26 PM 3:06 PM 3:11 PM 3:28 PM 3:45 PM 3:55 PM3:00 PM 3:11 PM 3:28 PM 3:47 PM 3:56 PM 3:36 PM 3:41 PM 3:58 PM 4:15 PM 4:25 PM3:30 PM 3:41 PM 3:58 PM 4:17 PM 4:26 PM 4:06 PM 4:11 PM 4:28 PM 4:45 PM 4:55 PM4:00 PM 4:11 PM 4:28 PM 4:47 PM 4:56 PM 4:36 PM 4:41 PM 4:58 PM 5:15 PM 5:25 PM4:30 PM 4:41 PM 4:58 PM 5:17 PM 5:26 PM 5:06 PM 5:11 PM 5:28 PM 5:45 PM 5:55 PM5:00 PM 5:11 PM 5:28 PM 5:47 PM 5:56 PM 5:36 PM 5:41 PM 5:58 PM 6:15 PM 6:25 PM5:30 PM 5:41 PM 5:58 PM 6:17 PM 6:26 PM 6:06 PM 6:11 PM 6:28 PM 6:45 PM 6:55 PM6:15 PM 6:26 PM 6:43 PM 7:02 PM 7:11 PM 6:36 PM 6:41 PM 6:58 PM 7:15 PM 7:25 PM6:45 PM 6:56 PM 7:13 PM 7:32 PM 7:41 PM 7:21 PM 7:26 PM 7:43 PM 8:00 PM 8:10 PM7:15 PM 7:26 PM 7:43 PM 8:02 PM 8:11 PM 8:21 PM 8:26 PM 8:43 PM 9:00 PM 9:10 PM8:15 PM 8:26 PM 8:43 PM 9:02 PM 9:11 PM 9:21 PM 9:26 PM 9:43 PM 10:00 PM 10:10 PM9:15 PM 9:26 PM 9:43 PM 10:02 PM 10:11 PM 10:21 PM 10:26 PM 10:43 PM 11:00 PM 11:10 PM
10:15 PM 10:26 PM 10:43 PM 11:02 PM 11:11 PM
Monterey-Salinas Transit Route 20 is currently the most productive route in
the system. It carries more than 50,000 riders each month, more than four
times as many riders as the next most productive route traveling through
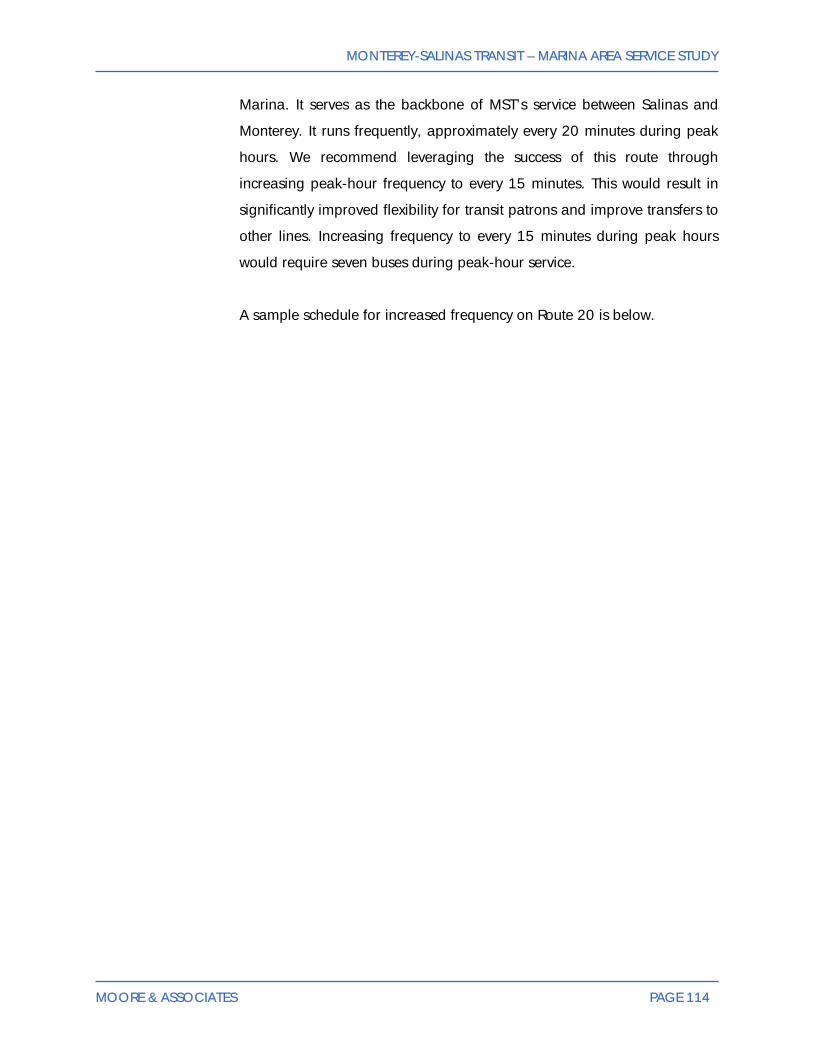
MONTEREY-SALINAS TRANSIT – MARINA AREA SERVICE STUDY
MOORE & ASSOCIATES PAGE 114
Marina. It serves as the backbone of MST’s service between Salinas and
Monterey. It runs frequently, approximately every 20 minutes during peak
hours. We recommend leveraging the success of this route through
increasing peak-hour frequency to every 15 minutes. This would result in
significantly improved flexibility for transit patrons and improve transfers to
other lines. Increasing frequency to every 15 minutes during peak hours
would require seven buses during peak-hour service.
A sample schedule for increased frequency on Route 20 is below.

MONTEREY-SALINAS TRANSIT – MARINA AREA SERVICE STUDY
MOORE & ASSOCIATES PAGE 115
Exhibit 6.17 Route 20 Sample Schedule
Monterey Transit Plaza
Edgewater Transit
Exchange
Marina Transit Exchange
Salinas Transit Center
Salinas Transit Center
Marina Transit Exchange
Edgewater Transit
Exchange
Monterey Transit Plaza
6:00 AM 6:15 AM 6:33 AM 6:53 AM 5:05 AM 5:26 AM 5:40 AM 5:58 AM6:15 AM 6:30 AM 6:48 AM 7:08 AM 5:45 AM 6:06 AM 6:23 AM 6:38 AM6:30 AM 6:45 AM 7:03 AM 7:23 AM 6:10 AM 6:31 AM 6:45 AM 6:59 AM6:45 AM 7:00 AM 7:18 AM 7:38 AM 6:40 AM 7:01 AM 7:15 AM 7:29 AM7:00 AM 7:15 AM 7:33 AM 7:53 AM 7:00 AM 7:21 AM 7:38 AM 7:53 AM7:15 AM 7:30 AM 7:48 AM 8:08 AM 7:15 AM 7:32 AM 7:51 AM 8:08 AM7:30 AM 7:45 AM 8:03 AM 8:23 AM 7:30 AM 7:47 AM 8:06 AM 8:23 AM8:00 AM 8:15 AM 8:33 AM 8:53 AM 7:45 AM 8:02 AM 8:23 AM 8:38 AM8:15 AM 8:30 AM 8:48 AM 9:08 AM 8:00 AM 8:17 AM 8:38 AM 8:53 AM8:30 AM 8:45 AM 9:03 AM 9:23 AM 8:15 AM 8:32 AM 8:53 AM 9:08 AM8:45 AM 9:00 AM 9:18 AM 9:38 AM 8:45 AM 9:06 AM 9:23 AM 9:38 AM9:00 AM 9:15 AM 9:33 AM 9:53 AM 9:00 AM 9:21 AM 9:38 AM 9:53 AM9:15 AM 9:30 AM 9:48 AM 10:08 AM 9:15 AM 9:34 AM 9:48 AM 10:02 AM9:45 AM 10:00 AM 10:18 AM 10:38 AM 9:30 AM 9:51 AM 10:08 AM 10:23 AM10:15 AM 10:30 AM 10:48 AM 11:08 AM 9:45 AM 10:06 AM 10:23 AM 10:38 AM10:45 AM 11:00 AM 11:18 AM 11:38 AM 10:00 AM 10:21 AM 10:38 AM 10:53 AM11:15 AM 11:30 AM 11:48 AM 12:08 PM 10:15 AM 10:36 AM 10:53 AM 11:08 AM11:45 AM 12:00 PM 12:18 PM 12:38 PM 10:45 AM 11:06 AM 11:23 AM 11:38 AM12:15 PM 12:30 PM 12:48 PM 1:08 PM 11:15 AM 11:36 AM 11:53 AM 12:08 PM12:45 PM 1:00 PM 1:18 PM 1:38 PM 11:45 AM 12:06 PM 12:23 PM 12:38 PM1:15 PM 1:30 PM 1:48 PM 2:08 PM 12:15 PM 12:36 PM 12:53 PM 1:08 PM1:45 PM 2:00 PM 2:18 PM 2:38 PM 12:45 PM 1:06 PM 1:23 PM 1:38 PM2:15 PM 2:30 PM 2:48 PM 3:08 PM 1:15 PM 1:36 PM 1:53 PM 2:08 PM2:45 PM 3:00 PM 3:18 PM 3:38 PM 1:45 PM 2:06 PM 2:23 PM 2:38 PM3:15 PM 3:30 PM 3:48 PM 4:08 PM 2:15 PM 2:36 PM 2:53 PM 3:08 PM3:45 PM 4:00 PM 4:18 PM 4:38 PM 2:48 PM 3:09 PM 3:26 PM 3:41 PM4:00 PM 4:15 PM 4:33 PM 4:53 PM 3:15 PM 3:36 PM 3:53 PM 4:08 PM4:15 PM 4:30 PM 4:48 PM 5:08 PM 3:45 PM 4:06 PM 4:23 PM 4:38 PM4:30 PM 4:45 PM 5:03 PM 5:23 PM 4:18 PM 4:39 PM 4:56 PM 5:11 PM4:45 PM 5:00 PM 5:18 PM 5:38 PM 4:33 PM 4:54 PM 5:11 PM 5:26 PM5:18 PM 5:33 PM 5:51 PM 6:11 PM 4:48 PM 5:09 PM 5:26 PM 5:41 PM5:33 PM 5:48 PM 6:06 PM 6:26 PM 5:03 PM 5:24 PM 5:41 PM 5:56 PM5:48 PM 6:03 PM 6:21 PM 6:41 PM 5:18 PM 5:39 PM 5:56 PM 6:11 PM6:03 PM 6:18 PM 6:36 PM 6:56 PM 5:33 PM 5:52 PM 6:05 PM 6:17 PM6:18 PM 6:33 PM 6:51 PM 7:11 PM 5:48 PM 6:09 PM 6:26 PM 6:41 PM6:33 PM 6:48 PM 7:06 PM 7:26 PM 6:18 PM 6:37 PM 6:53 PM 7:05 PM6:48 PM 7:03 PM 7:21 PM 7:41 PM 6:33 PM 6:52 PM 7:08 PM 7:20 PM7:15 PM 7:30 PM 7:48 PM 8:08 PM 6:48 PM 7:09 PM 7:26 PM 7:41 PM8:15 PM 8:30 PM 8:48 PM 9:08 PM 7:15 PM 7:36 PM 7:52 PM 8:08 PM9:15 PM 9:30 PM 9:48 PM 10:08 PM 8:20 PM 8:43 PM 8:52 PM 9:08 PM10:15 PM 10:30 PM 10:48 PM 11:08 PM 9:15 PM 9:36 PM 9:52 PM 10:08 PM11:15 PM 11:27 PM 11:42 PM 12:00 AM 10:15 PM 10:36 PM 10:48 PM 11:02 PM
Should performance monitoring reveal significant demand for Route 25,
we recommend increasing frequency to 30-minute headways. This would
allow the route to transition from a service primarily for ride-dependent
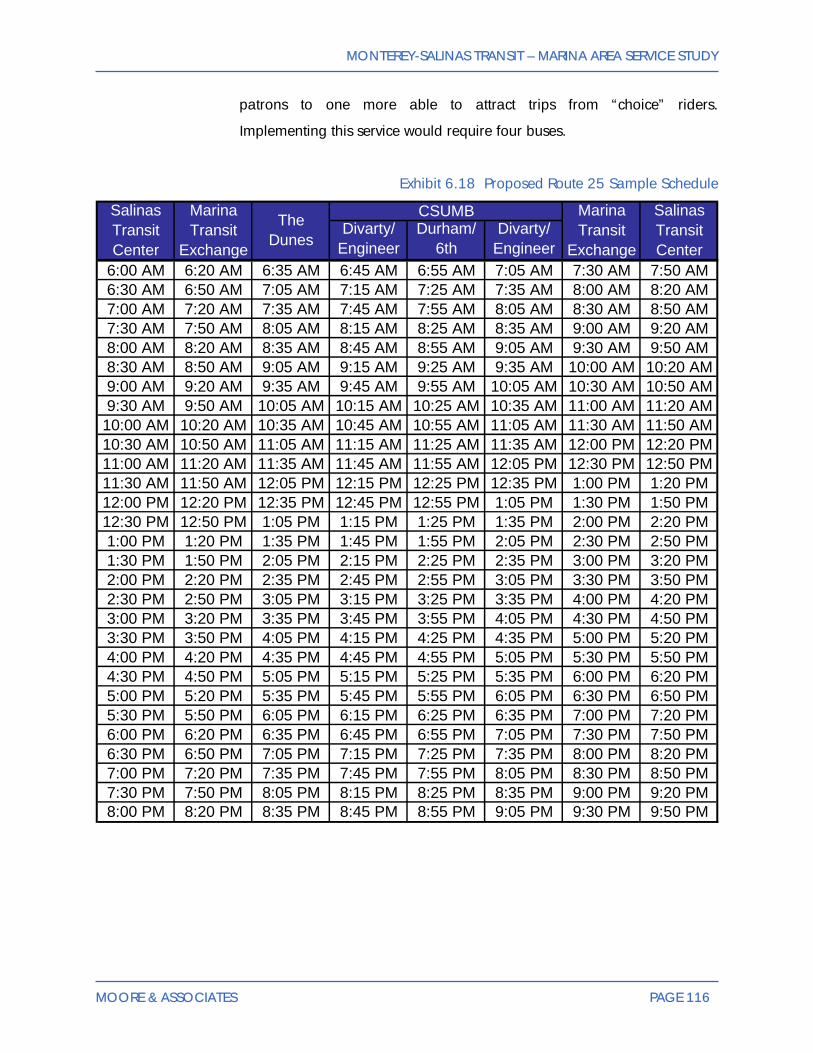
MONTEREY-SALINAS TRANSIT – MARINA AREA SERVICE STUDY
MOORE & ASSOCIATES PAGE 116
patrons to one more able to attract trips from “choice” riders.
Implementing this service would require four buses.
Exhibit 6.18 Proposed Route 25 Sample Schedule
Divarty/ Engineer
Durham/ 6th
Divarty/ Engineer
6:00 AM 6:20 AM 6:35 AM 6:45 AM 6:55 AM 7:05 AM 7:30 AM 7:50 AM6:30 AM 6:50 AM 7:05 AM 7:15 AM 7:25 AM 7:35 AM 8:00 AM 8:20 AM7:00 AM 7:20 AM 7:35 AM 7:45 AM 7:55 AM 8:05 AM 8:30 AM 8:50 AM7:30 AM 7:50 AM 8:05 AM 8:15 AM 8:25 AM 8:35 AM 9:00 AM 9:20 AM8:00 AM 8:20 AM 8:35 AM 8:45 AM 8:55 AM 9:05 AM 9:30 AM 9:50 AM8:30 AM 8:50 AM 9:05 AM 9:15 AM 9:25 AM 9:35 AM 10:00 AM 10:20 AM9:00 AM 9:20 AM 9:35 AM 9:45 AM 9:55 AM 10:05 AM 10:30 AM 10:50 AM9:30 AM 9:50 AM 10:05 AM 10:15 AM 10:25 AM 10:35 AM 11:00 AM 11:20 AM
10:00 AM 10:20 AM 10:35 AM 10:45 AM 10:55 AM 11:05 AM 11:30 AM 11:50 AM10:30 AM 10:50 AM 11:05 AM 11:15 AM 11:25 AM 11:35 AM 12:00 PM 12:20 PM11:00 AM 11:20 AM 11:35 AM 11:45 AM 11:55 AM 12:05 PM 12:30 PM 12:50 PM11:30 AM 11:50 AM 12:05 PM 12:15 PM 12:25 PM 12:35 PM 1:00 PM 1:20 PM12:00 PM 12:20 PM 12:35 PM 12:45 PM 12:55 PM 1:05 PM 1:30 PM 1:50 PM12:30 PM 12:50 PM 1:05 PM 1:15 PM 1:25 PM 1:35 PM 2:00 PM 2:20 PM1:00 PM 1:20 PM 1:35 PM 1:45 PM 1:55 PM 2:05 PM 2:30 PM 2:50 PM1:30 PM 1:50 PM 2:05 PM 2:15 PM 2:25 PM 2:35 PM 3:00 PM 3:20 PM2:00 PM 2:20 PM 2:35 PM 2:45 PM 2:55 PM 3:05 PM 3:30 PM 3:50 PM2:30 PM 2:50 PM 3:05 PM 3:15 PM 3:25 PM 3:35 PM 4:00 PM 4:20 PM3:00 PM 3:20 PM 3:35 PM 3:45 PM 3:55 PM 4:05 PM 4:30 PM 4:50 PM3:30 PM 3:50 PM 4:05 PM 4:15 PM 4:25 PM 4:35 PM 5:00 PM 5:20 PM4:00 PM 4:20 PM 4:35 PM 4:45 PM 4:55 PM 5:05 PM 5:30 PM 5:50 PM4:30 PM 4:50 PM 5:05 PM 5:15 PM 5:25 PM 5:35 PM 6:00 PM 6:20 PM5:00 PM 5:20 PM 5:35 PM 5:45 PM 5:55 PM 6:05 PM 6:30 PM 6:50 PM5:30 PM 5:50 PM 6:05 PM 6:15 PM 6:25 PM 6:35 PM 7:00 PM 7:20 PM6:00 PM 6:20 PM 6:35 PM 6:45 PM 6:55 PM 7:05 PM 7:30 PM 7:50 PM6:30 PM 6:50 PM 7:05 PM 7:15 PM 7:25 PM 7:35 PM 8:00 PM 8:20 PM7:00 PM 7:20 PM 7:35 PM 7:45 PM 7:55 PM 8:05 PM 8:30 PM 8:50 PM7:30 PM 7:50 PM 8:05 PM 8:15 PM 8:25 PM 8:35 PM 9:00 PM 9:20 PM8:00 PM 8:20 PM 8:35 PM 8:45 PM 8:55 PM 9:05 PM 9:30 PM 9:50 PM
Marina Transit
Exchange
Salinas Transit Center
Salinas Transit Center
Marina Transit
Exchange
The Dunes
CSUMB

MONTEREY-SALINAS TRANSIT – MARINA AREA SERVICE STUDY
MOORE & ASSOCIATES PAGE 117
Exhibit 6.19 Mid-Term Service in Marina

MONTEREY-SALINAS TRANSIT – MARINA AREA SERVICE STUDY
MOORE & ASSOCIATES PAGE 118
Exhibit 6.20 Mid-Term Service in Marina with Quarter-Mile Buffers

MONTEREY-SALINAS TRANSIT – MARINA AREA SERVICE STUDY
MOORE & ASSOCIATES PAGE 119
Long-Term Recommendations
Long-term recommendations focus on planning for forecast growth within
the Marina Service Sector, specifically in and within the former Fort Ord.
The long-term redevelopment plans for Fort Ord call for significant
housing and commercial development as well as essential services, such as
a new hospital. Accommodating this growth will require enhancements to
existing service, alignment adjustments, as well as the introduction of new
routes.
The goal of the long-term recommendations is to supplement existing
service as well as near- and mid-term recommendations to create a
comprehensive approach toward transit service delivery within Marina and
Fort Ord/CSUMB. To that end, we propose the following
recommendations:
• Realign Route 27 to better serve CSUMB, and
• Introduce a dedicated local Marina circulator.
These recommendations are discussed in more detail below.
Realign Route 27
Route 27 currently provides service between Marina and
Watsonville in Santa Cruz County. The route currently carries
approximately 2,000 riders each month, about one-sixth what
Route 16 carries and one-twentieth of Route 20. Given this Plan’s
increased focus on CSUMB as a major trip origin/destination, we
propose realigning Route 27 to extend it to CSUMB. This would
result in improved connections between Watsonville, Castroville,
and CSUMB as well as provide an alternate path for those looking
to travel between Marina and CSUMB. Given the route currently
provides some local service in the western portion of Marina and
has 13-minute layovers at the Marina Transit Exchange, we believe
it is possible to re-route the alignment directly from Castroville into

MONTEREY-SALINAS TRANSIT – MARINA AREA SERVICE STUDY
MOORE & ASSOCIATES PAGE 120
the Marina Transit Exchange, and then on to CSUMB via California
Avenue.
We recommend this change be accompanied by performance
monitoring to determine its net effect. Should patrons stop using
the service as a result, we recommend reverting to the current
alignment. However, should ridership increase, we recommend
increasing frequency along the route to transition it from a
primarily “life-line” service to a more mainstream service capable
of attracting “choice” riders.
A map of the proposed realignment is below.
MONTEREY-SALINAS TRANSIT – MARINA AREA SERVICE STUDY
MOORE & ASSOCIATES PAGE 121
Exhibit 6.21 Proposed Route 27

MONTEREY-SALINAS TRANSIT – MARINA AREA SERVICE STUDY
MOORE & ASSOCIATES PAGE 122
Marina Circulator
We believe poor patronage on the Marina On-Call service – the
community’s only local service – is due in large part to the fact it is
a demand-response service. Demand-response programs provide
a great deal of convenience in regards to origin and destination,
while fixed-route programs provide less convenience in terms of
origin/destination at the expense of improved reliability and
capacity. Demand-response programs are typically much less cost-
effective on a per-passenger basis than fixed-route programs and
also present a significant barrier to entry as there is no posted
schedule.
Given the Marina On-Call service is funded through a relatively
short-term grant which is set to expire in the next fiscal year, we
propose MST consider transitioning to a dedicated, fixed-route
circulator within Marina.
A good example of a viable community circulator service is Santa
Monica Big Blue Bus’ new Mini Blue service. The Mini Blue service
consists of four neighborhood circulators using smaller, 30-foot
low-floor coaches. The buses run frequently (every 15-20 minutes)
and fares are only 50 cents (versus 75 cents for regular Big Blue
Bus lines).
We recommend MST consider implementing the service as a trial to
replace the MST On-Call service as well as serve new or expanding
residential/commercial developments within Fort Ord. The service
should be offered at a reduced fare and operate every half-hour. It
should serve key points between the Marina and Edgewater Transit
Exchanges, including the Dunes Shopping Center, the Department
of Defense building, the Marina library, and CSUMB.
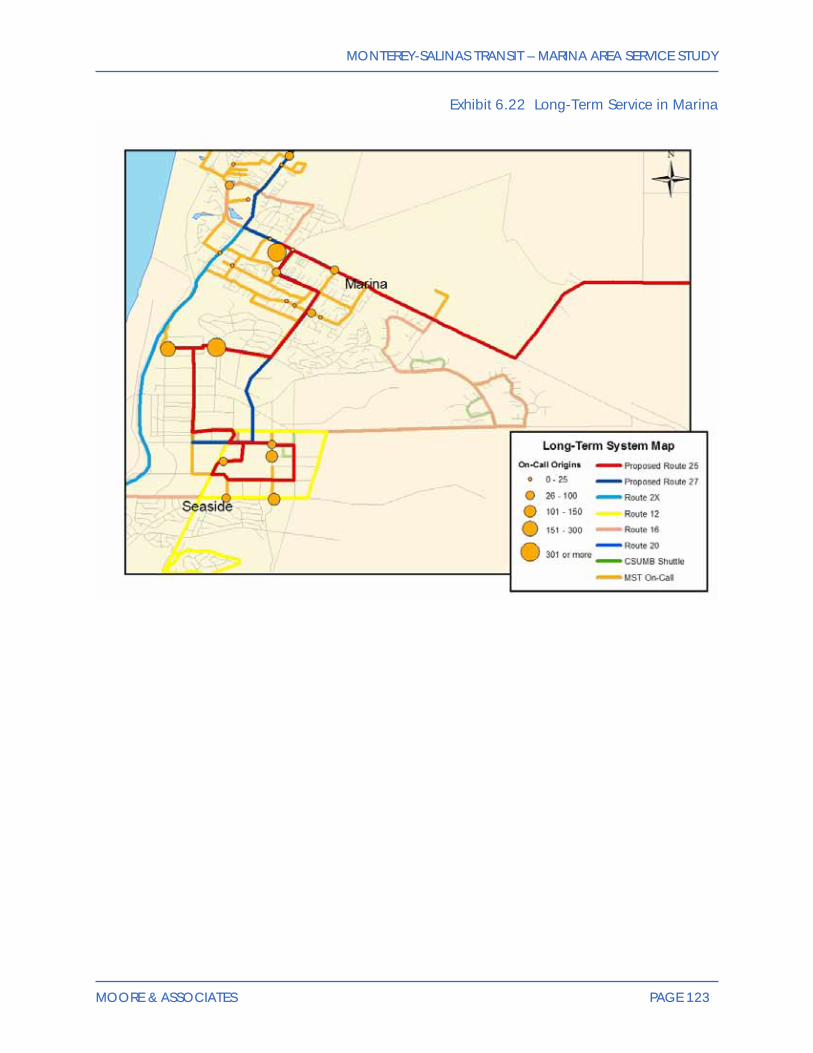
MONTEREY-SALINAS TRANSIT – MARINA AREA SERVICE STUDY
MOORE & ASSOCIATES PAGE 123
Exhibit 6.22 Long-Term Service in Marina

MONTEREY-SALINAS TRANSIT – MARINA AREA SERVICE STUDY
MOORE & ASSOCIATES PAGE 124
Exhibit 6.23 Long-Term Service in Marina with Quarter-Mile Buffers