monroe county accident rate database gis conversion upwp ... · the monroe county accident rate...
TRANSCRIPT
Monroe County Accident Rate Database GIS Conversion UPWP #6231 Executive Summary December 2012
1
Project Objective
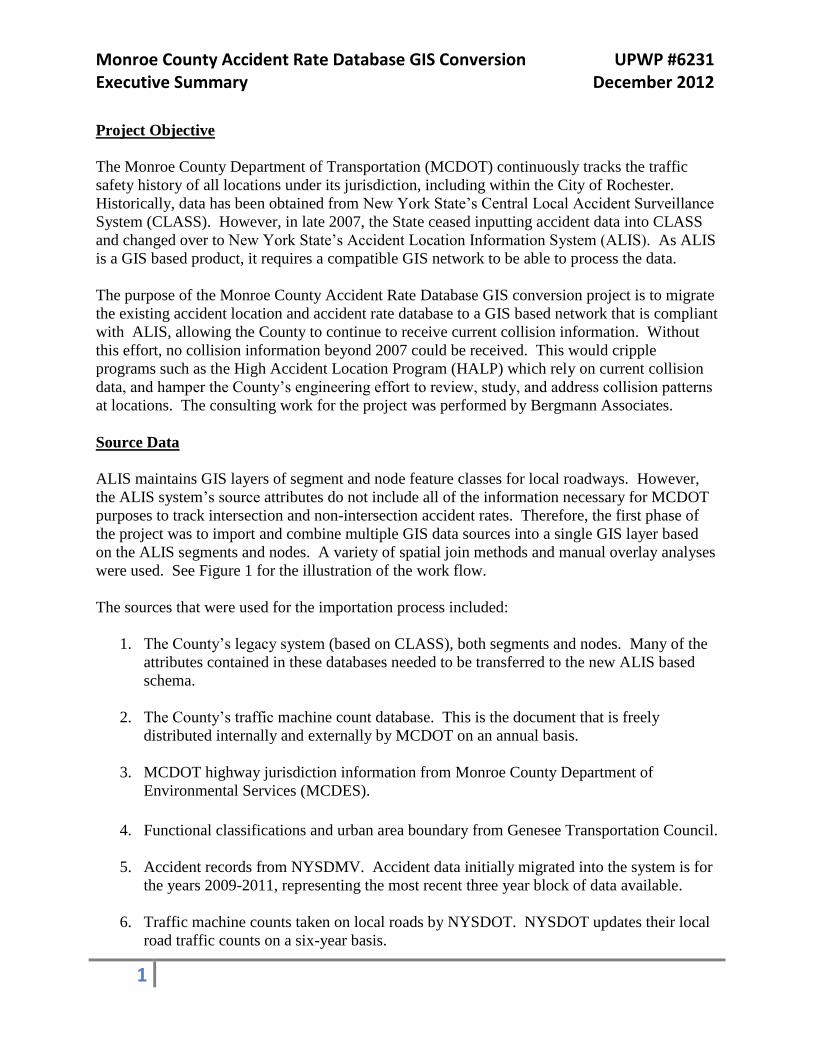
The Monroe County Department of Transportation (MCDOT) continuously tracks the traffic
safety history of all locations under its jurisdiction, including within the City of Rochester.
Historically, data has been obtained from New York State’s Central Local Accident Surveillance
System (CLASS). However, in late 2007, the State ceased inputting accident data into CLASS
and changed over to New York State’s Accident Location Information System (ALIS). As ALIS
is a GIS based product, it requires a compatible GIS network to be able to process the data.
The purpose of the Monroe County Accident Rate Database GIS conversion project is to migrate
the existing accident location and accident rate database to a GIS based network that is compliant
with ALIS, allowing the County to continue to receive current collision information. Without
this effort, no collision information beyond 2007 could be received. This would cripple
programs such as the High Accident Location Program (HALP) which rely on current collision
data, and hamper the County’s engineering effort to review, study, and address collision patterns
at locations. The consulting work for the project was performed by Bergmann Associates.
Source Data
ALIS maintains GIS layers of segment and node feature classes for local roadways. However,
the ALIS system’s source attributes do not include all of the information necessary for MCDOT
purposes to track intersection and non-intersection accident rates. Therefore, the first phase of
the project was to import and combine multiple GIS data sources into a single GIS layer based
on the ALIS segments and nodes. A variety of spatial join methods and manual overlay analyses
were used. See Figure 1 for the illustration of the work flow.
The sources that were used for the importation process included:
1. The County’s legacy system (based on CLASS), both segments and nodes. Many of the
attributes contained in these databases needed to be transferred to the new ALIS based
schema.
2. The County’s traffic machine count database. This is the document that is freely
distributed internally and externally by MCDOT on an annual basis.
3. MCDOT highway jurisdiction information from Monroe County Department of
Environmental Services (MCDES).
4. Functional classifications and urban area boundary from Genesee Transportation Council.
5. Accident records from NYSDMV. Accident data initially migrated into the system is for
the years 2009-2011, representing the most recent three year block of data available.
6. Traffic machine counts taken on local roads by NYSDOT. NYSDOT updates their local
road traffic counts on a six-year basis.

Monroe County Accident Rate Database GIS Conversion UPWP #6231 Executive Summary December 2012
2
The project successfully combined the above elements into a common GIS layer such that each
relevant attribute was captured and can be mathematically and/or logically combined as needed.
Output Products
From the source data, the following feature classes with attribute tables were created:
1. Crash Locations from NYSDOT – GIS point layer (see Figure 2).
2. ALIS Segments – GIS line layer (see Figure 3).
3. ALIS Nodes – GIS point layer (see Figure 3).
4. MCDOT Intersections – GIS polygon layer (see Figure 3). The purpose of the polygons
is to geographically group clusters of nodes together, so that they can be treated as a
single intersection for accident rate calculation purposes.
A series of custom tools were developed by the consultant to calculate accident rates and create
report-ready Microsoft Access tables. The tools enabled the following outputs:
Calculate Intersection Average Daily Traffic (ADT) for the intersection polygons.
Primary inputs are the segment ADT’s for segments that cross the intersection polygon
boundaries.
Calculate Intersection Polygon Accident Rates. Primary inputs are the intersection
ADT’s and the total number of accidents at the ALIS nodes contained within the
polygons.
Segment Accident Rate Calculations
Intersection Accident Rate Statistics Summary. The tool outputs a report ready table.
“Supersegment” Accident Rate Statistics Summary. The tool outputs a report ready table
that summarizes ALIS segment statistics generally from intersection to intersection or
“supersegments”. Figure 4 illustrates how supersegments are mapped.
“Supersection” Accident Rate Statistics Summary. The tool outputs a report ready table
that summarizes ALIS segment statistics into more significant and meaningful roadway
sections that would be the subject of P.I.L. studies or “supersections”. Figure 5 illustrates
how supersections are mapped.
Training and documentation in the use of the database and the above tools were also provided to
MCDOT by the consultant.

Monroe County Accident Rate Database GIS Conversion UPWP #6231 Executive Summary December 2012
3
Program Applications
The project has enabled MCDOT to resume getting current collision information from the State.
Furthermore, the use of a GIS platform has enabled the following capabilities in a visual
mapping format:
Where collisions are occurring by link and by node.
Safety trends over time.
Traffic volumes by location.
Filtering, sorting, and categorizing capabilities to produce special purpose maps.
Ability to combine data with other information sources relevant to traffic safety features.
An example of a program output is shown in Figure 6. The ratio of the three year accident rate
to the critical rate illustrates the overall performance of each intersection relative to others.
While we do not use this measure to select our Priority Investigation Locations (these are chosen
primarily by individual year performance, as well as the overall trend), this is an example of a
new way to view the data that can help in doing comparisons and visualizing the big picture.
Conclusions
The Monroe County Accident Rate Database GIS conversion project has successfully migrated
the existing accident location and accident rate database into a GIS based network that is
compliant with the State’s ALIS system. This has allowed the County to resume receiving
current collision information as well as providing the other attributes necessary to continue the
monitoring and tracking of safety trends through programs such as the High Accident Location
Program (HALP). The new GIS platform and the tools provided by this project allow MCDOT
to not only stay current but to also better view and display the data. In addition, as more traffic
feature location data is converted into GIS format, the outputs from this project will allow the
use of the data for safety performance comparison purposes.

4
Figure 1 Overall Task Flow Process

Crash Locations 2009-2011 (from NYSDOT) Figure 2
ALIS Segments *Attributes for multi-node
intersections are consolidated in the polygon feature class
Figure 3
MCDOT Intersection Polygons*
ALIS Nodes
ALIS and MCDOT Feature Classes
Small Circles Represent One Collision At The Indicated Location,
Color Coded By Year

[Type text]
ALIS Nodes
Figure 4 ALIS segments are combined into “Super Segments” to make for a more understandable
breakdown of the roadway accident rate analysis
Figure 5 Segments are further combined into “Super Sections” to make their accident rate analysis more significant for study
Links further combined into longer “Super
Sections”
Links combined into “Super Segments”, generally between
intersections
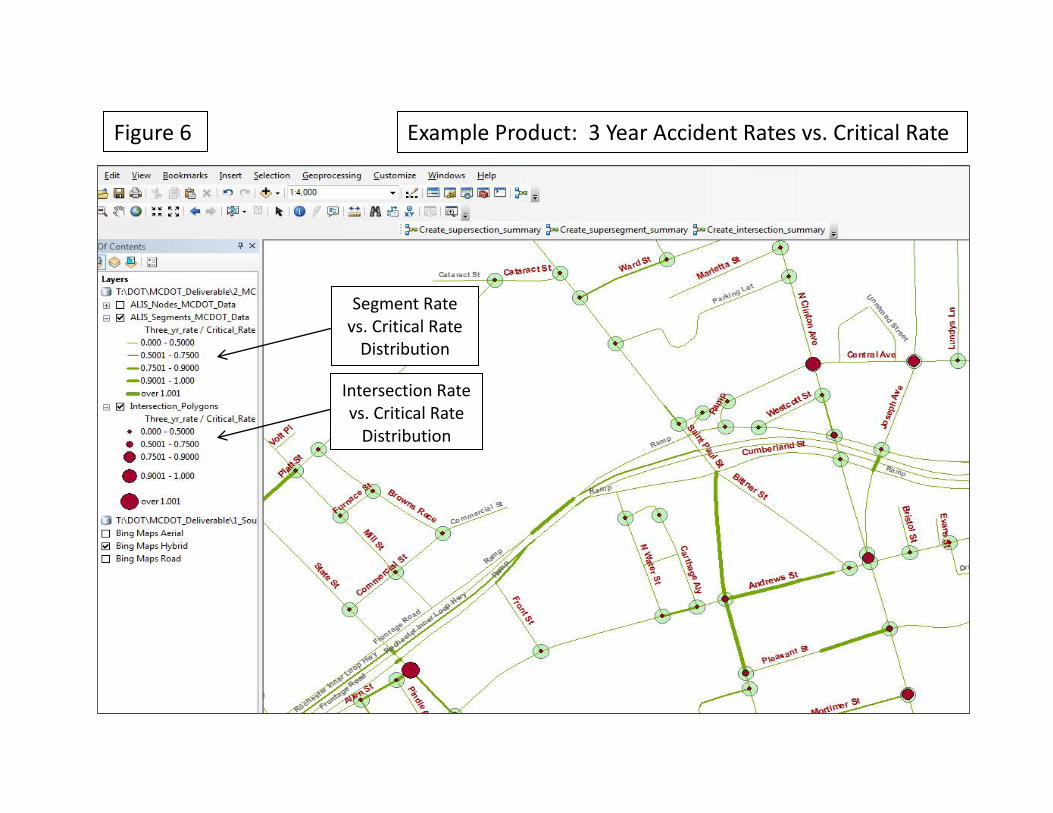
Figure 6 Example Product: 3 Year Accident Rates vs. Critical Rate
Segment Rate vs. Critical Rate
Distribution
Intersection Rate vs. Critical Rate
Distribution