monitoring xylem hydraulic pressure in woody plants - bio … · the dynamic changes in xylem sap...
TRANSCRIPT
www.bio-protocol.org/e2580 Vol 7, Iss 20, Oct 20, 2017 DOI:10.21769/BioProtoc.2580
Copyright © 2017 The Authors; exclusive licensee Bio-protocol LLC. 1
Monitoring Xylem Hydraulic Pressure in Woody Plants
Guillaume Charrier1, 2, 3, 4, *, Régis Burlett2, Gregory Gambetta1, Sylvain Delzon2,
Jean-Christophe Domec3 and François Beaujard4
1Bordeaux Sciences Agro, Institut des Sciences de la Vigne et du Vin, Ecophysiologie et Génomique
Fonctionnelle de la Vigne, UMR 1287, Villenave d’Ornon, France; 2BIOGECO, INRA, Univ. Bordeaux,
Cestas, France; 3Bordeaux Sciences Agro, UMR 1391 ISPA, INRA, 1 Cours du General de Gaulle,
Gradignan Cedex, France; 4PIAF, INRA, UCA, Clermont-Ferrand, France
*For correspondence: [email protected]
[Abstract] Xylem sap circulates under either positive or negative hydraulic pressure in plants. Negative
hydraulic pressure (i.e., tension) is the most common situation when transpiration is high, and several
devices have been developed to quantify it accurately (e.g., Scholander pressure chamber,
psychrometers). However, a proper measurement of positive xylem sap pressures may be critical when
pressure is generated by the root system, allowing vessels to be refilled. Here, we describe two
different methods to monitor positive xylem bulk pressure: the pressure gauge which can only be set
onto a rootstock or a side branch and the point pressure sensor, which can allow measurements from a
functioning plant without detopping or cutting. Keywords: Pressure, Tension, Water status, Xylem water potential
[Background] Although plants can recover from critical levels of xylem embolism, < 50% loss of
hydraulic conductivity in conifers (Brodribb and Cochard, 2009) and < 88% in angiosperms (Urli et al.,
2013), the exact mechanism is still under debate. The ascent of sap is driven by the evaporative
demand from the atmosphere, which generates a negative pressure (i.e., tension) in the water column
and hydrogen bonds between molecules (i.e., cohesion) pull the sap through the plant via the well
accepted cohesion-tension theory (Dixon, 1896; Angeles et al., 2004). However, positive xylem sap
pressure can be recorded under particular conditions, for example water-saturated soil combined with
very low transpiration. This mechanism has been shown to refill embolized vessels in springtime
(Sperry et al., 1994) and in species that experienced freeze-thaw induced embolism (Charrier et al.,
2013 and 2014). Refilling of embolized vessels has been hypothesized to occur under both positive and
negative xylem sap pressures in Laurus sp or Vitis sp, for example (Salleo et al., 1996). However, the
‘refilling under tension’ mechanism is inconsistent with the cohesion-tension theory (Zwieniecki and
Holbrook, 2000). Moreover, recent works suggest that refilling occurs only under positive pressure in
Vitis (Charrier et al., 2016). The dynamic changes in xylem sap pressure therefore need to be explored
at both the seasonal and diurnal scale while maintaining as much as possible the integrity of the
hydraulic architecture of the plant.
Although the use of stem psychrometers has been extensively described since the 80’s (e.g., Dixon
and Tyree, 1984; Tyree and Dixon, 1986), the measurement of positive xylem sap pressure is relatively

www.bio-protocol.org/e2580 Vol 7, Iss 20, Oct 20, 2017 DOI:10.21769/BioProtoc.2580
Copyright © 2017 The Authors; exclusive licensee Bio-protocol LLC. 2
rare. The protocol described here allows the quantification of the spatio-temporal pattern of bulk xylem
sap water potential under positive pressures, and even moderate tensions (maximum of 0.05 MPa)
along the water column using non-invasive sensors (i.e., point pressure sensors).
Materials and Reagents
1. Parafilm M (Bemis, catalog number: PM996)
2. Stainless-steel hypodermic needle 21 G 1 ½” (Terumo Medical, catalog number: 8AN2138R1)
3. Union–1/16” PEEK (Interchim, catalog number: 869290)
4. Lock ring (Ark-Plas Products, catalog number: LEX66-PP0)
5. Threaded male Luer connector 10-32 UNF (Ark-Plas Products, catalog number: LGX74-PP0)
6. Reinforced PVC flexible tubes (RS Components, catalog number: 440-874)
7. Zip ties e.g., RS Pro Black Nylon Non-Releasable Cable Tie, 300 x 4.8 mm (RS Components,
catalog number: 233-487)
8. 4-way Luer Lock Stopcock, Male-Male-Female (Cole-Parmer, catalog number: EW-30600-04)
9. Stainless steel high quality single edge blades (e.g., Mure & Peyrot, catalog number: 144.3)
10. Nylon Hose clips (RS Components, catalog number: 291-587)
11. Cutting disk (RS Components, catalog number: 448-7439)
12. HSS Drill bit, 0.8 mm diameter (e.g., RS Components, catalog number: 457-651)
Note: Most parts are available from the laboratory equipment suppliers.
Equipment
1. High resolution datalogger (e.g., Campbell Scientific, model: CR1000)
2. Pressure transducer 30Psi (Honeywell International, catalog number: 26PCDFA6D)
3. Stabilized power supply 12V DC (e.g., Traco Power, catalog number: TML 20212C)
4. Hand-held driller
Procedure
Directly attaching a pressure sensor at the distal end of a cut stem (i.e., pressure gauge) allows
quantitative measurement of the pressure however at the cost of removing the upper part of the
plant. Another approach, less interfering but still invasive (i.e., point pressure sensor), is to connect
the pressure sensor to the xylem via a stainless steel hypodermic needle (Clearwater et al., 2007;
Thitithanakul, 2012, see Figure 1). The latter allows plant functions (e.g., transpiration) to continue
and pressure to be recorded at different heights along the water column. Xylem sap pressure is
measured by a pressure transducer connected to a datalogger that records the output signal
(positive or negative). The connection between the sensor and the xylem has to be perfectly sealed
using Parafilm in order to accurately estimate the pressure.

www.bio-protocol.org/e2580 Vol 7, Iss 20, Oct 20, 2017 DOI:10.21769/BioProtoc.2580
Copyright © 2017 The Authors; exclusive licensee Bio-protocol LLC. 3
Figure 1. Distal part of a grapevine plant (Vitis vinifera cv. Grenache) showing examples of the three distinct instruments. From bottom to top, stem psychrometer PSY-1, point
pressure sensor and pressure gauge.
1. Preparation of the sensor (Figure 2)
Wrap the threaded end (10-32 UNF) of the pressure transducer (#1 Figure 2) and the male
Luer connector (#3 Figure 2) with Parafilm and screw up at both ends of the union 1/16” piece
(#2 Figure 2). Place the Luer lock (#4 Figure 2) onto the male Luer connector. Fill the sensor
with deionized degassed water to remove all air bubbles.
Figure 2. Different parts and assembly of the sensors. Pressure transducer (1), union 1/16”
piece (2), male Luer connector (3) and Luer lock (4), point pressure sensor (5) and pressure
gauge (6).
www.bio-protocol.org/e2580 Vol 7, Iss 20, Oct 20, 2017 DOI:10.21769/BioProtoc.2580
Copyright © 2017 The Authors; exclusive licensee Bio-protocol LLC. 4
a. Pressure gauge (#6 Figure 2)
Connect a 3 cm-long piece of adapter tubing to the 4-way Stopcock. Wrap the region of
interest of the distal end of the stem with Parafilm, cut the stem 2-3 times under water with
a sharp blade. Remove bark and cambium over 1 cm using the blade and immediately
insert the cut end into the adapter tubing, tighten with a collar. Fill the whole system up with
deionized and degassed water to remove all air bubbles using a syringe.
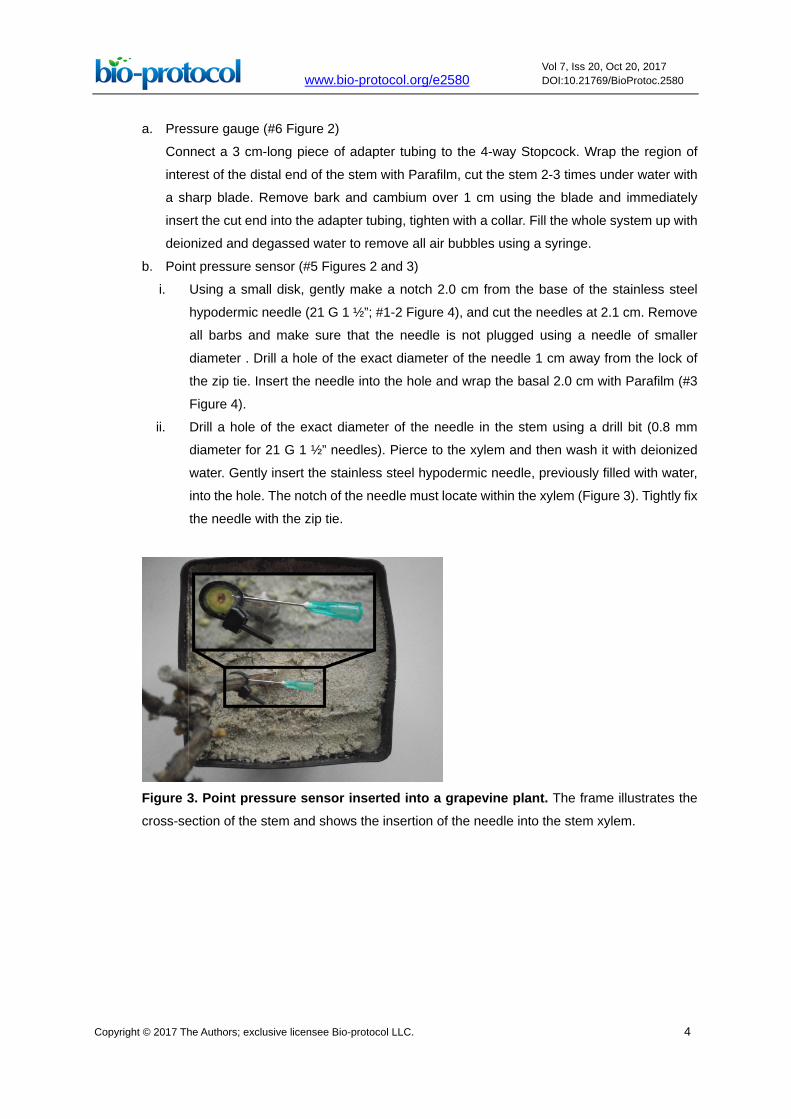
b. Point pressure sensor (#5 Figures 2 and 3)
i. Using a small disk, gently make a notch 2.0 cm from the base of the stainless steel
hypodermic needle (21 G 1 ½”; #1-2 Figure 4), and cut the needles at 2.1 cm. Remove
all barbs and make sure that the needle is not plugged using a needle of smaller
diameter . Drill a hole of the exact diameter of the needle 1 cm away from the lock of
the zip tie. Insert the needle into the hole and wrap the basal 2.0 cm with Parafilm (#3
Figure 4).
ii. Drill a hole of the exact diameter of the needle in the stem using a drill bit (0.8 mm
diameter for 21 G 1 ½” needles). Pierce to the xylem and then wash it with deionized
water. Gently insert the stainless steel hypodermic needle, previously filled with water,
into the hole. The notch of the needle must locate within the xylem (Figure 3). Tightly fix
the needle with the zip tie.
Figure 3. Point pressure sensor inserted into a grapevine plant. The frame illustrates the
cross-section of the stem and shows the insertion of the needle into the stem xylem.

www.bio-protocol.org/e2580 Vol 7, Iss 20, Oct 20, 2017 DOI:10.21769/BioProtoc.2580
Copyright © 2017 The Authors; exclusive licensee Bio-protocol LLC. 5
Figure 4. Preparation of the needle used for the point pressure sensor. The stainless steel
hypodermic needle (1) is cut and notched (2). The needle is inserted into the zip tie and
wrapped with Parafilm (3).
2. Connection of the sensor (Figure 5)
Fill both pressure sensor and inserted needle with deionized degassed water (#1 Figure 5),
and screw them together (#2 Figure 5). Connect the pressure transducer to the datalogger,
with stabilized 10 or 12 V (D.C) input voltage.
Figure 5. Connection of the point pressure sensor. Once the inserted needle is filled with
deionized and degassed water (1), the sensor is screwed onto the needle (2, 3).
Data analysis
1. Each pressure transducer has a slight offset from atmospheric pressure. It is therefore
recommended to measure the output signal (the offset U0) for a short period of time (e.g., >
5-10 measurements by the datalogger) before any measurement (calibration or connecting the
pressure transducer to the xylem of a plant).
2. Calibration can be performed using a pressure gauge to measure the output signal along the
normal operating range of the sensor (e.g., 30 Psi [ca. 0.2 MPa] for 26PCFFA6D sensors;
Figure 6). The output tension (Uout) depends on the input tension (Uin) and the calibration
coefficient of the sensor. It therefore should be normalized if Uin is not stable along the
experiment (e.g., battery supply over a long period).

www.bio-protocol.org/e2580 Vol 7, Iss 20, Oct 20, 2017 DOI:10.21769/BioProtoc.2580
Copyright © 2017 The Authors; exclusive licensee Bio-protocol LLC. 6
Figure 6. Calibration of the sensor. Pressure depending on the recorded tension Uout, with
constant input tension (Uin = 12V).
3. The pressure is therefore equal to:
𝑃𝑃 = 𝛼𝛼 ∙ 𝑘𝑘 ∙ (𝑈𝑈𝑜𝑜𝑜𝑜𝑜𝑜 − 𝑈𝑈0)
where, P is the pressure in kPa, Uout is the output signal in mV, U0 is the offset in mV, k the
calibration coefficient of the sensor in kPa mV-1 and α, the ratio between Ucal (the input tension
during calibration) and Uin.
4. Correcting the effect of temperature on the output signal.
Uout is affected by the temperature resulting in 3.5 kPa variation in apparent pressure over the
10-20 °C range in both a closed sensor (orange line Figure 7) and a sensor connected to an
excised plant i.e., detached from the root system (green line Figure 7).
The change in apparent pressure depending on the temperature is used to correct the
apparent pressure (Figure 8): sensor connected to the excised plant (𝑈𝑈0 = 0.530 ∙ 𝜃𝜃 − 9.60) or
closed sensor (𝑈𝑈0 = 0.482 ∙ 𝜃𝜃 − 11.12).
However, the discrepancy between apparent and corrected pressure is relatively small
compared to the pressure generated by the plant (50 kPa or more in intact plant, vs. ca. 3.5
kPa in control sensors, in this example).

www.bio-protocol.org/e2580 Vol 7, Iss 20, Oct 20, 2017 DOI:10.21769/BioProtoc.2580
Copyright © 2017 The Authors; exclusive licensee Bio-protocol LLC. 7
Figure 7. Variation in temperature (+ 20/10 °C; dotted black line) and the effect on the recorded signal from a pressure sensor alone (orange line) or inserted in a cut grapevine plant (without root system, green line). The change in the apparent pressure (ca.
0.35 kPa °C-1) has to be taken into account in data analysis. The solid black line represents the
apparent pressure recorded in an intact grapevine and red and brown lines the corrected
pressure according to the correction using sensor alone or inserted in a cut plant, respectively.
Figure 8. Apparent pressure depending on air temperature in a closed pressure sensor (orange dots) or inserted in a cut grapevine plant (without root system, green dots)
Acknowledgments
This study has been carried out with financial support from the Cluster of Excellence COTE
(ANR-10-LABX-45, within Water Stress project), and AgreenSkills Fellowship program, which has
received funding from the EU’s Seventh Framework Program under grant agreement FP7 No.
26719 (AgreenSkills contract 688).

www.bio-protocol.org/e2580 Vol 7, Iss 20, Oct 20, 2017 DOI:10.21769/BioProtoc.2580
Copyright © 2017 The Authors; exclusive licensee Bio-protocol LLC. 8
References
1. Angeles, G., Bond, B., Boyer, J. S., Brodribb, T., Brooks, J. R., Burns, M. J., Cavender-Bares,
J., Clearwater, M., Cochard, H., Comstock, J., Davis, S. D., Domec, J., Donovan, L., Ewers, F.,
Gartner, B., Hacke, U., Hinckley, T., Holbrook, N. M., Jones, H. J., Kavanagh, K., Law, B.,
López-Portillo, J., Lovisolo, C., Martin, T., Martínez-Vilalta, J., Mayr, S., Meinzer, F. C., Melcher,
P., Mencuccini, M., Mulkey, S., Nardini, A., Neufeld, H. S., Passioura, J., Pockman, W. T., Pratt,
R. B., Rambal, S., Richter, H., Sack, L., Salleo, S., Schubert, A., Schulte, P., Sparks, J. P.,
Sperry, J., Teskey, R. and Tyree, M. (2004). The cohesion-tension theory. New Phytologist
163(3): 451-452. 2. Brodribb, T. J. and Cochard, H. (2009). Hydraulic failure defines the recovery and point of
death in water-stressed conifers. Plant Physiol 149(1): 575-584. 3. Charrier, G., Charra-Vaskou, K., Kasuga, J., Cochard, H., Mayr, S. and Ameglio, T. (2014).
Freeze-thaw stress: effects of temperature on hydraulic conductivity and ultrasonic activity in
ten woody angiosperms. Plant Physiol 164(2): 992-998. 4. Charrier, G., Cochard, H. and Ameglio, T. (2013). Evaluation of the impact of frost resistances
on potential altitudinal limit of trees. Tree Physiol 33(9): 891-902. 5. Charrier, G., Torres-Ruiz, J. M., Badel, E., Burlett, R., Choat, B., Cochard, H., Delmas, C. E.,
Domec, J. C., Jansen, S., King, A., Lenoir, N., Martin-StPaul, N., Gambetta, G. A. and Delzon,
S. (2016). Evidence for hydraulic vulnerability segmentation and lack of xylem refilling under
tension. Plant Physiol 172(3): 1657-1668. 6. Clearwater, M. J., Blattmann, P., Luo, Z. and Lowe, R. G. (2007). Control of scion vigour by
kiwifruit rootstocks is correlated with spring root pressure phenology. J Exp Bot 58(7):
1741-1751. 7. Dixon, H. H. (1896). On the osmotic pressure in the cells of leaves. Proceedings of the Royal
Irish Academy (1889-1901) 4: 61-73.
8. Dixon, M. A. and Tyree, M. T. (1984). A new stem hygrometer, corrected for temperature
gradients and calibrated against the pressure bomb. Plant Cell Environ 7(9): 693-697.
9. Salleo, S., Gullo M. A. L., Paoli, D. and Zippo, M. (1996). Xylem recovery from
cavitation-induced embolism in young plants of Laurus nobilis: a possible mechanism. New
Phytologist 132: 47-56.
10. Sperry, J. S., Nichols, K. L., Sullivan, J. E. and Eastlack, S. E. (1994). Xylem embolism in
ring-porous, diffuse-porous, and coniferous trees of northern Utah and interior Alaska. Ecology
75(6): 1736-1752.
11. Thitithanakul, S. (2012). Effect of nitrogen supply before bud break on early development of the
young hybrid poplar. PhD thesis. Universite Blaise Pascal, Clermont-Ferrand II.
12. Tyree, M. T. and Dixon, M. A. (1986). Water stress induced cavitation and embolism in some
woody plants. Physiol Plantarum 66(3): 397-405.

www.bio-protocol.org/e2580 Vol 7, Iss 20, Oct 20, 2017 DOI:10.21769/BioProtoc.2580
Copyright © 2017 The Authors; exclusive licensee Bio-protocol LLC. 9
13. Urli, M., Porte, A. J., Cochard, H., Guengant, Y., Burlett, R. and Delzon, S. (2013). Xylem
embolism threshold for catastrophic hydraulic failure in angiosperm trees. Tree Physiol 33(7):
672-683.
14. Zwieniecki, M. A. and Holbrook, N. M. (2000). Bordered pit structure and vessel wall surface
properties. Implications for embolism repair. Plant Physiol 123(3): 1015-1020.