monitoring with prometheus
TRANSCRIPT

Prometheus
By Kasper Nissen
@phennex
Monitoring with

Hi! My name is Kasper
@phennex

What am I going to cover?
@phennex
+
+
+
Monitoring - why and what?
Prometheus - an introduction
Short demo

DEMO Part 1
@phennex
https://github.com/kaspernissen/automation_night_demo

Why monitor?
@phennex
What to monitor?
@phennex
Analyzing long-term trends
@phennex
What to monitor?
@phennex
Comparing over time or experiment groups
@phennex

What to monitor?
@phennex
Alerting
@phennex

What to monitor?
@phennex
Building dashboards
@phennex
@phennex
Conducting ad hoc retrospective analysis
@phennex

@phennex
Purpose:
What is broken? and why?

What to monitor?
@phennex

What to monitor?
@phennex
HostsCPU, Memory, I/O, Network, Filesystem
@phennex

What to monitor?
@phennex
ContainersCPU, Memory, I/O, Restarts, Throttling
@phennex

What to monitor?
@phennex
ApplicationsThroughput, Latency
@phennex

The Four Golden Signals
@phennex
Site Reliability Engineering - How Google Runs Production Systems

What to monitor?
@phennex
LatencyThe time it takes to service a request. Important to distinguish between the latency of successful and failed requests.
@phennex
What to monitor?
@phennex
TrafficA measure of how much demand is being placed on your system, measured in a high-level system-specific metric.
@phennex

What to monitor?
@phennex
ErrorsThe rate of requests that fail, either explicitly (e.g. HTTP 500s), implicitly (HTTP 200 success with wrong content)
@phennex
What to monitor?
@phennex
SaturationHow “full” your service is. A measure of your system fraction, emphasizing the resources that are most constrained (e.g. in a memory-constrained system, show memory)
@phennex

Prometheus
@phennex
What to monitor?
@phennex
PrometheusPrometheus was presented to be the protector and benefactor of mankind.
@phennex
Prometheus
@phennex
+
+
+
+
Heavily inspired by Borgmon
Built by ex-Googlers at SoundCloud
Pull-based (scrapes at regular intervals)
Many integration possibilities
The 2nd project in CNCF

What is Prometheus?
@phennex
+
+
+
+
+
+
Monitoring system and Timeseries Database
Instrumentation
Metrics collection and storage
Querying
Alerting
Dashboard / Graphing / Trending
Source: https://promcon.io/2016-berlin/talks/prometheus-design-and-philosophy/
Prometheus focus on
@phennex
+
+
Operational systems monitoring
Dynamic cloud environments
Source: https://promcon.io/2016-berlin/talks/prometheus-design-and-philosophy/

Prometheus does not do
@phennex
+
+
+
+
+
+
Raw log / event collection (use ELK stack)
Request tracing (use opentracing.io)
“Magic” anomaly detection
Durable long-term storage
Automatic horizontal scaling
User / auth management
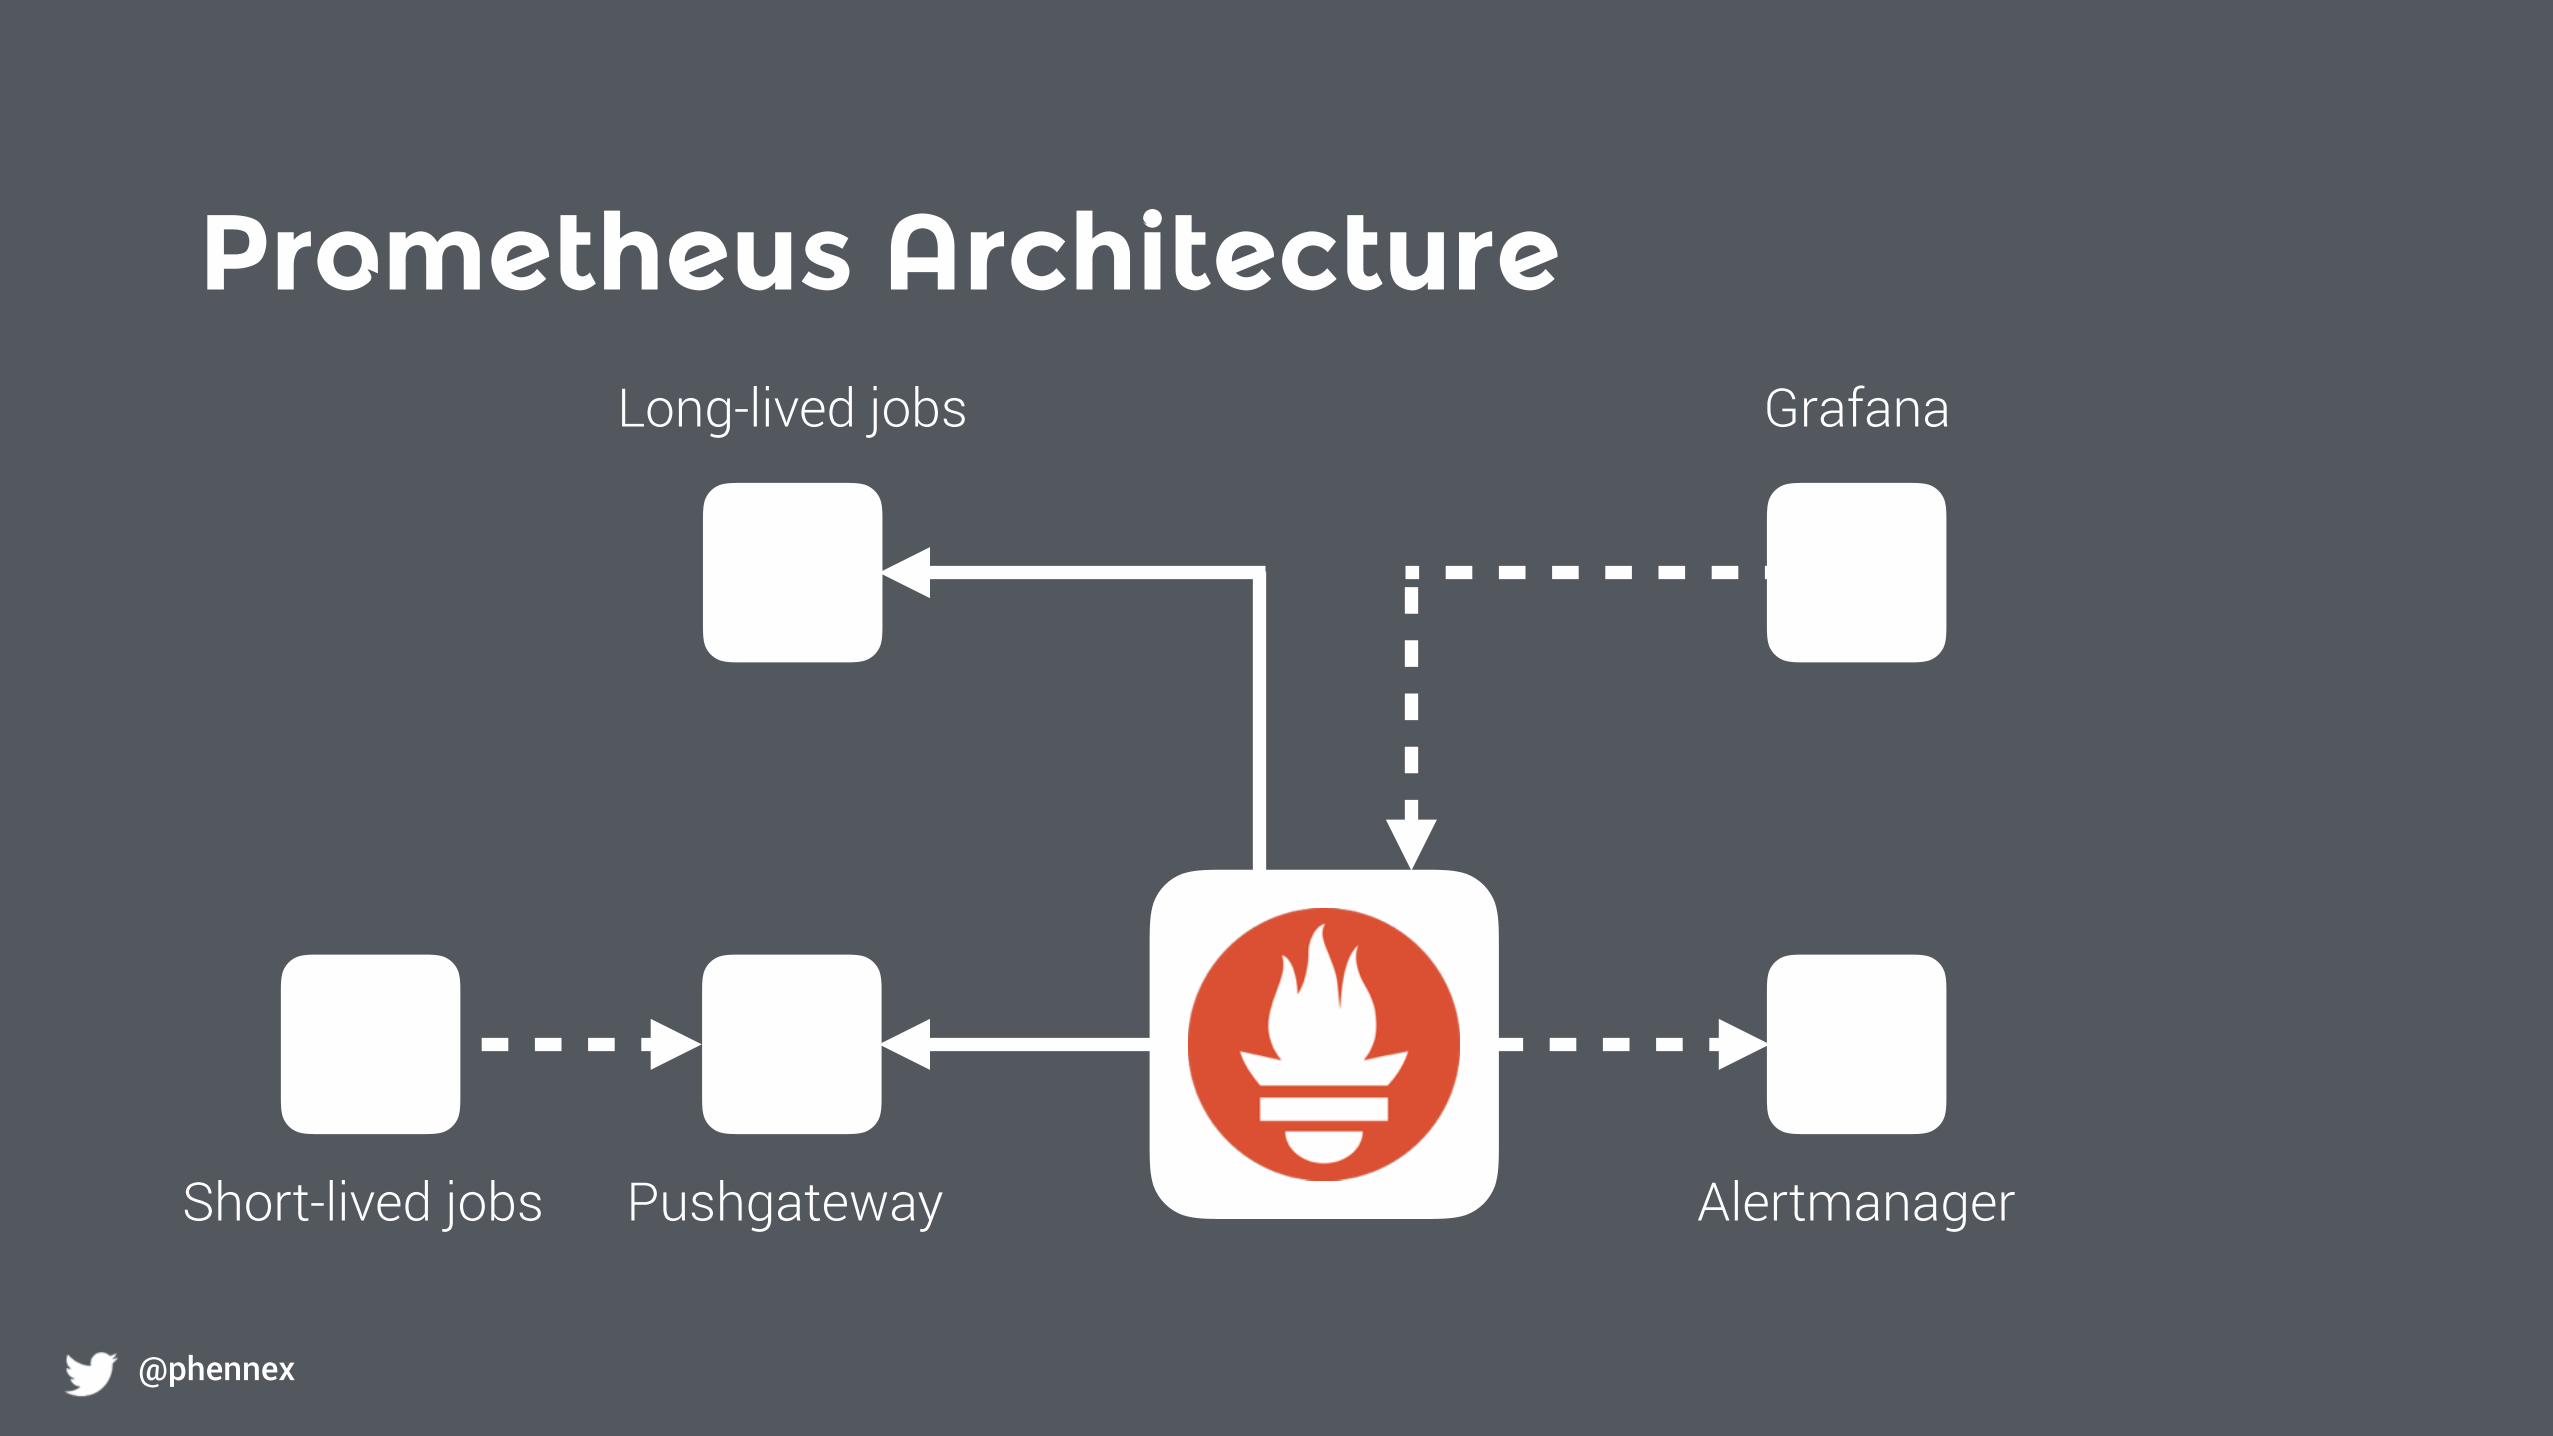
Prometheus Architecture
@phennex
Long-lived jobs
Pushgateway Alertmanager Short-lived jobs
Grafana

The Data model
@phennex
<metric name>{<label name>=<label value>, …}
api_http_requests_total{method="POST", handler="/messages"}
Notation:
Example:
Every time series is uniquely identified by its metric name and a set of key-value pairs, also known as labels.

How to get metrics?
@phennex
Directly instrumented
Not Directly instrumented
Exporter
Source: https://promcon.io/2016-berlin/talks/so-you-want-to-write-an-exporter/

@phennex

Directly instrumented software
@phennex
cAdvisor Doorman
Etcd Kubernetes-Mesos
Kubernetes RobustIRC
SkyDNS Weave Flux
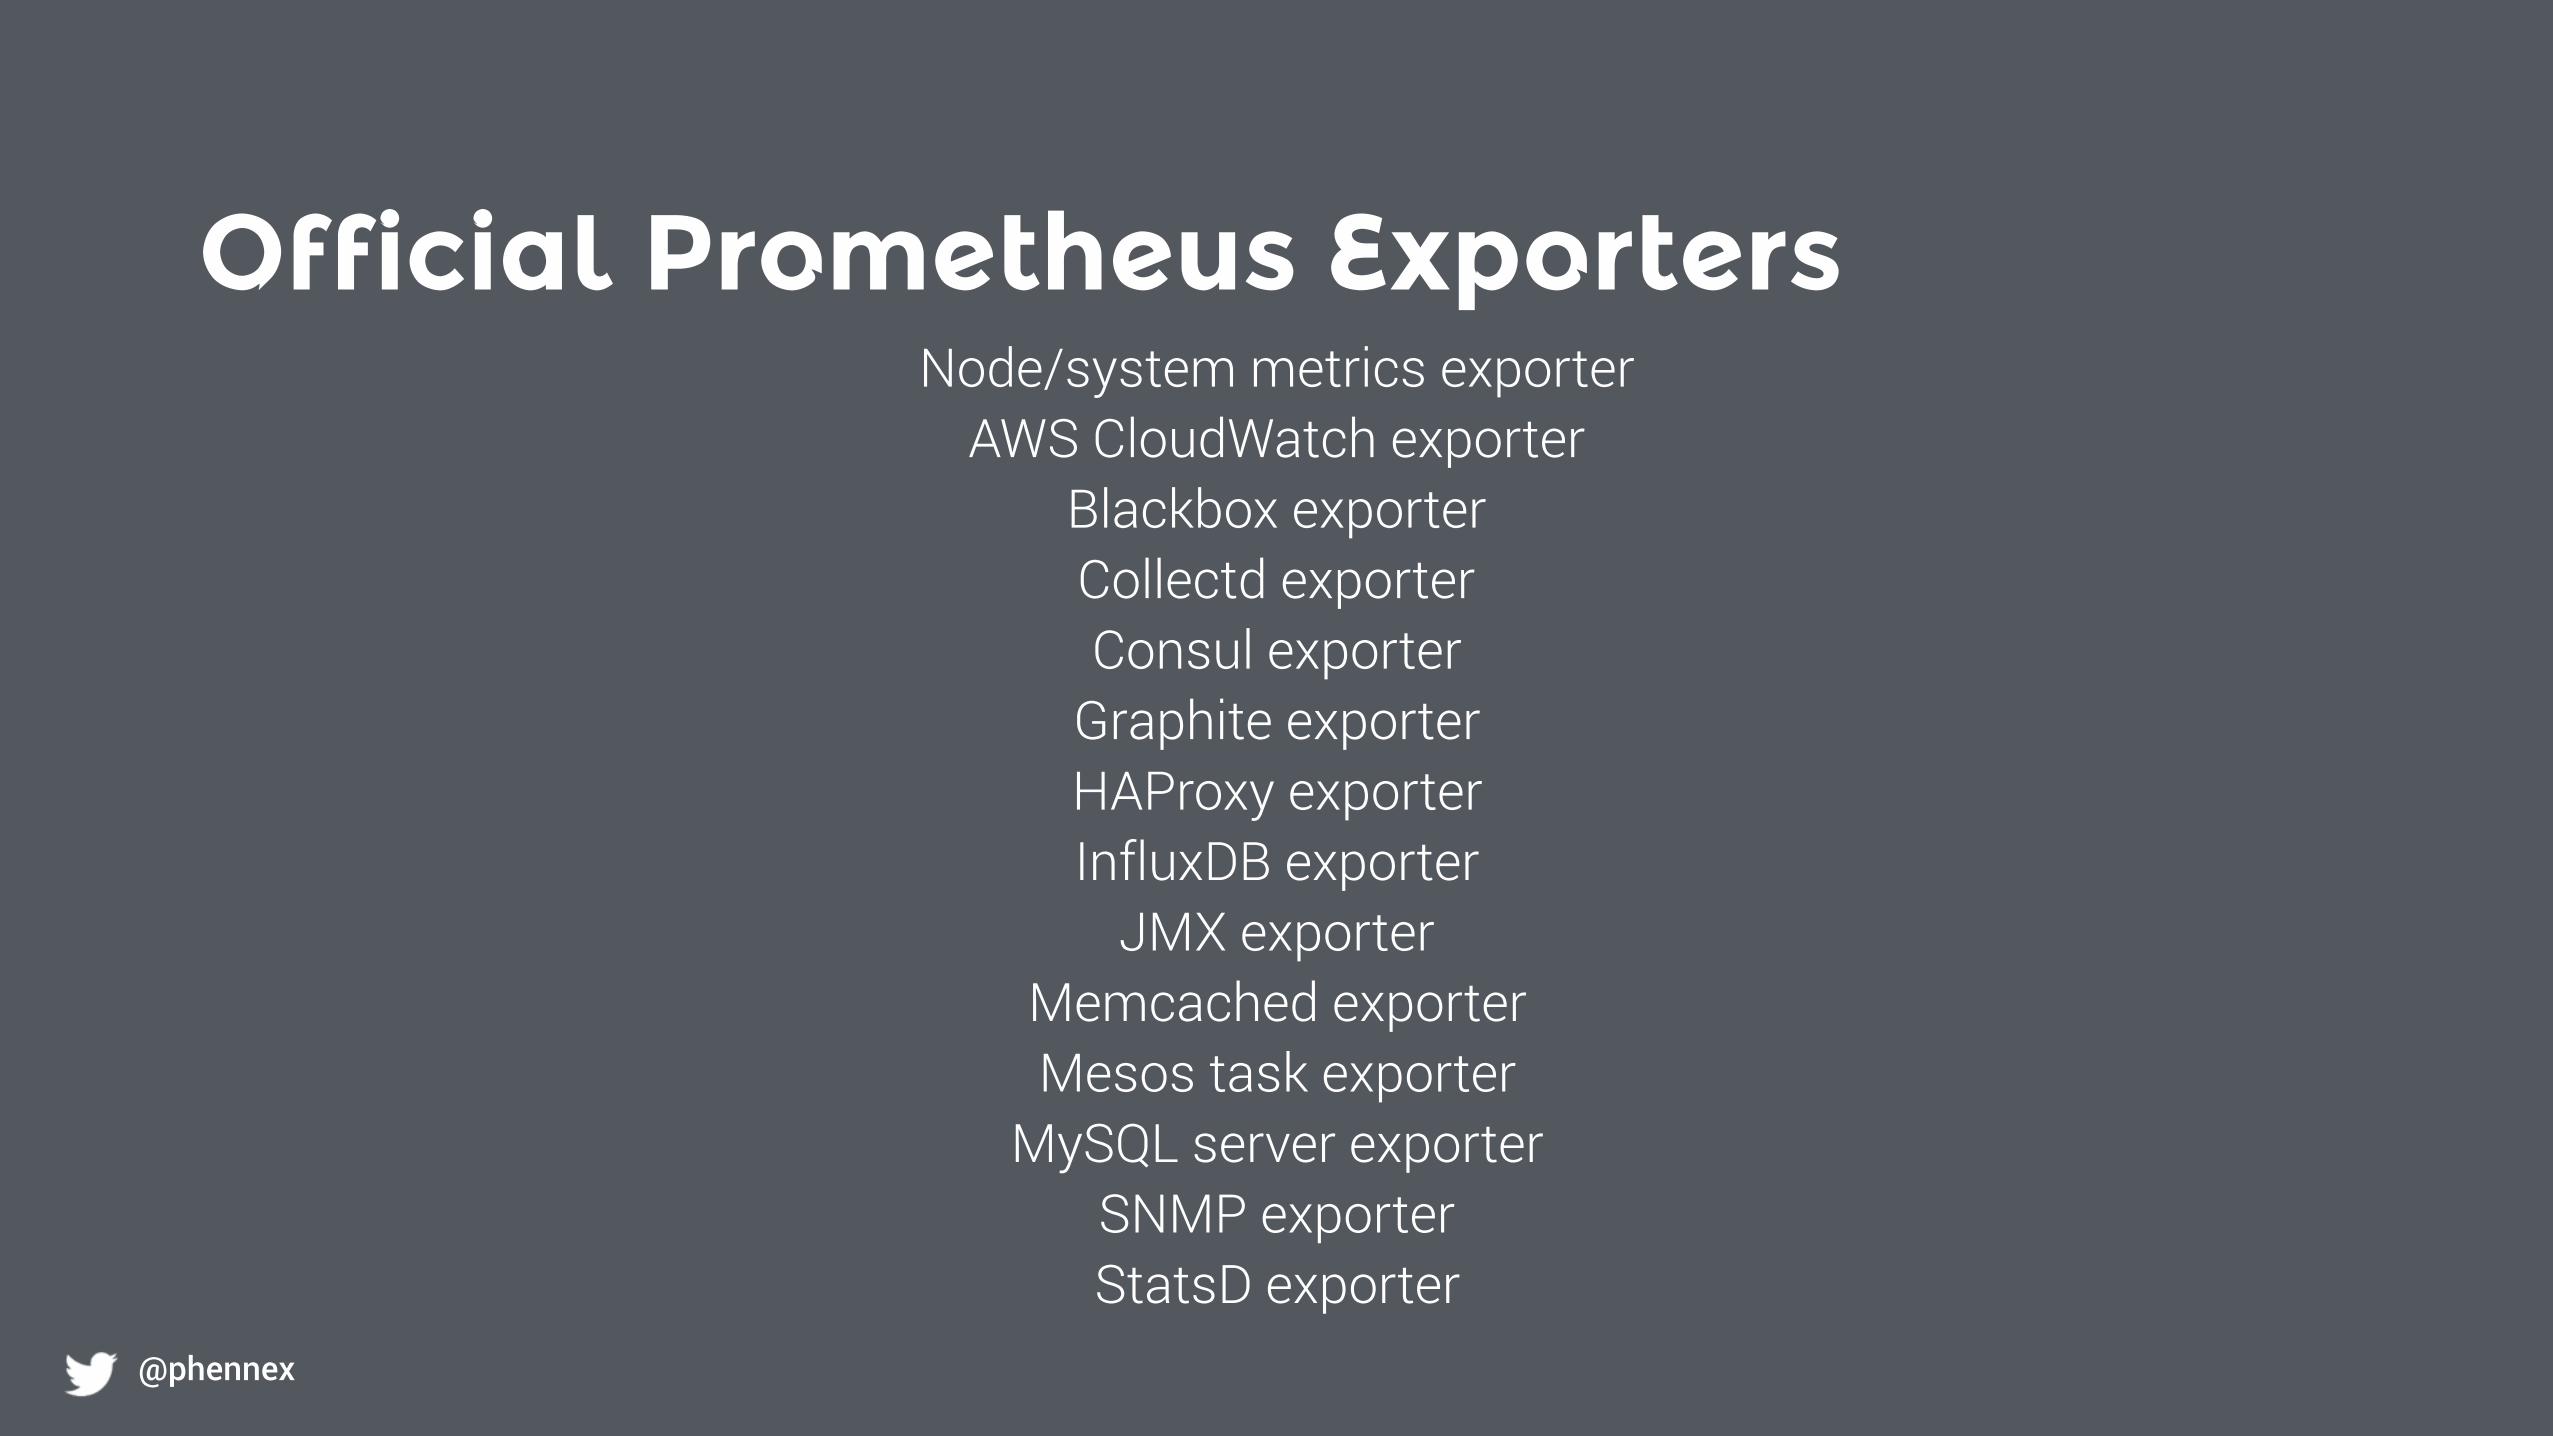
Official Prometheus Exporters
@phennex
Node/system metrics exporter AWS CloudWatch exporter
Blackbox exporter Collectd exporter Consul exporter
Graphite exporter HAProxy exporter InfluxDB exporter
JMX exporter Memcached exporter Mesos task exporter
MySQL server exporter SNMP exporter StatsD exporter

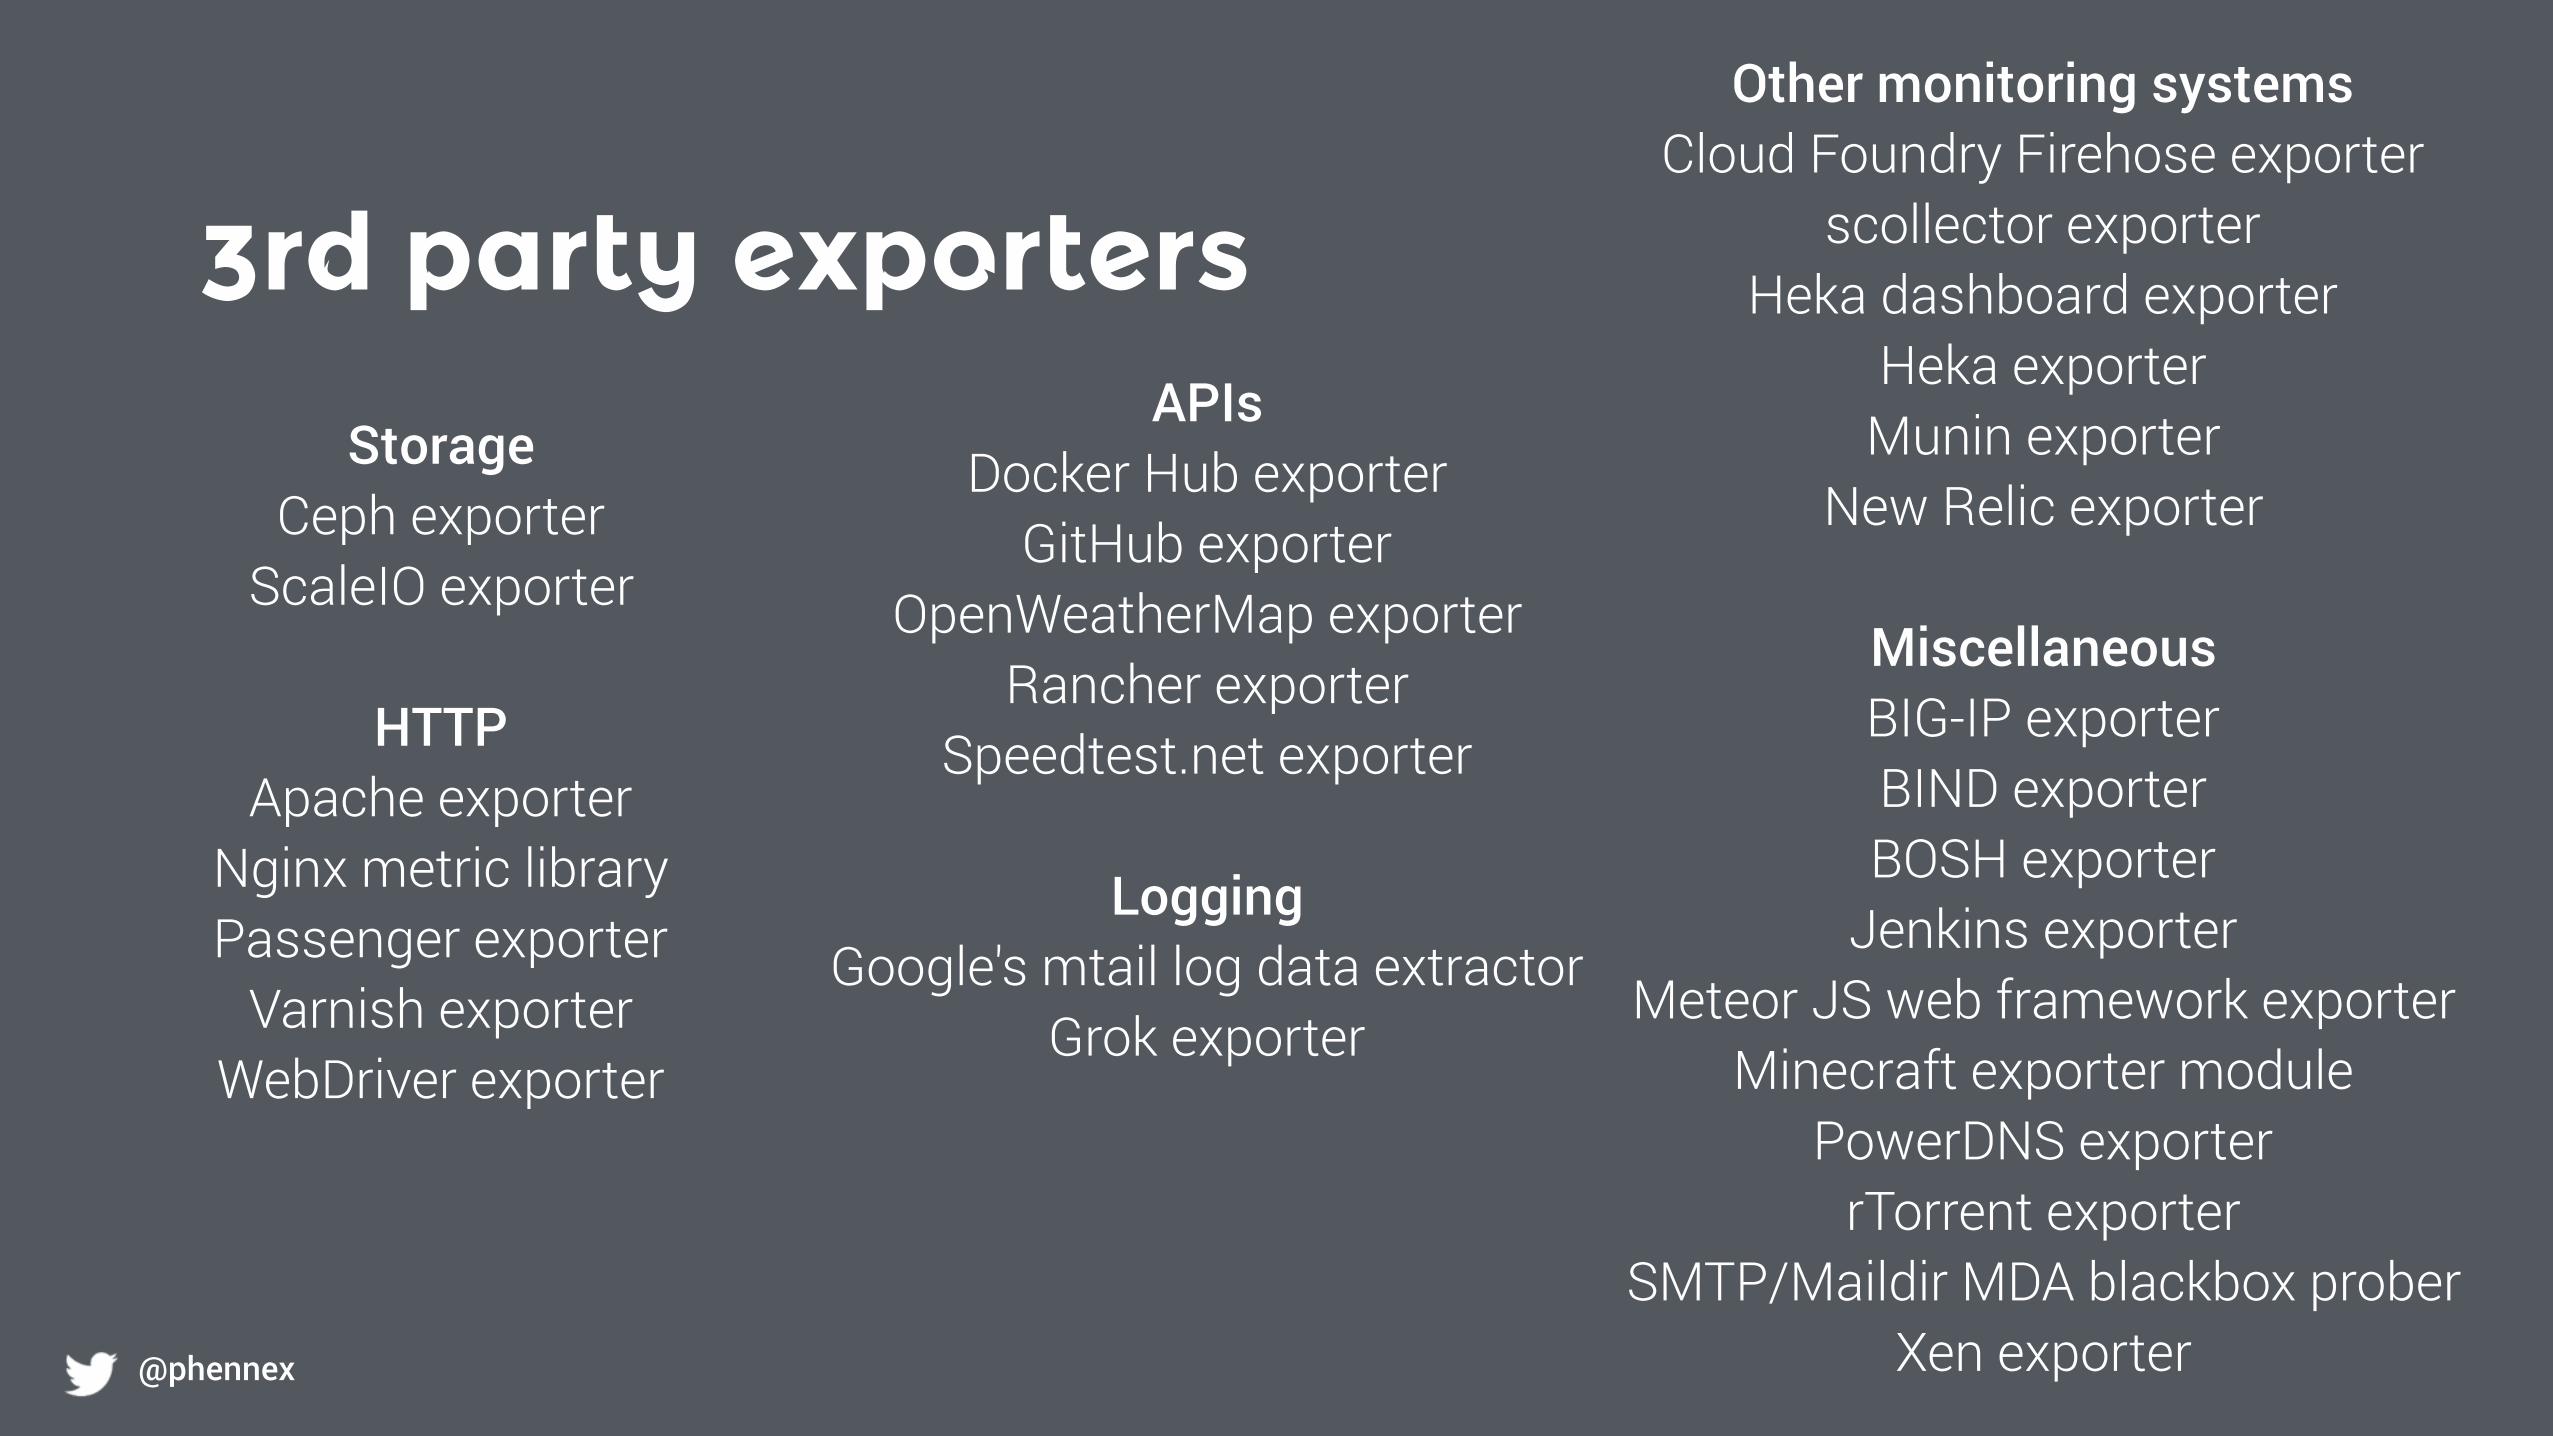
3rd party exporters
@phennex
Databases Aerospike exporter
ClickHouse exporter CouchDB exporter MongoDB exporter
PgBouncer exporter PostgreSQL exporter ProxySQL exporter
Redis exporter RethinkDB exporter
SQL query result set metrics exporter
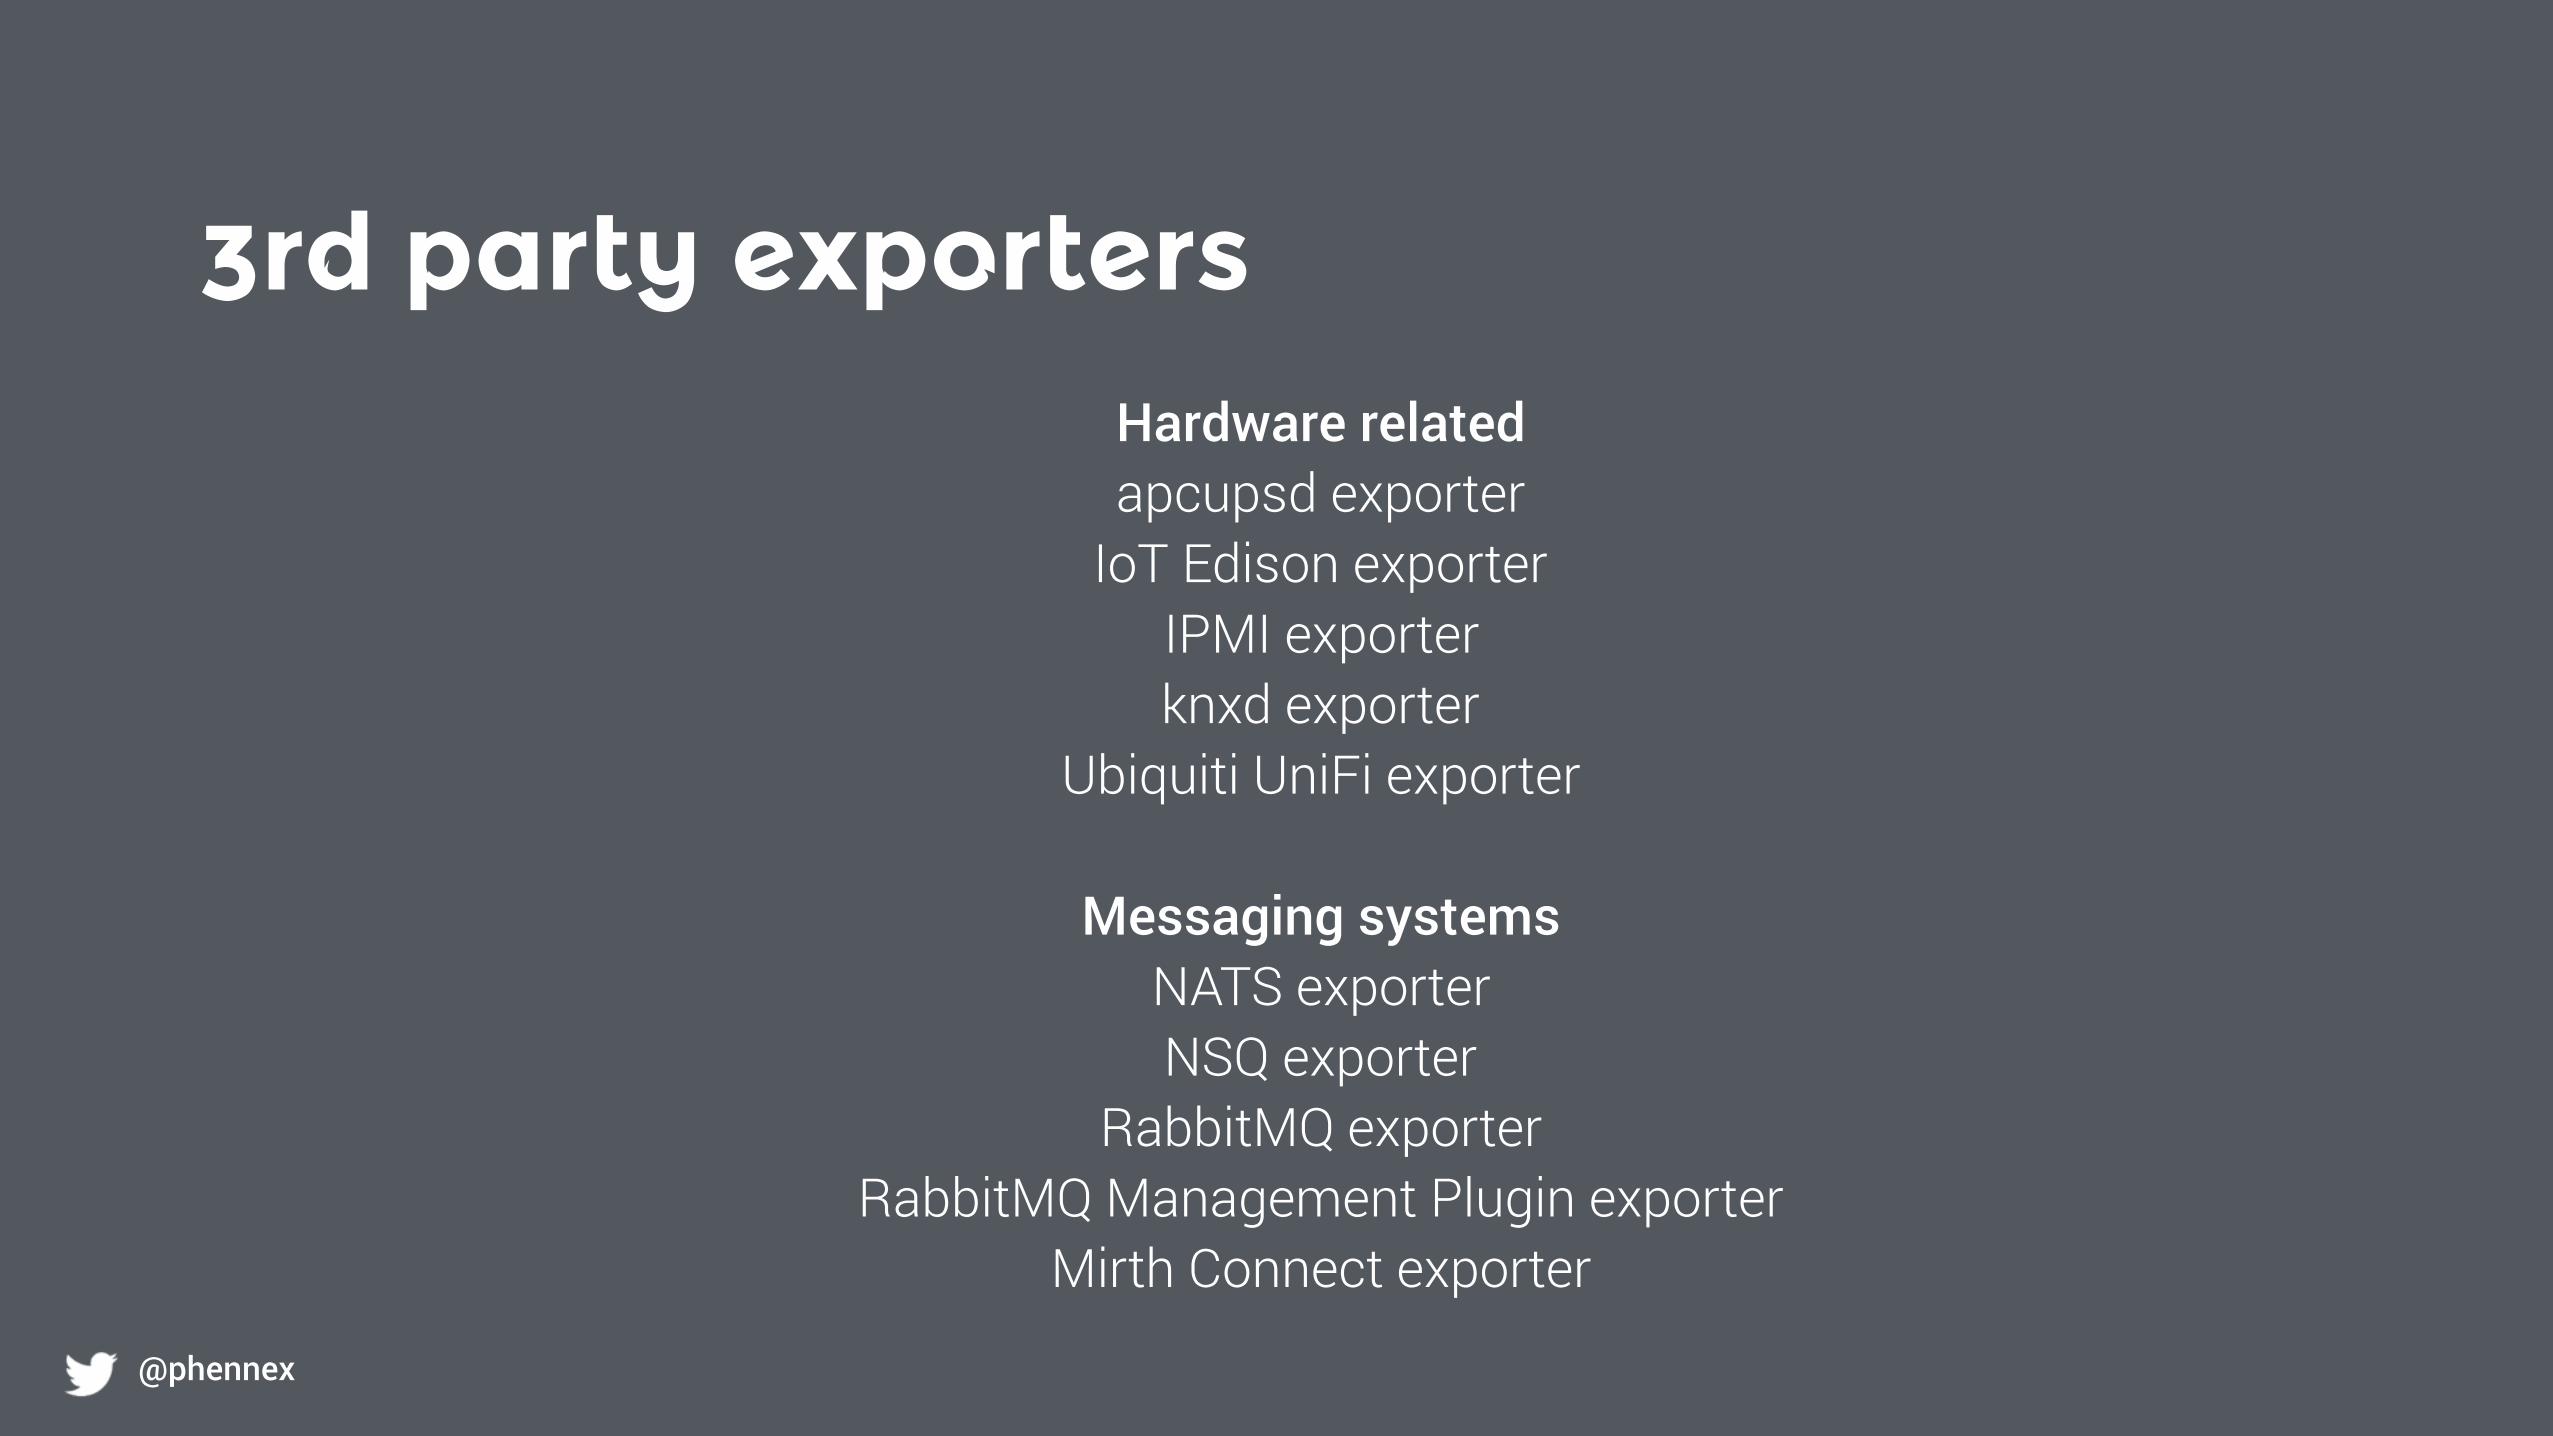
3rd party exporters
@phennex
Hardware related apcupsd exporter
IoT Edison exporter IPMI exporter knxd exporter
Ubiquiti UniFi exporter
Messaging systems NATS exporter NSQ exporter
RabbitMQ exporter RabbitMQ Management Plugin exporter
Mirth Connect exporter
3rd party exporters
@phennex
Storage Ceph exporter
ScaleIO exporter
HTTP Apache exporter
Nginx metric library Passenger exporter
Varnish exporter WebDriver exporter
APIs Docker Hub exporter
GitHub exporter OpenWeatherMap exporter
Rancher exporter Speedtest.net exporter
Logging Google's mtail log data extractor
Grok exporter
Other monitoring systems Cloud Foundry Firehose exporter
scollector exporter Heka dashboard exporter
Heka exporter Munin exporter
New Relic exporter
Miscellaneous BIG-IP exporter BIND exporter BOSH exporter
Jenkins exporter Meteor JS web framework exporter
Minecraft exporter module PowerDNS exporter
rTorrent exporter SMTP/Maildir MDA blackbox prober
Xen exporter
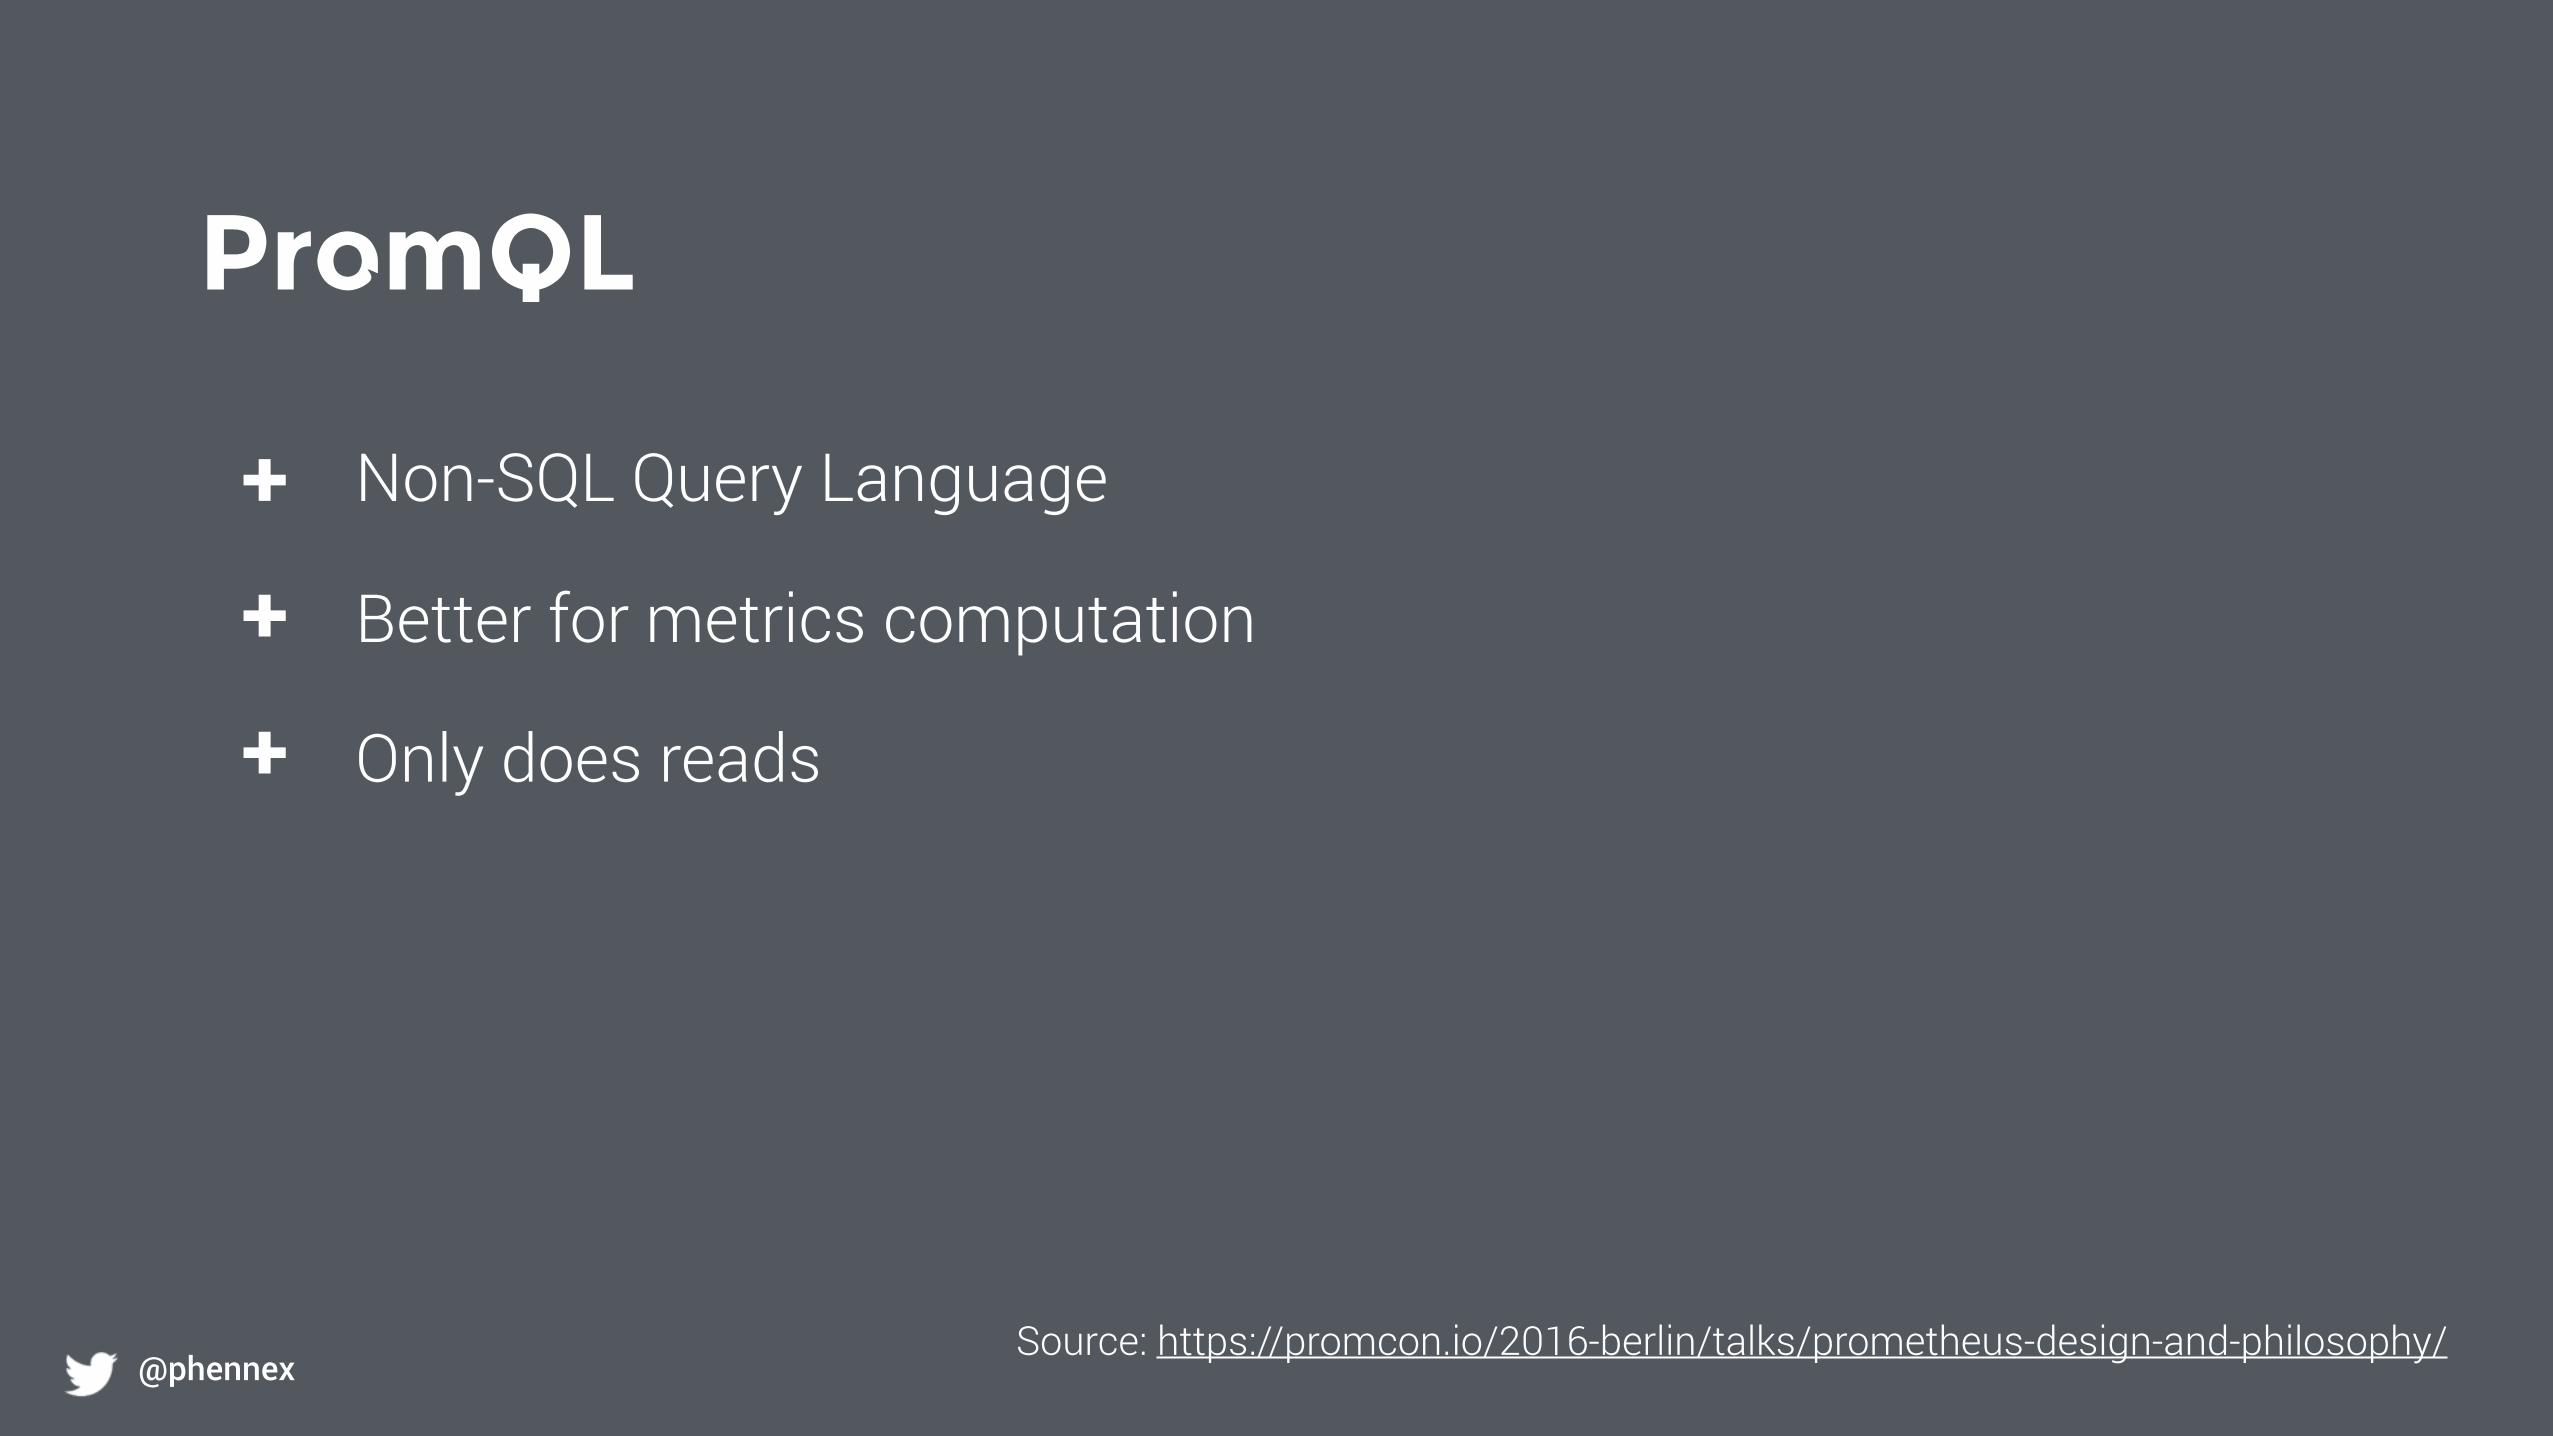
PromQL
@phennex
+
+
+
Non-SQL Query Language
Better for metrics computation
Only does reads
Source: https://promcon.io/2016-berlin/talks/prometheus-design-and-philosophy/

PromQL - Operators
@phennex
+ (addition) == (equal)- (substraction) != (not-equal)* (multiplication) > (greater-than)/ (division) < (less-than)% (modulo) >= (greater-or-equal)^ (exponentiation) <= (less-or-equal)and (intersection) or (union)unless (complement)
… and vector matching Source: https://prometheus.io

PromQL - Aggregation Operators
@phennex
sum stddev bottomk
min stdvar topk
max count quantile
avg count_values
Source: https://prometheus.io

PromQL - Examples
@phennex
rate(api_http_requests_total[5m])
errors{job=“foo”} / total{job=“foo”}
Source: https://promcon.io/2016-berlin/talks/prometheus-design-and-philosophy/

DEMO Part 2
@phennex
https://github.com/kaspernissen/automation_night_demo

Alerting
@phennex
What to monitor?
@phennex
Symptom-based alertingBe proactive
@phennex

What to monitor?
@phennex
Prevent alert fatigue- Use ticketing systems (Avoid email spam) - Warning are tasks like new features
@phennex
What to monitor?
@phennex
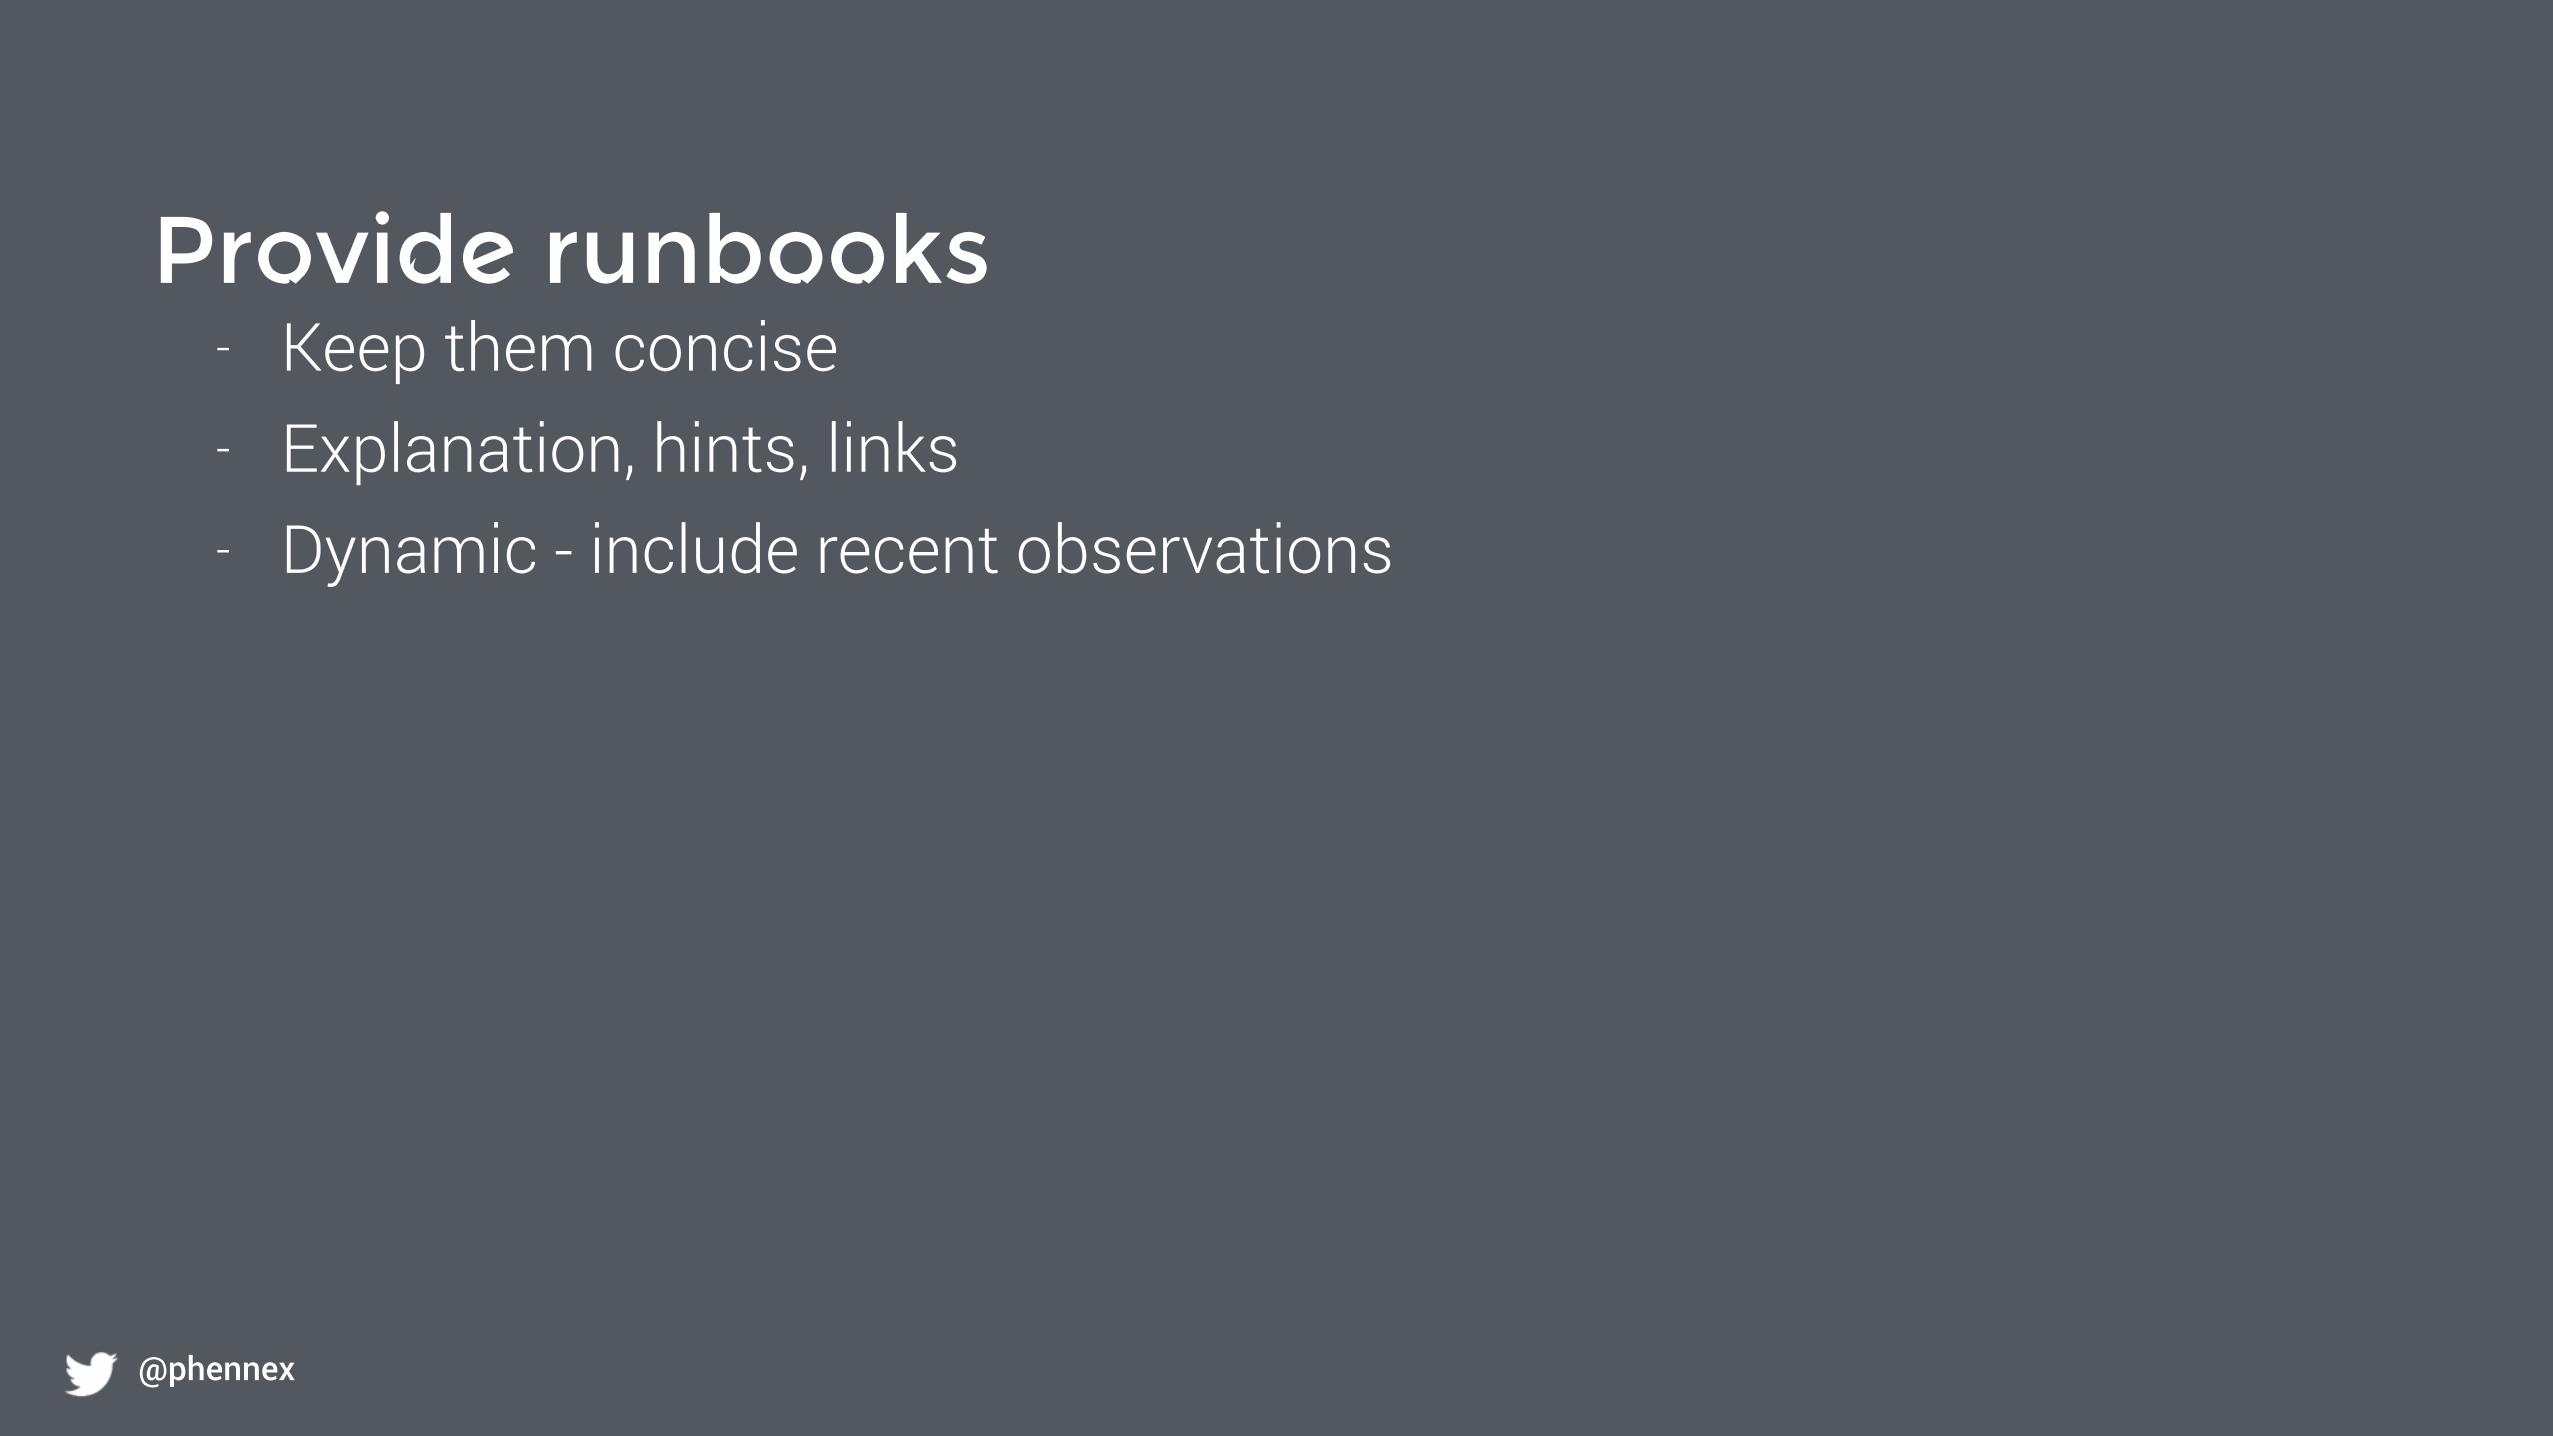
Provide runbooks- Keep them concise - Explanation, hints, links - Dynamic - include recent observations
@phennex
What to monitor?
@phennex
Practice outages“Firedrills”, “Gamedays” - repeat regularly
@phennex


@phennex
Start being proactive. Dont be firefighters.

… and remember …
@phennex
Hope is NOT a strategy
@phennexSource: Site Reliability Engineering, How Google Runs Production Systems (2016), B. Beyer et al.
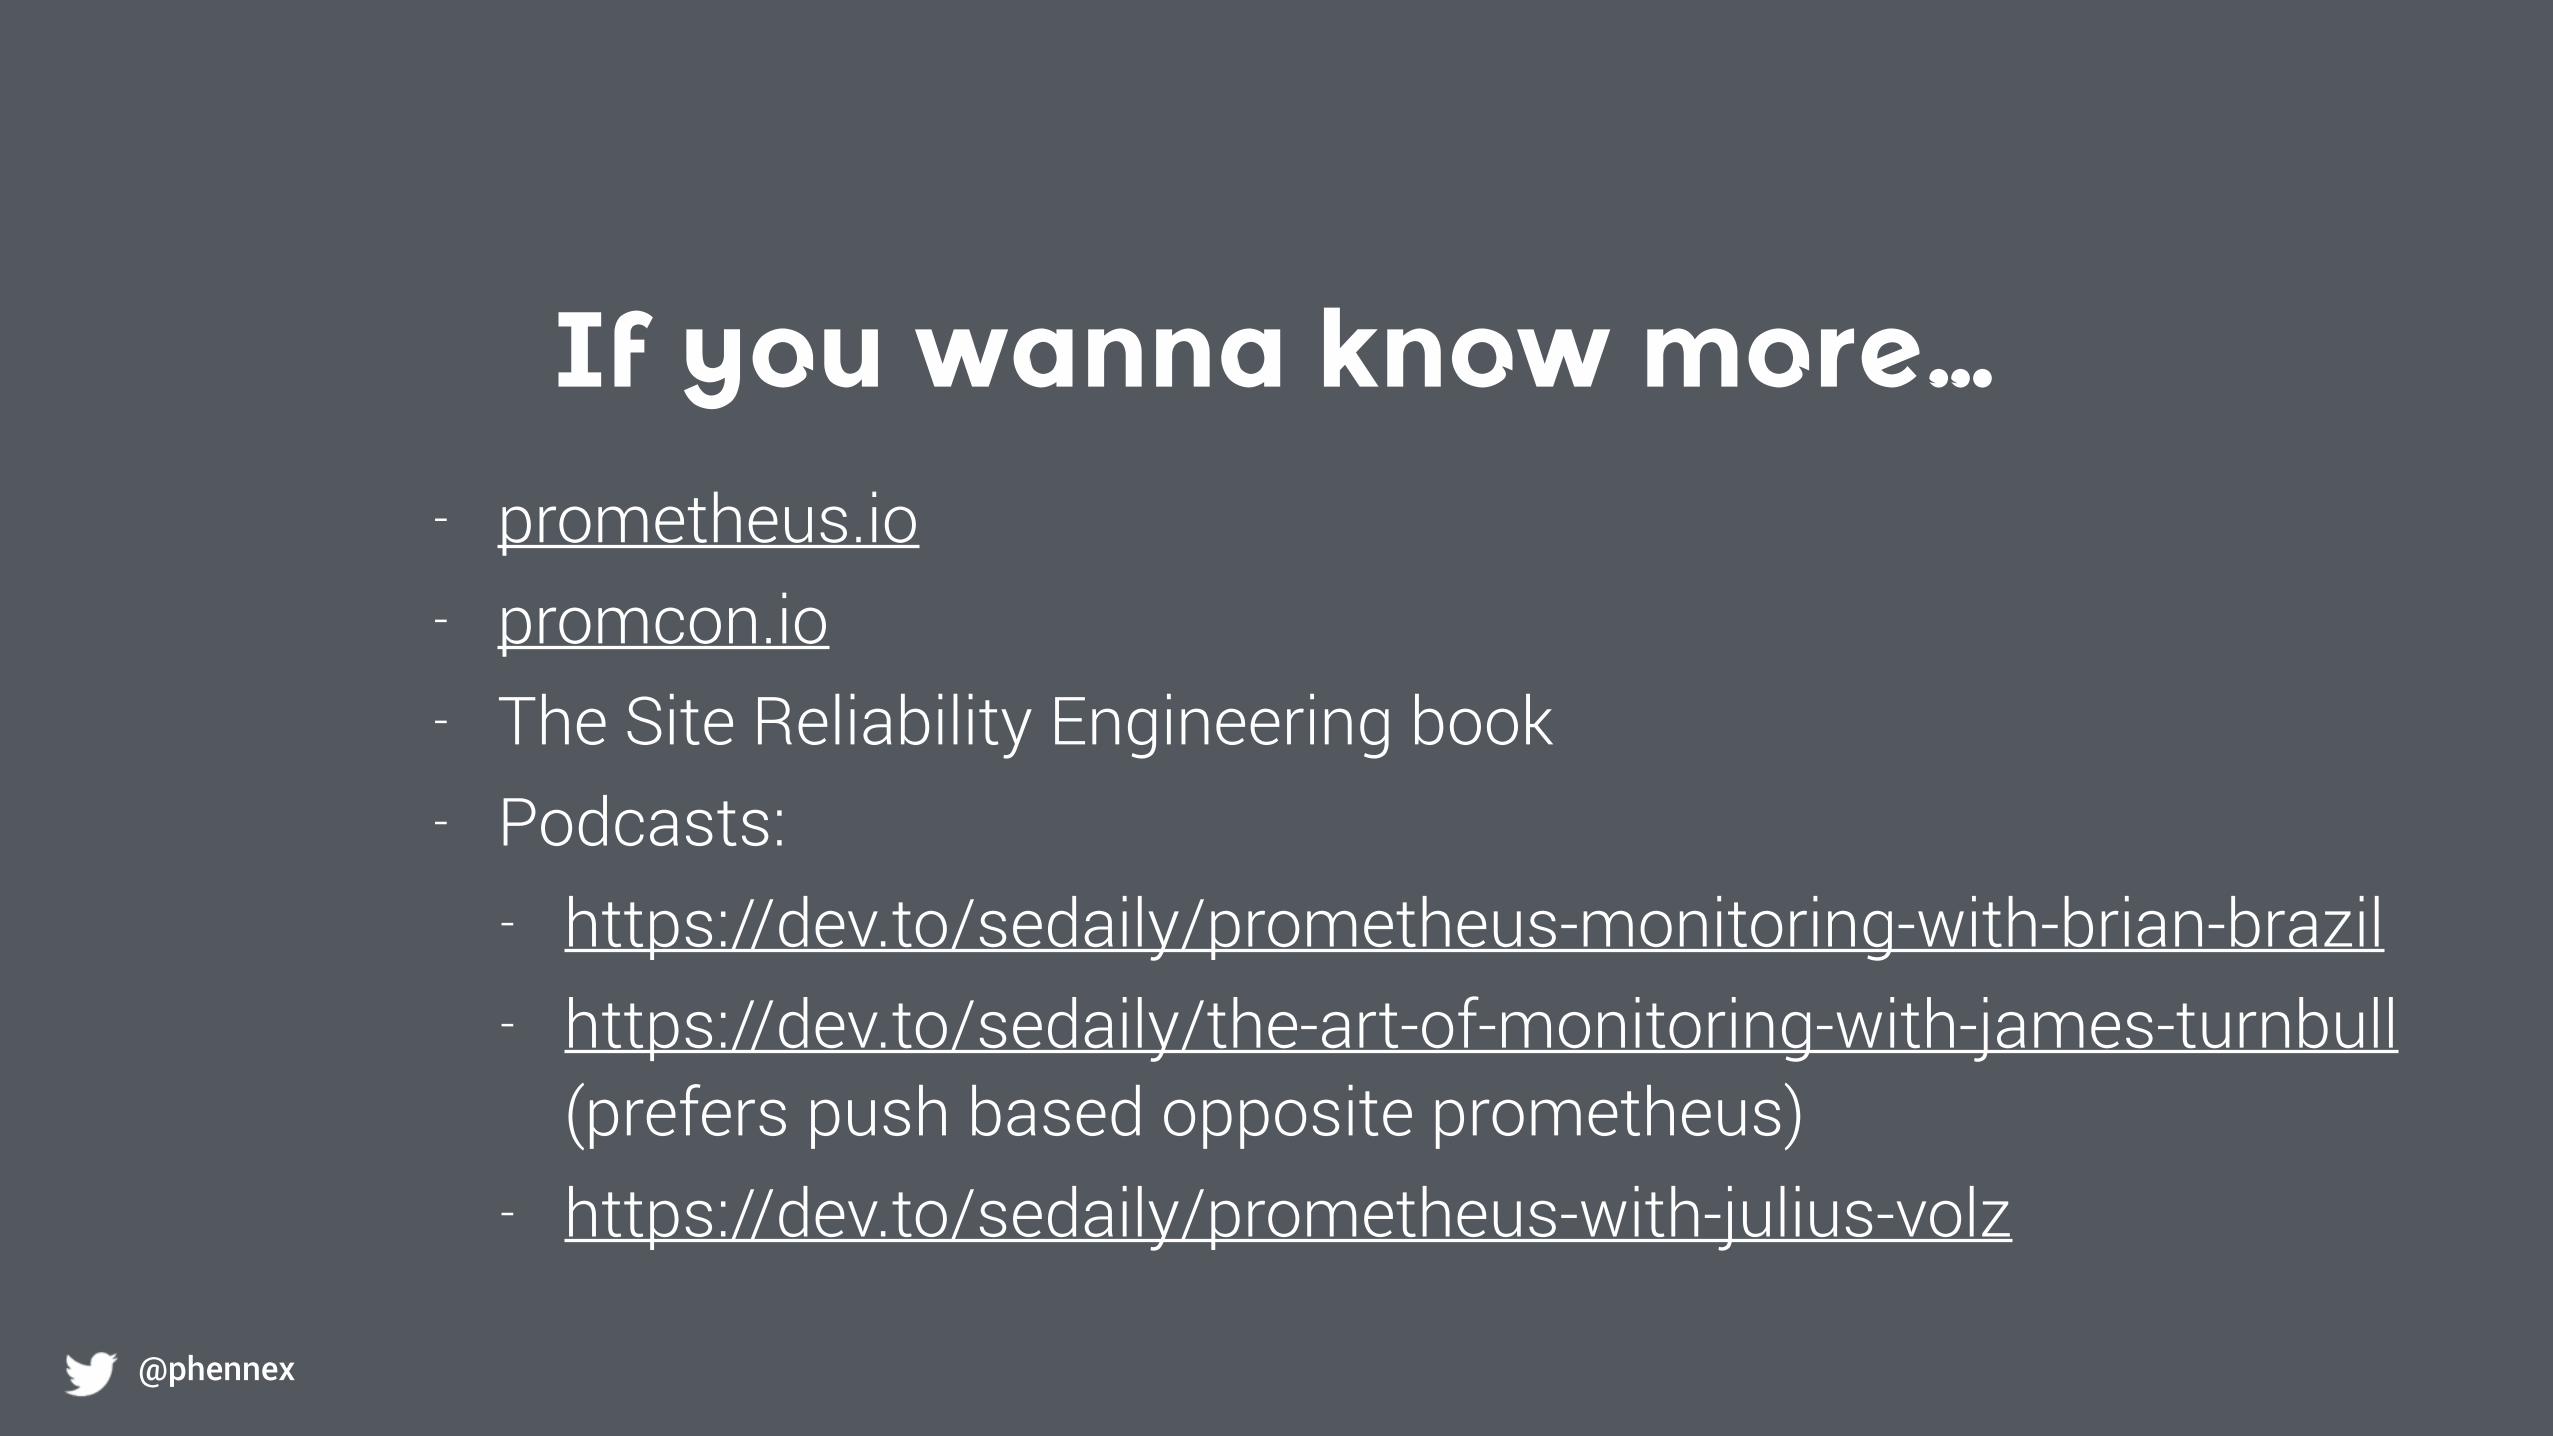
If you wanna know more…
@phennex
- prometheus.io - promcon.io - The Site Reliability Engineering book - Podcasts:
- https://dev.to/sedaily/prometheus-monitoring-with-brian-brazil - https://dev.to/sedaily/the-art-of-monitoring-with-james-turnbull
(prefers push based opposite prometheus) - https://dev.to/sedaily/prometheus-with-julius-volz