monitoring trains and track - eh-network.orgeh-network.org/events/eh2016/speakers/freeland.pdfthe...
TRANSCRIPT

EH 2016
EH Powered IoTMonitoring Trains and Track
Roy FreelandPresident – Perpetuum Ltd
Slide 1

IoT Characteristics
Sensor, Microprocessor, Transmitter
Self Powered - Energy Harvester (no batteries)
Wireless Data Transmission to Cloud Server
Information/Alarms anywhere over the internet
Mobile Platform (to make it a little more difficult)
When will see this ?
Slide 2
WARNTRAKWARNS
ENERGYMAN
INNOVATE UK EU FP7/H2020 SME INST

Live Monitoring on Trains
Axle Bearings
Wheels
Gearboxes
Traction Motors
Track
Cows

Perpetuum WSN Features
Totally Autonomous WSN (no wires or batteries)
32 WSN’s per 4 car train transmitting to 1 Data Concentrator (powered) with GPRS link to Cloud Server Vibration & Temperature Sensors
Early Identification of Failure
Wireless Communication
No Wires
Vibration Energy Harvester
No batteries
Robust design for harsh environments
Fast to fit
Trains fitted overnight
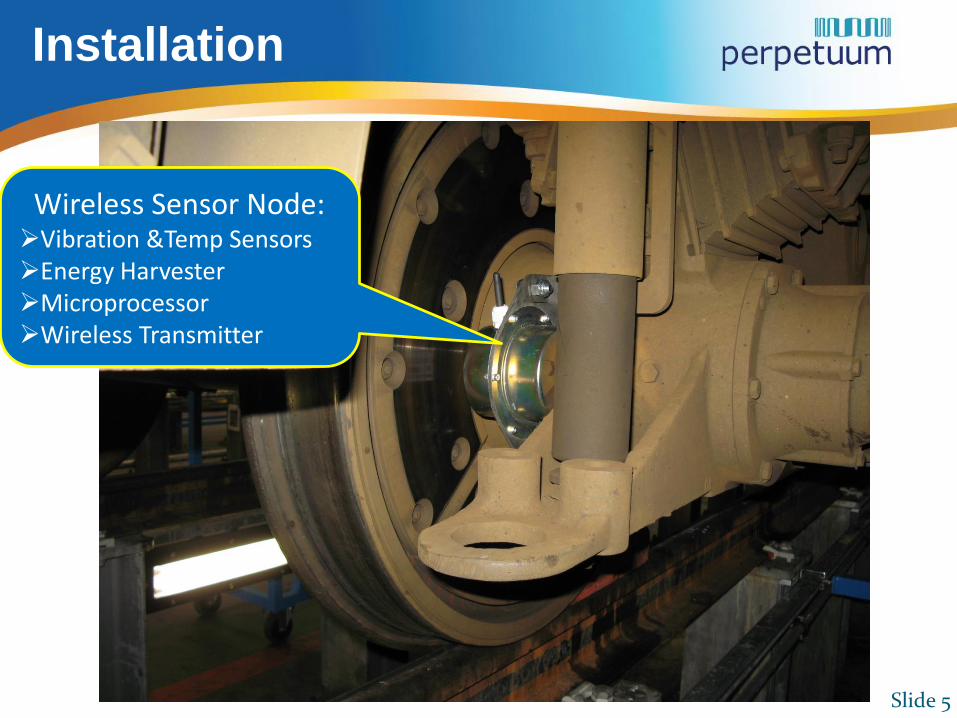
Installation
Slide 5
Wireless Sensor Node:Vibration &Temp SensorsEnergy HarvesterMicroprocessorWireless Transmitter

Wireless Sensor Node
Data Concentrator
On Train Communications
Data Download Via Cellular Network
Communications

Bearing Failure !
Slide 7

Simple to Use
Slide 8
Temperature
Raw Vibration
Data
Output:Simple numerical rating of wear:
Bearing/Wheel Health Index (BHI/WHI)
Input:Complex & noisy 3D
Vibration data
Perpetuum’sAlgorithms:
Reduce background noise,Look for Vibration
signatures of bearing & wheel damage

Vibration Data
Slide 9
Good Bearing
Onset of Flat
Degrading Bearing
2 Months

0
10
20
30
40
50
60
70
80
90
100
0 0.5 1 1.5 2 2.5 3
Exte
nt
of
Dam
age
(mm
)
Bearing Health Index (BHI)
Correlation of Damage to BHI
Slide 10

Subsurface Damage Revealed
Slide 11
0.6 mm Cut
Initial inspection shows minimal
damage
Surface removal reveals hidden
damage

Business Case
Extend service intervalMaintain on need not on mileage
Reduce number of major overhauls in franchise period
Improves asset utilisationFleet being monitored while earning revenue
Improves efficiency of maintenance operationsAllows potential failure to be identified in advance &
maintenance planned
Reduces damage by enabling early interventionWheel sets, shock damage etc
Avoids in service breakdownPenalty charges , cost of repair & recovery
Improved Reliability and Safety Slide 12

No Wasteful Bearing Changes
Slide 13
Only spend cash to replace the small % of
bearings that are failing
Use full life of good bearings and don’t waste cash on them
Current Maintenance Plan Extended Life
Use full life of good bearings and don’t waste cash on them

Gearbox Monitoring
Slide 14

Original bearing solution led to wheel solution
Now investigating track solution
> 5 000 sensors already monitor Kent network daily in real-time
Location tagged data using GPS
Going beyond rolling stock …
Sprung & Unsprung measurements
“Noisy” wheels easily removed
Vertical shock & vibration at
wheel/rail (+/- 0.025Grms)
Also lateral and longitudinal forces

WARNTRAK Track Monitoring
Vibration sensors measure the interaction of the rolling stock and the track
The Perpetuum Data Concentrator has GPS capability which enables vibration levels to be correlated with track position
This enables the system to identify locations where there are faults developing
Maintenance teams can then predict the priority areas for maintenance resulting in improvements in safety, reliability and cost
Examples:
Increasing vibration that leads to a track break
Increased vibration associated with poor track bed
Degradation of quality of points over time16

Poor Bed Identified, Remedied
17
Stations (B) & (C)
JunctionPoints around
Tunnel
Distance (Miles)
Instability under track
Each line shows vibration
levels vs distance
Each line represents
data from a week later
than the previous line
Tamping work done and
improvement seen in
vibration data

Degradation of Points
18
Degradation of Points over 6 Month Period

Future: Fully Monitored Train
Slide 19
Rail/Wheel Impact
Gearbox & Traction Motor
Pantograph Impact
Coach Temperature
Door Open & Close
Compressor
Ride Quality
BearingsWheels
Suspension

IoT–Improving Quality of Life
Slide 20
Checking the bearings on
the 12.37 to Brighton

Summary – EH Powered IoT
EH Powered Wireless > Competitive Installation Wireless Condition Monitoring
Adopt new maintenance methodology
Enhanced Safety from real time data
Improve Reliability
Reduce Maintenance Costs
Fast to Fit & Easy to Use with clear actionable information
Early Warning
See bearing degradation 2-3 months ahead
Wheel issues before further damage
Reduce unnecessary speed restrictions
Powerful Evolution Path Gearboxes, Traction Motors, Track condition, Cows
Slide 21

Cow on track – Train in Field
0
2
4
6
8
10
12
26/07/2015 21:31 26/07/2015 21:33 26/07/2015 21:34 26/07/2015 21:36 26/07/2015 21:37 26/07/2015 21:38 26/07/2015 21:40 26/07/2015 21:41 26/07/2015 21:43
Vib
rati
on
/G
Time
375703 - Vibration Level over Time
VibrationA
VibrationB