monitoring the temporal dynamics of four … · objetivo deste trabalho foi realizar o...
TRANSCRIPT
GEOGRAFIA, Rio Claro, v. 36, Número Especial, p. 173-185, jun. 2011.
MONITORING THE TEMPORAL DYNAMICS OF FOURVEGETATION COVER TYPES FROM THE PANTANAL
USING THE WAVELET TRANSFORM APPLIED TOA TIME-SERIES OF EVI/MODIS DATA
João Francisco Gonçalves ANTUNES1
Júlio César Dalla Mora ESQUERDO2
Rubens Augusto Camargo LAMPARELLI3
Abstract
Although one of the most preserved ecosystems in Brazil, the Pantanal suffers underproblems such as fire, deforestation and changes in the flood and drought cycles. Monitoring allthe extension of the Pantanal is essential to detect problems related to land use changes and toinfer on the level of floods in the wetlands. The objective of this study was to monitor four areasin the Pantanal with different vegetation cover using the Wavelet Transform applied to a time-series of EVI (Enhanced Vegetation Index) acquired from the MODIS (Moderate Resolution ImagingSpectroradiometer) sensor, between 2005 and 2009, in order to analyze the vegetation phenologydynamics. The results showed that the Coiflet Wavelet Transform of 4th order with 90% power,was able to remove the high frequency noise and highlight the changes of the vegetationphenology with a higher precision, allowing a better analysis of trends in the inter-annual variabilityof EVI. Changes of the temporal EVI pattern may indicate changes in vegetation phenology, mainlydue to rainfall seasonality. The technique is robust and can be extrapolated to other regions ofthe Pantanal in order to detect deforestation and fire occurrences.
Key words: Remote sensing. Image processing. Vegetation index. Temporal profile.Phenology detection.
Resumo
Monitoramento da dinâmica temporal de quatro coberturas vegetais do pantanalutilizando a transformada de wavelet em séries temporais de dados EVI/MODIS
Embora seja um dos ecossistemas mais conservados do Brasil, o Pantanal está sujeito aproblemas como o fogo, desmatamentos e alterações dos ciclos de cheia e seca. O monitoramentode toda a extensão do Pantanal é fundamental para a detecção de problemas relacionados aalterações do uso do solo, assim como inferir sobre o nível das cheias que ocorrem na planície. Oobjetivo deste trabalho foi realizar o monitoramento de quatro áreas com diferentes coberturasvegetais no Pantanal, utilizando a Transformada de Wavelet aplicada à série temporal de EVI(Enhanced Vegetation Index) do sensor MODIS (Moderate Resolution Imaging Spectroradiometer),do ano de 2005 a 2009, para analisar a dinâmica da fenologia da vegetação. Os resultadosmostraram que a Transformada de Wavelet Coiflet, de ordem 4 com potência de 90%, conseguiuremover os ruídos de alta frequência e destacar as mudanças de fenologia da vegetação commais precisão, propiciando uma melhor análise das tendências interanuais de variabilidade doEVI. As alterações do padrão temporal do EVI podem indicar mudanças na fenologia da vegetação,principalmente devido a sazonalidade da precipitação. A técnica mostrou ser robusta e pode serextrapolada para outras regiões do Pantanal para detectar ocorrências de desmatamentos equeimadas.
Palavras-chave: Sensoriamento remoto. Processamento de imagens. Índice de vegetação.Perfil temporal. Detecção da fenologia.
1 Embrapa Informática Agropecuária, Pesquisador, Caixa Postal 6041 - 13.083-886; Faculdade de EngenhariaAgrícola - Feagri/Unicamp, Doutorando, Caixa Postal 6011 - 13083-875 - Campinas - SP, Brasil.E-mail: [email protected]
2 Embrapa Informática Agropecuária, Pesquisador, Caixa Postal 6041 - 13.083-886 - Campinas - SP, Brasil.E-mail: [email protected]
3 Centro de Pesquisas Meteorológicas e Agrícolas aplicadas a Agricultura - Cepagri/Unicamp, Pesquisador,13.083-970 - Campinas - SP, Brasil. E-mail: [email protected]
174 GEOGRAFIA
Monitoring the temporal dynamics of four vegetation cover typesfrom the pantanal using the wavelet transform applied to
a time-series of EVI/MODIS data
INTRODUCTION
The Pantanal is one of the largest floodplains worldwide and houses a large wildlifeconcentration. Although it is one of the most preserved ecosystems from Brazil, with 85% ofits� original habitat, it is affected by problems such as fire and deforestation. Furthermore,human changes of vegetation in the Alto Paraguai Basin influence the flood and droughtcycles. So it is very important that this region is constantly monitored for the detection ofchanges on land use and land cover.
Due to the large extension of the Pantanal, satellite images became important toolsto study the dynamics of vegetation, because they provide a synoptic view of the entirebiome, allowing the analysis of changes occurring on the surface.
The MODIS (Moderate Resolution Imaging Spectrometer) sensor, aboard orbitalplatforms from the international EOS (Earth Observing System) from NASA, obtained datawhich were processed for global vegetation studies. The TERRA satellite was launched inDecember 1999, crossing the Equator at 10:30 a.m. (local time), in descending orbit (SOARESet al., 2007).
MODIS data, with moderate spatial resolution, high repeatability, good radiometricquality, high geometric precision, with atmospheric correction and cost-free distribution,have a great potential application to monitor vegetation (ZHANG et al., 2003).
From MODIS data it is possible to extract products of vegetation indices whichenhance the spectral response of plants, reducing the influence of soil, aiming to distinguishthe vegetation phenology and changes in land use/land cover at the analysis of a temporalimage series (WARDLOW et al., 2007).
In this research line there are several studies related to the scope of this work andseveral standing out scientific articles which use temporal series of the Enhanced VegetationIndex (EVI), to monitor the degree of fragmentation from the Amazon landscape and evaluateits impact on the ecological processes and habitat quality (FERREIRA et al., 2010), toobserve the course of the flood dynamics in the Pantanal of Southern Mato Grosso, determiningboth those areas susceptible for flooding and dry areas (ADAMI et al., 2008), and also todetect changes of land cover to measure the increase of agricultural production in theAmazon region (BROWN et al., 2007).
The harmonic analysis has been used for the study of long temporal series of vegetationindices, based on changes occurring on the Earth surface, facilitating to understand thetemporal dynamics.
One of the techniques used in temporal series, which normally have no periodicitydue to the inherent vegetation vigor, is the Wavelet Transform, based on the fitting of acurve, aiming to remove the high frequencies associated to noise, remaining sensitive tochanges in the plant phenology. This mathematical transformation is applied to process non-stationary signs to decompose and reset data in different temporal scales, to obtain hiddeninformation in the frequency domain, where each scale is represented by a specific frequency(SAKAMOTO et al., 2005).
In this context, the objective of this work was to execute the temporal monitoring offour different vegetation cover types from the Pantanal, using the Wavelet Transform appliedto the temporal series of EVI/MODIS data, from the timeframe 2005-2009, aiming to analyzethe dynamics of vegetation phenology.

175Antunes, J. F. G. / Esquerdo, J. C. D. M. /
Lamparelli, R. A. C.v. 36, Número Especial jun. 2011
MATERIAL AND METHODS
The biome of the Brazilian Pantanal has a size of approximately 160,000 km2 of which138,183 km2 are located within the States Mato Grosso and Mato Grosso do Sul, inserted atthe Alto Paraguai Basin (SILVA; ABDON, 1998), as illustrated by Figure 1. The Pantanalfloodplain is the largest wetland area of the Planet, and it is temporarily flooded every year,during the rainy season, by the Paraguai and its� tributaries, due to the low slope of therelief, where cattle raising is the main activity. The average yearly temperature is 25.5º Cand the annual rainfall varies between 1,000 and 1,400 mm. The rainy season occurs betweenDecember and May and the drought from June to November (JUNK et al., 2006).
In order to perform the temporal monitoring, four areas were selected which representthe main vegetation cover types of the Pantanal floodplain. Area 1 is composed by Semi-deciduous Seasonal Forest with trees 15 to 20 m high, which lose 20 to 50% of the leavesduring the dry season, located at the margins of Taquari River. Area 2 is made up of SavannaPark Steppe with sparse trees and grass cover located at the Nabileque River, prone toinundation. Area 3 is covered by Planted Pasture with grass of brachiaria type, located atthe subregion of Nhecolândia. Area 4 consists of irrigated rice plantation, using controlledinundation, located at the subregion of Miranda.
In each area spectral data were collected in a window of 2 x 2 pixels, encompassinga sample area of 250,000 m2 (25 ha), in order to choose quite homogeneous sections since,due to the moderate spatial resolution of MODIS images, there is a certain level of spectralmixture of the phytophysiognomies found in the pixel set of each place. Due to this procedure,the sample areas reflect the spatial average of the spectral response of a set of similarphytophysiognomies which tend to represent an unique landscape pattern.
Figure 1 - Alto Paraguai Basin and the four areas monitored in the Pantanal
For this study the Vegetation Index MOD13Q1 of MODIS/TERRA with spatial resolutionof 250 m was used, obtained free-of-charge of LP-DAAC (Land Processes Distributed Active
176 GEOGRAFIA
Monitoring the temporal dynamics of four vegetation cover typesfrom the pantanal using the wavelet transform applied to
a time-series of EVI/MODIS data
Archive Center), from EOS/NASA in form of tiles of 1,200 x 1,200 km, at HDF (HierarchicalData Format) and on sinusoidal cartographic projection (LP-DAAC, 2009).
The data manipulation for the selection of product, mosaic, section of interest areaand definition of the cartographic projection was done automatically by routines implementedon IDL (Interactive Data Language) of software from ENVI (ITTVIS, 2010), with the executionof programs from the free software package MRTools (MODIS Reprojection Tools) (LP-DAAC,2010).
The product MOD13Q1 consists of pixel compositions of high radiometric quality,improved observation geometry, minimum presence of clouds and aerosols, selected fromdaily images during a period of 16 days. The present version is collection 5 which presentssignificant changes to increase the quality of the products (LATORRE et al., 2007).
The band of product MOD13Q1 selected for this work was from EVI (EnhancedVegetation Index), aiming to better represent the vegetation dynamics along a temporalseries. According to Huete et al. (2002) EVI was developed to optimize the spectral responseof vegetation, improving the sensitivity in regions with higher biomass densities, besidespropitiating to monitor the vegetation by the reduction of the effects of the canopy substratumand of atmospheric influences, calculated by Equation (1):
(1)
where:
BLU = Reflectance on band 3 of blue (459-479 nm);RED = Reflectance on band 1 of red (620-670 nm);NIR = Reflectance on band 2 of near infrared (841-876 nm);G = 2.5 gain factor;L = 1: canopy adjustment factor, adopted by LP-DAAC for the index generation;C1 = 6.0 and C2 = 7.5: aerosol resistance coefficients using the blue band to reduce theinfluence of aerosols in the red band.
The values of coefficients C1 and C2 and of factors G and L, specified earlier, arebased on Huete et al., (1994) and Huete et al. (1997) in order guarantee the sensitivity ofEVI to most different landscapes, from deserts to dense forests. LP-DAAC adopts thesesame values for the generation of EVI, available on product MOD13Q1 of MODIS/TERRA.Although the MODIS products present information on the reliability of spectral values (pixelreliability), they are not considered in this study purposely, in order to evaluate the performanceand to verify the robustness of the decomposition and filtering technique in temporal series,containing data with higher oscillation.
The rainfall distribution in the Pantanal can affect the standard of phenology peaksfrom vegetation. To help the analysis of temporal dynamics the accumulated rainfall data,calculation was done by interpolation of 72 rainfall gauges from Agritempo (AgrometeorologicalMonitoring System) (EMBRAPA INFORMÁTICA AGROPECUÁRIA; CEPAGRI/UNICAMP, 2009) inthe States of Mato Grosso and Mato Grosso do Sul, for the entire temporal series.
For the decomposition and filtering of the temporal series of EVI/MODIS, the discreteWavelet Transform was used, defined by Daubechies (1992) where φ(t) is a function ofoscillation with finite energy and null average, according to Equation (2):
(2)

177Antunes, J. F. G. / Esquerdo, J. C. D. M. /
Lamparelli, R. A. C.v. 36, Número Especial jun. 2011
The Wavelet Transform W(a,b) is defined by Equation (3):
(3)
where, s(t) is the entry signal analyzed and φ* is the mother wavelet or base. In thisequation, the width of the wavelet is determined by the scale parameter �a� and its� centeris determined by parameter �b� with a, b ∈ R e a ≠ 0. To work with discrete signals normallyspecial values are used for �a� and �b�, being a = 2j e b = k2j, com j, k Î Z. Changing thevalue of parameter �a� there is a dilatation (a > 1) or contraction (a < 1) effect, whilechanges on parameter �b� have a translation effect to analyze the function φ(t) around thispoint. The variable �t� represents the time interval in the temporal series where the integrationis performed. The advantage of the Wavelet Transform is the maintenance of informationrelated to width (scale) and localization (time) of the characteristics present in s(t). Accordingto Gendrin et al. (2006), Equation (4) can be used to reconstruct the signal.
(4)
The temporal wavelet W is the sum of wavelets with decreasing widths of �i� to �x�,where �x� is the number of transformations needed to reach a defined number of coefficientsretained from input data. The wavelet filtering starts with the application of the smoothingfunction at the temporal series to remove high frequency noise. The smoothing temporalseries of EVI is then reconstructed with the discrete Wavelet Transform.
The wavelet functions are obtained by a dilatation and a translation, forming a basewhich is not necessarily orthogonal. One of the advantages to work with orthogonal bases,such as the Wavelet called Coiflet is the possibility of the perfect reconstruction of theoriginal signal from the wavelet coefficients (MORETTIN, 1999).
The application of the Wavelet Transform in a temporal series of EVI requires thedefinition of order and power of the mother wavelet which define the behavior of the curve.Order is a smoothness measure, where the highest values produce stronger smoothness.Power corresponds to the amount of retained coefficients from the temporal series EVI. Astronger power generates a narrower wavelet, which includes details of a finer scale, but itcan also retain more noise. A lower power removes more noise due to the larger form of thewavelet and it could capture tendencies in all the temporal series, but it could loose phenologicdetails (GALFORD et al., 2008).
In this study we used discrete wavelet mother Coiflet, orthogonal and almost symmetricof 4th order, because its shape is more similar to phonologic peaks. The power used was of90% to detect the peaks at the smoothed temporal series of EVI with higher precision andso, to allow an improved analysis of phenology patterns from vegetation (SAKAMOTO et al.,2005).To investigate only the tendencies of the temporal series of EVI, we used 70% and50% power.
The processing was made using package IDL Wavelet Toolkit from ENVI, which is animplementation of a set from graphic interfaces and routines for the Wavelet Transform,based on Torrence & Compo (1998).
RESULTS AND DISCUSSION
The MOD13Q1 image processing consisted on a mosaic of tiles H12V10, H12V11,H13V10, H13V11 which cover the area under study, the transformation for the geographic

178 GEOGRAFIA
Monitoring the temporal dynamics of four vegetation cover typesfrom the pantanal using the wavelet transform applied to
a time-series of EVI/MODIS data
cartographic projection, the section with the borders of the Alto Paraguai Basin, the EVIproduct extraction and recording on format GeoTIFF. From this set we obtained compositionsof 16 days for EVI from the timeframe January to December 2005 to 2009, 23 images foreach year, totaling 115 images for the entire temporal series.
Figure 2 presents a color composite RGB-732 (mid-infrared, near infrared, red) andthe EVI composition, representing the image processed in the timeframe March 5th to 20th
2008.
Composite RGB-732 EVI Composition
Figure 2 - MODIS products of the Alto Paraguai Basin
Taking into account the details of the Earth surface allowed by the 250 m spatialresolution of a MODIS image, the derived products can be analyzed for applications inregional scale. The color composite RGB-732 offers a good contrast of targets from theEarth surface. Areas in darker green tone correspond to the natural vegetation, those inclear green tone to pastures and agriculture areas, those in magenta to bare soil and thedark ones to water bodies. The highest of the EVI composition appear in red and representthose areas of higher biomass with more vegetation. The lowest values appear in green orblue and constitute areas of low biomass, such as bare soil and swampy areas.
Figure 3 shows the graph of accumulated rainfall from 16 days of the four areasmonitored in the timeframe 2005-2009.
Based on the understanding of the graph, one can perceive that the annualaccumulated rainfall distribution on 16 days in the four areas monitored has similar oscillations,with drought periods occurring from June to November, recording maximum 50 mm rainfalland with precipitation periods extending from December to May, when volumes of up to 250mm are recorded.
The rainfall regime in the Pantanal determines an alternation of the land coverconditions, which could affect the phenology pattern from the vegetation. There are higherlocated regions which are never flooded, low sections which are almost always underwater,as well as regions of intermediate altitude which are dry during the largest part of the yearand flooded during some months.

179Antunes, J. F. G. / Esquerdo, J. C. D. M. /
Lamparelli, R. A. C.v. 36, Número Especial jun. 2011
Based on that, monitoring was done of four areas with different vegetation cover inthe Pantanal, using the Wavelet Transform applied to the temporal MODIS series of thetimeframe 2005-2009. The dynamics of vegetation phenology was analyzed, according towhat is presented in the sequence of figures 4, 5, 6 and 7.
In order to help understanding the graphs, the MODIS composition of 16 days with Nr. 1starts on Jan. 1st 2005, Nr. 20 on Nov. 1st 2005, Nr. 40 on Sept. 14th 2006, Nr. 60 on July 28th
2007, Nr. 80 on June 9th 2008, Nr. 100 on April 23rd 2009 and Nr. 115 on Dec. 29th 2009.
Figure 3 - Accumulated rainfall from 16 days of the monitoredareas between 2005 and 2009
Source: Agritempo (2009).

180 GEOGRAFIA
Monitoring the temporal dynamics of four vegetation cover typesfrom the pantanal using the wavelet transform applied to
a time-series of EVI/MODIS data
Figure 5 shows the graphs of original EVI profile and smoothed by Wavelet Coiflet, of4th order with 90%, 70% and 50% power, of Area 2 - Savanna.
Area 1 - Forest - Original Series Area 1 - Forest - Smoothed Series - Power 90%
Area 1 - Forest - Smoothed Series - Power 70% Area 1 - Forest - Smoothed Series - Power 50%
Area 2 - Savanna - Original Series Area 2 - Savanna - Smoothed Series - Power 90%
Area 2 - Savanna - Smoothed Series - Power 70% Area 2 - Savanna - Smoothed Series - Power 50%
Figure 5 - EVI temporal profile of Area 2 - Savanna monitored between 2005 and 2009
Figure 4 - EVI temporal profile of Area 1 - Forest monitored between 2005 and 2009
Figure 4 shows the graphs of the original EVI profile and smoothed by the WaveletCoiflet, of 4th order, with 90%, 70% and 50% power, of Area 1 - Forest.
181Antunes, J. F. G. / Esquerdo, J. C. D. M. /
Lamparelli, R. A. C.v. 36, Número Especial jun. 2011
Figure 6 - EVI temporal profile of Area 3 - Pasture monitored between 2005 and 2009
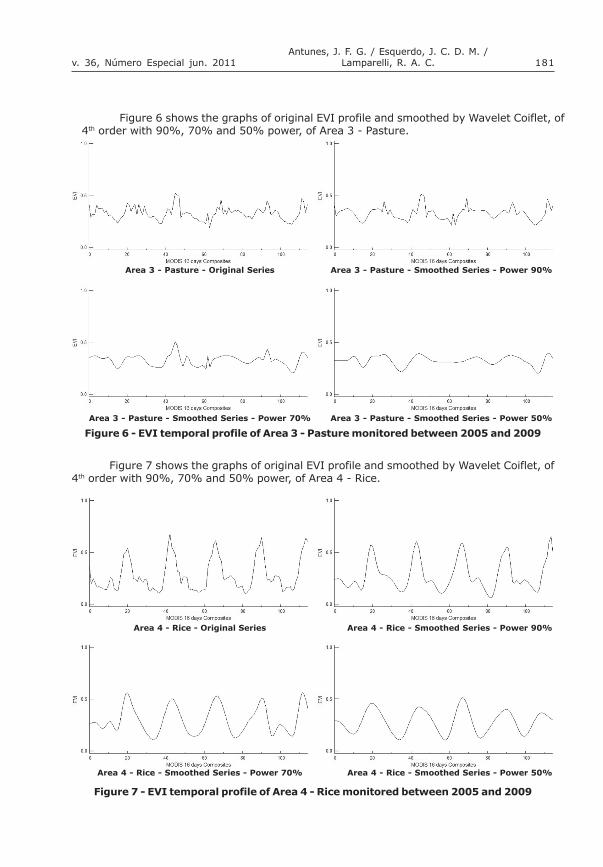
Figure 6 shows the graphs of original EVI profile and smoothed by Wavelet Coiflet, of4th order with 90%, 70% and 50% power, of Area 3 - Pasture.
Figure 7 shows the graphs of original EVI profile and smoothed by Wavelet Coiflet, of4th order with 90%, 70% and 50% power, of Area 4 - Rice.
Figure 7 - EVI temporal profile of Area 4 - Rice monitored between 2005 and 2009
Area 3 - Pasture - Original Series Area 3 - Pasture - Smoothed Series - Power 90%
Area 3 - Pasture - Smoothed Series - Power 70% Area 3 - Pasture - Smoothed Series - Power 50%
Area 4 - Rice - Original Series Area 4 - Rice - Smoothed Series - Power 90%
Area 4 - Rice - Smoothed Series - Power 70% Area 4 - Rice - Smoothed Series - Power 50%

182 GEOGRAFIA
Monitoring the temporal dynamics of four vegetation cover typesfrom the pantanal using the wavelet transform applied to
a time-series of EVI/MODIS data
The phenology of Area 1 - Forest (Figure 4) presents small variations of EVI betweenthe dry and wet seasons, with values above 0.31, but not exceeding 0.67, keeping anaverage value of 0.48. This is a characteristic behavior of this vegetation type, formed bytrees of medium size which loose part of its leaves during the dry season. The lowest valuesoccur in June, during the dry period, and this is justified since the year 2005 had a longdrought period.
The smoothed temporal series with power of 70% and 50% shows a cyclic tendencywhich is practically constant of EVI along the years, but the curves have a lower variationof values, with a reduction of important annual peaks of phenology from the forest.
The phenology of Area 2 - Savanna (Figure 5) has an average drop of EVI around0.26, with some seasonal variations between 0.06 and 0.43. Since it is localized in a regionof possible inundations, due to flooding in the Pantanal, this area can have a more markedvariation of EVI, and it could decrease strongly, such as in July 2006 and 2008, years oflarge flooding. The dates for the occurrence of these EVI decreases change from year toyear, due to changes of the flooding periods in the Pantanal and to the variation of thevegetation vigor.
The smoothed temporal series with power of 70% and 50% represents the tendencyof slow EVI variation along the years, but the curves present an increase of the lowestvalues and loose the yearly important peaks for the characterization of the savanna phenology,mainly the occurrence details of the large flooding.
The phenology of Area 3 - Pasture (Figure 6) is not susceptible to the floodingregime. EVI has an average around 0.32, larger than Area 2 - Savanna, and smaller thanArea 1 - Forest, with small seasonal variations between 0.18 and 0.52, decreasing in dryertimes of the year due to the decrease of vegetation vigor and increasing during the rainyseason, such as in December 2006.
The smoothed temporal series with 70% and 50% power presents a tendency ofsmall season EVI variations along the years, however the curves have a decrease of thehighest values and loose important details for the characterization of pasture phenology,such as the peaks with higher or lower vigor of vegetation.
The phenology of Area 4 - Rice (Figure 7) shows large EVI variations with bimodaltemporal pattern, related to different development cycles during the year, where cycle ischaracterized by a maximum in the temporal series. EVI values increase strongly afterSeptember, with the highest peak in November and another lower peak in March. In thistemporal series, EVI can grow 0.10 at the beginning of the agricultural cycle up to 0.70 atthe vegetative peak, with an average value of 0.28. This abrupt variation is related to thehigh spectral dynamics of the rice culture which presents bare soil at the beginning of thecycle and a high biomass quantity during the period of highest vegetative vigor.
The smoothed temporal series with power of 70% and 50% presents a tendency oflarge EVI variations along the years, the curves however have a reduction of the highestvalues and loose very important annual peaks of phenology characterization from rice cultureso as to not detecting the temporal bimodal pattern of cultivation which occurs all years.
When comparing the results obtained from the analysis of graphs of figures 4, 5 6 and7 with data from accumulated rainfall shown on figure 3, we verified that in not changed bymen, 1 - Forest, 2 - Savanna and 3 - Pasture, the biomass peaks coincide with periods ofhigher rainfall, in spite of a time interval between the beginning of the rain season and theresponse of vegetation. In Area 4 - Rice, the biomass peaks occur some weeks before theprecipitation peaks, due to specific phenology characteristics of the irrigated rice culture.
The fitting of the curve generated by the Coiflet Wavelet Transform, of 4th order and90% power was evaluated by the RMS error among the difference of the temporal originaland smoothed EVI for the four monitored areas, as shown on table 1.

183Antunes, J. F. G. / Esquerdo, J. C. D. M. /
Lamparelli, R. A. C.v. 36, Número Especial jun. 2011
The smoothed curve fittings for the four areas obtained a quite similar performancewith the RMS error magnitude around 30.0%. The fitting of Area 4 - Rice can be consideredthe most precise because it retained only 15.6% of the coefficients from the original timeseries for the reconstruction of the smoothed curve, with the same error level from theother curve fittings.
One must observe that the analysis done from the MODIS data are applied ionregional scale and therefore they could have limitations inherent to the details of thesurface with 250 m of spatial resolution. In spite of that, it must be emphasized that theresults obtained with the understanding of the temporal EVI dynamics in the four areasmonitored, could be extrapolated to other regions within the Pantanal, where samples ofhomogeneous vegetation types could be extracted, and so increasing the representativenessof the method used in the study, in terms of extension.
CONCLUSIONS AND SUGGESTIONS
The results of this work showed the potential of temporal monitoring at the detectionof phenology patterns on four predominant vegetation cover types from the Pantanal,whose understanding is important to verify its inter-annual variations.
The Coiflet Wavelet Transform of 4th order and 90% power applied to the EVI/MODIStemporal series is a quiet robust technique because it succeeded in the removal of highfrequency noise and detached changes on vegetation phenology with higher precision,propitiating an improvement on the analysis of variability tendencies of EVI. Changes at thetemporal pattern of EVI may indicate changes of vegetation phenology, especially due tothe seasonality of rainfall.
Variations of the temporal pattern from EVI however can also denote changes ofvegetation caused by other natural or human actions. For the continuation of this study wesuggest to aggregate geo-referenced historical information from the areas in the Pantanalwhich suffered deforestation and burning, where vegetation cover was eliminated in order toverify changes in the EVI pattern. After monitoring the temporal dynamics of vegetation itwould be possible to detect abrupt variations of the spectral patterns related to theoccurrence of these events.
Table 1 - Retained coefficients and RMS error of the smoothedcurves for the four areas
184 GEOGRAFIA
Monitoring the temporal dynamics of four vegetation cover typesfrom the pantanal using the wavelet transform applied to
a time-series of EVI/MODIS data
REFERENCES
ADAMI, M.; FREITAS, R. M.; PADOVANI, C. R.; SHIMABUKURO, Y. E.; MOREIRA, M. A. Estudoda dinâmica espaço-temporal do bioma Pantanal por meio de imagens MODIS. PesquisaAgropecuária Brasileira, v. 43, n. 10, p. 1371-1378, 2008.
BROWN, J. C.; JEPSON, W. E.; KASTENS, J. H.; WARDLOW, B. D.; LOMAS, J. M.; PRICE, K. P.Multitemporal, Moderate-Spatial-Resolution Remote Sensing of Modern Agricultural Productionand Land Modification in the Brazilian Amazon. GIScience & Remote Sensing, v. 44, n. 2,p. 117-148, 2007.
DAUBECHIES, I. Ten lectures on wavelets. Philadelphia: Rutgers University and AT&T BellLaboratories, 1992.
EMBRAPA INFORMÁTICA AGROPECUÁRIA; CEPAGRI/UNICAMP. Agritempo. Available at: <http://www.agritempo.gov.br/>. Accessed in: 18 ago. 2009.
FERREIRA, N. C.; FERREIRA, L. G.; HUETE, A. R. Assessing the response of the MODISvegetation indices to landscape disturbance in the forested areas of the legal BrazilianAmazon. International Journal of Remote Sensing, v. 31, n. 3, p. 745-759, 2010.
GALFORD, G. L.; MUSTARD, J. F.; MELILLO, J.; GENDRIN, A.; CERRI, C. C., CERRI, C. E. P.Wavelet analysis of MODIS time series to detect expansion and intensification of row-cropagriculture in Brazil. Remote Sensing of Environment, v. 112, n. 2, p. 576-587, 2008.
GENDRIN, A.; LANGEVIN, Y.; BIBRING, J. P.; FORNI, O. A new method to investigatehyperspectral image cubes: An application of the wavelet transform. Journal of GeophysicalResearch, v. 111, n. E10, E10004, 21 pp., 2006.
HUETE, A.; DIDAN, K.; MIURA, T.; RODRIGUEZ, E. Overview of the radiometric and biophysicalperformance of the MODIS vegetation indices. (Special Issue). Remote Sensing ofEnvironment, v. 83, n.1-2, p. 195-213, 2002.
HUETE, A.; JUSTICE, C.; LIU, H. Development of vegetation and soil indices for MODIS-EOS.Remote Sensing of Environment, v. 49, n. 3, p. 224-234, 1994.
HUETE, A. R.; LIU, H. Q.; BATCHILY, K.; VAN LEEUWEN, W. J. D. A comparison of vegetationindices over a global set of TM images for EOS-MODIS. Remote Sensing of Environment,v. 59, n. 3, p. 440-451, 1997.
ITT VISUAL INFORMATION SOLUTIONS (ITTVIS). ENVI/IDL. Available at: <http://www.ittvis.com/>. Accessed in 27. jul. 2010.
JUNK, W. J.; CUNHA, C. N.; WANTZEN, K. M.; PETERMANN, P.; STRUSSMANN, C.; MARQUES,M. I.; ADIS, J. Biodiversity and its conservation in the Pantanal of Mato Grosso, Brazil.Aquatic Sciences, v. 68, n. 3, p. 278-309, 2006.
LAND PROCESSES DISTRIBUTED ACTIVE ARCHIVE CENTER (LP-DAAC). MODIS Data PoolHoldings. Available at: <https://lpdaac.usgs.gov/lpdaac/get_data/data_pool>. Accessedin 10. nov. 2009.
LAND PROCESSES DISTRIBUTED ACTIVE ARCHIVE CENTER (LP-DAAC). MODIS ReprojectionTool. Available at: <https://lpdaac.usgs.gov/lpdaac/tools/>. Accessed in 27. jul. 2010.
LATORRE, M. L.; SHIMABUKURO, Y. E.; ANDERSON, L. O. Sensor MODIS: Produtos paraEcossistemas Terrestres - MODLAND. In: O Sensor Modis e suas aplicações ambientais noBrasil - SHIMABUKURO. Y. E.; RUDORFF, B. F. T.; CEBALLOS, J. C. (Coord.). São José dosCampos: Editora Parêntese, Brasil, 2007.
MORETTIN, P. A. Ondas e ondaletas: Da análise de Fourier à análise de ondaletas. SãoPaulo: Editora da Universidade de São Paulo, 1999.

185Antunes, J. F. G. / Esquerdo, J. C. D. M. /
Lamparelli, R. A. C.v. 36, Número Especial jun. 2011
SAKAMOTO, T.; YOKOZAWA, M.; TORITANI, H.; SHIBAYAMA, M.; ISHITSUKA, N.; OHNO, H. Acrop phenology detection method using time-series MODIS data. Remote Sensing ofEnvironment, v. 96, n. 3-4, p. 366-374, 2005.
SILVA, J. DOS S. V. DA; ABDON, M. DE M. Delimitação do Pantanal brasileiro e suas sub-regiões. Pesquisa Agropecuária Brasileira, v. 33, número especial, p. 1703-1711, 1998.
SOARES, J. V.; BATISTA, G. T; SHIMABUKURO, Y. E. Sensor MODIS: Histórico e Descrição.In: O Sensor Modis e suas aplicações ambientais no Brasil - SHIMABUKURO. Y. E.; RUDORFF,B. F. T.; CEBALLOS, J. C. (Coord.). São José dos Campos: Editora Parêntese, Brasil, 2007.
TORRENCE, C.; COMPO, G. P. A practical guide to wavelet analysis. Bulletin of the AmericanMeteorological Society, v. 79, n. 1, p. 61-78, 1998.
WARDLOW, B. D.; EGBERT, S. L.; KASTENS, J. H. Analysis of time-series MODIS 250m vegetationindex data for crop classification in the U.S. Central Great Plains. Remote Sensing ofEnvironment, v. 108, n. 3, p. 290-310, 2007.
ZHANG, X.; FRIEDL, M. A.; SCHAAF, C. B.; STRAHLER, A. H.; HODGES, J. C. F.; GAO, F.;REED, B. C; HUETE, A. Monitoring vegetation phenology using MODIS. Remote Sensing ofEnvironment, v. 84, n. 3, p. 471-475, 2003.
