monitoring the hp storageworks eva - eg innovations measurements manuals... · monitoring the hp...
TRANSCRIPT
Monitoring the HP StorageWorks EVA eG Enterprise v5.6

Restricted Rights Legend
The information contained in this document is confidential and subject to change without notice. No part of this document may be reproduced or disclosed to others without the prior permission of eG Innovations Inc. eG Innovations Inc. makes no warranty of any kind with regard to the software and documentation, including, but not limited to, the implied warranties of merchantability and fitness for a particular purpose.
Trademarks
Microsoft Windows, Windows NT, Windows 2003, and Windows 2000 are either registered trademarks or trademarks of Microsoft Corporation in United States and/or other countries.
The names of actual companies and products mentioned herein may be the trademarks of their respective owners.
Copyright
©2012 eG Innovations Inc. All rights reserved.

Table of Contents MONITORING THE HP STORAGEWORKS ENTERPRISE VIRTUAL ARRAY (EVA) FAMILY .............................................................1
1.1 PRE-REQUISITES FOR MONITORING THE HP EVA............................................................................................................................................. 3 1.1.1 Pre-requisites for Using the HP EVA Perf Component ...................................................................................................................... 4 1.1.2 Pre-requisites for Using the HP EVA SSSU Component .................................................................................................................... 5 1.1.3 The Hardware Layer............................................................................................................................................................................ 6
1.1.3.1 EVA Enclosure Temperature Status Test .............................................................................................................................. 7 1.1.3.2 EVA IO Communication Bus Status Test ............................................................................................................................. 8 1.1.3.3 EVA Enclosure EMU Status .................................................................................................................................................. 9 1.1.3.4 EVA Enclosure Fan Status Test ........................................................................................................................................... 11 1.1.3.5 EVA Enclosure Module Status ............................................................................................................................................ 12 1.1.3.6 EVA Enclosure Power Supply Status .................................................................................................................................. 13 1.1.3.7 EVA Controller Fan Status Test .......................................................................................................................................... 15 1.1.3.8 EVA Controller Power Status Test ...................................................................................................................................... 16
1.1.4 The Physical Disk Layer .................................................................................................................................................................... 17 1.1.4.1 EVA Disk Group Status ....................................................................................................................................................... 17 1.1.4.2 EVA Disk Group Traffic Test.............................................................................................................................................. 19 1.1.4.3 EVA Physical Disk Status.................................................................................................................................................... 21 1.1.4.4 EVA Physical Disk Traffic Test .......................................................................................................................................... 23
1.1.5 The Luns Layer................................................................................................................................................................................... 25 1.1.5.1 EVA Lun Group Test ........................................................................................................................................................... 26 1.1.5.2 EVA Lun Status Test............................................................................................................................................................ 28 1.1.5.3 EVA Lun Traffic Test .......................................................................................................................................................... 30
1.1.6 The Network Layer............................................................................................................................................................................. 33 1.1.6.1 EVA Controller to Device Port Status Test ......................................................................................................................... 33 1.1.6.2 EVA Device Port Status Test .............................................................................................................................................. 34 1.1.6.3 EVA FC Port Status Test ..................................................................................................................................................... 37
1.1.7 The Storage Array Layer ................................................................................................................................................................... 39 1.1.7.1 EVA Array Traffic Test ....................................................................................................................................................... 39 1.1.7.2 EVA System Status Test ...................................................................................................................................................... 40
1.1.8 The EVA Controller Layer................................................................................................................................................................. 42 1.1.8.1 EVA Cache Battery Status Test ........................................................................................................................................... 42 1.1.8.2 EVA Cache Memory Status Test ......................................................................................................................................... 44 1.1.8.3 EVA Controller Status Test ................................................................................................................................................. 46 1.1.8.4 EVA Processor Usage Test .................................................................................................................................................. 47
1.1.9 The Hosts Layer ................................................................................................................................................................................. 49 1.1.9.1 EVA Controller to Host Port Status Test ............................................................................................................................. 49 1.1.9.2 EVA Host to Lun Mapping .................................................................................................................................................. 51 1.1.9.3 EVA Host To Array Requests Test...................................................................................................................................... 53 1.1.9.4 EVA Host To Controller Traffic Test .................................................................................................................................. 55
CONCLUSION............................................................................................................................................................................................................58

Table of Figures
Figure 1.1: The layer model of the HP EVA storage array ............................................................................................................................................2 Figure 1.2: The fnames.conf file.....................................................................................................................................................................................5 Figure 1.3: The tests mapped to the Hardware layer ......................................................................................................................................................6 Figure 1.4: The tests mapped to the Physical Disk layer..............................................................................................................................................17 Figure 1.5: The tests mapped to the Luns layer ............................................................................................................................................................26 Figure 1.6: The tests mapped to the LUNs layer ..........................................................................................................................................................33 Figure 1.7: The tests mapped to the Storage Array layer .............................................................................................................................................39 Figure 1.8: The tests mapped to the EVA Controller layer ..........................................................................................................................................42 Figure 1.9: The tests mapped to the Hosts layer...........................................................................................................................................................49

M o n i t o r i n g t h e H P S t o r a g e W o r k s E n t e r p r i s e V i r t u a l A r r a y ( E V A ) F a m i l y
1
Monitoring the HP StorageWorks Enterprise Virtual Array (EVA) Family HP StorageWorks EVA disk arrays provide storage virtualization services to mid-sized enterprises. Storage virtualization refers to the process of separating (through abstraction) logical storage from physical storage. The virtualization system presents to the user a logical space for data storage and itself handles the process of mapping it to the actual physical location.
The key features of HP EVA include the following:
Places data across more spindles and automatically re-levels when new storage is added;
Offers tiered storage;
Requires less management resources for supporting, provisioning, and maintaining the storage environment;
Does not require storage capacity to be pre-allocated; dynamically adds disks when more storage is required;
This way, the HP EVA array lifts the management burden of traditional storage from the shoulders of administrators, and is hence quiet popular where mission-critical applications generating a high volume of sensitive data are in use. Such environments naturally will be extremely intolerant to issues in the performance of the virtual array, as even the slightest of deviations, be it a slowdown while reading from or writing to the virtual or physical disks supported by the array, excessive space usage on the array, or a failed host port/LUN/disk, can adversely impact application performance. It is therefore imperative that the operational state and condition of the integral components of the array, such as the host port, LUN, physical disk, LUN group, processor, etc., the processing ability of the array, and space usage by the array are continuously monitored, and bottlenecks (if any) reported to administrators instantly.
eG Enterprise provides a 100%, web-based HP EVA Storage monitoring model that observes the state and overall performance of the core components of a HP EVA storage array, and proactively alerts administrators to current/potential issues in array performance.
Chapter
1
M o n i t o r i n g t h e H P S t o r a g e W o r k s E n t e r p r i s e V i r t u a l A r r a y ( E V A ) F a m i l y
2
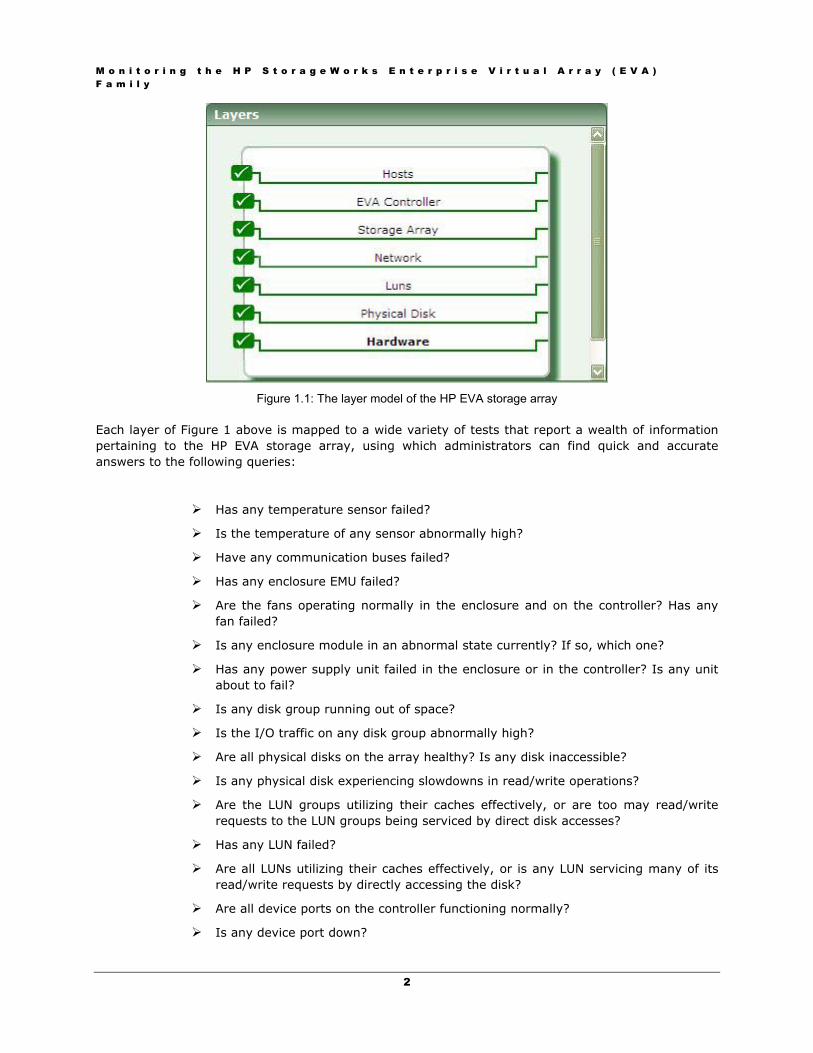
Figure 1.1: The layer model of the HP EVA storage array
Each layer of Figure 1 above is mapped to a wide variety of tests that report a wealth of information pertaining to the HP EVA storage array, using which administrators can find quick and accurate answers to the following queries:
Has any temperature sensor failed?
Is the temperature of any sensor abnormally high?
Have any communication buses failed?
Has any enclosure EMU failed?
Are the fans operating normally in the enclosure and on the controller? Has any fan failed?
Is any enclosure module in an abnormal state currently? If so, which one?
Has any power supply unit failed in the enclosure or in the controller? Is any unit about to fail?
Is any disk group running out of space?
Is the I/O traffic on any disk group abnormally high?
Are all physical disks on the array healthy? Is any disk inaccessible?
Is any physical disk experiencing slowdowns in read/write operations?
Are the LUN groups utilizing their caches effectively, or are too may read/write requests to the LUN groups being serviced by direct disk accesses?
Has any LUN failed?
Are all LUNs utilizing their caches effectively, or is any LUN servicing many of its read/write requests by directly accessing the disk?
Are all device ports on the controller functioning normally?
Is any device port down?

M o n i t o r i n g t h e H P S t o r a g e W o r k s E n t e r p r i s e V i r t u a l A r r a y ( E V A ) F a m i l y
3
Is any device port experiencing too many errors? If so, what type of errors are these?
Has any fibre channel port failed or is about to fail?
Are there any invalid/bad fibre channel ports on the controller?
Is the EVA system operating normally? Does the system have adequate free spaace?
Has any cache battery failed?
Are all controllers healthy?
Is the temperature of any controller very high?
Is any controller utilizing CPU resources excessively?
Is the array able to quickly process all requests from external hosts, or are too many outstanding requests in queue? Which external host is responsible for the maximum number of requests?
Is any host port experiencing a bottleneck during request processing?
Are too many requests awaiting processing by a host port? If so, which host port is it?
1.1 Pre-requisites for Monitoring the HP EVA To collect the useful statistics discussed above, the eG agent integrates with the following software components bundled with the HP Command View EVA software suite:
HP StorageWorks Command View EVAPerf
HP StorageWorks Storage System Scripting Utility (SSSU)
While a few tests executed by the eG agent use the HP StorageWorks Command View EVAPerf tool, a few others use the HP StorageWorks Storage System Scripting Utility (SSSU) for metrics collection. To ensure the hassle-free execution of these tests, the following primary pre-requisites are to be fulfilled:
The eG agent should be deployed on the same system as the EVAPerf and SSSU components mentioned above; to determine whether/not the EVAPerf component is installed on a target host, check for the existence of the following software components on that host:
evapdcs.exe—EVA Data Collection service, which gathers data from the EVAs that are visible to a host and stores it in memory cache
evaperf.exe—HP Command View EVAPerf command line interface
evapmext.dll—DLL extension for Windows Performance Monitor, the graphical user interface
EVAPerf-TLViz-Formatter.exe–EVAPerf TLViz Formatter user interface, which formats the HP CommandView EVAPerf all command output so you can view it with the HP TLViz tool.

M o n i t o r i n g t h e H P S t o r a g e W o r k s E n t e r p r i s e V i r t u a l A r r a y ( E V A ) F a m i l y
4
EVADATA.MDB–A Microsoft Access database template you can use to view the all command output in a database. The data from the command output resides in individual tables.
MSADODC.OCX–This .le is required to operate the EVAPerf TLVIZ Formatter use interface
By default, these components will be available in the C:\Program Files\Hewlett-Packard\EVA Performance Monitor directory on the host.
Similarly, you can be sure that the SSSU component has been installed on a host if you can locate the SSSU.exe file on that host.
The SSSU utility should be configured with at least one array
In addition, the tool-specific pre-requisites discussed in the sections that will follow should also be fulfilled.
1.1.1 Pre-requisites for Using the HP EVA Perf Component To begin array monitoring using the EVAPerf tool, ensure that the HP Command View EVAPerf component is configured properly:
EVA Data Collection service
The service uses TCP port 860. You may need to open this port on your firewall.
The service is set to manual start when you install HP Command View EVAPerf.
When the test runs the HP Command View EVAPerf command line interface, the service starts and remains running until you reboot the host.
Set the service to start automatically if you use Windows Performance Monitor for background logging. If you execute logging before starting this service, the startup time for the service may exceed the time that Windows Performance Monitor waits for the .rst data samples.
You can also start and stop the service using Windows Service Manager.
Array
Ensure that the array for which you want to gather performance metrics is initialized. Metrics will not be collected for uninitialized arrays.
HP recommends that you use unique names for each array.
Moreover, the eG tests that invoke the EVAPerf component for collecting performance metrics, should be configured with the following:
The install directory of the executable, evaperf.exe – by default, this will be C:\Program Files\Hewlett-Packard\EVA Performance Monitor directory on the host;
The WWN (world wide name) or the friendly name of the array to be monitored. To know the friendly name of an array, open the fnames.conf file in the install directory of the EVAPerf tool. The sample contents of this file have been provided below:
M o n i t o r i n g t h e H P S t o r a g e W o r k s E n t e r p r i s e V i r t u a l A r r a y ( E V A ) F a m i l y
5
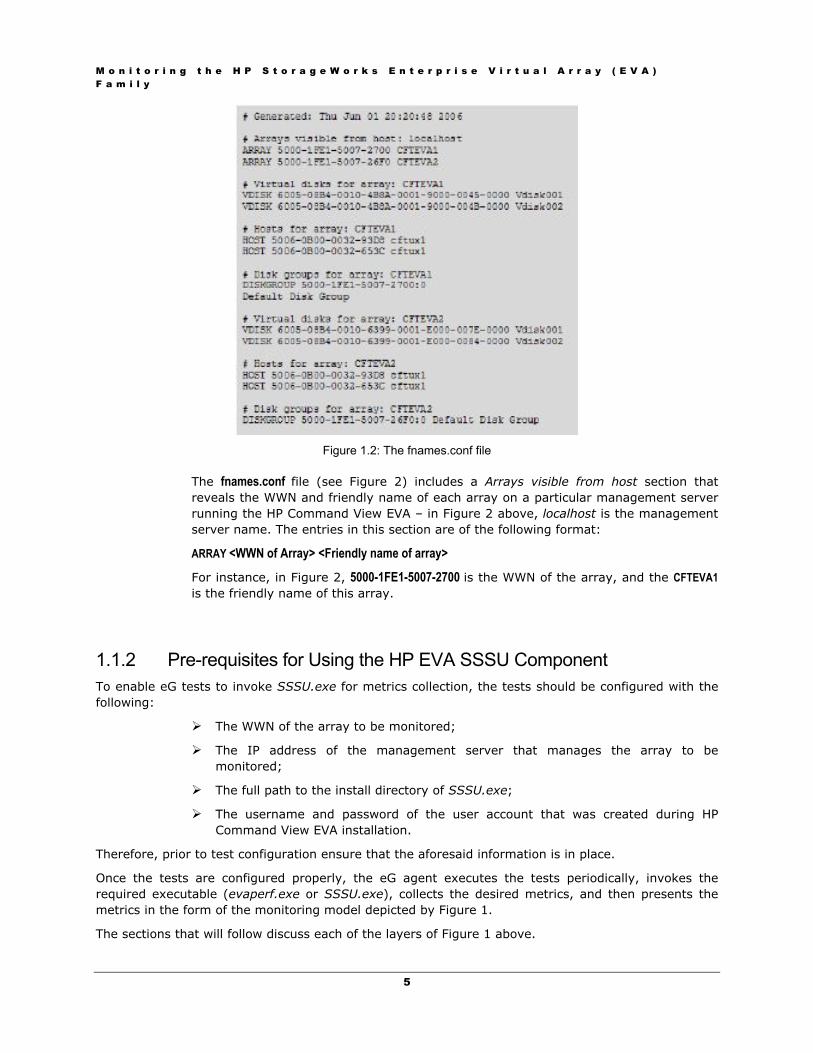
Figure 1.2: The fnames.conf file
The fnames.conf file (see Figure 2) includes a Arrays visible from host section that reveals the WWN and friendly name of each array on a particular management server running the HP Command View EVA – in Figure 2 above, localhost is the management server name. The entries in this section are of the following format:
ARRAY <WWN of Array> <Friendly name of array>
For instance, in Figure 2, 5000-1FE1-5007-2700 is the WWN of the array, and the CFTEVA1 is the friendly name of this array.
1.1.2 Pre-requisites for Using the HP EVA SSSU Component To enable eG tests to invoke SSSU.exe for metrics collection, the tests should be configured with the following:
The WWN of the array to be monitored;
The IP address of the management server that manages the array to be monitored;
The full path to the install directory of SSSU.exe;
The username and password of the user account that was created during HP Command View EVA installation.
Therefore, prior to test configuration ensure that the aforesaid information is in place.
Once the tests are configured properly, the eG agent executes the tests periodically, invokes the required executable (evaperf.exe or SSSU.exe), collects the desired metrics, and then presents the metrics in the form of the monitoring model depicted by Figure 1.
The sections that will follow discuss each of the layers of Figure 1 above.
M o n i t o r i n g t h e H P S t o r a g e W o r k s E n t e r p r i s e V i r t u a l A r r a y ( E V A ) F a m i l y
6
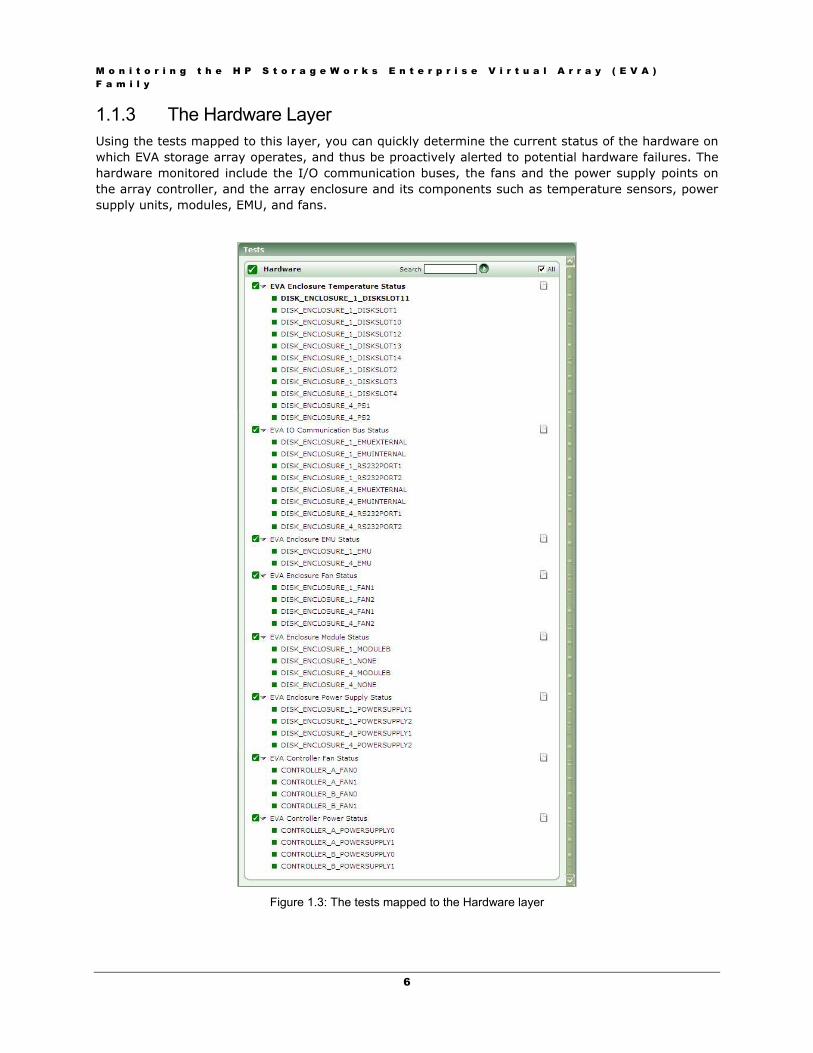
1.1.3 The Hardware Layer Using the tests mapped to this layer, you can quickly determine the current status of the hardware on which EVA storage array operates, and thus be proactively alerted to potential hardware failures. The hardware monitored include the I/O communication buses, the fans and the power supply points on the array controller, and the array enclosure and its components such as temperature sensors, power supply units, modules, EMU, and fans.
Figure 1.3: The tests mapped to the Hardware layer

M o n i t o r i n g t h e H P S t o r a g e W o r k s E n t e r p r i s e V i r t u a l A r r a y ( E V A ) F a m i l y
7
1.1.3.1 EVA Enclosure Temperature Status Test This test reports the current operational state and overall health of each temperature sensor contained within an array enclosure.
Purpose Reports the current operational state and overall health of each temperature sensor contained within an array enclosure
Target of the test
EVA Storage Array
Agent deploying the test
A remote agent
Configurable parameters for the test
1. TEST PERIOD - How often should the test be executed
2. HOST - The host for which the test is to be configured.
3. PORT – Refers to the port used by the EVA SAN device. By default, it is null.
4. ARRAYNAME – Specify the WWN (World wide name) of the array that has been configured for monitoring.
5. EVASYSTEMIP – Specify the IP address of the management server that manages the target array.
6. SSSULOCATION – Specify the full path to the install directory of the HP StorageWorks Storage System Scripting Utility (SSSU.exe).
7. USERNAME and PASSWORD- Specify the credentials of the user account that was created during HP EVA Command View installation.
8. CONFIRM PASSWORD – Confirm the PASSWORD by retyping it here.
9. TIMEOUT – Indicate the duration (in seconds) for which this test should wait for a response from the storage device. By default, this is set to 120 seconds.
Outputs of the test
One set of results for each temperature sensor within an enclosure
Measurement Measurement Unit Interpretation Measurements
made by the test
Operational mode:
Indicates the current operational status of this temperature sensor.
Status The values that this measure can report and the states they indicate are tabulated below:
Value State
1 good or attention or normal
0 Failed or bad
2 Unknown or not available or notinstalled or not_present or unsupported, etc.
M o n i t o r i n g t h e H P S t o r a g e W o r k s E n t e r p r i s e V i r t u a l A r r a y ( E V A ) F a m i l y
8
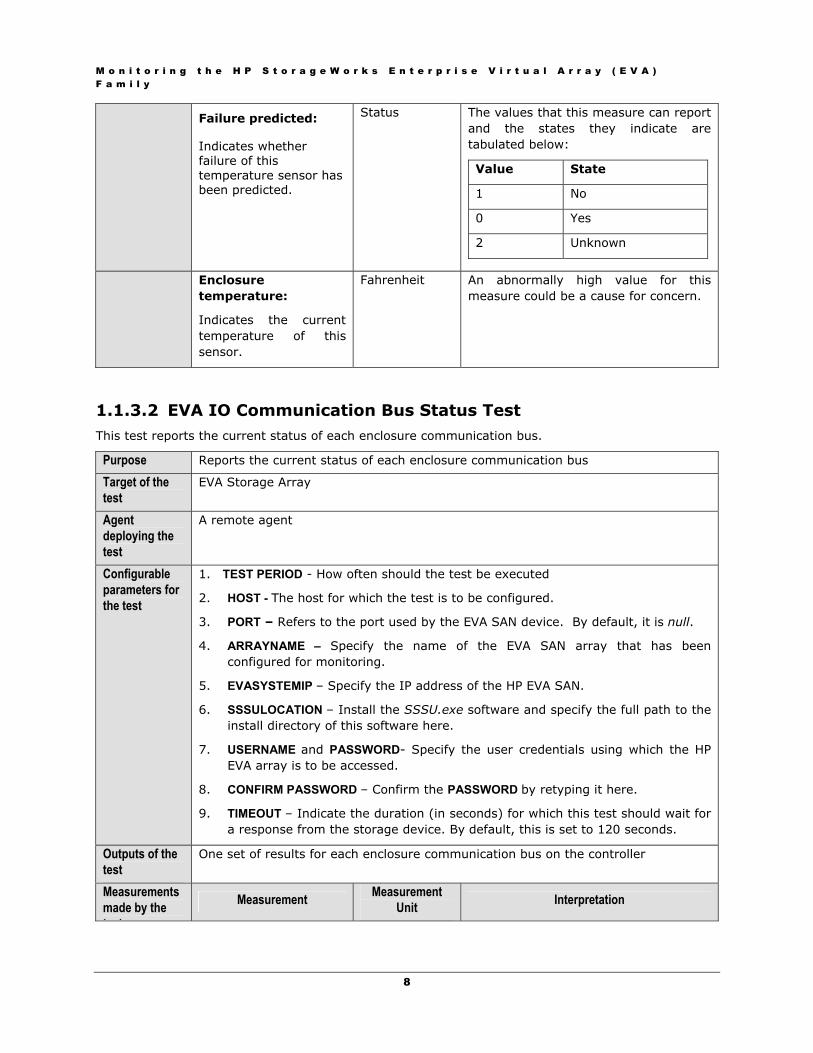
Failure predicted:
Indicates whether failure of this temperature sensor has been predicted.
Status The values that this measure can report and the states they indicate are tabulated below:
Value State
1 No
0 Yes
2 Unknown
Enclosure temperature:
Indicates the current temperature of this sensor.
Fahrenheit An abnormally high value for this measure could be a cause for concern.
1.1.3.2 EVA IO Communication Bus Status Test This test reports the current status of each enclosure communication bus.
Purpose Reports the current status of each enclosure communication bus
Target of the test
EVA Storage Array
Agent deploying the test
A remote agent
Configurable parameters for the test
1. TEST PERIOD - How often should the test be executed
2. HOST - The host for which the test is to be configured.
3. PORT – Refers to the port used by the EVA SAN device. By default, it is null.
4. ARRAYNAME – Specify the name of the EVA SAN array that has been configured for monitoring.
5. EVASYSTEMIP – Specify the IP address of the HP EVA SAN.
6. SSSULOCATION – Install the SSSU.exe software and specify the full path to the install directory of this software here.
7. USERNAME and PASSWORD- Specify the user credentials using which the HP EVA array is to be accessed.
8. CONFIRM PASSWORD – Confirm the PASSWORD by retyping it here.
9. TIMEOUT – Indicate the duration (in seconds) for which this test should wait for a response from the storage device. By default, this is set to 120 seconds.
Outputs of the test
One set of results for each enclosure communication bus on the controller
Measurements made by the t t
Measurement Measurement Unit Interpretation

M o n i t o r i n g t h e H P S t o r a g e W o r k s E n t e r p r i s e V i r t u a l A r r a y ( E V A ) F a m i l y
9
test Operational mode:
Indicates the current operational mode of this bus.
Status The values that this measure can report and the states they indicate are tabulated below:
Value State
1 good or attention or normal
0 Failed or bad
2 Unknown or not available or notinstalled or not_present or unsupported, etc.
Failure predicted:
Indicates whether failure of the bus has been predicted.
Status The values that this measure can report and the states they indicate are tabulated below:
Value State
1 No
0 Yes
2 Unknown
Bus status:
Indicates the current status of this bus.
Status The values that this measure can report and the states they indicate are tabulated below:
Value State
1 enabled
0 disabled
2 unknown
1.1.3.3 EVA Enclosure EMU Status This test reports the current operational state of each enclosure EMU.
Purpose Reports the current operational state of each enclosure EMU
Target of the test
EVA Storage Array
Agent deploying the test
A remote agent

M o n i t o r i n g t h e H P S t o r a g e W o r k s E n t e r p r i s e V i r t u a l A r r a y ( E V A ) F a m i l y
10
Configurable parameters for the test
1. TEST PERIOD - How often should the test be executed
2. HOST - The host for which the test is to be configured.
3. PORT – Refers to the port used by the EVA SAN device. By default, it is null.
4. ARRAYNAME – Specify the name of the EVA SAN array that has been configured for monitoring.
5. EVASYSTEMIP – Specify the IP address of the HP EVA SAN.
6. SSSULOCATION – Install the SSSU.exe software and specify the full path to the install directory of this software here.
7. USERNAME and PASSWORD- Specify the user credentials using which the HP EVA array is to be accessed.
8. CONFIRM PASSWORD – Confirm the PASSWORD by retyping it here.
9. TIMEOUT – Indicate the duration (in seconds) for which this test should wait for a response from the storage device. By default, this is set to 120 seconds.
Outputs of the test
One set of results for each enclosure EMU
Measurement Measurement Unit Interpretation Measurements
made by the test
Operational mode:
Indicates the current operational status of this enclosure EMU.
Status The values that this measure can report and the states they indicate are tabulated below:
Value State
1 good or attention or normal
0 Failed or bad
2 Unknown or not available or notinstalled or not_present or unsupported, etc.
Failure predicted:
Indicates whether failure of this EMU has been predicted.
Status The values that this measure can report and the states they indicate are tabulated below:
Value State
1 No
0 Yes
2 Unknown
M o n i t o r i n g t h e H P S t o r a g e W o r k s E n t e r p r i s e V i r t u a l A r r a y ( E V A ) F a m i l y
11
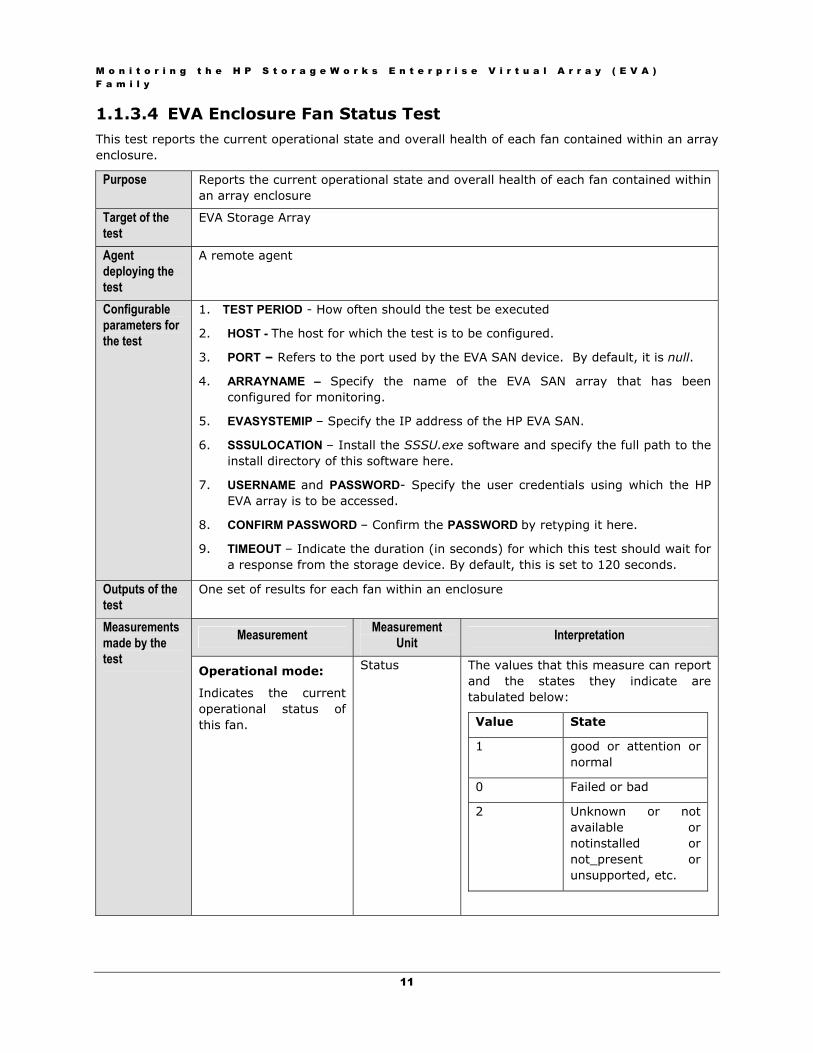
1.1.3.4 EVA Enclosure Fan Status Test This test reports the current operational state and overall health of each fan contained within an array enclosure.
Purpose Reports the current operational state and overall health of each fan contained within an array enclosure
Target of the test
EVA Storage Array
Agent deploying the test
A remote agent
Configurable parameters for the test
1. TEST PERIOD - How often should the test be executed
2. HOST - The host for which the test is to be configured.
3. PORT – Refers to the port used by the EVA SAN device. By default, it is null.
4. ARRAYNAME – Specify the name of the EVA SAN array that has been configured for monitoring.
5. EVASYSTEMIP – Specify the IP address of the HP EVA SAN.
6. SSSULOCATION – Install the SSSU.exe software and specify the full path to the install directory of this software here.
7. USERNAME and PASSWORD- Specify the user credentials using which the HP EVA array is to be accessed.
8. CONFIRM PASSWORD – Confirm the PASSWORD by retyping it here.
9. TIMEOUT – Indicate the duration (in seconds) for which this test should wait for a response from the storage device. By default, this is set to 120 seconds.
Outputs of the test
One set of results for each fan within an enclosure
Measurement Measurement Unit Interpretation Measurements
made by the test
Operational mode:
Indicates the current operational status of this fan.
Status The values that this measure can report and the states they indicate are tabulated below:
Value State
1 good or attention or normal
0 Failed or bad
2 Unknown or not available or notinstalled or not_present or unsupported, etc.

M o n i t o r i n g t h e H P S t o r a g e W o r k s E n t e r p r i s e V i r t u a l A r r a y ( E V A ) F a m i l y
12
Failure predicted:
Indicates whether failure of this fan has been predicted.
Status The values that this measure can report and the states they indicate are tabulated below:
Value State
1 No
0 Yes
2 Unknown
1.1.3.5 EVA Enclosure Module Status This test reports the current operational state and overall health of each module contained within an array enclosure.
Purpose Reports the current operational state and overall health of each module contained within an array enclosure
Target of the test
EVA Storage Array
Agent deploying the test
A remote agent
Configurable parameters for the test
1. TEST PERIOD - How often should the test be executed
2. HOST - The host for which the test is to be configured.
3. PORT – Refers to the port used by the EVA SAN device. By default, it is null.
4. ARRAYNAME – Specify the name of the EVA SAN array that has been configured for monitoring.
5. EVASYSTEMIP – Specify the IP address of the HP EVA SAN.
6. SSSULOCATION – Install the SSSU.exe software and specify the full path to the install directory of this software here.
7. USERNAME and PASSWORD- Specify the user credentials using which the HP EVA array is to be accessed.
8. CONFIRM PASSWORD – Confirm the PASSWORD by retyping it here.
9. TIMEOUT – Indicate the duration (in seconds) for which this test should wait for a response from the storage device. By default, this is set to 120 seconds.
Outputs of the test
One set of results for each enclosure module
Measurements made by the t t
Measurement Measurement Unit Interpretation

M o n i t o r i n g t h e H P S t o r a g e W o r k s E n t e r p r i s e V i r t u a l A r r a y ( E V A ) F a m i l y
13
test Operational mode:
Indicates the current operational status of this enclosure module.
Status The values that this measure can report and the states they indicate are tabulated below:
Value State
1 good or attention or normal
0 Failed or bad
2 Unknown or not available or notinstalled or not_present or unsupported, etc.
Failure predicted:
Indicates whether failure of this module has been predicted.
Status The values that this measure can report and the states they indicate are tabulated below:
Value State
1 No
0 Yes
2 Unknown
1.1.3.6 EVA Enclosure Power Supply Status This test reports the current operational state and overall health of each power supply unit contained within an array enclosure.
Purpose Reports the current operational state and overall health of each power supply unit contained within an array enclosure
Target of the test
EVA Storage Array
Agent deploying the test
A remote agent

M o n i t o r i n g t h e H P S t o r a g e W o r k s E n t e r p r i s e V i r t u a l A r r a y ( E V A ) F a m i l y
14
Configurable parameters for the test
1. TEST PERIOD - How often should the test be executed
2. HOST - The host for which the test is to be configured.
3. PORT – Refers to the port used by the EVA SAN device. By default, it is null.
4. ARRAYNAME – Specify the name of the EVA SAN array that has been configured for monitoring.
5. EVASYSTEMIP – Specify the IP address of the HP EVA SAN.
6. SSSULOCATION – Install the SSSU.exe software and specify the full path to the install directory of this software here.
7. USERNAME and PASSWORD- Specify the user credentials using which the HP EVA array is to be accessed.
8. CONFIRM PASSWORD – Confirm the PASSWORD by retyping it here.
9. TIMEOUT – Indicate the duration (in seconds) for which this test should wait for a response from the storage device. By default, this is set to 120 seconds.
Outputs of the test
One set of results for each power supply unit within an enclosure
Measurement Measurement Unit Interpretation Measurements
made by the test
Operational mode:
Indicates the current operational status of this power supply unit.
Status The values that this measure can report and the states they indicate are tabulated below:
Value State
1 good or attention or normal
0 Failed or bad
2 Unknown or not available or notinstalled or not_present or unsupported, etc.
Failure predicted:
Indicates whether failure of this power supply unit has been predicted.
Status The values that this measure can report and the states they indicate are tabulated below:
Value State
1 No
0 Yes
2 Unknown

M o n i t o r i n g t h e H P S t o r a g e W o r k s E n t e r p r i s e V i r t u a l A r r a y ( E V A ) F a m i l y
15
1.1.3.7 EVA Controller Fan Status Test This test auto-discovers the fans supported by the controller and reports the status of each fan.
Purpose Auto-discovers the fans supported by the controller and reports the status of each fan
Target of the test
EVA Storage Array
Agent deploying the test
A remote agent
Configurable parameters for the test
1. TEST PERIOD - How often should the test be executed
2. HOST - The host for which the test is to be configured.
3. PORT – Refers to the port used by the EVA SAN device. By default, it is null.
4. ARRAYNAME – Specify the name of the EVA SAN array that has been configured for monitoring.
5. EVASYSTEMIP – Specify the IP address of the HP EVA SAN.
6. SSSULOCATION – Install the SSSU.exe software and specify the full path to the install directory of this software here.
7. USERNAME and PASSWORD- Specify the user credentials using which the HP EVA array is to be accessed.
8. CONFIRM PASSWORD – Confirm the PASSWORD by retyping it here.
9. TIMEOUT – Indicate the duration (in seconds) for which this test should wait for a response from the storage device. By default, this is set to 120 seconds.
Outputs of the test
One set of results for each fan on the controller
Measurement Measurement Unit Interpretation Measurements
made by the test
Fan status:
Indicates the current status of this fan.
Status The values that this measure can report and the states they indicate are tabulated below:
Value State
1 Normal, good
0 Abnormal, bad
2 Unknown

M o n i t o r i n g t h e H P S t o r a g e W o r k s E n t e r p r i s e V i r t u a l A r r a y ( E V A ) F a m i l y
16
1.1.3.8 EVA Controller Power Status Test This test auto-discovers the power supply units on the controller and reports the status of each unit.
Purpose Auto-discovers the power supply units on the controller and reports the status of each unit
Target of the test
EVA Storage Array
Agent deploying the test
A remote agent
Configurable parameters for the test
1. TEST PERIOD - How often should the test be executed
2. HOST - The host for which the test is to be configured.
3. PORT – Refers to the port used by the EVA SAN device. By default, it is null.
4. ARRAYNAME – Specify the name of the EVA SAN array that has been configured for monitoring.
5. EVASYSTEMIP – Specify the IP address of the HP EVA SAN.
6. SSSULOCATION – Install the SSSU.exe software and specify the full path to the install directory of this software here.
7. USERNAME and PASSWORD- Specify the user credentials using which the HP EVA array is to be accessed.
8. CONFIRM PASSWORD – Confirm the PASSWORD by retyping it here.
9. TIMEOUT – Indicate the duration (in seconds) for which this test should wait for a response from the storage device. By default, this is set to 120 seconds.
Outputs of the test
One set of results for each fan on the controller
Measurement Measurement Unit Interpretation Measurements
made by the test
Power status:
Indicates the current status of this power supply unit.
Status The values that this measure can report and the states they indicate are tabulated below:
Value State
1 Normal, good
0 Abnormal, bad
2 Unknown

M o n i t o r i n g t h e H P S t o r a g e W o r k s E n t e r p r i s e V i r t u a l A r r a y ( E V A ) F a m i l y
17
1.1.4 The Physical Disk Layer This layer reports the current operational state of the physical disk groups and disks on the HP EVA storage array, and also monitors the traffic to and from each of the disk groups and disks.
Figure 1.4: The tests mapped to the Physical Disk layer
1.1.4.1 EVA Disk Group Status This test reports the current operational state of each disk group on the storage array, monitors the space usage of every group, and enables administrators to accurately identify which disk group is experiencing a space crunch currently.
Purpose Reports the current operational state of each disk group on the storage array, monitors the space usage of every group, and enables administrators to accurately identify which disk group is experiencing a space crunch currently
Target of the test
EVA Storage Array
Agent deploying the test
A remote agent
M o n i t o r i n g t h e H P S t o r a g e W o r k s E n t e r p r i s e V i r t u a l A r r a y ( E V A ) F a m i l y
18
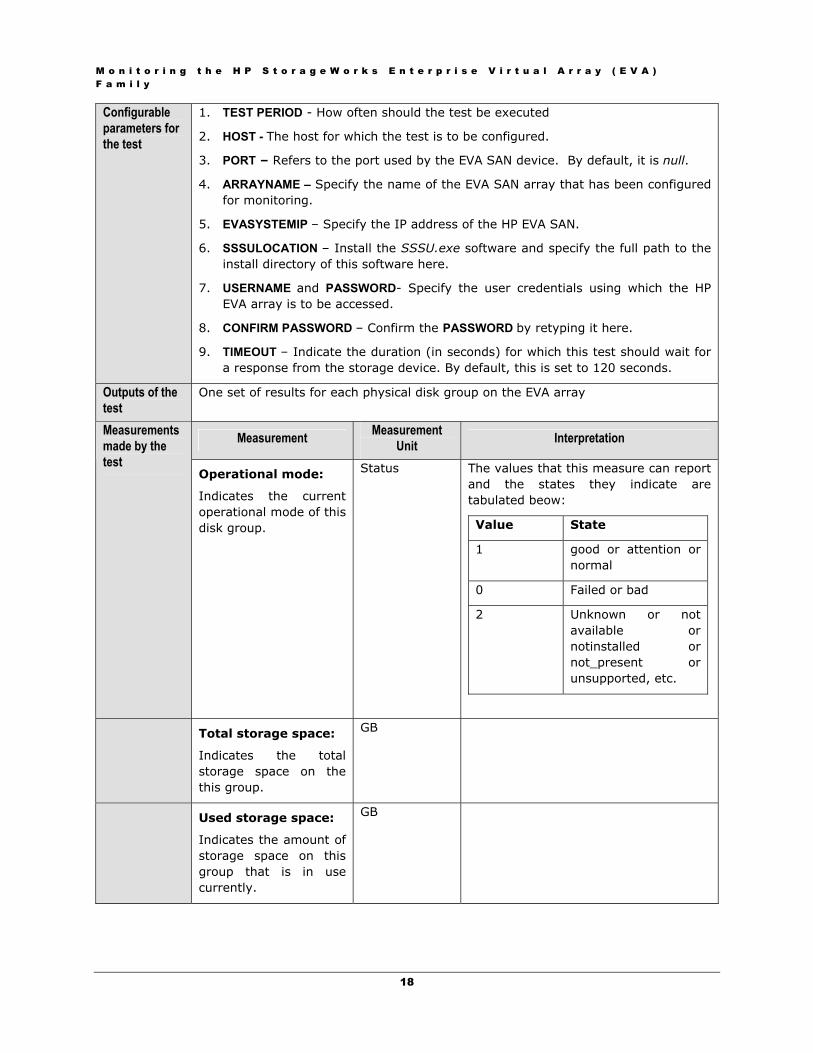
Configurable parameters for the test
1. TEST PERIOD - How often should the test be executed
2. HOST - The host for which the test is to be configured.
3. PORT – Refers to the port used by the EVA SAN device. By default, it is null.
4. ARRAYNAME – Specify the name of the EVA SAN array that has been configured for monitoring.
5. EVASYSTEMIP – Specify the IP address of the HP EVA SAN.
6. SSSULOCATION – Install the SSSU.exe software and specify the full path to the install directory of this software here.
7. USERNAME and PASSWORD- Specify the user credentials using which the HP EVA array is to be accessed.
8. CONFIRM PASSWORD – Confirm the PASSWORD by retyping it here.
9. TIMEOUT – Indicate the duration (in seconds) for which this test should wait for a response from the storage device. By default, this is set to 120 seconds.
Outputs of the test
One set of results for each physical disk group on the EVA array
Measurement Measurement Unit Interpretation Measurements
made by the test
Operational mode:
Indicates the current operational mode of this disk group.
Status The values that this measure can report and the states they indicate are tabulated beow:
Value State
1 good or attention or normal
0 Failed or bad
2 Unknown or not available or notinstalled or not_present or unsupported, etc.
Total storage space:
Indicates the total storage space on the this group.
GB
Used storage space:
Indicates the amount of storage space on this group that is in use currently.
GB

M o n i t o r i n g t h e H P S t o r a g e W o r k s E n t e r p r i s e V i r t u a l A r r a y ( E V A ) F a m i l y
19
Percent free space:
Indicates the percentage of space available for use on the this group.
Percent Ideally, the value of this measure should be high. A low value or a value that decreases consistently over time could indicate a potential space crunch on the group.
Disk count:
Indicates the number of disks in this group.
Number
Drive state:
Indicates the current state of drives in this group.
Status The values that this measure can report and the states they indicate are tabulated below:
Value State
1 Online
0 Offline
2 Unknown
1.1.4.2 EVA Disk Group Traffic Test This test monitors the level of traffic on each physical disk group on an EVA storage array, and helps isolate irregularities in load balancing across the disk groups. Alongside, the test also helps identify which disk group is experiencing processing bottlenecks (if any).
Purpose Monitors the level of traffic on each physical disk group on an EVA storage array, and helps isolate irregularities in load balancing across the disk groups. Alongside, the test also helps identify which disk group is experiencing processing bottlenecks (if any)
Target of the test
EVA Storage Array
Agent deploying the test
A Remote agent

M o n i t o r i n g t h e H P S t o r a g e W o r k s E n t e r p r i s e V i r t u a l A r r a y ( E V A ) F a m i l y
20
Configurable parameters for the test
1. TEST PERIOD - How often should the test be executed
2. HOST - The host for which the test is to be configured.
3. PORT – Refers to the port used by the EVA SAN device. By default, it is null.
4. EVAPERFLOCATION – Specify the full path of the directory in which the evaperf.exe has been installed.
5. ARRAYNAME – Specify the name of the EVA SAN array that has been configured for monitoring.
6. SSSULOCATION – This test uses the EVAPerf software component to auto-discover the disk groups on an EVA storage array. The EVA Disk Group Status test on the other hand uses the SSSU console to discover disk groups. During auto-discovery, the EVAPerf utility reports the WWN names of the disk groups. In contrast, the SSSU console reports the friendly names of the same disk groups.
To ensure that these disk groups are represented using a uniform, consistent notation across the eG monitoring interface, you can optionally configure this test to use the SSSU console (instead of EVAPerf) to perform disk group discovery. This way, the names of disk groups will be the same for this test and the EVA Disk Group Status test. To enable disk group discovery via the SSSU console, configure the full path to the location of the SSSU.exe in the SSSULOCATION text box. If you prefer not to use SSSU.exe for disk group discovery and would rather use the EVAPerf component instead, then, set this parameter to none.
7. USERNAME, PASSWORD, CONFIRM PASSWORD - To use the SSSU.exe for discovering the friendly names of disk groups, specify the user credentials using which the HP EVA array is to be accessed in the USERNAME and PASSWORD text boxes. Confirm the PASSWORD by retyping it here. If you do not wish to use the SSSU.exe, then set these parameters to none.
8. TIMEOUT – Indicate the duration (in seconds) for which this test should wait for a response from the storage device. By default, this is set to 60 seconds.
Outputs of the test
One set of results for each disk group on the EVA storage array
Measurement Measurement Unit Interpretation Measurements
made by the test
Avg read requests:
Indicates the rate at which read requests were made to this physical disk group.
Reqs /sec
Avg write requests:
Indicates the rate at which write requests were received by this physical disk group.
Reqs /sec
M o n i t o r i n g t h e H P S t o r a g e W o r k s E n t e r p r i s e V i r t u a l A r r a y ( E V A ) F a m i l y
21
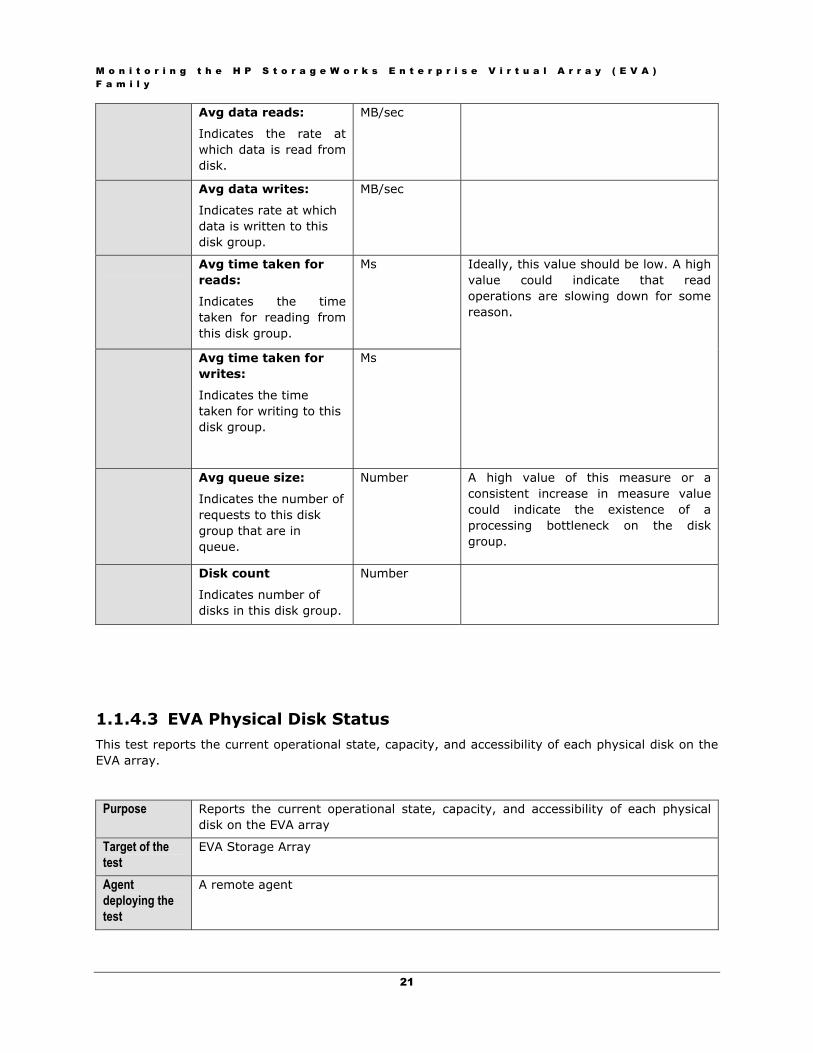
Avg data reads:
Indicates the rate at which data is read from disk.
MB/sec
Avg data writes:
Indicates rate at which data is written to this disk group.
MB/sec
Avg time taken for reads:
Indicates the time taken for reading from this disk group.
Ms
Avg time taken for writes:
Indicates the time taken for writing to this disk group.
Ms
Ideally, this value should be low. A high value could indicate that read operations are slowing down for some reason.
Avg queue size:
Indicates the number of requests to this disk group that are in queue.
Number A high value of this measure or a consistent increase in measure value could indicate the existence of a processing bottleneck on the disk group.
Disk count
Indicates number of disks in this disk group.
Number
1.1.4.3 EVA Physical Disk Status This test reports the current operational state, capacity, and accessibility of each physical disk on the EVA array.
Purpose Reports the current operational state, capacity, and accessibility of each physical disk on the EVA array
Target of the test
EVA Storage Array
Agent deploying the test
A remote agent

M o n i t o r i n g t h e H P S t o r a g e W o r k s E n t e r p r i s e V i r t u a l A r r a y ( E V A ) F a m i l y
22
Configurable parameters for the test
1. TEST PERIOD - How often should the test be executed
2. HOST - The host for which the test is to be configured.
3. PORT – Refers to the port used by the EVA SAN device. By default, it is null.
4. ARRAYNAME – Specify the name of the EVA SAN array that has been configured for monitoring.
5. EVASYSTEMIP – Specify the IP address of the HP EVA SAN.
6. SSSULOCATION – Install the SSSU.exe software and specify the full path to the install directory of this software here.
7. USERNAME and PASSWORD- Specify the user credentials using which the HP EVA array is to be accessed.
8. CONFIRM PASSWORD – Confirm the PASSWORD by retyping it here.
9. TIMEOUT – Indicate the duration (in seconds) for which this test should wait for a response from the storage device. By default, this is set to 120 seconds.
Outputs of the test
One set of results for each physical disk on the EVA array
Measurement Measurement Unit Interpretation Measurements
made by the test
Operational mode:
Indicates the current operational mode of this disk.
Status The values that this measure can report and the states they indicate are tabulated below:
Value State
1 good or attention or normal
0 Failed or bad
2 Unknown or not available or notinstalled or not_present or unsupported, etc.
Formatted capacity:
Indicates the current formatted capacity of this disk.
Millions of blocks
M o n i t o r i n g t h e H P S t o r a g e W o r k s E n t e r p r i s e V i r t u a l A r r a y ( E V A ) F a m i l y
23
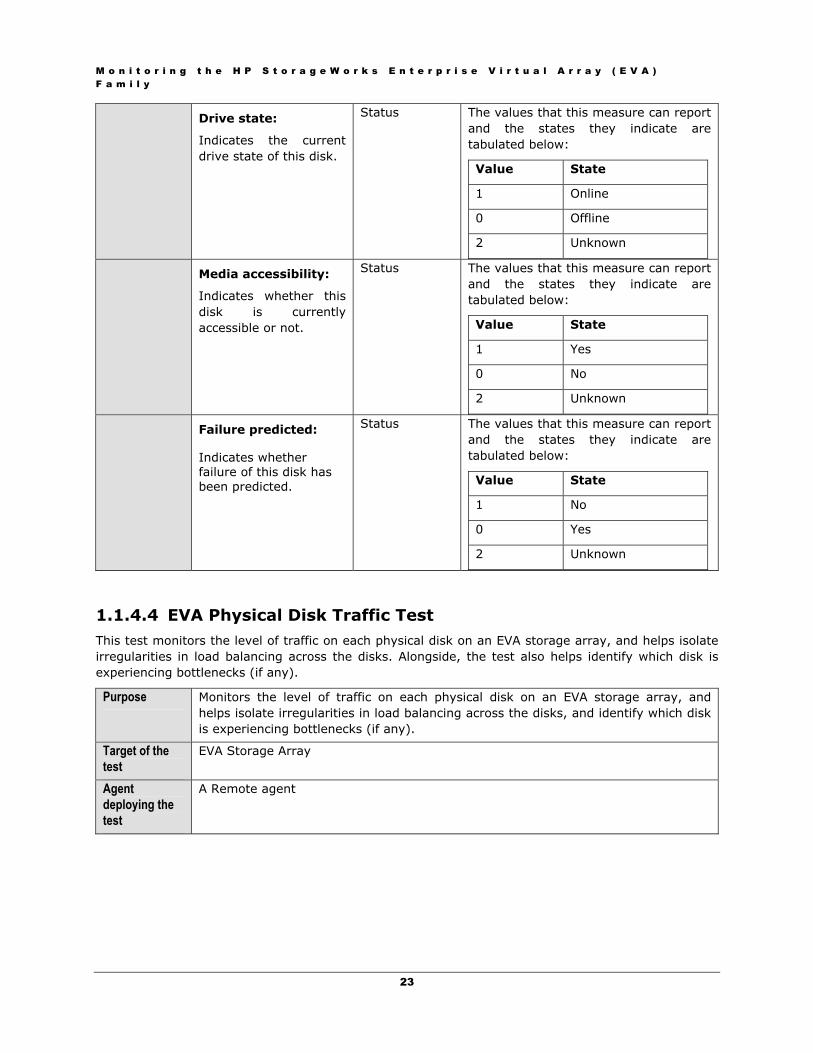
Drive state:
Indicates the current drive state of this disk.
Status The values that this measure can report and the states they indicate are tabulated below:
Value State
1 Online
0 Offline
2 Unknown
Media accessibility:
Indicates whether this disk is currently accessible or not.
Status The values that this measure can report and the states they indicate are tabulated below:
Value State
1 Yes
0 No
2 Unknown
Failure predicted:
Indicates whether failure of this disk has been predicted.
Status The values that this measure can report and the states they indicate are tabulated below:
Value State
1 No
0 Yes
2 Unknown
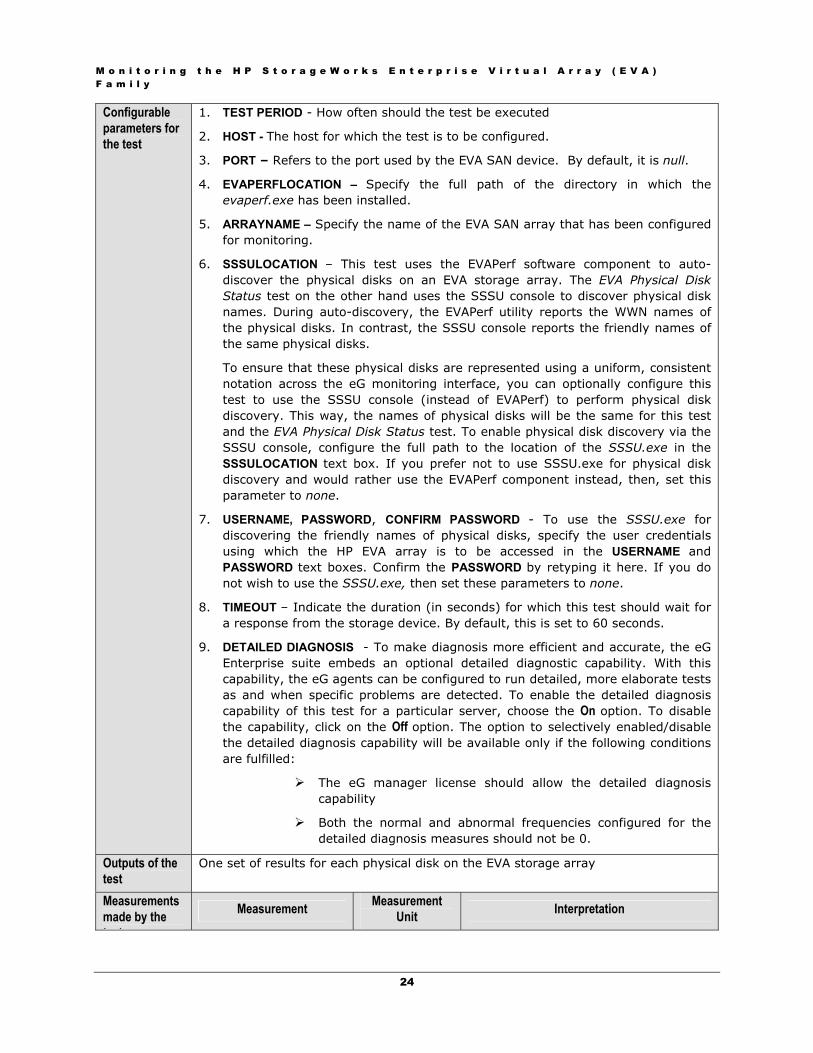
1.1.4.4 EVA Physical Disk Traffic Test This test monitors the level of traffic on each physical disk on an EVA storage array, and helps isolate irregularities in load balancing across the disks. Alongside, the test also helps identify which disk is experiencing bottlenecks (if any).
Purpose Monitors the level of traffic on each physical disk on an EVA storage array, and helps isolate irregularities in load balancing across the disks, and identify which disk is experiencing bottlenecks (if any).
Target of the test
EVA Storage Array
Agent deploying the test
A Remote agent
M o n i t o r i n g t h e H P S t o r a g e W o r k s E n t e r p r i s e V i r t u a l A r r a y ( E V A ) F a m i l y
24
Configurable parameters for the test
1. TEST PERIOD - How often should the test be executed
2. HOST - The host for which the test is to be configured.
3. PORT – Refers to the port used by the EVA SAN device. By default, it is null.
4. EVAPERFLOCATION – Specify the full path of the directory in which the evaperf.exe has been installed.
5. ARRAYNAME – Specify the name of the EVA SAN array that has been configured for monitoring.
6. SSSULOCATION – This test uses the EVAPerf software component to auto-discover the physical disks on an EVA storage array. The EVA Physical Disk Status test on the other hand uses the SSSU console to discover physical disk names. During auto-discovery, the EVAPerf utility reports the WWN names of the physical disks. In contrast, the SSSU console reports the friendly names of the same physical disks.
To ensure that these physical disks are represented using a uniform, consistent notation across the eG monitoring interface, you can optionally configure this test to use the SSSU console (instead of EVAPerf) to perform physical disk discovery. This way, the names of physical disks will be the same for this test and the EVA Physical Disk Status test. To enable physical disk discovery via the SSSU console, configure the full path to the location of the SSSU.exe in the SSSULOCATION text box. If you prefer not to use SSSU.exe for physical disk discovery and would rather use the EVAPerf component instead, then, set this parameter to none.
7. USERNAME, PASSWORD, CONFIRM PASSWORD - To use the SSSU.exe for discovering the friendly names of physical disks, specify the user credentials using which the HP EVA array is to be accessed in the USERNAME and PASSWORD text boxes. Confirm the PASSWORD by retyping it here. If you do not wish to use the SSSU.exe, then set these parameters to none.
8. TIMEOUT – Indicate the duration (in seconds) for which this test should wait for a response from the storage device. By default, this is set to 60 seconds.
9. DETAILED DIAGNOSIS - To make diagnosis more efficient and accurate, the eG Enterprise suite embeds an optional detailed diagnostic capability. With this capability, the eG agents can be configured to run detailed, more elaborate tests as and when specific problems are detected. To enable the detailed diagnosis capability of this test for a particular server, choose the On option. To disable the capability, click on the Off option. The option to selectively enabled/disable the detailed diagnosis capability will be available only if the following conditions are fulfilled:
The eG manager license should allow the detailed diagnosis capability
Both the normal and abnormal frequencies configured for the detailed diagnosis measures should not be 0.
Outputs of the test
One set of results for each physical disk on the EVA storage array
Measurements made by the t t
Measurement Measurement Unit Interpretation
M o n i t o r i n g t h e H P S t o r a g e W o r k s E n t e r p r i s e V i r t u a l A r r a y ( E V A ) F a m i l y
25
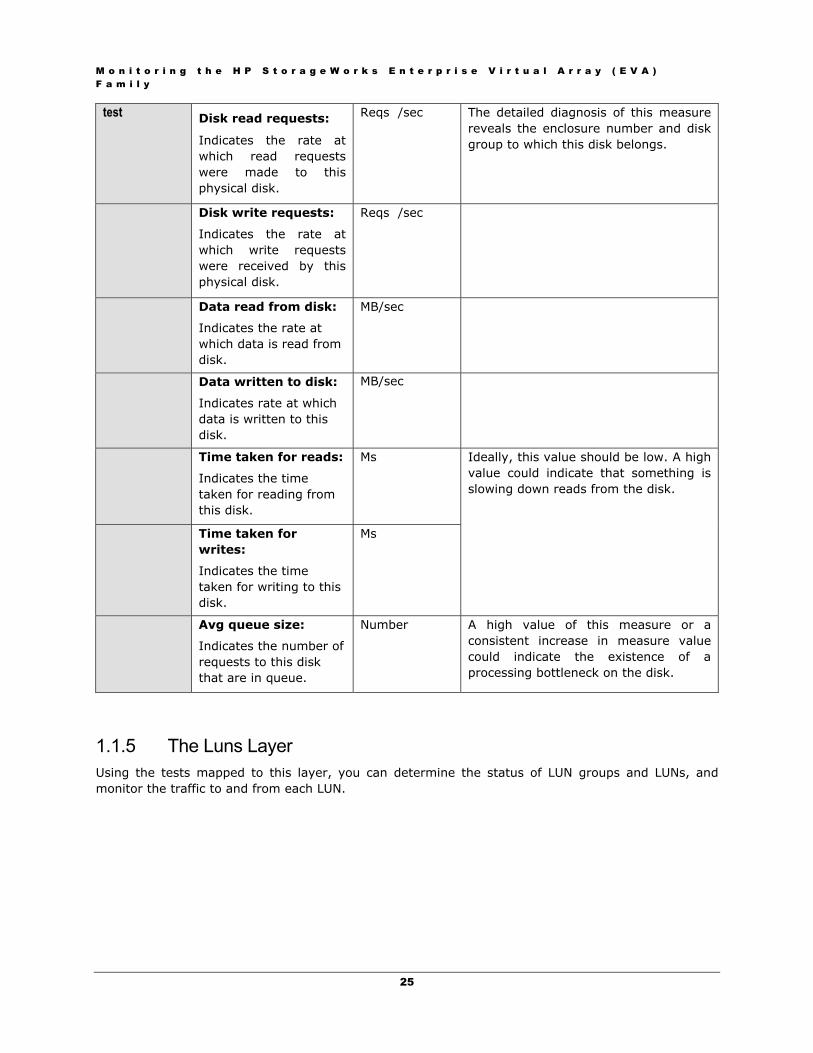
test Disk read requests:
Indicates the rate at which read requests were made to this physical disk.
Reqs /sec The detailed diagnosis of this measure reveals the enclosure number and disk group to which this disk belongs.
Disk write requests:
Indicates the rate at which write requests were received by this physical disk.
Reqs /sec
Data read from disk:
Indicates the rate at which data is read from disk.
MB/sec
Data written to disk:
Indicates rate at which data is written to this disk.
MB/sec
Time taken for reads:
Indicates the time taken for reading from this disk.
Ms
Time taken for writes:
Indicates the time taken for writing to this disk.
Ms
Ideally, this value should be low. A high value could indicate that something is slowing down reads from the disk.
Avg queue size:
Indicates the number of requests to this disk that are in queue.
Number A high value of this measure or a consistent increase in measure value could indicate the existence of a processing bottleneck on the disk.
1.1.5 The Luns Layer Using the tests mapped to this layer, you can determine the status of LUN groups and LUNs, and monitor the traffic to and from each LUN.
M o n i t o r i n g t h e H P S t o r a g e W o r k s E n t e r p r i s e V i r t u a l A r r a y ( E V A ) F a m i l y
26
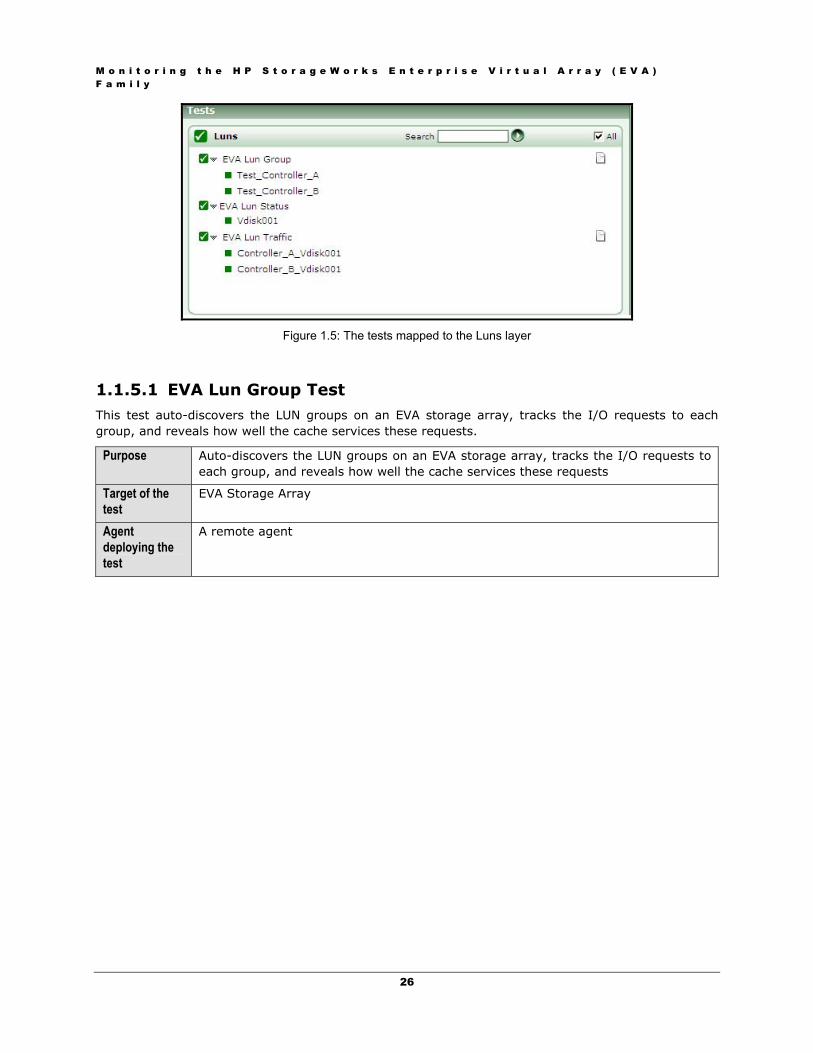
Figure 1.5: The tests mapped to the Luns layer
1.1.5.1 EVA Lun Group Test This test auto-discovers the LUN groups on an EVA storage array, tracks the I/O requests to each group, and reveals how well the cache services these requests.
Purpose Auto-discovers the LUN groups on an EVA storage array, tracks the I/O requests to each group, and reveals how well the cache services these requests
Target of the test
EVA Storage Array
Agent deploying the test
A remote agent
M o n i t o r i n g t h e H P S t o r a g e W o r k s E n t e r p r i s e V i r t u a l A r r a y ( E V A ) F a m i l y
27
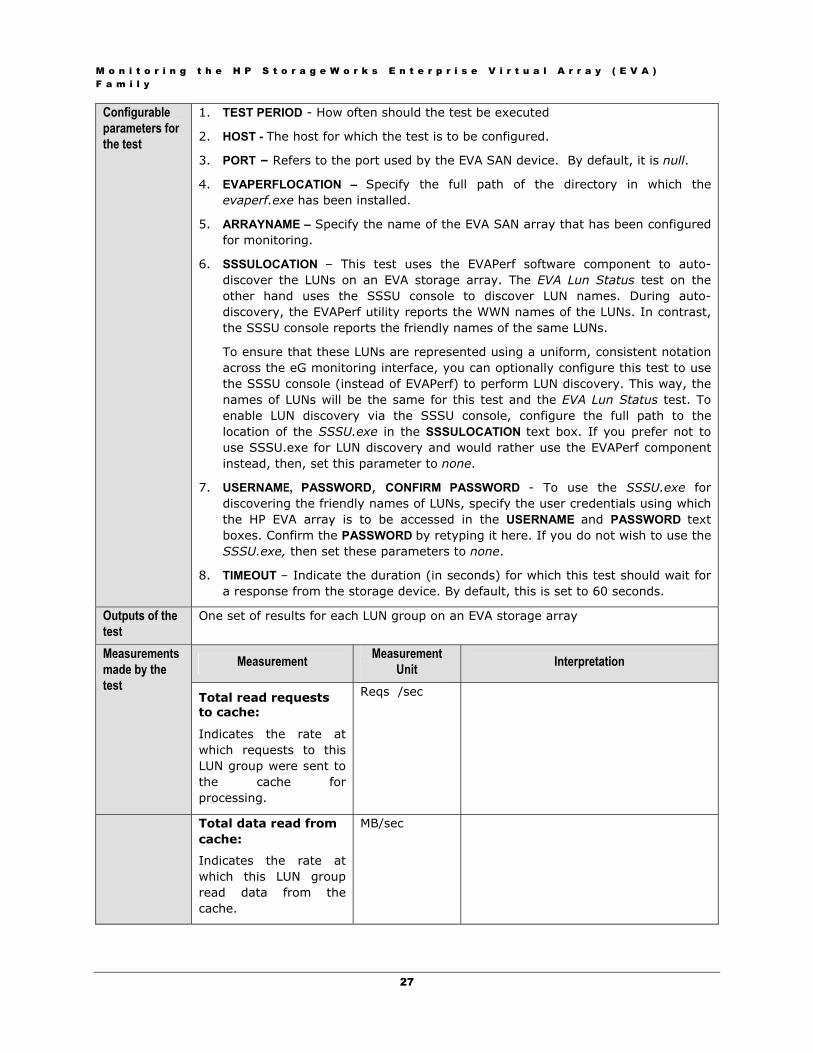
Configurable parameters for the test
1. TEST PERIOD - How often should the test be executed
2. HOST - The host for which the test is to be configured.
3. PORT – Refers to the port used by the EVA SAN device. By default, it is null.
4. EVAPERFLOCATION – Specify the full path of the directory in which the evaperf.exe has been installed.
5. ARRAYNAME – Specify the name of the EVA SAN array that has been configured for monitoring.
6. SSSULOCATION – This test uses the EVAPerf software component to auto-discover the LUNs on an EVA storage array. The EVA Lun Status test on the other hand uses the SSSU console to discover LUN names. During auto-discovery, the EVAPerf utility reports the WWN names of the LUNs. In contrast, the SSSU console reports the friendly names of the same LUNs.
To ensure that these LUNs are represented using a uniform, consistent notation across the eG monitoring interface, you can optionally configure this test to use the SSSU console (instead of EVAPerf) to perform LUN discovery. This way, the names of LUNs will be the same for this test and the EVA Lun Status test. To enable LUN discovery via the SSSU console, configure the full path to the location of the SSSU.exe in the SSSULOCATION text box. If you prefer not to use SSSU.exe for LUN discovery and would rather use the EVAPerf component instead, then, set this parameter to none.
7. USERNAME, PASSWORD, CONFIRM PASSWORD - To use the SSSU.exe for discovering the friendly names of LUNs, specify the user credentials using which the HP EVA array is to be accessed in the USERNAME and PASSWORD text boxes. Confirm the PASSWORD by retyping it here. If you do not wish to use the SSSU.exe, then set these parameters to none.
8. TIMEOUT – Indicate the duration (in seconds) for which this test should wait for a response from the storage device. By default, this is set to 60 seconds.
Outputs of the test
One set of results for each LUN group on an EVA storage array
Measurement Measurement Unit Interpretation Measurements
made by the test
Total read requests to cache:
Indicates the rate at which requests to this LUN group were sent to the cache for processing.
Reqs /sec
Total data read from cache:
Indicates the rate at which this LUN group read data from the cache.
MB/sec

M o n i t o r i n g t h e H P S t o r a g e W o r k s E n t e r p r i s e V i r t u a l A r r a y ( E V A ) F a m i l y
28
Avg time taken for reading from cache:
Indicates the average time taken for reading from cache.
Ms A high value could indicate an I/O bottleneck.
Total read requests served by disk:
Indicates the rate at which read requests to the LUN group were serviced by the disk and not the cache.
Reqs/sec
Total data read from disk:
Indicates the rate at which data was read from the physical disk and not the cache..
MB/sec
Ideally, this rate should be low. A high rate indicates a large number of direct disk accesses, which in turn may expose the physical disk to overuse, and may increase the processing overheads.
Avg time taken for reading from disk:
Indicates the time taken by this test for reading from the physical disk.
Ms
Total write request rate:
Indicates the rate at which write requests to the LUN group were sent to the cache.
Reqs/sec
Total data written to cache:
Indicates the rate at which data was written to the cache.
MB/sec
Avg time taken for writing to cache:
Indicates the time taken for writing to the cache.
Ms A high value could indicate an I/O bottleneck.
1.1.5.2 EVA Lun Status Test This test reports the current operational state of each LUN on the EVA storage array, and also the current state of the read, write, and mirror caches.
M o n i t o r i n g t h e H P S t o r a g e W o r k s E n t e r p r i s e V i r t u a l A r r a y ( E V A ) F a m i l y
29
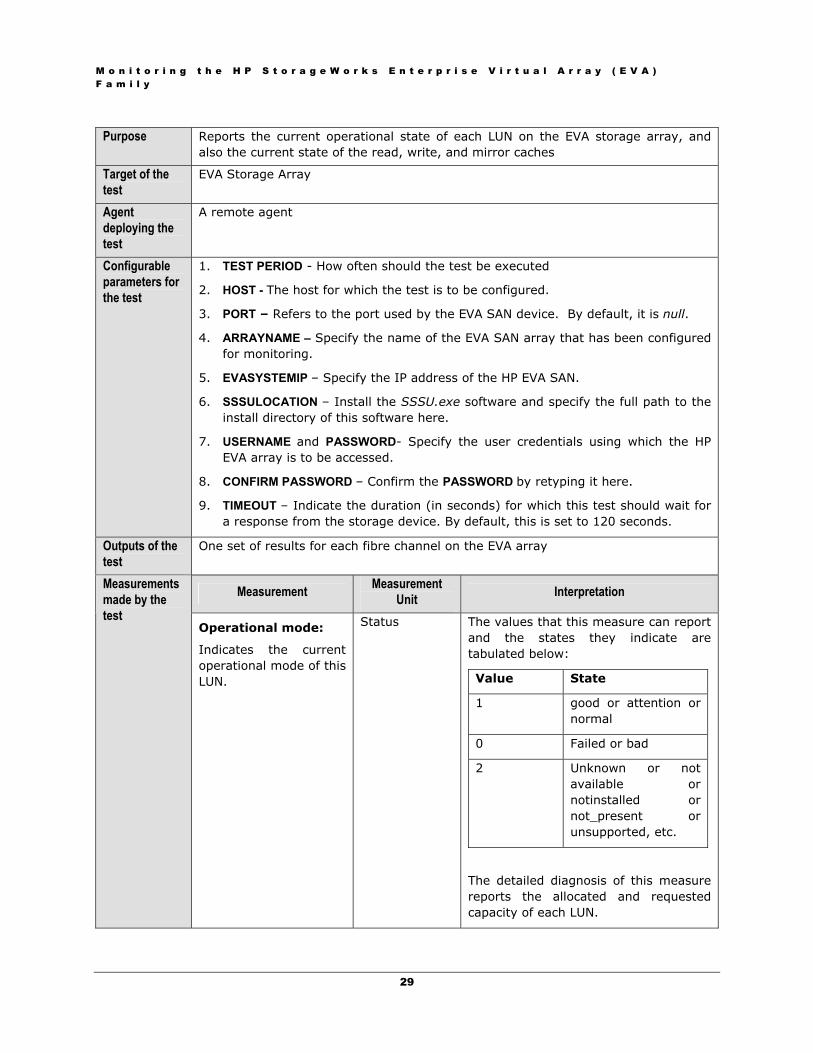
Purpose Reports the current operational state of each LUN on the EVA storage array, and also the current state of the read, write, and mirror caches
Target of the test
EVA Storage Array
Agent deploying the test
A remote agent
Configurable parameters for the test
1. TEST PERIOD - How often should the test be executed
2. HOST - The host for which the test is to be configured.
3. PORT – Refers to the port used by the EVA SAN device. By default, it is null.
4. ARRAYNAME – Specify the name of the EVA SAN array that has been configured for monitoring.
5. EVASYSTEMIP – Specify the IP address of the HP EVA SAN.
6. SSSULOCATION – Install the SSSU.exe software and specify the full path to the install directory of this software here.
7. USERNAME and PASSWORD- Specify the user credentials using which the HP EVA array is to be accessed.
8. CONFIRM PASSWORD – Confirm the PASSWORD by retyping it here.
9. TIMEOUT – Indicate the duration (in seconds) for which this test should wait for a response from the storage device. By default, this is set to 120 seconds.
Outputs of the test
One set of results for each fibre channel on the EVA array
Measurement Measurement Unit Interpretation Measurements
made by the test
Operational mode:
Indicates the current operational mode of this LUN.
Status The values that this measure can report and the states they indicate are tabulated below:
Value State
1 good or attention or normal
0 Failed or bad
2 Unknown or not available or notinstalled or not_present or unsupported, etc.
The detailed diagnosis of this measure reports the allocated and requested capacity of each LUN.

M o n i t o r i n g t h e H P S t o r a g e W o r k s E n t e r p r i s e V i r t u a l A r r a y ( E V A ) F a m i l y
30
Read cache state:
Indicates the current state of the read cache.
Status The values that this measure can report and the states they indicate are tabulated below:
Value State
1 Enable
0 Disable
2 Unknown
Write cache state:
Indicates the current state of the write cache.
Status The values that this measure can report and the states they indicate are tabulated below:
Value State
1 Writeback, writethrough
0 Failed, disabled
2 Unknown
Mirror cache state:
Indicates the current state of the mirror cache.
Status The values that this measure can report and the states they indicate are tabulated below:
Value State
1 mirrored
0 notmirrored
2 Unknown
1.1.5.3 EVA Lun Traffic Test LUN is a Logical Unit Number. A LUN represents a logical abstraction or, if you prefer, virtualization layer between the physical disk device/volume and the applications. They are also referred to as virtual disks. A virtual disk can also be a Snapshot, Snapclone, or replication volume.
This test auto-discovers the LUNs on an EVA storage array, tracks the I/O requests to each LUN, and reveals how well the cache services these requests.
Purpose Auto-discovers the LUNs on an EVA storage array, and reveals how well the cache services I/O requests to each LUN
Target of the test
EVA Storage Array
Agent deploying the test
A remote agent
M o n i t o r i n g t h e H P S t o r a g e W o r k s E n t e r p r i s e V i r t u a l A r r a y ( E V A ) F a m i l y
31
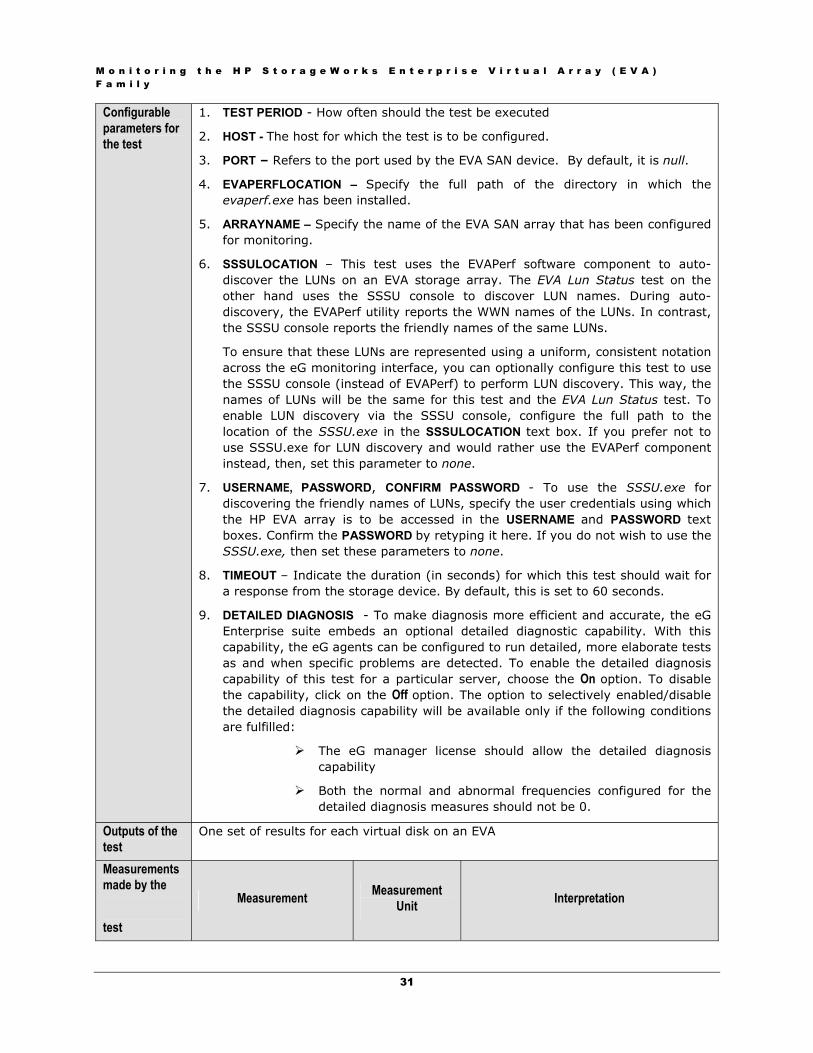
Configurable parameters for the test
1. TEST PERIOD - How often should the test be executed
2. HOST - The host for which the test is to be configured.
3. PORT – Refers to the port used by the EVA SAN device. By default, it is null.
4. EVAPERFLOCATION – Specify the full path of the directory in which the evaperf.exe has been installed.
5. ARRAYNAME – Specify the name of the EVA SAN array that has been configured for monitoring.
6. SSSULOCATION – This test uses the EVAPerf software component to auto-discover the LUNs on an EVA storage array. The EVA Lun Status test on the other hand uses the SSSU console to discover LUN names. During auto-discovery, the EVAPerf utility reports the WWN names of the LUNs. In contrast, the SSSU console reports the friendly names of the same LUNs.
To ensure that these LUNs are represented using a uniform, consistent notation across the eG monitoring interface, you can optionally configure this test to use the SSSU console (instead of EVAPerf) to perform LUN discovery. This way, the names of LUNs will be the same for this test and the EVA Lun Status test. To enable LUN discovery via the SSSU console, configure the full path to the location of the SSSU.exe in the SSSULOCATION text box. If you prefer not to use SSSU.exe for LUN discovery and would rather use the EVAPerf component instead, then, set this parameter to none.
7. USERNAME, PASSWORD, CONFIRM PASSWORD - To use the SSSU.exe for discovering the friendly names of LUNs, specify the user credentials using which the HP EVA array is to be accessed in the USERNAME and PASSWORD text boxes. Confirm the PASSWORD by retyping it here. If you do not wish to use the SSSU.exe, then set these parameters to none.
8. TIMEOUT – Indicate the duration (in seconds) for which this test should wait for a response from the storage device. By default, this is set to 60 seconds.
9. DETAILED DIAGNOSIS - To make diagnosis more efficient and accurate, the eG Enterprise suite embeds an optional detailed diagnostic capability. With this capability, the eG agents can be configured to run detailed, more elaborate tests as and when specific problems are detected. To enable the detailed diagnosis capability of this test for a particular server, choose the On option. To disable the capability, click on the Off option. The option to selectively enabled/disable the detailed diagnosis capability will be available only if the following conditions are fulfilled:
The eG manager license should allow the detailed diagnosis capability
Both the normal and abnormal frequencies configured for the detailed diagnosis measures should not be 0.
Outputs of the test
One set of results for each virtual disk on an EVA
Measurements made by the test
Measurement Measurement Unit Interpretation

M o n i t o r i n g t h e H P S t o r a g e W o r k s E n t e r p r i s e V i r t u a l A r r a y ( E V A ) F a m i l y
32
Read requests to cache:
Indicates the rate at which requests to the LUN were sent to the cache for processing.
Reqs/Sec The detailed diagnosis of this measure reveals the LUN group to which this LUN belongs.
Data read from cache:
Indicates the rate at which this LUN read data from the cache.
MB/sec
Time taken for reading from cache:
Indicates the time taken by this LUN for reading from the cache.
Ms A high value could indicate an I/O bottleneck.
Read requests served by disk:
Indicates the rate at which read requests to the LUN were serviced by the disk and not the cache.
Reqs/sec
Data read from disk:
Indicates the rate at which data was read from the physical disk and not the cache.
MB/sec
Ideally, this rate should be low. A high rate indicates a large number of direct disk accesses, which in turn may expose the physical disk to overuse, and may increase the processing overheads.
Time taken for reading from disk:
Indicates the time taken by this test for reading from the physical disk.
Ms
Write request rate:
Indicates the rate at which write requests to the LUN were sent to the cache.
Reqs/sec
Data written to cache:
Indicates the rate at which data was written to the cache.
MB/sec

M o n i t o r i n g t h e H P S t o r a g e W o r k s E n t e r p r i s e V i r t u a l A r r a y ( E V A ) F a m i l y
33
Time taken for writing to cache:
Indicates the time taken for writing to the cache.
Ms A high value could indicate an I/O bottleneck.
1.1.6 The Network Layer This layer reveals the current state and overall health of the device ports and fibre channel ports on the storage controller.
Figure 1.6: The tests mapped to the LUNs layer
1.1.6.1 EVA Controller to Device Port Status Test This test reports the current operational mode of each device port on the controller.
M o n i t o r i n g t h e H P S t o r a g e W o r k s E n t e r p r i s e V i r t u a l A r r a y ( E V A ) F a m i l y
34
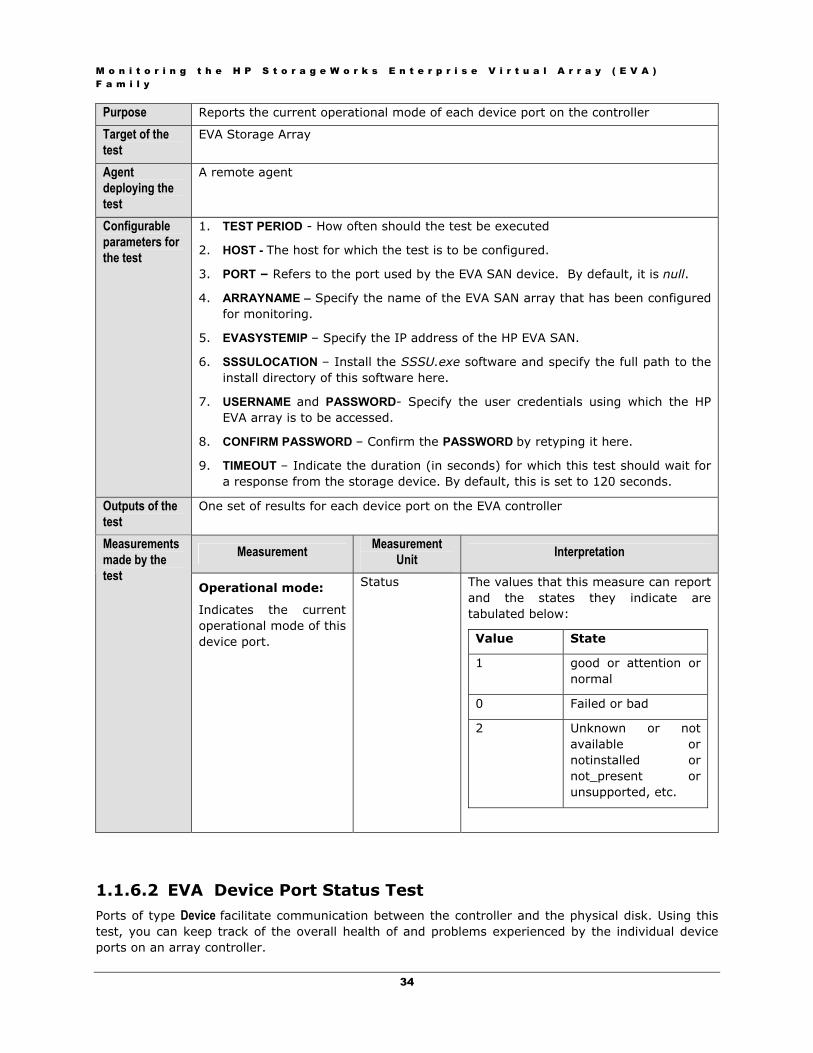
Purpose Reports the current operational mode of each device port on the controller
Target of the test
EVA Storage Array
Agent deploying the test
A remote agent
Configurable parameters for the test
1. TEST PERIOD - How often should the test be executed
2. HOST - The host for which the test is to be configured.
3. PORT – Refers to the port used by the EVA SAN device. By default, it is null.
4. ARRAYNAME – Specify the name of the EVA SAN array that has been configured for monitoring.
5. EVASYSTEMIP – Specify the IP address of the HP EVA SAN.
6. SSSULOCATION – Install the SSSU.exe software and specify the full path to the install directory of this software here.
7. USERNAME and PASSWORD- Specify the user credentials using which the HP EVA array is to be accessed.
8. CONFIRM PASSWORD – Confirm the PASSWORD by retyping it here.
9. TIMEOUT – Indicate the duration (in seconds) for which this test should wait for a response from the storage device. By default, this is set to 120 seconds.
Outputs of the test
One set of results for each device port on the EVA controller
Measurement Measurement Unit Interpretation Measurements
made by the test
Operational mode:
Indicates the current operational mode of this device port.
Status The values that this measure can report and the states they indicate are tabulated below:
Value State
1 good or attention or normal
0 Failed or bad
2 Unknown or not available or notinstalled or not_present or unsupported, etc.
1.1.6.2 EVA Device Port Status Test Ports of type Device facilitate communication between the controller and the physical disk. Using this test, you can keep track of the overall health of and problems experienced by the individual device ports on an array controller.

M o n i t o r i n g t h e H P S t o r a g e W o r k s E n t e r p r i s e V i r t u a l A r r a y ( E V A ) F a m i l y
35
Purpose Keeps track of the overall health of and problems experienced by the individual device ports on an array controller
Target of the test
EVA Storage Array
Agent deploying the test
A remote agent
Configurable parameters for the test
1. TEST PERIOD - How often should the test be executed
2. HOST - The host for which the test is to be configured.
3. PORT – Refers to the port used by the EVA SAN device. By default, it is null.
4. EVAPERFLOCATION – Specify the full path of the directory in which the evaperf.exe has been installed.
5. ARRAYNAME – Specify the name of the EVA SAN array that has been configured for monitoring.
6. SSSULOCATION – This test uses the EVAPerf software component to auto-discover the device ports on an EVA storage array. The EVA Controller to Device Port Status test on the other hand uses the SSSU console to discover device pors. During auto-discovery, the EVAPerf utility reports the WWN names of the device ports. In contrast, the SSSU console reports the friendly names of the same device ports.
To ensure that device port references are uniform and consistent across tests, you can optionally configure this test to use the SSSU console (instead of EVAPerf) to perform device port discovery. This way, the names of device ports will be the same for this test and the EVA Controller to Device Port Status test. To enable device port discovery via the SSSU console, configure the full path to the location of the SSSU.exe in the SSSULOCATION text box. If you prefer not to use SSSU.exe for discovering device ports and would rather use the EVAPerf component instead, then, set this parameter to none.
7. USERNAME, PASSWORD, CONFIRM PASSWORD - To use the SSSU.exe for discovering the friendly names of device ports, specify the user credentials using which the HP EVA array is to be accessed in the USERNAME and PASSWORD text boxes. Confirm the PASSWORD by retyping it here. If you do not wish to use the SSSU.exe, then set these parameters to none.
8. TIMEOUT – Indicate the duration (in seconds) for which this test should wait for a response from the storage device. By default, this is set to 60 seconds.
Outputs of the test
One set of results for each device port on the controller
Measurement Measurement Unit Interpretation
Measurements made by the test
Port status:
Indicates the status of this device port.
Status The value 1 for this measure indicates that the port is up and the value 0 indicates the port is down.

M o n i t o r i n g t h e H P S t o r a g e W o r k s E n t e r p r i s e V i r t u a l A r r a y ( E V A ) F a m i l y
36
Signal loss count:
Indicates the number of times signal losses have occurred on this port during the last measurement period.
Number Ideally, this value should be 0.
Frames with invalid words received:
Indicates the number of frames possessing invalid words that were received by this port during the last measurement period.
Number Ideally, this value should be 0.
Synchronization loss count:
Indicates the number of times synchronization losses that occurred on this port during the last measurement period.
Number Ideally, this value should be 0.
Link failures:
Indicates the number of times link failures occurred on this port during the last measurement period.
Number Ideally, this value should be 0.
Frames rcvd with EOF delimiter:
Indicates the number of frames received with EOF delimiter during the last measurement period.
Number Ideally, this value should be 0.
Frames discarded:
Indicates the number of frames discarded during the last measurement period.
Number Ideally, this value should be 0.
Frames rcvd with invalid CRC:
Indicates the number of frames received with invalid CRC during the last measurement period.
Number Ideally, this value should be 0.

M o n i t o r i n g t h e H P S t o r a g e W o r k s E n t e r p r i s e V i r t u a l A r r a y ( E V A ) F a m i l y
37
Protocol errors:
Indicates the number of protocol errors that occurred during the last measurement period.
Number Ideally, this value should be 0.
1.1.6.3 EVA FC Port Status Test This test indicates the current state and overall health of each Fibre Channel port on the EVA storage array.
Purpose Indicates the current state and overall health of each Fibre Channel port on the EVA storage array
Target of the test
EVA Storage Array
Agent deploying the test
A remote agent
Configurable parameters for the test
1. TEST PERIOD - How often should the test be executed
2. HOST - The host for which the test is to be configured.
3. PORT – Refers to the port used by the EVA SAN device. By default, it is null.
4. ARRAYNAME – Specify the name of the EVA SAN array that has been configured for monitoring.
5. EVASYSTEMIP – Specify the IP address of the HP EVA SAN.
6. SSSULOCATION – Install the SSSU.exe software and specify the full path to the install directory of this software here.
7. USERNAME and PASSWORD- Specify the user credentials using which the HP EVA array is to be accessed.
8. CONFIRM PASSWORD – Confirm the PASSWORD by retyping it here.
9. TIMEOUT – Indicate the duration (in seconds) for which this test should wait for a response from the storage device. By default, this is set to 120 seconds.
Outputs of the test
One set of results for each fibre channel on the EVA array
Measurements made by the t t
Measurement Measurement Unit Interpretation

M o n i t o r i n g t h e H P S t o r a g e W o r k s E n t e r p r i s e V i r t u a l A r r a y ( E V A ) F a m i l y
38
test Operational mode:
Indicates the current operational mode of this FC port.
Status The values that this measure can report and the states they indicate are tabulated below:
Value State
1 good or attention or normal
0 Failed or bad
2 Unknown or not available or notinstalled or not_present or unsupported, etc.
Failure predicted:
Indicates whether failure of this FC port has been predicted.
Status The values that this measure can report and the states they indicate are tabulated below:
Value State
1 no
0 yes
2 Unknown, etc.
Output link:
Indicates the current state of the output link of this FC port.
Status The values that this measure can report and the states they indicate are tabulated below:
Value State
1 Good, normal, active
0 Bad, failed, inactive
2 Unknown, etc.
Input link:
Indicates the current state of the input link of this FC port.
Status The values that this measure can report and the states they indicate are tabulated below:
Value State
1 Good, normal, active
0 Bad, failed, inactive
2 Unknown, etc.

M o n i t o r i n g t h e H P S t o r a g e W o r k s E n t e r p r i s e V i r t u a l A r r a y ( E V A ) F a m i l y
39
FC port status:
Indicates the current status of the FC port.
Status The values that this measure can report and the states they indicate are tabulated below:
Value State
1 Enabled,good,valid
0 Disabled,bad,invalid
2 Unknown, etc.
1.1.7 The Storage Array Layer Using the tests mapped to this layer you can observe the data traffic received and sent by the storage array, measure the space usage of the EVA system, and instantly detect whether the system is over-utilizing the available storage space.
Figure 1.7: The tests mapped to the Storage Array layer
1.1.7.1 EVA Array Traffic Test This test monitors the data traffic to and from the EVA storage array, and reports how well the array is able to handle the traffic.
Purpose Monitors the data traffic to and from the EVA storage array, and reports how well the array is able to handle the traffic
Target of the test
EVA Storage Array
Agent deploying the test
A remote agent
M o n i t o r i n g t h e H P S t o r a g e W o r k s E n t e r p r i s e V i r t u a l A r r a y ( E V A ) F a m i l y
40
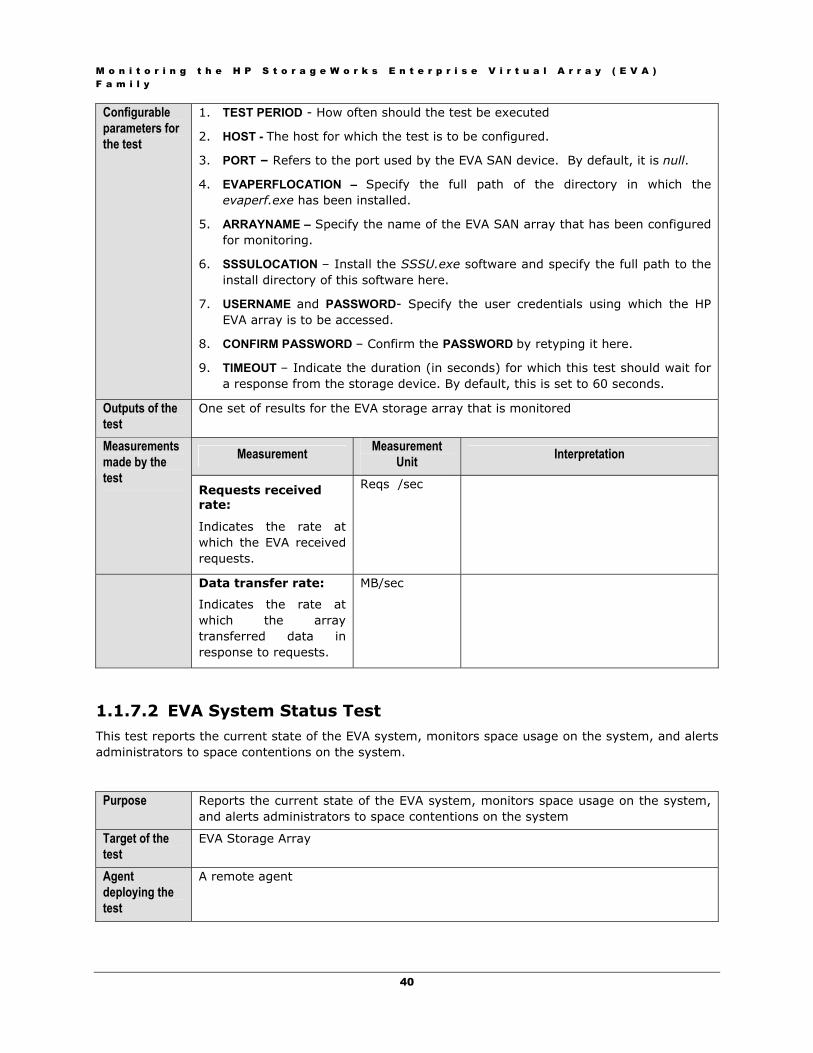
Configurable parameters for the test
1. TEST PERIOD - How often should the test be executed
2. HOST - The host for which the test is to be configured.
3. PORT – Refers to the port used by the EVA SAN device. By default, it is null.
4. EVAPERFLOCATION – Specify the full path of the directory in which the evaperf.exe has been installed.
5. ARRAYNAME – Specify the name of the EVA SAN array that has been configured for monitoring.
6. SSSULOCATION – Install the SSSU.exe software and specify the full path to the install directory of this software here.
7. USERNAME and PASSWORD- Specify the user credentials using which the HP EVA array is to be accessed.
8. CONFIRM PASSWORD – Confirm the PASSWORD by retyping it here.
9. TIMEOUT – Indicate the duration (in seconds) for which this test should wait for a response from the storage device. By default, this is set to 60 seconds.
Outputs of the test
One set of results for the EVA storage array that is monitored
Measurement Measurement Unit Interpretation Measurements
made by the test
Requests received rate:
Indicates the rate at which the EVA received requests.
Reqs /sec
Data transfer rate:
Indicates the rate at which the array transferred data in response to requests.
MB/sec
1.1.7.2 EVA System Status Test This test reports the current state of the EVA system, monitors space usage on the system, and alerts administrators to space contentions on the system.
Purpose Reports the current state of the EVA system, monitors space usage on the system, and alerts administrators to space contentions on the system
Target of the test
EVA Storage Array
Agent deploying the test
A remote agent

M o n i t o r i n g t h e H P S t o r a g e W o r k s E n t e r p r i s e V i r t u a l A r r a y ( E V A ) F a m i l y
41
Configurable parameters for the test
1. TEST PERIOD - How often should the test be executed
2. HOST - The host for which the test is to be configured.
3. PORT – Refers to the port used by the EVA SAN device. By default, it is null.
4. ARRAYNAME – Specify the name of the EVA SAN array that has been configured for monitoring.
5. EVASYSTEMIP – Specify the IP address of the HP EVA SAN.
6. SSSULOCATION – Install the SSSU.exe software and specify the full path to the install directory of this software here.
7. USERNAME and PASSWORD- Specify the user credentials using which the HP EVA array is to be accessed.
8. CONFIRM PASSWORD – Confirm the PASSWORD by retyping it here.
9. TIMEOUT – Indicate the duration (in seconds) for which this test should wait for a response from the storage device. By default, this is set to 120 seconds.
Outputs of the test
One set of results for the EVA system
Measurement Measurement Unit Interpretation Measurements
made by the test
Operational mode:
Indicates the current operational mode of the EVA system.
Status The values that this measure can report and the states they indicate are tabulated below:
Value State
1 good or attention or normal
0 Failed or bad
2 Unknown or not available or notinstalled or not_present or unsupported, etc.
Total storage space:
Indicates the total storage space on the array.
GB
Used storage space:
Indicates the amount of storage space currently utilized.
GB

M o n i t o r i n g t h e H P S t o r a g e W o r k s E n t e r p r i s e V i r t u a l A r r a y ( E V A ) F a m i l y
42
Percent free space:
Indicates the percentage of space available for use on the array.
Percent Ideally, the value of this measure should be high. A low value or a value that decreases consistently over time could indicate a potential space crunch on the array.
1.1.8 The EVA Controller Layer The tests mapped to this layer enable you to detect the following:
Has any cache battery failed?
Does any controller have a bad cache, a bad mirror connection, or a bad mirror port? If so, which controller is it?
Has any controller failed?
Is any controller experiencing abnormally high temperatures?
Which controller is utilizing CPU excessively?
Figure 1.8: The tests mapped to the EVA Controller layer
1.1.8.1 EVA Cache Battery Status Test This test reports the current operational state and overall health of each Cache battery.
Purpose Reports the current operational state and overall health of each Cache battery
Target of the t t
EVA Storage Array

M o n i t o r i n g t h e H P S t o r a g e W o r k s E n t e r p r i s e V i r t u a l A r r a y ( E V A ) F a m i l y
43
test Agent deploying the test
A remote agent
Configurable parameters for the test
1. TEST PERIOD - How often should the test be executed
2. HOST - The host for which the test is to be configured.
3. PORT – Refers to the port used by the EVA SAN device. By default, it is null.
4. ARRAYNAME – Specify the name of the EVA SAN array that has been configured for monitoring.
5. EVASYSTEMIP – Specify the IP address of the HP EVA SAN.
6. SSSULOCATION – Install the SSSU.exe software and specify the full path to the install directory of this software here.
7. USERNAME and PASSWORD- Specify the user credentials using which the HP EVA array is to be accessed.
8. CONFIRM PASSWORD – Confirm the PASSWORD by retyping it here.
9. TIMEOUT – Indicate the duration (in seconds) for which this test should wait for a response from the storage device. By default, this is set to 120 seconds.
Outputs of the test
One set of results for each Cache battery
Measurement Measurement Unit Interpretation Measurements
made by the test
Operational mode:
Indicates the current operational status of this cache battery.
Status The values that this measure can report and the states they indicate are tabulated below:
Value State
1 good or attention or normal
0 Failed or bad
2 Unknown or not available or notinstalled or not_present or unsupported, etc.
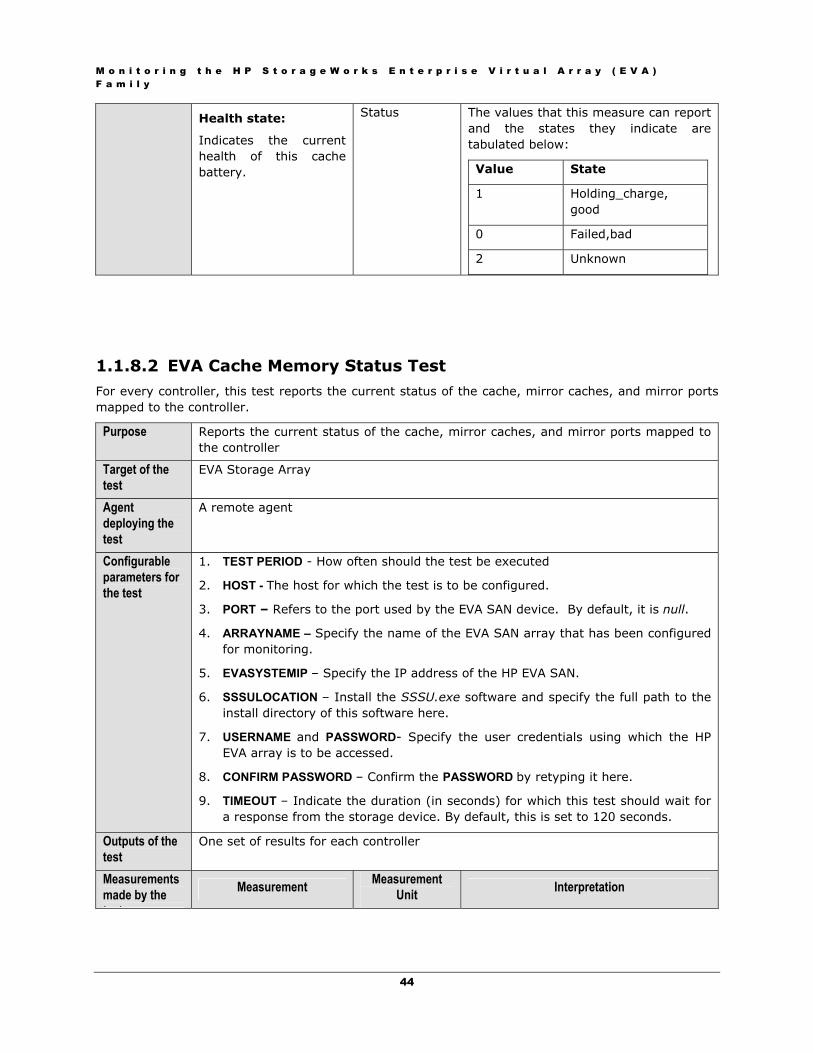
M o n i t o r i n g t h e H P S t o r a g e W o r k s E n t e r p r i s e V i r t u a l A r r a y ( E V A ) F a m i l y
44
Health state:
Indicates the current health of this cache battery.
Status The values that this measure can report and the states they indicate are tabulated below:
Value State
1 Holding_charge, good
0 Failed,bad
2 Unknown
1.1.8.2 EVA Cache Memory Status Test For every controller, this test reports the current status of the cache, mirror caches, and mirror ports mapped to the controller.
Purpose Reports the current status of the cache, mirror caches, and mirror ports mapped to the controller
Target of the test
EVA Storage Array
Agent deploying the test
A remote agent
Configurable parameters for the test
1. TEST PERIOD - How often should the test be executed
2. HOST - The host for which the test is to be configured.
3. PORT – Refers to the port used by the EVA SAN device. By default, it is null.
4. ARRAYNAME – Specify the name of the EVA SAN array that has been configured for monitoring.
5. EVASYSTEMIP – Specify the IP address of the HP EVA SAN.
6. SSSULOCATION – Install the SSSU.exe software and specify the full path to the install directory of this software here.
7. USERNAME and PASSWORD- Specify the user credentials using which the HP EVA array is to be accessed.
8. CONFIRM PASSWORD – Confirm the PASSWORD by retyping it here.
9. TIMEOUT – Indicate the duration (in seconds) for which this test should wait for a response from the storage device. By default, this is set to 120 seconds.
Outputs of the test
One set of results for each controller
Measurements made by the t t
Measurement Measurement Unit Interpretation
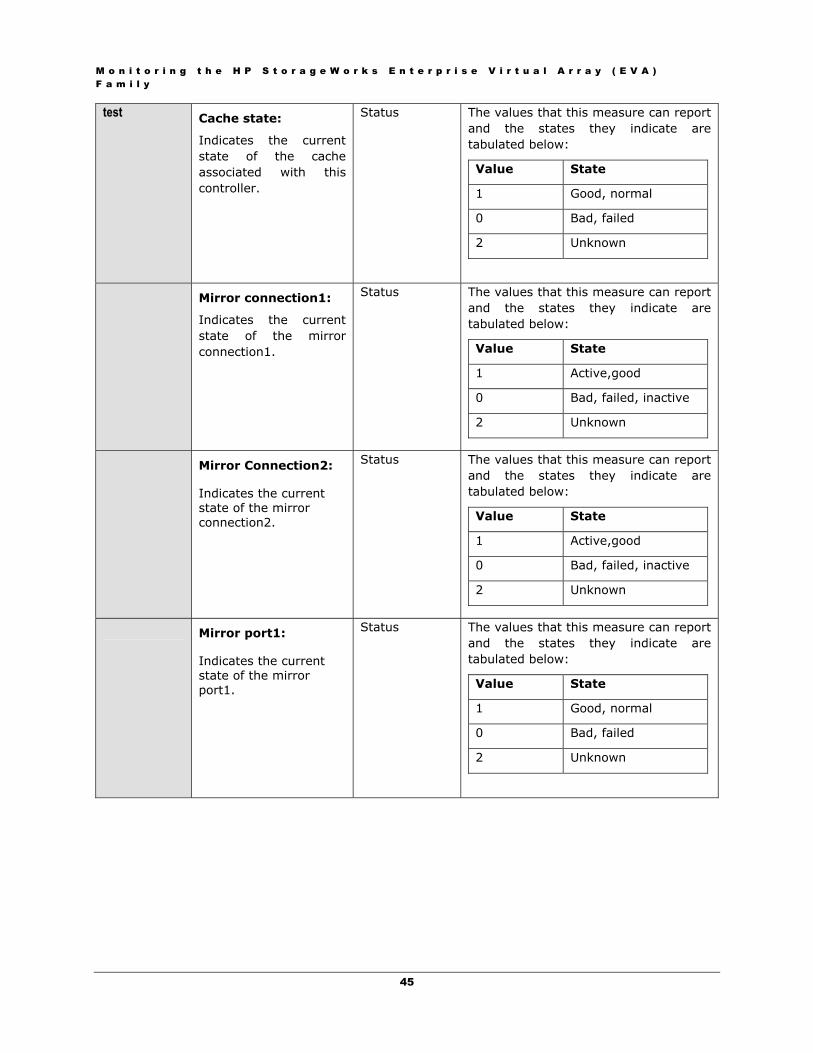
M o n i t o r i n g t h e H P S t o r a g e W o r k s E n t e r p r i s e V i r t u a l A r r a y ( E V A ) F a m i l y
45
test Cache state:
Indicates the current state of the cache associated with this controller.
Status The values that this measure can report and the states they indicate are tabulated below:
Value State
1 Good, normal
0 Bad, failed
2 Unknown
Mirror connection1:
Indicates the current state of the mirror connection1.
Status The values that this measure can report and the states they indicate are tabulated below:
Value State
1 Active,good
0 Bad, failed, inactive
2 Unknown
Mirror Connection2:
Indicates the current state of the mirror connection2.
Status The values that this measure can report and the states they indicate are tabulated below:
Value State
1 Active,good
0 Bad, failed, inactive
2 Unknown
Mirror port1:
Indicates the current state of the mirror port1.
Status The values that this measure can report and the states they indicate are tabulated below:
Value State
1 Good, normal
0 Bad, failed
2 Unknown

M o n i t o r i n g t h e H P S t o r a g e W o r k s E n t e r p r i s e V i r t u a l A r r a y ( E V A ) F a m i l y
46
Mirror port2:
Indicates the current state of mirror port 2.
Number The values that this measure can report and the states they indicate are tabulated below:
Value State
1 Good, normal
0 Bad, failed
2 Unknown
1.1.8.3 EVA Controller Status Test This test reports the current operational state and temperature state of each EVA controller.
Purpose Reports the current operational state and temperature state of each EVA controller
Target of the test
EVA Storage Array
Agent deploying the test
A remote agent
Configurable parameters for the test
1. TEST PERIOD - How often should the test be executed
2. HOST - The host for which the test is to be configured.
3. PORT – Refers to the port used by the EVA SAN device. By default, it is null.
4. ARRAYNAME – Specify the name of the EVA SAN array that has been configured for monitoring.
5. EVASYSTEMIP – Specify the IP address of the HP EVA SAN.
6. SSSULOCATION – Install the SSSU.exe software and specify the full path to the install directory of this software here.
7. USERNAME and PASSWORD- Specify the user credentials using which the HP EVA array is to be accessed.
8. CONFIRM PASSWORD – Confirm the PASSWORD by retyping it here.
9. TIMEOUT – Indicate the duration (in seconds) for which this test should wait for a response from the storage device. By default, this is set to 120 seconds.
Outputs of the test
One set of results for each EVA controller
Measurements made by the t t
Measurement Measurement Unit Interpretation

M o n i t o r i n g t h e H P S t o r a g e W o r k s E n t e r p r i s e V i r t u a l A r r a y ( E V A ) F a m i l y
47
test Operational mode:
Indicates the current operational status of this controller.
Status The values that this measure can report and the states they indicate are tabulated below:
Value State
1 good or attention or normal
0 Failed or bad
2 Unknown or not available or notinstalled or not_present or unsupported, etc.
Temperature status:
Indicates the current temperature status of this controller.
Status The values that this measure can report and the states they indicate are tabulated below:
Value State
1 normal
0 High, abnormal
2 Unknown
1.1.8.4 EVA Processor Usage Test This test tracks the CPU usage of and data traffic handled by the processor on each EVA controller, and thus alerts administrators to any real or potential contention for CPU resources on the controller.
Purpose Tracks the CPU usage of and data traffic handled by the processor on each EVA controller, and thus alerts administrators to any real or potential contention for CPU resources on the controller
Target of the test
EVA Storage Array
Agent deploying the test
A remote agent

M o n i t o r i n g t h e H P S t o r a g e W o r k s E n t e r p r i s e V i r t u a l A r r a y ( E V A ) F a m i l y
48
Configurable parameters for the test
1. TEST PERIOD - How often should the test be executed
2. HOST - The host for which the test is to be configured.
3. PORT – Refers to the port used by the EVA SAN device. By default, it is null.
4. EVAPERFLOCATION – Specify the full path of the directory in which the evaperf.exe has been installed.
5. SSSULOCATION – This test uses the EVAPerf software component to auto-discover the controllers on an EVA storage array. The EVA Controller Status test on the other hand uses the SSSU console to discover controller names. During auto-discovery, the EVAPerf utility reports the WWN names of the controllers. In contrast, the SSSU console reports the friendly names of the same controllers.
To ensure that these controllers are represented using a uniform, consistent notation across the eG monitoring interface, you can optionally configure this test to use the SSSU console (instead of EVAPerf) to perform controller discovery. This way, the names of controllers will be the same for this test and the EVA Controller Status test. To enable controller discovery via the SSSU console, configure the full path to the location of the SSSU.exe in the SSSULOCATION text box. If you prefer not to use SSSU.exe for controller discovery and would rather use the EVAPerf component instead, then, set this parameter to none.
6. USERNAME, PASSWORD, CONFIRM PASSWORD - To use the SSSU.exe for discovering the friendly names of controllers, specify the user credentials using which the HP EVA array is to be accessed in the USERNAME and PASSWORD text boxes. Confirm the PASSWORD by retyping it here. If you do not wish to use the SSSU.exe, then set these parameters to none.
7. ARRAYNAME – Specify the name of the EVA SAN array that has been configured for monitoring.
8. TIMEOUT – Indicate the duration (in seconds) for which this test should wait for a response from the storage device. By default, this is set to 60 seconds.
Outputs of the test
One set of results for each controller
Measurement Measurement Unit Interpretation Measurements
made by the test
CPU busy time:
Indicates the percentage of time the processor on this controller was busy processing requests.
Percent Comparing the value of this measure across controllers will enable you to accurately identify the controller that is consuming CPU resources excessively. Irregularities in load balancing across controllers can thus be isolated, and relevant remedial action initiated.
Data transfer time:
Indicates the percentage of processor time used for data transfer operations.
Percent Comparing the value of this measure across controllers will enable you to accurately identify the controller that is spending too much CPU on data transfer operations.

M o n i t o r i n g t h e H P S t o r a g e W o r k s E n t e r p r i s e V i r t u a l A r r a y ( E V A ) F a m i l y
49
1.1.9 The Hosts Layer This layer quickly reveals the bad host ports on a controller, busy host ports, external hosts connecting to the LUN that are in a failed state currently, external hosts that are overloading the array, and overloaded host ports on the controller.
Figure 1.9: The tests mapped to the Hosts layer
1.1.9.1 EVA Controller to Host Port Status Test For each host port on a controller, this test reports the operational state and overall health.
Purpose For each host port on a controller, this test reports the operational state and overall health
Target of the test
EVA Storage Array
Agent deploying the test
A remote agent

M o n i t o r i n g t h e H P S t o r a g e W o r k s E n t e r p r i s e V i r t u a l A r r a y ( E V A ) F a m i l y
50
Configurable parameters for the test
1. TEST PERIOD - How often should the test be executed
2. HOST - The host for which the test is to be configured.
3. PORT – Refers to the port used by the EVA SAN device. By default, it is null.
4. ARRAYNAME – Specify the name of the EVA SAN array that has been configured for monitoring.
5. EVASYSTEMIP – Specify the IP address of the HP EVA SAN.
6. SSSULOCATION – Install the SSSU.exe software and specify the full path to the install directory of this software here.
7. USERNAME and PASSWORD- Specify the user credentials using which the HP EVA array is to be accessed.
8. CONFIRM PASSWORD – Confirm the PASSWORD by retyping it here.
9. TIMEOUT – Indicate the duration (in seconds) for which this test should wait for a response from the storage device. By default, this is set to 120 seconds.
10. DETAILED DIAGNOSIS - To make diagnosis more efficient and accurate, the eG Enterprise suite embeds an optional detailed diagnostic capability. With this capability, the eG agents can be configured to run detailed, more elaborate tests as and when specific problems are detected. To enable the detailed diagnosis capability of this test for a particular server, choose the On option. To disable the capability, click on the Off option. The option to selectively enabled/disable the detailed diagnosis capability will be available only if the following conditions are fulfilled:
The eG manager license should allow the detailed diagnosis capability
Both the normal and abnormal frequencies configured for the detailed diagnosis measures should not be 0.
Outputs of the test
One set of results for each host port on a controller
Measurements made by the t t
Measurement Measurement Unit Interpretation
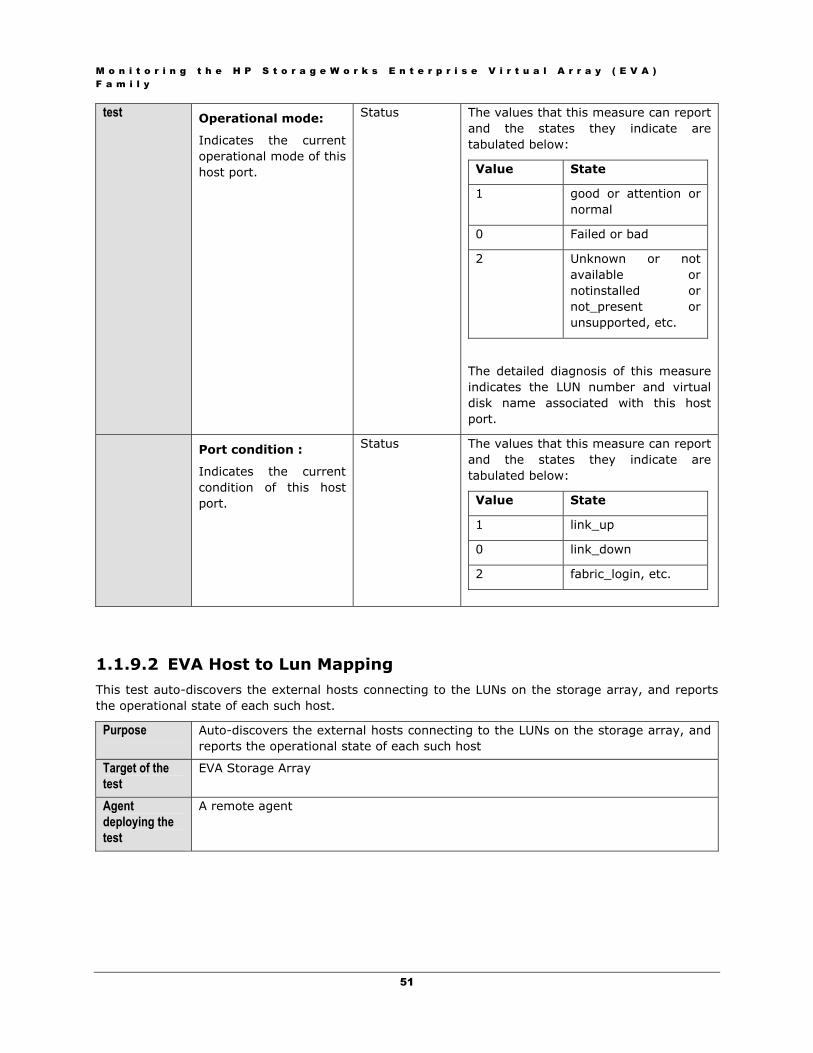
M o n i t o r i n g t h e H P S t o r a g e W o r k s E n t e r p r i s e V i r t u a l A r r a y ( E V A ) F a m i l y
51
test Operational mode:
Indicates the current operational mode of this host port.
Status The values that this measure can report and the states they indicate are tabulated below:
Value State
1 good or attention or normal
0 Failed or bad
2 Unknown or not available or notinstalled or not_present or unsupported, etc.
The detailed diagnosis of this measure indicates the LUN number and virtual disk name associated with this host port.
Port condition :
Indicates the current condition of this host port.
Status The values that this measure can report and the states they indicate are tabulated below:
Value State
1 link_up
0 link_down
2 fabric_login, etc.
1.1.9.2 EVA Host to Lun Mapping This test auto-discovers the external hosts connecting to the LUNs on the storage array, and reports the operational state of each such host.
Purpose Auto-discovers the external hosts connecting to the LUNs on the storage array, and reports the operational state of each such host
Target of the test
EVA Storage Array
Agent deploying the test
A remote agent

M o n i t o r i n g t h e H P S t o r a g e W o r k s E n t e r p r i s e V i r t u a l A r r a y ( E V A ) F a m i l y
52
Configurable parameters for the test
1. TEST PERIOD - How often should the test be executed
2. HOST - The host for which the test is to be configured.
3. PORT – Refers to the port used by the EVA SAN device. By default, it is null.
4. ARRAYNAME – Specify the name of the EVA SAN array that has been configured for monitoring.
5. EVASYSTEMIP – Specify the IP address of the HP EVA SAN.
6. SSSULOCATION – Install the SSSU.exe software and specify the full path to the install directory of this software here.
7. USERNAME and PASSWORD- Specify the user credentials using which the HP EVA array is to be accessed.
8. CONFIRM PASSWORD – Confirm the PASSWORD by retyping it here.
9. TIMEOUT – Indicate the duration (in seconds) for which this test should wait for a response from the storage device. By default, this is set to 120 seconds.
10. DETAILED DIAGNOSIS - To make diagnosis more efficient and accurate, the eG Enterprise suite embeds an optional detailed diagnostic capability. With this capability, the eG agents can be configured to run detailed, more elaborate tests as and when specific problems are detected. To enable the detailed diagnosis capability of this test for a particular server, choose the On option. To disable the capability, click on the Off option. The option to selectively enabled/disable the detailed diagnosis capability will be available only if the following conditions are fulfilled:
The eG manager license should allow the detailed diagnosis capability
Both the normal and abnormal frequencies configured for the detailed diagnosis measures should not be 0.
Outputs of the test
One set of results for each external host connecting to a LUN on the EVA storage array that is monitored
Measurements made by the t t
Measurement Measurement Unit Interpretation

M o n i t o r i n g t h e H P S t o r a g e W o r k s E n t e r p r i s e V i r t u a l A r r a y ( E V A ) F a m i l y
53
test Operational mode:
Indicates the operational mode of this host.
Status The values that this measure can report and the states they indicate are tabulated below:
Value State
1 good or attention or normal
0 Failed or bad
2 Unknown or not available or notinstalled or not_present or unsupported, etc.
The detailed diagnosis of this measure indicates the LUN number and virtual disk name associated with this host.
1.1.9.3 EVA Host To Array Requests Test This test monitors the requests flowing from each external host to an array, and helps administrators understand how busy the array is, and which external host is overloading the array.
Purpose Monitors the requests flowing from each external host to an array, and helps administrators understand how busy the array is, and which external host is overloading the array
Target of the test
EVA Storage Array
Agent deploying the test
A remote agent

M o n i t o r i n g t h e H P S t o r a g e W o r k s E n t e r p r i s e V i r t u a l A r r a y ( E V A ) F a m i l y
54
Configurable parameters for the test
1. TEST PERIOD - How often should the test be executed
2. HOST - The host for which the test is to be configured.
3. PORT – Refers to the port used by the EVA SAN device. By default, it is null.
4. EVAPERFLOCATION – Specify the full path of the directory in which the evaperf.exe has been installed.
5. SSSULOCATION – This test uses the EVAPerf software component to auto-discover the external hosts connected to an EVA storage array. The EVA Host to Lun Mapping test on the other hand uses the SSSU console to discover the external hosts. During auto-discovery, the EVAPerf utility reports the WWN names of the external hosts. In contrast, the SSSU console reports the friendly names of the same external hosts.
To ensure that these external hosts are represented using a uniform, consistent notation across the eG monitoring interface, you can optionally configure this test to use the SSSU console (instead of EVAPerf) to perform external host discovery. This way, the names of external hosts will be the same for this test and the EVA Host to Lun Mapping test. To enable external host discovery via the SSSU console, configure the full path to the location of the SSSU.exe in the SSSULOCATION text box. If you prefer not to use SSSU.exe for external host discovery and would rather use the EVAPerf component instead, then, set this parameter to none.
6. USERNAME, PASSWORD, CONFIRM PASSWORD - To use the SSSU.exe for discovering the friendly names of external hosts, specify the user credentials using which the HP EVA array is to be accessed in the USERNAME and PASSWORD text boxes. Confirm the PASSWORD by retyping it here. If you do not wish to use the SSSU.exe, then set these parameters to none.
7. ARRAYNAME – Specify the name of the EVA SAN array that has been configured for monitoring.
8. TIMEOUT – Indicate the duration (in seconds) for which this test should wait for a response from the storage device. By default, this is set to 60 seconds.
Outputs of the test
One set of results for each external host connected to the array
Measurement Measurement Unit Interpretation Measurements
made by the test
Queue size:
Indicates the current number of outstanding requests from this host.
Number In times of heavy load, you can compare the value of this measure across hosts to accurately identify which host is responsible for the overload.
If the value of this measure grows significantly with time, it could indicate a processing bottleneck on the array, which may require investigation.

M o n i t o r i n g t h e H P S t o r a g e W o r k s E n t e r p r i s e V i r t u a l A r r a y ( E V A ) F a m i l y
55
Busy responses:
Indicates the number of busy responses currently sent to this host.
Number A busy response is a request transmitted from the array to the host to cease I/O traffic until an internal job queue is reduced.
1.1.9.4 EVA Host To Controller Traffic Test This test auto-discovers the host ports handling data traffic on a controller, monitors the load on each port, and indicates how well the controller handles the load.
Purpose Auto-discovers the host ports handling data traffic on a controller, monitors the load on each port, and indicates how well the controller handles the load
Target of the test
EVA Storage Array
Agent deploying the test
A remote agent
Configurable parameters for the test
1. TEST PERIOD - How often should the test be executed
2. HOST - The host for which the test is to be configured.
3. PORT – Refers to the port used by the EVA SAN device. By default, it is null.
4. EVAPERFLOCATION – Specify the full path of the directory in which the evaperf.exe has been installed.
5. ARRAYNAME – Specify the name of the EVA SAN array that has been configured for monitoring.
6. SSSULOCATION – This test uses the EVAPerf software component to auto-discover the host ports on an EVA storage array. The EVA Controller to Host Port Status test on the other hand uses the SSSU console to discover host ports. During auto-discovery, the EVAPerf utility reports the WWN names of the host ports. In contrast, the SSSU console reports the friendly names of the same host ports.
To ensure that the host port representations are uniform and consistent across tests, you can optionally configure this test to use the SSSU console (instead of EVAPerf) to perform host port discovery. This way, the names of host ports will be the same for this test and the EVA Controller to Host Port Status test. To enable host port discovery via the SSSU console, configure the full path to the location of the SSSU.exe in the SSSULOCATION text box. If you prefer not to use SSSU.exe for host port discovery and would rather use the EVAPerf component instead, then, set this parameter to none.
7. USERNAME, PASSWORD, CONFIRM PASSWORD - To use the SSSU.exe for discovering the friendly names of host ports, specify the user credentials using which the HP EVA array is to be accessed in the USERNAME and PASSWORD text boxes. Confirm the PASSWORD by retyping it here. If you do not wish to use the SSSU.exe, then set these parameters to none.
8. TIMEOUT – Indicate the duration (in seconds) for which this test should wait for a response from the storage device. By default, this is set to 60 seconds.

M o n i t o r i n g t h e H P S t o r a g e W o r k s E n t e r p r i s e V i r t u a l A r r a y ( E V A ) F a m i l y
56
Outputs of the test
One set of results for each host port on the controller
Measurement Measurement Unit Interpretation Measurements
made by the test
Read requests:
Indicates the rate at which read requests were received by this host port.
Reqs/Sec
Write requests:
Indicates the rate at which write requests were received by this host port.
Reqs/Sec
Data reads:
Indicates the rate at which data is read by this host port.
MB/Sec
Data writes:
Indicates the rate at which data is written to the this host port.
MB/Sec
Time taken for reads:
Indicates the time taken by the controller to service the read requests to this host port.
Ms
Time taken for writes:
Indicates the time taken by the controller to service the write requests to this host port.
Ms
Ideally, this value should be low. An unusually high value across hosts could indicate the existence of a bottleneck in I/O processing on the controller.

M o n i t o r i n g t h e H P S t o r a g e W o r k s E n t e r p r i s e V i r t u a l A r r a y ( E V A ) F a m i l y
57
Avg queue size:
Indicates the average number of requests waiting in the queue of this host port.
Number Ideally, this value should be low. In times of heavy load, you may want to compare the value of this measure across host ports to figure out which port is the busiest.

C o n c l u s i o n
58
Conclusion This document has described in detail the monitoring paradigm used and the measurement capabilities of the eG Enterprise suite of products with respect to HP StorageWorks EVA. For details of how to administer and use the eG Enterprise suite of products, refer to the user manuals.
We will be adding new measurement capabilities into the future versions of the eG Enterprise suite. If you can identify new capabilities that you would like us to incorporate in the eG Enterprise suite of products, please contact [email protected]. We look forward to your support and cooperation. Any feedback regarding this manual or any other aspects of the eG Enterprise suite can be forwarded to [email protected].
Chapter
2