monitoring the effect of anti- cancer treatment … · determined by diffusion-weighted magnetic...
TRANSCRIPT

From Department of Molecular Medicin and Surgery
Karolinska Institutet, Stockholm, Sweden
MONITORING THE EFFECT OF ANTI-CANCER TREATMENT IN URO-
ONCOLOGICAL MALIGNANCIES WITH MOLECULAR IMAGING
Jacob Farnebo
Stockholm 2016

All previously published papers were reproduced with permission from the publisher.
Published by Karolinska Institutet.
Printed by AJ E-print AB
© Jacob Farnebo, 2016
ISBN 978-91 -7676 -390 -2
Printed by E-Print AB 2016

Institutionen för molekylär medicin och kirurgi, Karolinska Institutet
Röntgenkliniken, Karolinska Universitetssjukhuset, Solna
Monitoring the effect of anti-cancer treatment in uro-
oncological malignancies with molecular imaging
AKADEMISK AVHANDLING
som för avläggande av medicine doktorsexamen vid Karolinska Institutet offentligen
försvaras i Cancer Centrum Karolinskas stora föreläsningssal, entréplan, Karolinska
Universitetssjukhuset, Solna
Fredagen den 18 november, 2016, kl. 09.00
av
Jacob Farnebo
Huvudhandledare:
Professor Lennart Blomqvist
Karolinska Institutet
Department of Molecular Medicin and Surgery
Department of Diagnostic Radiology
Karolinska University Hospital
Bihandledare:
Dr. Per Sandström
Current Bayer pharmaceutical
former Karolinska Institutet
Department of oncology and pathology
Dr. Per Grybäck
Karolinska Institutet
Department of Molecular Medicine and Surgery
Department of Diagnostic Radiology
Karolinska University Hospital
Opponent:
Adj Professor Jens Sörensen
Uppsala University
Department of Surgical Science and Radiology
Examination Board:
Professor Sharon Stone-Elander
Karolinska Institutet
Department of Clinical Neuroscience
Docent Torkel Brismar
Karolinska Institutet
Department of Clinical science, intervention and
technology CLINTEC
Division of Radiology
Docent Magnus Lindskog
Uppsala University
Department of immunology, genetics and
pathology
Division of Clinical Oncology


“In golf as in life it is the follow through that makes the difference”
(Anonymous)
To Alice, Tom, Adam and Marianne


ABSTRACT
In the last decade, new therapies have changed the management of patients with metastatic
renal cell carcinoma (mRCC) and metastatic castration resistant prostate cancer (mCRPC).
Although new therapies have improved survival, drug response varies widely with some
patients not responding to treatment. Unfortunately, traditional assessment of drug response
with computed tomography (CT) has limitations, and novel biomarkers of treatment response
are warranted in order to reduce unnecessary side-effects and costs. The general aim of this
thesis was to identify imaging biomarkers that can help predict the treatment response in
mRCC and mCRPC.
In the first study, metabolic changes of tumour lesions detected by 18
F-Fluorodeoxyglucose
(FDG) positron emission tomography (PET) and CT (PET/CT) after 14 days of treatment
predicted the progression-free (PFS) and overall survival (OS) in 32 patients. Metabolic
response was assessed in several ways revealing that PET parameters measuring FDG uptake
within a volume had stronger association to outcome than parameters based on single voxel
analysis.
In the second study, the benefit of repeated 11
C-acetate PET/CT was evaluated retrospectively
to assess response in patients with mCRPC treated with abiraterone acetate. Potential
association between 11
C-acetate PET/CT, serum levels of prostate specific antigen (PSA),
PFS and OS were investigated. 11
C-acetate PET/CT predicted PFS and OS which may be of
particular clinical interest in patients who do not exhibit a PSA response to treatment.
In the third study, the maximal diameter of metastatic lesions originating from mRCC as
determined by diffusion-weighted magnetic resonance imaging (DWI) were compared with
the corresponding measurements on CT. These measurements appeared to be in close
agreement warranting for a larger trial investigating the feasibility of employing DWI in
clinical trials that follow the Response Evaluation Criteria in Solid Tumours (RECIST
version 1.1) guideline.
In conclusion, the novel imaging biomarkers evaluated here have the ability to predict
response of mRCC and mCRPC to targeted therapies, but need to be validated in a larger
setting before being implemented into the clinic.

LIST OF SCIENTIFIC PAPERS
I. Volumetric FDG-PET predicts overall and progression-free survival after 14
days of targeted therapy in metastatic renal cell carcinoma
Jacob Farnebo*, Per Grybäck, Ulrika Harmenberg, Anna Laurell, Peter
Wersäll, Lennart K Blomqvist, Anders Ullén and Per Sandström
BMC Cancer 2014, 14:408
II. Progression-free and overall survival in metastatic castration-resistant prostate
cancer treated with abiraterone acetate can be predicted with serial C11-
acetate PET/CT
Jacob Farnebo*, Agnes Wadelius, Per Sandström, Sten Nilsson, Hans
Jacobsson, Lennart Blomqvist, Anders Ullén
Medicine 2016, 95:31
III. Measurements of metastatic renal cell tumours as determined by whole-body
diffusion weighted imaging or computed tomography are in close
concordance, a pilot study
Farnebo J* , Suzuki C, Vargas R, Sandström P, Blomqvist L
Manuscript 2016
*Indicates the Corresponding Author

ARTICLES NOT INCLUDED IN THESIS
Downregulation of the cancer susceptibility protein WRAP53B in epithelial
ovarian cancer leads to defective DNA repair and poor clinical outcome
Hedström E, Pederiva C, Farnebo J, Nodin B, Jirström K, Brennan DJ,
Farnebo M.
Cell Death Dis. 2015 Oct 1;6:e1892.
Interleukin-18 acts as an angiogenesis and tumor suppressor
Cao R, Farnebo J, Kurimoto M, Cao Y.
FASEB J. 1999 Dec;13(15):2195-202.
Suppression of angiogenesis and tumor growth by the inhibitor K1-5
generated by plasmin-mediated proteolysis
Cao R, Wu HL, Veitonmäki N, Linden P, Farnebo J, Shi GY, Cao Y.
Proc Natl Acad Sci U S A. 1999 May 11;96(10):5728-33.
Vascular endothelial growth factor C induces angiogenesis in vivo
Cao Y, Linden P, Farnebo J, Cao R, Eriksson A, Kumar V, Qi JH,
Claesson-Welsh L, Alitalo K.
Proc Natl Acad Sci U S A. 1998 Nov 24;95(24):14389-94.

TABLE OF CONTENTS
1 LIST OF ABBREVIATIONS .......................................................................................... 7
2 INTRODUCTION ............................................................................................................ 7
2.1 Diagnostic imaging and the emerging role of molecular imaging in medicine .............. 7
2.2 Urological malignancies ........................................................................................................ 8
2.2.1 Renal cell carcinoma ........................................................................................................... 8
2.2.2 Castration Resistant Prostate Cancer (CRPC) .................................................................... 9
2.3 Targeted cancer therapies................................................................................................... 10
2.4 Molecular imaging technologies ......................................................................................... 11
2.4.1 PET/CT .............................................................................................................................. 11
2.4.2 18F-Fluorodeoxyglucose - FDG ....................................................................................... 11
2.4.3 The standardized uptake value SUV ................................................................................. 12
2.4.4 PET/CT for response assessment of mRCC ..................................................................... 13
2.4.5 Imaging Prostate cancer with 11
C-acetate PET/CT .......................................................... 16
2.4.6 Diffusion weighted magnetic resonance imaging (DWI) ................................................ 18
2.4.7 Usage of DWI to assess the response solid tumours to treatment ................................... 20
2.5 RECIST and PERCIST ...................................................................................................... 21
2.6 Statistical procedures .......................................................................................................... 23
2.6.1 Kaplan Meier survival analysis ......................................................................................... 23
2.6.2 The Cox Proportional Hazards Model .............................................................................. 24
2.6.3 P-Values, Statistical Power and Confidence Intervals ..................................................... 25
3 AIM OF THESIS ............................................................................................................. 27
3.1 General Aim of the present thesis ...................................................................................... 27
3.1.1 Specific Aims .................................................................................................................... 27
4 MATERIAL AND METHODS ..................................................................................... 29
4.1 Ethical approval, patient recruitment and informed consent ........................................ 29
4.2 Treatment ............................................................................................................................. 29
4.3 The PET/CT examinations ................................................................................................. 30
4.3.1 The FDG PET/CT examinations in Study 1 ..................................................................... 30
4.3.2 C11-acetate PET/CT examinations in Study 2 ................................................................. 31
4.4 DWI examinations ............................................................................................................... 32
4.4.1 Analysis of DWI imaging ................................................................................................. 33
4.5 Statistical Analyses .............................................................................................................. 34
5 RESULTS AND DISCUSSION ..................................................................................... 35
5.1 Study 1: Monitoring mRCC with FDG PET/CT ............................................................. 35
5.2 Study 2: Monitoring mCRPC with 11
C-acetate PET/CT ................................................ 38
5.3 Study 3: Monitoring mRCC with DWI ............................................................................. 39
6 SUMMARY OF FINDINGS .......................................................................................... 41
7 FUTURE PERSPECTIVES AND CHALLENGES ................................................... 42
8 ACKNOWLEDGMENTS .............................................................................................. 45
9 REFERENCES ................................................................................................................ 47

1 LIST OF ABBREVIATIONS
ADC
ADT
CT
DWI
ECOG
EORTC
FASN
FDG
FLT
FMISO
GE
GIST
HER-2
HU
IVIM
MRI
MTV
mRCC
mCRPC
OS
PD
PET
PERCIST
PFS
PR
PSA
PSMA
RCC
RECIST
Apparent diffusion coefficient
Androgen deprivation therapy
Computed Tomography
Diffusion weighted imaging
Eastern Cooperative Oncology Group
European Organization for Research and Treatment of Cancer
Fatty acid synthase
18F-Fuorodeoxyglucose
18F-Fluorothymidine
18F-misonidazole
General Electric
Gastrointestinal stromal tumours
human epidermal growth factor receptor 2
Hounsfield Unit
Intravoxel Incoherent Motion
Magnetic Resonance Imaging
Metabolic tumour volume
metastatic Renal Cell Carcinoma
metastatic Castration Resistant Prostate Cancer
Overall survival
Progressive disease
Positron Emission Tomography
PET Response Criteria in Solid Tumours
Progression-free survival
Partial response
Prostate specific antigen
Prostate specific membrane antigen
Renal Cell Carcinoma
Response Evaluation Criteria In Solid Tumours
ROI
SD
SUV
SPECT
SUL
TLG
TKI
VEGF
VOI
WHO
Region of interest
Stable disease
Standardized uptake value
Single photon emission computed tomography
SUV lean
Total lesion glycolysis
Tyrosine kinase inhibitors
Vascular endothelial growth factor
Volume of interest
World Health Organization


7
2 INTRODUCTION
2.1 DIAGNOSTIC IMAGING AND THE EMERGING ROLE OF MOLECULAR IMAGING IN MEDICINE
The era of medical imaging began in 1895 with the discovery of X-rays by the German
physicist Wilhelm Conrad Röntgen, an achievement for which he was awarded the Nobel
prize in physics 6 years later. An enormous fascination with the possibility of viewing
uninvasively inside the human body led to virtually instant utilization of X-rays, before the
dangers of ionizing radiation were discovered. During the 20th century the development of
novel modes of imaging such as nuclear medicine (1940s), ultrasound (1960s), computer
tomography (CT) and magnetic resonance imaging (MRI) (1970s) also exerted great impact
on medicine and today most medical specialties depend on imaging for diagnosis guiding
invasive procedures and monitoring disease treatment.
The 20th
century also brought revolutionary new insights into the molecular details of life
including pathological processes. The many new tools, including not least medical imaging
and drugs discovered have improved our ability to cure or at least prolong the life of patients
with cancer. However, the anatomic or physiological abnormalities indicative of cancer arise
relatively late in the course of the disease and further improvement is necessary. Molecular
imaging techniques allow visualization of functional events on a cellular level, and when
combined with conventional anatomical imaging to achieve what is often referred to as fusion
imaging, can help reveal the location of a specific event in the organism.
In the present thesis, the use of novel imaging technologies that combine anatomical
information with physiological information to monitor the treatment of patients with
urological malignancies has been evaluated.

8
2.2 UROLOGICAL MALIGNANCIES
All work described here involves patients with renal cell carcinoma (RCC) or prostate cancer
and a brief introduction to these pathologies follows.
2.2.1 Renal cell carcinoma (RCC)
RCC, also called hypernephroma or renal cell cancer, arises from the renal cortex (i.e. the
renal tubules) and is distinct from tumours that form in the transitional epithelium of the renal
pelvis or in the renal medulla. RCCs are relatively uncommon, with an annual incidence
today of approximately 1000 cases in Sweden, accounting for around 2 % of all cancers[1],
with a male-to-female ratio of around 1.6:1[2]. Risk factors include cigarette smoke, obesity,
hypertension, diabetes mellitus and reproductive factors, while genetic factors are involved in
approximately 3-4%[2] of all RCC[3]. The World Health Organization (WHO) classifies this
disease into several subgroups of which clear cell is by far the most common group (around
85%), followed by papillary (10%), chromophobe (5%) and an unclassified form somewhat
different from these others. A sarcomatoid subtype seen in all subgroups is considered to be
an indicator of progressive disease[2]. Non-specific symptoms of RCC include haematuria,
flank pain, weight loss and fever. RCC is often discovered incidentally, most often when
conducting abdominal ultrasound or computerized tomography[4].
If diagnosed at an early stage, when the tumour is still localized to the kidney or within the
immediate surrounding tissue, RCC can be cured. Overall, the 5-year survival rate for the 70-
80% of Swedish patients without metastases at the time of diagnosis is 83%[1], while the
corresponding figure for the others is only 15%. Although, metastatic RCC (mRCC) is
relatively resistant to chemotherapy and radiation therapy, our increased understanding
during the last decade of the underlying mechanisms have led to novel specific therapies, so-
called targeted therapies. Thus, the introduction of tyrosine kinase inhibitors (TKIs) that
target angiogenic pathways such as sorafenib, sunitinib and pazopanib, has improved the
survival of patients with mRCC.
CT is the preferred method for imaging RCC today. In most cases a dedicated multi-phase
CT allows detection, staging and planning for surgery. When metastases are present repeated
CT examinations are usually performed to monitor treatment.
The work described here involves patients with either metastatic disease at the time of
9
diagnosis or a disease relapse following curative therapy.
2.2.2 Castration Resistant Prostate Cancer (CRPC)
Prostate cancer, the most common cancer in Sweden, accounts for 1/3 of all malignancies
among men[5]. In 2014, 10985 cases were diagnosed and around 2500 of these patients died,
accounting for approximately 5% of all mortalities among Swedish men. The number of
cases diagnosed each year has been increasing steadily most likely due to the aging
population and increasing number of PSA tests being performed. Prostate cancer is rare in
men under 45 years of age, but very common among men older than 80. However, because of
its slow progression, most men afflicted will not die from this disease.
A study from USA reported in 2012 that at the time of diagnosis that 80% of patients
demonstrate localized, 12% loco-regional and 4% metastatic disease[6] (the remaining were
not staged at diagnosis). In the absence of metastatic spread, curative treatment involving
surgery or radiotherapy in combination with androgen deprivation therapy (ADT) is initiated.
It is now well known that prostate cancer cells require testosterone in order to grow, a
discovery for which Huggins and Hodges received the Nobel Prize in 1967. However, in the
majority of patients with metastatic prostate cancer, the disease will eventually become
refractory to all anti-hormonal treatment, a status referred to as androgen-independent or
castration resistant (the latter term being preferred by the Prostate Cancer Working Group 2
committee[7]).
Determination of whether the tumour has spread beyond the prostate gland and to loco-
regional lymph nodes is critical for deciding on a treatment strategy and much effort is
currently focused on finding a reliable diagnostic imaging technique for this purpose. The
role of magnetic resonance imaging (MRI) or positron emission tomography (PET) to stage
local disease is still under investigation. In 2015 Swedish authorities recommended MRI
before re-biopsy of patients with suspected cancer but with negative first biopsy, and that
further studies are conducted to determine if MRI should be implanted as a standard pre-
operative routine[8].
When prostate cancer spreads, the cells enter the blood and/or lymph vessels which can
transport them to distant locations to establish metastases[9]. Thus, such metastases are often
found in regional lymph nodes before they appear in bone, only occasionally being found in
10
visceral organs such as the lungs or liver. Once spread to distant parts of the body, the disease
becomes incurable. The most common approach to visualize metastatic spread to the skeleton
is using bone scintigraphy, while visceral metastases are generally diagnosed with CT.
2.3 TARGETED CANCER THERAPIES
Until the late 1990’s with exception of certain hormone blockers, almost all chemotherapeutic
drugs against cancer were designed to kill proliferating cells, so that they also kill normal
cells to a certain extent. So-called targeted therapies based on greater understanding of the
molecular biology of cancer target specific molecules required for cancer cell growth,
division and/or spread[10]. Targeted therapies are usually cytostatic, blocking the
proliferation of tumour cells, while chemotherapeutic agents are cytotoxic, killing the cells. In
recent decades the several types of targeted therapies approved for use in cancer treatment
include hormone therapies, inhibitors of signal transduction/angiogenesis[11], modulators of
gene expression[12], immunotherapies[13] and molecules that deliver toxins[14]. Table 1
below illustrates the new targeted therapies introduced against mRCC and mCRPC. The
continuously increasing number of therapeutic options makes it even more important to
identify patients who will not benefit from treatment, potentially by imaging biomarkers of
response. Imaging can capture not only heterogeneity within one lesion, but also between
lesions.
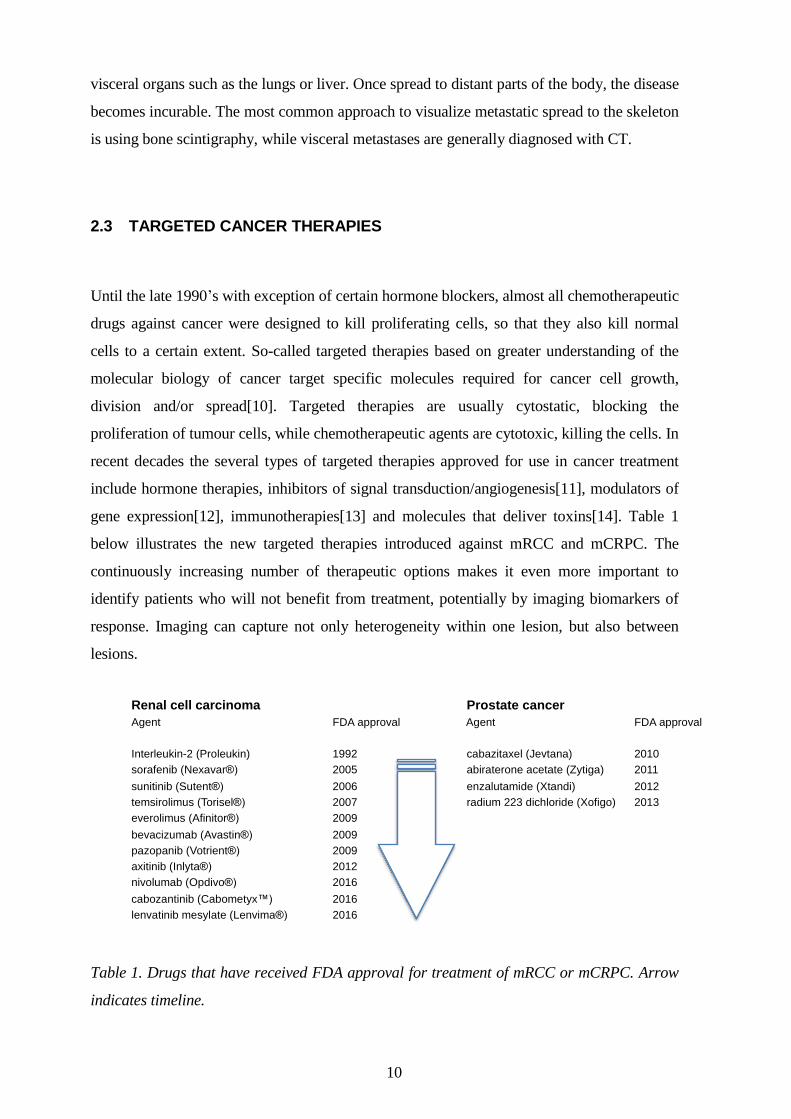
Table 1. Drugs that have received FDA approval for treatment of mRCC or mCRPC. Arrow
indicates timeline.
Renal cell carcinoma Prostate cancer
Agent FDA approval Agent FDA approval
Interleukin-2 (Proleukin) 1992 cabazitaxel (Jevtana) 2010
sorafenib (Nexavar®) 2005 abiraterone acetate (Zytiga) 2011
sunitinib (Sutent®) 2006 enzalutamide (Xtandi) 2012
temsirolimus (Torisel®) 2007 radium 223 dichloride (Xofigo) 2013
everolimus (Afinitor®) 2009
bevacizumab (Avastin®) 2009
pazopanib (Votrient®) 2009
axitinib (Inlyta®) 2012
nivolumab (Opdivo®) 2016
cabozantinib (Cabometyx™) 2016
lenvatinib mesylate (Lenvima®) 2016
11
2.4 MOLECULAR IMAGING TECHNOLOGIES
In the present research Positron Emission Tomography (PET) in combination with CT
(PET/CT) utilizing the radiotracers 18
F-Fluorodeoxyglucose (FDG) and 11
C-acetate, along
with Diffusion Weighted MRI (DWI) have been employed.
2.4.1 PET/CT
PET/CT, one of the most powerful imaging modalities presently available, combines
functional information obtained with radio-labelled substances with anatomical information
provided by CT, with the two being superimposed to provide a fusion image. In the case of
PET, a radio-labelled tracer injected into the body intravenously is then distributed to tissues
on the basis of its biochemical and pharmacokinetic properties. At some point the isotope will
decay and emit a positron from the nucleus which will travel a short distance (less than 1
mm) before losing most of its energy in collisions with electrons. This collision begins the
conversion of the mass of the electron and positron into electromagnetic energy in the form of
two gamma photons, each with an energy of 511 keV and travelling in opposite
directions[15] though the body.
These photons can be detected by an external PET camera that converts them into a signal. If
a pair of such detectors record two annihilating photons at the same time their source is
located along the line connecting these detectors. After adjusting this information for scatter,
body attenuation and detector properties, a 3D image can be constructed, in which the signal
intensity of any given volume is proportional to the amount of radionuclide in that particular
voxel. Thus, PET images are based on radiation emitted outwards from the patient, while CT
involves transmission of an outside X-ray through the patient’s body. Due to the present
physical limitation of the technique, the resolution of modern clinical PET scanners is too
limited to be able to detect micro-metastatic lesions, which is also beyond reach of other
imaging modalities.
2.4.2 18F-Fluorodeoxyglucose - FDG
Fluorodeoxyglucose or 2-deoxy-2-(18
F)fluoro-D-glucose (FDG), a glucose analogue in which
the 2’-hydroxyl group has been replaced with the radioactive isotope flouorine-18 that emits
positrons with a half-life time of 110 minutes. FDG, the most common radioactive tracer used
12
in clinical PET examinations and considered to be “the magic bullet” in nuclear medicine, is
employed in the evaluation of many types of cancers and infectious diseases. Although every
living cell in the human body requires glucose, many cancer cells exhibit relatively little
oxidative phosphorylation and are thus more dependent on glycolysis than most other tissues
(a phenomenon known as the Warburg effect). Hannahan and Weinberg[16] published a
highly influential article entitled “The hallmarks of cancer” in 2000 and in the updated
version of this article that appeared in 2011 one of the two hallmarks added was
“reprogramming of energy metabolism”, i.e. increased metabolism is not only a characteristic
of, but even an essential necessity for cancer development. Although many different factors
influence the uptake of FDG, a number of studies have demonstrated a relationship between
this uptake and the number of cancer cells[17, 18]. After cellular uptake, FDG is
phosphorylated by intracellular hexokinases to 18
F-FDG-6-phosphate, which unlike glucose,
can neither be metabolized further nor exit the cell and thus can serve as a biomarker for
glucose uptake in the body.
2.4.3 The standardized uptake value SUV
The raw PET signals can be converted into concentrations by calculating a Standardized
Uptake Value (SUV), defined for certain image volume, as the tracer concentration
normalized to the radioactivity administered and body weight (Figure 1). The unit is g/mL,
but SUV is generally presented as a unitless value, since 1 mL soft tissue has a mass of
approximately 1 g. If the FDG injected were to be uniformly distributed throughout the body,
the SUV would be 1 g/mL, regardless of the amount injected or size of the patient.
The many factors that potentially can influence the SUV include fundamental physical
limitations such as the spatial resolution and total effective counts of the detector, which
together determine the signal-to-noise ratio in a PET image [19]. The limited spatial
resolution leads to a well-known error in partial volume, where small objects display less than
their actual concentration of tracer[20]. Other factors include the status of the patient (e.g.
blood glucose level, previous physical exercise or recent chemotherapy), as well as variations
in the scan protocol and reconstruction parameters used in processing the images[21].
Although the maximal SUV, SUVmax, is most commonly used in the clinic, several other
SUV parameters are also employed. The SUVmean and SUVmax values apply to a specified
volume-of-interest (VOI). The SUVmean represents the average SUV within a given volume,
whereas SUVmax is the peak value for one voxel within the same VOI. SUVmean is
13
influenced by the size of the VOI, while SUVmax is not and is therefore less dependent on
the observers, more reproducible[22] and especially advantageous for small tumours.
However, the influence of scatter noise is substantial. The metabolic tumour volume (MTV)
is defined as the volume of tissue for which the SUV is above a certain threshold. Total lesion
glycolysis (TLG) can be calculated by multiplying the MTV by the SUVmean within the
same VOI.
2.4.4 PET/CT for response assessment of mRCC
While FDG PET/CT is widely utilized to evaluate the metabolism of various cancers, this
approach has not yet received the same attention in connection with mRCC. The obvious
reasons for this include the fact that mRCC can vary from intense to only mild uptake of
FDG, similar to that of normal parenchyma and, moreover as a consequence of urinary
excretion of FDG by the kidneys, tumours can easily be missed. However, FDG PET/CT is
better at detecting distant metastases than the primary neoplasm, with a pooled sensitivity
and specificity in a meta-analysis of 91% and 88% compared to 62% and 88% for renal
lesions [23].
The approval of several novel anti-angiogenic therapies targeting mRCC has heightened the
need for novel biomarkers, such as FDG PET/CT, designed to monitor the early response in
order to customize effective treatment. Today, standard anatomic radiographic CT imaging
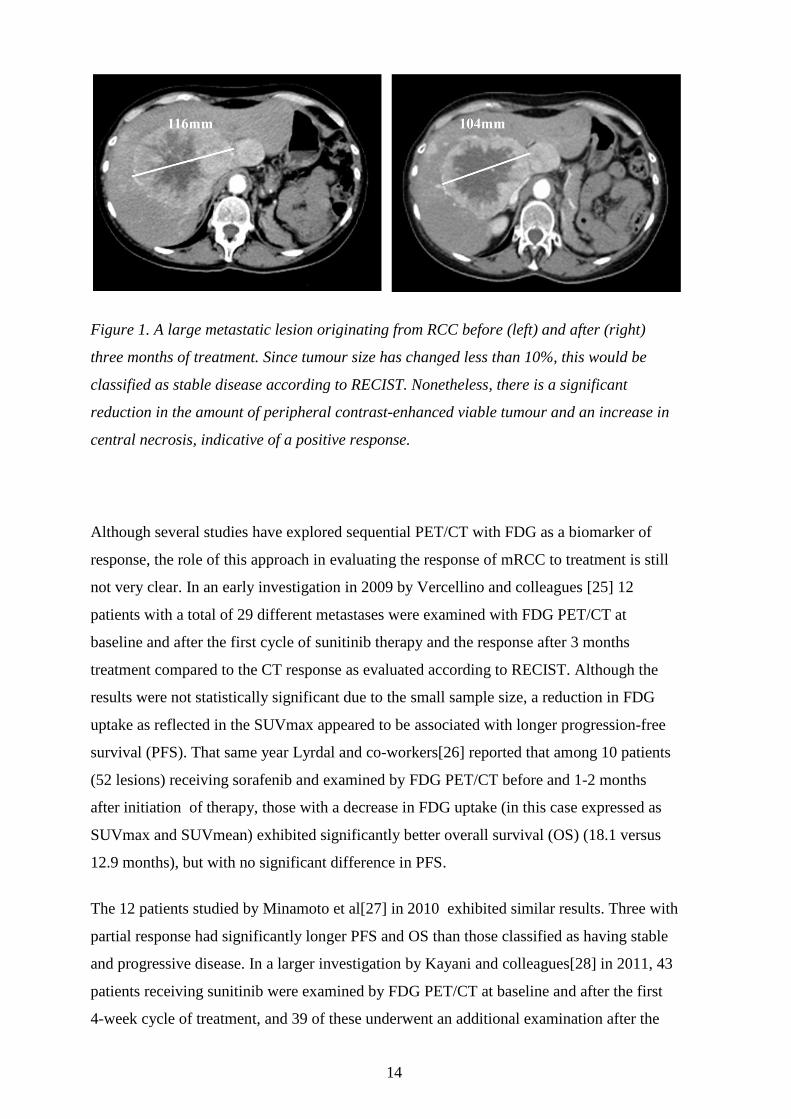
is carried out usually once every three months during therapy. As illustrated in Figure 1
conventional CT imaging of mRCC is not very effective. The Response Evaluation Criteria
in Solid Tumors (RECIST) state that only the longest dimensions of no more than five
lesions (according to the updated RECIST 1.1, further explained in section 2.5) are to be
analyzed and that sum of these dimensions must differ more than 30% in order to conclude
that progress or a partial response has occurred. However, a relatively large proportion of
the patients who benefit from treatment experience only disease stabilization at the
beginning and show progress later on[24]. Functional molecular imaging such as FDG-
PET/CT can be utilized to assess early changes in tumour metabolism and may thus be
useful for monitoring clinical efficacy as illustrated in Figure 2.
14
Figure 1. A large metastatic lesion originating from RCC before (left) and after (right)
three months of treatment. Since tumour size has changed less than 10%, this would be
classified as stable disease according to RECIST. Nonetheless, there is a significant
reduction in the amount of peripheral contrast-enhanced viable tumour and an increase in
central necrosis, indicative of a positive response.
Although several studies have explored sequential PET/CT with FDG as a biomarker of
response, the role of this approach in evaluating the response of mRCC to treatment is still
not very clear. In an early investigation in 2009 by Vercellino and colleagues [25] 12
patients with a total of 29 different metastases were examined with FDG PET/CT at
baseline and after the first cycle of sunitinib therapy and the response after 3 months
treatment compared to the CT response as evaluated according to RECIST. Although the
results were not statistically significant due to the small sample size, a reduction in FDG
uptake as reflected in the SUVmax appeared to be associated with longer progression-free
survival (PFS). That same year Lyrdal and co-workers[26] reported that among 10 patients
(52 lesions) receiving sorafenib and examined by FDG PET/CT before and 1-2 months
after initiation of therapy, those with a decrease in FDG uptake (in this case expressed as
SUVmax and SUVmean) exhibited significantly better overall survival (OS) (18.1 versus
12.9 months), but with no significant difference in PFS.
The 12 patients studied by Minamoto et al[27] in 2010 exhibited similar results. Three with
partial response had significantly longer PFS and OS than those classified as having stable
and progressive disease. In a larger investigation by Kayani and colleagues[28] in 2011, 43
patients receiving sunitinib were examined by FDG PET/CT at baseline and after the first
4-week cycle of treatment, and 39 of these underwent an additional examination after the
15
third cycle. In contrast to previous reports, they observed no significant correlation between
a reduction in SUVmax in connection with either the first or second examination and either
PFS or OS. However, patients with a progressive disease after the third cycle demonstrated
a significantly shorter OS. These authors also reported that both high metabolic activity and
a large number of metastatic lesions at baseline were associated with shorter OS.
In 2012 Ueno and co-workers[29] described a similar study on 30 patients with mRCC who
underwent PET/CT examinations at baseline and after 1 month of treatment with either
sorafenib or sunitinb. The changes in SUVmax and in lesion diameter as determined by CT
were combined to classify response as good, intermediate or poor, all of which
demonstrated statistically significant associations with both PFS and OS. CT alone could
not predict outcome.
Critical aspects of assessing drug efficacy are the time required before a detectable effect
can be expected and whether or not this effect is sustained. In 2010 Lassau et al[30] found
that comparison of contrast-enhanced ultrasound examinations performed before and after
initiation of sunitinib treatment revealed detectable effects after as little as 15 days. These
investigators also found that the time to peak intensity and wash-in were significantly
associated with drug-free survival and OS. Accordingly, TKIs appear to act rapidly and
their effects can be visualized within the first month of treatment.
16
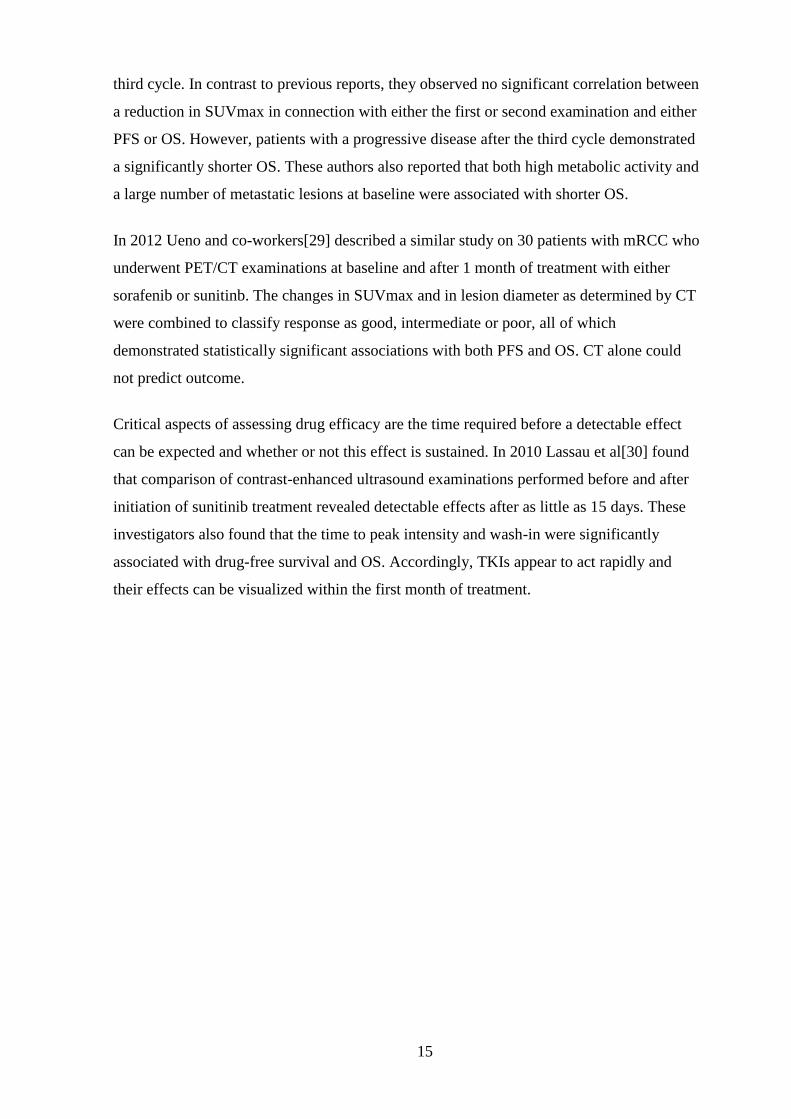
Figure 2. Reduction in the metabolic activity of a liver metastasis originating from mRCC
after one month of treatment with sunitinib.
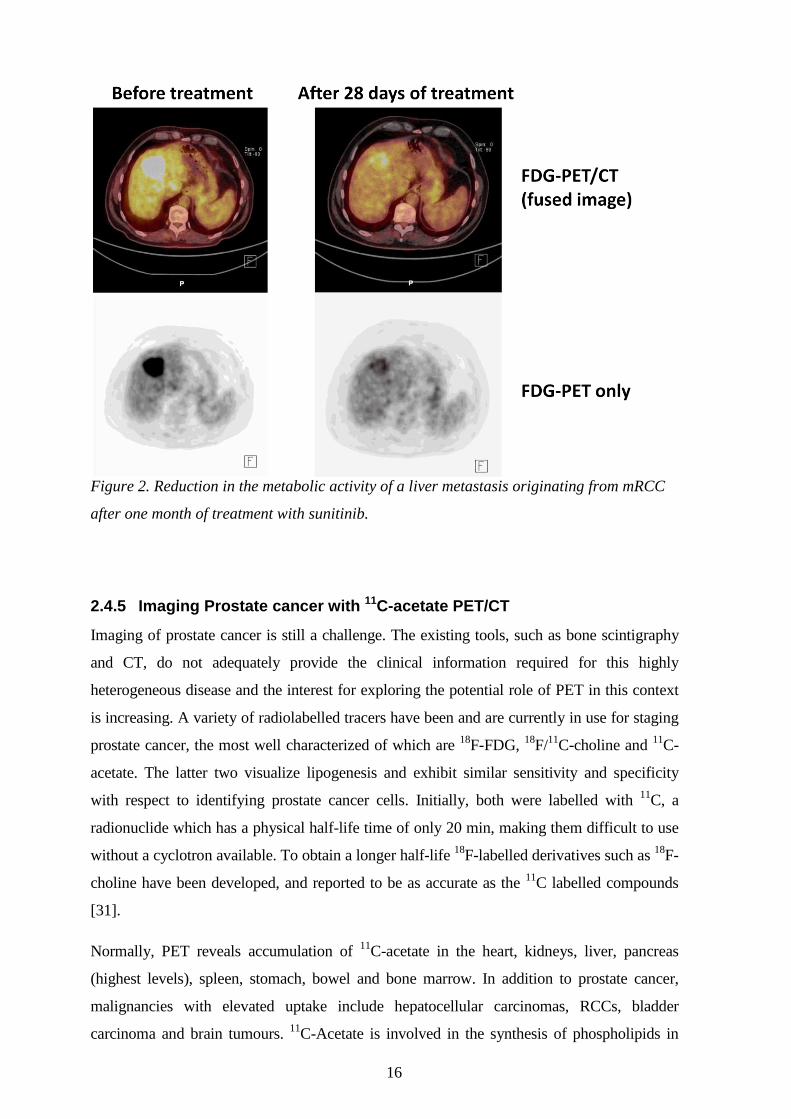
2.4.5 Imaging Prostate cancer with 11C-acetate PET/CT
Imaging of prostate cancer is still a challenge. The existing tools, such as bone scintigraphy
and CT, do not adequately provide the clinical information required for this highly
heterogeneous disease and the interest for exploring the potential role of PET in this context
is increasing. A variety of radiolabelled tracers have been and are currently in use for staging
prostate cancer, the most well characterized of which are 18
F-FDG, 18
F/11
C-choline and 11
C-
acetate. The latter two visualize lipogenesis and exhibit similar sensitivity and specificity
with respect to identifying prostate cancer cells. Initially, both were labelled with 11
C, a
radionuclide which has a physical half-life time of only 20 min, making them difficult to use
without a cyclotron available. To obtain a longer half-life 18
F-labelled derivatives such as 18
F-
choline have been developed, and reported to be as accurate as the 11
C labelled compounds
[31].
Normally, PET reveals accumulation of 11
C-acetate in the heart, kidneys, liver, pancreas
(highest levels), spleen, stomach, bowel and bone marrow. In addition to prostate cancer,
malignancies with elevated uptake include hepatocellular carcinomas, RCCs, bladder
carcinoma and brain tumours. 11
C-Acetate is involved in the synthesis of phospholipids in

17
which fatty acid synthase (FASN), an enzyme up-regulated in prostate cancers,
participates[32]. More aggressive forms of prostate cancer, with higher Gleason scores,
display higher levels of FASN[33] activity and enhanced uptake of 11
C-acetate has recently
been proposed to be a surrogate biomarker for sensitivity to inhibitors of FASN[34], which
suppress cell proliferation, adhesion, migration and invasion[35]. Thus, targeting FASN
might effectively suppress multiple steps in the progression of prostate cancer. Figure 3
illustrates a patient with lymph node and bone metastases from prostate cancer.
Most studies performed to date indicate a limited ability for choline and acetate tracers to
localize and characterize the primary tumour within the prostate. Another aspect of initial
detection of prostate tumours is staging of local lymph nodes in high risk patients. One of the
few investigations in this area[36] found high patient-by-patient sensitivity, but low
specificity, in combination with low sensitivity, but high specificity with respect to the nodal
region. These results are in line with studies indicating the high specificity, but low to
moderate sensitivity of 18
F/11
C-choline.
The ten-year recurrence rate for prostate cancer can be as high as 34% [37]. In most patients
recurrence will first be reflected in a rise in prostate specific antigen (PSA), usually referred
to as biochemical recurrence and thereafter metastases are detectable within months to years.
The evidence indicates a linear relationship between the level of PSA and detection of
metastases by PET [38].
In clinical practice bone scintigraphy is most frequently utilized for imaging of prostate
cancer. In comparison with 18
F-Flouride PET the latter has shown to have slightly higher
sensitivity in detecting bone metastases[39]. It is anticipated that choline or acetate PET could
be expected to be of value in detecting not only bone but also extra-osseous metastases.

18
Figure 3. Elevated uptake of 11
C -acetate in abdominal lymph node metastases (encircled)
and a sclerotic bone metastasis (arrow).
2.4.6 Diffusion weighted magnetic resonance imaging (DWI)
DWI, a pulse sequence technique in MRI, monitors the random motion of protons in water
molecules present in tissues, where their diffusion is restricted by interactions with cell
membranes and macromolecules. Tissues with high cellularity, such as tumours, impede the
diffusion of water and are seen as bright areas with high signal intensity in DWI images,
whereas areas with less restriction produce lower signals on such images with high b-
values[40].
Since DWI can be performed relatively quickly employing routine MRI scanners, this
technique is widely available, which is one reason for its increasing popularity. Another
advantage in comparison to CT or PET/CT is that DWI requires no administration of
exogenous contrast medium or ionizing radiation when desired. Images can be acquired over
multiple stations that cover the entire body, a concept first introduced by Takahara and
colleagues in 2004[41], who also employed background signal suppression in this
connection. During the last decade improvements in both MRI hardware and software, such
as the continuous moving table, allow whole body MRI examinations to be performed in a
clinical setting.
The free-breathing T2 spin-echo echo-planar technique involved in DWI is explained in
Figure 4.

19
Figure 4. The DWI sequence involves a spin echo sequence with two strong magnetic field
diffusion gradients applied to opposing sides of a 180-degree refocusing pulse. Moving and
static protons (the latter only being present in areas with restricted diffusion) will be
dephased by the first diffusion gradient and only the static protons will rephase when the
second is applied, while all moving protons dephase randomly. Finally, a signal will arise
from static protons only. The unit of diffusion weight is referred to as the b-value. This b-
value can be enhanced either by increasing or prolonging the magnetic gradient or allowing
more time to elapse between application of the gradients.
With small b-values (e.g. 50-100 mm s/mm2), water molecules with extensive freedom of
movement will produce a bright signal. At the same time a large b-value (e.g. 1000 s/mm2) is
required to detect slow-moving water molecules with restricted diffusion. Sometimes, normal
tissues also produce a strong signal on DWI images, not due to restricted diffusion, but rather
to a strong T2 signal which shines through, a phenomenon referred to as “T2 shine through”.
By performing DWI with at least two different b-values, an apparent diffusion coefficient
(ADC) can be calculated and the problem of T2 shine through avoided.
The ADC expressed as mm2/s is calculated automatically by MRI workstations and the
results displayed as a map of the degree of diffusion in different tissues. The errors in this

20
calculation can be reduced by applying several b-values. Areas with restricted diffusion, such
as in tumours are characterized by ADC values that are lower than those of normal tissues,
which are brighter. The diffusivity in a region-of-interest of the ADC map can be quantified.
Although malignancies with impeded diffusion are common findings, false-positives include
inflammatory conditions, normal lymph nodes and areas with poor suppression by fat. An
example of DWI in a patient with metastatic prostate cancer is illustrated in Figure 5.
Figure 5. A reconstructed inverted
b-800 s/mm2 diffusion weighted
image of maximal intensity
showing pathological lymph nodes,
originating from RCC, as dark
round areas in the axillary (blue
arrows) and pelvic regions (green
arrows).
2.4.7 Usage of DWI to assess the response solid tumours to treatment
Efficient therapy causes tumour cells to die, thereby disrupting the cellular membrane,
widening the extracellular space and increasing the diffusion of water[42]. Several
assessments indicate that the ADC after initiation of treatment is associated with the
therapeutic effect of a drug and might predict outcome [43-45] and, moreover that changes in
ADC occur earlier than the reduction of tumour size. A challenge with ADCs in tissues is that
it is influenced by microcirculation of blood in capillaries leading to higher ADCs. With the
intravoxel incoherent motion (IVIM) concept[46, 47], first described in 1988 by Bihan and
colleagues, the molecular diffusion of water can be separated from the perfusion in
21
capillaries. Perfusion related diffusion effects become significant only at low b-values, which
allows diffusion and perfusion to be separated. The vascularity and cellularity of tumours are
often directly affected by targeted therapies, which are quantifiable by analysis of IVIM
based analysis.
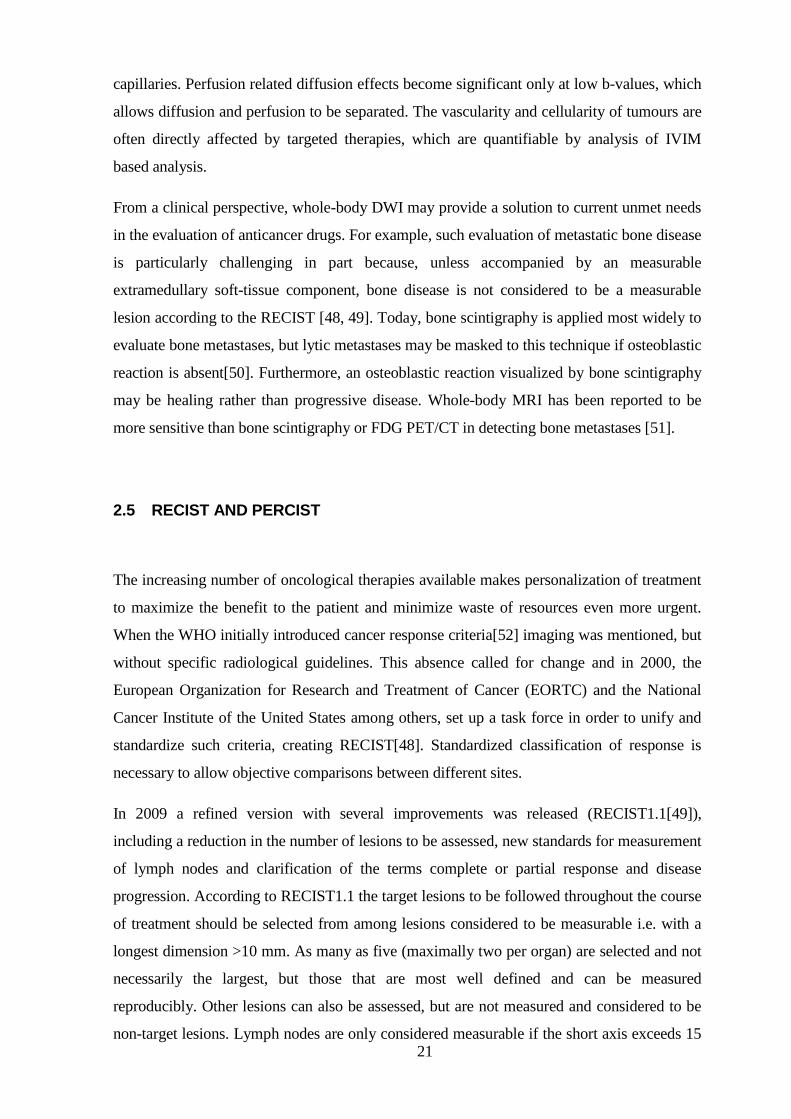
From a clinical perspective, whole-body DWI may provide a solution to current unmet needs
in the evaluation of anticancer drugs. For example, such evaluation of metastatic bone disease
is particularly challenging in part because, unless accompanied by an measurable
extramedullary soft-tissue component, bone disease is not considered to be a measurable
lesion according to the RECIST [48, 49]. Today, bone scintigraphy is applied most widely to
evaluate bone metastases, but lytic metastases may be masked to this technique if osteoblastic
reaction is absent[50]. Furthermore, an osteoblastic reaction visualized by bone scintigraphy
may be healing rather than progressive disease. Whole-body MRI has been reported to be
more sensitive than bone scintigraphy or FDG PET/CT in detecting bone metastases [51].
2.5 RECIST AND PERCIST
The increasing number of oncological therapies available makes personalization of treatment
to maximize the benefit to the patient and minimize waste of resources even more urgent.
When the WHO initially introduced cancer response criteria[52] imaging was mentioned, but
without specific radiological guidelines. This absence called for change and in 2000, the
European Organization for Research and Treatment of Cancer (EORTC) and the National
Cancer Institute of the United States among others, set up a task force in order to unify and
standardize such criteria, creating RECIST[48]. Standardized classification of response is
necessary to allow objective comparisons between different sites.
In 2009 a refined version with several improvements was released (RECIST1.1[49]),
including a reduction in the number of lesions to be assessed, new standards for measurement
of lymph nodes and clarification of the terms complete or partial response and disease
progression. According to RECIST1.1 the target lesions to be followed throughout the course
of treatment should be selected from among lesions considered to be measurable i.e. with a
longest dimension >10 mm. As many as five (maximally two per organ) are selected and not
necessarily the largest, but those that are most well defined and can be measured
reproducibly. Other lesions can also be assessed, but are not measured and considered to be
non-target lesions. Lymph nodes are only considered measurable if the short axis exceeds 15
22
mm. Lytic bone lesions with a measureable soft tissue component can be considered
measurable, while blastic bone lesions are not. If the sum of the dimensions’ increases by
>20% and more than 5 mm or if the tumour burden in non-target lesions has risen
substantially, the patient is considered to be experiencing progressive disease (PD).
In a retrospective comparison between RECIST1.0 and RECIST1.1 involving 62 patients
with mRCC receiving vascular endothelial growth factor (VEGF) -targeted therapy, fewer
lesions were measured according to with RECIST1.1 and the best response (Kappa = 0.819)
and median time to progression was similar [53]. Thus, assessment of fewer lesions with
RECIST 1.1 is equivalent to applying RECIST1.0. Although this updated version of RECIST
represents an improvement, assessment of response solely on the basis of anatomical
measurements has limitations, particularly in connection with metastatic solid tumours, where
novel treatments rarely cure, but instead prolong survival by acting in a cytostatic rather than
cytotoxic fashion [54]. These treatments may shut down certain functions in the cancer cell to
establish a highly desirable long-term stable disease. For example, the RECIST guidelines are
insensitive for evaluating treatment of gastrointestinal stromal tumours (GIST) with imatinib,
although this drug shrinks’ tumour slowly, can be highly effective. Therefore, it has been
recommended that RECIST not be applied to GIST[55] and the response evaluated instead
employing CT criteria according to Choi or FDG-PET/CT[56, 57].
For several years now, evidence has been accumulating that indicates FDG-PET could not
only provide better imaging of tumour response to drugs than CT, but could also improve
prediction of survival [58]. FDG-PET is mentioned only briefly in RECIST 1.1 and no
guidance concerning classification of response by PET is provided. In lymphoma FDG-PET
is used frequently and guidelines for response assessment have been created [59, 60].
The variety of solid tumours being examined with FDG-PET/CT is increasing rapidly and a
draft framework of PET response criteria in solid tumours (PERCIST) was proposed by
Richard Wahl in 2009 [61]. Key components of PERCIST include standardization of PET
protocols on calibrated scanners [62]. The patient should have fasted for 4-6 hours prior to
the examination and serum his/her glucose level should be no more than 200 mg/dL.
Scanning should be performed within 50-70 minutes after injection of FDG and follow-up
scans within 15 minutes after the baseline scan.
Instead of assessing SUVmax, it is recommended that the SUV be corrected for lean body
mass (SUL) and measured as a sphere with a diameter of 1.2 cm in a lesion preferably larger
than 1.5 cm (to minimize partial volume effects) to produce a region of interest (ROI) with a

23
volume of 1,3 cm3 designated SULpeak. The ROI for this SULpeak will usually include the
maximal SUL pixel without necessarily being centred around this. Only lesions with an SUL
greater than 1.5 times the average SUL in liver parenchyma + 2 standard deviations of mean
SULs (measured as a 3 cm diameter ROI) are measured. As with RECIST1.1, as many as five
lesions (maximally two per organ) are measured, but the response is classified only on the
basis of the behaviour of the lesion that takes up most FDG. Partial response and progressive
disease are defined as either a decline or increase of more than 30% together with a 0.8 unit
alteration in SULpeak respectively. PERCIST1.0 also acknowledges total lesion glycolysis
(TLG) by recommending that this be recorded routinely and that a 75% increase by the most
active lesion be considered metabolic progression.
Since 2009, six publications have compared RECIST1.1 and PERCIST1.0 and a pooled
analysis (including 268 patients with different forms of cancer) revealed considerable
discordance between the two [63]. Compared to RECIST1.1, PERCIST1.0 graded tumour
response as higher in 85 patients and lower in 16 indicating that PERCIST1.0 might be more
sensitive in this respect. However, it remains to be determined whether this response is of
prognostic relevance or clinical significance.
2.6 STATISTICAL PROCEDURES
2.6.1 Kaplan Meier survival analysis
The Kaplan-Meier survival analysis named after Edward Kaplan and Paul Meier in 1958 is a
non-parametric statistical model used to estimate survival from patient lifetime data [64]. The
length of time required for a critical event to occur is called survival time. In medical studies
survival time is usually identical to time-in-study, since patients seldom enter a study at the
same time. A Kaplan-Meier plot depicts a curve that declines in multiple steps, each of which
indicates the occurrence of a specified critical event (in medicine, this often being death,
which explains the designation survival analysis). Patients who for some reason leave the
study or have not yet experienced the critical event by the end of the study are referred to as
“censored observations”. A censored observation is indicated in the Kaplan-Meier plot as a
vertical tick or cross at the time-point of last follow-up. The Kaplan-Meier procedure is
commonly used to compare two different groups employing the Logrank test, with the null
hypothesis of no difference between the two groups being equivalent to their having the same
survival time. The Kaplan-Meier plot is explained further in Figure 6.

24
Figure 6. A Kaplan-Meier plot comparing two different groups. The Logrank test can be
applied to determine whether there is a significant difference between these two groups as
(indicated by the p-value in the graph).
2.6.2 The Cox Proportional Hazards Model
Other survival models often employed in medical statistics are the proportional hazards
model [65], regression models that describe a hazard function or ratio that varies
multiplicatively over time in relationship to various covariates. The hazard ratio represents
the instantaneous risk for an event to occur during a study period, whereas the relative risk is
cumulative over the entire period. The hazard ratio can also be described as the instantaneous
probability of a particular event occurring over time in a group of patients compared to the
corresponding probability for a control group. A hazard ratio equal to one indicates no
difference in survival between the two groups; a ratio of less than one indicates better
survival in the study group; and a ratio of more than one that the risk for an event to occur in
this group is larger. The endpoint can be any dependent variable (e.g. death, remission or
progression of disease) associated with the covariates (independent variables). It is important
to realize that a hazard ratio is a relative measure of effect that provides no information
concerning the absolute risk. Proportional hazards models involve the important assumption
that the hazard for any one individual is a fixed proportion of the hazard for any other
individual, which means that if a covariate doubles the risk for an event on the first day, it

25
also doubles the risk for this same event on any other day.
In 1972 Sir David Cox applied proportional hazards models to survival data by including
survival time [66], which is also a continuous variable but with the possibility of including
censored observations, to create the Cox proportional hazards ratio [67]. When applying this
model in a multivariable analysis (where several explanatory covariates are included), it is
important to recognize that it is the number of events observed, rather than the number of
included subjects in the study, decides how many variables are to be included. It has been
recommended that for each variable included in a multivariable Cox analysis, a minimum of
10 events should have been observed [67]. In relationship to Kaplan-Meier plots, the hazard
ratio represents the distance between the two curves.
2.6.3 P-Values, Statistical Power and Confidence Intervals
The one goal of statistical analysis is to utilize information about a sample of individuals to
draw a conclusion about the general population of interest. This can be accomplished either
by testing a hypothesis (with p-values) or estimation (with confidence intervals). With the
first approach it is necessary to formulate a “null hypothesis” statement e.g., treatment with
sorafenib has no benefits for patients with mRCC and then try to disprove it. Secondly, a
level of significance concerning the probability of obtaining a false positive or rejecting the
null hypothesis even if it is true (a type I error) is chosen. In biomedical research this level is
often set at 0.05, indicating that it is acceptable to have 5% probability of false positive result.
Statistical analysis will give a measure on how extreme the observations were, defined as a p-
value. If the p-value is less than the chosen level of significance, the test suggests that the
observed data is incompatible with the null hypothesis, thus it must be rejected. If a test
reveals a false negative result and the null hypothesis remains although it is false, a type II
error has occurred. Type two errors are related to the sensitivity or the so-called power of the
test.
The so-called power of a test is defined as 1 minus the sensitivity and reflects the probability
of obtaining a type II error, i.e. with lower power there is less chance of rejecting a null
hypothesis that is false. Thus, the power decides the probability of obtaining a statistically
significant result. Among the factors that influence the power of a test, the most important are
the level of statistical significance chosen, the expected magnitude of the differences between
the groups studied and the sample size. If something is known beforehand about the

26
magnitude of the effect and level of significance, a power analysis can be conducted to
determine the minimal sample size required to detect the effect.
Statistical testing of a hypothesis reveals whether there is any difference between the groups
studied, but does not say anything about the nature of size of the difference. Supplementation
with a confidence interval provides a range of values covering the actual mean difference
[68]. Typically, a 95% confidence interval (a 5% significance level) is utilized i.e. the range
containing of the true value with 95% confidence, indicating both the magnitude of the
difference and any lack of precision in the estimate thereby helping to decide whether the
difference is of clinical interest.
27
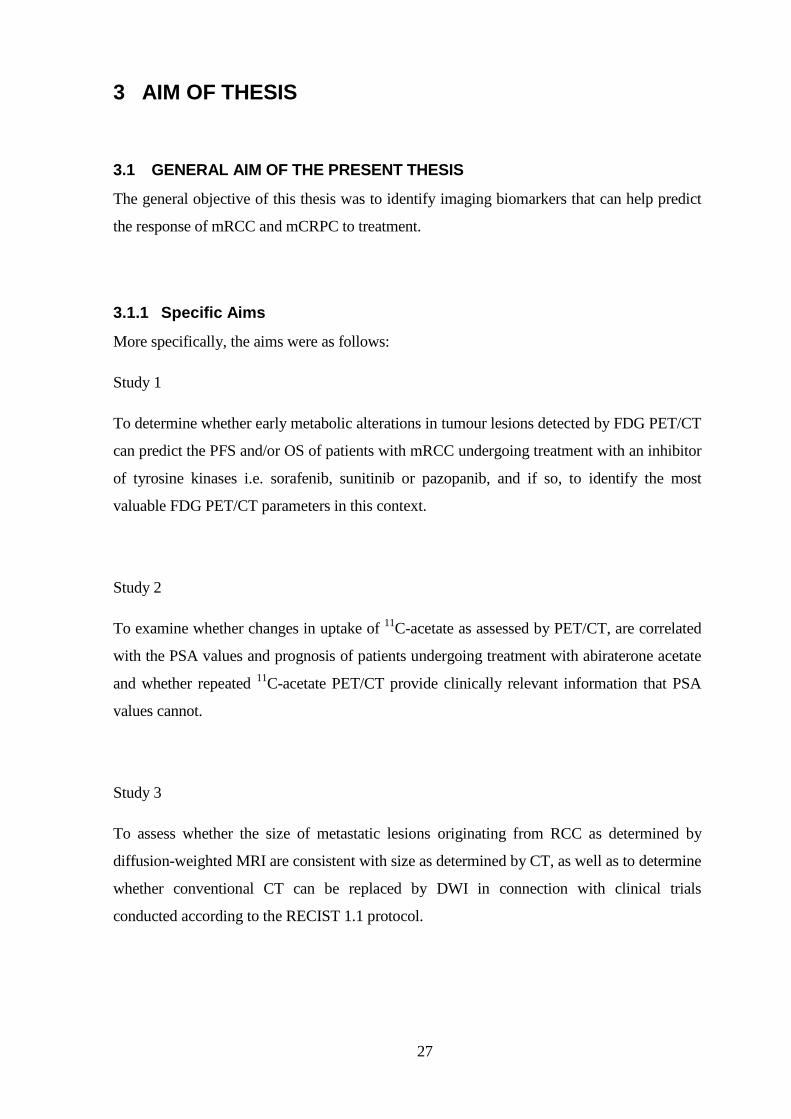
3 AIM OF THESIS
3.1 GENERAL AIM OF THE PRESENT THESIS
The general objective of this thesis was to identify imaging biomarkers that can help predict
the response of mRCC and mCRPC to treatment.
3.1.1 Specific Aims
More specifically, the aims were as follows:
Study 1
To determine whether early metabolic alterations in tumour lesions detected by FDG PET/CT
can predict the PFS and/or OS of patients with mRCC undergoing treatment with an inhibitor
of tyrosine kinases i.e. sorafenib, sunitinib or pazopanib, and if so, to identify the most
valuable FDG PET/CT parameters in this context.
Study 2
To examine whether changes in uptake of 11
C-acetate as assessed by PET/CT, are correlated
with the PSA values and prognosis of patients undergoing treatment with abiraterone acetate
and whether repeated 11
C-acetate PET/CT provide clinically relevant information that PSA
values cannot.
Study 3
To assess whether the size of metastatic lesions originating from RCC as determined by
diffusion-weighted MRI are consistent with size as determined by CT, as well as to determine
whether conventional CT can be replaced by DWI in connection with clinical trials
conducted according to the RECIST 1.1 protocol.


29
4 MATERIALS AND METHODS
A summary of the general methods applied in this thesis including certain aspects of
particular interest.
4.1 ETHICAL APPROVAL, PATIENT RECRUITMENT AND INFORMED CONSENT
Studies 1 and 3 were prospective and conducted with pre-approval by the regional ethical
committee in Stockholm, Sweden (Dnr 2007/1551-31/3 and Dnr 2013/1216-31/3). All
participants, recruited by the referring oncologist, provided their written informed consent
and were free to leave the study at any time.
Study 2, a retrospective analysis of available clinical material, was also pre-approved (Dnr
2015/1068-31) by the same ethical committee. Patient consent was not obtained, in part
because most of the individuals concerned had already died.
4.2 TREATMENT
In Study 1, 39 patients with mRCC underwent repeated FDG PET examinations prior to and
after treatment with one of the TKIs sorafenib (19), sunitinib (18) or pazopanib (2) between
2006 and 2010. These drugs block multiple tyrosine kinase receptors e.g., the receptors for
platelet-derived and vascular endothelial growth factors [69, 70]. Several of these tyrosine
kinases play a role in both tumour angiogenesis and proliferation. In addition to being
approved for treatment of mRCC, sorafenib is also approved for therapy of advanced
hepatocellular and radioactive iodine-resistant thyroid carcinomas, sunitinib for imatinib-
resistant gastrointestinal stromal tumours and pazopanib for soft tissue sarcoma.
At the beginning of the study, most of the patients recruited were being treated with sorafenib
secondary to treatment after interferon. During the study treatment recommendations were
changed and sunitinib became the drug-of-choice for first-line treatment of mRCC. Most of
the patients recruited thereafter received sunitinib alone, although a few also received
30
sorafenib and pazopanib as second line treatment.
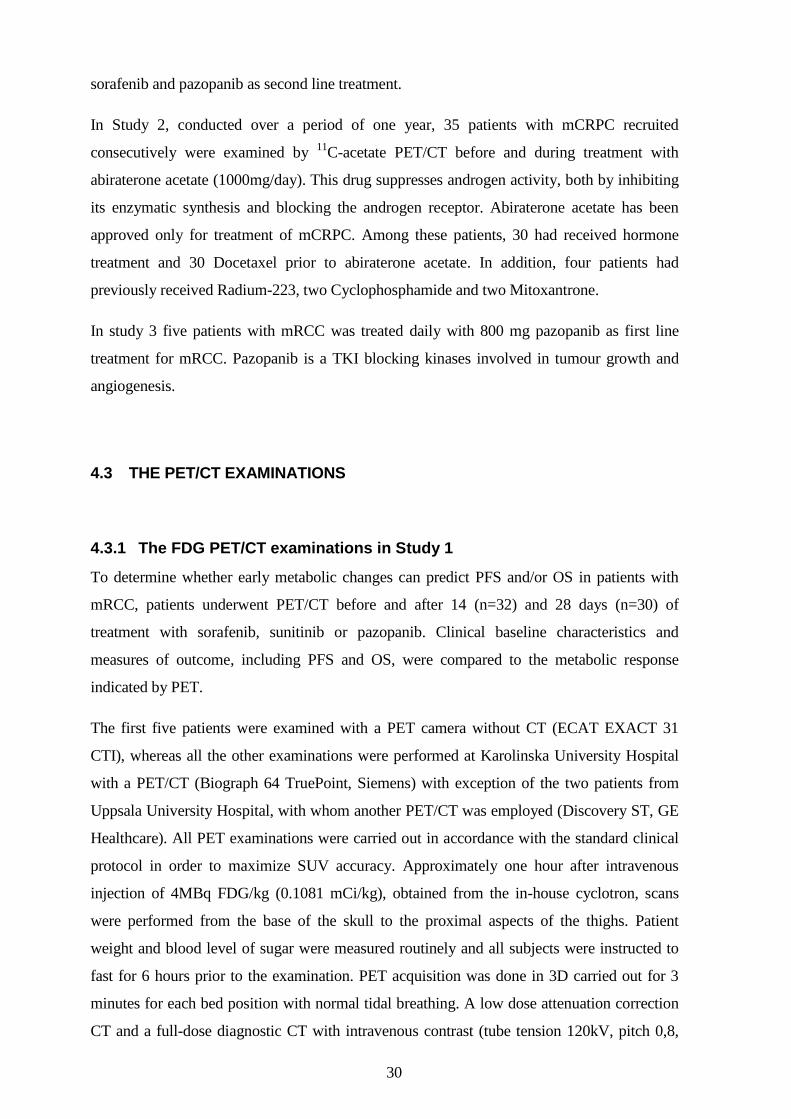
In Study 2, conducted over a period of one year, 35 patients with mCRPC recruited
consecutively were examined by 11
C-acetate PET/CT before and during treatment with
abiraterone acetate (1000mg/day). This drug suppresses androgen activity, both by inhibiting
its enzymatic synthesis and blocking the androgen receptor. Abiraterone acetate has been
approved only for treatment of mCRPC. Among these patients, 30 had received hormone
treatment and 30 Docetaxel prior to abiraterone acetate. In addition, four patients had
previously received Radium-223, two Cyclophosphamide and two Mitoxantrone.
In study 3 five patients with mRCC was treated daily with 800 mg pazopanib as first line
treatment for mRCC. Pazopanib is a TKI blocking kinases involved in tumour growth and
angiogenesis.
4.3 THE PET/CT EXAMINATIONS
4.3.1 The FDG PET/CT examinations in Study 1
To determine whether early metabolic changes can predict PFS and/or OS in patients with
mRCC, patients underwent PET/CT before and after 14 (n=32) and 28 days (n=30) of
treatment with sorafenib, sunitinib or pazopanib. Clinical baseline characteristics and
measures of outcome, including PFS and OS, were compared to the metabolic response
indicated by PET.
The first five patients were examined with a PET camera without CT (ECAT EXACT 31
CTI), whereas all the other examinations were performed at Karolinska University Hospital
with a PET/CT (Biograph 64 TruePoint, Siemens) with exception of the two patients from
Uppsala University Hospital, with whom another PET/CT was employed (Discovery ST, GE
Healthcare). All PET examinations were carried out in accordance with the standard clinical
protocol in order to maximize SUV accuracy. Approximately one hour after intravenous
injection of 4MBq FDG/kg (0.1081 mCi/kg), obtained from the in-house cyclotron, scans
were performed from the base of the skull to the proximal aspects of the thighs. Patient
weight and blood level of sugar were measured routinely and all subjects were instructed to
fast for 6 hours prior to the examination. PET acquisition was done in 3D carried out for 3
minutes for each bed position with normal tidal breathing. A low dose attenuation correction
CT and a full-dose diagnostic CT with intravenous contrast (tube tension 120kV, pitch 0,8,

31
slice thickness 1,2 mm and rotation speed 0,5 second) were performed.
All images were analysed retrospectively by a radiologist who had no information concerning
the clinical or radiological outcome, utilizing the commercial Siemens software provided by
the PET/CT manufacturer. Two-dimensional circles were drawn around ROIs in the
transverse plane of metastatic lesions and three-dimensional iso-contour lines drawn around
the volume with most FDG uptake as displayed in Figure 7. SUVmax was determined from
the voxel with the highest SUV within the same volume, the MTV as the entire volume
delineated and total lesion glycolysis as the MTV multiplied by the average SUV within the
same volume. The arbitrary SUV threshold was set to either 50% of SUVmax or a fixed
value of 2.5. A 1-cm3 spherical ROI was also drawn around the region demonstrating most
avid FDG uptake and all SUV values were normalized to lean body mass to obtain SULpeak
as recommended by PERCIST [61].
Figure 7. Encircled ROIs in one metastatic lesion. The single voxel measurement in the
centre is SUVmax, the entire metabolic volume around a fixed SUV threshold provides
MTV/TLG and a small spherical volume around the area with most avid FDG uptake gives
SULpeak.
Metabolic response was defined as at least a 30% reduction in either SUVmax, TLG50% or
TLG2.5 and metabolic progression as the appearance of new malignant lesions or at least a
30% increase in SUVmax, TLG50 or TLG2.5 in comparison to baseline. SULpeak was
assessed in accordance with the PERCIST criteria [61]. As many as five lesions were
assessed (no more than two per organ) and two parallel analyses conducted, one on all
changes in target lesions and the other only on the most FDG-avid lesions. Statistical
comparison of baseline PET characteristics to clinical outcome was also performed.
4.3.2 C11-acetate PET/CT examinations in Study 2
In order to evaluate monitoring of mCRPC by 11
C-acetate PET/CT, 60 PET/CT examinations

32
carried out on 30 patients with this disease at the time of initiation and during treatment with
abiraterone acetate were evaluated retrospectively. In addition, information on blood levels of
PSA, haemoglobin and alkaline phosphatase was obtained.
All of the patients were examined with the same PET scanner (Biograph 64 TruePoint,
Siemens), approximately 23 minutes after injection of 6-700 MBq 11
C-acetate (produced by
an in-house cyclotron). All CT assessments were full-tube diagnostic examinations without
intravenous contrast medium, otherwise performed according to the same standard protocol
as in Study 1. All examinations extended from the inferior cervical neck to the proximal
thighs.
The repeated 11
C-acetate PET/CT examinations were examined retrospectively by two
different readers who had no information concerning clinical or radiological outcome.
Lesions with the characteristic CT appearance (bone sclerosis, enlarged lymph nodes or
abnormal lesion in an organ) and elevated 11
C-acetate uptake were classified as metastases.
To adjust for variations in plasma clearance 11
C-acetate uptake was expressed relative to a
tumour-to-liver ratio. The PET response in connection with the follow-up examination was
assessed both qualitatively (visual grading of all metastatic lesions) and semi-quantitatively
by measuring the SUVpeak of the lesion demonstrating the most pronounced uptake. The CT
examination was analysed in accordance with RECIST1.1. In a separate analysis, a bone
lesion index was calculated employing an automated segmentation algorithm from General
Electric (GE) by which in areas exhibiting elevated 11
C-acetate with a SUV >3 and
corresponding CT attenuation >150 Hounsfield Units (HU), the volume of metastatic lesion
was measured. This volume was then divided by the total skeletal volume (areas with CT
attenuation >150 HU) to obtain an index. All evaluations were performed with the PET
VCAR software from GE Healthcare.
4.4 THE DWI EXAMINATIONS
In an initial attempt to implement DWI in clinical trials performed according to RECIST1.1,
we compared the number of lesions measured, their sizes, reduction in their size due to
treatment and finally, inter-observer variability as determined by DWI and CT. For this
purpose, five patients with mRCC were examined by both CT and DWI on the same day or
nearby days before and after three months of treatment with pazopanib.
33
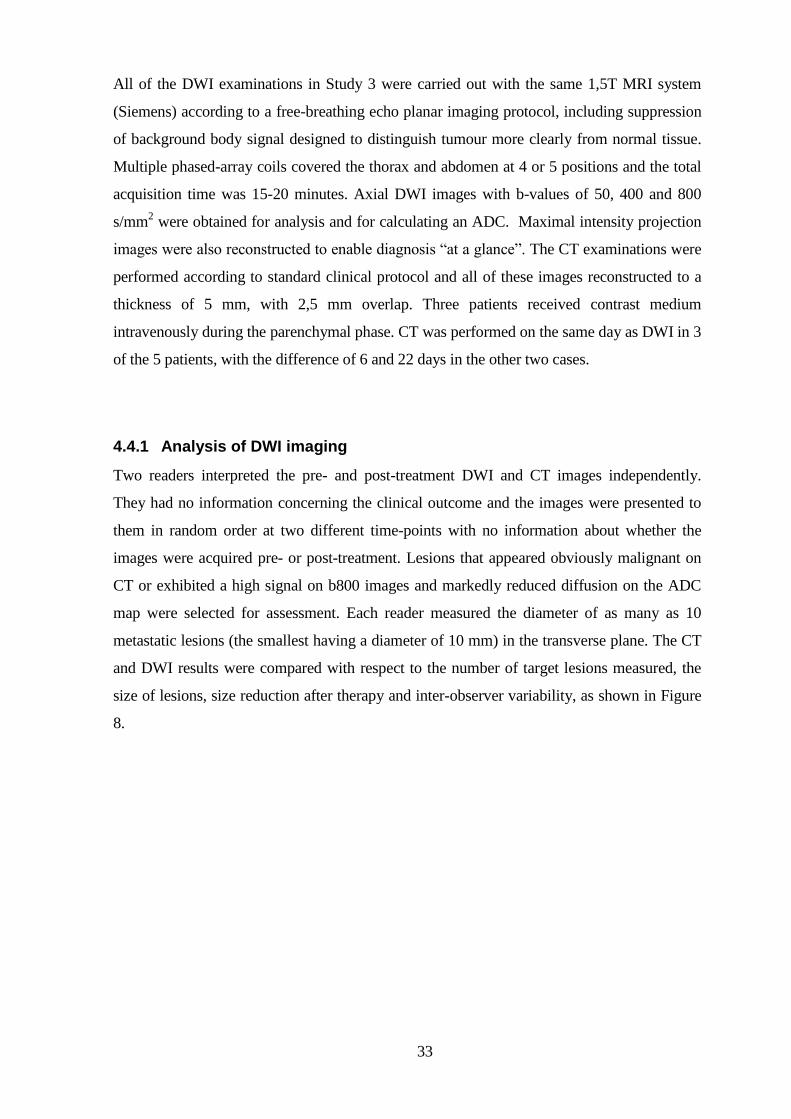
All of the DWI examinations in Study 3 were carried out with the same 1,5T MRI system
(Siemens) according to a free-breathing echo planar imaging protocol, including suppression
of background body signal designed to distinguish tumour more clearly from normal tissue.
Multiple phased-array coils covered the thorax and abdomen at 4 or 5 positions and the total
acquisition time was 15-20 minutes. Axial DWI images with b-values of 50, 400 and 800
s/mm2 were obtained for analysis and for calculating an ADC. Maximal intensity projection
images were also reconstructed to enable diagnosis “at a glance”. The CT examinations were
performed according to standard clinical protocol and all of these images reconstructed to a
thickness of 5 mm, with 2,5 mm overlap. Three patients received contrast medium
intravenously during the parenchymal phase. CT was performed on the same day as DWI in 3
of the 5 patients, with the difference of 6 and 22 days in the other two cases.
4.4.1 Analysis of DWI imaging
Two readers interpreted the pre- and post-treatment DWI and CT images independently.
They had no information concerning the clinical outcome and the images were presented to
them in random order at two different time-points with no information about whether the
images were acquired pre- or post-treatment. Lesions that appeared obviously malignant on
CT or exhibited a high signal on b800 images and markedly reduced diffusion on the ADC
map were selected for assessment. Each reader measured the diameter of as many as 10
metastatic lesions (the smallest having a diameter of 10 mm) in the transverse plane. The CT
and DWI results were compared with respect to the number of target lesions measured, the
size of lesions, size reduction after therapy and inter-observer variability, as shown in Figure
8.

34
Figure 8. The longest dimension as determined by DWI (to the left) and CT (in centre) was
measured and compared before and after treatment. An ADC map (to the right) confirmed
the identification of malignant lesions by DWI.
4.5 STATISTICAL ANALYSES
The Kaplan-Meier procedure and Cox proportional hazards model were employed to estimate
and describe survival from lifetime data in Studies 1 and 2. Confidence intervals and p-values
were calculated. The Spearman Rho test was applied to investigate non-parametric
correlations between PET response and PSA in Study 2. The non-parametric Wilcoxon
signed-rank test was utilized for comparison of the median differences between the PSA
scores in Study 2, as well as the number of lesions measured by the two different readers,
tumour length before and after treatment, and inter-observer variability in Study 3. All
statistical analyses were performed with the IBM SPSS software (version 21 and 22). PFS
was defined as the period that elapsed from enrolment in the study to the date on which the
patient experienced an event associated with disease progression (e.g., a laboratory test and/or
radiological or clinical assessment). PFS is sometimes considered to be a surrogate for OS,
the most reliable endpoint in clinical studies. PFS is usually evaluated when OS data are not
available.

35
5 RESULTS AND DISCUSSION
5.1 STUDY 1: MONITORING MRCC WITH FDG PET/CT
Although FDG-PET/CT uptake by mRCC is known to be variable [71, 72], PET/CT was
performed before and after treatment with a TKI in order to examine whether early metabolic
changes can predict outcome. In our cohort, univariate Cox regression analysis revealed that
high metabolic activity in the most FDG-avid lesion prior to treatment was negatively
associated with survival. Moreover, the clinical Heng factor score [73] was significantly
associated with outcome. These findings are consistent with previous reports [28, 74, 75],
although we observed no association between Eastern Cooperative Oncology Group (ECOG)
status or previous treatment and outcome.
The metabolic response in connection with the follow-up PET/CT examinations (as indicated
by SULpeak, TLG2.5 and TLG50 14 and 28 days after initiation of treatment) was
significantly associated with PFS and OS, although SUVmax was not. The largest study on
FDG-PET/CT monitoring of TKI treatment of RCC (n=44) conducted to date (Kayani et
al[28]) failed to show any association between FDG-PET response and outcome after one
month of treatment, but a negative association between elevated FDG uptake and survival
after three months of treatment. A key difference between this investigation and ours is that
these other researchers classified the PET response on the basis of the SUVmax for the most
FDG-avid lesion. Studies on patients with GIST have provided strong evidence that FDG-
PET can be used for early prediction of the response of such tumours to TKI [76-78]. For
example, Prior and co-workers were able to predict PFS employing the volume based
SUVpeak for the three most FDG-avid lesions after 4 weeks of treatment with sunitinib [79],
of course there may be essential biological differences between mRCC and GIST in this
context, but it is also possible that the single most FDG-avid voxel, as reflected in SUVmax,
chosen from only one of a patient’s many metastases might not be representative of the
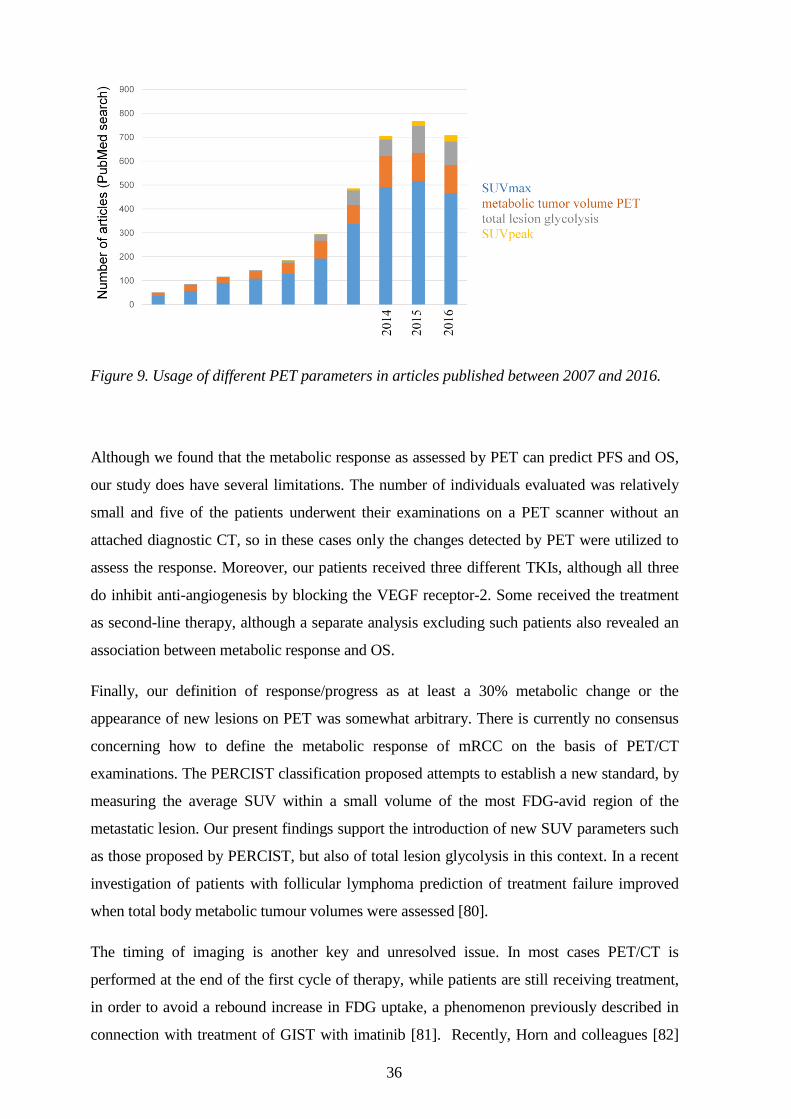
response by a widespread and heterogeneous mRCC. As shown in Figure 9, SUVmax is still
the PET parameter most commonly utilized, although there is also growing interest in
volume-based parameters such as metabolic tumour volume, total lesion glycolysis and the
SUVpeak.
36
Figure 9. Usage of different PET parameters in articles published between 2007 and 2016.
Although we found that the metabolic response as assessed by PET can predict PFS and OS,
our study does have several limitations. The number of individuals evaluated was relatively
small and five of the patients underwent their examinations on a PET scanner without an
attached diagnostic CT, so in these cases only the changes detected by PET were utilized to
assess the response. Moreover, our patients received three different TKIs, although all three
do inhibit anti-angiogenesis by blocking the VEGF receptor-2. Some received the treatment
as second-line therapy, although a separate analysis excluding such patients also revealed an
association between metabolic response and OS.
Finally, our definition of response/progress as at least a 30% metabolic change or the
appearance of new lesions on PET was somewhat arbitrary. There is currently no consensus
concerning how to define the metabolic response of mRCC on the basis of PET/CT
examinations. The PERCIST classification proposed attempts to establish a new standard, by
measuring the average SUV within a small volume of the most FDG-avid region of the
metastatic lesion. Our present findings support the introduction of new SUV parameters such
as those proposed by PERCIST, but also of total lesion glycolysis in this context. In a recent
investigation of patients with follicular lymphoma prediction of treatment failure improved
when total body metabolic tumour volumes were assessed [80].
The timing of imaging is another key and unresolved issue. In most cases PET/CT is
performed at the end of the first cycle of therapy, while patients are still receiving treatment,
in order to avoid a rebound increase in FDG uptake, a phenomenon previously described in
connection with treatment of GIST with imatinib [81]. Recently, Horn and colleagues [82]

37
compared FDG and FLT PET results for 19 patients with mRCC after 0, 1, 2 and 3 weeks of
sunitinib treatment. They showed an immediate and sustained proliferative (FLT) response
after one week of therapy, but with weaker prognostic value than the metabolic response (the
average SUVmax for as many as six metastatic lesions on FDG PET), which required at least
two weeks of treatment.
Although our results indicate little difference between the results of assessment from 2 to 4
weeks after initiation of treatment, these findings need to be confirmed in a larger trial in
which several different PET parameters are assessed. Preferably, a larger cohort of treatment
naïve patients with mRCC who is about to start treatment with a targeted therapy would
conduct a FDG PET/CT together with another imaging modality (DWI or contrast-enhanced
ultrasound) before and after three weeks of treatment.
38
5.2 STUDY 2: MONITORING CRPC WITH 11C-ACETATE PET/CT
Although the therapeutic options for patients with mCRPC are increasing rapidly and a
variety of techniques are currently used to diagnose recurrent and metastatic disease, none
has gained a dominant role in all clinical scenarios. Serum PSA, an established biochemical
marker, demonstrate relatively good correlation to total tumour burden, but limited value in
explaining clinical symptoms or for planning subsequent radiotherapy.
In study 2, 10 patients exhibited partial response (PR), 10 stable disease (SD) and 10
progressive disease (PD) upon comparison of the second PET/CT to the first. Those
exhibiting a PET/CT response had significantly longer PFS and OS. For the 19 patients with
a measurable target lesion on CT when treatment was initiated the corresponding numbers
were 4, 10 and 5 (PR/SD/PD) while the remaining 11 patients had only sclerotic bone
metastases that could not be assessed according to RECIST. A PSA response, defined as a
reduction in the serum level by more than 50%, occurred in 14 patients, of whom all but one
experienced partial response or stable disease as assessed by PET/CT.
More importantly, in the subgroup of patients without a PSA response, the OS of those
demonstrating PD on PET/CT differed from that of those with controlled disease (PR or SD).
Thus, 11
C-acetate PET/CT is of potential clinical value for patients in whom no PSA response
occurs. At the same time, the need of 11
C-acetate PET for general monitoring of mCRPC is
arguable, since at least in the current investigation the outcome could be predicted equally
well on the basis of CT alone and PSA. However, in cases where the PSA response is not
clear and only bone metastases are present, 11
C-acetate PET/CT could play a key role in
assessing response. It is also not yet known the extent to which expression of FASN, which
enzymatic activity is upregulated in aggressive forms of prostate cancer[33], can serve as a
surrogate biomarker for the response of mCRPC to treatment which might enhance interest in
11C-acetate as a radiotracer.
This study also had several limitations. The cohort consisted of only thirty patients and some
of these had already received several different treatments prior initiation of abiraterone
acetate. In addition, the inter-individual variation in 11
C-acetate uptake by normal tissues
required adjustment. Although we could not find any substantial evidence in the literature
that 11
C-acetate uptake by metastatic lesions differs from that by normal tissues, this remains
a hypothesis.

39
5.3 STUDY 3: MONITORING MRCC WITH DWI
Our third study was designed to examine whether DWI can be incorporated into radiological
assessments of response that follow the RECIST1.1 guideline. In addition to not requiring
any intravenous contrast medium or ionizing radiation, DWI can provide quantitative
information concerning the diffusivity of tissues (ADC-map), an aspect currently being
investigated extensively [83-85]. ADC reporting is not mentioned in RECIST1.1, and the
logical first step before implementing DWI in clinical trials would be to determine whether
measurement of tumour size as measured by DWI is reliable and in agreement with the
corresponding values obtained by CT.
The five patients in Study 3 underwent both CT and DWI examinations in close proximity in
time before and after three months of treatment. There were no significant differences in the
number of lesions measured per subject. A reduction in median tumour size was observed
with both approaches (from 32 to 29 mm with CT and from 30 mm to 28 mm with DWI).
There was no statistically significant difference when each lesion was assessed pre- and/or
post-treatment by the same reader on the basis of CT and DWI. Although the inter-observer
variability in connection with pre-treatment CT and pre- and post- treatment DWI was the
same, there was a significant difference between readers in connection with post-treatment
CT. A methodological consideration was that pulmonary metastases under influence of
motion artefacts were measured frequently (only lymph node metastases were measured more
frequently), which could have influenced measured dimensions. Another consideration is the
possible underestimation of tumour size on follow-up examinations due to necrosis induced
by treatment. This could be the reason why we found a larger mean difference between size
of the same lesion measured by CT and DWI on post-treatment (1.76 mm) examinations than
pre-treatment (1.31 mm) examinations.
This pilot indicates that further investigation of the applicability of DWI in RECIST1.1 trials
is warranted. Because of the small number of individuals examined there was an obvious risk
of a type II statistical error due to under-powering. Nonetheless, these results provide
important information for deciding sample size in connection with a larger trial. In a post-hoc
power analysis, we calculated that comparison of 2536 lesions is required in order detect any
significant difference between measurement by DWI and CT that might exist. One way to
overcome the sample size problem in a larger trial, is to choose another form of cancer than

40
mRCC. Breast cancer could be a suitable candidate, considering it metastasizes as solid
tumours in various organs and the increasing number of therapeutic options. In the present
study we employed measurements on DWI images with a b-value of 800. However, this
value was arbitrary chosen whether this or other b-values correspond best to measurements
by CT has to be further investigated. It could also be of interest to use several b-values, that
makes it possible to extrapolate a computed b-value of desired magnitude, which may show
higher agreement to CT than that of b-value 800.

41
6 SUMMARY OF FINDINGS
The following conclusions can be drawn from the work described here:
FDG-PET/CT can potentially provide a surrogate biomarker for the response of mRCC to
treatment with TKIs. Selection of the appropriate PET parameters appears to be of crucial
importance in this context and parameters including PET volume may be more reliable than
those based only on the highest pixel value.
Repeated 11
C-acetate PET/CT examinations can predict the clinical outcome of patients with
mCRPC undergoing treatment with abiraterone acetate. Although CT and serum PSA can
predict this outcome, CT fails to assess response in the large number of patient with bone
metastases only and PSA provides no information concerning the localization of tumour
burden.
Measurements on mRCC by DWI or CT appear to be in close agreement and initiation of a
larger trial investigating the feasibility of employing DWI in clinical trials that follow the
RECIST1.1 guideline is warranted.

42
7 FUTURE PERSPECTIVES AND CHALLENGES
As a consequence of innovations in the fields of molecular biology and technology,
molecular imaging is showing ever-greater promise. Hybrid PET/CT technology is standard
in many hospitals and PET/MRI is on the move from the laboratory to the clinic. Better
availability of scanners allows the introduction of more novel and specific
radiopharmaceuticals that fill present needs.
Despite its known drawbacks and the fact that it only reveals the basic metabolism of tissues,
FDG has definitely become a blockbuster for nuclear medicine and is continuously proving to
be valuable in more and more aspects of daily clinical work. Although FDG-PET has been
around for quite some time, many questions concerning interpretation of the results obtained
still remain to be answered, as demonstrated by this thesis. We can expect larger studies in
this area in the future going hand in hand with the introduction of novel oncological PET
tracers. The superior image resolution and better quantification by PET (5-7 mm) than with
single photon emission computed tomography (SPECT) (12-15 mm) favour the former,
although the longer half-lives time of the isotopes employed by SPECT enable labelling of
antibodies, fragments of antibodies or peptides for investigating biodistribution, targeting and
drug kinetics.
Some of the radiotracers of tomorrow have already been approved and are available, but their
clinical usefulness has yet to be proven. 18
F-Fluorothymidine (FLT), a non-metabolized
thymidine analogue, can serve as a tracer for tumour proliferation, but the fact that its uptake
into tumours is relatively low compared to that of FDG has so far limited its clinical use. This
situation might change as more cytostatic therapies are introduced and novel biomarkers of
tumour proliferation become desirable.
Hypoxia is another target for experimental imaging and among the several different tracers
available, 18
F-misonidazole (FMISO) is by far the most commonly used. Tumour hypoxia
may promote tumour progression and has been associated with failure of radio- and
chemotherapy [86, 87]. Although hypoxia, as visualized by FMISO, has not yet been shown
to be correlated with clinical outcome [88], such information might help in planning
treatment in the future. Although, tracers for metabolism (FDG), proliferation (FLT) and
hypoxia (FMISO) can provide insight into tumour behaviour, these are still relatively non-
specific and development of a tracer that binds to a specific receptor expressed uniquely on
the surface of cancer cells is highly desirable. 68
Ga coupled to prostate specific membrane
43
antigen (PSMA), which binds to surface proteins on prostate cancer cells, has recently shown
high potential for localizing the tumour within the prostate (87.5% accuracy) [89], as well as
distant metastatic lesions in patients with a PSA value of < 0.5 ng/mL [90].
In the case of breast cancer several attempts have been made to image specific therapeutic
targets, including estrogen receptors, the human epidermal growth factor receptor 2 (HER2)
receptor, the epidermal growth factor receptor and receptors involved in angiogenesis.
Trastuzumab, an antibody targeting HER2, has dramatically improved therapy for HER2-
positive patients. In a recent publication from 2016 small affibody molecules labelled with
68Ga were utilized to reveal HER2 expression in patients with metastatic breast cancer [91]. If
cancer cells can be distinguished definitely from normal tissue, it might be possible to follow-
up a diagnostic PET examination with a therapeutic one involving a radionuclide with
therapeutic properties, such as 177
Lu.
The field of body DWI has expanded rapidly during the last decade and is today not only
subject extensive research but also widely applied in clinical practice. MRI systems are
continuously improving in hardware and pulse sequence and a variety of platforms are in use.
The technological difference between MRI systems has created reproducibility issues that
remain a challenge, and in order to gain interest as a biomarker reproducible quantification is
essential. While early diffusion measurement protocols only employed a monoexponential
model, consisting of only two b-values, modern clinical MRI scanners employ protocols with
multiple b-values including very high values (exceeding 2000 s/mm2 as in diffusion kurtosis
imaging). This enables measurement of capillary perfusion and other flow phenomena [92],
but at the price of longer scan times. Optimal number of b-values, and what b-values to
select, are still unknown and more reports concerning this issue are to be expected.
Considering that DWI does not expose patients to any intravenous contrast media or ionizing
radiation, repeated examinations for assessment of tumour response to oncological treatment
may be in favour of DWI to CT. In particular, metastases of the bone (for example from
breast or prostate cancer) represent an area with unmet clinical need for a robust biomarker.
Bone metastases can be assessed rapidly by assessment of maximum intensity projections
images displaying high b-value signal reductions accompanied by rises in ADC [93], and it is
possible that this technique will replace conventional bone scans in the future.
PET/MRI combines the morphological, functional and molecular imaging potential of MRI
and PET. DWI provides PET/MRI with new potential concerning information on tissue
structure and biology, that are not possible with PET/CT [94]. For example, DWI may be
complementary to PET when examination is focused on finding small metastases of the liver,

44
where pathological FDG uptake is often blurred by physiological uptake. However, the most
exciting potential might not lie in lesion detection, but rather in combining information from
PET tracers more specific than FDG, for example FLT might come out negative concerning
the tumour proliferation while the lesion is picked-up with DWI.
It is desirable that the next generation of agents for molecular imaging allow accurate
visualization of the extent of the primary tumour (for correct staging), early diagnosing of
metastatic disease (making salvage treatment a realistic option), prediction of the response to
planned treatment (as a support in decision making) and finally, assessment of the early
response to any given treatment (to make it possible to change the treatment regime for non-
responders).

45
8 ACKNOWLEDGEMENTS
I wish to express my sincere gratitude to all those who made this thesis possible.
First, my main supervisor and good friend Professor Lennart Blomqvist. Always
enthusiastic, positive and definitely the quickest to reply to my questions. I was the
impossible PhD student finding interest in almost any area of imaging, except from that of the
rectum… We found common ground in exploring new things and I am grateful that you
introduced me to the exciting field of DWI!
My co-supervisor and good friend Per Sandström. When the person recruiting me for PhD
studies left for pharma industry, you stepped in and set me up with both patients and projects,
ultimately playing a key role in this thesis. We had a lot of fun together and I hope our
collaboration will continue in the future.
My other co-supervisor Per Grybäck, a good friend and the kindest boss, always wanting the
best for me.
Docent Anders Ullén, for good ideas and clinical expertise in the two PET-projects, and for
recruiting Agnes Wadelius who set up a brilliant excel sheet in the abiraterone paper.
Chikako Suzuki for scientific discussion and data collecting in the DWI paper. Roberto
Vargas-Paris for help with DWI sequences and together with Tuija Ö always making time
in the MR-camera.
Docent Peter Lindholm for great ideas and finding a smart way to finance many things in
this thesis.
Professors Hans J and Sten N for intiating a study I had the opportunity to finish, and Hans
for teaching me about PET and Nuclear Medicine in a sometimes an entertaining way.
Fellow PhD students Erik R for fun discussions about anything possible and/or impossible
including how to get published to advice on car cleaning, Fredrik J, Patricia S and Susanne
F for clinical advice and friendship.
Senior colleagues Mats B, Veli S, Jan B, Anita L, Jo R, Henry L, Kaj W, Fredrik V-B,
Staffan T, Hans O, Viveca R-H, Mikael S, Magnus T, Karin V-S and Michael Ö for
teaching me radiology.
Dan Grandér, Claes Karlsson and Ingemar Ernberg at Nation for inspiration and
friendship. Yihai Cao, for teaching me what it takes to perform real science.
My brothers, Filip and Simon for showing me the way and my parents Gunnel and Lars-
Ove for endless love and support. Lovisa and Nini for co-support and fun times.
Marianne, the love of my life, for giving me Alice, Tom and Adam, all I could ever ask for.

46
47
9 REFERENCES
1. Börje L: Cancerdiagnoser, Urinvägar. Regionala Cencercentrum i samverkan 2015.
2. Harmenberg Ulrika LB: Njurcancer. Internetmedicinse 2015-06-02. 3. Pfaffenroth EC, Linehan WM: Genetic basis for kidney cancer: opportunity
for disease-specific approaches to therapy. Expert opinion on biological therapy 2008, 8(6):779-790.
4. Palsdottir HB, Hardarson S, Petursdottir V, Jonsson A, Jonsson E, Sigurdsson MI, Einarsson GV, Gudbjartsson T: Incidental detection of renal cell carcinoma is an independent prognostic marker: results of a long-term, whole population study. J Urol 2012, 187(1):48-53.
5. O B: Cancerdiagnoser, Prostatacancer. Regionala Cencercentrum i samverkan 2015.
6. Brawley OW: Trends in prostate cancer in the United States. Journal of the National Cancer Institute Monographs 2012, 2012(45):152-156.
7. Scher HI, Halabi S, Tannock I, Morris M, Sternberg CN, Carducci MA, Eisenberger MA, Higano C, Bubley GJ, Dreicer R et al: Design and end points of clinical trials for patients with progressive prostate cancer and castrate levels of testosterone: recommendations of the Prostate Cancer Clinical Trials Working Group. J Clin Oncol 2008, 26(7):1148-1159.
8. Prostatacancer. Regionala Cencercentrum i samverkan 2015. 9. Casimiro S, Ferreira AR, Mansinho A, Alho I, Costa L: Molecular Mechanisms
of Bone Metastasis: Which Targets Came from the Bench to the Bedside? Int J Mol Sci 2016, 17(9).
10. Moe G: Enteral feeding and infection in the immunocompromised patient. Nutr Clin Pract 1991, 6(2):55-64.
11. Folkman J: Tumor angiogenesis: therapeutic implications. N Engl J Med 1971, 285(21):1182-1186.
12. Mita MM, Mita A, Rowinsky EK: The molecular target of rapamycin (mTOR) as a therapeutic target against cancer. Cancer Biol Ther 2003, 2(4 Suppl 1):S169-177.
13. McDermott DF, Drake CG, Sznol M, Choueiri TK, Powderly JD, Smith DC, Brahmer JR, Carvajal RD, Hammers HJ, Puzanov I et al: Survival, Durable Response, and Long-Term Safety in Patients With Previously Treated Advanced Renal Cell Carcinoma Receiving Nivolumab. J Clin Oncol 2015, 33(18):2013-2020.
14. Scott AM, Allison JP, Wolchok JD: Monoclonal antibodies in cancer therapy. Cancer Immun 2012, 12:14.
15. Basu S, Hess S, Nielsen Braad PE, Olsen BB, Inglev S, Hoilund-Carlsen PF: The Basic Principles of FDG-PET/CT Imaging. PET Clin 2014, 9(4):355-370, v.
16. Hanahan D, Weinberg RA: Hallmarks of cancer: the next generation. Cell 2011, 144(5):646-674.
17. Bos R, van Der Hoeven JJ, van Der Wall E, van Der Groep P, van Diest PJ, Comans EF, Joshi U, Semenza GL, Hoekstra OS, Lammertsma AA et al: Biologic correlates of (18)fluorodeoxyglucose uptake in human breast cancer measured by positron emission tomography. J Clin Oncol 2002, 20(2):379-387.

48
18. Brucher BL, Weber W, Bauer M, Fink U, Avril N, Stein HJ, Werner M, Zimmerman F, Siewert JR, Schwaiger M: Neoadjuvant therapy of esophageal squamous cell carcinoma: response evaluation by positron emission tomography. Ann Surg 2001, 233(3):300-309.
19. Kinahan PE, Fletcher JW: Positron emission tomography-computed tomography standardized uptake values in clinical practice and assessing response to therapy. Semin Ultrasound CT MR 2010, 31(6):496-505.
20. Soret M, Bacharach SL, Buvat I: Partial-volume effect in PET tumor imaging. Journal of nuclear medicine : official publication, Society of Nuclear Medicine 2007, 48(6):932-945.
21. Tong S, Alessio AM, Kinahan PE: Image reconstruction for PET/CT scanners: past achievements and future challenges. Imaging Med 2010, 2(5):529-545.
22. Adams MC, Turkington TG, Wilson JM, Wong TZ: A systematic review of the factors affecting accuracy of SUV measurements. AJR Am J Roentgenol 2010, 195(2):310-320.
23. Wang HY, Ding HJ, Chen JH, Chao CH, Lu YY, Lin WY, Kao CH: Meta-analysis of the diagnostic performance of [18F]FDG-PET and PET/CT in renal cell carcinoma. Cancer imaging : the official publication of the International Cancer Imaging Society 2012, 12:464-474.
24. Kontovinis LF, Papazisis KT, Touplikioti P, Andreadis C, Mouratidou D, Kortsaris AH: Sunitinib treatment for patients with clear-cell metastatic renal cell carcinoma: clinical outcomes and plasma angiogenesis markers. BMC Cancer 2009, 9:82.
25. Vercellino L, Bousquet G, Baillet G, Barre E, Mathieu O, Just PA, Desgrandchamps F, Misset JL, Hindie E, Moretti JL: 18F-FDG PET/CT imaging for an early assessment of response to sunitinib in metastatic renal carcinoma: preliminary study. Cancer biotherapy & radiopharmaceuticals 2009, 24(1):137-144.
26. Lyrdal D, Boijsen M, Suurkula M, Lundstam S, Stierner U: Evaluation of sorafenib treatment in metastatic renal cell carcinoma with 2-fluoro-2-deoxyglucose positron emission tomography and computed tomography. Nuclear medicine communications 2009, 30(7):519-524.
27. Minamimoto R, Nakaigawa N, Tateishi U, Suzuki A, Shizukuishi K, Kishida T, Miura T, Makiyama K, Yao M, Kubota Y et al: Evaluation of response to multikinase inhibitor in metastatic renal cell carcinoma by FDG PET/contrast-enhanced CT. Clinical nuclear medicine 2010, 35(12):918-923.
28. Kayani I, Avril N, Bomanji J, Chowdhury S, Rockall A, Sahdev A, Nathan P, Wilson P, Shamash J, Sharpe K et al: Sequential FDG-PET/CT as a biomarker of response to Sunitinib in metastatic clear cell renal cancer. Clin Cancer Res 2011, 17(18):6021-6028.
29. Ueno D, Yao M, Tateishi U, Minamimoto R, Makiyama K, Hayashi N, Sano F, Murakami T, Kishida T, Miura T et al: Early assessment by FDG-PET/CT of patients with advanced renal cell carcinoma treated with tyrosine kinase inhibitors is predictive of disease course. BMC cancer 2012, 12:162.
30. Lassau N, Koscielny S, Albiges L, Chami L, Benatsou B, Chebil M, Roche A, Escudier BJ: Metastatic renal cell carcinoma treated with sunitinib: early evaluation of treatment response using dynamic contrast-enhanced ultrasonography. Clinical cancer research : an official journal of the American Association for Cancer Research 2010, 16(4):1216-1225.
31. Cimitan M, Bortolus R, Morassut S, Canzonieri V, Garbeglio A, Baresic T, Borsatti E, Drigo A, Trovo MG: [18F]fluorocholine PET/CT imaging for the
49
detection of recurrent prostate cancer at PSA relapse: experience in 100 consecutive patients. European journal of nuclear medicine and molecular imaging 2006, 33(12):1387-1398.
32. Yoshimoto M, Waki A, Obata A, Furukawa T, Yonekura Y, Fujibayashi Y: Radiolabeled choline as a proliferation marker: comparison with radiolabeled acetate. Nuclear medicine and biology 2004, 31(7):859-865.
33. Prowatke I, Devens F, Benner A, Grone EF, Mertens D, Grone HJ, Lichter P, Joos S: Expression analysis of imbalanced genes in prostate carcinoma using tissue microarrays. British journal of cancer 2007, 96(1):82-88.
34. Leisser A, Pruscha K, Ubl P, Wadsak W, Mayerhofer M, Mitterhauser M, Hacker M, Kramer G, Shariat S, Karanikas G et al: Evaluation of fatty acid synthase in prostate cancer recurrence: SUV of [(11) C]acetate PET as a prognostic marker. The Prostate 2015, 75(15):1760-1767.
35. Yoshii Y, Furukawa T, Oyama N, Hasegawa Y, Kiyono Y, Nishii R, Waki A, Tsuji AB, Sogawa C, Wakizaka H et al: Fatty acid synthase is a key target in multiple essential tumor functions of prostate cancer: uptake of radiolabeled acetate as a predictor of the targeted therapy outcome. PLoS One 2013, 8(5):e64570.
36. Schumacher MC, Radecka E, Hellstrom M, Jacobsson H, Sundin A: [11C]Acetate positron emission tomography-computed tomography imaging of prostate cancer lymph-node metastases correlated with histopathological findings after extended lymphadenectomy. Scand J Urol 2015, 49(1):35-42.
37. Liesenfeld L, Kron M, Gschwend JE, Herkommer K: Prognostic Factors for Biochemical Recurrence More than Ten Years after Radical Prostatectomy. J Urol 2016.
38. Krause BJ, Souvatzoglou M, Tuncel M, Herrmann K, Buck AK, Praus C, Schuster T, Geinitz H, Treiber U, Schwaiger M: The detection rate of [11C]choline-PET/CT depends on the serum PSA-value in patients with biochemical recurrence of prostate cancer. European journal of nuclear medicine and molecular imaging 2008, 35(1):18-23.
39. Kjolhede H, Ahlgren G, Almquist H, Liedberg F, Lyttkens K, Ohlsson T, Bratt O: Combined 18F-fluorocholine and 18F-fluoride positron emission tomography/computed tomography imaging for staging of high-risk prostate cancer. BJU Int 2012, 110(10):1501-1506.
40. Le Bihan D: Molecular diffusion nuclear magnetic resonance imaging. Magn Reson Q 1991, 7(1):1-30.
41. Takahara T, Imai Y, Yamashita T, Yasuda S, Nasu S, Van Cauteren M: Diffusion weighted whole body imaging with background body signal suppression (DWIBS): technical improvement using free breathing, STIR and high resolution 3D display. Radiat Med 2004, 22(4):275-282.
42. Moffat BA, Hall DE, Stojanovska J, McConville PJ, Moody JB, Chenevert TL, Rehemtulla A, Ross BD: Diffusion imaging for evaluation of tumor therapies in preclinical animal models. MAGMA 2004, 17(3-6):249-259.
43. DeVries AF, Kremser C, Hein PA, Griebel J, Krezcy A, Ofner D, Pfeiffer KP, Lukas P, Judmaier W: Tumor microcirculation and diffusion predict therapy outcome for primary rectal carcinoma. Int J Radiat Oncol Biol Phys 2003, 56(4):958-965.
44. Theilmann RJ, Borders R, Trouard TP, Xia G, Outwater E, Ranger-Moore J, Gillies RJ, Stopeck A: Changes in water mobility measured by diffusion MRI
50
predict response of metastatic breast cancer to chemotherapy. Neoplasia 2004, 6(6):831-837.
45. Moffat BA, Chenevert TL, Lawrence TS, Meyer CR, Johnson TD, Dong Q, Tsien C, Mukherji S, Quint DJ, Gebarski SS et al: Functional diffusion map: a noninvasive MRI biomarker for early stratification of clinical brain tumor response. Proc Natl Acad Sci U S A 2005, 102(15):5524-5529.
46. Iima M, Le Bihan D: Clinical Intravoxel Incoherent Motion and Diffusion MR Imaging: Past, Present, and Future. Radiology 2016, 278(1):13-32.
47. Le Bihan D, Breton E, Lallemand D, Aubin ML, Vignaud J, Laval-Jeantet M: Separation of diffusion and perfusion in intravoxel incoherent motion MR imaging. Radiology 1988, 168(2):497-505.
48. Therasse P, Arbuck SG, Eisenhauer EA, Wanders J, Kaplan RS, Rubinstein L, Verweij J, Van Glabbeke M, van Oosterom AT, Christian MC et al: New guidelines to evaluate the response to treatment in solid tumors. European Organization for Research and Treatment of Cancer, National Cancer Institute of the United States, National Cancer Institute of Canada. J Natl Cancer Inst 2000, 92(3):205-216.
49. Eisenhauer EA, Therasse P, Bogaerts J, Schwartz LH, Sargent D, Ford R, Dancey J, Arbuck S, Gwyther S, Mooney M et al: New response evaluation criteria in solid tumours: revised RECIST guideline (version 1.1). Eur J Cancer 2009, 45(2):228-247.
50. Kruger S, Buck AK, Mottaghy FM, Hasenkamp E, Pauls S, Schumann C, Wibmer T, Merk T, Hombach V, Reske SN: Detection of bone metastases in patients with lung cancer: 99mTc-MDP planar bone scintigraphy, 18F-fluoride PET or 18F-FDG PET/CT. European journal of nuclear medicine and molecular imaging 2009, 36(11):1807-1812.
51. Chan Y, Chan K, Lam W, Metreweli C: Comparison of whole body MRI and radioisotope bone scintigram for skeletal metastases detection. Chin Med J (Engl) 1997, 110(6):485-489.
52. treatment. WHOWhfrroc: 1979, 48. 53. Krajewski KM, Nishino M, Ramaiya NH, Choueiri TK: RECIST 1.1 compared
with RECIST 1.0 in patients with advanced renal cell carcinoma receiving vascular endothelial growth factor-targeted therapy. AJR Am J Roentgenol 2015, 204(3):W282-288.
54. Stukalin I, Alimohamed N, Heng DY: Contemporary Treatment of Metastatic Renal Cell Carcinoma. Oncol Rev 2016, 10(1):295.
55. Benjamin RS, Choi H, Macapinlac HA, Burgess MA, Patel SR, Chen LL, Podoloff DA, Charnsangavej C: We should desist using RECIST, at least in GIST. J Clin Oncol 2007, 25(13):1760-1764.
56. Stroobants S, Goeminne J, Seegers M, Dimitrijevic S, Dupont P, Nuyts J, Martens M, van den Borne B, Cole P, Sciot R et al: 18FDG-Positron emission tomography for the early prediction of response in advanced soft tissue sarcoma treated with imatinib mesylate (Glivec). Eur J Cancer 2003, 39(14):2012-2020.
57. Choi H, Charnsangavej C, Faria SC, Macapinlac HA, Burgess MA, Patel SR, Chen LL, Podoloff DA, Benjamin RS: Correlation of computed tomography and positron emission tomography in patients with metastatic gastrointestinal stromal tumor treated at a single institution with imatinib mesylate: proposal of new computed tomography response criteria. J Clin Oncol 2007, 25(13):1753-1759.

51
58. Larson SM, Schwartz LH: 18F-FDG PET as a candidate for "qualified biomarker": functional assessment of treatment response in oncology. Journal of nuclear medicine : official publication, Society of Nuclear Medicine 2006, 47(6):901-903.
59. Juweid ME, Stroobants S, Hoekstra OS, Mottaghy FM, Dietlein M, Guermazi A, Wiseman GA, Kostakoglu L, Scheidhauer K, Buck A et al: Use of positron emission tomography for response assessment of lymphoma: consensus of the Imaging Subcommittee of International Harmonization Project in Lymphoma. J Clin Oncol 2007, 25(5):571-578.
60. Cheson BD, Pfistner B, Juweid ME, Gascoyne RD, Specht L, Horning SJ, Coiffier B, Fisher RI, Hagenbeek A, Zucca E et al: Revised response criteria for malignant lymphoma. J Clin Oncol 2007, 25(5):579-586.
61. Wahl RL, Jacene H, Kasamon Y, Lodge MA: From RECIST to PERCIST: Evolving Considerations for PET response criteria in solid tumors. Journal of nuclear medicine : official publication, Society of Nuclear Medicine 2009, 50 Suppl 1:122S-150S.
62. Shankar LK, Hoffman JM, Bacharach S, Graham MM, Karp J, Lammertsma AA, Larson S, Mankoff DA, Siegel BA, Van den Abbeele A et al: Consensus recommendations for the use of 18F-FDG PET as an indicator of therapeutic response in patients in National Cancer Institute Trials. Journal of nuclear medicine : official publication, Society of Nuclear Medicine 2006, 47(6):1059-1066.
63. Min SJ, Jang HJ, Kim JH: Comparison of the RECIST and PERCIST criteria in solid tumors: a pooled analysis and review. Oncotarget 2016, 7(19):27848-27854.
64. Kaplan ELM, P: Nonparametric estimation from incomplete observations. J Amer Statist Assn 1958, 53(282):457-481.
65. Breslow NE: Analysis of Survival Data under the Proportional Hazards Model. International Statistical Review / Revue Internationale de Statistique 1975, 43 (1): 45–57.
66. Cox DR: Regression-Models and Life Tables. Journal of the Royal Statistical Society 1972, 34 (2): 187–220. Retrieved 5 December 2012.
67. Machin C, Walters: Medical Statistics, a textbook for helath sciences.194-195.
68. J N: Outline of a Theory of Statistical Estimation Based on the Classical Theory of
Probability. Philosophical Transactions of the Royal Society of London Series A, Mathematical and Physical Sciences 1937, Vol. 236, No. 767 (Aug. 30, 1937), pp. 333-380:pp. 333-380.
69. Motzer RJ, Michaelson MD, Redman BG, Hudes GR, Wilding G, Figlin RA, Ginsberg MS, Kim ST, Baum CM, DePrimo SE et al: Activity of SU11248, a multitargeted inhibitor of vascular endothelial growth factor receptor and platelet-derived growth factor receptor, in patients with metastatic renal cell carcinoma. J Clin Oncol 2006, 24(1):16-24.
70. Kupsch P, Henning BF, Passarge K, Richly H, Wiesemann K, Hilger RA, Scheulen ME, Christensen O, Brendel E, Schwartz B et al: Results of a phase I trial of sorafenib (BAY 43-9006) in combination with oxaliplatin in patients with refractory solid tumors, including colorectal cancer. Clin Colorectal Cancer 2005, 5(3):188-196.
71. Majhail NS, Urbain JL, Albani JM, Kanvinde MH, Rice TW, Novick AC, Mekhail TM, Olencki TE, Elson P, Bukowski RM: F-18 fluorodeoxyglucose positron
52
emission tomography in the evaluation of distant metastases from renal cell carcinoma. J Clin Oncol 2003, 21(21):3995-4000.
72. Kumar R, Shandal V, Shamim SA, Jeph S, Singh H, Malhotra A: Role of FDG PET-CT in recurrent renal cell carcinoma. Nucl Med Commun 2010, 31(10):844-850.
73. Heng DY, Xie W, Regan MM, Warren MA, Golshayan AR, Sahi C, Eigl BJ, Ruether JD, Cheng T, North S et al: Prognostic factors for overall survival in patients with metastatic renal cell carcinoma treated with vascular endothelial growth factor-targeted agents: results from a large, multicenter study. J Clin Oncol 2009, 27(34):5794-5799.
74. Khandani AH, Cowey CL, Moore DT, Gohil H, Rathmell WK: Primary renal cell carcinoma: relationship between 18F-FDG uptake and response to neoadjuvant sorafenib. Nucl Med Commun 2012, 33(9):967-973.
75. Revheim ME, Winge-Main AK, Hagen G, Fjeld JG, Fossa SD, Lilleby W: Combined positron emission tomography/computed tomography in sunitinib therapy assessment of patients with metastatic renal cell carcinoma. Clin Oncol (R Coll Radiol) 2011, 23(5):339-343.
76. Cullinane C, Dorow DS, Kansara M, Conus N, Binns D, Hicks RJ, Ashman LK, McArthur GA, Thomas DM: An in vivo tumor model exploiting metabolic response as a biomarker for targeted drug development. Cancer Res 2005, 65(21):9633-9636.
77. Linden HM, Krohn KA, Livingston RB, Mankoff DA: Monitoring targeted therapy: is fluorodeoxylucose uptake a marker of early response? Clin Cancer Res 2006, 12(19):5608-5610.
78. Su H, Bodenstein C, Dumont RA, Seimbille Y, Dubinett S, Phelps ME, Herschman H, Czernin J, Weber W: Monitoring tumor glucose utilization by positron emission tomography for the prediction of treatment response to epidermal growth factor receptor kinase inhibitors. Clin Cancer Res 2006, 12(19):5659-5667.
79. Prior JO, Montemurro M, Orcurto MV, Michielin O, Luthi F, Benhattar J, Guillou L, Elsig V, Stupp R, Delaloye AB et al: Early prediction of response to sunitinib after imatinib failure by 18F-fluorodeoxyglucose positron emission tomography in patients with gastrointestinal stromal tumor. J Clin Oncol 2009, 27(3):439-445.
80. Meignan M, Cottereau AS, Versari A, Chartier L, Dupuis J, Boussetta S, Grassi I, Casasnovas RO, Haioun C, Tilly H et al: Baseline Metabolic Tumor Volume Predicts Outcome in High-Tumor-Burden Follicular Lymphoma: A Pooled Analysis of Three Multicenter Studies. J Clin Oncol 2016.
81. Van den Abbeele AD, Gatsonis C, de Vries DJ, Melenevsky Y, Szot-Barnes A, Yap JT, Godwin AK, Rink L, Huang M, Blevins M et al: ACRIN 6665/RTOG 0132 phase II trial of neoadjuvant imatinib mesylate for operable malignant gastrointestinal stromal tumor: monitoring with 18F-FDG PET and correlation with genotype and GLUT4 expression. Journal of nuclear medicine : official publication, Society of Nuclear Medicine 2012, 53(4):567-574.
82. Horn KP, Yap JT, Agarwal N, Morton KA, Kadrmas DJ, Beardmore B, Butterfield RI, Boucher K, Hoffman JM: FDG and FLT-PET for Early measurement of response to 37.5 mg daily sunitinib therapy in metastatic renal cell carcinoma. Cancer Imaging 2015, 15:15.
83. Galban CJ, Hoff BA, Chenevert TL, Ross BD: Diffusion MRI in early cancer therapeutic response assessment. NMR Biomed 2016.

53
84. Heijmen L, Verstappen MC, Ter Voert EE, Punt CJ, Oyen WJ, de Geus-Oei LF, Hermans JJ, Heerschap A, van Laarhoven HW: Tumour response prediction by diffusion-weighted MR imaging: ready for clinical use? Crit Rev Oncol Hematol 2012, 83(2):194-207.
85. Xie H, Sun T, Chen M, Wang H, Zhou X, Zhang Y, Zeng H, Wang J, Fu W: Effectiveness of the apparent diffusion coefficient for predicting the response to chemoradiation therapy in locally advanced rectal cancer: a systematic review and meta-analysis. Medicine (Baltimore) 2015, 94(6):e517.
86. Nordsmark M, Bentzen SM, Rudat V, Brizel D, Lartigau E, Stadler P, Becker A, Adam M, Molls M, Dunst J et al: Prognostic value of tumor oxygenation in 397 head and neck tumors after primary radiation therapy. An international multi-center study. Radiother Oncol 2005, 77(1):18-24.
87. Tamaki N, Hirata K: Tumor hypoxia: a new PET imaging biomarker in clinical oncology. Int J Clin Oncol 2016, 21(4):619-625.
88. Lee N, Nehmeh S, Schoder H, Fury M, Chan K, Ling CC, Humm J: Prospective trial incorporating pre-/mid-treatment [18F]-misonidazole positron emission tomography for head-and-neck cancer patients undergoing concurrent chemoradiotherapy. Int J Radiat Oncol Biol Phys 2009, 75(1):101-108.
89. Rahbar K, Weckesser M, Huss S, Semjonow A, Breyholz HJ, Schrader AJ, Schafers M, Bogemann M: Correlation of Intraprostatic Tumor Extent with (6)(8)Ga-PSMA Distribution in Patients with Prostate Cancer. Journal of nuclear medicine : official publication, Society of Nuclear Medicine 2016, 57(4):563-567.
90. van Leeuwen PJ, Stricker P, Hruby G, Kneebone A, Ting F, Thompson B, Nguyen Q, Ho B, Emmett L: (68) Ga-PSMA has a high detection rate of prostate cancer recurrence outside the prostatic fossa in patients being considered for salvage radiation treatment. BJU Int 2016, 117(5):732-739.
91. Sorensen J, Velikyan I, Sandberg D, Wennborg A, Feldwisch J, Tolmachev V, Orlova A, Sandstrom M, Lubberink M, Olofsson H et al: Measuring HER2-Receptor Expression In Metastatic Breast Cancer Using [68Ga]ABY-025 Affibody PET/CT. Theranostics 2016, 6(2):262-271.
92. Koh DM, Collins DJ, Orton MR: Intravoxel incoherent motion in body diffusion-weighted MRI: reality and challenges. AJR Am J Roentgenol 2011, 196(6):1351-1361.
93. Blackledge MD, Collins DJ, Tunariu N, Orton MR, Padhani AR, Leach MO, Koh DM: Assessment of treatment response by total tumor volume and global apparent diffusion coefficient using diffusion-weighted MRI in patients with metastatic bone disease: a feasibility study. PLoS One 2014, 9(4):e91779.
94. Bailey DL, Antoch G, Bartenstein P, Barthel H, Beer AJ, Bisdas S, Bluemke DA, Boellaard R, Claussen CD, Franzius C et al: Combined PET/MR: The Real Work Has Just Started. Summary Report of the Third International Workshop on PET/MR Imaging; February 17-21, 2014, Tubingen, Germany. Mol Imaging Biol 2015, 17(3):297-312.