monitoring soil-based ecosystem services in el … soil-based ecosystem services in el salvador sean...
TRANSCRIPT

Monitoring soil-based ecosystem
services in El Salvador
Sean Patrick Kearney, Edwin Garcia, Rolando Barillas, Steven J. Fonte, Aracely Castro, Kai M. A. Chan, Nicholas C. Coops, Sean M. Smukler March 8, 2014

Outline 2
Introduction
Research objectives
Methods
Project location and sampling
GIS analysis
Preliminary Results
Maps of soil properties and nutrient deficiencies
Next steps and applications
Translating soil properties into ecosystem services
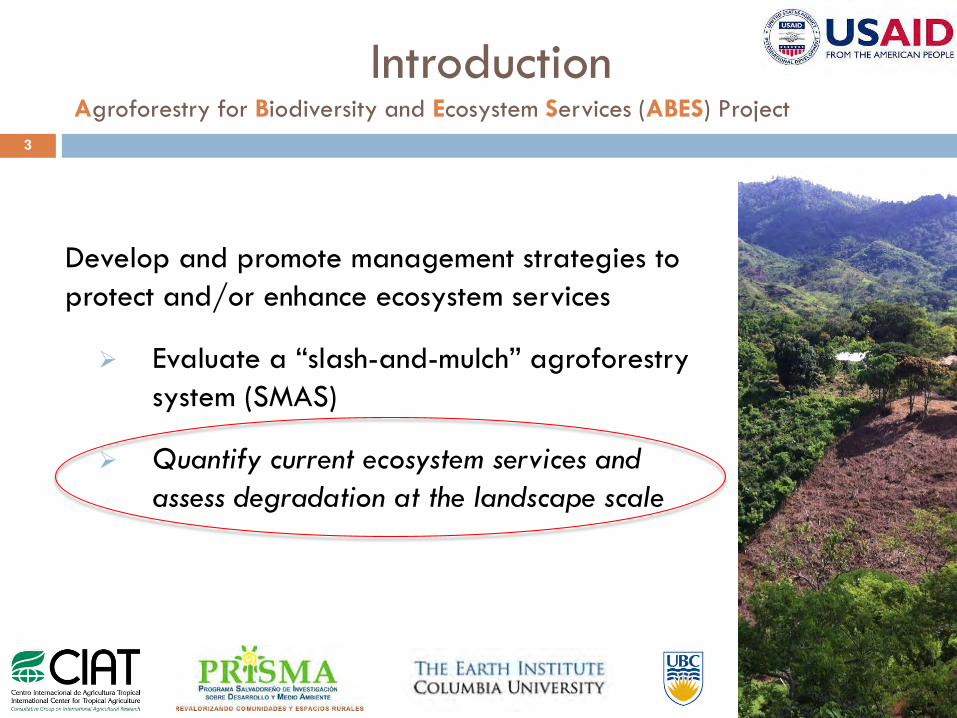
Introduction Agroforestry for Biodiversity and Ecosystem Services (ABES) Project
3
Develop and promote management strategies to
protect and/or enhance ecosystem services
Evaluate a “slash-and-mulch” agroforestry
system (SMAS)
Quantify current ecosystem services and
assess degradation at the landscape scale

Introduction 4
Quantify current ecosystem services (ES) and assess degradation
at the landscape scale
Measure
indicators
Assess
relationship
with ES
Map ES Value ES
Broad Indicators
Land use/cover
Soil quality
Erosion
Biodiversity (woody vegetation)
Biomass
Carbon storage

Methods

Location Details
o Elevation: 233 - 1643 m.a.s.l.
o Tropical climate: 22 - 26°C
o MAP: 1985 mm
Sampling (Nov-Dec 2012)
o 100 km2
o 144 sites
o Based on the LDSF
methodology
o Hierarchical cluster sampling
• Soils cores up to 1m
• Infiltration rate
• All woody vegetation
• Canopy/ground cover
• Observations
Methods Baseline Landscape Assessment (BLA)
6

Methods Soil analysis
7
Soil Property Analysis Method
Che
mic
al Pro
pert
ies
SOM FT-MIR (Walkeley-Black)
Total C FT-MIR
Total N FT-MIR (Keidel)
P Mehlich - 1
K Mehlich - 1
exch-Ca FT-MIR (KCl)
exch-Mg FT-MIR (KCl)
Zn Mehlich - 1
pH Soil:Water (1: 2.5)
Phy
sica
l Pro
pert
ies Sand Hydrometer
Silt Hydrometer
Clay Hydrometer
Soil Depth Auger Restriction (up to 1m)
Infiltration Rate Decagon MDI
Micro-plate prepped for FT-MIR analysis
FT-IR spectrometer (Tensor 37 with HTS-XT)

Methods Mapping using geostatistics
8
Co-Kriging
Predict values at unsampled locations
Incorporate cross-correlation with remote sensing
variables that are:
Higher resolution
Easier/cheaper to measure
Source: sciencegl.com

Methods Choosing co-variates
Spectral Layers (biotic) Terrain Layers (abiotic)
Soil
Pro
pert
ies
9
QuickBird Imagery (2.4m) ASTER DEM (30m)
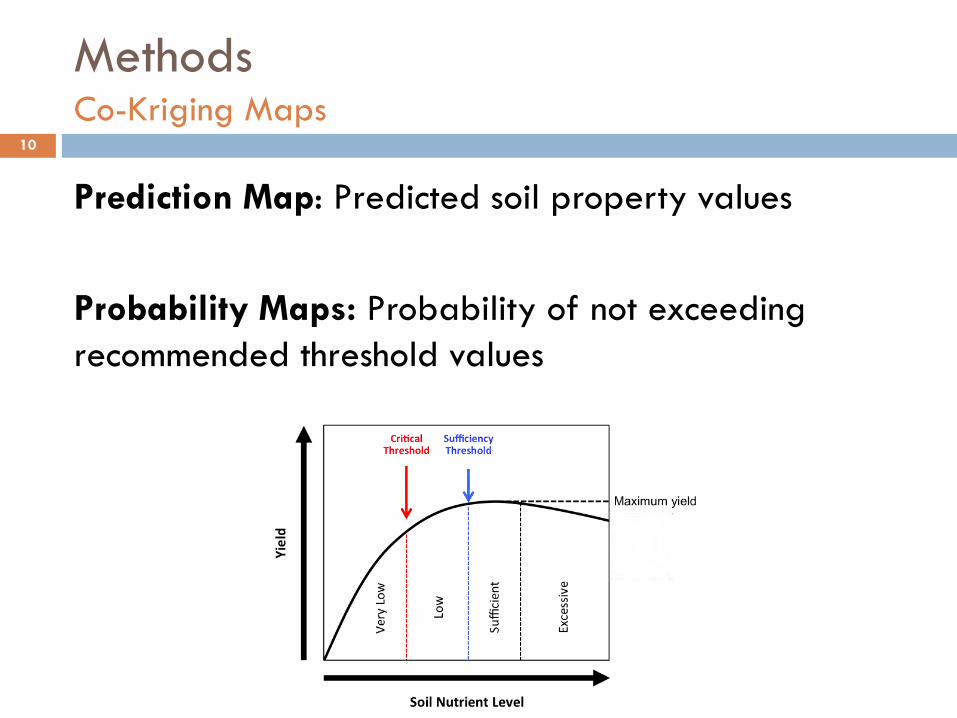
Methods Co-Kriging Maps
Prediction Map: Predicted soil property values
Probability Maps: Probability of not exceeding
recommended threshold values
10

Results

Results Example: Potassium
Topsoil K (mg kg-1)
Mean (n = 143) 115 (± 65) 1
Median 109
Minimum 13
Maximum 335
Sufficiency Threshold 175 (86%) 2
Critical Threshold 60 (26%) 2 1 Standard deviation 2 Percent of sample sites below threshold
Sample Results Co-Kriging Map Results
12
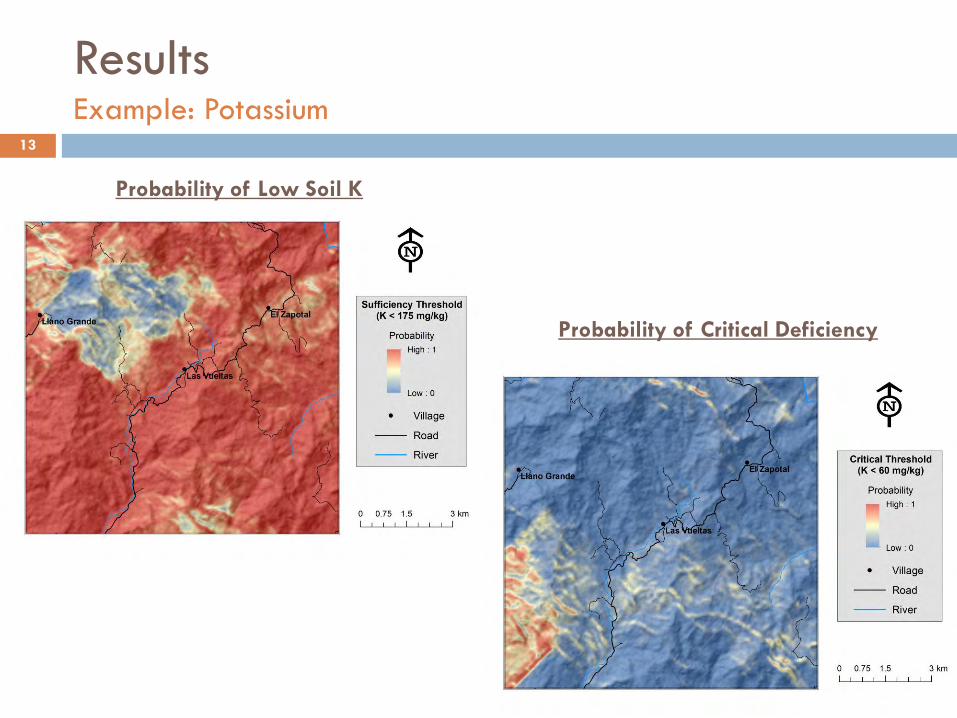
Results Example: Potassium
Probability of Low Soil K
Probability of Critical Deficiency
13

Topsoil Constraint Index (TCI)
Raster Math:
P1…n = probability of
value below sufficiency
threshold
n = Soil property
14

Next Steps and Applications

Next steps and applications Provisioning Services
Spatially specific dataset:
16
Example: Potassium (K)
Location: 14.094915, -88.891391
Predicted K: 43 - 67 mg/kg
Confidence: Moderate
Probability of deficiency (< 60 mg/kg): 78%
Recommended fertilization: 85.5 kg/ha of K2O
Predicted
Values
Probability of
Deficiency
Uncertainty
Estimates
What about Liebig’s Law of the Minimum and soil interactions?

17
Carbon storage
Erosion Risk
Biodiversity
Next steps and applications Regulatory Services
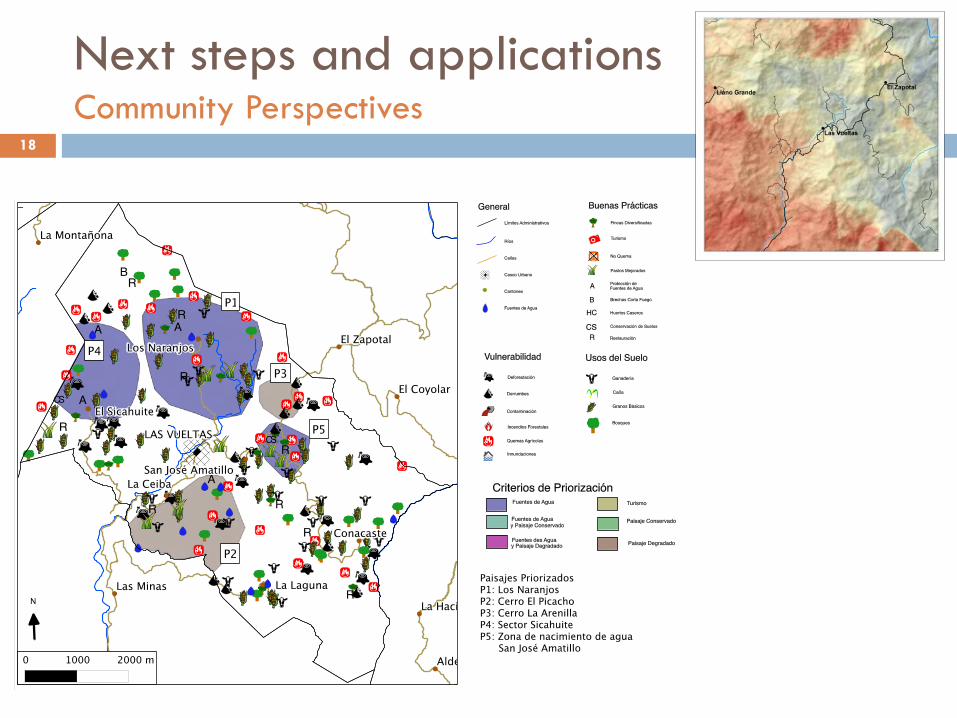
Next steps and applications Community Perspectives
18

Acknowledgements
Supervisor: Dr. Sean Smukler
Committee Members: Dr. Kai Chan, Dr. Nicholas Coops
Earth Institute at Columbia University, NY
Rolando Barillas
International Centre for Tropical Agriulture (CIAT)
Steve Fonte
Aracely Castro
Edwin Garcia
PRIMSA, El Salvador
19

Acknowledgements
The dedicated field crew
Luis, Victor, Jose, Jenny and many others!
20

Contact Info:
Sean Patrick Kearney
[email protected] | 604-724-9197
http://sal-lab.landfood.ubc.ca/
Thank you

Co-Kriging Results Nitrogen (Total N)
22

Co-Kriging Results Phosphorus (P)
23

Co-Kriging Results Calcium (exch-Ca)
24

Co-Kriging Results Magnesium (exch-Mg)
25

Co-Kriging Results Soil Organic Matter (SOM)
N/A
26

Co-Kriging Results Acidity (pH)
27

Co-Kriging Results Infiltration Rate
28

Co-Kriging Results Texture
29

Deforestation 30
*Created using data from
Hansen et al. 2013 ‘Global
Forest Change 2000-2012’

Randomizing sample plots 31

D = 17.84
m
r = 5.64 m Parcel: Measure all trees
with DBH > 10 cm
Center Sub-Plot: Measure
shrubs and all trees with
DBH < 10 cm
Upslope
Every sub-plot: Measure
canopy and ground cover (20
point measurements per sub-
plot)
0.1 ha
0.01 ha
Every sub-plot center: Take
soil samples at 0-20, 20-50,
50-80 and 80-100cm depths
32