monitoring procedure for solar cooling systems - …...task 38 solar air -conditioning and...
TRANSCRIPT

Task 38
Solar Air-Conditioning
and Refrigeration
Monitoring Procedure for Solar Cooling Systems
A joint technical report of subtask A and B (D-A3a / D-B3b)
Date: 2011, October 20th
Relevant version of the monitoring procedure: 110801_T38_MonProc_V6-0.xls
Authors: Assunta Napolitano1, Wolfram Sparber
1, Alexander Thür
2, Pietro
Finocchiaro3, Bettina Nocke
3
1 Institution EURAC research
Address Viale Druso 1, 39100 Bolzano, Italy
Phone 0039 0471 055 600
Fax 0039 0471 055 699
e-mail [email protected] [email protected]
2 Institution AEE INTEC
Address A-8200 Gleisdorf, Feldgasse 19
Phone +43 (0)3112 5886-26
Fax +43 (0)3112 5886-18
e-mail [email protected]
3 Institution Dipartimento per le Ricerche Energetiche ed
Ambientali (DREAM), Università di Palermo
Address Viale delle Scienze ed. 9, 90128 Palermo, Italy
Phone 0039 091 238 61908
Fax 0039 091 484 425

IEA SHC Task 38 Monitoring Procedure
2
Table of contents
1. Introduction ....................................................................................................................... 1
2. Selection of graphical representations .............................................................................. 2
2.1 Selection of a standard graphical scheme for the representation of real monitored installations 2
2.2 Selection of a standard graphical scheme for the representation of a reference system 5
3. Monitoring procedure ........................................................................................................ 7
3.1 Assumptions 7
3.1.1 Accuracy of the sensors 7
3.1.2 Efficiency of the conventional system 7
3.1.3 Primary energy conversion factors 8
3.2 Input data 9
3.2.1 General input data 9
3.2.2 Special input data required for DEC systems 10
3.3 Monitoring data elaboration and assessment 11
3.3.1 General key energy performance figures in the 1st monitoring level 11
3.3.2 General key energy performance figures in the 2nd
monitoring level 15
3.3.3 General key energy performance figures in the 3rd monitoring level 21
3.3.4 Special energy performance figures for DEC systems in the 3rd monitoring level26
3.4 Summary of the output of the procedure 29
4. How to fill in the monitoring procedure .............................................................................33
5. Conclusions .....................................................................................................................34
Bibliography .........................................................................................................................35

Table of Figures
Figure 2-1 Reference solar heating and cooling system including the single energy fluxes (SHC Max System) ................................................................................................................ 2
Figure 2-2 Example of a solar heating and cooling system of a specific installation based on the “SHC Max System” shown in Figure 2-1. ......................................................................... 5
Figure 2-3 Diagram of the selected conventional reference systems including energy flows . 6
Figure 3-1 Qualitative representation of the energy gap between solar radiation, heat collected by solar collectors and heat contribution from the back up source. .......................16
Figure 3-2 Connection between the heat back-up system and the solar collectors: shared hot storage .................................................................................................................................17
Figure 3-3 Connection between the heat back-up system and the solar collectors: direct use of the heat supplied by the back-up system .........................................................................18
Figure 3-4 Qualitative representation of heat needs, solar radiation and solar load contribution...........................................................................................................................21
Figure 3-5 Air-treatment in DEC-AHU (green line) and in conventional AHU (blue-red line); e.g.: reference inlet temperature = 20°C ..............................................................................27
Figure 3-6 Air-treatment in DEC-AHU (green line) and in conventional AHU (blue-red line); post heating up to the identical supply temperature as measured in the DEC-AHU .............27
Figure 3-7 Example for the solar energy source management in a SHDC system ...............32
Figure 3-8 Representation of an example for DEC process .................................................32

Table of tables
Table 1 List of electrical flows involved in a SHC system ...................................................... 3
Table 2 List of thermal flows involved in a SHC system ........................................................ 4
Table 3 List of water consumptions involved in a SHC system .............................................. 4
Table 4: Parameters which can be entered by the users ......................................................10
Table 5 Monitored data necessary for the completion of the 1st monitoring level ..................11
Table 6 Necessary measurements for the completion of the second monitoring level ..........15
Table 7 Necessary measurements for the calculation of the enthalpy differences (DH) .......28
Table 8: Output of the spreadsheet for the calculation of enthalpy differences (DH) ............28
Table 9 Summary of the output of the 1st monitoring level ....................................................29
Table 10 Summary of the output of the 2nd
monitoring level .................................................30
Table 11 Summary of the output of the 3rd monitoring level ..................................................31

1
1. Introduction Monitoring of installed solar assisted cooling systems represents a fundamental tool in order not only to optimize the monitored system itself, but as well to draw conclusions for a suited selection of design and control for future installations.
This is especially true for a technology in an early stage of market penetration, as it is the case for Solar Heating and Cooling (SHC) systems. In fact to the date, only around 300 SHC are documented worldwide.
Within the documented plants, 14 small scale (< 20 kW cooling capacity) and 12 large scale systems have been monitored.
In order to enable a structured collection of monitoring data and to define common performance figures for comparisons of SHC plants, a unified monitoring procedure has been developed.
The procedure aims at:
- evaluating a set of performance figures of monitored SHC systems;
- estimating the primary energy savings of monitored SHC systems with the respect to a conventional system;
- enabling the comparison between different monitored SHC systems.
On the basis of such output, the procedure could lead to the identification of best practices hence of best design solutions in relationship with the climate, the building features and use, occupation conditions and so on.
Furthermore the procedure defines the minimum monitoring equipment required to evaluate the energy performance of the existing systems. So it is not restricted to the IEA activities and the mentioned systems but can support the development of further monitoring campaigns.
Finally, the procedure should permit as well to draw (with the results) a learning curve over the coming years on the cost development of installed solar assisted heating and cooling systems.
The procedure can be applied for both Solar Heat Driven Chiller (SHDC) and Desiccant Evaporative Cooling (DEC) systems, even if for the latter case an additional tool has been developed.
This report describes the developed monitoring procedure which includes:
- one standard tool for the graphical representation of monitored systems (ppt-file);
- one standard tool for the visual representation of a conventional system as term of comparison with SHC systems (ppt-file);
- one excel file which enables the calculation of key figures such as primary energy ratio, electrical coefficient of performance, solar heat management efficiency and fractional savings with respect to a conventional (non solar) heating and cooling system;
- one more excel file to be applied in case of DEC systems with the aim at collecting very detailed monitoring data and derive intermediate figures useful for the evaluation of relevant energy performance with respect to a conventional system.

2
2. Selection of graphical representations The monitoring procedure aims at evaluating monitored systems and comparing them with a selected conventional system. Actually, depending on whether the monitored system is based on SHDC or DEC, the conventional system to be taken as reference is different.
To enable a clear and homogeneous representation of monitored systems and of the conventional system to be taken as reference for comparisons, two standard diagrams have been drawn which are below described.
2.1 Selection of a standard graphical scheme for the representation of real
monitored installations
A diagram (Figure 2-1) for the representation of monitored systems has been developed on the basis of commonly applied layouts for SHC systems. This scheme is available as a power point file (see Appendix) and enables to represent largely different systems. In fact the scheme can be adapted mainly by deleting those parts which do not exist in the system under investigation (see Figure 2-2 as an example).
∆ HAHU
Exhaust air
Inlet air
E16
E18 E19
DEC – Desiccant and evaporative cooling
Outlet air
Supply air
V2
Q_sol
Collector field
E1
E2
Q1
Q2D
E3
Q4
DHW
E5 V1
E14
E7
E4
Q3aSH
Q3b
E6
Q6b
Q6a
E11E8
Q7
Ab/Adsorbtion
cooling machine
(ACM)
Ho
t s
tora
ge
Co
ld s
tora
ge
E15
E13
E10
Q8
E9
Q10b
E17
Q10a
Ceiling
cooling
elements
Fan coils
E20Water treatment
Back up heat source
(conventionally powered
or RES or waste heat…)
Cooling tower
Back up cold source:
Compression chiller
or free cooling or…
Q… Heat flow
… Pump
E… Electricity consumption of pump
compression chiller, fan, motor, …
E12
Q2S
Q1S
Cooling
Figure 2-1 Reference solar heating and cooling system including the single energy fluxes (SHC Max System)
Electricity and thermal flows involved in a SHC system are shown in the figure. For a detailed explanation of each flow, refer to Table 1, Table 2 and Table 3.

IEA SHC Task 38 Monitoring Procedure
3
Table 1 List of electrical flows involved in a SHC system
Electricity consumer [kWh] Label
Heating System
pump collector field (primary loop) E1
pump collector field (secondary loop) E2
pump boiler hot-storage (including internal boiler consumption) E3
pump hot-storage to space heating (SH) E4
pump hot-storage to domestic hot water (DHW) E5
Cooling System
pump hot-storage to cooling machine E6
pump cooling machine (ACM) to cooling tower E7
pump cooling machine (ACM) to cold-storage E8
pump cold storage to cold distribution E9
pump back up source - cold storage E10
absorption/adsorption cooling machine (ACM) E11
compression chiller (back-up system) E12
pump compression chiller to fan (back-up system) E13
fan, cooling tower E14
fan of compression chiller ( back-up system) E15
Desiccant cooling/ dehumidification System
fan exhaust air E16
fan supply air E17
motor for desiccant wheel E18
motor for heat recovery wheel E19
Water treatment System
water treatment for wet cooling tower and humidifier for DEC E20
IEA SHC Task 38 Monitoring Procedure
4
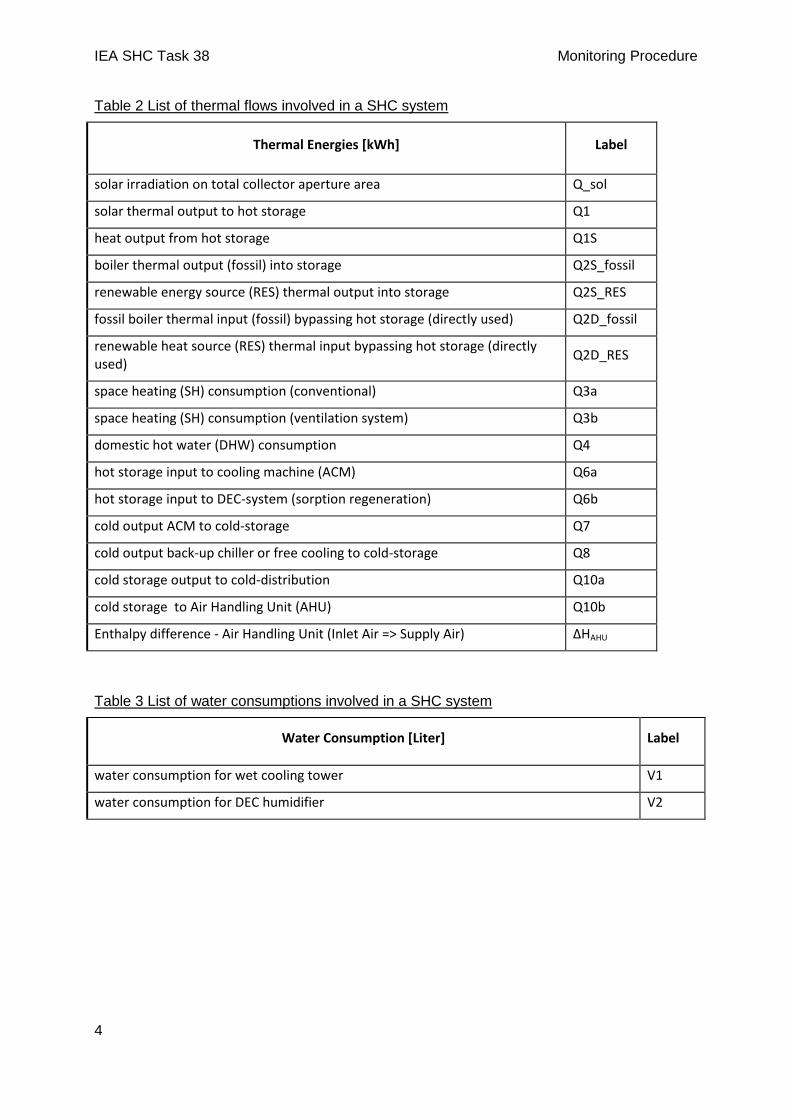
Table 2 List of thermal flows involved in a SHC system
Thermal Energies [kWh] Label
solar irradiation on total collector aperture area Q_sol
solar thermal output to hot storage Q1
heat output from hot storage Q1S
boiler thermal output (fossil) into storage Q2S_fossil
renewable energy source (RES) thermal output into storage Q2S_RES
fossil boiler thermal input (fossil) bypassing hot storage (directly used) Q2D_fossil
renewable heat source (RES) thermal input bypassing hot storage (directly used)
Q2D_RES
space heating (SH) consumption (conventional) Q3a
space heating (SH) consumption (ventilation system) Q3b
domestic hot water (DHW) consumption Q4
hot storage input to cooling machine (ACM) Q6a
hot storage input to DEC-system (sorption regeneration) Q6b
cold output ACM to cold-storage Q7
cold output back-up chiller or free cooling to cold-storage Q8
cold storage output to cold-distribution Q10a
cold storage to Air Handling Unit (AHU) Q10b
Enthalpy difference - Air Handling Unit (Inlet Air => Supply Air) ΔHAHU
Table 3 List of water consumptions involved in a SHC system
Water Consumption [Liter] Label
water consumption for wet cooling tower V1
water consumption for DEC humidifier V2
IEA SHC Task 38 Monitoring Procedure
5
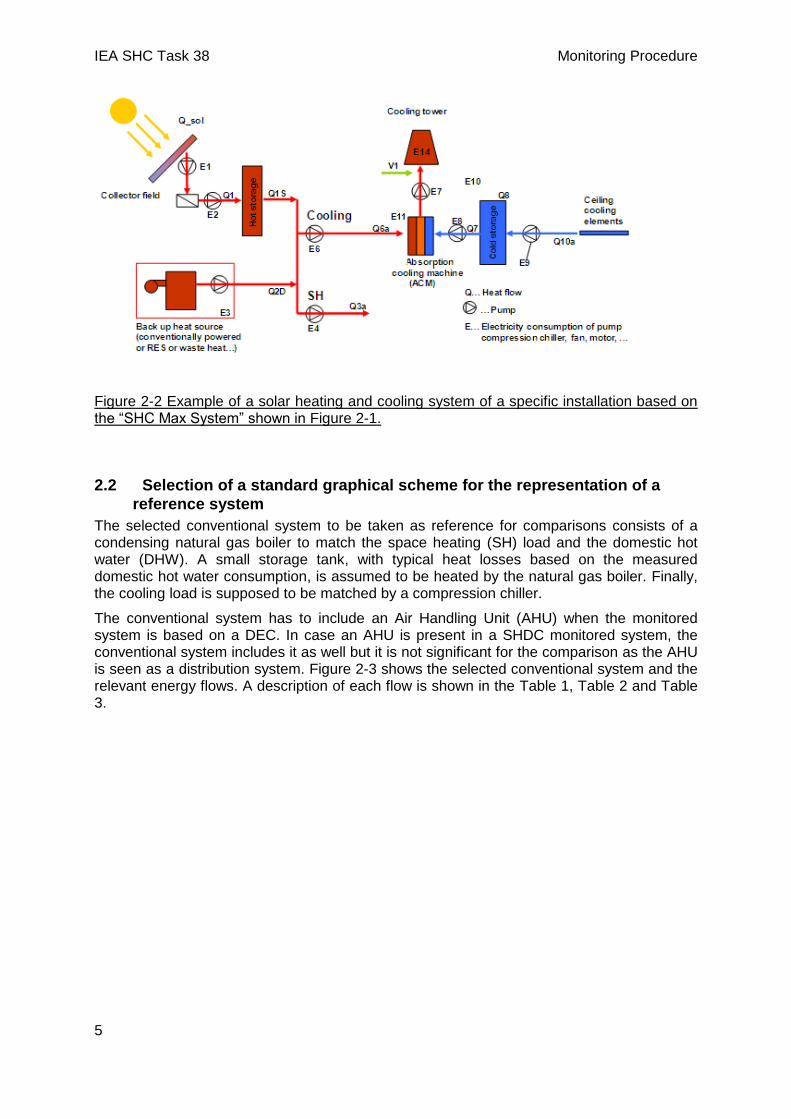
Figure 2-2 Example of a solar heating and cooling system of a specific installation based on the “SHC Max System” shown in Figure 2-1.
2.2 Selection of a standard graphical scheme for the representation of a
reference system
The selected conventional system to be taken as reference for comparisons consists of a condensing natural gas boiler to match the space heating (SH) load and the domestic hot water (DHW). A small storage tank, with typical heat losses based on the measured domestic hot water consumption, is assumed to be heated by the natural gas boiler. Finally, the cooling load is supposed to be matched by a compression chiller.
The conventional system has to include an Air Handling Unit (AHU) when the monitored system is based on a DEC. In case an AHU is present in a SHDC monitored system, the conventional system includes it as well but it is not significant for the comparison as the AHU is seen as a distribution system. Figure 2-3 shows the selected conventional system and the relevant energy flows. A description of each flow is shown in the Table 1, Table 2 and Table 3.

IEA SHC Task 38 Monitoring Procedure
6
E3
Back up heat source
(conventionally powered)
Q2
SH DHW
Exhaust air
Inlet air
E16
Outlet air
Supply air
E17
E15 E12
Ceiling cooling elements
fan coils
Air handling unit
Q3a Q4
Hot water
storage
E4
E5
Q… Heat flow
… Pump
E… Electricity consumption of pump, fan, motor, …
Q3b
Heat rejection
E13
E9
Back up cold source
Compression chiller
Q10a
Q10b
Figure 2-3 Diagram of the selected conventional reference systems including energy flows

IEA SHC Task 38 Monitoring Procedure
7
3. Monitoring procedure The monitoring procedure consists of an excel file where monitored data are collected and elaborated on monthly and yearly basis for both SHDC and DEC systems. For DEC systems one more excel file has been developed to collect and elaborate special data which are then integrated in the main file for a complete and correct performance evaluation.
The main excel file of the monitoring procedure consists of 3 levels:
1. First level: Basic Information on COP, Primary Energy Ratio and Costs;
2. Second level: Basic monitoring procedure mainly evaluating the solar heat management efficiency (kept simple in sense of calculation and necessary monitoring hardware);
3. Third level: Advanced monitoring procedure evaluating primary energy savings and specific COP`s of components and groups (more complex in sense of calculation and necessary monitoring hardware).
Several key figures are defined in each of the three levels and can be calculated depending on the sensors installed. In practice, each completed level of the procedure indicates a certain level of detail of the monitoring system.
3.1 Assumptions
Before going in detail with the monitoring procedure, it is necessary to list the major assumptions at the base of the monitoring data collection and elaboration.
3.1.1 Accuracy of the sensors
In order to enable a correct evaluation of the performance of a monitored solar heating and cooling system and a fair comparison between different systems, accuracy of measurements should be checked. Nevertheless, an estimation of the accuracy for the entire monitoring system installed is out of scope of the developed procedure. For this reason the tool only includes an estimation of the accuracy of the chilling power of the heat driven chiller (according to Eq. 1) and allows users to enter accuracies values for specific devices, such as signal conditioning devices, electricity energy counters and pyranometers.
It is highlighted that the tool does not set any benchmark for the accuracy values but only aims at informing about the reliability of the output data.
T
T2
c
c
V
V
Q
Q2
p
p
22
Eq. 1
3.1.2 Efficiency of the conventional system
Most key figures defined in the procedure for the evaluation of the performance of the monitored system require data on energy used for heating, cooling and DHW to be converted into primary energy.
The calculation of the energy use needs the definition of efficiency figures of the applied heating, cooling and DHW systems. In practice such efficiencies have to be defined for the heat and cold backup systems and depend of course on the technology used. Typical backup systems applied in the monitored installations are natural gas boilers and

IEA SHC Task 38 Monitoring Procedure
8
compression chillers. In these cases the efficiencies considered for the backup system in the monitored installations are the same as in the conventional system.
The use of common values for all the monitored installations enables the comparison between their performance results. For this reason some reference values have been defined, such as:
- Natural gas boiler efficiency
95.0boiler Eq. 2
- Seasonal Performance Factor of vapor compression chiller
elec
thref
kWh
kWh 8.2SPF Eq. 3
In case a boiler fired by renewable energy source (e.g. biomass) is applied, a special efficiency value can be used, labeled as:
90.0RES_boiler Eq. 4
All the default values listed efficiencies can also be substituted with special values in relationship with a different technology applied or according to the knowledge of the users (Refer to “3.2.1 General input data”).
3.1.3 Primary energy conversion factors
On the other hand it has been necessary to fix the primary energy factors for the main energy carriers used in the installations, i.e. electricity and fossil fuels like oil and natural gas
1. It is the “fossil” primary energy factor, which means how much fossil energy was used
in order to produce the delivered energy carrier.
pe
elec
eleckWh
kWh 40.0 Eq. 5
pe
th
fossilkWh
kWh 90.0 Eq. 6
1 Please note that the values selected are actually the reciprocal of the so called primary energy factors
defined according to the EN 15603

IEA SHC Task 38 Monitoring Procedure
9
Primary energy factors depend on the process beyond the delivery of the energy carriers to the building. To enable comparisons between the different monitored installations common values have been selected. However if the users are interested in making calculations according to special factors (national, local and so on), such values can also be defined as input.(Read “3.2.1 General input data”).
The procedure also enables the definition of primary energy factors for renewable energy carriers, e.g. biomass. As base values the following can be considered:
pe
th
kWh
kWh 10RES Eq. 7
One special case for the calculation of the primary energy is the utilization of cogeneration units as heat backup system.
In these cases, the calculation of the primary energy factor has to account for the electricity produced with the same fuel consumption. In practice the primary energy related with the electricity output by the prime motor is discounted from the primary energy entering the cogeneration unit, according to the formula below:
pe
th
elec
el
fuel
fuel
CHP
COGkWh
kWh
WQ
Q
Eq. 8
Where:
turbine or engine the from recovered heat the is CHPQ
fuel driving theofenergy input monitored theis uelfQ
fuel driving the for factor conversionenergy primary the is uelf
turbine or engine theby outputy electricit the is elW
yelectricit the for factor conversionenergy primary the is elec
Note that the calculated value represents the efficiency of the cogeneration unit but already includes the primary energy factor for the driving fuel.
3.2 Input data
3.2.1 General input data
General data on the system have to be entered: name, location and final use of the installation together with sizes, technologies and units of the major SHC components (i.e. solar collectors, TDC, tanks, back-up systems).
It is needed to adapt the standard scheme shown in Figure 2-1 to the monitored system and list the energy flows which are monitored according to Table 1. On the basis of the sensors available, different level of information can be derived which are represented by the three

IEA SHC Task 38 Monitoring Procedure
10
different levels of the procedure. Then the major input data are basically the monthly values measured by each listed sensor.
As already mentioned in the previous subchapter, the efficiencies of the machines and the primary energy factors can be also entered by the users according to special needs. So additionally to the above Tables, the parameters listed in Table 4 can be entered.
For instance if the users know the monthly efficiency of the installed boiler, this value can be entered and used for the calculation of the monthly and yearly energy use. On the other hand, if the primary energy factor of the location where the system is installed differs from the default value, it can also be entered.
Table 4: Parameters which can be entered by the users
Parameters Label
annual electricity generation efficiency elec
seasonal performance factor of the reference compression chiller SPFref
mean annual / monthly efficiency of the auxiliary boiler boiler
primary energy factor for fossil fuel fossil
mean annual / monthly efficiency of the RES device RES
primary energy factor for RES fuel RES
mean annual / monthly efficiency of the reference boiler boiler,ref
3.2.2 Special input data required for DEC systems
In the case of DEC systems further data are needed, especially for the 1° and the 3° level. Inputs for the 3° level partly have to be calculated in an extra excel file (110801_T38_MonProc_V6-0_DH-calc.xls) which has been developed to calculate the following monthly values based on high resolution monitoring data (e.g. 5 minutes):
- reference electricity consumption of the AHU (necessary for the 1° and the 3° level);
- reference enthalpy difference of the AHU supply air mass flow (3° level);
- reference enthalpy difference obtained from single components indoors the conventional AHU, such as dehumidification coil, post-cooling coil, post-heating coil (3° level).
For this reason, the following monitoring data in reasonable time steps (5 to 10 minutes are recommended) from the DEC AHU are required to be able to do the calculations in this excel tool:
1. Heating is ON or OFF [1 or 0]

IEA SHC Task 38 Monitoring Procedure
11
2. Cooling is ON or OFF [1 or 0]
3. Inlet Air Temperature [°C]
4. Inlet Air relative Humidity [%]
5. Supply Air Temperature [°C]
6. Supply Air relative Humidity [%]
7. Outlet Air Temperature [°C]
8. Supply Air Flow [kg/h]
Additionally the following parameters need to be defined:
1. The supply air temperature of the reference AHU: “t supply max conv.” [°C]; as standard 20°C is set.
2. The heat recovery ratio of the reference heat recovery wheel: “Reference Heat Recovery“; as standard 75% is set.
3. Minimum supply air flow rate [kg/h] which indicates if the AHU is in operation or not. This value is only used if in the monitoring data no status value for “Heating is ON or OFF” and “Cooling is ON or OFF” is given.
The calculated values are finally presented in the worksheet “introduction” in a light green marked field which can directly be transferred to the main excel tool by copy and paste as explained in the tool.
3.3 Monitoring data elaboration and assessment
3.3.1 General key energy performance figures in the 1st monitoring level
In the first level, an overall evaluation for the entire system is done by calculating coefficients of performances (COP) and primary energy ratios (PER) on both monthly and yearly basis.
The inputs necessary for the achievement of this level are listed in Table 5
Table 5 Monitored data necessary for the completion of the 1st monitoring level
Electricity consumer [kWh] Label
Overall electricity consumption of the energy facility (the overall and only sensors listed in Table 1 are included)
Eelec,overall
Heating System
pump hot-storage to space heating (SH) E4
pump hot-storage to domestic hot water (DHW) E5
Cooling System

IEA SHC Task 38 Monitoring Procedure
12
pump cold storage to cold distribution E9
Desiccant cooling/ dehumidification System
fan exhaust air (eventually fan regeneration air) E16
fan supply air E17
Thermal Energies [kWh] Label
boiler thermal output (fossil) into storage Q2S_fossil
renewable energy source (RES) thermal output into storage Q2S_RES
fossil boiler thermal input (fossil) bypassing hot storage (directly used) Q2D_fossil
renewable heat source (RES) thermal input bypassing hot storage (directly used) Q2D_RES
space heating (SH) consumption Q3a
domestic hot water (DHW) consumption Q4
cold storage output to cold-distribution Q10a
Enthalpy difference - Air Handling Unit (Inlet Air => Supply Air) ΔHAHU
The 1st monitoring level aims at comparing the useful heat and cold supply with the
correspondent electricity or primary energy spent in the operation.
The total electrical COP (COPel,tot) calculates the ratio of useful heat and/or cold in relation to the electricity consumption needed but excludes the electrical consumption of pumps and fans which are used to distribute heat and/or cold in the building by pumping water or blowing air (i.e. the so labelled Eelec,tot = Eelec,overall–E4-E5-E9-E16-E17).
elec
thAHU
tot,elkWh
kWh
tot,Eelec
H4Qa10Qa3QCOP Eq. 9
The overall electrical COP (COPel,overall) includes also all the electrical consumers for distribution (i.e. the so labelled Eelec,overall)
elec
thAHU
overall,elkWh
kWh
overall,Eelec
H4Qa10Qa3QCOP Eq. 10
At this monitoring level, to calculate the Eelec,overall is not needed to have all the relevant electricity meters installed, but just one meter on the overall consumption of the facility. To calculate the Eelec,tot is then needed at least one overall meter and the measurement of the electrical consumption of the distribution pumps (E4, E5 and E9). In case the monitored

IEA SHC Task 38 Monitoring Procedure
13
system includes a conventional AHU, this is considered as a distribution system and the electricity consumed for fans (E16 and E17) should be subtracted from Eelec,overall too. If the monitored system includes a DEC AHU, only the additional electricity due to special DEC components (see chapter 3.3.2) should be considered in Eelec_overall. So further measurements are needed, or at least pressure drops of the single AHU components must be known to be able to calculate the nominal pressure drops of the DEC AHU and a Reference AHU resulting in a correction factor which is used to estimate the additional electricity consumption of the fans due to the DEC components.
Primary energy ratio is calculated for the monitored installation as the ratio of useful heat and/or cold in relation to the primary energy demand.
pe
th
elecboiler_RESboilerfossil
AHU
kWh
kWh
ε
totEelec,
η*ε_RES
Q2_RES_tot
η*ε
totQ2_fossil_
ΔHQ4Q10aQ3aPER_res
Eq. 11
Where:
fossil_D2Qfossil_S2Qtot_fossil_2Q Eq. 12
RES_D2QRES_S2Qtot_RES_2Q Eq. 13
Note that AHUH has only to be included when the monitored system is based on DEC. In
case the monitored system includes a conventional AHU, this is considered as a distribution system and Q3a actually includes the heat which is then transferred to all the distribution system, AHU included.
In case back up systems based on renewable energy are installed, the procedure can also evaluate the impact of such RES compared to a conventional system according to:
pe
th
elecboiler_RESfossilboilerfossil
kWh
kWh
ε
totEelec,
η*ε
Q2_RES_tot
η*ε
totQ2_fossil_
ΔAHUQ4Q10aQ3aPER_fossil
Eq. 14
In comparison with Eq. 11, Eq. 14 considers Q2 produced from RES as produced by fossil fuel but with the same efficiency of RES technology used. In this way the influence of the much more advantageous primary energy factor for RES is eliminated and the RES-system can be compared with a fossil-system based on the same fuel type (but of course different boiler efficiency is still a weak point which should be kept in mind).
Additionally a PER is calculated also for the supposed conventional system according to:

IEA SHC Task 38 Monitoring Procedure
14
pe
th
elec
refel,
elecref
refcooling,
boilerfossil
refboiler, kWh
kWh
ε
E
ε*SPF
Q
η*ε
Q
ΔAHUQ4Q10aQ3aPERref
Eq. 15
The so called Qboiler,ref not only takes into account the heat load of the monitored installation for heating and DHW purposes but of course includes also the possible heat losses of the storage for DHW in the reference system according to IEA SHC Task26: ENV 12977-1 (2000); (Weiss, Ed. 2003). So, it is defined as:
thloss_refrefboiler, kWh QQ4Q3bQ3aQ Eq. 16
Where:
thTDloss_ref kWh 8760*_TaT*V*0.75*0.00016Q Eq. 17
And:
VD : average daily hot water consumption (liter / day)
TT : set point temperature of the hot water tank (default 52.5 °C)
Ta : ambient temperature around the hot water tank (default 15 °C) Note that Q3b has to be entered only when the monitored system is based on DEC. In case the monitored system includes a conventional AHU, this is considered as a distribution system and Q3a actually includes the heat which is then transferred to all the distribution system, AHU included.
The so called Eel,ref, is the electrical consumption of the conventional system which includes the consumption for operating the boiler and the pump between the boiler and the storage. This is the only item which differs from the electrical consumption of a SHDC in the heating mode. The electricity consumed by a conventional system in the cooling mode is taken into account in the SPFref.
In case the monitored system is based on a DEC AHU, the Eel,ref includes the electrical consumption of the corresponding AHU as described in subchapter 3.3.4.
For conventional systems to be compared to SHDC systems:
elecref_lossref_el kWh )Q4Qb3Qa3Q(*02.0E Eq. 18
The value 0.02 kWhel/kWhth is an assumption to be taken into consideration for small boilers and in case no real value is available (low level of detail of monitoring). In a very detailed monitoring, one more calculation procedure has been defined as described later.

IEA SHC Task 38 Monitoring Procedure
15
The so-labeled Qcooling,ref is the cooling supplied to the load, (i.e. Q10a) and in a conventional system is entirely supplied by a compression chiller. In the 1
st monitoring level it
is enough to monitor Q10a and assume a proper SPF which takes into account all the relevant electrical consumption, i.e., with reference to Figure 2-3, not only E12 but also E13 and E15, e.g. the default value of SPFref. In a very detailed monitoring, one more calculation procedure has been defined to derive Qcooling,ref which is described later.
At the end of the 1st monitoring level one economic figure, the Cost Per kW, is calculated
according to:
kW
k€
installedcapacity Cooling
system cooling totalofCost CPK Eq. 19
3.3.2 General key energy performance figures in the 2nd
monitoring level
In the second level mainly the quality of the subsystems solar thermal heat production and heat management within the system are evaluated.
The necessary measurements only concern thermal flows (Table 6).
Table 6 Necessary measurements for the completion of the second monitoring level
Thermal Energies [kWh] Label
solar irradiation on total collector aperture area Q_sol
solar thermal output to hot storage Q1
heat output from hot storage Q1S
boiler thermal output (fossil) into storage Q2S_fossil
renewable energy source (RES) thermal output into storage Q2S_RES
fossil boiler thermal input (fossil) bypassing hot storage (directly used) Q2D_fossil
renewable heat source (RES) thermal input bypassing hot storage (directly used) Q2D_RES
space heating (SH) consumption Q3a
space heating (SH) consumption (ventilation system) Q3b
domestic hot water (DHW) consumption Q4
hot storage input to cooling machine (ACM) Q6a
hot storage input to DEC-system (sorption regeneration) Q6b
First, the efficiency of solar collectors is estimated by means of:

IEA SHC Task 38 Monitoring Procedure
16
Qsol
1Qutil,coll Eq. 20
Hence losses in the collectors are given by (Figure 3-1):
thkWh 1QQsolQsol Eq. 21
Q1 Q2_total sumQsol
Figure 3-1 Qualitative representation of the energy gap between solar radiation, heat collected by solar collectors and heat contribution from the back up source.
The solar energy collected per square meter of the collector:
2m
kWh
Area Aperture Collector
Q1dQcoll_yiel Eq. 22
Solar cooling systems can be:
- solar autonomous systems: the cooling load is covered only by solar energy. In these systems only solar collectors supply heat to the thermally driven chiller, and eventually to the heating and sanitary hot water systems; no back-up system is available to provide heat to the thermally driven chiller.
- solar assisted systems: only a part of the cooling load is covered by solar energy. In these systems the solar collectors can represent an additional heat source assisting a conventional heat source for the delivery of the needed thermal energy to operate the thermally driven chiller; usually the same heat source is also used to provide heat to the

IEA SHC Task 38 Monitoring Procedure
17
DHW and the heating system. For cooling applications also a back-up on the cold side is possible, using conventional vapor compression chillers.
As the majority of installations are solar assisted systems, it is useful to compare the solar use with the contribution from the heat back up source (Figure 3-1). In order to define suitable figures assessing the solar fraction, it is needed to distinguish three cases on the basis of the integration of the heat back up system.
Usually the heat acquired by the solar collectors is stored in buffer tanks before being used.Back-up systems can be connected to the same storage as the solar collectors (Figure 3-2) or supply the load directly, or allowing for both the types of connection (Figure 3-3).
Q_sol
Collector field
E1
E2
Q1
E3
Ho
t s
tora
ge
Back up heat source
(conventionally powered
or RES or waste heat…)
Q2S
Q1S
Figure 3-2 Connection between the heat back-up system and the solar collectors: shared hot storage
When the solar heat buffer is shared with the heat backup system, only Q2S is available as shown in Figure 3-2. Thereby::
thkWh 0fossil_D2Q Eq. 23
thkWh 0RES_D2Q Eq. 24
S2QRES_S2Qfossil_S2Q
RES_D2QRES_S2Qfossil_D2Qfossil_S2Qsum total_2Q
Eq. 25

IEA SHC Task 38 Monitoring Procedure
18
In these cases, as the output of the storage includes both the input from solar and back-up system, the storage solar fraction, defined as the ratio between the heat collected by the solar collectors and the heat produced by the backup system, is calculated according to:
Q2SQ1
Q1SFhotstorage
Eq. 26
Q_sol
Collector field
E1
E2
Q1
Q2D
E3
Ho
t s
tora
ge
Back up heat source
(conventionally powered
or RES or waste heat…)
Q2S
Q1S
Figure 3-3 Connection between the heat back-up system and the solar collectors: direct use of the heat supplied by the back-up system
If the heat delivered by the back-up system is also directly used like in Figure 3-3, i.e. Q2D is not null, the output from the storage due to the solar collectors is given by:
thkWh Q2SQ1
Q1*Q1S
Eq. 27
Hence the storage solar fraction amounts to:

IEA SHC Task 38 Monitoring Procedure
19
sum Q2_totalQ1
Q2SQ1
Q1Q1s
SFhotstorage
Eq. 28
Note that in cases such as Figure 3-3 :
Q2DQ2SQ2_RESQ2_fossil
Q2D_RESQ2S_RESQ2D_fossilQ2S_fossilsum Q2_total
Eq. 29
One special application of the Eq. 28 is when the heat from the back up source is only directly used, i.e.
thkWh 0Q2SQ2S_RESQ2S_fossil Eq. 30
Under Eq. 30, Eq. 28 becomes:
Q2DQ1
Q1sSFhotstorage
Eq. 31
The losses through the buffer tank are calculated as the difference between the input and the output, if the latter is known.
thkWh (Q1S)Q2S_RES)Q2S_fossil(Q1eQ_loss_stg Eq. 32
In case, the output of the storage tanks is not known and the buffer tank is shared with the heat back-up system, the efficiency of the storage can be estimated as follows:
thkWh )6Qb3Q4Qa3Q()RES_S2Qfossil_S2Q1Q(stge_loss_Q Eq. 33
In the considered case, Q_loss_stge coincides with the overall losses in the system, which are given by:

IEA SHC Task 38 Monitoring Procedure
20
thkWh )6Qb3Q4Qa3Q()sum total_2Q1Q(sys_loss_Q Eq. 34
On the basis of the losses calculated in Eq. 33 and Eq. 34, the efficiency of the storage and the efficiency of the system are calculated according to:
The solar heat management efficiency is defined as the rate between the “solar load contribution” and the solar availability (Eq. 41).
The solar load contribution refers to the amount of load energy which is fully covered by solar energy. I.e. the solar space heating contribution is given by:
thhotstorage* kWh Q3b)(Q3a*SF3Q Eq. 37
The solar DHW contribution is:
thhotstorage* kWh 4Q*SF4Q Eq. 38
The solar cooling contribution is:
thhotstorage* kWh 6Q*SF6Q Eq. 39
On the basis of Eq. 37, Eq. 38 Eq. 39, the total solar load contribution is given by:
th**** kWh 6QQ43QQtot Eq. 40
Q2S_RES)Q2S_fossil(Q1
eQ_loss_stgQ2S_RES)Q2S_fossil(Q1ηstge
Eq. 35
Q2S_RES)Q2S_fossil(Q1
Q_loss_syssum) Q2_total(Q1ηsys
Eq. 36

IEA SHC Task 38 Monitoring Procedure
21
Refer to Figure 3-4 for a qualitative example of total solar load contribution.
Figure 3-4 Qualitative representation of heat needs, solar radiation and solar load contribution
Hence the solar heat management efficiency is calculated according to:
Qsol
Qtotsolrad_heat
*
Eq. 41
This means that the solar energy unexploited is:
*QtotQsolsolunex_Q Eq. 42
3.3.3 General key energy performance figures in the 3rd
monitoring level
In the third level all the flows listed in Table 1, Table 2 and Table 3 are required to carry out deep analysis.
First of all, the fractional energy saving (Fsav) is calculated according to the method which was elaborated in the IEA SHC Task 26 for solar combisystems and extended in the IEA SHC Task 32 for solar heating and cooling systems.
This method requires the PER of a conventional system to be calculated according to the formula already presented in the 1
st level:
IEA SHC Task 38 Monitoring Procedure
22
pe
th
elec
refel,
elecref
refcooling,
boilerfossil
refboiler, kWh
kWh
ε
E
ε*SPF
Q
η*ε
Q
ΔAHUQ4Q10aQ3aPERref
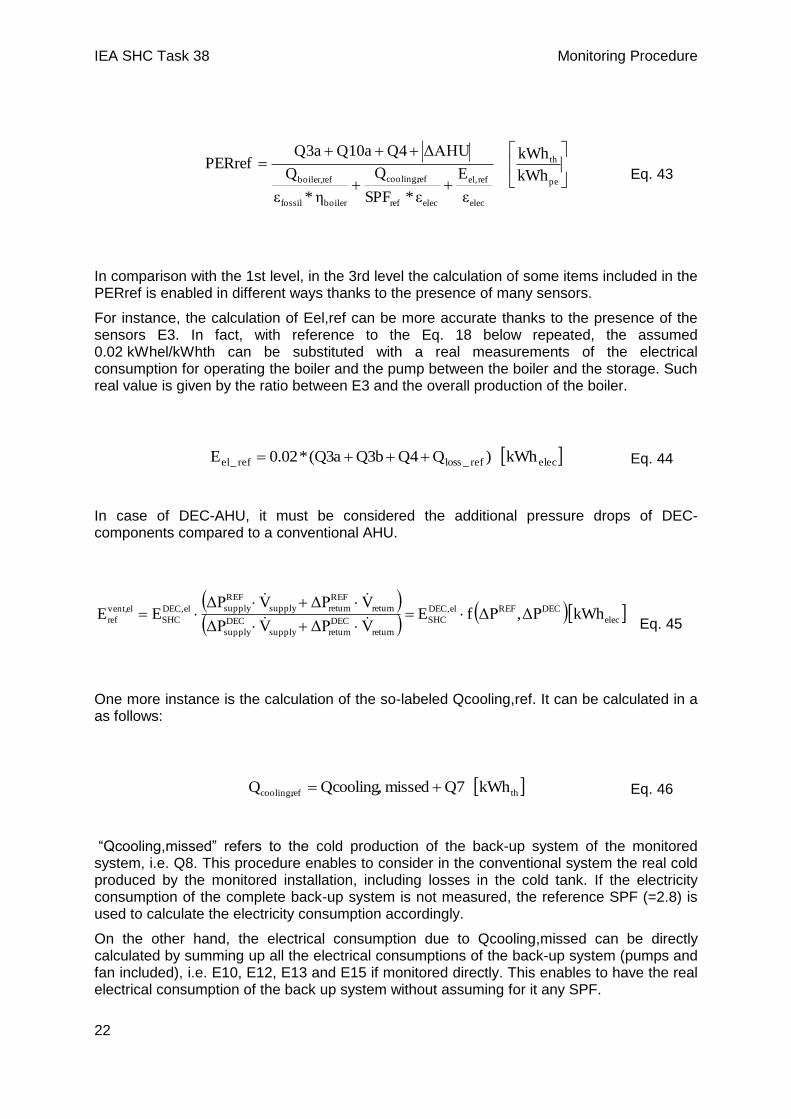
Eq. 43
In comparison with the 1st level, in the 3rd level the calculation of some items included in the PERref is enabled in different ways thanks to the presence of many sensors.
For instance, the calculation of Eel,ref can be more accurate thanks to the presence of the sensors E3. In fact, with reference to the Eq. 18 below repeated, the assumed 0.02 kWhel/kWhth can be substituted with a real measurements of the electrical consumption for operating the boiler and the pump between the boiler and the storage. Such real value is given by the ratio between E3 and the overall production of the boiler.
elecref_lossref_el kWh )Q4Qb3Qa3Q(*02.0E Eq. 44
In case of DEC-AHU, it must be considered the additional pressure drops of DEC-components compared to a conventional AHU.
elec
DECREFelDEC,
SHC
return
DEC
returnsupply
DEC
supply
return
REF
returnsupply
REF
supplyelDEC,
SHC
elvent,
ref kWh ΔP,ΔPf EVΔPVΔP
VΔPVΔP EE
Eq. 45
One more instance is the calculation of the so-labeled Qcooling,ref. It can be calculated in a as follows:
threfcooling, kWh Q7missedQcooling,Q Eq. 46
“Qcooling,missed” refers to the cold production of the back-up system of the monitored system, i.e. Q8. This procedure enables to consider in the conventional system the real cold produced by the monitored installation, including losses in the cold tank. If the electricity consumption of the complete back-up system is not measured, the reference SPF (=2.8) is used to calculate the electricity consumption accordingly.
On the other hand, the electrical consumption due to Qcooling,missed can be directly calculated by summing up all the electrical consumptions of the back-up system (pumps and fan included), i.e. E10, E12, E13 and E15 if monitored directly. This enables to have the real electrical consumption of the back up system without assuming for it any SPF.
IEA SHC Task 38 Monitoring Procedure
23
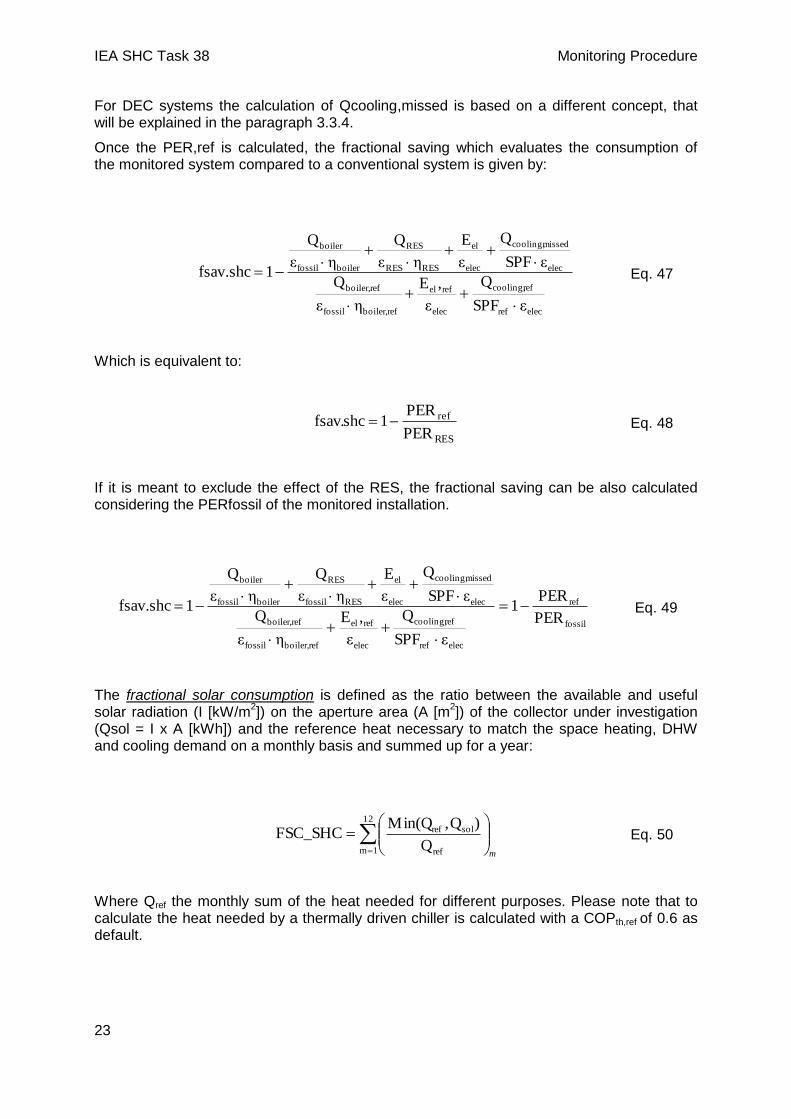
For DEC systems the calculation of Qcooling,missed is based on a different concept, that will be explained in the paragraph 3.3.4.
Once the PER,ref is calculated, the fractional saving which evaluates the consumption of the monitored system compared to a conventional system is given by:
Which is equivalent to:
If it is meant to exclude the effect of the RES, the fractional saving can be also calculated considering the PERfossil of the monitored installation.
fossil
ref
elecref
refcooling,
elec
refel
refboiler,fossil
refboiler,
elec
missedcooling,
elec
el
RESfossil
RES
boilerfossil
boiler
PER
PER1
εSPF
Q
ε
,E
ηε
Q
εSPF
Q
ε
E
ηε
Q
ηε
Q
1fsav.shc
Eq. 49
The fractional solar consumption is defined as the ratio between the available and useful solar radiation (I [kW/m
2]) on the aperture area (A [m
2]) of the collector under investigation
(Qsol = I x A [kWh]) and the reference heat necessary to match the space heating, DHW and cooling demand on a monthly basis and summed up for a year:
Where Qref the monthly sum of the heat needed for different purposes. Please note that to calculate the heat needed by a thermally driven chiller is calculated with a COPth,ref of 0.6 as default.
elecref
refcooling,
elec
refel
refboiler,fossil
refboiler,
elec
missedcooling,
elec
el
RESRES
RES
boilerfossil
boiler
εSPF
Q
ε
,E
ηε
Q
εSPF
Q
ε
E
ηε
Q
ηε
Q
1fsav.shc
Eq. 47
RES
ref
PER
PER1shc.fsav Eq. 48
m
12
1m ref
solref
Q
)Q,Min(QFSC_SHC Eq. 50

IEA SHC Task 38 Monitoring Procedure
24
The 3rd level is also focusing on the water consumption for cold production. The water
consumption of the wet cooling tower and the DEC system is evaluated in terms of:
- Cooling tower water consumption per kWh dissipated heat
- DEC humidifier water consumption per kWh COLD production
On the other hand the electrical consumption related to the treatment of the water is calculated in terms of:
- Electricity consumption for water treatment per liter treated water in SHDC systems
- Electricity consumption for water treatment per kWh cold production in SHDC and DEC systems:
Several specific defined COP’s evaluating the thermal and the electric performance of the subsystems sorption chiller and DEC unit are calculated.
th
refth,
refcooling,
refboiler,
refloss,DHWSH
ref kWh COP
Q
η
QQQQ
Eq. 51
thkWh
l
Q7Q6a
V1ACM_water Eq. 52
thAHU_cool kWh
l
ΔH
V2DEC_water Eq. 53
l
kWh
2V1V
20Ewater_treat_El el Eq. 54
cold
el
_ kWh
kWh
7
20__
QH
EwatertreatEl
coolAHU
Eq. 55
IEA SHC Task 38 Monitoring Procedure
25
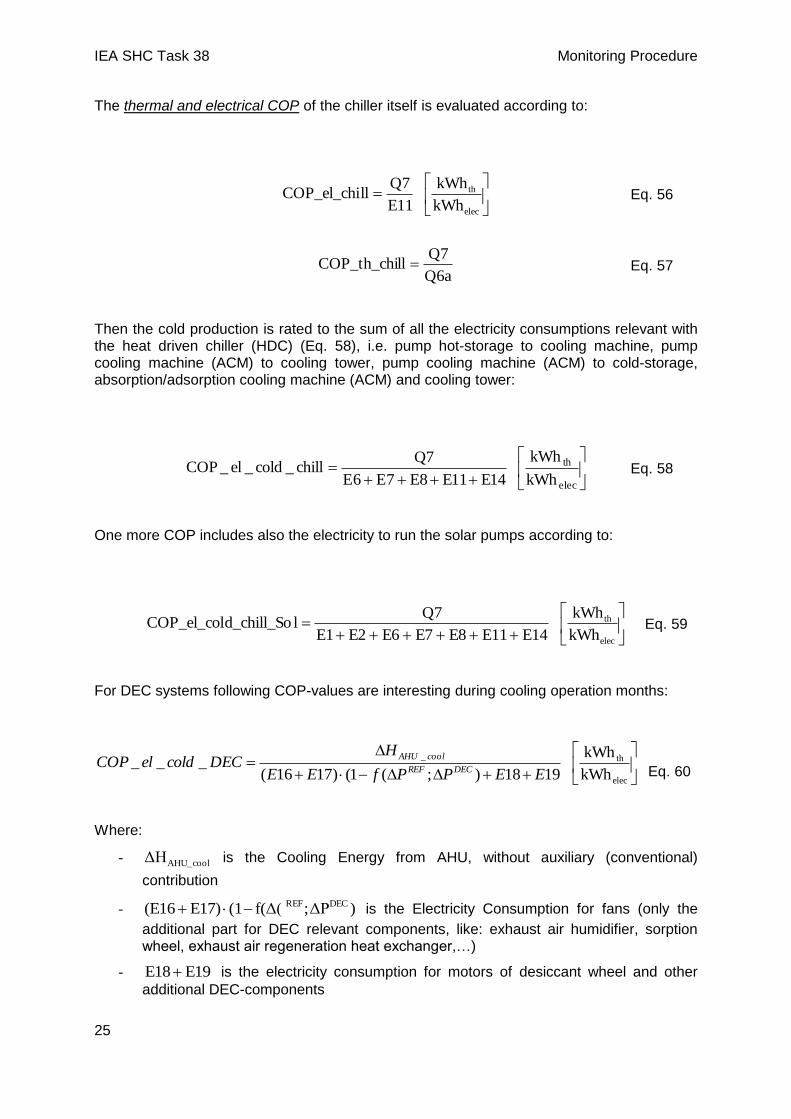
The thermal and electrical COP of the chiller itself is evaluated according to:
Then the cold production is rated to the sum of all the electricity consumptions relevant with the heat driven chiller (HDC) (Eq. 58), i.e. pump hot-storage to cooling machine, pump cooling machine (ACM) to cooling tower, pump cooling machine (ACM) to cold-storage, absorption/adsorption cooling machine (ACM) and cooling tower:
One more COP includes also the electricity to run the solar pumps according to:
For DEC systems following COP-values are interesting during cooling operation months:
Where:
- AHU_coolΔH is the Cooling Energy from AHU, without auxiliary (conventional)
contribution
- )ΔP;f(Δ((1E17)(E16 DECREF is the Electricity Consumption for fans (only the
additional part for DEC relevant components, like: exhaust air humidifier, sorption wheel, exhaust air regeneration heat exchanger,…)
- E19E18 is the electricity consumption for motors of desiccant wheel and other
additional DEC-components
elec
th
kWh
kWh
E11
Q7llCOP_el_chi Eq. 56
Q6a
Q7llCOP_th_chi Eq. 57
elec
th
kWh
kWh
14E11E8E7E6E
7Qchill_cold_el_COP Eq. 58
elec
th
kWh
kWh
E14E11E8E7E6E2E1
Q7ld_chill_SoCOP_el_col Eq. 59
elec
th_
kWh
kWh
1918);(1()1716(___
EEPPfEE
HDECcoldelCOP
DECREF
coolAHU
Eq. 60

IEA SHC Task 38 Monitoring Procedure
26
To take in consideration also additional PE-consumption for solar components, further is defined:
With:
- E1 is the electricity consumption of the pump in the primary loop of the collector field.
- E2 is the electricity consumption of the pump in the secondary loop of the collector field.
Finally the thermal COP of the DEC-AHU has to be calculated:
Where Q6a is the regeneration heat for the sorption wheel coming from the solar tank.
3.3.4 Special energy performance figures for DEC systems in the 3rd
monitoring level
In case the monitored system includes a DEC-AHU, the comparison to a conventional AHU requires an in-depth consideration of both the air-treatment processes.
Savings in terms of Primary Energy are obtained in a DEC-Process through:
- Avoiding the cooling of the air until below the dew-point for dehumidification
- Avoiding the necessary post-heating of the air to reach required inlet-temperature
On the other hand, inlet-temperature of supply air from the DEC-AHU can be higher than in a conventional AHU, it means the DEC-AHU delivers less cooling energy than conventional AHU
Further important advantage of a DEC AHU can be the possibility of humidity recovery during winter time. This can lead to quite high energy savings compared to conventional AHU, of course strong depending on the specific climatic zone.
In order to make easier and more comparable the results of single plants, an excel-tool has been created, where measured data can be directly inserted (in same time-step as measured), and the enthalpy differences reached in DEC-AHU and reference AHU will be calculated for a month.
For a better validation of possible scenarios, 4 cases are considered:
elec
th
DECREF
AHU_cool
kWh
kWh
E2E1E19E18)ΔP;f(Δ((1E17)(E16
ΔH
d_DEC_SolCOP_el_col
Eq. 61
Q6a
ΔHCOP_th_DEC
AHU_DEC Eq. 62
IEA SHC Task 38 Monitoring Procedure
27
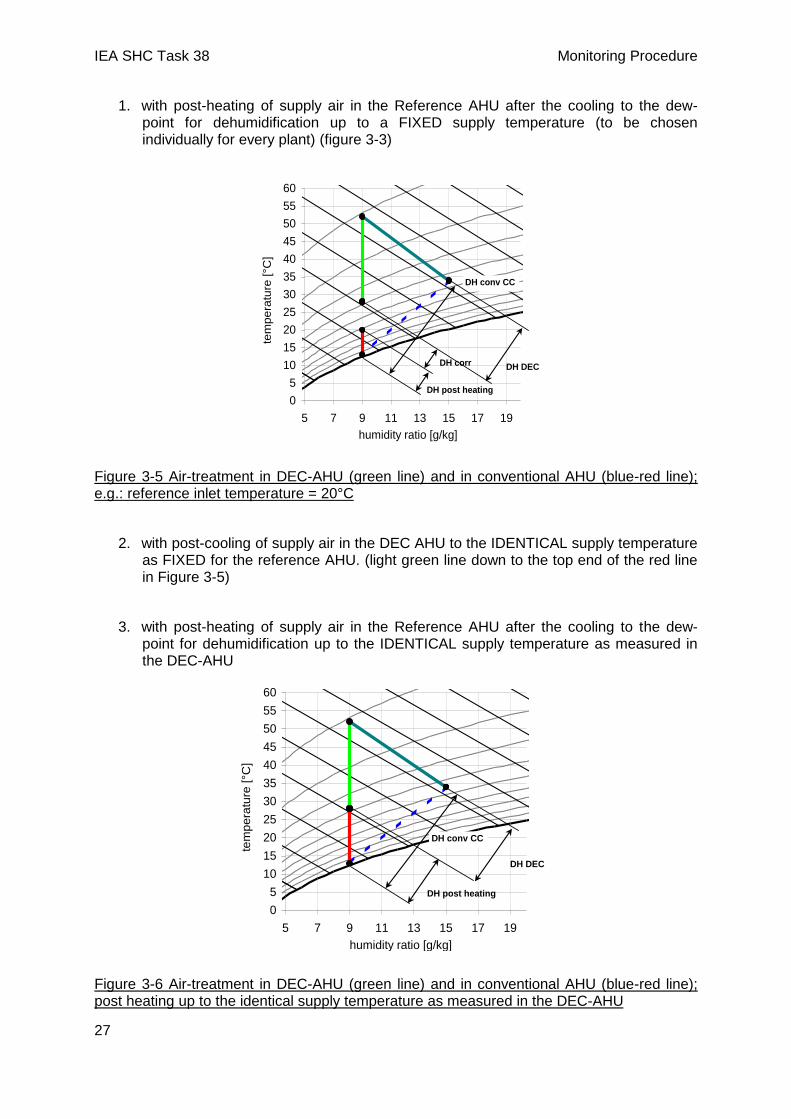
1. with post-heating of supply air in the Reference AHU after the cooling to the dew-point for dehumidification up to a FIXED supply temperature (to be chosen individually for every plant) (figure 3-3)
0
5
10
15
20
25
30
35
40
45
50
55
60
5 7 9 11 13 15 17 19
humidity ratio [g/kg]
tem
pe
ratu
re [°C
]
DH DEC
DH post heating
DH corr
DH conv CC
Figure 3-5 Air-treatment in DEC-AHU (green line) and in conventional AHU (blue-red line); e.g.: reference inlet temperature = 20°C
2. with post-cooling of supply air in the DEC AHU to the IDENTICAL supply temperature as FIXED for the reference AHU. (light green line down to the top end of the red line in Figure 3-5)
3. with post-heating of supply air in the Reference AHU after the cooling to the dew-point for dehumidification up to the IDENTICAL supply temperature as measured in the DEC-AHU
0
5
10
15
20
25
30
35
40
45
50
55
60
5 7 9 11 13 15 17 19
humidity ratio [g/kg]
tem
pe
ratu
re [°C
]
DH post heating
DH DEC
DH conv CC
Figure 3-6 Air-treatment in DEC-AHU (green line) and in conventional AHU (blue-red line); post heating up to the identical supply temperature as measured in the DEC-AHU

IEA SHC Task 38 Monitoring Procedure
28
4. without post-heating. It is assumed that in the conventional AHU the heat demand for post heating is for free because any kind of waste heat is used (e.g. from CHP plant or using an additional heat recovery wheel or using the waste heat of the vapor compression chiller).
Necessary Input-data for every time-step are shown in Table 7.
Table 7 Necessary measurements for the calculation of the enthalpy differences (DH)
Description of data input Label
Heating mode Heating ON/OFF
Cooling mode Cooling ON/OFF
Temperature of inlet air in the AHU (external air) T inlet
Relative humidity of inlet air in the AHU (external air) rH inlet
Temperature of supply air from the AHU T supply
relative humidity of supply air from the AHU rH supply
Supply air flow, Supply air flow
Besides the inputs shown in Table 7, one parameter has to be set: the supply temperature of reference AHU if it is considered as fixed.
The values output by this spreadsheet are listed inTable 8.
Table 8: Output of the spreadsheet for the calculation of enthalpy differences (DH)
Description of data output Label
Difference between cooling energy delivered from DEC AHU and from conventional AHU with fixed supply temperature, m*DH AHU corr
ΔHcorr
Difference of enthalpy (cooling energy) achieved from cooling coil in conventional AHU, m*DH AHU CC
ΔHconv_CC
Difference of enthalpy (heating energy) achieved from heating coil in conventional AHU, m*DH postheat
ΔHpostheat
Difference of enthalpy between inlet (external) air and outlet (supply ) air of conventional AHU, m*DH AHU conv
ΔHconv_AHU

IEA SHC Task 38 Monitoring Procedure
29
m*DH AHU DEC cooling ΔHAHU_cool
m*DH AHU DEC heating ΔHAHU_heat
These outputs are the special input on the monitoring procedure for DEC systems.
On their basis the Primary Energy Ratio for conventional AHU (PER REF) can be calculated as follows:
The Primary Energy Saving factor fsave is calculated as for all Solar Heating and Cooling systems with PERRES or PERfossil:
3.4 Summary of the output of the procedure
The monitoring procedure supports the evaluation of the performance of the monitored system and its comparison with a conventional system. To this purposes, three level of data elaboration have been defined depending on the kind of monitored energy flows. The major output of each level is summarized in the following tables.
Table 9 Summary of the output of the 1st monitoring level
First monitoring level Description
SHDC DEC
COPel, tot Ratio between load and the electrical consumption excluding distribution
COPel, overall Ratio between load and the electrical consumption including distribution
PER_res PER_res with DEC
postcooling, Tsupply fixed to: xx°C
Primary energy ratio for the monitored system accounting for RES contribution
PER_fossil Primary energy ratio for the monitored system accounting RES contribution as fossil
PER_ref PER_ref with Primary energy ratio for the conventional
elec
th
elec
conv_AHUelec,
fossilboiler
postheat
el
conv_CC
conv_AHU
ref_DECkWh
kWh
ε
E
εη
ΔH
εSPF
ΔH
ΔHPER
Eq. 63
RES/fossil
ref
PER
PER1shcsav,f Eq. 64

IEA SHC Task 38 Monitoring Procedure
30
ref_AHU postheating, Tsupply fixed to: xx°C
system set as reference for comparisons
PER_ref_AHU postheating, Tsupply = measured in DEC
PER_ref without ref_AHU postheating
Table 10 Summary of the output of the 2nd
monitoring level
Second monitoring level Description
coll,util Collectors efficiency
stge Storage efficiency
sys System efficiency (taking into account the heat losses in all the system)
heat_solrad Solar heat management efficiency
Q_solunex Solar energy unexploited
Q_tot, heat Total heat load
IEA SHC Task 38 Monitoring Procedure
31
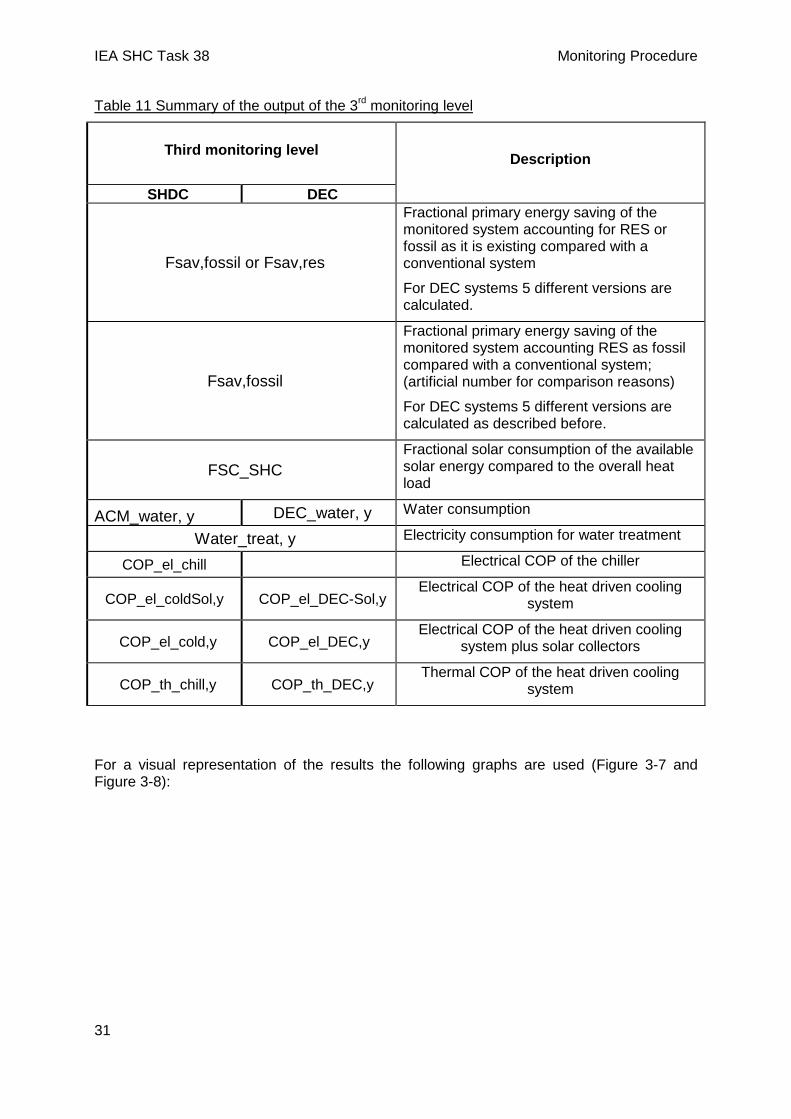
Table 11 Summary of the output of the 3rd monitoring level
Third monitoring level Description
SHDC DEC
Fsav,fossil or Fsav,res
Fractional primary energy saving of the monitored system accounting for RES or fossil as it is existing compared with a conventional system
For DEC systems 5 different versions are calculated.
Fsav,fossil
Fractional primary energy saving of the monitored system accounting RES as fossil compared with a conventional system; (artificial number for comparison reasons)
For DEC systems 5 different versions are calculated as described before.
FSC_SHC
Fractional solar consumption of the available solar energy compared to the overall heat load
ACM_water, y DEC_water, y Water consumption
Water_treat, y Electricity consumption for water treatment
COP_el_chill Electrical COP of the chiller
COP_el_coldSol,y COP_el_DEC-Sol,yElectrical COP of the heat driven cooling
system
COP_el_cold,y COP_el_DEC,y Electrical COP of the heat driven cooling
system plus solar collectors
COP_th_chill,y COP_th_DEC,y Thermal COP of the heat driven cooling
system
For a visual representation of the results the following graphs are used (Figure 3-7 and Figure 3-8):

IEA SHC Task 38 Monitoring Procedure
32
-10000
0
10000
20000
30000
40000
50000
60000
1 2 3 4 5 6 7 8 9 10 11 12
[kW
h]
Month
Diagram 3Q3 Q6
Q4 Qtot, heat
Qsol Q*tot, y
Figure 3-7 Example for the solar energy source management in a solar assisted cooling system using an absorption chiller
0
5
10
15
20
25
30
35
40
45
50
55
60
5 7 9 11 13 15 17 19
humidity ratio [g/kg]
tem
pe
ratu
re [°C
]
DH DEC
DH post heating
DH corr
DH conv CC
0
5
10
15
20
25
30
35
40
45
50
55
60
5 7 9 11 13 15 17 19
humidity ratio [g/kg]
tem
pera
ture
[°C
]
DH post heating
DH DEC
DH conv CC
postheat fix: post heating up to a fixed supply temperature (to be chosen individually for every plant)
postheat meas: post heating up to the identical supply temperature as measured in the DEC-AHU
Figure 3-8 Representation of an example for cooling and de-humidification process with a solar assisted cooling system using a DEC unit DEC

IEA SHC Task 38 Monitoring Procedure
33
4. How to fill in the monitoring procedure The excel tool for the evaluation of monitored data is composed of six sheets.
The first sheet, named “Introduction”, shortly presents the tool and its authors.
Users are then required to enter data:
- in the second sheet, named “Data”, entering pieces of information on the installed SHC and monitoring system;
- in the fifth sheet, named “3rdLvl”, entering the required monitoring data;
- In the sixth sheet, named “Summary” entering main key data of the installed SHC and inserting the energy flow diagram as shown in the sheet “Introduction” (see also Figure 2-1) adapted to the installed SHC.
Yellow cells require data to be entered whereas.
The sheets automatically calculate all the performance figures described in this report. Orange cells output results. All the results are summarized in the sixth sheet, named “Summary” so that the overall system and its performance are shown all at once.
IEA SHC Task 38 Monitoring Procedure
34
5. Conclusions This technical report describes a tool which has been developed within IEA SHC Task 38 in order to evaluate, with a common procedure, the performance of monitored solar heating and cooling installations. The tool also enables the relative evaluation of a monitored system with respect to a conventional system. Nevertheless, such comparison is based on many assumptions of the conventional system which can lead to misleading results.
The development of a standard procedure was expected to enable the comparison between the results of several systems as well. Actually, at the current state of the art, custom made systems differ so much that a comparison between many of the energy performance figures defined in the tool sometimes is not fair. Further improvement of this tool is planned within IEA SHC Task 48, starting in autumn 2011.
The tool is usually referred to as a “monitoring procedure”. In fact, even if it is not explicitly giving any guidelines for carrying out monitoring campaigns for solar heating and cooling systems, it suggests the necessary measurements for the evaluation of selected energy performance figures. Depending on the kind and the number of measurements needed, three level of detail of monitoring have then been defined, which correspond to different scopes, level of efforts and thus costs of monitoring.
The procedure has been applied to more than twenty five installations, including large and small systems. Results are presented in the following documents of Task 38:
- Jähnig D. and Thür A., “Monitoring Results of fourteen small scale systems - A technical report of subtask A (Pre-engineered systems for residential and small commercial applications)”, December 2010;
- Sparber W. and Napolitano A., “Monitored installations and results – A technical report of subtask B (large scale and custom made applications)”, December 2010;
- Sparber, W., & Napolitano, A. (2009). State of the art on existing solar heating and cooling systems - A technical report of Task 38 - Subtask B1. http://www.iea-shc.org/task38/work.htm.
The complete package of this IEA SHC Task 38 Monitoring Procedure can be downloaded from IEA SHC Task 38 Webpage:
http://www.iea-shc.org/publications/task.aspx?Task=38
and it consists of 4 files:
1. This joint monitoring procedure report of Subtask B (D-B3b) and Subtask A (D-A3a):
Task38-SubtaskA+B_report_D-B3b_D-A3a_monitoring procedure V6-0.doc
2. XLS-file as the master file for the monitoring procedure:
110801_T38_MonProc_V6-0.xls
3. PPT-file with reference energy flow schemes:
110801_T38_MonProc_V6-0_Schemes.ppt
4. XLS-file for extra calculations for DEC systems:
110801_T38_MonProc_V6-0_DH-calc.xls

IEA SHC Task 38 Monitoring Procedure
35
Bibliography Letz, T. (2002). Validation and background information on the FSC procedure. www.iea-shc.org/output/task26/A_Letz_FSC_method.pdf.
Weiss, Ed. (2003), IEA SHC Task26, “Solar Heating Systems for Houses – A Design Handbook for Solar Combisystems”, James & James
Letz, T. (2007). „The Extended FSC Procedure for Larger Storage Sizes - Report A1 of Subtask A http://www.iea-shc.org/publications/downloads/task32-Extended_FSC_Procedure.pdf
W. Sparber, A. Thuer, F. Besana, W. Streicher, H.M. Henning, (2008) “Unified Monitoring Procedure and Performance Assessment for Solar Assisted Heating and Cooling Systems”, proceedings No 240, Eurosun
Sparber, W., Napolitano, A., & Melograno, P. (2007). Overview on worldwide installed solar cooling systems. 2
nd International conference on Solar Air Conditioning. Tarragona.
Sparber, W., & Napolitano, A. (2009). State of the art on existing solar heating and cooling systems - A technical report of Task 38 - Subtask B1. http://www.iea-shc.org/task38/work.htm.
W. Sparber, A. Napolitano, F. Besana, A. Thür, B. Nocke, P. Finocchiaro, L. A. Bujedo Nieto4, J. Rodriguez, T. Núñez (2009) ,”Comparative results of monitored solar assisted heating and cooling installations”, 3
rd International conference on Solar Air Conditioning,
Palermo, Italy
Thür, A., Jähnig, D., Nunez, T., Wiemken, E., Helm, M., Mugnier, D., Finocchiaro, P., Nocke, B., (2010). “Monitoring Program of Small-Scale Solar Heating and Cooling Systems within IEA-SHC Task 38 – Procedure and First Results”, proceedings No161, Eurosun Conference, Graz, Austria
Thür, A., Vukits, M., Jähnig, D., (2011), „IEA SHC Task38 – Monitoring Prozedur – Vorstellung und Ergebnisse”, OTTI - 21. Symposium Thermische Solarenergie, Bad Staffelstein, Germany