monitoring plan - portland, oregon
TRANSCRIPT
Monitoring Plan For Stormwater and Surface Water Sampling by the
City of Portland in Compliance with MS4 Permit Requirements
City of Portland Bureau of Environmental Services
Municipal Separate Storm Sewer System (MS4) Permit # 101314
Effective Date July 1, 2016

i
TABLE OF CONTENTS
SECTION 1 INTRODUCTION ............................................................................ 1
1.1 Purpose ....................................................................................................................................... 1
1.2 Organization ............................................................................................................................... 1
1.3 Monitoring Program Requirements & Objectives ...................................................................... 1
1.4 Monitoring Plan Modifications ................................................................................................... 3
1.4.1 Updates to Previous Monitoring Plan........................................................................... 4
1.5 Long-Term Monitoring Strategy ................................................................................................ 4
1.5.1 Stormwater Monitoring ................................................................................................ 5
1.5.2 Instream Monitoring ..................................................................................................... 5
SECTION 2 DRY AND WET SEASON INSTREAM MONITORING ...................... 7
2.1 Project Task/Organization .......................................................................................................... 7
2.2 Background ................................................................................................................................. 7
2.3 Monitoring Objectives ................................................................................................................ 7
2.4 Monitoring Locations ................................................................................................................. 8
2.4.1 Monitoring Frequency & Schedule .............................................................................. 8
2.4.2 Sample Collection Methodology .................................................................................. 8
2.5 Connection to Long-Term Monitoring Strategy ....................................................................... 10
SECTION 3 CONTINUOUS INSTREAM MONITORING .................................... 11
3.1 Project Task/Organization ........................................................................................................ 11
3.2 Background ............................................................................................................................... 11
3.3 Monitoring Objectives .............................................................................................................. 11
3.4 Monitoring Locations ............................................................................................................... 11
3.4.1 Monitoring Frequency and Duration .......................................................................... 12
3.4.2 Sample Collection Methodology ................................................................................ 12
3.5 Special Data Quality Objectives and Criteria ........................................................................... 13
3.6 Connection to Long-Term Monitoring Strategy ....................................................................... 13
SECTION 4 STORMWATER MONITORING ..................................................... 14
4.1 Project Task/Organization ........................................................................................................ 14
4.2 Background ............................................................................................................................... 14
4.3 Monitoring Objectives .............................................................................................................. 15

ii
4.4 Probabilistic UIC Monitoring ................................................................................................... 15
4.4.1 Description of Sample Design .................................................................................... 15
4.4.2 Target Population ....................................................................................................... 15
4.4.3 Monitoring Locations ................................................................................................. 16
4.4.4 Monitoring Frequency and Duration .......................................................................... 20
4.4.5 Sample Collection Methodology ................................................................................ 20
4.4.6 Sampling Considerations ............................................................................................ 20
4.5 Fixed Land Use Monitoring ...................................................................................................... 21
4.5.1 Description of Sample Design .................................................................................... 21
4.5.2 Target Population ....................................................................................................... 21
4.5.3 Monitoring Locations ................................................................................................. 21
4.5.4 Monitoring Frequency and Duration .......................................................................... 22
4.5.5 Sample Collection Methodology ................................................................................ 22
4.5.6 Sampling Considerations ............................................................................................ 22
4.6 Storm Event Targeting .............................................................................................................. 22
4.6.1 Storm Criteria ............................................................................................................. 22
4.6.2 Weather Forecasting ................................................................................................... 23
4.7 Parameters & Analytical Methods ............................................................................................ 24
4.8 Connection to Long-Term Monitoring Strategy ....................................................................... 24
SECTION 5 MACROINVERTEBRATE MONITORING ....................................... 25
5.1 Project Task/Organization ........................................................................................................ 25
5.2 Background ............................................................................................................................... 25
5.3 Monitoring Objectives .............................................................................................................. 26
5.4 Study Design and Monitoring Process ..................................................................................... 26
5.4.1 Monitoring Locations ................................................................................................. 26
5.4.2 Monitoring Frequency and Duration .......................................................................... 28
5.4.3 Sample Collection Methodology ................................................................................ 28
5.5 Special Data Quality Objectives and Criteria ........................................................................... 29
5.5.1 Measurement Quality Objectives ............................................................................... 29
5.5.2 Sample Handling and Custody ................................................................................... 29
5.6 Quality Control ......................................................................................................................... 30
5.6.1 Field Quality Control.................................................................................................. 30
5.6.2 Laboratory Quality Control ........................................................................................ 31
5.7 Connection to Long-Term Monitoring Strategy ....................................................................... 31
iii
SECTION 6 SAMPLING STAFF ...................................................................... 32
6.1 Storm Monitoring Coordinator ................................................................................................. 32
6.2 Field Sampling Teams .............................................................................................................. 32
SECTION 7 FIELD SAMPLING PROCEDURES ................................................ 33
SECTION 8 QUALITY CONTROL & QUALITY ASSURANCE ........................... 34
SECTION 9 REFERENCES ............................................................................. 35
TABLES & FIGURES
Table 1.1 Monitoring Objectives Matrix ..................................................................................................... 6
Table 2.1 Fixed Instream Monitoring Locations.......................................................................................... 8
Table 2.2 Instream Sample Laboratory Analytes, Containers, Volumes, Methods, Preservation, and Holding Times ..................................................................................................................................... 9
Table 3.1 Continuous Instream Monitoring Locations (Current USGS Gauges) ...................................... 12
Table 4.1 Probabilistic UIC Monitoring Locations................................................................................... 17
Table 4.2 Fixed Land Use Stormwater Monitoring Locations .................................................................. 21
Table 4.3 Stormwater Sample Laboratory Analytes, Containers, Volumes, Methods Preservation, and Holding Times ................................................................................................................................... 24
Table 5.1 Macroinvertebrate Instream Monitoring Locations & Panels ................................................... 27
Table 5.2 Macroinvertebrate Frequency & Panel Rotation ...................................................................... 28
Figure 5.1 Wadeable Site Reach Features with Macroinvertebrate L, C, and R Sampling Points ............. 29
Table 5.3 Biological Communities Field Quality Control .......................................................................... 30
Table 5.4 Macroinvertebrate Laboratory Quality Control .......................................................................... 31

1
SECTION 1
INTRODUCTION 1.1 PURPOSE
This Monitoring Plan (Plan) describes the sampling and analysis program for the collection of stormwater and surface water samples by the City of Portland (City) Bureau of Environmental Services. Stormwater and surface water or “instream” water quality data will be collected and reported annually from representative monitoring locations for compliance with the National Pollutant Discharge Elimination System (NPDES) Municipal Separate Storm Sewer System (MS4) Permit (Permit No. 101314) issued to the City by the Oregon Department of Environmental Quality (DEQ). The MS4 permit requires the City to monitor stormwater and surface water during each 5-year permit term.
This Plan will guide (or provide reference to appropriate documents) all sampling, analyses, data assessment, data management, and other monitoring-related activities conducted under the permit and will ensure that quality control and consistency are maintained.
1.2 ORGANIZATION
Section 1.0 provides a summary of the MS4 permit requirements related to monitoring, procedures for making modifications to this plan, and a summary of the overall long-term monitoring strategy. In the following sections, this Plan covers the main elements of the NPDES MS4 environmental monitoring program including instream monitoring (Section 2.0), continuous instream monitoring (Section 3.0), stormwater monitoring and storm event targeting (Section 4.0), and macroinvertebrate monitoring (Section 5.0). Section 6.0 provides a description of sampling staff, and Section 7.0 provides a description of field sampling procedures. Section 8.0 provides information related to quality control procedures. The last section of this document (Section 9) lists the references cited in this Plan.
The City conducts significant monitoring of stormwater in the underground injection control (UIC) system for compliance with its Water Pollution Control Facility (WPCF) and MS4 permits. The UIC stormwater monitoring program is documented in the WPCF Permit Sampling and Analysis Plan (WPCF-SAP) and the WPCF Permit Quality Assurance Project Plan (WPCF-QAPP). Where methods and QA/QC procedures overlap between the City’s UIC and MS4 monitoring programs, this document references those sections of the WPCF-SAP and WPCF-QAPP in order to minimize duplication and simplify the process for any potential future modifications.
1.3 MONITORING PROGRAM REQUIREMENTS & OBJECTIVES
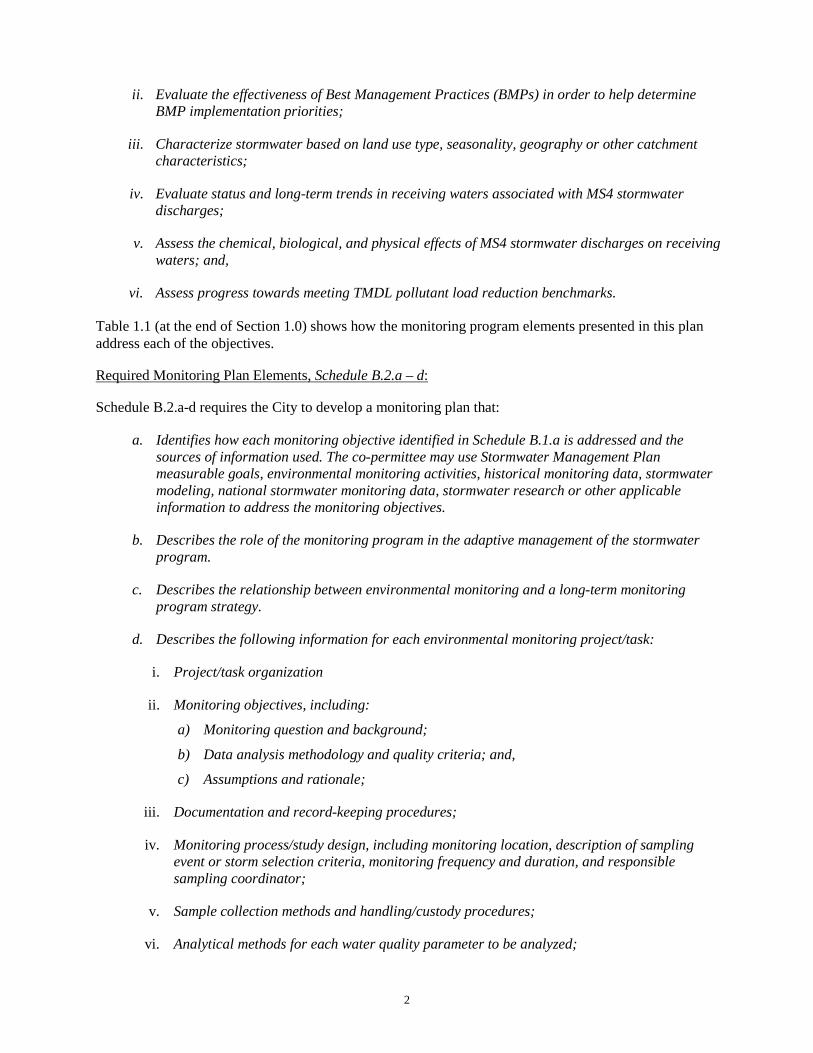
Schedule B.1.a of the City’s MS4 permit specifies minimum monitoring and reporting requirements. It lists the following six objectives that the monitoring program must incorporate.
Required Monitoring Program Objectives, Schedule B.1.a:
i. Evaluate the source(s) of the 2004/2006 303(d) listed pollutants applicable to the co-permittees’ permit area;
2
ii. Evaluate the effectiveness of Best Management Practices (BMPs) in order to help determine BMP implementation priorities;
iii. Characterize stormwater based on land use type, seasonality, geography or other catchment characteristics;
iv. Evaluate status and long-term trends in receiving waters associated with MS4 stormwater discharges;
v. Assess the chemical, biological, and physical effects of MS4 stormwater discharges on receiving waters; and,
vi. Assess progress towards meeting TMDL pollutant load reduction benchmarks.
Table 1.1 (at the end of Section 1.0) shows how the monitoring program elements presented in this plan address each of the objectives.
Required Monitoring Plan Elements, Schedule B.2.a – d:
Schedule B.2.a-d requires the City to develop a monitoring plan that:
a. Identifies how each monitoring objective identified in Schedule B.1.a is addressed and the sources of information used. The co-permittee may use Stormwater Management Plan measurable goals, environmental monitoring activities, historical monitoring data, stormwater modeling, national stormwater monitoring data, stormwater research or other applicable information to address the monitoring objectives.
b. Describes the role of the monitoring program in the adaptive management of the stormwater program.
c. Describes the relationship between environmental monitoring and a long-term monitoring program strategy.
d. Describes the following information for each environmental monitoring project/task:
i. Project/task organization
ii. Monitoring objectives, including:
a) Monitoring question and background;
b) Data analysis methodology and quality criteria; and,
c) Assumptions and rationale;
iii. Documentation and record-keeping procedures;
iv. Monitoring process/study design, including monitoring location, description of sampling event or storm selection criteria, monitoring frequency and duration, and responsible sampling coordinator;
v. Sample collection methods and handling/custody procedures;
vi. Analytical methods for each water quality parameter to be analyzed;
3
vii. Quality control procedures, including quality assurance, the testing, inspection, maintenance, calibration of instrumentation and equipment; and,
viii. Data management, review, validation, and verification.
This Plan addresses these requirements.
1.4 MONITORING PLAN MODIFICATIONS
Modifications to the Plan may be prompted by recommendations from field sampling or laboratory staff, during review and evaluation of the field and/or analytical data, or as part of changes to the monitoring approach. Modifications will be addressed by either revising the Plan or preparing addenda to the Plan. The revised Plan or addenda will describe both the need for the modifications and how the planned changes will be implemented (e.g., sampling and analyses, QA/QC). Modifications may include, but are not be limited to:
• Modifications to the data management system • Selection of monitoring locations • Changes in field procedures or analytical methods • Changes in monitoring protocols • Change in contract laboratory • Change in stormwater data evaluation reporting (e.g., graphs, calculations, correlations) and
trend analyses reporting (e.g., graphs, statistical methods)
Modifications to the Plan will be made in accordance with Schedule B.2.e of the permit, which states:
The monitoring plan may be modified without prior Department approval if the following conditions are met. For conditions not covered in this section, the co-permittee must provide the Department with a 30-day notice of the proposed modification to the monitoring plan, and receive written approval from the Department prior to implementation of the proposed modification. If the Department does not respond to the permittee within 30 days, the permittee may proceed with implementation of the proposed modification without written approval.
i. The co-permittee is unable to collect or analyze any sample, pollutant parameter, or information due to circumstances beyond the co-permittee’s control. These circumstances may include, but are not limited to, abnormal climatic conditions, unsafe or impracticable sampling conditions, equipment vandalism or equipment failures that occur despite proper operations and maintenance; or,
ii. The modification does not reduce the minimum number of data points, which are a product of monitoring location, frequency, and length of permit term, or eliminate pollutant parameters identified in Table B-1 (of the permit).
Per Schedule B.2.f of the permit, the City will include a summary and rationale of any modifications in the subsequent MS4 annual compliance report.

4
1.4.1 Updates to Previous Monitoring Plan
The City’s MS4 permit, which expired on January 30, 2016, is currently under administrative extension. The City met its monitoring requirements for the permit term described in the 2013 Quality Assurance Monitoring Plan (QAMP) 1 and as documented in the annual compliance reports. During the permit term, the City also concluded key elements of the monitoring program listed in Schedule B.1 that have been fulfilled, including pesticide and mercury monitoring in stormwater.2 This Plan effectively updates the City’s 2013 QAMP for the timeframe relevant to the administrative extension period.
The City evaluated the monitoring program during the 2015 permit application renewal process and identified some adaptive management changes and new monitoring opportunities to be implemented under this Plan. These changes include a reduction in the number of UIC stormwater monitoring locations and the addition of several fixed land use stations that were historically sampled for direct stormwater monitoring of the MS4. In addition, the City has discontinued macroinvertebrate monitoring specifically in the Columbia Slough, resulting in a small reduction in the number of sites sampled for this monitoring element. The reason for the change is that most metrics used to evaluate the health of aquatic insect communities are developed for pool-riffle stream systems and are not effective in addressing low gradient systems like the Columbia Slough. The City is considering use of a more viable biological index that may be substituted in the Slough.
Under this revised Plan, the City has elected to resurrect four MS4 land use sites that were historically monitored between 1991 and 2011. Revisiting these sites will allow the City to assess whether there have been significant changes or detectable trends in the quality of stormwater runoff over many years, particularly in light of the best management practice (BMP) and green infrastructure implementation that has increased significantly in recent years. The fixed land use monitoring will entail flow-weighted sampling during three storms per year at each of the four sites. Given the labor-intensive nature and cost of the fixed land use monitoring coupled with the robust UIC stormwater dataset that the City has collected over the past 10-plus years, the value of the information gained compared to the reduction of UIC monitoring locations is justified. The re-allocation of resources in this manner brings value and diversity to the City’s MS4 monitoring program, as determined per our adaptive management strategies.
1.5 LONG-TERM MONITORING STRATEGY
The City’s long-term strategy for environmental monitoring is focused on evaluating the quality of both stormwater discharges and receiving waters. The purpose of the environmental monitoring is to meet the objectives listed above in Section 1.3 and to inform the City’s decisions related to stormwater management priorities per our adaptive management strategies. For both of these monitoring elements (stormwater and receiving water), different types of sampling are conducted in an attempt to answer various questions that will address this purpose. More detail regarding these types of monitoring and how they address the City’s long-term strategy is as follows:
1 The City submitted its QAMP to the Oregon DEQ on June 1, 2011. DEQ conditionally approved the QAMP with comments that triggered additional revisions. The City subsequently submitted a revised QAMP in accordance with Schedule B.2.e of the permit on January 29, 2013.
2 The permit-required pesticide monitoring was completed in year 2013-14 in accordance with the City’s Pesticide Monitoring Plan that was submitted to DEQ on June 28, 2012. The conclusion of the pesticide monitoring was documented in the City’s Year 19 (2013-14) Annual Compliance Report. The mercury monitoring was also concluded in year 2013-14 and the City received approval from DEQ to eliminate the mercury monitoring on January 30, 2014.
5
1.5.1 Stormwater Monitoring
With respect to stormwater discharges, the City’s strategy is to conduct two types of monitoring. The first is referred to as probabilistic monitoring3, which includes the collection of stormwater runoff grab samples from City UIC sites with small drainage areas. This probabilistic method has been used by the City to build a robust inventory of stormwater quality data and to further evaluate pollutant sources that could be related to specific drainage area qualities (e.g., traffic, land use, soils).The second type of stormwater monitoring is the collection of flow-weighted stormwater quality samples from historic fixed land use sites. Data from these sites will be used to evaluate whether detectable trends can be observed in stormwater runoff quality over time and as upstream BMPs have been implemented.
Both types of monitoring include the analysis of a comprehensive list of pollutant parameters.
1.5.2 Instream Monitoring
With respect to sampling Portland’s receiving waters, the City’s strategy is to conduct four types of instream monitoring: continuous monitoring, dry weather ambient monitoring, storm event monitoring, and macroinvertebrate monitoring. Continuous instream monitoring is conducted for select parameters (typically temperature and flow) and is used to evaluate fluctuations in water quality on a diurnal basis and when storm events occur.
The dry weather ambient monitoring will be used to evaluate instream trends over time and to assess compliance with water quality standards and Total Maximum Daily Load (TMDL) goals. Comparing dry weather instream data with instream storm event data will also provide insights into whether stormwater discharges are contributing to and/or exacerbating water quality issues or trends.
Results from macroinvertebrate sampling may provide further insight into stream quality. As macroinvertebrates are present in the stream year-round, they show the effects of degraded water quality and habitat. Some macroinvertebrates are more sensitive to pollution than others. Therefore, if a receiving stream is inhabited by macroinvertebrates that are more tolerant than others, a pollution problem could exist. Comparing information on the presence of various macroinvertebrate communities to water quality data from the same site will provide indications regarding the potential problems (e.g., low dissolved oxygen, high temperatures and sedimentation).
Results from the monitoring described in Section 1 will be used to inform and adaptively manage the City’s stormwater management program over time.
3 Also known as generalized random tessellation stratified (GRTS) design using methods developed by Stevens and Olsen (2004)

6
Table 1.1 Monitoring Objectives Matrix
Monitoring Objective
Environmental Monitoring Elements
Instream Monitoring Dry and Wet Season
(Section 2.0)
Instream Monitoring Continuous
(Section 3.0)
Stormwater Monitoring Probabilistic UIC Sites
(Section 4.0)
Stormwater Monitoring Historic Land Use Sites
(Section 4.0)
Macroinvertebrate Monitoring
(Section 5.0)
i. Evaluate the source of the 2004/2006 303(d) listed pollutants applicable to the co-permittees permit area
Analysis of instream samples includes TMDL and some 303(d) listed pollutants (some are monitored using surrogates, such as TSS). Evaluating instream pollutant concentrations in dry weather versus wet weather conditions will assist in identifying the role that stormwater plays as a contributing source of these pollutants.
Evaluating flow and temperature data (and sometimes turbidity) on a continuous basis can be used in comparison with instream water quality data to identify the relationship between these parameters and pollutant concentrations.
Analysis of stormwater samples includes most TMDL and some 303(d) listed pollutants (some are monitored using surrogates, such as TSS). Comparison of stormwater monitoring results with instream results may provide information to evaluate the role that stormwater plays as a potential source.
Analysis of stormwater samples includes TMDL and some 303(d) listed pollutants (some are monitored using surrogates, such as TSS). Comparison of stormwater monitoring results with instream results may provide information to evaluate the role that stormwater plays as a potential source.
Macroinvertebrate sampling, when combined with instream pollutant concentration results, provides information to support the identification of pollutants of concern.
ii. Evaluate the effectiveness of Best Management Practices (BMPs) to assist in identifying BMP priorities
In combination with results from stormwater monitoring, instream data can be used to evaluate instream trends and the overall effectiveness of stormwater management program/BMP implementation.
If a relationship is identified between flow/turbidity data and pollutant concentrations, that information may be used to select and refine BMPs to enhance effectiveness.
Stormwater monitoring will provide information to support the evaluation of overall BMP effectiveness in reducing pollutants in the monitored catchment.
Stormwater monitoring will provide information to support the evaluation of overall BMP effectiveness in reducing pollutants in the monitored catchment.
Macroinvertebrate monitoring may be used to assess overall program improvements.
iii. Characterize stormwater based on land use type, seasonality, or geography
N/A N/A Probabilistic monitoring may potentially answer more specific questions regarding sources of stormwater pollutant concentrations.
Returning to fixed land use stations for monitoring will be used to answer questions related to whether trends have been observed as a result of upstream management measures, and whether trends vary by land use.
Indirectly provides information to support the characterization of MS4 runoff discharges based on seasonality and/or geography.
iv. Evaluate long-term trends in receiving waters associated with MS4 stormwater discharges
Instream data can be used to assess trends. Both dry weather and wet season data will be collected to evaluate ambient trends reflective of stormwater management program implementation.
N/A Stormwater monitoring will assist in the interpretation of instream trends analyses.
Stormwater monitoring will assist in the interpretation of instream trends analyses.
Macroinvertebrate sampling will provide information to support the evaluation of trends in receiving waters and may be used for trending as an independent measure.
v. Assess the chemical, biological, and physical effects of MS4 stormwater discharges on receiving waters
Instream monitoring will provide information to assess the chemical and physical effects of MS4 runoff on receiving waters.
Continuous instream monitoring will provide information to assess select physical effects of MS4 runoff on receiving waters.
Stormwater monitoring will assist in the interpretation of instream water quality concerns and will be used to evaluate potential impacts.
Stormwater monitoring will assist in the interpretation of instream water quality concerns and will be used to evaluate potential impacts.
Macroinvertebrate monitoring will provide information to assess the biological effects of MS4 runoff on receiving waters.
vi. Assess progress toward meeting TMDL pollutant load reduction benchmarks
Instream monitoring will provide information regarding progress toward meeting TMDL waste load allocations (used to establish pollutant load reduction benchmarks).
N/A Stormwater monitoring may provide information (i.e., improved land use concentrations) for use in the pollutant loads modeling to assess progress toward meeting pollutant load reduction benchmarks.
Stormwater monitoring may provide information (i.e., improved land use concentrations) for use in the pollutant loads modeling to assess progress toward meeting pollutant load reduction benchmarks.
N/A
NA = not applicable.
7
SECTION 2
DRY AND WET SEASON INSTREAM MONITORING This section provides a summary of the instream portion of the monitoring program. This summary includes a description of the project task/organization, background, monitoring objectives, monitoring locations, and connection to the long-term monitoring strategy.
2.1 PROJECT TASK/ORGANIZATION
Instream monitoring refers to the collection of water quality samples from streams that receive MS4 discharges. Samples will be collected at fixed sampling locations to evaluate receiving water quality and ambient trends over time and to evaluate instream quality during storm events. The samples will be collected by City of Portland staff and analyzed by the City of Portland water pollution control laboratory (WPCL) or Test America as described in Section 9.0 of this document. WPCL staff will be responsible for data management, and MS4 staff will perform data assessment and evaluation.
2.2 BACKGROUND
Since the early 1990s, the City has collected samples from a set of fixed instream monitoring locations representing various receiving water bodies throughout the City. In 2010, the City re-evaluated its instream monitoring program based on national watershed monitoring approaches. The City then transitioned to a new method for continued instream monitoring adapted from the U.S. Environmental Protection Agency National Rivers and Streams Assessment, Field Operations Manual (US EPA, 2009). The new method is called the generalized random tessellation stratified, or GRTS, design. The design has a rigorous statistical foundation, yet is able to adapt to the challenges and complexities of collecting data in the natural environment. This instream monitoring program includes four rotating panels of sampling locations at both perennial and intermittent stream sites.
As the City transitions to this new instream monitoring protocol, the fixed monitoring sites have also been maintained to allow for continued receiving water quality data analysis and evaluation of ongoing trends (as required by the MS4 permit). Results from the fixed sites can also be used for a comparison between the two monitoring approaches.
2.3 MONITORING OBJECTIVES
Instream monitoring will contribute to monitoring objectives i, ii, iv, v, and vi identified in Schedule B.1 of the MS4 permit (see Table 1.1). Specifically, instream monitoring is critical for evaluating long-term trends in receiving waters with MS4 discharges, as well as for assessing the effects of MS4 discharges on receiving waters by evaluating and comparing data during both dry and wet weather conditions. Instream monitoring will also assist in evaluating progress toward addressing TMDL objectives including benchmarks.

8
2.4 MONITORING LOCATIONS
Table 2.1 lists the fixed instream monitoring locations that will be sampled. These sites were selected as representative of a variety of the major watersheds in Portland and various land uses and geographies.
Table 2.1 Fixed Instream Monitoring Locations Site ID Location Stream Name Watershed
AWB NE Airport Way Bridge B Columbia Slough Columbia Slough
SJB St. John’s Landfill Bridge Columbia Slough Columbia Slough
M2 1900 SE Millport Road Johnson Creek Johnson Creek
JC-6 SE 158th Ave. Bridge Johnson Creek Johnson Creek
FC-8 4916 SW 56th Avenue Fanno Creek Fanno Creek
TC-4 10750 SW Boones Ferry Road Tryon Creek Tryon Creek
TC-5 SW 26th Way and Barbur Boulevard Tryon Creek Tryon Creek
TC-6 9323 SW Lancaster Road Tryon Creek Tryon Creek
WR-BM Morrison Street Bridge – RM 12.7 Willamette River Willamette River
WR-CM St. John’s Railroad Bridge – RM 6.8 Willamette River Willamette River
WR-FM Waverly Country Club – RM 17.9 Willamette River Willamette River
2.4.1 Monitoring Frequency & Schedule
A minimum of four samples will be collected per year at each location. Two of the four samples will be collected during storm events unless conditions beyond the City’s reasonable control are encountered that prevent the collection of the storm event samples.
As per Schedule B.3 of the permit for instream monitoring:
• A minimum of 50 percent of the water quality sampling events must be collected during the wet season (October 1 to April 30).
• Each unique sample event must occur at a minimum of 14 days apart.
2.4.2 Sample Collection Methodology
Grab samples will be collected at the listed instream sites, facing upstream. At wadeable sites, the sample bottle or beaker will be submerged upside down, then slowly turned right side up while bringing it up through the water column. Samples will be collected directly into the analyte-specific bottle if there is sufficient water depth. If water depth is insufficient for direct collection into bottles, samples will be collected into a decontaminated stainless steel beaker and then transferred into the analyte-specific bottles. Prior to use in the field, beakers will be decontaminated according to the protocol described in Section 7.64 of the WPCF-SAP. For deeper, faster-moving stream segments, samples are collected from bridges using a column sampler in accordance with BES Field Operations Standard Operating Procedure (SOP) 2.02d.
9
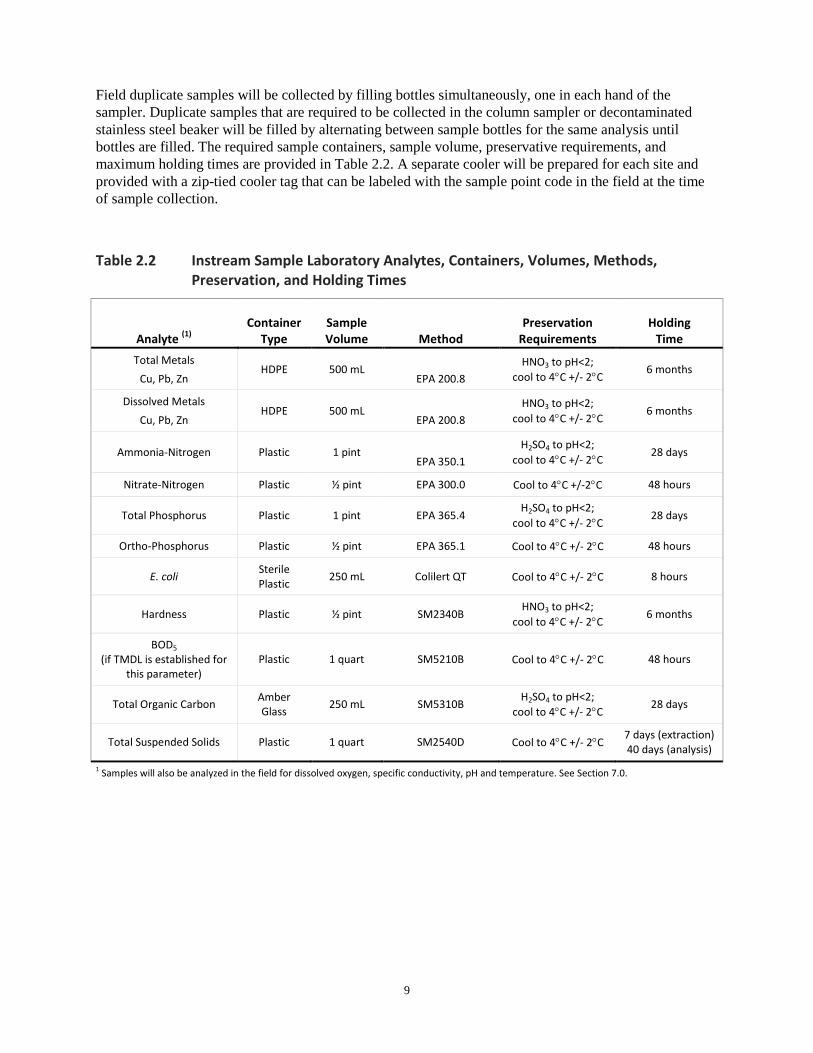
Field duplicate samples will be collected by filling bottles simultaneously, one in each hand of the sampler. Duplicate samples that are required to be collected in the column sampler or decontaminated stainless steel beaker will be filled by alternating between sample bottles for the same analysis until bottles are filled. The required sample containers, sample volume, preservative requirements, and maximum holding times are provided in Table 2.2. A separate cooler will be prepared for each site and provided with a zip-tied cooler tag that can be labeled with the sample point code in the field at the time of sample collection.
Table 2.2 Instream Sample Laboratory Analytes, Containers, Volumes, Methods, Preservation, and Holding Times
Analyte (1) Container
Type Sample Volume Method
Preservation Requirements
Holding Time
Total Metals Cu, Pb, Zn
HDPE 500 mL
EPA 200.8 HNO3 to pH<2;
cool to 4°C +/- 2°C 6 months
Dissolved Metals Cu, Pb, Zn
HDPE 500 mL
EPA 200.8 HNO3 to pH<2;
cool to 4°C +/- 2°C 6 months
Ammonia-Nitrogen Plastic 1 pint
EPA 350.1 H2SO4 to pH<2;
cool to 4°C +/- 2°C 28 days
Nitrate-Nitrogen Plastic ½ pint EPA 300.0 Cool to 4°C +/-2°C 48 hours
Total Phosphorus Plastic 1 pint EPA 365.4 H2SO4 to pH<2;
cool to 4°C +/- 2°C 28 days
Ortho-Phosphorus Plastic ½ pint EPA 365.1 Cool to 4°C +/- 2°C 48 hours
E. coli Sterile Plastic 250 mL Colilert QT Cool to 4°C +/- 2°C 8 hours
Hardness Plastic ½ pint SM2340B HNO3 to pH<2;
cool to 4°C +/- 2°C 6 months
BOD5
(if TMDL is established for this parameter)
Plastic 1 quart SM5210B Cool to 4°C +/- 2°C 48 hours
Total Organic Carbon Amber Glass 250 mL SM5310B H2SO4 to pH<2;
cool to 4°C +/- 2°C 28 days
Total Suspended Solids Plastic 1 quart SM2540D Cool to 4°C +/- 2°C 7 days (extraction) 40 days (analysis)
1 Samples will also be analyzed in the field for dissolved oxygen, specific conductivity, pH and temperature. See Section 7.0.

10
2.5 CONNECTION TO LONG-TERM MONITORING STRATEGY
Instream water quality monitoring is one of the monitoring elements that the City has employed to inform the MS4 program management, as well as TMDL development and implementation. Instream water quality monitoring provides a direct measure of the chemical condition of streams within the City that receive MS4 stormwater discharges. In addition to other chemical, physical, and biological data collected instream, as described in Sections 3 and 5, instream water quality monitoring allows for calculating trends analyses, correlating physical and chemical measurements to biological health of the stream, tracking long-term climatic changes, and evaluating the cumulative effect of implementing the City’s NPDES MS4 Stormwater Management Plan (SWMP). Therefore, instream water quality monitoring will remain a central element of the City’s monitoring program.
11
SECTION 3
CONTINUOUS INSTREAM MONITORING This section provides a summary of the continuous instream monitoring portion of the program. The summary describes project task/organization, background, monitoring objectives, monitoring locations, special data quality objectives/criteria, and connection to the long-term monitoring strategy.
3.1 PROJECT TASK/ORGANIZATION
Continuous instream monitoring refers to ongoing physical and chemical stream monitoring at fixed locations within streams that receive MS4 runoff. Continuous instream monitoring is typically conducted every 15 or 30 minutes, depending on the constituent measured. It typically consists of stream gauge as well as the calculation of stream flow (discharge), based on the cross section of the stream at the monitoring location and the recorded stream gauge height. The U.S. Geological Survey (USGS) operates the monitoring sites at several instream locations in Portland and they provide data management and storage and limited data interpretation. Information from these sites can be found at http://waterdata.usgs.gov/nwis/rt.
3.2 BACKGROUND
The USGS operates stream gauges in many Portland streams. Some sites have been monitored since 1940, but more typically, monitoring started in the 1980s. All gauges provide gauge height and calculated discharge. Four gauges also provide temperature monitoring (see Table 3.1). These gauge data can be used to compare chemical monitoring results in terms of their potential relationship with flow. These gauges have also provided valuable information for a variety of permit and TMDL-related activities, such as the creation of flow duration curves in Johnson Creek that were instrumental in establishing the bacteria TMDL.
3.3 MONITORING OBJECTIVES
Continuous instream monitoring, as available, will contribute to monitoring objectives i, ii, and v identified in Schedule B.1 of the MS4 permit (see Table 1.1).
3.4 MONITORING LOCATIONS
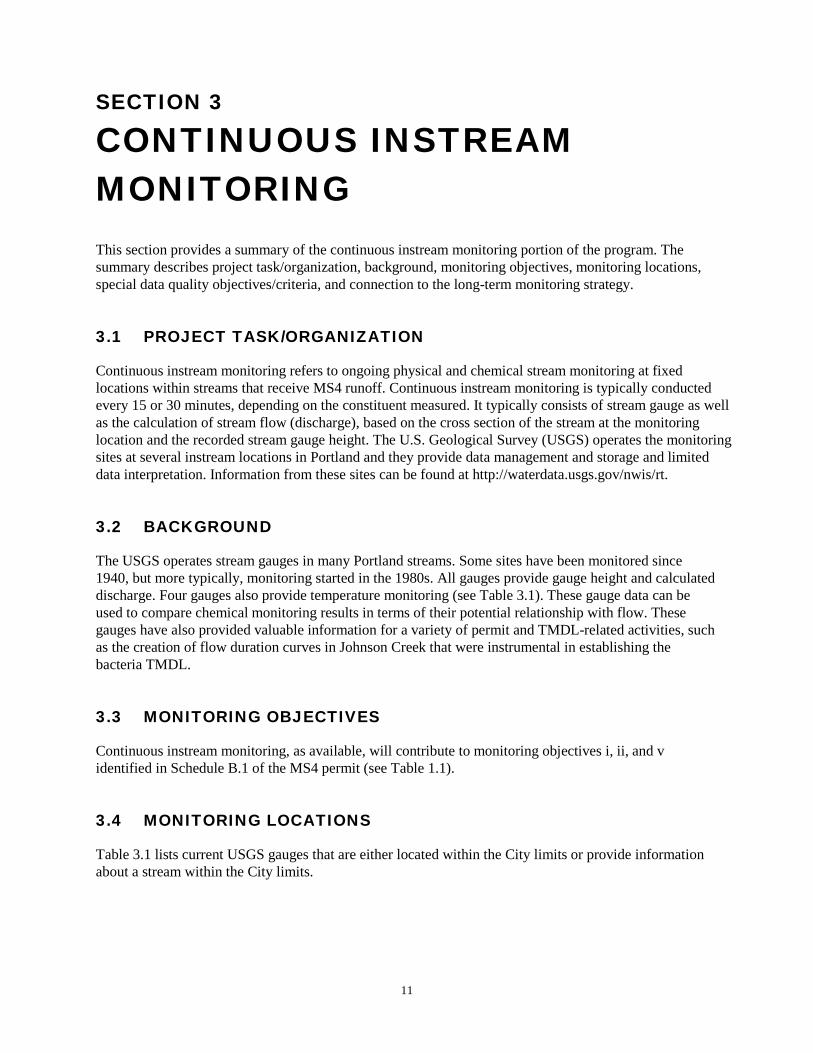
Table 3.1 lists current USGS gauges that are either located within the City limits or provide information about a stream within the City limits.
12
Table 3.1 Continuous Instream Monitoring Locations (Current USGS Gauges) Location Parameter Period of record
Columbia Slough – RM 0.25
Gauge #14211820
Gauge height Discharge
Stream velocity
10/01/1989 – to date 10/01/1989 – to date
Fanno Creek at 56th Ave. – RM 11.9
Gauge #14206900
Gauge height Discharge
10/01/1990 – to date 10/01/1990 – to date
Johnson Creek at Sycamore – RM 10.2
Gauge #14211500
Gauge height Discharge
Temperature
07/01/1940 – to date 10/01/2001 – to date 04/28/1998 – to date
Johnson Creek at Milwaukie – RM 0.7
Gauge #14211550
Gauge height Discharge
Temperature
04/22/1989 – to date 04/22/1989 – to date 05/07/1998 – to date 11/10/2004 – to date
Kelly Creek at 159th Dr. – RM 0.0
Gauge #14211499
Gauge height Discharge
Temperature
03/11/2000 – to date 01/29/2000 – to date 07/27/2010 – to date
Tryon Creek near Lake Oswego – RM 1.0
Gauge #14211315
Gauge height Discharge
08/03/2001 – to date 08/02/2001 – to date
Willamette River at Morrison Bridge – RM 12.8 Gauge #14211720
Gauge height Discharge
Temperature Turbidity
Specific conductance Stream velocity
Dissolved oxygen pH
Chlorophyll Cyanobacteria Nitrate, in situ
10/11/1987 – to date 10/01/1972 – to date 11/07/1975 – to date 01/22/2009 – to date 12/02/1975 – to date 10/01/1972 – to date 01/22/2009 – to date 01/22/2009 – to date 01/22/2009 – to date 06/08/2013 – to date 06/08/2013 – to date
3.4.1 Monitoring Frequency and Duration
All parameters at all the gauges in Table 3.1 are logged every 15 minutes, except the Willamette River gauge, which creates a data point every 30 minutes. Table 3.1 shows the period of record; monitoring is expected to continue into the foreseeable future at all of these sites.
3.4.2 Sample Collection Methodology
The USGS measures gauge height and discharge according to methods described in Rantz and others (1982) and measures temperature and turbidity according to methods described in Wagner et al. (2006).

13
3.5 SPECIAL DATA QUALITY OBJECTIVES AND CRITERIA
The USGS manages all aspects of the installation, maintenance, calibration, reporting, and storage of data from its gauging stations. USGS data are flagged as provisional until they are reviewed and meet USGS data quality standards. Quality assurance procedures for USGS discharge data are described in Rantz (1982) and described in Wagner et al. (2006) for temperature and turbidity data.
3.6 CONNECTION TO LONG-TERM MONITORING STRATEGY
Continuous instream discharge, temperature, and turbidity monitoring provides a direct measure of chemical and physical conditions of streams within the City that receive MS4 discharges. In connection with other chemical, physical, and biological data collected instream (as described in Sections 2 and 5), continuous instream monitoring allows for calculating trends analyses, correlating the biological health of streams to physical and chemical measurements, tracking long-term climatic changes, and evaluating the cumulative effect of implementing the MS4 SWMP. Therefore, continuous monitoring, as available from USGS, will remain an element of the City’s monitoring program.

14
SECTION 4
STORMWATER MONITORING This section provides a summary of the stormwater monitoring portion of the program. The summary describes project task/organization, background, monitoring objectives, monitoring locations, and connection to the long-term monitoring strategy.
4.1 PROJECT TASK/ORGANIZATION
Stormwater monitoring refers to the monitoring of stormwater discharges from a defined point in the stormwater system during defined storm events. All stormwater monitoring sites are manholes within the storm collection system or the UIC system. City of Portland staff will collect the samples, and the City WPCL and the City’s contract laboratories will analyze the samples, as described in Section 8.0 of this Plan. WPCL staff will be responsible for data collection and management, and MS4 program staff will perform data evaluation and reporting.
4.2 BACKGROUND
The City began collecting stormwater samples from 10 land use-based monitoring locations in 1991 to meet NPDES permit requirements to characterize stormwater runoff. Monitoring at these 10 land use stations continued through 1997.
In 1997, a comprehensive stormwater land use characterization report (ACWA, 1997) was developed that compiled stormwater characterization data from all Phase I permittees in Oregon. The study concluded that for most parameters, stormwater pollutant concentrations by land use are similar across all six participating jurisdictions. To date, this is still the most comprehensive stormwater characterization study conducted in Oregon. Based on this report, the DEQ agreed that “a good deal of this characterization has been completed, at least to a point where additional information is not likely to significantly improve our current knowledge of general water quality conditions from different land uses” (DEQ, June 24, 1997). Therefore, beginning in 1997, land use-based stormwater monitoring was gradually reduced and funds were shifted to other aspects of the MS4 monitoring program, including best management practice (BMP) effectiveness and instream surface water monitoring. Subsequently in 1997, only three of the ten land use locations were carried forward in the City’s monitoring program until January 2011, when the City’s MS4 permit was renewed for the third permit term.
Since the 1991‒1996 stormwater monitoring study (ACWA, 1997) and rainfall quality study (Sullivan, 2005) indicated that differences in rainfall and stormwater pollutant concentrations are predominantly driven by land use and not geography, the City shifted its stormwater monitoring strategy away from land use sites to the City UIC network for the new 2011 permit term. In January 2011, the City initiated a probabilistic stormwater monitoring approach which included sampling runoff at City UIC locations. The advantage of targeting the UIC stormwater network for MS4 compliance monitoring is that is has been sampled since 2005 and a large stormwater pollutant concentration data set is already available that enables robust statistical analyses. Throughout the 2011 - 2016 MS4 permit term, three different panels of 15 UIC sampling sites were monitored each year for a total of 45 data points per year.

15
Under this revised Plan, the City has elected to revisit four of the original land use sites with historic data in order to assess whether there have been significant changes or detectable trends in the quality of stormwater runoff. Given a shift of resources to evaluate trends in stormwater pollutant concentrations from historic fixed land use sites, the probabilistic UIC monitoring level has been adjusted to include monitoring of 15 UIC sites per year.
4.3 MONITORING OBJECTIVES
Stormwater monitoring will contribute to monitoring objectives i, ii, iii, iv, v, and vi identified in Schedule B.1 of the MS4 permit (see Table 1.1). More specifically, the City has been interested in gaining a better understanding of the drivers of stormwater pollutant concentrations; this has proven very difficult to date because of the large size of the stormwater catchments sampled. Selecting smaller catchments limits the number of variables that must be considered when trying to determine the factors that influence stormwater quality. Therefore, probabilistic UIC monitoring was initiated during the permit term (January 2011 – January 2016) and will continue under this revised Plan at a modified level. In addition, and as noted above, the resurrection of several land use sites will allow the City to further evaluate runoff trends in targeted MS4 areas that have seen an increased implementation of BMPs since monitoring originally began in 1991.
4.4 PROBABILISTIC UIC MONITORING
The City implements a program to monitor stormwater entering the City’s UIC system to comply with both UIC and MS4 permit requirements. A description of this probabilistic stormwater monitoring is provided below and described further in the WPCF-SAP.
4.4.1 Description of Sample Design
With respect to selected monitoring sites from the UIC system (approximately 9,600 UICs), the Stevens and Olsen (2004) generalized random-tessellation stratified (GRTS) design was selected. The method has been used by the U.S. Environmental Protection Agency and state agencies to successfully monitor water quality, physical habitat, and aquatic life for several years. The design has a rigorous statistical foundation, yet is able to adapt to the challenges and complexities of collecting data in the natural environment.
GRTS survey design is specifically designed to efficiently characterize a large system with many potential sampling locations. It randomly selects sampling locations in a manner that produces a spatially balanced sample. The GRTS method is designed for large-scale environmental sampling programs such as those required under the MS4 permit. The GRTS method can also accommodate long-term monitoring programs whose objectives may change over time. With a spatially balanced sample, important subpopulations can be identified throughout the course of the monitoring, and greater sampling efforts can be focused on these subpopulations if supported by a change in the program objectives. In this way, the sampling program can be adaptively managed as it progresses, without losing any statistical power to analyze the collected data.
4.4.2 Target Population
Close to 20,000 potential stormwater sampling locations (every accessible manhole) are within the City’s stormwater network. Smaller catchments or drainage basins are targeted to better understand the drivers

16
of stormwater pollutant concentrations. MS4 drainage basins are generally large, ranging from 0.01 acres to 750 acres with an average 9.7 acres, whereas UIC catchments are smaller, ranging in size from 0.1 acres to 75 acres with an average 2.1 acres. Because UIC catchments are monitored for the UIC program and because of the smaller average size of the UIC catchments, these catchments were selected for MS4 probabilistic stormwater monitoring.
4.4.3 Monitoring Locations
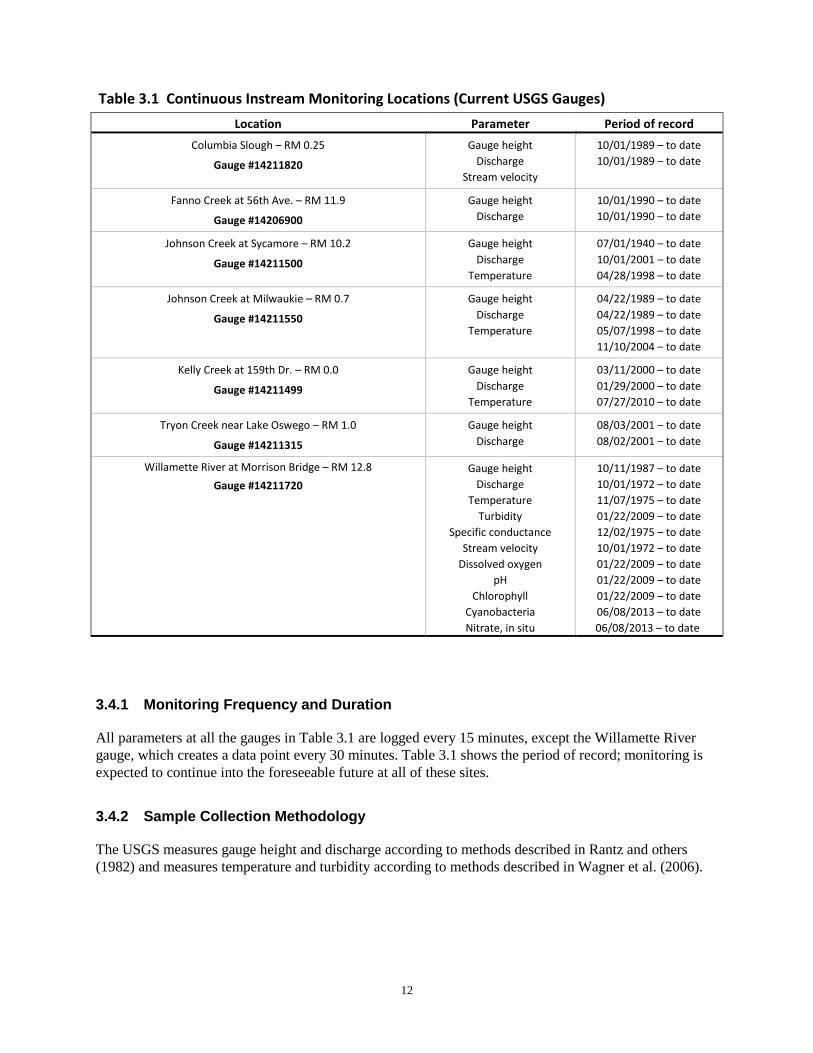
The City applies the GRTS survey design for selection of the subset of City UICs located in shallow groundwater to be monitored for permit compliance. Selecting UICs from only the subset located in shallow groundwater is being done to meet a monitoring objective of the City’s WPCF permit to target “higher risk” sites. There are approximately 120 UICs located in areas of shallow groundwater, from which different panels of 15 UICs are selected for monitoring each year.1
Sampling locations (i.e., UIC identification) for each panel are finalized during the summer months before the monitoring season in which they will be sampled. UIC locations are not duplicated among panels and each UIC is investigated and field verified before the sampling panel is finalized.2
Table 4.1 provides a list of all GRTS-selected shallow groundwater UIC locations from which the sampling panels will be selected each year. The WPCF-SAP has additional details on the sampling design and it also includes figures showing these UIC locations.
1 The first 75 UICs on the list of 120 that are suitable for sampling are used as the sample during the WPCF permit term, with sequential blocks of 15 UICs making up each of the panels. For the purpose of choosing the UIC sampling panels, the entire population of UICs located in shallow groundwater areas was placed into random order as described in the WPCF-SAP.
2 Before sampling, desktop reconnaissance and field research are performed for each UIC sample location to determine if the UIC is suitable for sampling based on factors such as: unsafe sampling conditions, lack of accessibility, inactive status, etc. If a UIC is deemed unsuitable for sampling, a replacement UIC is selected and documented.

17
Table 4.1 Probabilistic UIC Monitoring Locations
Site ID Approximate Address
Estimated Trips per Day
(TPD)
Traffic Category
(TPD) DEQ UIC ID BES UIC ID Latitude Longitude UIC Depth
(feet) Pretreatment
System Separation Distance(ft) Notes
SG-001 2542 SE 18TH AVE 2315 < 1000 10102-9640 APR303 45.50400000 -122.64800000 23' No Sed MH 2 Sampled 15/16
SG-002 12140 SE RAMONA ST 11195 > 1000 10102-5319 ADT716 45.48055267 -122.53763580 28' Sed MH -11 Sampled 15/16
SG-003 5980 SE 102ND AVE 688 < 1000 10102-5429 ADV146 45.47930145 -122.55857086 22' Sed MH 3
SG-004 5031 SE 128TH AVE 1544 < 1000 10102-5921 ADU738 45.48538970 -122.53224182 30' Sed MH -11 Sampled 15/16
SG-005 12524 SE SCHILLER ST 416 < 1000 10102-5925 ADU744 45.48737716 -122.53431701 16' Sed MH 2 Sampled 15/16
SG-006 5710 SE 115TH AVE 521 < 1000 10102-5267 ADV193 45.48116302 -122.54491424 24' Sed MH -1 Unsuitable for sampling
SG-007 8312 SE 75TH PL 501 < 1000 10102-120 ADV951 45.46345520 -122.58612823 30' Sed MH 2 Sampled 15/16
SG-008 4332 SE 130TH AVE 1606 > 1000 10102-822 ADT455 45.49054336 -122.53001403 20' Sed MH 1 Sampled 15/16
SG-009 5000 SE 122ND AVE 12138 > 1000 10102-5896 ADW266 45.48593139 -122.53773498 20' No Sed MH 0 Unsuitable for sampling
SG-010 10298 SE ELLIS ST 1051 < 1000 10102-5463 ADV187 45.48181533 -122.55730438 23.5' Sed MH 0 Sampled 15/16
SG-011 11540 SE FOSTER RD 25775 > 1000 10102-5280 ADW312 45.47639083 -122.54454803 18' No Sed MH -6 Sampled 15/16
SG-012 13250 SE HOLGATE BLVD 4710 > 1000 10102-711 ANA590 45.48958969 -122.52693939 Unknown Sed MH -1 Sampled 15/16
SG-013 12122 SE HAROLD ST 11646 > 1000 10102-5904 ADW275 45.48316955 -122.53810882 22' No Sed MH 1 Unsuitable for sampling
SG-014 10357 SE ELLIS ST 279 < 1000 10102-5460 ACP889 45.48178482 -122.55604553 19' Sed MH 2
SG-015 6245 NE 80TH AVE 2900 > 1000 10102-870 ANB185 45.56816482 -122.58040618 Unknown No Sed MH -11 Sampled 15/16
SG-016 13236 SE CORA ST 419 < 1000 10102-6324 ADT463 45.49154663 -122.52667236 23.3' Sed MH -1 Sampled 15/16
SG-017 5403 SE 122ND AVE 11646 > 1000 10102-5900 ADW271 45.48409271 -122.53801727 21' No Sed MH -4 Sampled 15/16
SG-018 5803 SE 122ND AVE 11133 > 1000 10102-5288 ADT682 45.48019409 -122.53735351 27' Sed MH -11
SG-019 5905 SE 102ND AVE 553 < 1000 10102-165 ADV144 45.47944641 -122.55856323 20.6' Sed MH 4 Sampled 15/16
SG-020 13030 SE MITCHELL ST 178 < 1000 10102-5934 ADU753 45.48421096 -122.52912139 30' Sed MH 2 Sampled 15/16
SG-021 4754 SE 122ND AVE 12363 > 1000 10102-5888 ADW257 45.48746490 -122.53768920 22' Bioswale 1 Sampled 15/16
SG-022 11246 SE HAROLD ST 3295 > 1000 10102-263 AMY402 45.48283767 -122.54711151 Unknown No Sed MH -8
SG-024 12830 SE HOLGATE BLVD 5035 > 1000 10102-6315 ADT454 45.48972702 -122.53241730 20.6 Sed MH 0
SG-025 12010 SE REEDWAY ST 205 < 1000 10102-5269 ADV196 45.48127365 -122.53939056 28' Sed MH -13
SG-026 5712 SE 103RD AVE 1109 > 1000 10102-117 AMT874 45.48089981 -122.55725097 21.2' Bioswale, Sed MH 0
SG-027 11501 SE FOSTER RD 25775 > 1000 10102-5272 ADW303 45.47650909 -122.54454040 19' No Sed MH -9
SG-028 13515 SE HOLGATE BLVD 4568 > 1000 10102-1908 AMR622 45.48900985 -122.52449035 21' Sed MH 2
SG-029 5500 SE 121ST AVE 4885 > 1000 10102-5914 ADU735 45.48327636 -122.53894805 30' Sed MH -9
SG-030 10402 SE ELLIS ST 279 < 1000 10102-169 ADV190 45.48177337 -122.55564880 21' Bioswale, Sed MH -1
SG-031 8111 NE HOLMAN ST 0 < 1000 10102-3106 ADV384 45.56826782 -122.57869720 14' No Sed MH -10
SG-032 13658 SE CORA ST 413 < 1000 10102-6334 ADT474 45.49146270 -122.52229309 19.7' Sed MH 1
SG-033 5423 SE 121ST AVE 806 < 1000 10102-5912 ADU734 45.48351287 -122.53894042 30' Sed MH -8
SG-034 12319 SE RAMONA ST 1089 > 1000 10102-5300 ADT696 45.48014068 -122.53573608 20.2' Sed MH 0
SG-036 5544 SE 128TH AVE 1298 > 1000 10102-5294 ADT689 45.48270797 -122.53215789 30' Sed MH -8
SG-037 4918 SE 122ND AVE 12138 > 1000 10102-5892 ACK357 45.48641204 -122.53774261 20' Sed MH 1
SG-038 11134 SE STEELE ST 173 < 1000 10102-5910 ADU731 45.48452758 -122.54837036 30.1' Sed MH -2
SG-039 5918 SE 122ND AVE 10908 > 1000 10102-5286 ADV203 45.47868728 -122.53705596 30' No Sed MH -1
SG-040 12920 SE HOLGATE BLVD 4814 > 1000 10102-6314 ADT453 45.48973464 -122.53133392 19.6' Sed MH 0
SG-041 5601 SE 122ND AVE 11400 > 1000 10102-5281 ADW313 45.48228073 -122.53800201 24' Sed MH 0
SG-042 5635 SE 102ND AVE 440 < 1000 10102-164 ADV130 45.48136520 -122.55846405 22' Sed MH 2
SG-043 11020 NE MARX ST 1714 > 1000 10102-791 ANB108 45.56054306 -122.54932403 16' No Sed MH 2

18
Table 4.1 Probabilistic UIC Monitoring Locations
Site ID Approximate Address
Estimated Trips per Day
(TPD)
Traffic Category
(TPD) DEQ UIC ID BES UIC ID Latitude Longitude UIC Depth
(feet) Pretreatment
System Separation Distance(ft) Notes
SG-044 4406 SE 135TH AVE 186 < 1000 10102-925 AMX686 45.49053573 -122.52488708 25.4' Sed MH -9
SG-045 12532 SE ELLIS ST 236 < 1000 10102-5293 ADT688 45.48248672 -122.53414154 30' No Sed MH -8
SG-046 5736 SE 102ND AVE 426 < 1000 10102-5422 ADV135 45.48060989 -122.55849456 20.7' Bioswale, Sed MH 3
SG-047 4022 NE 142ND AVE 426 < 1000 10102-9474 AAV769 45.55256271 -122.51643371 Unknown Sed MH -1
SG-048 4241 SE 136TH AVE 10104 > 1000 10102-6335 ADT475 45.49134826 -122.52353668 27' Sed MH -8
SG-049 5211 SE 122ND AVE 11953 > 1000 10102-574 ADW269 45.48487472 -122.53798675 22' No Sed MH 1
SG-050 4736 SE 115TH AVE 821 < 1000 10102-6110 AMR771 45.48759078 -122.54449462 31' Sed MH 3
SG-051 9956 SE HAROLD ST 3892 > 1000 10102-855 ANA841 45.48259353 -122.56085968 30' No Sed MH 4
SG-052 13033 SE HOLGATE BLVD 4710 > 1000 10102-714 ANA596 45.48972320 -122.52897644 Unknown Sed MH -16
SG-053 4919 SE 122ND AVE 12138 > 1000 10102-5891 ADW261 45.48643875 -122.53794097 21' No Sed MH 0
SG-054 5440 SE 111TH AVE 1848 > 1000 10102-5765 ADW230 45.48312759 -122.54922485 19' No Sed MH 3
SG-055 11741 SE FOSTER RD 25775 > 1000 10102-5273 ADW304 45.47650909 -122.54300689 19' No Sed MH 2
SG-056 13250 SE HOLGATE BLVD 4710 > 1000 10102-713 ANA592 45.48958969 -122.52688598 Unknown No Sed MH -1
SG-057 5500 SE 122ND AVE 11646 > 1000 10102-5903 ADW274 45.48321151 -122.53783416 20.2' No Sed MH 1
SG-058 10304 SE ELLIS ST 1051 > 1000 10102-5458 ACP887 45.48181152 -122.55709075 20.5' Sed MH 2
SG-059 4656 NE 118TH AVE 436 < 1000 10102-3576 ADQ418 45.55727005 -122.54135131 30.1' No Sed MH 3
SG-060 4144 SE 132ND AVE 0 < 1000 10102-6287 ADT426 45.49193954 -122.52745056 30' Sed MH -2
SG-061 12246 SE ELLIS ST 224 < 1000 10102-5292 ADT687 45.48254776 -122.53687286 25' Sed MH -4
SG-062 6034 SE 102ND AVE 894 < 1000 10102-5435 ADV154 45.47859573 -122.55861663 26.1' Sed MH 0
SG-063 13820 SE GLADSTONE ST 430 < 1000 10102-6333 ADT473 45.49227905 -122.52095794 20.9' Sed MH 4
SG-064 1839 NE MARINE DR 11064 > 1000 10102-1042 ANA900 45.60036468 -122.64641571 10.2' Sed MH 2
SG-065 4745 SE 122ND AVE 12363 > 1000 10102-5887 ADW256 45.48761749 -122.53787994 20' Sed MH 3
SG-066 8318 SE 78TH AVE 86 < 1000 10102-4830 ADV950 45.46357727 -122.58353424 27.5' No Sed MH -13
SG-067 10246 SE ELLIS ST 1051 > 1000 10102-5462 ACP891 45.48181915 -122.55750274 20.4' No Sed MH 3
SG-068 13250 SE HOLGATE BLVD 4710 > 1000 10102-712 ANA591 45.48958969 -122.52690887 Unknown Sed MH -1
SG-069 12210 SE ELLIS ST 11461 > 1000 10102-5291 ADT686 45.48255157 -122.53763580 17' Sed MH 4
SG-070 6135 NE 80TH AVE 2900 > 1000 10102-869 ANB182 45.56728363 -122.58050537 17' Sed MH -16
SG-071 5404 SE 122ND AVE 11646 > 1000 10102-5901 ADW272 45.48406600 -122.53781890 17.9' Sed MH 1
SG-072 4490 SE 125TH AVE 5249 > 1000 10102-6312 ADT451 45.48973846 -122.53472900 20' No Sed MH 3
SG-073 4857 SE 122ND AVE 12261 > 1000 10102-5889 ADW258 45.48686599 -122.53791046 21' No Sed MH 1
SG-074 8100 SE CRYSTAL SPRINGS BLVD 895 < 1000 10102-5347 AMR553 45.46509552 -122.58024597 30' Sed MH -13
SG-075 5610 SE 102ND AVE 490 < 1000 10102-5412 ADV127 45.48170852 -122.55844116 21' No Sed MH 4
SG-076 13515 SE HOLGATE BLVD 4568 > 1000 10102-352 AMY600 45.48942947 -122.52488708 21' Sed MH -2
SG-077 12500 SE HAROLD ST 1477 > 1000 10102-232 AMS283 45.48330688 -122.53488159 25' Sed MH -5
SG-078 6457 NE 66TH AVE 439 < 1000 10102-9478 ANW740 45.57010269 -122.59515380 18' Sed MH 4
SG-079 12204 SE STEELE ST 11953 > 1000 10102-5931 ADU751 45.48472213 -122.53757476 20.4' Sed MH 0
SG-080 5608 SE 99TH AVE 557 < 1000 10102-5407 ACP660 45.48171615 -122.56162261 30' No Sed MH 4
SG-081 11080 SE HAROLD ST 3791 > 1000 10102-5468 ADV191 45.48280334 -122.54930877 22.9' Sed MH -3
SG-082 4406 SE 136TH AVE 9961 > 1000 10102-558 AMX688 45.49026870 -122.52355194 22.75' Sed MH -4
SG-083 10310 SE ELLIS ST 1051 > 1000 10102-5464 ADV188 45.48180389 -122.55689239 22' Sed MH 0
SG-084 4100 SE 133RD AVE 389 < 1000 10102-6326 ADT466 45.49257659 -122.52648925 30' Sed MH -1
19
Table 4.1 Probabilistic UIC Monitoring Locations
Site ID Approximate Address
Estimated Trips per Day
(TPD)
Traffic Category
(TPD) DEQ UIC ID BES UIC ID Latitude Longitude UIC Depth
(feet) Pretreatment
System Separation Distance(ft) Notes
SG-085 12506 SE REEDWAY ST 187 < 1000 10102-5296 ADT691 45.48175430 -122.53427124 25' No Sed MH -4
SG-086 3734 NE 154TH AVE 0 < 1000 10102-4041 ADR048 45.55039215 -122.50386047 30.2' Sed MH 3
SG-087 5021 SE 122ND AVE 11953 > 1000 10102-5897 ADW267 45.48545837 -122.53794860 20' Sed MH 1
SG-088 3039 SE TOLMAN ST 1503 > 1000 10102-5590 ADW286 45.47599411 -122.63162994 30.2' Sed MH -2
SG-089 5436 SE 109TH AVE 461 < 1000 10102-5764 ADW229 45.48305511 -122.55123901 20.5' No Sed MH 2
SG-090 13250 SE HOLGATE BLVD 4710 > 1000 10102-710 ANA589 45.48958969 -122.52696228 Unknown No Sed MH 0
SG-091 5436 SE 122ND AVE 11646 > 1000 10102-5902 ADW273 45.48338317 -122.53783416 17.5' No Sed MH 4
SG-092 6015 NE 80TH AVE 6658 > 1000 10102-868 ANB179 45.56639480 -122.58049774 19.5' Sed MH -7
SG-093 5825 SE 122ND AVE 11031 > 1000 10102-267 ADV204 45.47970199 -122.53723907 25' No Sed MH -6
SG-094 12908 SE MITCHELL ST 178 < 1000 10102-5938 ADU758 45.48411178 -122.53086853 21' No Sed MH 3
SG-095 5732 SE 122ND AVE 11195 > 1000 10102-5311 ADW321 45.48059082 -122.53733062 20' Sed MH -3
SG-096 12780 SE SCHILLER ST 1778 > 1000 10102-5924 ADU743 45.48738098 -122.53247070 15.4' Sed MH 1
SG-097 11305 SE HAROLD ST 3295 > 1000 10102-1036 ANA889 45.48294830 -122.54711151 Unknown No Sed MH -8
SG-098 4425 SE 130TH AVE 4814 > 1000 10102-715 ANA598 45.48972702 -122.53005981 15.6' Sed MH -2
SG-099 5605 SE 120TH AVE 192 < 1000 10102-5270 ADV197 45.48211669 -122.54003906 26' No Sed MH -5
SG-100 11540 SE FOSTER RD 25775 > 1000 10102-5280 APV741 45.47600000 -122.54500000 18' No Sed MH -1
SG-101 10398 SE ELLIS ST 279 < 1000 10102-5466 ADV189 45.48178100 -122.55584716 20' Sed MH 0
SG-102 13722 SE CORA ST 413 < 1000 10102-6332 ADT472 45.49144363 -122.52182769 19' Bioswale, Sed MH 1
SG-103 12230 SE RAMONA ST 11133 > 1000 10102-5289 ADT683 45.48014068 -122.53694915 19.5' Sed MH -3
SG-104 13000 SE HAROLD ST 1341 > 1000 10102-5936 ADU755 45.48346710 -122.52983856 29' Sed MH -3
SG-105 12221 SE REEDWAY ST 11400 > 1000 10102-5295 ADT690 45.48181915 -122.53762054 27' Sed MH -7
SG-106 10900 NE MARX ST 1714 > 1000 10102-1316 ADV974 45.56085205 -122.55072784 16.3' Sed MH -2
SG-107 5500 SE 104TH AVE 4096 > 1000 10102-5768 ADW233 45.48270797 -122.55564117 Unknown No Sed MH 0
SG-108 13612 SE CORA ST 10104 > 1000 10102-6331 ADT471 45.49146652 -122.52326202 21' No Sed MH -1
SG-109 5906 SE 122ND AVE 11031 > 1000 10102-5287 ADV205 45.47969436 -122.53704833 28' Sed MH -7
SG-110 13110 SE GLADSTONE CT 0 < 1000 10102-6289 ADT428 45.49228286 -122.52851867 30' Sed MH 1
SG-111 4908 SE 122ND AVE 12138 > 1000 10102-5915 ADU725 45.48645782 -122.53776550 19' Sed MH 2
SG-112 11716 SE FOSTER RD 25775 > 1000 10102-5279 ACQ013 45.47637176 -122.54296875 20' No Sed MH 4
SG-113 6036 SE 102ND AVE 894 < 1000 10102-5436 ACP693 45.47846221 -122.55862426 22' No Sed MH 4
SG-114 1801 NE MARINE DR 11064 > 1000 10102-1041 ANA899 45.60034179 -122.64723968 10' Sed MH 1
SG-115 5450 SE 114TH PL 3642 > 1000 10102-5894 ADW264 45.48316574 -122.54518127 Unknown No Sed MH -5
SG-116 13008 SE HOLGATE BLVD 4710 > 1000 10102-709 ANA587 45.48961257 -122.52936553 Unknown No Sed MH -3
SG-117 12150 SE RAYMOND ST 12138 > 1000 10102-5895 ADW265 45.48594665 -122.53807830 16.5' No Sed MH 4
SG-118 11540 SE FOSTER RD 25775 > 1000 10102-9680 APV742 45.47600000 -122.54500000 13' No Sed MH -1
SG-119 10324 SE ELLIS ST 142 < 1000 10102-5465 ACP892 45.48179626 -122.55660247 21' Sed MH 0
SG-120 13326 SE CORA ST 418 < 1000 10102-6325 ADT464 45.49151229 -122.52593231 25' Sed MH -4
SG-121 5988 SE 102ND AVE 688 < 1000 10102-5431 ACP682 45.47921752 -122.55857849 21.8' Bioswale, Sed MH 3
SG-122 1445 NE MARINE DR 11064 > 1000 10102-1919 AAC311 45.60037994 -122.65004730 14.9' No Sed MH -4
20
4.4.4 Monitoring Frequency and Duration
The City will collect one stormwater sample from each of 15 designated sampling locations between July 1 and June 30 of each permit year unless conditions beyond the City’s reasonable control are encountered that prevent the collection of samples during a rain event or prevent analyzing any sample or pollutant parameter (Permit Schedule B.2.e).
The City will begin targeting storm events for sampling each fall. The remaining sites will be sampled as appropriate storm events are identified throughout the rest of the monitoring season, as storm events allow.
During each permit year, the City will attempt to sample all 15 selected locations during the same storm event. Since storms often fall short of predicted rainfall amounts and/or durations, there is a possibility that rainfall or runoff may cease prior to the collection of all 15 samples during an event. If all locations cannot be sampled during a targeted storm, the remaining locations will be sampled during subsequent storms that meet the criteria required by the permit and referenced in Section 4.6 of this document.
4.4.5 Sample Collection Methodology
The City chose a probabilistic approach to stormwater monitoring, which includes a large number of monitoring locations and annually rotating panels. This approach is only feasible if grab samples are collected because the collection of flow-composite samples is too resource-intensive for such an approach. It is infeasible and cost prohibitive to install flow meters and sampling equipment at 15 different locations every year, as well as to adjust the flow triggers based on weather forecasts that are critical for proper collection of flow-composite samples.
Grab samples will be collected using decontaminated stainless steel beakers connected to telescoping poles by swing samplers. To eliminate the need for field decontamination, a separate decontaminated beaker will be dedicated to each sample location. The sampling team will take care not to place the decontaminated beaker on the ground or hit any part of the manhole or stormwater pipe during sampling activities.
The beaker will be placed into the flow of stormwater and brought to the surface grade to fill sample containers. To the extent practicable, the beaker will be filled and emptied slowly and carefully to avoid degassing the sample. Samples will be placed in pre-cleaned bottles provided by the analytical laboratory and analyzed for the parameters specified in Table 4.2 which shows the required sample containers, sample volume, preservative requirements, and maximum holding times. A separate cooler will be prepared for each site and provided with a zip-tied cooler tag that can be labeled with the sample point code in the field at the time of sample collection.
4.4.6 Sampling Considerations
Storms may occur at any time; however, the City will primarily target storms during regular business hours to limit overtime hours that would be required of laboratory staff to meet stringent sample holding time requirements.
As described earlier in Section 4, the City will collect stormwater samples one time from 15 designated sampling locations between July 1 and June 30, unless conditions are encountered that are beyond the City’s reasonable control (e.g., atypical climatic conditions; see Section 6).

21
The City will begin tracking and targeting storm events each fall that meet the storm criteria presented in Section 4.6. It may take more than one storm to collect samples from all 15 sampling locations. Whichever locations are not sampled during the first storm will be targeted for sampling during subsequent storm events that meet the storm criteria described in Section 4.6.
4.5 FIXED LAND USE MONITORING
This section provides information on the sampling locations and methodologies at fixed land use sites.
4.5.1 Description of Sample Design
In order to evaluate trends at the fixed land use sites, methods for collecting samples will come as close as possible to methods used in collecting the previous historic data. This includes the collection of flow-weighted samples during rain events, aiming for the collection of samples from approximately three storms per year at each of the four land use sites. This will produce a total of 12 data points per year.
4.5.2 Target Population
For this permit term, the City has decided to revisit 4 of the original 10 land use sites in the storm system where significant data have been collected in the past. The purpose of revisiting these sites will be to see whether statistically significant changes have occurred in stormwater pollutant concentrations over time given the implementation of stormwater management BMPs. Sampling will be conducted at each of these four sites each year of the permit term.
4.5.3 Monitoring Locations
A summary of the four fixed land use sites that will be revisited in order to collect data to evaluate trends is provided in Table 4.1.
Table 4.2 Fixed Land Use Stormwater Monitoring Locations
Site Name Watershed
Predominant land use Location BES ID
Dates of previous
data collection
OF19 Willamette River Forest Park and Industrial
NW Front and Kittridge Avenues
AAP918 (OF 19)
2000–2011*
M1 Columbia Slough Mixed NE 122nd Avenue at the Columbia Slough
AAS510 (OF 100)
1991-2011
R1 Fanno Creek Residential Fanno Creek at SW 56th Street (instream)
X: 45.488333 Y:-122.734444
1991-2001
R2 Columbia Slough Residential NE 141st Avenue and Sandy Boulevard
AAV759 (OF AAS905)
1991-1996
* Sampling of this site began in 1995. However, data collection methods were inconsistent and not considered comparable prior to 2000.
22
4.5.4 Monitoring Frequency and Duration
For each of the four fixed land use sites, the City will attempt to collect samples during three storm events per year meeting the criteria required by the permit and referenced in Section 4.6 of this document. This will produce a total of 12 sampled events per year at the land use stations.
4.5.5 Sample Collection Methodology
To be consistent with historic sampling methods, two station designs will be employed in the field depending on whether the site is an instream or manhole location. Automatic sampling and stage recording equipment will be deployed at each site with each station consisting of the following equipment:
• Ultrasonic level sensor and/or Doppler velocity sensor to measure depth of flow and peak velocity in order to estimate flow rate.
• An automatic water quality sampler for collecting a flow-weighted composite sample. Sampling is actuated by flow as calculated by the system microprocessor based on previously collected flow data. The automatic samplers are used to store the stormwater in glass bottles during monitored events.
• A telemetry or remote sensing system to allow the station to be accessed with a personal computer remotely or via telephone lines.
The instrumentation of the instream station (R1) is contained in an enclosure mounted on a concrete pad. Manhole stations are completely contained within the existing manhole chambers, such that all equipment is suspended just under the manhole cover.
Automated samplers are programmed to deliver samples throughout the event based on a predicted rainfall volume and hence runoff volume. The intent is to obtain a good representation of the predicted storm with a collection of flow-weighted samples that are composited together in the lab. Each composite is typically composed of at least 10 to 15 aliquots of approximately 0.3 to 0.4 liters of sample volume.
4.5.6 Sampling Considerations
For the fixed land use sites, an attempt will be made to collect flow-weighted composite samples during the same three storm events for each of the four sites. The storm events will be targeted to meet the storm criteria presented in Section 4.6.
4.6 STORM EVENT TARGETING
This section provides information on sampling considerations, storm criteria, and weather forecasting, all related to the stormwater sampling described in this section.
4.6.1 Storm Criteria
Adhering to target storm criteria to the extent practicable will help ensure that stormwater runoff will be adequate for sample collection, representative of stormwater runoff, and consistent across sampling events). Before initiating sampling, the storm forecast will be evaluated against the criteria listed below to

23
assess whether a storm should be targeted for potential compliance sampling. Based on the City’s extensive experience with stormwater monitoring in this region, storms meeting these criteria are expected to provide the volume, intensity, and duration of runoff necessary to collect individual samples. Smaller storms, or storms of shorter duration, are considered to have a low probability of producing sufficient runoff to warrant the extensive preparation and mobilization time required for this project.
It is likely that a storm may not meet the criteria below when sampling is completed due to the inherent uncertainty in weather prediction. The following criteria will therefore be used as general guidance to determine when forecasted storms should be targeted for sampling during this project:
• predicted rainfall amount of ≥ 0.1 inch per storm
• predicted rainfall duration ≥ 6 hours
• a goal for the antecedent dry period is 24 hours
Storms meeting these criteria that were not predicted or were expected to have less rainfall intensity or duration are not included as potential compliance sampling events.
Hourly and daily rainfall records are available for more than 20 sites on the east side of Portland. These data are maintained in the BES’s HYDRA Data Report System and are available at:
http://or.water.usgs.gov/non-usgs/bes/raingage_info/clickmap.html
Storm characteristics for each storm during which samples are collected may be documented and summarized in the City’s annual UIC Stormwater Discharge Monitoring Report. If the City is unable to collect all samples because of atypical climatic conditions, representative climatic data will be provided to document these conditions.
4.6.2 Weather Forecasting
The Storm Monitoring Coordinator for this project is the BES Field Operations supervisor or a designated alternate (see Section 6). The Storm Monitoring Coordinator is responsible for tracking storms and reviewing consultant weather forecasts to determine if a predicted storm is likely to meet the criteria for initiating compliance sampling. If the weather forecast predicts that the storm criteria will be met, the Storm Monitoring Coordinator is responsible for mobilizing the BES sampling teams and ultimately making the “go/no go” decision.
Extended Range Forecasting Company, Inc., (ERF) a private Portland weather forecasting service, is the City’s weather consultant. The Storm Monitoring Coordinator receives daily weather forecasts from ERF that have a 10-day forecast including quantity of precipitation forecasts for each day. ERF is available on an as-needed, on-call basis for telephone consultations regarding pending storms. When a candidate storm approaches, the Storm Monitoring Coordinator will communicate frequently with ERF to determine whether to mobilize sampling teams to begin sampling operations.
Other forecasting resources used include online resources such as National Weather Service predictions, Doppler radar, and smartphone weather applications. Refer to SOP D-1, provided in Appendix B of the WPCF-SAP, for more weather tracking information.

24
4.7 PARAMETERS & ANALYTICAL METHODS
Samples from both the probabilistic UIC and fixed land use stormwater monitoring locations will be analyzed for the list of parameters specified in Table 4.3.
Table 4.3 Stormwater Sample Laboratory Analytes, Containers, Volumes, Methods Preservation, and Holding Times
Analyte (1) Container
Type Sample Volume Method
Preservation Requirements
Holding Time
Total Metals Cu, Pb, Zn
HDPE 500 mL 200.8 HNO3 to pH<2; cool to 4°C +/- 2°C
6 months
Dissolved Metals Cu, Pb, Zn
HDPE 500 mL 200.8 HNO3 to pH<2; cool to 4°C +/- 2°C
6 months
Ammonia-Nitrogen Plastic 1 pint 350.1 H2SO4 to pH<2; cool to 4°C +/- 2°C 28 days
Nitrate-Nitrogen Plastic ½ pint 300.0 Cool to 4°C +/- 2°C 48 hours
Total Phosphorus Plastic 1 pint 365.4 H2SO4 to pH<2; cool to 4°C +/- 2°C
28 days
Ortho-Phosphorus Plastic ½ pint 365.1 Cool to 4°C +/- 2°C 48 hours
E. coli 2 Sterile Plastic 250 mL Colilert QT Cool to 4°C +/- 2°C 8 hours
Hardness Plastic ½ pint SM2340B HNO3 to pH<2; cool to 4°C +/- 2°C 6 months
Total Organic Carbon Amber Glass 250 mL SM5310B H2SO4 to pH<2; cool to 4°C +/- 2°C 28 days
Total Suspended Solids Plastic 1 quart SM2540D Cool to 4°C +/- 2°C 7 days (extraction) 40 days (analysis)
1 Samples will also be analyzed in the field for dissolved oxygen, specific conductivity, pH, and temperature. See Section 7.0. 2 E. coli will only be analyzed in samples collected from the four fixed land use monitoring sites for stormwater monitoring described herein
4.8 CONNECTION TO LONG-TERM MONITORING STRATEGY
The City’s stormwater monitoring approach has evolved over the years from the stormwater monitoring that began in 1991. While the early focus was on characterizing stormwater from various land uses, the focus of the probabilistic monitoring approach is on evaluating other factors that drive stormwater pollutant concentrations. With that, the probabilistic monitoring approach differs from previous land use monitoring as it includes reduced catchment sizes by about two orders of magnitude, and the number of locations and frequency of sampling was increased in order to increase the number of samples collected per year by a factor of almost five. Analysis of this collected data will help to determine how stormwater monitoring will be adaptively managed in future permit terms. In addition, monitoring four of the historic fixed land use monitoring sites should help to indicate whether detectable trends can be observed. Results will be reviewed to identify whether or not improvements have occurred and for which parameters. This will help the City adaptively manage stormwater programs in future permit terms.

25
SECTION 5
MACROINVERTEBRATE MONITORING This section provides a summary of the macroinvertebrate monitoring portion of the program. The summary describes project task/organization; background; monitoring objectives; study design and monitoring process; special data quality objectives and criteria; quality control; and connection to the long-term monitoring strategy.
5.1 PROJECT TASK/ORGANIZATION
Macroinvertebrate monitoring refers to the annual instream monitoring of benthic macroinvertebrates in late summer. During the 2011 permit term, samples were collected from the same rotating sampling locations where dry and wet-season instream monitoring occurred (i.e., at the probabilistic instream monitoring locations). Macroinvertebrate monitoring will continue to be conducted at the majority of those sites under this Plan. City WPCL staff will collect the samples, which will be analyzed by a contract taxonomist.
5.2 BACKGROUND
Macroinvertebrate information is useful for evaluating water quality and habitat condition because macroinvertebrates are present in diverse habitat types, represent local conditions due to their limited dispersal ability, they are an important food source for fish and other wildlife and they are sensitive to changes in physical habitat and water chemistry.
Macroinvertebrate communities are evaluated through observed/expected (OE) ratio of taxa loss and through indicators of biotic integrity (IBIs). OE ratio of taxa loss is developed using models based on data from reference and/or “least disturbed” sites. Metrics used to develop macroinvertebrate IBIs generally include (EPA, 2004):
• Taxonomic richness, composition, and diversity—i.e., the number of distinct taxa and relative abundance of organisms
• Feeding groups: Diversity in feeding groups—i.e., those that depend on cold water environment vs. those that are algal-feeding, warm-water species
• Habits—e.g., burrowing vs. clinging macroinvertebrates as indicators of sediment transport within a stream
• Pollution tolerance: Presence or absence of sensitive taxa reflects changes in physical habitat and water chemistry.

26
5.3 MONITORING OBJECTIVES
Macroinvertebrate monitoring will contribute to monitoring objectives ii, iv, v, and vi identified in Schedule B.1 of the City’s MS4 Permit (see Table 1.1). Macroinvertebrate monitoring is intended to track the status and trends of biological communities within water bodies that receive MS4 discharges. Macroinvertebrate monitoring will be timed to coincide with the first instream monitoring of the fiscal year so biological information is collected at the same time summer water quality samples are collected.
5.4 STUDY DESIGN AND MONITORING PROCESS
Special monitoring and sample collection and preservation procedures will be followed, as described below. These procedures follow National Rivers and Stream Assessment: Field Operations Manuals.
https://www.nemi.gov/methods/method_summary/12564/
https://www.nemi.gov/methods/method_summary/12563/
5.4.1 Monitoring Locations
Macroinvertebrate samples will be collected at a minimum of 14 sites per year where instream water quality samples are collected as part of the instream monitoring protocols described in Section 2.2 1.
Table 5.1 on the following page lists the macroinvertebrate sampling locations.
1 Historically, the City has collected macroinvertebrate samples at all 20 perennial instream monitoring sites across the local watersheds. However, the City is currently evaluating alternatives to macroinvertebrate monitoring specifically in the Columbia Slough. Most metrics used to evaluate the health of aquatic insect communities are developed for pool-riffle stream systems and are not as effective in addressing low gradient systems like the Columbia Slough. As a result, macroinvertebrate monitoring in the Slough is being discontinued and a more viable biological index may be substituted.

27
Table 5.1 Macroinvertebrate Instream Monitoring Locations & Panels
Site ID Site Location Watershed Site ID Site Location Watershed
Panel
1
0012 Stephens Creek Tributary - SW Brier & Custer Willamette River
Panel
3
0170 Sylvan Creek - 3223 SW Scholls Ferry Rd Tualatin River
0016 Kelley Creek - 17601 SE Foster Rd Johnson Creek 0316 Veterans Creek - 11801 SE Mt Scott Blvd Johnson Creek
0017 Peninsula Drainage Canal - 9111 SE Sunderland Ave Columbia Slough* 0337 Lower Slough - 437 N Columbia Blvd Columbia Slough*
0058 Woods Creek - 8721 SW 47th Ave Fanno Creek 0800 Willamette River Tributary - 01609 SW Radcliffe Ct Willamette River
0060 Veterans Creek - S of 10200 SE Mt Scott Blvd Johnson Creek 1002 Fanno Creek - 4911 SW Beaverton-Hillsdale Hwy Fanno Creek
0080 Upper Slough - N of 18008 NE Airport Way Columbia Slough* 1104 Upper Slough - NE 185th Drive Columbia Slough*
0122 Golf Creek - SW Barnes Rd near W Burnside Tualatin River 1130 Cedar Mill Creek - 2118 NW Mill Pond Rd Tualatin River
0124 Johnson Creek - 6538 Barbara Welch Drive Johnson Creek 1184 Johnson Creek - 8400 SE 26th Pl Johnson Creek
0129 Upper Slough - 14912 NE Airport Way Columbia Slough* 1212 Johnson Creek - 1243 SE Brookside Dr Johnson Creek
0144 Nettle Creek - 1260 Hideaway Lane, Lake Oswego Tryon Creek 1292 Crystal Springs - 7910 SE 21st Ave Johnson Creek
0188 Johnson Creek - SE 110th Ave Bridge Johnson Creek 1312 Willamette River Tributary - 01350 SW Radcliffe Rd Willamette River
0208 Tryon Creek - Tryon Creek State Park Tryon Creek 1360 Wilkes Creek - 15416 NE Fremont St Columbia Slough*
0250 Balch Creek - Lower Macleay Park Willamette River 1376 Johnson Creek - 6709 SE May St Johnson Creek
0272 Johnson Creek - 4950 SE 174th Ave Johnson Creek 1404 Johnson Creek - 12253 Brookside Dr Johnson Creek
0273 Whitaker Slough - 6455 NE Columbia Blvd Columbia Slough* 1473 Buffalo Slough - 7302 NE 42nd Ave Columbia Slough*
0298 Cedar Mill Creek - NW Mill Pond Rd at Cedar Creek Tualatin River 1593 Miller Creek - Forest Park Willamette River
0314 Fanno Creek - 3455 SW Beaverton-Hillsdale Hwy Fanno Creek 1781 Columbia Slough - 15840 N Simmons Rd Columbia Slough*
0329 Lower Slough - 3841 N Columbia Blvd Columbia Slough* 1872 Nettle Creek - Tryon Creek State Park Tryon Creek
0352 Johnson Creek - 5840 SE Morris St Johnson Creek 1916 Veterans Creek - 9808 SE Mt Scott Blvd Johnson Creek
0524 Stephens Creek - 7720 SW Macadam Willamette River 2000 Tryon Creek - Tryon Creek State Park Tryon Creek
Site ID Site Location Watershed
Site ID Site Location Watershed
Panel
2
0234 Fanno Creek Tributary - 4241 SW Tunnelwood St Fanno Creek
Panel 4
1194 Columbia Creek - 3608 SW 60th Pl Fanno Creek
0444 Johnson Creek - 3083 SW 14th Dr Johnson Creek 1612 Johnson Creek - 4305 SE Harney St Johnson Creek
0498 Ash Creek Tributary - 10536 SW 53rd Ave Fanno Creek 1642 Columbia Creek - 4119 SW 58th Ave Fanno Creek
0513 Middle Slough - 12002 NE Inverness Dr Columbia Slough* 1744 Willamette River Tributary - 8421 SW Macadam Ave Willamette River
0526 Balch Creek - 6131 NW Thompson Rd Willamette River 1769 Miller Creek - 12928 NW Newberry Rd Willamette River
0529 Middle Slough - 6900 NE Cornfoot Rd Columbia Slough* 1778 Woods Creek - 9715 SW 43rd Ave Fanno Creek
0544 Johnson Creek - 9201 SE McLoughlin Blvd Johnson Creek 1793 Columbia Slough - 10652 NE Holman St Columbia Slough*
0554 Cedar Mill Creek Tributary - 9742 NW Miller Hill Rd Tualatin River 1809 Columbia Slough Tributary - 2210 NE Riverside Way Columbia Slough*
0592 Tryon Creek Tributary - Tryon Creek State Park Willamette River 1834 Cedar Mill Creek Tributary - 2317 NW Birkendene St Tualatin River
0633 Willamette River Trib - Forest Park, 2nd Order Stream Willamette River 1857 Columbia Slough - 16811 NE Mason Ct Columbia Slough*
0705 Middle Slough - 4501 NE Crystal Ln Columbia Slough* 1865 Columbia Slough - 9645 N Columbia Blvd Columbia Slough*
0720 Willamette River Tributary - 8421 SW Macadam Ave Willamette River 1936 Tryon Creek Tributary - 10719 SW Boones Ferry Rd Tryon Creek
0746 Ivey Creek - 4722 SW 42nd Ave Fanno Creek 2113 Columbia Slough - 6031 NE 92nd Ave Columbia Slough*
0754 Falling Creek - 9505 SW Jonathan Ct Willamette River 2154 Cedar Mill Creek Tributary - 2708 NW Mill Pond Rd Tualatin River
0762 Balch Creek - 4300 NW Cornell Rd Willamette River 2185 Saltzman Creek Trib - Forest Park, 2nd order stream Willamette River
0769 Middle Slough - 11632 NE Ainsworth Circle Columbia Slough* 2208 Johnson Creek - 4938 SE Johnson Creek Blvd Johnson Creek
0828 Johnson Creek Tributary - 7017 SE Deardorf Rd Johnson Creek 2290 South Ash Creek - 6433 SW Dickinson St Fanno Creek
0892 Johnson Creek - 6400 SE 101st Ave Johnson Creek 2318 Balch Creek - 5410 NW Cornell Rd Willamette River
0961 Middle Slough - 2424 NE Riverside Way Columbia Slough* 2320 Johnson Creek - 5509 SE Circle Rd Johnson Creek
1020 Kelley Creek - 6363 SE 159th Dr Johnson Creek 2377 Lower Slough – 10425 N Bloss Ave Columbia Slough*
* Beginning FY 16-17 macroinvertebrate sampling is being discontinued at the Columbia Slough instream monitoring sites only, due to the lack of appropriate metrics as footnoted in Section 5.4.1. Alternate biological parameters are being considered for the Columbia Slough.
28
5.4.2 Monitoring Frequency and Duration
Macroinvertebrate samples will be collected once per year, concurrent with the summer dry weather (July 1 through September 30) instream water quality sampling conducted at the rotating perennial instream sampling sites under the instream monitoring protocol described previously. Table 5.2 below lists the annual panel rotation:
Table 5.2 Macroinvertebrate Frequency & Panel Rotation
Year Panel Rotation
FY 14-15 Panel 1
FY 15-16 Panel 2
FY 16-17 Panel 3
FY 17-18 Panel 4
FY 18-19 Panel 1
FY 19-20 Panel 2
FY 20-21 Panel 3
FY 21-22 Panel 4
5.4.3 Sample Collection Methodology
Benthic macroinvertebrate samples will be collected using the following protocols (adapted from the U.S. Environmental Protection Agency National Rivers and Streams Assessment, Field Operations Manual, 2009). A sample is collected from one meter downstream of each of 11 cross-section transects at the assigned sampling locations (Figure 5.1) using a D-frame kicknet. The sample location at Transect A is determined at random, and each following transect is assigned a station based off the pattern right (R), center (C), left (L). At transects where a center sampling point is assigned and the stream width is between one and two net widths wide, the left or right sampling point is picked randomly instead. If the stream width is only one net width wide at a transect, the net is placed across the entire stream width and the sampling point is designated as center. If a sampling point is located in water that is too deep or too swift to safely sample, an alternate sampling point on the transect will be selected at random. The kick area at each transect is approximately one square foot for a total area of approximately 11 square feet for each composite sample.
29
Figure 5.1 Wadeable Site Reach Features with Macroinvertebrate L, C, and R Sampling Points (from USEPA 2009, p. 45, Figure 4-6)
5.5 SPECIAL DATA QUALITY OBJECTIVES AND CRITERIA
This section includes information on measurement quality objectives and sample handling and custody.
5.5.1 Measurement Quality Objectives
A subsample of 500 organisms will be sorted and identified as described in Section 5.6. Taxonomic identification of organisms will reach the species level whenever possible or cost-feasible. However, the taxonomic resolution will, at a minimum, be to Standard Taxonomic Effort Level 2 per the following:
http://www.pnamp.org/project/4210
5.5.2 Sample Handling and Custody
To adequately track each macroinvertebrate sample, the following parameters are needed: station, site name, site ID (depending on project), collection date, habitat sampled, whether or not the sample was a field duplicate, the number of jars used for the entire macroinvertebrate sample, the collector’s initials, and/or the field taxonomist’s initials. Labels with all of the information listed above will be placed inside the container and also attached (taped) to the outside. Macroinvertebrate samples will be placed in plastic sealable bins or a cooler and shipped to the contractor for identification.

30
5.6 QUALITY CONTROL
Quality control measures for instream and stormwater sampling are described in Section 9 of this QAMP. Because of the special nature of macroinvertebrate sampling and analyses, additional quality control measures are required, as described below.
5.6.1 Field Quality Control
As shown in Table 5.3, quality control measures for field measurements are evaluated primarily through best professional judgment and by ensuring that the work is performed by experienced and/or well-trained field teams.
Table 5.3 Biological Communities Field Quality Control Item Frequency Acceptance criteria Corrective actions
Inspect kick net Prior to each use No holes or tears, no foreign matter on nets
Repair, clean, or replace as necessary
Time collection with stopwatch
20 seconds kicking, 60 seconds picking
Required time +/- 3 seconds to ensure consistency of collection at each site
Add time or repeat sample
Check net Each collection site No clinging organisms Remove any clinging organisms and add to sample
Use widely/commonly accepted taxonomic references
For all identifications
All keys and references used must be based on a bibliography prepared by another laboratory
If other references desired, obtain permission to use from project lead

31
5.6.2 Laboratory Quality Control
Table 5.4 summarizes biological laboratory quality control measures. The laboratory will archive sample residuals, vials, and slides until the project leader has authorized the disposition of the samples in writing.
Table 5.4 Macroinvertebrate Laboratory Quality Control Check description Frequency Acceptance criteria Corrective actions
Sample residuals examined by different analyst within lab
10% of all samples completed per analyst
Efficiency of sorting >= 95%
If < 95%, examine all residuals of samples by that analyst and retrain analyst
Duplicate identification by different taxonomist within lab
5 to 25% of all samples completed per laboratory (see SOP)
Efficiency >= 95% Increasing check frequency if acceptance criteria are not met (see SOP)
Independent identification by outside taxonomist
All uncertain taxa Assigned certainty rating of 1 to 5, reviewed by outside expert if necessary
Reviewed by QC taxonomist, sent to outside expert if “unknown”
Prepare reference collection
Each new taxon per laboratory
Complete reference collection to be maintained by each individual laboratory
Benthic lab manager periodically reviews data and reference collection to ensure reference collection is complete and identifications are accurate
5.7 CONNECTION TO LONG-TERM MONITORING STRATEGY
Since 2010, macroinvertebrate monitoring has been an integral element of the BES’s comprehensive instream monitoring program. BES expects to use macroinvertebrates to assess the long-term improvement of the City’s watersheds and evaluate the correlation among macroinvertebrates and water quality, hydrology, and physical habitat.
32
SECTION 6
SAMPLING STAFF Sampling staff refers to all personnel who are involved in logistical support, sample collection, traffic control, and safety during the storm event. At a minimum, the sampling staff will include a Storm Monitoring Coordinator (one person; can be remote) and field sampling teams, as described below.
6.1 STORM MONITORING COORDINATOR
The Storm Monitoring Coordinator is responsible for tracking weather patterns and selecting the storms to be monitored. The Storm Monitoring Coordinator will work directly with ERF, to obtain the latest weather forecasts and updates and make the “go/no go” decision. The Storm Monitoring Coordinator should attempt to notify the sampling teams and the analytical laboratory 72 hours in advance of a potential qualifying storm. The Storm Monitoring Coordinator directs sampling activities by tracking real-time weather conditions and using dependable two-way communication with ERF and sampling teams (via cell phone). The Storm Monitoring Coordinator for this project will be the Field Operations (FO) Supervisor, or a designee.
Instream monitoring events, as opposed to stormwater monitoring events, are typically scheduled in advance, but the Storm Monitoring Coordinator makes the final decision on whether sampling occurs on any given day at which locations.
6.2 FIELD SAMPLING TEAMS
Multiple teams are sometimes used during a single stormwater sampling effort to decrease the length of field time and the number of individual storms needed to collect samples from all stormwater monitoring locations. Sampling teams are comprised of two people, primarily from the City’s FO staff. Generally, multiple sampling teams will be used as the season progresses, particularly if samples have been difficult to collect. Instream monitoring will also be conducted by multiple teams to increase the probability of collecting all samples under very similar weather conditions.
Field staff members are required to read, understand, and follow all procedures documented in this Plan and the WPCF-SAP and WPCF-QAPP. At a minimum, field sampling personnel will be responsible for the following:
• Inspecting field sampling equipment before use to ensure that it is in proper working order and calibrated
• Ensuring that all field sampling collection forms (e.g., chain of custody forms, field data sheets, daily field report) are properly and completely filled out
• Ensuring that samples are collected, stored, and delivered to the laboratory in accordance with documented procedures
Field staff members also are responsible for performing all the field sampling activities in accordance with the procedures and standards established in the project Health and Safety Plan (see Appendix C of the WPCF-SAP and WPCF-QAPP).

33
SECTION 7
FIELD SAMPLING PROCEDURES As described in Sections 1 and 4, stormwater sampling is also conducted for compliance with the City’s WPCF permit. To minimize duplication of documentation, the field sampling procedures for stormwater sampling are not repeated here but can be found in Section 7 of the WPCF-SAP. Section 7 of that document includes a description of the following: personal safety, sample collection location, analytical schedule, sampling equipment preparation, sampling equipment decontamination, sample container preparation, clean sampling techniques, sampling location access procedures, sample collection and handling, field quality control sample collection, sample labeling, sample collection documentation, sample transport and delivery to the laboratory, and change notification.
To supplement Section 7 of the WPCF-SAP, this NPDES MS4 Permit Monitoring Plan includes instream surface water sampling procedures. Some of the analytical parameters required for the NPDES MS4 permit vary from what is required by the WPCF permit. Therefore, sampling equipment described in the WPCF-SAP should be supplemented by this Plan to also include analytical field meters for the analysis of:
• pH
• specific conductance
• dissolved oxygen
• temperature
These field meters will be calibrated at the WPCL prior to initiating stormwater and instream sampling activities using standard field meter calibration procedures. Meters are also checked for drift at WPCL at the end of the field day prior to relinquishing samples. For field parameters that fail drift checks, data is either flagged or rejected as appropriate.
Field parameters will be measured at each sample location immediately after filling the last sample container. Field measurements will be taken from collected stormwater or surface water samples by inserting the analytical field meter probes into the stainless steel beaker or by directly inserting the analytical field meter probes into the flow of surface water.
For instream monitoring activities, sampling teams will use the following procedures to access each sampling location:
• Set up a staging area close to, but at a safe distance from, the surface water body.
• Observe and document conditions near the sampling location that may affect surface water quality, such as:
• Physical characteristics (e.g., bank condition, vegetation, shading); • Human activities (e.g., homeless camps, trash); and • Potential pollutant sources (e.g., pipe discharge, especially during dry conditions).
• Determine if the flow rate in the stream allows for safe access to the stream.
In addition to the personal safety procedures provided in Section 7 of the WPCF-SAP, personal flotation devices should be worn when collecting surface water samples.

34
SECTION 8
QUALITY CONTROL & QUALITY ASSURANCE The U.S. Environmental Protection Agency (http://www.epa.gov/quality/glossary.htm#Q) defines “quality assurance” (QA) and “quality control” (QC) as follows:
• QA is the integrated system of management activities involving planning, implementation, documentation, assessment, reporting, and quality improvement to ensure that a process, item, or service is of the type and quality needed and expected.
• QC is the overall system of technical activities that measures the attributes and performance of a process, item, or service against defined standards to verify that they meet the established requirements.
The QA/QC procedures that will be followed as part of this management plan are documented in detail in the WPCF-QAPP. The WPCF-QAPP includes the following:
• Project management/data quality objectives
• Sampling handling and custody
• Analytical procedures
• Quality control procedures
• Data management, validation, and reporting
• Data assessment and evaluation
• Inspection and audits
• Deviations, nonconformance, and occurrences
• Monitoring program corrections
Appendices A, B, and C of the WPCF-QAPP provide supporting information, including field sampling and laboratory forms, laboratory method reporting limits, and data qualifiers.
In addition, related to QA/QC, the City has documented standard operating procedures for field measurements of multiple water quality parameters, decontamination of sampling equipment, chain of custody, grab sample collection with bottles, grab sample collection with stainless steel beakers, field filtering of water samples, quality control sample collection, and laboratory analysis.

35
SECTION 9
REFERENCES City of Portland, Bureau of Environmental Services. 2005. WPCL Quality Manual. Revision 6.
City of Portland, Bureau of Environmental Services. 2006. WPCF Permit Sampling and Analysis Plan. (http://www.portlandonline.com/bes/index.cfm?c=50442&a=282500)
Oregon Association of Clean Water Agencies. 1997. Analysis of Oregon Urban Runoff Water Quality Monitoring Data Collected from 1990 to 1996. Prepared by Woodward-Clyde Consultants.
Oregon Department of Environmental Quality, June 24, 1997. Letter to Janet Gillaspie at the Oregon Association of Clean Water Agencies regarding: MS4 Permit Modification. Prepared by Neil Mullane.
Oregon Department of Environmental Quality. 2008. PREDATOR: Development and use of RIVPACS-type macroinvertebrate models to assess the biotic condition of wadeable Oregon streams (November 2005 models). Prepared by Shannon Hubler.
Oregon Department of Environmental Quality. 2009a. High Level Indicators or Oregon’s Forested Streams. Prepared by Shannon Hubler. (http://www.deq.state.or.us/lab/techrpts/docs/10-lab-003.pdf)
Rantz, S.E. and others. 1982. Measurement and computation of streamflow, Volume 1: Measurement of stage and discharge. Volume 2: Computation of discharge. U.S. Geological Survey Water Supply Paper 2175.
Stevens Jr, D. & Olsen, A. 2004. Spatially balanced sampling of natural resources. Journal of the American Statistical Association, ASA 99, 262-278.
Sullivan, L. 2005. Preliminary Study Comparing Precipitation Quality Between Nominal Land Uses in Portland, Oregon. Masters of Environmental Management. Environmental Sciences and Resources, Portland State University
U.S. EPA. 2004. Wadeable Streams Assessment: Field Operations Manual. EPA 841-B-04-004. U.S. Environmental Protection Agency, Office of Water and Office of Research and Development, Washington, D.C
U.S. EPA. 2009. National Rivers and Streams Assessment, Field Operations Manual. EPA 841-B-07-009.
Wagner, R.J., Boulger, R.W., Jr., Oblinger, C.J., and Smith, B.A. 2006. Guidelines and standard procedures for continuous water-quality monitors: Station operation, record computation, and data reporting. U.S. Geological Survey Techniques and Methods 1-D3.