monitoring intra-urban inequalities with gis-based indicators · international institute for...
TRANSCRIPT

Monitoring intra-urban inequalities with GIS-based indicators
With a case study in Rosario, Argentina

This doctoral dissertation was produced with the financial support of the International Institute for Geo‐Information Science and Earth Observation (ITC), the Urban and Regional research centre Utrecht (URU) and the Ryoichi Sasakawa Young Leaders Fellowship Fund (SYLFF). The research reported in this book was conducted at the Urban and Regional research centre Utrecht (URU), Faculty of Geosciences, Utrecht University, which is part of the Netherlands Graduate School of Housing and Urban Research (NETHUR). ITC Dissertation Series No. 127 © Martínez‐Martín, Javier Alberto ISBN 90‐6164‐235‐3 All rights reserved. No part of this publication, apart from bibliographic data or brief quotations from critical reviews, may be reproduced in any form, by print, photocopy, microfilm or any other means, without written permission. Monitoring intra‐urban inequalities with GIS‐based indicators. With a case study in Rosario, Argentina. Thesis Utrecht University and ITC, with summaries in Dutch and Spanish. Subject Headings: Urban Planning / Inequalities / Geographical Information Systems / Indicators / Rosario, Argentina.

Monitoring intra-urban inequalities
with GIS-based indicators With a case study in Rosario, Argentina
Monitoren van ongelijkheid binnen steden met op GIS gebaseerde indicatoren
Met een gevalstudie in Rosario, Argentinië
(met een samenvatting in het Nederlands) (con un resumen en castellano)
PROEFSCHRIFT
Ter verkrijging van de graad van doctor aan de Universiteit Utrecht op gezag van de Rector Magnificus, Prof. Dr. W.H. Gispen
ingevolge het besluit van het College voor Promoties in het openbaar te verdedigen
op maandag 19 september 2005 des middags te 12:45 uur.
door
Javier Alberto Martínez ‐ Martín
geboren op 16 juli 1969 te Rosario, Argentinië

Promotoren Prof. Dr. H.F.L. Ottens Faculty of Geosciences, Utrecht University Prof. Dr. F. I. Masser

i
Contents List of Tables ............................................................................................................................... v List of Figures............................................................................................................................. vi List of main acronyms..............................................................................................................vii Foreword ..................................................................................................................................... ix Chapter 1 Introduction ............................................................................................................1
1.1 The urban inequality problem ....................................................................................2 1.2 Inequality and urban policy ........................................................................................3 1.3 GIS‐based indicators to support urban policy ..........................................................5 1.4 Research objective.........................................................................................................5 1.5 Outline of this study.....................................................................................................7
Chapter 2 What is inequality and why does it matter? ......................................................9 2.1 What is inequality? .......................................................................................................9
2.1.1 Inequality – justice (equality as social justice) ................................................9 2.1.2 Inequality – rights and needs (equality as a right).......................................11 2.1.3 Inequality – difference .....................................................................................12 2.1.4 Inequality – segregation ..................................................................................12 2.1.5 Inequality – poverty – inequity ......................................................................12 2.1.6 Inequality – sustainability ...............................................................................14 2.1.7 Inequality – deprivation ..................................................................................15 2.1.8 Inequality – social exclusion ...........................................................................15 2.1.9 Dual cities and social polarisation..................................................................16
2.2 Area‐based policies to address inequality ...............................................................17 2.3 The spatial dimension of inequality .........................................................................19 2.4 The need to monitor (intra‐urban) inequality .........................................................20 2.5 Objective, questions and conceptual model ............................................................21
2.5.1 Case study selection.........................................................................................23 2.5.2 Conceptual model ............................................................................................23
Chapter 3 Measuring inequality ...........................................................................................25 3.1 The role of urban indicators ......................................................................................26 3.2 Socio‐territorial indicators: studies of patterns of inequality................................28 3.3 Accessibility indicators ..............................................................................................31 3.4 Scientifically and policy‐adequate/valid indicators ...............................................34 3.5 The role of GIS in the construction of indicators ....................................................38 3.6 Research design: empirical model ............................................................................40 3.7 Conclusions .................................................................................................................43
Chapter 4 Urban inequalities in Rosario, Argentina, and Liverpool, England ...........45 4.1 Inequality in Latin America and Argentina ............................................................45 4.2 Study area Rosario (Argentina).................................................................................48 4.3 Local planning context in Rosario ............................................................................52

ii
4.3.1 Strategic Planning ............................................................................................53 4.3.2 Secretariat of Planning ‒ Urban Plan (Nuevo Plan Director) ........................54 4.3.3 Decentralisation Programme ..........................................................................56 4.3.4 Public Housing Service (SPV) Rosario Hábitat ............................................58 4.3.5 Social Welfare Department .............................................................................62
4.4 Inequality in Western European cities .....................................................................64 4.5 UK planning context...................................................................................................66 4.6 (Contrast) study area: Liverpool (UK) .....................................................................69 4.7 Liverpool First: a community strategy.....................................................................74 4.8 Liverpool Neighbourhood Renewal Strategy (LNRS) ...........................................75 4.9 The South Liverpool Partnership Cluster Strategy ................................................79 4.10 Liverpool Vision ....................................................................................................82 4.11 Conclusions ............................................................................................................83
Chapter 5 Inequality perception and indicators usage ....................................................87 5.1 Characteristics and purpose of the interviews........................................................87 5.2 Prioritised inequality aspects in Rosario (Argentina) ............................................88 5.3 Aspects suggested by the interviewees (Rosario, Argentina) ...............................90 5.4 Local capacity to influence and act on inequalities (Rosario, Argentina)............91 5.5 Inequality in the local policy context (Rosario, Argentina)...................................93
5.5.1 “Inequality grew between 1991 and 2001” ...................................................93 5.5.2 Interrelation between inequality aspects.......................................................95 5.5.3 Values and basic needs in the perception of inequalities............................96 5.5.4 Policies and institutional implications...........................................................97 5.5.5 Local accountability and capacity to act on inequalities .............................99
5.6 Use of indicators by policy makers in Rosario, Argentina ..................................100 5.6.1 Institutional aspects of use of indicators .....................................................101 5.6.2 Minimum scale of policy application ..........................................................103 5.6.3 Present usage of indicators ...........................................................................103 5.6.4 Indicators usage and research demand.......................................................104
5.7 Summary Rosario, Argentina..................................................................................104 5.8 Prioritised inequality aspects in Liverpool (UK) ..................................................105
5.8.1 Income level ....................................................................................................108 5.8.2 Education – employment ..............................................................................108 5.8.3 Interrelation of aspects of inequalities.........................................................109
5.9 Policy responses to inequalities/deprivation.........................................................111 5.10 Indicators usage...................................................................................................114
5.10.1 Targets / setting targets: Public Service Agreements (PSAT) ...................115 5.11 Reaction to “too much information”.................................................................116 5.12 Use of GIS to construct indicators .....................................................................118 5.13 Contrasting indicators usage: Rosario – Liverpool .........................................120
5.13.1 Inequality aspects...........................................................................................120 5.13.2 Indicators.........................................................................................................121

iii
Chapter 6 Methodology.......................................................................................................125 6.1 What set of GIS‐based indicators is valid/relevant for describing
intra‐urban inequalities? ..........................................................................................125 6.1.1 Policy‐relevant indicators..............................................................................125 6.1.2 Policy‐applicable indicators..........................................................................126 6.1.3 Indicator matrix ..............................................................................................127
6.2 Calculating GIS‐based indicators............................................................................129 6.2.1 Areal units – census data...............................................................................129 6.2.2 Administrative data .......................................................................................131 6.2.3 Derived and expressed need indicators ......................................................132 6.2.4 Accessibility indicators..................................................................................135 6.2.5 Factor analysis: socio‐economic spatial differentiation.............................136 6.2.6 Cluster analysis: identifying homogeneous areas......................................138 6.2.7 Index of inequalities: measuring concentration of inequality aspects.....139
6.3 Interpretation and use of indicators .......................................................................141 6.3.1 Data aggregation level, city, district and neighbourhood areas ..............141 6.3.2 Gap analysis ....................................................................................................142 6.3.3 Dynamic indicators: monitoring spatial inequality ...................................142
6.4 Conclusions ...............................................................................................................143 Chapter 7 Describing, analysing, and compensating for intra‐urban inequalities....145
7.1 Describing and analysing intra‐urban inequalities with GIS‐based indicators 145 7.1.1 Inequality conditions / quality of life...........................................................147 7.1.2 Distribution of opportunities / accessibility................................................152 7.1.3 Expressed need vs. derived need .................................................................158
7.2 Covariation and concentration of inequality aspects...........................................161 7.3 Gap analysis ..............................................................................................................163 7.4 Dynamic indicators: monitoring inequality variation 1991‐2001 .......................166 7.5 Prescriptive use of GIS‐based indicators ...............................................................174
7.5.1 Area‐based budgeting ...................................................................................176 7.5.2 Prioritised neighbourhood areas proportional to need.............................180
7.6 Socio‐economic spatial differentiation and spatial distribution of inequalities in Rosario ..............................................................................................185
7.7 Conclusions ...............................................................................................................191 Chapter 8 Conclusions and recommendations................................................................193
8.1 Conclusions ...............................................................................................................193 8.1.1 GIS‐based indicators: monitoring intra‐urban inequalities ......................193 8.1.2 Intra‐urban inequality aspects: understanding spatial inequality...........196 8.1.3 Relevance of GIS‐based indicators in the local planning context ............198
8.2 Recommendations for policy makers and further research ................................199 8.2.1 Embedding GIS‐based indicators in policy making ..................................199 8.2.2 Implications in theory, and policy‐practice: expressed and derived
need approach ................................................................................................200 8.3 Final remarks.............................................................................................................202

iv
Bibliography.............................................................................................................................205 Samenvatting in het Nederlands ..........................................................................................215 Resumen en castellano............................................................................................................220 Annex 1: List of reports on urban indicators ....................................................................225 Annex 2: Policy areas and domains under several indicators initiatives.....................226 Annex 3: Operational definitions of indicators................................................................229 Annex 4: List of interviewees ..............................................................................................234 Annex 5: Variables census 1991 – 2001...............................................................................235 Annex 6: Aggregation block group 1991‐2001...................................................................237 Annex 7: Correlation between indicators ..........................................................................239 Annex 8: Complete list of neighbourhood areas..............................................................240 Annex 9: Boxplots overcrowding ........................................................................................242 Curriculum Vitae .....................................................................................................................244 ITC dissertation list.................................................................................................................245
v
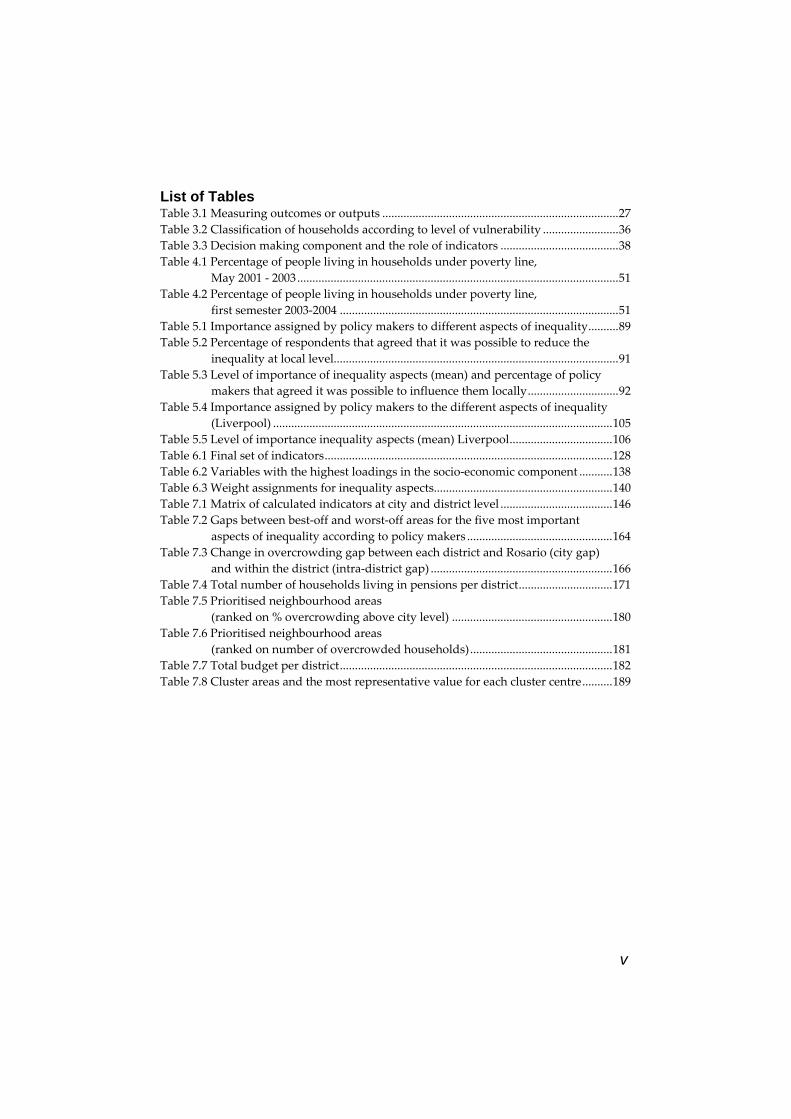
List of Tables Table 3.1 Measuring outcomes or outputs ..............................................................................27 Table 3.2 Classification of households according to level of vulnerability .........................36 Table 3.3 Decision making component and the role of indicators .......................................38 Table 4.1 Percentage of people living in households under poverty line,
May 2001 ‐ 2003..........................................................................................................51 Table 4.2 Percentage of people living in households under poverty line,
first semester 2003‐2004 ............................................................................................51 Table 5.1 Importance assigned by policy makers to different aspects of inequality..........89 Table 5.2 Percentage of respondents that agreed that it was possible to reduce the
inequality at local level..............................................................................................91 Table 5.3 Level of importance of inequality aspects (mean) and percentage of policy
makers that agreed it was possible to influence them locally..............................92 Table 5.4 Importance assigned by policy makers to the different aspects of inequality
(Liverpool) ................................................................................................................105 Table 5.5 Level of importance inequality aspects (mean) Liverpool..................................106 Table 6.1 Final set of indicators...............................................................................................128 Table 6.2 Variables with the highest loadings in the socio‐economic component ...........138 Table 6.3 Weight assignments for inequality aspects...........................................................140 Table 7.1 Matrix of calculated indicators at city and district level .....................................146 Table 7.2 Gaps between best‐off and worst‐off areas for the five most important
aspects of inequality according to policy makers ................................................164 Table 7.3 Change in overcrowding gap between each district and Rosario (city gap)
and within the district (intra‐district gap) ............................................................166 Table 7.4 Total number of households living in pensions per district...............................171 Table 7.5 Prioritised neighbourhood areas
(ranked on % overcrowding above city level) .....................................................180 Table 7.6 Prioritised neighbourhood areas
(ranked on number of overcrowded households)...............................................181 Table 7.7 Total budget per district..........................................................................................182 Table 7.8 Cluster areas and the most representative value for each cluster centre..........189

vi
List of Figures Figure 2.1 Conceptual model ....................................................................................................24 Figure 3.1 Empirical model .......................................................................................................42 Figure 4.1 Location Rosario.......................................................................................................48 Figure 4.2 Metropolitan area of Rosario with districts ..........................................................49 Figure 4.3 Population growth in Rosario 1763 – 2001............................................................50 Figure 4.4 Urban expansion of Rosario with main roads and slums locations ..................53 Figure 4.5 Slum areas selected by Rosario Hábitat.................................................................60 Figure 4.6 Slum area Villa Itatí..................................................................................................60 Figure 4.7 Slum areas in Rosario: Barrio Las Flores ...............................................................61 Figure 4.8 Location Liverpool ...................................................................................................69 Figure 4.9 Liverpool population growth 1700‐2001 ...............................................................70 Figure 4.10 a: Regeneration of Liverpool’s riverside and dockland;
b: Regeneration in the city centre; c‐d: Vacant properties ................................71 Figure 4.11 Index of Multiple Deprivation 2000 ranking of Liverpool wards....................72 Figure 4.12 Income deprivation, percentage of the population living in low‐income
families. IMD 2000, IMD 2004. (1998 and 2001 benefits data) ..........................73 Figure 4.13 The New Commitment to Neighbourhood Renewal applied at national,
local and area levels...............................................................................................76 Figure 5.1 Row houses under demolition next to inhabited houses in a deprived ward
(Alt Valley ‐ North Liverpool)..............................................................................109 Figure 5.2 Regeneration in the city centre .............................................................................110 Figure 6.1 Steps in the selection of inequality indicators ....................................................126 Figure 6.2 A‐B: Census tracts (fracciones censales) ‐ Block groups (radios censales)......130 Figure 6.3 Flowchart to calculate and compare derived need and expressed need.........134 Figure 6.4 Flowchart accessibility indicators construction..................................................136 Figure 6.5 Extraction of socio‐economic factor ‐ income indicator proxy .........................137 Figure 6.6 Outcome regions for change in spatial inequalities...........................................142 Figure 7.1 Quality of life – physical environment: overcrowding......................................147 Figure 7.2 Quality of life – physical environment: inadequate housing............................148 Figure 7.3 A‐B: Quality of life – socio‐economic environment:
A: education level, B: health coverage ................................................................150 Figure 7.4 Quality of life – socio‐economic environment: unemployment .......................151 Figure 7.5 Distribution of opportunities, accessibility – physical infrastructure:
tap water in the dwelling......................................................................................152 Figure 7.6 Distribution of opportunities, accessibility – physical infrastructure:
sewage connections ...............................................................................................153 Figure 7.7 Distribution of opportunities, accessibility – ICT infrastructure:
households with internet ......................................................................................154 Figure 7.8 Distribution of opportunities, accessibility – social infrastructure:
primary health centres ..........................................................................................155 Figure 7.9 Distribution of opportunities, accessibility – social infrastructure:
day‐care centres (Centros Crecer)........................................................................155 Figure 7.10 Distribution of opportunities, accessibility – social infrastructure:
education (primary schools and kindergartens) ..............................................156

vii
Figure 7.11 Concentration of social infrastructure: schools. Social infrastructure per 10,000 inhabitants at neighbourhood area level (container approach) ..157
Figure 7.12 Catchments / service area of health centres ......................................................158 Figure 7.13 Expressed housing need in areas of different inadequate housing ...............159 Figure 7.14 Distribution of expressed housing needs (as a percentage of inadequate
houses) over derived housing needs (inadequate housing indicator) ..........160 Figure 7.15 Percentage of the population that completed secondary school level and
areas of worst‐off unemployment level ............................................................162 Figure 7.16 Overcrowding at city and district level, and gap worst‐off / best‐off
neighbourhood areas...........................................................................................165 Figure 7.17 Change in overcrowding 1991‐2001 in Rosario’s neighbourhood areas .......167 Figure 7.18 Change in overcrowding 1991‐2001...................................................................168 Figure 7.19 Population growth 1991‐2001 .............................................................................169 Figure 7.20 Change in housing inequalities 1991‐2001 ........................................................170 Figure 7.21 Change in 1991‐2001 indicators socio‐economic environment:
health coverage.....................................................................................................172 Figure 7.22 A‐B: Change in 1991‐2001 indicators socio‐economic environment:
A: education level, B: unemployment ...............................................................173 Figure 7.23 Schematic diagram of proposed area‐based budgeting ..................................178 Figure 7.24 Prioritised neighbourhood areas........................................................................181 Figure 7.25 Distribution of budget per district .....................................................................182 Figure 7.26 A‐C: Analysis of the block groups within the prioritised
neighbourhood area Oeste 6...............................................................................183 Figure 7.27 Distribution of inequality index 2001 in neighbourhood area Oeste 6..........184 Figure 7.28 Distribution of child population in neighbourhood area Oeste 6..................184 Figure 7.29 Concentration of child population in worst‐off areas .....................................185 Figure 7.30 Schematic socio‐economic spatial differentiations in Rosario:
best‐off core and axes and worst‐off periphery ...............................................186 Figure 7.31 Schematic representation of inequality changes between 1991 and 2001 .....187 Figure 7.32 Socio‐economic factor ..........................................................................................188 Figure 7.33 Cluster areas in Rosario.......................................................................................190 Figure 7.34 Inequality index 2001...........................................................................................191 Figure 8.1 A proposed macro‐micro model of spatial intra‐urban inequalities .............198
List of main acronyms BHN Banco Hipotecario Nacional (National Mortgage Bank) CMD Centro Municipal de Distrito (Municipal District Centres) CBO Community Based Organisation DETR Department of the Environment, Transport and the Regions DGE Dirección General de Estadística (General Direction of Statistics) DNPH Dirección Nacional de Políticas Habitacionales (National Direction of
Housing Policies) DPVU Dirección Provincial de Vivienda y Urbanismo (Provincial Housing
and Urban Institute)

viii
EC European Communities ECLAC Economic Commission for Latin America EPH Encuesta Permanente de Hogares (Permanent Household Survey) FONAVI Fondo Nacional de la Vivienda (National Housing Fund) GIS Geographical Information Systems IADB Inter American Development Bank ILO International Labour Organization IMF International Monetary Fund INDEC Instituto Nacional de Estadísticas y Censos (National Institute of
Statistics and Censuses) JET Jobs, Education and Training services LNRS Liverpool Neighbourhood Renewal Strategy LPG Liverpool Partnership Group LSP Local Strategic Partnerships MERCOSUR Mercado Común del Sur (South America’s Common Market) NBI Necesidades Básicas Insatisfechas (Unsatisfied Basic Needs) NGO Non‐Governmental Organisations NRA Neighbourhood Regeneration Area OAV Oficina de atención al Vecino (Neighbours’ Service Office) ODPM Office of the Deputy Prime Minister OECD Organisation for Economic Co‐operation and Development ONS Office for National Statistics PCT Primary Care Trust PER Plan Estratégico Rosario (Strategic Plan of Rosario) PSAT Public Service Agreement Targets PTI Poverty‐targeted Investment SIA Strategic Investment Areas SLH South Liverpool Housing SPV Servicio Público de la Vivienda (Public Housing Service) STEC Speke Training and Education Centre UNCHS United Nations Commission for Human Settlements UNDP United Nations Development Programme WCED World Commission on Environment and Development

ix
Foreword The idea of embarking on PhD research started six years ago when I contacted Prof. Ian Masser and asked him about the possibility of writing a PhD proposal to submit to ITC. I took the opportunity when he was visiting the Universidade Federal de Santa Catarina in Florianópolis (Brazil) to meet him and discuss the first draft in 1999.
At that time, I was personally shocked by the increasing poverty and social inequality in Argentina. I still keep the front page of the Clarín newspaper supplement Zona of 13 June 1999 with the headline La estampida de la pobreza (The stampede of poverty), which vividly depicted the situation. At the same time, through the research carried out for my MSc thesis I was aware of some of the possibilities offered by the combined use of indicators and GIS for monitoring that situation. One of my first ideas was to develop a methodology that policy makers could use to better understand the increasing inequalities within cities and at the same time to reduce the gap.
In March of 2001, I was able to start my qualifier phase in Enschede and write the final proposal. Since September 2001, I have continued the major part of my research in Utrecht, thanks to the support of Prof. Henk Ottens and the late Prof. Frans Dieleman, who accepted the PhD proposal at the Urban and Regional research centre Utrecht (URU). I am very grateful to my supervisors Henk and Ian for all their patience and support, in particular at the end of 2001 during the socio‐economic crisis in Argentina. The whole PhD research owes much to their assistance, advice and critical involvement.
This research would not have been possible without the financial support received from different institutions. I am particularly grateful to the International Institute for Geo‐Information Science and Earth Observation (ITC), who co‐funded this research and the publication of this book. In this respect, I would like to thank the ITC research coordinator Prof. Martin Hale, as well as Loes Colenbrander for her perfect research administration and help. The ITC library staff have been very helpful in providing me with books and inter‐university library loans. I am also thankful for the support received from the Ryoichi Sasakawa Young Leaders Fellowship Fund (SYLFF).
I would not have been able to complete this research without the help of various people and institutions that provided data or made time available for the interviews. Among them, I would like to thank especially Mónica Bifarello, Andrea Ronchi, Daniel Sartorio, José Boin, Silvia Vila and Maria Isabel Garzia. I would like to thank Gustavo Alvarez and Alejandro Giusti from INDEC, who kindly facilitated access to the census data. To all the people in both Rosario and Liverpool who agreed to be interviewed ‒ many thanks!
I am also grateful to many people from the Facultad de Arquitectura, Planeamiento y Diseño UNR Rosario, where I graduated, who directly or indirectly helped me in arriving at this point. I would like to thank Prof. Adolfo Concina and the staff members working then in his department who back in 1994 let me take my first steps as a student assistant in urban analysis. My MSc studies at ITC would not have been possible without the support of Prof. Oscar Bragos and Roberto Monteverde, then coordinator of Grupo GiS. Finally, I would like to thank Prof. Dr. Héctor Floriani for supporting me in my attempts to find my way in the research arena in Argentina in 1999.

x
I would like to thank Prof. Cecilia Wong and Dr. Peter Brown from the Department of Civic Design at the University of Liverpool for their useful advice and help.
My sincere thanks to Janice Collins, for putting this thesis into proper English. For enriching me with new perspectives on Dutch and international culture, my
gratitude goes to all the AIOs and young researchers with whom I’ve shared lunch and URU days over these past four years: Femke, Rebecca, Michel, Ivo, Annet, Guido, Nikki, Sendy, Taede, Jasper, Karien, Annet, Justin, Maarten, Tim, Peteke, Saskia, Erik, Antonio, Stephan and Ari. I would like to thank my office‐mates at both Utrecht and Enschede: Saim, Bert, Pravesh, Cheng and Uday. In particular, I have to thank Tuna Taşan‐Kok for her friendship and for inspiring so much energy.
I am writing this the day before “friends day”, which is celebrated in some countries, so I cannot forget to thank my friends Verónica, Rubén, Marc and especially my paranymphs Lyande Eelderink and Lorena Montoya for their continuous encouragement, advice and friendship. Thanks Julián for checking my “Argentinean” Spanish in the summary. The last two years of my PhD have certainly benefited from the support and encouragement of Ton, whose sincere commitment to study and research certainly inspired me to continue. Bedankt!!!
My special thanks to my family, and in particular to my two nieces Carolina and Julieta.
Utrecht 20 July 2005

1
Chapter 1 Introduction The objective of this introductory chapter is to describe briefly the theme, context and approach of this research. First, it describes the importance of the urban inequality problem in the context of globalisation and its consequences for both the developed and developing world. Secondly, it establishes the relevance of inequality problems for urban policy. Finally, it explains the role of GIS‐based indicators in supporting urban policy. Economic transformation is taking place around the world, and globalisation, privatisation and deregulation are usually seen as responsible for an increase in spatial segregation, social polarisation and spatial inequalities (Castells, 1996; Harvey, 2000; Knox and Pinch, 2000; UNCHS, 2001). Social polarisation and the deterioration of the built environment have given birth to the phenomenon of so‐called dual or divided cities (Mega, 1995). This phenomenon is the spatial polarisation of the city. Spatial polarisation and geographical inequality occur in urban areas around the world. However, inequalities are particularly evident in cities in developing countries, where there is a permanent state of growth and urban poverty vulnerability. Inadequate habitat conditions, degradation of urban services infrastructure, unequal access to physical and social infrastructure, crime and unemployment are found in these cities. What all these problems have in common is a spatial dimension, since they all occur and tend to be concentrated in specific areas of the city.
To describe inequalities, as well as to implement effective remedy policies, it is necessary to establish monitoring studies. The spatial dimension of inequalities makes it a suitable subject for analysis and monitoring with the use of geographical information systems (GIS). Indicators, due to their inherent function, are a tool that can simplify and communicate these complex phenomena into quantifiable measures. The systematic use of urban indicators and GIS analysis techniques can monitor this problem and its effects on the quality of life of the population. Therefore, GIS‐based indicators can be applied to target the most disadvantaged areas and to implement effective remedy policies. Descriptive and comparative studies of different areas of the city can also raise awareness of the low quality of life of the urban poor and reveal the existence of dual/divided cities.
While many studies have been proposed for monitoring urban poverty and urban sustainability, and indicators have been formulated at global, national and city levels, further research is needed to monitor spatial inequality within cities, and in the developing world in particular. Moreover, even though experience in the use of GIS and indicators for urban planning is increasing, there is a much greater need to emphasise inequality issues rather than poverty issues. Confirming this need, the United Nations Human Settlements Programme (UN‐HABITAT) clearly presents spatial inequality as one of the areas for more fundamental research (UNCHS, 1995, p. 36), and this is especially stressed in the 2001 Report on Human Settlements Cities in a Globalizing World (UNCHS, 2001).

2
1.1 The urban inequality problem The 2001 Global Report on Human Settlements (UNCHS, 2001) assigns a significant role to inequality and poverty issues. According to this report, they are uniquely important to people living in human settlements and cities. The main reason for this is that housing and services are no longer provided by the public sector, so people are then thrown back on their (in)ability to pay market prices. Because of these privatisations, the capacity of policy makers to have an effective influence on reducing inequalities might be limited. However, policy makers can improve the quality of life of those affected by inequality.
The influence of globalisation and inequalities in the developing and the developed world is explained as follows (UNCHS, 2001, p. 13):
“In today’s world, globalization is the most significant socio‐economic phenomenon, shaping the economic fortunes of both nations and cities. In spite of globalization, and sometimes because of it, extreme poverty has persisted and inequality deepened in many countries. In such countries, globalization has tended to fragment production processes, labour markets, political entities and societies. The main features of poverty today include falling incomes, rising costs of living, especially within urban areas, and inadequate access to basic services such as water and sanitation. Poverty is also increasingly becoming an urban phenomenon. The increase in the number of the world’s poor has been accompanied by rising inequality and polarization, between nations, within nations and within cities. Most of these features of poverty are not limited to the developing world, but also apply to more developed countries.”
In Latin America in particular, the main problem is the highly unequal distribution of urban income, “resulting in a dual urban economy and a highly segregated urban social structure: luxury apartments and elegant high‐rise office and hotel towers in the city centres, huge shanty‐towns in the outskirt” (Hall and Pfeiffer, 2000, p. 127). Latin America is the world region with the worst income distribution indicators, and some countries, such as Argentina, had an increase in income concentration between 1990 and 2002 (ECLAC, 2004b). In Argentina, the average income of the richest quintile was 13.5 times that of the poorest in 1990, rising to 21.8 times in 2002 (ECLAC, 2004a). The Economic Commission for Latin America (ECLAC) in its report Social Panorama of Latin America (ECLAC, 2004b) calls for “the urgency of developing distributive policies to increase low‐income strata’s income generating capacity with the help of stronger social safety nets and a more inclusive production model”.
At the end of the 1990s, different authors studied the impact of globalisation in the cities and agreed on the emergence of growing inequalities (Castells, 1996; Borja and Castells, 1997; Castells, 1999; Harvey, 2000). Castells studied the “informational age” and globalisation thoroughly, and clearly explains the concept of “switched‐off” areas and the unequal access to technology, and how it affects cities around the world independent of their level of development (Castells, 1996, p. 34):
”The speed of technological diffusion is selective, both socially and functionally. Differential timing in access to the power of technology for people, countries, and regions is a critical source of inequality in our society. The

3
switched‐off areas are culturally and spatially discontinuous: they are in the American inner cities or in the French banlieues [suburbs], as much as in the shanty towns of Africa or in the deprived rural areas of China or India”...
Knox and Pinch (2000), following Sassen (1991), argue that one of the main features of global cities is social polarisation – growing social inequalities. “In large measure, this inequality stems from the characteristics of financial services; they are dependent upon a strata of relatively well‐paid workers who require many consumer services such as restaurants, shops and cleaners which in turn utilize low‐paid workers. This social inequality is also manifested in the social geography of global cities.” Knox and Pinch (2000, p. 46) argue that while few cities can claim true global status, all urban centres are now global “for they are all affected by events and decisions outside their boundaries. Furthermore, they are all engaged in a fierce competition to attract mobile capital into their areas.”1 The promotion of spatial concentration, specialisation and fragmentation by globalisation, making certain locations and regions more favourable than others, is found in Europe (Kunzmann, 1998, p. 104), as well as in metropolitan areas of Latin American countries, for example, the metropolitan area of Buenos Aires in Argentina (Ciccolella, 1999).
However, other authors, such as Hall and Pfeiffer (2000, p. 37) take a more positive or optimistic point of view than Harvey or Sassen:
“... we believe that technological progress and economic globalization will prove to be on balance benign forces, whatever short term problems they bring in their wake. Technology and capital accumulation will together bring millions of people out of poverty into relative affluence ... the process will not be smooth and easy, not least because increasing wealth may also bring with it increasing disparities between countries and within countries; and the problem for policy makers is to try to predict the deep long‐term trends as far as it is possible to trace them, and then to seek to anticipate both the likely challenges, and the shifts in value systems that they will engender.”
Hence, the tracing of these disparities, the monitoring of inequalities within cities, still matters and it is justified even if a positive position towards globalisation is adopted or the short‐term problems are accepted.
1.2 Inequality and urban policy Since the Agenda 21 declaration, the reduction of inequalities and disparities within cities has been constantly mentioned as important for sustainable development (United Nations, 1992b; European Commission, DG XI (1994), in Mega, 1996; UNCHS, 2001). Local governments are encouraged to target deprived areas and implement effective remedy policies to reduce inequalities.
1 For a different perspective and a debate about whether or not dual cities are direct consequences of globalisation or world cities status, see Hamnett, 1994; Hamnett, 1996; Burgers, 1996.

4
Area‐based policies are one of the tools that have been applied since the 1990s to target geographical areas where problems coexist, and to improve the quality of life of the people living in those areas. A shift from universalist (uniform transfers budgeting) to targeted policies is identified as a trend in urban policies in the UK (Smith, 1999) and in other parts of Europe, and they are credited with providing a good framework for concerted action to counteract multiple deprivation (Andersen and van Kempen, 2003, p. 82). One of the arguments in favour of geographically targeted policies is that they are justified because of the increased polarisation between deprived and more affluent areas (Smith, 1999, p. 4).
Since the end of the 1990s, there has also been concern in Latin America about improving the quality of life and reducing inequality through a better allocation of resources. Several agreements between Latin American mayors have specifically stressed the importance of reducing inequality. The Charter of Porto Alegre, signed by more than 50 mayors in 2001, shows an attitude of social justice in its willingness to reduce inequalities. One point stresses the extension “to all residents of the city of access to the network of social and public services”, while another intends “to promote policies to overcome the housing crisis, poverty and other forms of social exclusion and marginalization affecting large numbers of people in their cities” (Westendorff, 2002). A similar attitude was expressed in May 2001, when the mayors of the cities of Montevideo (Uruguay); Belo Horizonte, Porto Alegre, Sao Paulo (Brazil); and Buenos Aires and Rosario (Argentina) signed an agreement to promote social cohesion.2 Here they specifically address the importance of local government pursuing that objective. In this agreement, the mayors identify the objective of “strengthening the management in the areas that contribute to a better quality of life for our citizens” and the need to ”implement innovative and effective policies that guarantee full access to health care, education and housing and generate better working conditions”. They propose that local authorities should “be the first level of government to fight for greater social inclusion”. They also declare “the fundamental importance of developing strategies for the implementation of the Local Agenda 21 and the integrated participation in the United Nations Conference ‘Rio Plus 10’”.
In a similar way, the Charter of Buenos Aires on Social Commitment in MERCOSUR, Bolivia, and Chile3 states the intention to “unite their efforts in achieving greater welfare and social equality through a balanced and fair approach to economic development”. The last point of the Charter stresses the importance of promoting research on social exclusion to improve decision making and a better allocation of resources:
“To encourage research and joint studies on social vulnerability and exclusion, decentralization and participation, in order to improve the decision‐making process in the formulation of social policy and in the allocation of resources” (MERCOSUR, 2000).
2 Dialogue on the topic of social inclusion (Buenos Aires, May 12, 2001) in Strategic Plan Buenos Aires 2010: http://www.buenosaires2010.org.ar/english/about/news/agreement.html. 3 Signed in the year 2000 by the presidents of Argentina, Brazil, Paraguay, and Uruguay (member states of MERCOSUR) and the presidents of Bolivia, and Chile.

5
The previous paragraphs show that the monitoring of inequalities will be greatly needed to target and redistribute municipal welfare within local governments.
1.3 GIS-based indicators to support urban policy The UN‐HABITAT report Slums of the World advocates the need ”to produce spatially disaggregated data in order to address urban inequalities ... to facilitate reporting at city‐level along with country‐level reporting ... This will contribute to redirecting attention and future investments towards slum areas” (UN‐HABITAT, 2003b, p. 6). Even though there is a clear need for better information and spatially disaggregated data, the Global Urban Observatory, the UN‐HABITAT international capacity‐building network, indicates that many cities suffer from an information crisis that undermines their capacity to develop effective urban policy. It also warns that these cities do not have a sustained or systematic approach to assessing the urban problems and cannot evaluate the success of the implemented policies. Urban indicators are seen as a tool that can improve this situation (Moor, 2000), and the spatial dimension of inequalities makes it a suitable subject for analysis and monitoring with the use of GIS.
Indicators simplify complex phenomena into quantifiable measures that can be used for policy and decision making. Therefore, indicators have three functions: to simplify, to quantify and to communicate (van Delft, 1997). Innes (1990) considers that an indicator focuses on, and renders, intentionally selected areas of the reality. She puts it this way: “An indicator is simply a set of rules for gathering and organizing data so they can be assigned meaning.” These definitions show the potential that GIS has for operationalising indicators. While constructing indicators, it is necessary to organise data, to quantify and to communicate. These three functions of indicators coincide with the usually acknowledged advantages of GIS: data organisation, spatial analysis and visualisation (Burrough, 1986, in Huxhold, 1991; Webster, 1993; Ghose and Huxhold, 2002). Furthermore, the spatial dimension of urban inequalities and the area‐based policies that target deprived areas makes decision support suitable for analysis and monitoring with the use of GIS‐based indicators. Besides, in the late 1990s the value and potential of GIS in constructing intra‐urban indicators was increased by a combination of factors: a growing concern regarding intra‐urban inequalities, the implementation of area‐based policies, and the developments in ICT and GIS technology.
1.4 Research objective The main objective of this research is to develop a methodology that combines the use of urban indicators and GIS as a valid diagnostic and prescriptive tool to generate policy‐relevant information on the complex and multidimensional aspects of spatial inequalities. In Section 2.5, research questions are formulated to fulfil this main objective.
To apply and assess the proposed planning support methodology in a concrete local policy context, a case study in Rosario (Argentina) is carried out. To enrich the assessment, a complementary case study is performed in Liverpool (UK). It provides additional knowledge from a country with experience both in the use of indicators and in the implementation of area‐based policies to tackle inequalities. In this way, both case studies support the development of the methodology.
In the following chapter, a series of research questions is presented. They are formulated to pursue four research goals: (1) to generate a scientifically valid set of

6
indicators that both reflects the different aspects of intra‐urban inequalities and considers small‐area data availability at local government level; (2) to adapt the generated set of indicators to the Rosario context of policy making with respect to relevance and effectiveness; (3) to develop a methodology that uses GIS to construct indicators taking into account the relevant intra‐urban scales and the different aspects of inequalities; and (4) to gain more insight into the inequality problem. A multivariate/multiscale analysis of the indicator values is performed in the case study to see how the different aspects relate to each other and evolve over time. This is particularly relevant to prove that the selected set of indicators is able to monitor inequality and communicate gaps, as well as to explain how certain problems tend to concentrate in specific areas, generating uneven geographies.
As mentioned above, this research proposes a methodology that policy makers can use to address intra‐urban inequalities. In this context, the perspective of local policy makers about inequality aspects is very relevant. Initially, a case study in Argentina was foreseen to apply and evaluate the proposed methodology. During the 1990s, Argentina went through a series of economic adjustments, privatisations and deregulations. One of the negative effects of these policies was an increase in income inequalities and poverty, which, together with a combination of institutional and economic problems, led to a profound crisis in December 2001.
This research had already started nine months before that institutional and socio‐economic crisis, and the city of Rosario had been selected as a case study area. The major part of the empirical analysis had been planned based on the Argentinean census and interviews with policy makers. The extreme uncertainties in the political environment of Argentina delayed the start of the interviews and the reception of the 2001 census data. The delay in data reception and the crisis in Argentina proved to be an opportunity for a new dimension to the research. It was therefore decided to add a complementary case study in a country with experience in the use of indicators and the implementation of area‐based policies. Consequently, a series of interviews with policy makers in Liverpool added a further perspective to the research. One of the values of cross‐national comparative perspectives is that policy makers are given the opportunity to consider the lessons from others’ experience (Masser, 1986). The benefits of this complementary case study are reflected in particular in the development of the methodology and the recommendations.
Fortunately, in spite of the crisis in Argentina – although not without extra effort to keep this research afloat – it was possible to complete the case study in Rosario. This particular experience revealed the difficulties that have to be taken into account when research is carried out in developing countries, where unstable institutions and uncertainties can hamper data accessibility and fieldwork development.

7
1.5 Outline of this study After this introduction, Chapter 2 conceptualises inequality and compares it with related problems such as social exclusion, poverty and deprivation. Finally, it presents the research questions and conceptual model. Chapter 3 explains what indicators are and the role of GIS‐based indicators in monitoring inequalities. The chapter ends by presenting the empirical research model.
The following three chapters are related to the description of a methodology that can be applied as a diagnostic and prescriptive tool for inequalities. Chapter 4 describes the case study area of Rosario (Argentina), selected to focus the policy relevance of indicators and approximate the validity of the methodology to the local context. An overview of a “contrast” case study area is given, together with both planning policy contexts. The complementary case study of Liverpool (UK) helps us to understand how indicators and area‐based policies are already applied in the developed world and to anticipate similar issues that might arise in Rosario after a more extended use of indicators. Chapter 5 explains the current role assigned to indicators and inequality by policy makers in the city of Rosario, and it is contrasted with the perspective of policy makers in Liverpool. Chapter 6 operationally defines the set of indicators proposed for monitoring inequalities and explains the methodology in detail.
Chapter 7 presents the empirical application of the methodology and deals with the analysis of inequality using GIS‐based indicators. It demonstrates how urban indicators and GIS can describe and monitor inequality aspects such as quality‐of‐life conditions and access to physical and social infrastructure. This research proposes a methodology to systematically monitor the most relevant aspects of intra‐urban inequalities through an indicator matrix and an approach to incorporate a geographical component into municipal budget allocation.
Chapter 8, focusing on the conclusions and recommendations, brings this book to a close.


9
Chapter 2 What is inequality and why does it matter? The objective of this chapter is to conceptualise inequality and describe its spatial dimension. This exposes the theoretical perspective that will underline the rest of the research (social justice perspective). The last section of this chapter presents the research design and the conceptual model.
2.1 What is inequality? To understand the importance of describing and monitoring spatial inequalities within cities, it is important to explain inequality and differentiate it from other related and sometimes overlapping concepts. In the following subsection, concepts such as social justice, poverty, and social exclusion are described and related to urban inequality.
2.1.1 Inequality – justice (equality as social justice) To demonstrate that inequalities in cities really do matter, it is necessary to consider an approach from a social justice perspective. When there is a need to monitor or describe inequalities, it is implied that with the aid of planning tools there is the intention to change, improve and/or solve this problem (unless a passive observer position is adopted). Hence, there is concern about what the city should be and some form of redistributive or compensatory action. According to Smith (1994, p. 2), “questions of social justice, morality or ethics are usually described as normative, concerned with what should be, as opposed to positive knowledge which is about what actually is”. Social justice is concerned with the question of who gets what where and how, and more precisely who should get what where and how (Smith, 1977). Smith (1994) considers that justice involves treating people fairly, which in distributive justice means that whatever is being distributed should go to people in the right quantities. As he expresses it, “fairness” means that people in the same circumstances should be treated in the same way. A difference can be made between arithmetic and proportional equality where the distribution is justified according to a certain criterion.
“A central issue in distributive justice is how to justify differential treatment, or how to identify the differences among people which are relevant to the particular attribute(s) to be distributed. This raises the distinction between arithmetic equality which means everyone is getting exactly the same quantity of something, and proportional equality which means people getting something in quantities proportional to circumstances which can differ among them. These could include such criteria as need, merit and desert” (Smith, 1994, p. 24).
Arithmetic equality is also related to what other authors call in the equal access to public services “horizontal equity” (e.g. Devas and Rakodi, 1993). Talen (1998, p. 24), who studied the equitable distribution of public facilities, defines “equality criteria”, where everyone receives the same public benefit, regardless of socio‐economic status, or willingness or ability to pay.

10
With respect to the proportional equality category, the following criteria apply: • Need criterion: termed “compensatory equity” by Crompton and Wicks (1988, cited
in Talen, 1998, p. 24) and referred to as “unequal treatment of unequals” by Lucy (1981, cited in Talen, 1998, p. 24), which is based on factors such as poverty and race. In the city of Liverpool, for example, resources are directed into the most deprived wards. Pacione explains that the need criterion is related to the “needs assessment school”, which “emphasises the goal of allocating public goods and services for the welfare of society as a whole” (2001, p. 336). The egalitarian principle is also present in the “ideology‐appeasement view”, but this ideology understands that public goods and services are provided by a dominant class to appease the interests of a repressed class in order to maintain social order (Pacione, 2001, p. 336).
• Demand criterion: where active participation in distributive decisions is “rewarded”
by increased user benefit. This can be related to the lobbying power of certain groups. An example of this power is explained by Werna (2001, p. 1) in the following way:
“Wealthy people often use their connections to – and influence upon – government officials to attract public investments and services to the neighbourhoods where they live, at the expense of low‐income neighbourhoods. Thus, in such circumstances, the poor, through their contributions to the public system, actually subsidize the wealthy.”
• Market criterion: the cost of the service is a key factor in the distribution. The degree to which the people use (and therefore pay for) a particular service defines the distribution of services. This is related to one of the theories of public service provision, the “market‐surrogate school”, which considers market principles to determine which goods should be provided publicly. According to this theory, public goods should be allocated according to the willingness of people to pay for them (Pacione, 2001, p. 336). Pacione explains that “according to this ‘public choice’ approach local politicians who make decisions on the allocation of public services do so in response to the demands of their ‘voters consumers’ expressed via public support for particular tax and expenditure options at election time” (Pacione, 2001, p. 336). In this theory, the demand for different sets of public goods is reflected by individuals selecting where to live, looking for the administrative area with the desired mixture of public services and taxes. However, the critics of this model explain that for many households there is a limited choice of residential location. “For those unable to participate in the public choice, the ‘exit’ strategy is not an option, resignation or ‘learned acceptance’ of their current situation being all that is available” (Pacione, 2001, p. 336).

11
Following Devas and Rakodi (1993, p. 57‐58), two more criteria can be mentioned:
• Vertical equity criterion: where “those who have greater wealth and income should contribute more towards the costs of public services than those who have less”.
• Benefit criterion: where “people should contribute in accordance with the benefits
they have received”.
The previous definitions and perspectives show how inequality problems have a close relationship with social justice, distributive issues and ethics. Moral philosophy or ethics is an “emergent perspective” within urban geography, where normative judgement is central. Related to this perspective, there are issues such as the equitable and fair distribution of services, and access to housing and employment for all. Pacione (2001) recognises the relation of the moral philosophy or ethic perspective to the attention paid to issues of social justice during the 1970s, and in the more recent critiques of the ethics of market‐oriented individualism, which emerged in the 1980s and 1990s.
Equality and social justice are related to the concept of “collective consumption” and the role of the welfare state. Collective consumption4 refers to the collectively organised and managed services that are paid for by the public and are consumed via non‐market mechanisms. It coincides with the philosophy of the post‐World War II welfare state period, where the state had a responsibility to provide access to health, housing and education and thus guarantee their citizens a decent standard of living. Pacione (2001) explains that the quality of life of families with limited resources and restricted access to private consumption may be measured in terms of public goods and services available locally.
In the moral philosophy or ethic perspective, there is rejection of the post‐modern denial of the possible existence of generally applicable moral bases for political‐economic action (Pacione, 2001). According to the same author, the uncritical (post‐modernist) celebration of difference and plurality might obscure the need to solve problems of social injustice. However, it is commonly accepted by international organisations and by local governments that human beings do have certain universal basic rights.
2.1.2 Inequality – rights and needs (equality as a right) Rights are very much related to equity issues and the selection of some urban indicators, since they are usually formulated following explicit policies. A good example of this is the urban indicators formulated by Habitat, where there is a commitment to promote the right to adequate housing on an equity basis.
“Since the adoption of the Universal Declaration of Human Rights in 1948, the right to adequate housing has been recognized as an important component of the right to an adequate standard of living. Part of the actions that Governments are committed to providing, in the matter of housing, that the law shall prohibit any discrimination and guarantee to all persons equal and
4 Coined by Castells (1977), in Pacione (2001)

12
effective protection against them” (Habitat Agenda, paragraph 61, cited in UNCHS, 2000b).
This right emphasises equality, and it does not matter who, when or where people are. Hence, it is possible to monitor how (un)equal a certain area of the city is becoming if it is possible to measure how these rights are guaranteed.
To say that people have rights, according to Smith (1994, p. 34), is “to require them to be treated in a certain way, to get something to which they are entitled or at least to raise this expectation”. Smith goes further and differentiates rights (which are respected and guaranteed) from wants (which can be met and are related to personal desires) and from needs (which can be satisfied and quantified). “To assert a need is to appeal to some external standard, however implicitly, which may legitimate something that would otherwise merely be a want” (Smith, 1994, p. 36). Pacione (2001) explains that certain basic needs are universal and common to all human needs but many needs are related to a certain socio‐geographical context. This author gives as an example the “need” of a suburban US family for two cars to deal with the activity patterns of a household in the spatially dispersed US city ‒ a need that in other countries might be related to wants.
Indicators and GIS can play a role in evaluating certain needs (e.g. housing needs) and in comparing how (un)equal the city is becoming.
2.1.3 Inequality – difference Inequality should be distinguished from difference ‒ especially since some urban/social differences are usually seen as positive and are closely related to personal and cultural choices and values. Smith (1994, p. 49) puts it this way: “Inequality can be thought of as a particular kind of difference between people, about which moral questions arise.” He considers that “all sources of human difference are not necessarily subject to the moral disapproval often elicited by observations of inequality”. Clear examples of differences that do not get moral disapproval are cultural differences expressed, for example, in housing preferences.
2.1.4 Inequality – segregation Segregation is the spatial concentration of population groups, which is related to the segregation of particular socio‐economic, ethnic or other groups. The (equalising) influence of the welfare state in the urban segregation problem might also ameliorate the effects of globalisation and economic restructuring and the consequent dual cities. Van der Wusten and Musterd (1998) have studied inequality and segregation under redistributive welfare states. In their view, inequality and segregation do not necessarily correlate. Comparing different case studies, they explain that Belfast might be an example of less income inequality but high levels of segregation, contrasting with US cities where the most pronounced levels of segregation coincide with high levels of inequality (van der Wusten and Musterd, 1998, p. 247).
2.1.5 Inequality – poverty – inequity Recently, concern has been growing about the lack of discussion on inequality, mainly because attention has been given to urban poverty (Mitlin et al., 1996). This lack of discussion has been reflected in international and governmental programmes for “urban

13
poverty alleviation”, as well as in the literature. Mitlin et al. (1996, p. 3) recognise two causes: “the increased emphasis on market driven approaches to development over the last 10 to 15 years” and the “increased willingness to perceive income inequalities as important in providing individual incentives for entrepreneurship”5. Consequently, these have “resulted in a scepticism about any role governments might play in lessening inequality”. A similar perspective is found in the 2001 Human Development Report (UNDP, 2001, p. 17):
“For development economists concerned primarily with the world’s poor countries, the central issues have been growth and poverty reduction, not inequality. And for mainstream economists during most of the post‐war period of the 20th century, inequality was at worst a necessary evil—helping to enhance growth by concentrating income among the rich, who save and invest more, and by creating incentives for individuals to work hard, innovate and take productive risks.”
However, increasing attention to inequality and its differentiation from poverty has been seen. This is reflected in the 2001 Global Report on Human Settlements (UNCHS, 2001, p. 15):
“Although absolute poverty is bad enough, it is worse when it occurs amid conditions of plenty. Relative poverty mirrors inequalities that raise important questions of equitable access to rights and resources. Polarization happens when these inequalities worsen over time and inequities become accentuated and magnified.”
This distinction between absolute poverty and relative poverty is also a fundamental issue in the debate on poverty and deprivation. While absolute poverty is the inability to attain a minimal standard of living, and needs are biologically fixed, relative poverty is the inability to attain relative living standards across the whole of society, where needs are culturally determined (Stephens, 1996, p. 14; Pacione, 2001). Therefore, poverty seen as a relative phenomenon recognises other needs, such as job security and self‐esteem.
These two concepts should be differentiated from inequality and equity, where inequality involves difference, unevenness and dissimilarity, and inequity involves a lack of equity, an unjust action. Pacione (2001, p. 339) stresses that equity should not be confused with equality. He argues that citizens are equal in neither service needs nor preferences, and saying they get equal services indicates little about how well they are served. In this case, equality is what Smith (1994) defines as arithmetic equality and equity is what Smith (1994) defines as proportional equality (see p. 9). Both Stephens (1996, p. 14) and Pacione (2001) distinguish inequality from inequity, giving the latter a moral or normative aspect, while other authors use them indiscriminately.
5 However, “Glyn and Miliband (1994) found societies with wider inequality have more ill‐health, social stress and crime which cramp economic growth” (cited in Pantazis and Gordon, 2000, p. 15).

14
Castells (1999, p. 71) groups inequality, polarisation and poverty under what he calls “processes of social differentiation” and defines them as follows:
“Inequality refers to the differential appropriation of wealth (income and assets) by different individual and social groups, relative to each other. Polarization is a specific process of inequality that occurs when both the top and the bottom of the scale of income or wealth distribution grow faster than the middle, thus shrinking the middle, and sharpening social differences between two extreme segments of the population. Poverty is an institutional defined norm concerning a level of resources below which it is not possible to reach the living standards considered to be the minimum norm in a given society at a given time.”
In this research, the term “inequality” is used, since it better reflects multidimensional (including spatial) aspects of the phenomenon, such as health, education or access inequalities. On the other hand, although “inequity” emphasises the normative meaning, it is usually related to economic aspects of the phenomenon, and is more associated with income inequity.
2.1.6 Inequality – sustainability Equity, together with quality of life, is usually included in the conceptualisation of sustainability. In 1987, the World Commission on Environment and Development6 defined sustainable development as the development that meets the needs of the present without compromising the ability of future generations to meet their own needs (WCED, 1987). Equity is defined as social solidarity in terms of fairness to people living now and in the future. Social equity and quality of life are one of the most important aspects of sustainability.
Quality of life is composed of several aspects, including material living standards, public health and safety, access to education, health care, fulfilling occupations, opportunities for personal development and advancement, community, culture, social life and recreation, environmental amenities and aesthetic qualities (EURONET, 1997).
The concept of sustainability was extremely diffused in the agendas of various local governments, agencies and NGOs, especially after the 1992 Rio Earth Summit, which established Agenda 21. The declaration resulting from that summit particularly mentions in its fifth principle the importance of reducing inequalities for sustainable development:
“All States and all people shall cooperate in the essential task of eradicating poverty as an indispensable requirement for sustainable development, in order to decrease the disparities in standards of living and better meet the needs of the majority of the people of the world” (United Nations, 1992b, Principle 5).
6 The Commissionʹs recommendations led to the Earth Summit ‐ the United Nations Conference on Environment and Development (UNCED) in Rio de Janeiro in 1992.

15
Apart from the UN Agenda 21, this is also stressed by the European Commission’s First Report on the Sustainable City: “environmental sustainability cannot be perceived without social equity and economic sustainability” (European Commission, DG XI (1994) cited in Mega, 1996). It also recognises the need for sustainability indicators as tools for quantifying sustainability performance.
2.1.7 Inequality – deprivation Deprivation is defined as “a state of observable and demonstrable disadvantage relative to the local community or the wider society or nation to which an individual, family or group belongs” (Townsend, 1987, p. 125, cited in Broadway and Jesty, 1998). It refers to specific conditions, such as the lack of clothing, housing, household facilities, education and social activities, rather than resources, and is thus distinguished from poverty.
The measurement of deprivation through indices is frequently used in the UK. The Department of the Environment, Transport and the Regions elaborated since 1998 an Index of Local Deprivation (ILD), using census and administrative data. It measures the following dimensions of deprivation: income, health, education, environment, crime and housing. After a revision, the ILD was published in the year 2000 as the Index of Multiple Deprivation (IMD), with the following domains (DETR, 2000b): income; employment; health deprivation and disability; education, skills and training; housing; and geographical access to services. The latest revision of the IMD in 2004 included the following domains: income deprivation; employment deprivation; health deprivation and disability; education, skills and training deprivation; barriers to housing and services; living environment deprivation; and crime (ODPM, 2004b).
According to Thake and Staubach (1993 in Pacione, 2001, p. 291), “The root cause of deprivation is economic and stems from three sources”: low wages, unemployment and the reduction in welfare expenditure. Deprivation is very much related to the concept of social exclusion.
2.1.8 Inequality – social exclusion When individuals or large sectors of the population are denied equal access to rights and resources, they can be considered socially excluded. Increasing levels of inequalities within cities might be a symptom of the existence of this problem. Social exclusion is a complex and multidimensional phenomenon with economic, social and political aspects. People are socially excluded when they are deprived of access to assets such as property or income (the unemployed), when they lack a link to mainstream society, or when they are deprived of part or all of their political and human rights (e.g. immigrants, minorities) (Bessis, 1995).
Poverty is one form of social exclusion, but not the only one. Income inequality and material exclusion are the traditional focus of the Anglo‐Saxons on social exclusion issues (European Commission, 1998). On the other hand, the concept of social exclusion, developed mainly by the French intellectual tradition, emphasises social and cultural exclusion and has recently been adopted by the discourse of the European Union (European Commission, 1998). There are aspects of social exclusion (as well as poverty and inequality‐inequity) that cannot be translated into monetary terms, for example, social identity, aspirations, and social and political participation (European Commission, 1998).

16
Vranken (2001) considers social exclusion to be part of a quartet formed by differentiation, fragmentation, inequality and exclusion. The four concepts are the result of the combination of the presence/absence of hierarchy and the presence/absence of fault lines. Fault lines may be manifested as a gap, a wall or a barrier. He defines the following conceptual equations:
social differentiation as the “basic concept” social differentiation + fault lines = social fragmentation social differentiation + hierarchy = social inequality social inequality + fault lines = social exclusion
(Vranken, 2001, p. 4)
From the previous conceptual equation, social exclusion is the result of two conditions: a hierarchical relationship between individuals or groups and a separation by fault lines. Vranken refers to social exclusion as “situations and processes such as polarisation, discrimination, poverty, and inaccessibility”. He further explains that exclusion is not the result of simple ruptures in the fabric of society but real gaps that “lead to a division between ‘in’ and ‘out’” (Vranken, 2001, p. 4). This author considers that, in order to arrive at such a situation, a society must possess certain characteristics, for example, “be structured in a centre/periphery relationship and society’s economic, social, and cultural capital must be distributed unevenly”.
According to Atkinson (2000, p. 1050), there is no clear definition of social exclusion, resulting in a lack of methods for measuring, and a failure to capture, the relational and spatial dimensions of exclusion. One of the reasons for this failure is the use of poverty as the main proxy indicator of social exclusion (Atkinson, 2000, p. 1050). He also doubts whether existing methods, indicators and multiple deprivation indices really “measure social exclusion, or at least the cultural and relational dimensions of exclusion” (Atkinson, 2000, p. 1051). One of the problems of previous research was neglecting social exclusion as a multidimensional aspect that is intricately related to the spatial aspects of inequality.
2.1.9 Dual cities and social polarisation It is social polarisation and the concept of dual cities that emphasise the spatial aspect of inequality most. The social polarisation concept, originated by Manuel Castells and Saskia Sassen, resulted from the observation of patterns in New York and Los Angeles that could be generalised into “global cities”. In 1989, Castells (1989, p. 225, in Wessel, 2000) anticipated increasing differentiation of labour and a “new urban dualism”, and concluded that “The global city is also the dual city” (Castells, 1989, p. 343, in Wessel, 2000). A few years later Sassen arrived at similar conclusions but used the term “social polarisation” (Wessel, 2000).
Social polarisation can be understood as a result of economic restructuring. Owing to the removal of locational constraints, some activities became footloose and this, together with deregulation and technological rationalisation, led to changes in the manufacturing sectors of (global) cities. As a result, many workers lost their jobs or got lower salaries. On the other hand, there was an increase in demand for people highly qualified in administration and finance. The latter group benefited from higher income,

17
and generated a demand for low‐grade personal service work, usually covered by immigrants from developing countries. According to Hall (2001, p. 154), the idea of the dual city “is based upon evidence of increasing social division within cities and the apparent emergence of an ‘urban underclass’ divorced from dynamic mechanisms in the formal economy”. He indicates that social polarisation marked the spatial structure of cities. In this respect, Hudson (1989, in Hall, 2001) states that ”pockets of deprivation have become contrasted to highly spectacular ‘islands’ of regeneration which exist often in very close proximity to these ‘seas of despair’”. Castells (1989, p. 227, in Wessel, 2000, p. 1949) follows a similar perspective:
“Structural dualism leads at the same time to spatial segregation and to spatial segmentation, to sharp differentiation between the upper level of the information society and the rest of the local residents as well as to endless segmentation and frequent opposition among the many components of restructured and destructured labour.”
However, within social polarisation, the role of the welfare state and social democracies is sometimes seen as an equaliser. Welfare states, through their redistributive mechanisms, can affect segregation. This argument gives a different perspective to the proposition that social polarisation is a direct result of economic restructuring. To some extent, the welfare state in Europe had some equalising effect. However, income equality seems to be more difficult to attain nowadays, compared with other aspects such as health or education equality. Referring particularly to the Scandinavian social democracy, Wessel (2000) considers that politicians (in the welfare state) still have “variable opportunities to maintain egalitarian tradition” in health provision, education and the benefit system.
Similarly, Dieleman and Hamnett (1994) argue that “many social problems said to be inextricably linked to global cities are contingent rather than necessary and inevitable”. For instance, the Randstad in the Netherlands is an example of the welfare model where inequalities are moderated by state intervention and consensus building (Wessel, 2000). Another example of the existence of inequalities and social exclusion, as well as the compensating action of the welfare state through area‐based policies, can be found in Hoogvliet (Rotterdam). As explained by Botman and van Kempen (2002), it has become one of the Rotterdam target areas for the Dutch Big Cities Policy. This policy introduced in 1994 aims, through area‐based policies, to make the cities “complete” (Botman and van Kempen, 2002). When a city has a strong economic, physical and social structure, it is said to be “complete” (Botman and van Kempen, 2002). Targeting deprived neighbourhoods and trying to make the city “complete” demonstrates a recognition by the central government of the problems of a “dual city”, as well as an intention to level the differences. In the following section, the characteristics of area‐based policies are discussed.
2.2 Area-based policies to address inequality The spatial patterning of inequality and difference results in the segregation of certain segments of the population (Langlois and Kitchen, 2001). Actions to counteract this problem are usually addressed through area‐based policies that target those deprived or

18
segregated areas. The recognition of area‐based policies to address multiple deprivation problems became important in the 1990s. The diffusion of area‐based policies in the UK became particularly extended during the New Labour mandate. The shift from universalist (uniform transfers budgeting) to targeted policies is identified as a trend in urban policies in the UK (Smith, 1999) and in other parts of Europe. Their bottom‐up characteristic is achieved through partnership between key local stakeholders (Smith, 1999), while the resulting pooling of resources might also help in a more effective use of the budget. Furthermore, the geographical perspective allows the development of cross‐sectoral and coordinated actions (Andersen and van Kempen, 2003). The following are some of the arguments in favour of geographically targeted policies (Smith, 1999, p. 4):
• There are identifiable geographical areas that suffer disproportionately from problems.
• Problems overlap in space and they are often made worse when they coexist.
• They are justified because of the increased polarisation between deprived and more affluent areas.
• Because of the concentration of problems, targeted resources are more effective since a greater number of deprived people are reached.
• Their bottom‐up approach through partnership working can result in the more effective identification of problems and delivery of solutions.
Besides, proponents of the area‐based approach argue that there is an “area effect” that accentuates, if not actually causes, deprivation. The Inner Areas Studies report of the UK Department of the Environment already talked about “collective deprivation” back in 1977 and concluded that “There is a collective deprivation in some inner areas which affects all residents, even though individually the majority of people may have satisfactory homes and worthwhile jobs. It arises from a pervasive sense of decay and neglect which affects the whole area” (DoE, 1977, p. 4, in Pacione, 2001).
Pacione (2001) explains that there are “additionality effects” such as (positive) spillovers for the area and adjacent areas. The identification of certain population groups concentrated in particular areas can help to target different policy requirements, such as a concentration of children requiring more kindergartens or primary health care.
The discussion on the area‐based versus the people‐based (place problems versus people problems) approach is usually brought into the debate, not without criticism (Knox, 1989; Smith, 1999; Pantazis and Gordon, 2000; Andersen and van Kempen, 2003). One of the disadvantages of area‐based policies is that, while problems are present not only in targeted areas, those areas that score slightly better do not get any attention (Parkinson, 1997, in Andersen and van Kempen, 2003). Another criticism is that “There are political problems associated with targeting some areas and not others” (Smith, 1999). However, this can be avoided if the final budget allocation is discussed within a consensus and participatory environment. The same author mentions the argument that “Area interventions interfere with the market – areas should be left to decline or recover since interfering with these processes may do more harm than good“. This is an ideological argument as valid (or not) as a social justice perspective. The

19
history of Argentina (especially in the 1990s) rather suggests that benefits from the market rarely trickle down to the most deprived areas.
It is also suggested that programmes should focus not only on deprived areas but also on target population groups (Robson et al., 1994, in Pantazis and Gordon, 2000). Musterd and Murie (2001) also doubt the effectiveness of area‐based policies (after considering European case studies), compared with general welfare redistributive policies:
“Area‐based policies do not have a strong record in terms of compensating for neighbourhood differences. The evidence would suggest that a strong welfare state system which limits the extent of inequality in the first place is the most effective way of limiting the extent to which spatial concentrations of disadvantage add to exclusionary processes. Attempts to compensate once inequalities have emerged through area targeting are not as effective (Musterd and Murie, 2001, p. 24).
Area targeting might not be as effective as a strong welfare state redistributive system but it still carries a strong social justice perspective. In that sense, area‐based policies do have a clear vision of what the city should be, and they implement redistribution or compensatory actions to reach that goal.
2.3 The spatial dimension of inequality Spatial disparities are found at different levels; “gaps” can be observed at different geographical scales. At global level, inequalities are found between countries and at the end of the scale; at local or intra‐city level, inequalities are found between neighbourhoods. Besides, problems related to deprivation or poverty show spatial concentrations in cities, accentuating the problems suffered by people living in certain areas (Pacione, 1986, in Pacione, 2001, p. 291).
This concern about spatial disparities and spatial injustice in geographical studies appeared during the 1970s, and there was interest in influencing public policy. Later on, post‐modernism emphasised or “celebrated” diversity and difference (Smith, 1994). Since the 1990s, there has again been a growing engagement of geographers with inequalities and moral and social issues, including the theme of the ethics of professional practice (e.g. Couclelis, 1999). This growing concern is particularly evident and is reflected in different reports and initiatives of international organisations that are stressing the importance of monitoring spatial inequalities within cities (e.g. UNCHS, 1995; The World Bank, 1996; European Commission, 2000; European Communities, 2000; UNDP, 2000; UNCHS, 2001; UNDP, 2001).
There is one aspect of social exclusion that is very much related to this concern about spatial inequalities. This is the spatial factor of social exclusion where it is not the individual but the complete geographical area that is deprived (e.g. of basic services), hence generating uneven geographies. This is the case of degraded quarters, slum areas or historical centres (European Commission, 1998, p. 25). One of the reasons why this aspect of exclusion is important is that the population (or the main part of it) is deprived, since they have to live in these areas. In the case of services, it is not a matter of access to the existing supply, but the non‐existence of providers (European Commission, 1998, p.

20
26). Castells (1999, p. 74) links the process of social exclusion concerning territories with the new logics of globalisation, hence “areas that are non‐valuable from the perspective of informational capitalism, and do not have significant political interest for the powers that be, are bypassed by flows of wealth and information, and ultimately deprived of the basic technological infrastructure that allows us to communicate, innovate, produce, consume, and even live, in today’s world”.
Even though there is mounting literature about inequalities and the importance of measuring them, there is not enough discussion about methods and tools (basically indicators), about how suitable they are, and about the introduction of new ones (e.g. GIS). This concern is also expressed by Kunzmann, who describes the problem as a lack of “spatially relevant indicators” (1998, p. 108). The Eurostat research project Non‐monetary Indicators of Poverty and Social Exclusion seeks to address part of this deficiency (European Commission, 1998). It is trying to cover the multidimensional nature of the problem, including territorial aspects of exclusion. However, there are no further details on how they will operationalise the indicators that will measure the spatial aspects of exclusion.
Some critics of using area‐based policy strategies to reduce inequalities argue that the targeting is not based on needs, but on what was described earlier as the demand criterion; that the areas are not homogeneous (ecological fallacy); and that inequality is a national problem that requires national solutions (Pantazis and Gordon, 2000). Taking this into consideration, and to minimise the problems (and criticism) of ecological fallacy7, this research focuses on the use of small area units and low levels of aggregation, and places stress on “need” more than on any other distributive criterion. The criticism on the scale of intervention ‒ that is, whether it is feasible or not to solve inequalities at local level ‒ poses the question of whether this criticism is valid for all the aspects/domains of the phenomenon (and whether it is applicable to all planning/policy contexts). Therefore, this research takes into account the local policy sensitivity of the phenomenon.
2.4 The need to monitor (intra-urban) inequality From the previous sections and Chapter 1, it is clear that inequality is becoming an international concern in both developed and developing countries and is being differentiated from traditional poverty. Concern over inequality raises a moral and normative issue that implies compensatory policies such as area‐based policies. In other words, one of the reasons for implementing descriptive and monitoring studies of inequality is to subsequently target the disadvantaged areas and implement compensatory/remedy policies. The resulting patterns or degrees of inequality express the extent to which people’s needs are satisfied and, according to Smith (1994), this depends on how the social structure operates in producing well‐being. It is also evident that, studied at lower levels of aggregation, inequalities become more evident.
Recently, different urban indicators initiatives and governmental reports have expressed the need to use small‐area information and encourage studies on intra‐urban differences (Policy Action Team 18, 2000; UNCHS, 2000a; UN‐HABITAT, 2003b). In small areas, inequalities cannot be hidden and are thus more visible, and the criticism of
7 For further discussion on ecological fallacy in factorial ecology, see p. 30.

21
ecological fallacy is diminished ‒ hence the importance of studying urban inequalities at low levels of aggregation (e.g. intra‐district and inter‐district) rather than higher levels of aggregation. Smith (1994, p. 47), referring to social justice with a territorial dimension, explains that the scale adopted will to a large extent define the problem itself, for the degree of inequality observed will be very much a function of scale. Explaining why scale is important for people in the perception of inequality and (in)justice, Smith states that:
“... relevant to how people perceive their lives in comparison with others is to some extent a function of information mediated by distance. Thus for African‐Americans, the national numerical picture of progress (if this is actually the case) is likely to be less significant than what has happened in their own neighbourhood, and how this compares with other parts of the town or city which they encounter in their daily life” (Smith, 1994, p. 157).
Another case study, carried out in Stockholm by Borgegård et al. (1998), concludes that the evolution of income inequality between 1970 and 1994 varies depending on the geographical level (municipalities and housing areas). “The hypothesis that differences in income between municipalities have decreased over time (1970‐90), while differences between housing areas have increased, has thus been confirmed” (Borgegård et al., 1998, p. 220). Hence, the scale at which inequality is observed is highly relevant. It is clear that the scale factor of the inequality analysis determines the problem to a great extent. Sabatini et al. (2001, p. 29) have studied the scale of the analysis of spatial segregation (high and low), and how in the case of cities in Chile there is a change in the segregation scale from high‐scale to low‐scale segregation. The study indicates that there is more segregation nowadays at lower geographical scales.
It should be noted that perfect equality is an ideal situation and that monitoring studies and GIS‐based indicators should be thought of as tools aimed at helping to reduce or compensate for urban inequalities. Smith (1994), following his own theory of “Justice as equalization”, proposes that “situations in the real world should be judged according to their tendency towards equalization”. Smith also claims that “social justice is manifest in reductions in inequality: in a process of returning to equality”, hence perfect equality is only an ideal.
Within this research, one main case study is proposed, to both explore the relevance of monitoring intra‐urban inequalities and apply a method using GIS‐based indicators.
2.5 Objective, questions and conceptual model The main objective of this research is to develop a methodology that combines the use of urban indicators and GIS as a valid diagnostic and prescriptive tool to generate policy‐relevant information on the complex and multidimensional aspects of spatial inequalities. To fulfil this research goal the following questions are presented: 1. Which aspects of inequality do policy makers find more relevant? In which part of the policy
cycle have they been using indicators and when would they like to use them in the future? Which aspects of inequalities and indicator‐related issues emerge in a city with experience in

22
both indicators and area‐based policies? What problems related to the use of indicators might appear?
The objective of this question is to produce relevant and effective indicators that fit into the Rosario context of policy making, and to identify the usage (or not) of indicators by policy makers on decision‐related issues and to explain the reasons. This stresses the importance of relating the use of indicators to policy and the local context and of orienting the methodology accordingly. Consequently, interviews with policy makers are a necessary component of the case study. Besides, it is intended to learn from the experience of countries with more experience in the use of indicators and the application of compensatory policies. This gives a cross‐national comparative dimension to the research, with clear benefits such as learning from the previous experiences and lessons of other countries. 2. What set of indicators is valid for describing spatial inequality within urban areas; how can
they be defined and operationalised; and what are the current data needs, sources and gaps? In what way is it possible to combine the different aspects of inequality into composite indices and how might values influence their operationalisation?
This question aims at generating a scientifically valid set of indicators that both reflects the different aspects of intra‐urban inequalities and considers small‐area data availability at local government level. The consequence of this approach is that the ultimately selected matrix of indicators might be limited by some data restrictions and availability within the local context. However, since indicators should be policy‐related, it is not possible to perform this research without a concrete case study. If there are data gaps and needs, they will emerge from this research.
3. How can the methodology to monitor spatial inequality at the local level be improved by the
combined use of GIS, urban indicators and other specific methods, in order to better understand the multidimensional aspects of the phenomenon? How can inequalities or gaps be communicated and made visible?
This question is formulated because it is necessary to develop a methodology that uses GIS to construct indicators that take into account the intra‐urban scale and the different aspects of inequalities. This approach follows a social justice perspective and it implies that local policy makers want to apply compensatory and remedy policies.
4. What are the circumstances and the processes behind increasing, decreasing and/or
consolidating spatial inequalities as measured by indicators over a period of time? This question derives from the need to gain more insight into the inequality problem and to see how the different aspects relate to each other and evolve over time. The reason for including this question is that it is necessary to prove that the selected set of indicators is able to monitor inequality and communicate gaps and explain how certain problems tend to concentrate in specific areas, generating uneven geographies.

23
2.5.1 Case study selection The city of Rosario (Argentina) was selected as a case study because of the following characteristics. In Rosario, there are unequal levels of quality of life for a high percentage of the population. Secondly, the city falls within the context of a city under both the influence of globalisation (privatisation of services, deregulation, etc.) and a local decentralisation process. It is within this process that policy makers express their intentions to improve the welfare level of the people living in its districts and reduce disparities. Part of this research incorporates interviews with local policy makers to see how they perceive inequality, which aspects they find more relevant, and how they use indicators to monitor these processes and design and apply compensatory policies. The local knowledge of the author, and therefore the possibility to access data and communicate with policy makers, was another determinant for the selection of Rosario as a case study. For both case studies and cross‐national research, the inclusion of the home country of the researcher represents some advantages. One clear advantage for a comparative evaluation is the possibility for the researcher to refer back to his/her local experience while carrying out the fieldwork in a foreign country (Masser, 1986, p. 17).
As explained in Chapter 1, the city of Liverpool (UK) was chosen to contrast the interview findings in Rosario. The reason for choosing Liverpool was based on the fact that, like Rosario, it is a city affected by inequalities, with the local authority strongly committed to reducing such inequalities. This commitment is expressed in the Liverpool City Council Unitary Development Plan (UDP), as well as in its Neighbourhood Renewal Strategy and in Liverpool Vision. The main goal of the Rosario case study is to orient a planning support methodology to a concrete local policy context and to explore the suitability of the methodology to monitor intra‐urban inequalities, using GIS and indicators. The goal of the complementary case study in Liverpool is to examine how indicators are being used in a city with experience in both the use of indicators and the implementation of area‐based policies to tackle inequalities. Besides, it is also possible to find out what problems related to the use of indicators might appear.
2.5.2 Conceptual model The following conceptual model (Figure 2.1) relates the main concepts discussed in previous sections. This research follows a social justice perspective, with fairness in distribution and proportional equality based on needs. Equal opportunity and equal access are also the criteria adopted. This perspective is closely related to social exclusion, where those who are denied equal access to rights and resources are excluded. This research focuses more on lessening inequalities rather than on poverty; “minding gaps” and compensating uneven geographies are the issue. With GIS‐based indicators, this research proposes a methodology to monitor the multidimensional characteristics of spatial inequalities, both the unequal conditions of quality of life and the unequal distribution of opportunities related to unequal access to physical and social infrastructure8. The emphasis in Chapter 3 is on the measurement of inequalities.
8 The different aspects and indicators for every domain are further explained Chapter 6.

24
Characteristics of spatial inequality
Unequal conditions Unequal access
Spatial inequality
Monitoring
Resource allocation
Area-based policies
GIS + indicators
Inequality
Social justice perspective
Redistributing / compensating / equalising
Soc
io-e
cono
mic
theo
ry
behi
nd in
equa
lity
Spa
tial t
heor
yA
ddre
ssin
g sp
atia
l ine
qual
ityM
onito
ring
spat
ial i
nequ
ality
Local policy context
Fairness in distribution
Proportional equality
Needs
Local geographical
context
Data issues
Figure 2.1 Conceptual model

25
Chapter 3 Measuring inequality The objective of this chapter is to conceptualise indicators and in particular urban and socio‐territorial indicators. Different aspects of inequality are explored as a precondition to establishing scientifically and policy‐valid indicators. Furthermore, the role of GIS in the construction of indicators is discussed before introducing the empirical model of this research. The interest in measuring inequalities can be traced back to the 1960s and 1970s, coinciding with the growing interest in social indicators. Smith (1994) explains that the first interest in national levels of life quality, development or well‐being can be traced back to the 1960s. The first initiatives regarding indicators to measure international disparities came from the United Nations. The UNDP introduced the Human Development Index ‒ not without some criticism of the combination of life expectancy at birth and the adult literacy rate with gross domestic product per capita. Another criticism is that, even though national wealth might increase, the people’s well‐being does not necessarily improve in the same proportion (Smith, 1994, p. 143). In that sense, gross product per capita at national level hides disparities within the country and between cities. Inequality is specifically addressed by the UNDP taking a smaller‐scale perspective. In this direction, the Human Development Report 2000 (UNDP, 2000) describes the importance of using disaggregated indicators by district, gender, ethnicity and income group as follows:
...“many countries continue to focus the resources and opportunities on those already privileged. Across a range of countries, public health and education spending is routinely concentrated on providing services for the better‐off, reinforcing the divide. By the principles of rights, it is an imperative to reorient resources towards the marginalized so that long‐standing and systematic discrimination is overcome” (UNDP, 2000, p. 96).
In the report Assessing Progress in Human Rights and Human Development, the UNDP (2000) includes an inequality perspective in assessing progress, taking into account the worst‐off and best‐off regions, rural and urban, worst‐off and best‐off ethnic groups, no education and higher education. Over time, disparities between social groups are assessed to see if they have widened or narrowed. UN‐HABITAT, one of the agencies with more experience in the diffusion of urban indicators, expresses in its report Slums of the World the relevance of monitoring the implementation of the Millennium Development Goals, in particular the one setting the target to improve the lives of at least 100 million slum dwellers by the year 2020 (UN‐HABITAT, 2003b).

26
3.1 The role of urban indicators The advantage of using urban indicators to measure inequalities is that they can communicate in a simple way and can detect and quantify inequalities and monitor tendencies towards (non‐)equalisation. They can also be used to prioritise areas of action and policy intervention. Indicators simplify complex, and often abstract, phenomena into quantifiable measures. Indicators have three functions: to simplify, to quantify, and to communicate (Adriaanse, 1997). According to Adriaanse (1997, p. 111), “The main function of an indicator with reference to decision making is its compass or early‐warning function, given the trend it shows over time. This is especially valid if the trend can be related to a set policy target.”
An interesting perspective given to the term by Innes (1990) is that an indicator focuses on and renders only intentionally selected areas of the reality. She puts it this way: “An indicator is simply a set of rules for gathering and organizing data so they can be assigned meaning”...”An indicator, like a piece of research, highlights certain aspects of a situation at the expense of others. It allows observers to ‘see’ the world through a particular lens” (Innes, 1990, p. 5). This definition clearly poses the importance of choosing a set of indicators considering in advance what types of phenomena and problems are intended to be rendered and communicated. In this case, spatial inequality being a heterogeneous, multidimensional and complex phenomenon requires precise delimitations of its different aspects.
Depending on the function, and coinciding with the different phases in the policy cycle, indicators can be classified as follows9:
• Descriptive or baseline indicators: used to present a certain state or process. They
describe the present situation and are useful for targeting and identifying need areas. They usually represent the starting point before policies are applied.
• Normative or target indicators10: used to evaluate and compare the result of an
indicator with a standard that acts as a norm (usually related to policies). With these indicators, goals and objectives can be set after the areas of need have been identified with the descriptive/baseline indicators.
• Performance or outcome indicators: used to present achievements by measuring
whether the policy goals have been achieved, as well as the level of people’s satisfaction with the results. A performance is a value judgement that results from the comparison of an existing situation with a goal or target that has been fixed in advance. Outcome indicators should not be confused with output indicators. In this respect, the New Economics Foundation clearly defines the characteristics that distinguish outcomes from inputs and outputs (Table 3.1):
9 Adapted from Adriaanse (1997, p. 111) and Parnell and Poyser (2001). 10 A further distinction can be made between targets, which are levels that must be met, and thresholds, which are levels that should not be exceeded (Maclaren, 1996).

27
Table 3.1 Measuring outcomes or outputs Inputs Outputs Outcomes
Definition Resources (money, time) used for achieving particular aims
Project activities (deliverables) carried out in order to achieve aims (e.g. a community garden)
The effect or impact of the project activities
Measuring
How much resource has been spent on activities aimed at achieving this goal?
What activities have been carried out in order to achieve the aims? How have they been carried out – good/ bad practice?
What has been the impact of the project activities? How far have aims been achieved?
Features
Easy to measure, can be measured early in project life. Less meaningful in terms of project aims.
Easy to measure later, or at the end of a project. Fairly meaningful regarding project aims.
Most directly related to project aims. Impacts on people take time. Lots of them tend to happen after the lifetime of a project. The impact of a local project can be influenced by external factors.
Source: Prove It! (New Economics Foundation, 2000)
One of the international agencies that helped to define the role of indicators, and urban indicators in particular, is UN‐HABITAT. This United Nations agency for human settlements has developed the Urban Indicators Programme to compare cities from countries around the world. This programme completed two phases between 1994 and 2001 and became the first urban indicators initiative at global level. It promotes the use of GIS and global urban databases within the Global Urban Observatory11 (UNCHS, 1999). UN‐HABITAT presents the Urban Indicators Programme as part of a strategy for the development of sustainable human settlements:
“Increasingly, the world’s problems are urban problems. How we anticipate, recognize, measure and interpret urban problems and how we respond to them in policy will determine the overall sustainability of human development“ (UNCHS, 1995).
UN‐HABITAT considers that urban indicators should be clearly related to urban policy goals and capable of being changed by the use of policy instruments. Some of the criteria for selecting indicators, according to UN‐HABITAT, are that they should be important for policy, easily understood, and should be able to be collected in a cost‐effective way and on a regular basis (UNCHS, 1995, p. 18). Validity, meaning the extent to which the measure reflects the phenomenon or concept, and sensitivity to changes in the phenomenon are the main criteria according to Innes (1990).
11 “The Global Urban Observatory is an international capacity‐building network, established to help to meet the goals of the Habitat Agenda, the World Summit on Sustainable Development, and Agenda 21”. Source: http://www.unhabitat.org/press2000/sign.asp; accessed 17/07/2003.

28
Another important criterion is that indicators should be disaggregated by sex, age and geographical area where special needs and equity are policy issues (UNCHS, 1995). This criterion highlights the importance of using disaggregated urban indicators, which is also reflected in other initiatives. The Urban Audit project, a European indicators initiative, uses indicators within subdivisions of cities (e.g. districts) and clearly states the objective to address inequality and social exclusion (European Communities, 2000). The aim of disaggregating indicators is to “pinpoint major disparities in terms of socio‐economic cohesion of the city or conglomeration. Comparisons between cities in terms of internal equilibrium can also be made” (Grubert, 1997, p. 128).
According to Abrahamson (1997, p. 131) and referring to the European context, “it is virtually impossible to come by up‐to‐date data concerning inequality, poverty and social exclusion”...”and it is even more difficult to come by very reliable data”. The comparisons he makes among different countries in Europe are also based on the perception of social exclusion, poverty and welfare. However, the only aspect taken into account in inequality is income inequality.
One of the difficulties in collecting indicators at intra‐urban level is the lack of data other than census data – most of the research done on spatial inequality is based on this source. This poses the problem of finding alternative sources (other than census data). With this in mind, this research starts to address this issue by using points of expressed need (Martinez, 2000). Indicators from census data are good for measuring indirect need (or demand) but they cannot measure expressed need coming from the population, nor do they reflect the “distribution of opportunities” inherent in the accessibility to social and physical infrastructure.
Taking into account that indicators should be available for geographical areas and at the same time be measurable using immediately available data (UNCHS, 1995), this research proposes to emphasise the search for alternative perspectives in the measurement of inequalities, which include, for example, expressed demand or perception of the problem by the population. The use of administrative data together with census data aims in that direction.
Indicators constructed from census data and factor analysis are also common methods used in deprivation and well‐being studies (e.g. Smith, 1973; Langlois and Kitchen, 2001). In the following section, different studies of patterns of inequality and socio‐territorial indicators are analysed.
3.2 Socio-territorial indicators: studies of patterns of inequality Among the first studies of social conditions, including the use of territorial social indicators at sub‐city level, were those of Booth (1902) in London12 (Pacione, 2001). In the 1920s, “natural areas” were described by the Chicago ecologist school as a “geographical area characterised both by a physical individuality and by the cultural characteristics of the people who live in it” (Zorbaugh, 1961, in Pacione, 2001, p. 348).
These natural areas were criticised for being artificial units rather than “meaningful community areas related to the broader social, economic and cultural changes taking place in society” (Pacione, 2001). Another problem is that they depend on
12 C. Booth (1902) Life and Labour of the People in London. Macmillan, London.

29
a limited set of variables and that they have no theoretical base to justify the use of the selected variables. In contrast, the work on social area analysis of Shevky and Bell13 (1955, in Pacione, 2001, p. 350) used a multivariate classification method derived from a theory on social change based on three main expressions or constructs:
• Social rank or economic status referred to the tendency towards a more
stratified society in terms of work specialisation and social prestige. • Urbanisation or family status described a weakening of the traditional
organisation of the family as society became more urbanised. • Segregation or ethnic status suggested that over time the urban population
would tend to separate into distinctive clusters based primarily on ethnicity.
Several studies of patterns of inequality and spatial differentiation within the city have been based on indicators of personal income (e.g. Smith, 1973; Smith, 1994; Chakravorty, 1996). However, as Knox and Pinch (2000, p. 100) put it: “While socioeconomic differentiation is arguably the most important cleavage within contemporary cities, it is by no means the only one.” Besides, for most cities there is also a data availability restriction, since data on personal income is not collected at low levels of aggregation. This is the case for many cities in the developing world as well as in developed countries (Broadway and Jesty, 1998; Wessel, 2000).
Factor analysis and multivariate statistical techniques have become one of the most widely used techniques in social research and are now generally the preferred approach for dealing with the complex question of measuring urban socio‐spatial differentiation (Knox and Pinch, 2000). The relationships and spatial patterns, which the factors describe, are known as factorial ecology.
Factorial ecology constructs the areas with an exploratory analysis of a larger data set in an inductive way, compared with the social area approach, which does it deductively or based on theory (Pacione, 2001). Factor ecology uses factor analysis to derive from a large set of variables a set of factors. Each of them can be thought of as a macro or “super variable” that represents a cluster of highly correlated census‐based variables. The meaning of each factor can be allied with the original variables that it is most strongly associated with. For example, if a factor is associated with many variables, such as low education level, bad housing quality and unemployment, it can be labelled as a measure of multiple deprivation or social exclusion. Block groups can be scored on each of the factors, and by mapping them it is possible to reveal the spatial distribution and patterns of social conditions within the city (Pacione, 2001). Three general factors have commonly emerged in factory ecology studies of US cities, and they are socio‐economic status, family status and ethnic status. All three factors may operate simultaneously, “if socio‐economic status were the sole factor, cities would tend to divide into sectors; if family status were dominant, the spatial order would be concentric zones; and if ethnicity were the major factor, the pattern would be one of multiple nuclei” (Erwin, 1984, in Pacione, 2001, p. 351‐352).
13 E. Shevky and W. Bell (1955), Social Area Analysis. Standford University Press, Standford, CA.

30
However, factor analysis does come in for some criticism. Knox and Pinch, stress that one of the major shortcomings of these factorial ecology studies is that the combination of different input variables ignores other important aspects of urban life, for example, environmental quality, accessibility of facilities, and social problems such as drugs and crime (Knox and Pinch, 2000, p. 119). According to Soja (2000), it is possible nowadays to find many more “pluralistic axes of inequality formation: class, race, ethnicity, gender, sexuality, age, residential location, immigration status, housing, environmental justice, cultural identity, and so on”.
Another limitation of the methods of factorial ecologies is that most of the analyses use exclusively decennial census data. For this reason, some of the socio‐economic characteristics or complex phenomena such as people’s lifestyle or activity patterns are not available since they are not collected (Knox and Pinch, 2000). These authors consider that the territorial units for which aggregate census data are published may also have a considerable effect upon the analysis, since census sub‐areas will not match actual patterns of residential variation on the ground. The implicit assumption in the methodology is that these territories are homogeneous. Besides, census sub‐areas represent only one of the very large number of ways that a city can be subdivided, thus raising the question as to whether the same factorial ecology would result from different spatial frameworks. Knox and Pinch (2000, p. 123) also warn about the dangers of ecological fallacy (i.e. making inferences about individuals using data based on aggregates of people): “Thus not everyone in a deprived area is necessarily deprived and not every deprived person in an area of ‘multiple deprivation’ is necessarily multiply deprived”14.
The criticism of traditional factorial analysis was reflected in a renewed interest in social indicators in the 1990s, mainly because of growing social inequality in Western societies and a focus on ideas of social exclusion that defines poverty also in terms of social participation (Knox and Pinch, 2000).
Smith (1973, p. 120‐134) carried out a study of the city of Tampa using 47 “intra‐city indicators” grouped into six criteria indicators (based on economic status, environment, health, education, social disorganisation, and participation and equality) and a general index to measure the general social well‐being. Some of the weakness of this method, according to Knox and Pinch (2000), is that even though that social well‐being can be regarded as the product of factors weighted according to their – relative – importance to the people whose well‐being is under consideration, the importance given to housing, health and accessibility of recreational facilities varies even among socio‐geographical groups. People’s values vary according to their income, to their stage in the family life cycle, and to their membership of a particular religious or cultural group. Knox and Pinch consider that the issue of these quality‐of‐life studies is whether variations in people’s values are great enough to “blunt the effectiveness of unweighted bundles of statistics such as those used by Smith“ (2000, p. 121).
A similar criticism is expressed by Innes (1990), who considers that an aggregated index such as social deprivation has virtually no diagnostic value: “To say
14 Similar criticisms apply to area‐based policies; for further details see p. 20.

31
that certain areas get high scores is not to give an idea what to do”15 (Innes, 1990, p. 223). She also agrees on the idea of keeping dimensions separate and letting decision makers apply their own value judgements and models. Regarding the difficulties of explaining them to users, Innes gives the example that they would “understand better what amenity level in an area was if they had one measure of park space, one of indoor recreation and one for shopping facilities than they would with only one mysterious measure combining all three” (Innes, 1990, p. 224). This poses the problem of values and choices in weighted indices, which is added to the difficulty of clearly communicating them to policy makers.
3.3 Accessibility indicators As it has been discussed in the previous section, inequality should not be limited to the measurement of economic inequality. The use of indicators to measure accessibility is relevant to determining how equal the access is to social and physical infrastructure, which describes another aspect of quality of life and the distribution of opportunities. As Knox and Pinch put it: “Distance also emerges as a significant determinant of the quality of life in different parts of the city because of variations in physical accessibility to opportunities and amenities such as jobs, shops, schools, clinics, parks and sports centres. Because the benefits conferred by proximity to these amenities contribute so much to people’s welfare, locational issues also often form the focus of inter‐class conflict within the city, thus giving the spatial perspective a key role in the analysis of urban politics” (Knox and Pinch, 2000, p. 9).
Sometimes, the provision of services can be patterned, that is, there is a correlation between certain levels of provisions and the ecological character of the neighbourhood. Some studies try to explain whether there is a bias in favour of certain social groups and areas in the city (Pacione, 2001, p. 341). According to Pacione, in all cities there is to some extent injustice in the provision of public services. He argues that this inequality is due to a dynamic relationship, rarely in balance, between needs and resources.
According to Knox (1982, p. 167), the urban residential structure is the result of not only the simple interaction of housing demand and supply but also the competition of groups and the conflicts which occur for the allocation and location of services and amenities. A result of this is competition to gain access to these facilities and be positively influenced by the effect of externalities. Externalities are effects of the activity of one group on the welfare of others. An example of a negative externality effect is that caused by factory pollution; a positive eternality effect can be produced by the presence of new green areas in the neighbourhood. The intensity of externality effects is usually a function of relative location; the indirect benefits are greatest for those living nearby and diminish with increasing distance from them. In this context, as suggested by Knox
15 Remarkably, a similar perspective was given by one of the interviewees during this research fieldwork. Interviewee 12 was asked if he was suggesting the use of a composite indicator of quality of life and whether he preferred a single figure or disaggregated indicators, and he replied: “One number is very difficult because you know that this number is composed of the evaluation of a group of data and I consider important to evaluate those data [separately] … it is important how you compose it rather than the final result.”

32
(1982), those with the greatest wealth, the most power and the best knowledge will be best placed to gain the benefits of positive externalities and to reject activities which generate negative externalities. Some facilities such as shopping areas, restaurants, private schools and private clubs are located by private decision makers based on potential profit. The privatisation of services in many cities during the 1990s has increased the social marginalisation of certain neighbourhoods identified as non‐profitable by the private sector. Reinforcing social exclusion, neighbourhoods are usually marginalised in financial services, food retailing and utility sectors such as energy and information technology (Speak and Graham, 1999).
The locations of public schools, parks, hospitals or health centres are those that can be directly determined by public policy makers. The inequalities arising from these phenomena can be diminished by a better‐planned location of public facilities.
To determine how just the distribution of public services is in a city (and hence the justness of patterns of collective consumption), it is possible to measure and compare them with normative criteria based on (usually a combination of) locational efficiency and equity based on need (Pacione, 2001). Two approaches are usually mentioned in location accessibility: personal and locational accessibility. In the case of personal accessibility, the resources and opportunities that each individual has for performing their daily activities are studied; different social groups might have different space‐time prisms (Pacione, 2001, p. 338). In the case of locational or place accessibility, the distance or time that separates origin points (centroids of block groups as origins) from the number of resources available (as destination) is measured.
Spatial inequality in terms of accessibility has been studied by Talen (1998; 1999) to assess to what degree the distribution of urban public services is equitable. Le Grand (1991, p. 108, cited in Smith, 1994) clearly explains the issue of justice in accessibility: “Poor families, or those who for some reason are ‘locked into’ a location that is poorly endowed with facilities, could well be viewed as suffering inequitable differences in access.” From the social exclusion perspective (described in a previous section), it can be said that they are suffering the territorial aspects of social exclusion. Talen (1998) analyses the location of public facilities according to a need‐based distributional standard. The author argues that “distributive policy should recognize the fact that some citizens are more able than others to offset reductions in public facilities and services” (Talen, 1998, p. 25).
Following Talen and Anselin (1998), a distinction can be made between the traditional discrete notion of access implied by the “container” view and accessibility indices that are continuous over space. The container view is defined as the number of facilities in the unit of observation (e.g. census tract or district). They point out that with this approach, spatial spillovers or spatial externalities to other tracts are not taken into account, since people cannot be explicitly excluded from using a park or library in any part of a city based on their residential location. However, there are other definitions and measurement approaches where the access is characterised by the relationship between origin and destination. Accessibility is measured between residential locations (origin proxied by the centroids of block groups) and the public service facilities in an urban area (destination). Three different accessibility measures are compared within this approach:

33
• gravity potential: facilities are weighted by their size and adjusted for the
“friction of distance”. • average travel cost: a measure of the total or average distance between each
origin (census tract) and all destinations (public facilities). The advantage of using average travel cost is that the value is expressed in simple distance units. A lower value indicates better accessibility (Talen and Anselin, 1998).
• minimum distance: this reflects the distance from a residential location (census tract) to the nearest facility.
The container index and the minimum distance measure mostly ignore spatial externalities associated with public service facilities. In contrast, according to Talen (1998), both the gravity potential and the average travel cost measure capture the spatial externalities of all the facilities in the urban area. Talen (1998) justifies the selection of these access measures because of their ease of interpretation, their prolific use in the literature, and their lack of computational burden and data requirements. Citing Koenig (1980), Talen says that policy planners and decision makers can understand these simple measures better than more complex mathematical models. On the other hand, she considers that the following difficulties are associated with the building of equity maps:
• the ecological fallacy/modifiable areal unit problem, which occurs when
characteristics of aggregate data are also assumed to be present in the individual data;
• the temporal lag problem, which results from the fact that the relationship between facility distribution and population distribution (which determines the distribution of needs) is dynamic;
• the problem of defining accessibility, which can be very complex in its definition and measurement.
The issue of personal accessibility and time constraints for different social groups should be added to the listed difficulties (Kwan et al., 2003). Accessibility of jobs, services and amenities must be carefully assessed in terms of people’s time budget (Knox, 1982). Effective accessibility of particular locations will depend, then, not only on their physical proximity but also on whether people are free to make the journey in the first place. Some social aspects and gender issues are involved in the restrictions that affect effective accessibility. Women living in the periphery and women‐headed households (including unmarried, divorced and widowed women with young children) face particular hardship wherever they live, because the constraints imposed by the opening hours of day‐care centres, nurseries and schools tend to limit job opportunities to a very narrow range (Pickup, 1976, Pred and Palm, 1978, in Knox, 1982). They also face the greatest constraint on “free time” as they have to combine income earning, child rearing and household maintenance.
If the accessibility analysis is not limited to the problem description but also extends to prescriptive planning and policy evaluation, normative accessibility indicators are needed. In that case, the existing situation has to be compared with a goal

34
or target. Since this is a disciplinary matter, the ideal distances to services have to be found based mainly on planning agreed standards or based on other similar previous experiences. In the case of Rosario (Argentina), large sectors of the population are still without private transport. In 1993, 62% of the families in Rosario did not have a car (Municipalidad de Rosario, 1997). In cases like this, the actual distance from home to basic education, primary health‐care facilities and especially the family doctor’s surgery is particularly critical. About 750 m is often regarded as the upper limit for mothers with pre‐school children and for the elderly; and travelling much more than this by public transport may involve a long wait or a change of bus (Knox, 1982). Sometimes the situation for the elderly is even worse; the optimal distance can be defined as a walking distance of 250 m for less‐mobile elderly and 500 m for mobile elderly (Grothe and Walter, 1992).
The use of buffer distances can be criticised from the point of view that sometimes it is difficult to define the best possible accessibility distance. Besides, buffers that define only two classes of areas (inside and outside the buffer distance) generate a dichotomy that can be criticised for being too restrictive. To some extent, a GIS buffer operation can still help in the identification of areas that fall outside the optimal catchment areas of basic social infrastructure (Martinez, 2000).
3.4 Scientifically and policy-adequate/valid indicators The measurement of poverty in Argentina was influenced by the concept of a defined basket of food. In particular, this influenced the measurement of the poverty line16 (línea de pobreza) and extreme poverty line17 (línea de indigencia). As discussed in Chapter 2 (subsection 2.1.5), inequality should be differentiated from the concept(s) of poverty, and a distinction should be made between absolute and relative poverty.
The absolute or subsistence definition of poverty considers that a family would be living in poverty if its “total earnings are insufficient to obtain the minimum necessaries for the maintenance of merely physical efficiency” (Rowntree 1901, p. 186, in Pacione, 2001). This notion of minimum level of subsistence influenced the post‐World War II social welfare legislation, where the system of benefits was based on “calculations of amount required to satisfy the basic needs of food, clothing and housing plus a small amount for other expenses” (Pacione, 2001, p. 291). Absolute poverty is then an institutionally defined norm (Castells, 1999, p. 71).
However, Pacione (2001, p. 291) explains that “if on the other hand we accept that needs are culturally determined rather than biologically fixed, then poverty is more accurately seen as a relative phenomenon”. The same author considers that relative poverty includes a broader definition of needs, which includes job security, work satisfaction, benefits and components of the “social wage” such as the use of public services, and satisfaction of “higher‐order” needs such as status and self‐esteem.
16 Poverty line: INDEC considers a household under the poverty line when it cannot afford a basket of food with the minimum amount of proteins and calories; plus costs related to transport, health, education and clothing. 17 Extreme poverty line: INDEC considers a household to be under the extreme poverty line when it cannot afford a basket of food with the minimum amount of proteins and calories.

35
In Argentina, the National Institute of Statistics and Censuses (INDEC) considers a household to have unsatisfied basic needs (NBI) when it meets any of the following conditions: Physical characteristics of the dwelling, which represent critical levels of housing needs:
• Households with more than three persons to a room (overcrowding); • Households that live in housing of unsuitable type18; • Households without a flush toilet.
Household‐related characteristics, which represent the incapacity of the household to obtain enough income for adequate living:
• Households with any child of school age who is not attending school (this
represents lack of access to basic education); • Households with four or more persons per employed member and the
head of the family with a low level of education (less than second grade).
In some Latin American countries, special efforts have been made to determine areas and target groups in order to ensure that the benefits from the policy’s investments reach the most needy (Hall and Conning, 1992). In Chile, within the national government, the National Regional Development Fund has the intention of detecting households whose basic human needs are unsatisfied. The goal is to identify pockets of poverty at the municipal level.
The methodology used in Chile to determine a household with unsatisfied basic needs is very similar to that used by INDEC in Argentina. Two primary dimensions of poverty are considered. The first dimension deals with physical conditions of the dwelling, availability of potable water, availability of sewage, and level of overcrowding. The second dimension applies when the household income level is below that needed to meet the cost of a basic “basket of food” and other basic needs such as clothing, health and housing. Facing the problem that data on household income are not collected in the census, vulnerable households are classified as those with more than three dependants per person actively employed and a household head with four or less years of schooling.
To locate the most vulnerable cases the households are classified in four classes (See Table 3.2). The most disadvantaged are those falling in class A, since they are classified as vulnerable households living in deficient houses. Households living in deficient houses but in non‐vulnerable family circumstances fall into class B. Households with non‐deficient housing but with incomes below the poverty line are in class C (normally “new poor”). The best situation is found in class D, where the households are not vulnerable and the houses are non‐deficient.
18 Dwellings considered unsuitable are those built of non‐permanent materials; rented rooms (pieza de inquilinato) or pensions; camps; bed and breakfast establishments; huts or dangerous housing; and households that meet at least one of the following conditions: no provision of piped water inside the house, no flush toilet, floor of earth or other material that is not ceramic, tiles, mosaic, wood, carpet, plastic, cement or fixed brick.

36
Table 3.2 Classification of households according to level of vulnerability (Hall and Conning, 1992) Below the poverty line
(vulnerable households) Above the poverty line
One or more needs (deficient houses) A B
No needs C D
The measurement of “unsatisfied basic needs” (NBI) without the poverty line
approach can hide the existence of the so‐called “new poor”. Contrary to the structural poor, the new poor do not live in the slum areas, they have smaller families, they are better educated, and they have landed up in this situation owing to job loss or a drop in real income (Minujin, 1995). In NBI indicators, households with a head of the family with a low level of education are considered unable to obtain enough income for adequate living, hiding again the situation of the new poor, where the head of the family normally has more years of schooling. The lack of data on income and the use of a proxy such as education level of the household head might be a drawback of the NBI approach.
The previous discussions on how to measure poverty and unsatisfied basic needs indicate the importance of selecting the right set of indicators to measure intra‐urban inequalities.
An indicator describes “a reality” in a partial and subjective way, because it focuses on certain aspects at the expense of others (Innes, 1990). An indicator is valid (for a particular perspective) if it is consciously selected taking into account a specific perspective and a policy goal. In subsection 2.1.1, it was explained that within a social justice perspective proportional equality could be approached following a need criterion. In this case, to be valid, indicators should be able to describe needs and to differentiate between worst‐off and best‐off areas. This is also related to the issue that indicators should be able to communicate gaps.
A pre‐selection of aspects/domains of inequality can be based on the existing literature, as well as recognised urban indicators programmes. Different scholars have identified several domains related to quality of life, social well‐being, and inequality and deprivation problems. Smith (1973) focuses on six criteria to assess social well‐being19: economic status, environment, health, education, social disorganisation, and participation and equality20. The same author (1973), after reviewing the contents of the
19 Smith (1973) indicates that, although quality of life is sometimes taken as synonymous with social well‐being, it is at “the more concrete or specific end of a continuum of abstraction that descends from human happiness through the concept of the quality of life to social well‐being”. 20 Each criterion has several sub‐aspects:
• economic status (income, employment, welfare); • environment (housing, streets and sewers, air pollution and open space); • health (general mortality, chronic diseases); • education (duration); • social disorganisation (personal pathologies, family breakdown, overcrowding, public order
and safety, delinquency); • participation and equality (democratic participation, equality – racial and income distribution).

37
literature of the social indicators movement, finds full agreement on the inclusion of four conditions: income and wealth, employment, health and education21. Smith (1973) also finds a “broad measure” of agreement on social status and mobility, public order and safety, the state of the family, and the living environment. Liu (in Wong, 1994) mentions five goal areas to represent the quality of life in American cities: the economic, political, environmental, health and education, and social areas. Pacione (1995) derives a multiple deprivation factor from a list of 64 variables related to social, demographic and economic aspects of deprivation. Some authors emphasise certain aspects depending on the research focus, such as environment within urban sustainability indicators (Mega, 1996; Mega and Pedersen, 1998) or material and social deprivation within deprivation indicators (Broadway and Jesty, 1998). Kearns et al. (2000) address six deprivation domains (housing, crime/environment, health, education, labour market and poverty) and Langlois and Kitchen (2001) address another six deprivation dimensions: demography, income, education, language, housing and employment.
The aspects and domains suggested by the scholars were compared with those considered by recognised international and governmental agencies involved in the collection of indicators and more related to policy goals22. All the reports analysed mention the following aspects, which, as can be noticed, do not differ from those suggested by scholars:
• Income (socio‐economic development/poverty); • Employment/unemployment; • Health (and social services); • Education (and skills and training); • Shelter/housing (access, affordability and appropriateness); • Environment.
Less relevance (in more than five of the reports but not all) is given to:
• Crime; • Infrastructure (access, affordability, provision); • Governance (empowerment, participation); • Gender equality and empowerment of women; • Transportation.
Some of the topics mentioned only once are related to a particular interest or goal of the agency involved, such as geographical access to services; improving desirability of urban living; removing dereliction and encouraging renewal; increasing self‐containment and improving balance of work and home‐life; improving attractiveness of town centre and city‐fringe locations; hunger; combating HIV/aids, malaria and other diseases; human rights and democracy; culture and recreation. 21 These conditions coincide with the highly prioritised aspects of inequalities considered by the policy makers in Rosario during the interviews in the case study. 22 See Annex 1: List of reports on urban indicators, and Annex 2: Policy areas and domains under several indicators initiatives.

38
In this research, after analysing the existing literature on indicators and the inequality problem (Section 2.1), two axes are distinguished with the following domains:
(un)equal conditions of quality of life
• social environment; • physical environment.
(un)equal distributions of opportunities / (un)equal access to • social infrastructure; • physical infrastructure; • virtual infrastructures (nets, ICT ‒ “switched off areas”).
Some authors (Innes, 1990; Maclaren, 1996) suggest multiple stakeholder participation in the development of indicators. In this research, it was decided to interview local policy makers to refine the selection of inequality aspects following a policy relevance criterion (Chapter 5).
3.5 The role of GIS in the construction of indicators Webster (1993) describes the role of GIS in planning and conceptualises the “nature of planning” as “an act of government intervention into the land and property markets in order to correct certain market failures and thus raise the social welfare”. He also describes the decision‐making process and the scientific inputs required for each decision‐making component (Table 3.3).
Table 3.3 Decision making component and the role of indicators. Adapted from Webster (1993)
Decision-making component Scientific inputs Indicators
Problem identification Description and prediction Descriptive and baseline indicators + GIS
visualisation
Goal setting; Plan Generation; Evaluation of alternatives; Choice of solution
Prescription
Descriptive indicators; Normative or target indicators + GIS analysis (communication role in participatory planning)
Implementation Description, prediction and prescription Normative indicators + GIS analysis
Monitoring (the implementation of the plan and the problem)
Description and prediction Idem problem identification + performance indicators

39
The first step, problem identification, is understood “to involve the measurement of the demand for public goods, including the measurement of negative externalities that may require the supply of regulatory goods”. The identification of current problems is concerned with current market failures that demand public‐good provision, and is a necessary part of “present time” planning intervention and other forms of direct investment in the built environment. Indicators can be used in all the stages described by Webster. The visualisation aspects of GIS, together with descriptive indicators, are ideal for the problem identification phase. During goal setting and the plan formulation phase, normative indicators and GIS analysis capabilities are suitable.
Data organisation, spatial analysis and visualisation are the main advantages of using GIS in the descriptive phase of planning (Webster, 1993). Data organisation and management are among the advantages of GIS, which facilitates the storing of data from diverse data sources as multiple attributes of geographical space referenced by some form of geocode. Webster explains that a simple representation might model census tract boundaries as a polygon system ‒ the polygon identifier becoming a key that links all data having some functional relationship with the polygon (1993, p. 722). The same author indicates that in a vector database, where data are organised by their spatial features, with each having a geometric definition and descriptive attributes, a screen display may be used to select features of interest. In this way, a GIS is able to answer with indicators questions such as “what is the percentage of households living in overcrowded conditions in a certain district?”.
Thanks to the spatial analysis capabilities, within a GIS it is possible to generate new information by explicit spatial processing of a single data layer or multiple layers. An example of this is the creation of accessibility buffers or the calculation of average travel cost to a specific social infrastructure such as primary health‐care facilities. Huxhold (1991) also observes that analysing spatial data “involves the determination of patterns of data associated with locations and the manipulation of location‐related data to derive new information from existing data”. Though spatial analysis tools were already used by geographers, GIS technology allowed analysts to work interactively with the spatial and attribute data in a way not available before (Burrough, 1986, in Huxhold, 1991). Through analysis (and visualisation) patterns, trends can be identified that may otherwise not be evident (Ghose and Huxhold, 2002).
Visualisation is to some extent the GIS advantage most used and recognised. A case in point would be visualisation for spatial pattern identification such as in studies of patterns of inequality (Section 3.2). In some cases, for example, in the clustering of serious diseases thought to be related to industrial pollution, visualisation is an essential analytical tool that may or may not be supported by more rigorous statistical descriptions of revealed relationships (Webster, 1993). In other cases, visualisation is merely about communication. The differences in housing quality between two districts may, for example, be obvious enough from tabular statistics, but a GIS used to map the differences has a greater impact. The big advantage a GIS offers over conventional cartographic processes is flexibility ‒ in particular the ability to produce rapid responses to ad hoc changes in cartographic parameters, such as interactive changes in the definition of data categories (Webster, 1993). Through visualisation, it is possible to communicate data in an effective way both to government agencies and to the public

40
(Ghose and Huxhold, 2002). GIS visualisation, then, enhances the communication aspects of indicators.
Furthermore, the increasing availability of different GIS software at lower prices and its increasing popularity within policy research, together with the automatisation of administrative records, have contributed to a growing use of neighbourhood indicators in some countries such as the USA (Ghose and Huxhold, 2002).
Research already carried out for the city of Rosario (Argentina) demonstrates the capacity of GIS to integrate different data sources and the possibility to measure demand (expressed need) by combining the use of census data, administrative data and the geocoding capability of GIS (Martinez, 2000). The combined use of indicators of derived demand with expressed demand is an efficient way to detect cases of housing needs where derived demand via indicators shows lower levels of demand or hides the situation completely. This can help in detecting the new poor, normally hidden by many indicators. The geocoding capability of GIS can be used to generate map points of that expressed demand. This can be analysed, overlaid and compared with maps that show different levels of housing needs calculated with indicators derived from census data (Martinez, 2000). The increasing availability of census data in digital format, block group boundaries (the specific geography of the census), and different administrative data sources increases the potential for integrating them into a GIS to construct and analyse inequality indicators.
Other research carried out by Hall and also taking Rosario as a case study shows that GIS can also be integrated with remote sensing to detect pockets of poverty (2001). That study is an example of how the increasing amount of high spatial resolution satellite imagery can facilitate the location and monitoring of slum areas in particular. There is the opportunity to compare the results presented in this book with those obtained by Hall for poverty mapping in Rosario.
3.6 Research design: empirical model The empirical model shown in Figure 3.1 is divided into data collection, data processing and data analysis. Data collection This research incorporates several secondary data sources:
• Census data: Small‐area census data were provided by the National Institute of Statistics and Censuses (INDEC) in digital format for the years 1991 and 2001. They included variables related to population, household and dwelling characteristics (see Annex 5: Variables census 1991 – 2001). Further discussions on the census geography and its characteristics are found in subsection 6.2.1.
• Census tracts: Polygons representing the census geography of 2001 were obtained in digital format (ArcGIS shapefile) from INDEC and the 1991 polygons were digitised on screen.
• Administrative data: Administrative data were obtained from the Municipality of Rosario: demand for housing solutions (Public Housing Service (SPV)), and telephone complaints by citizens (Oficina de Atención

41
al Vecino (OAV)) from 2001. The two databases had a field containing an address to generate point data through geocoding using the street name and the house number. Further details can be found in subsections 6.2.2 and 7.1.3. A similar approach was taken for the location of primary health facilities, schools and day‐care centres, but addresses of the facilities were obtained from the municipality webpage.
• Base map and street network: A base map and a street network ready for geocoding were provided by the Municipal Cadastre Office.
Apart from these secondary data sources, this research incorporated questionnaires and open interviews that took place in Rosario and Liverpool between 2002 and 2003. Details on the characteristics of these interviews are given in Chapter 5.
Reports produced by the Municipality of Rosario and different local governmental institutions in Liverpool were used to analyse the present use of indicators and the application of remedy policies, as well as provide a general overview of the local planning context. Some of the reports are cited throughout this book, mostly in Chapter 4. Data processing Most of the data processing consisted of applying GIS operations and included geocoding, table calculations for the construction of indicators, and several operations for aggregating data at different administrative boundaries. ArcGIS 9 was the software used, the exception being the calculation of accessibility indicators within ArcView Network Analyst. The processing of the 2001 census data was not possible until December 2003, and health coverage and unemployment variables were only obtained later in 2004 at census tract level. Further details on the methodology can be found in Chapter 6. The processing of the interview questionnaires was necessary for the final selection of indicators, and other implications and results are discussed in detail in Chapter 5. The coding and analysis of the Rosario and Liverpool interviews were relevant not only for the selection of indicators but also for the prescriptive phase. Data analysis This stage was subdivided into three parts. The first part was the descriptive phase, where inequality aspects at city, district and neighbourhood levels were mapped and the variables as well as the indicators were explored using descriptive statistics. The majority of the statistics were calculated with SPSS software.
The second part was the explanatory phase. A bivariate correlation matrix was calculated to identify the correlation between the different inequality aspects. The mapping of the GIS‐based indicators helped in the visualisation of gaps, and in the analysis of uneven geographies and the variation between 1991 and 2001. The socio‐economic spatial differentiation of Rosario was explained with the use of factor analysis and cluster analysis (see Section 7.6).
Finally, in the prescriptive phase the resource allocation using GIS‐based indicators was performed. Prioritised neighbourhood areas proportional to need and budget allocation were suggested (see Section 7.5). A comparative evaluation of the case studies in Rosario and Liverpool was necessary for the elaboration of the conclusions and recommendations reflected in Chapter 8.

42
Dat
a C
olle
ctio
nD
ata
Pro
cess
ing
Anal
ysis
Census data
(variables 1991/ 2001)
Administrative data:
(SPV housing)(OAV
complaints)
SPV housing demand per block group / population per block groups (expressed need)
OAV complaints per block group /
population with phone lines
(participation proxy)
Indicators derived from census
Accessibility indicator (s)
Gaps / uneven geographies
Variation 2001-1991
Expl
anat
ory
Pres
crip
tive
Des
crip
tive
Street network Rosario
Coding interviews
Aggregation at district level and census block groups level
Accessibility measures : .Minimum distance
. Service area
Correlation Bi-variate analysis
Preprocessing data files
Polygons census blockgroups 1991/
2001
Generation centroids
census block groups
Geocoding
Point maps SPV expressed housing demandOAV expressed
complaints
Construction of indicators at block
group level
Map centroids census block
groups
Map locationsschools primary
health care
Processing questionnaires
Interviews Rosario
Conclusions - recommendations
Descriptive statistics (standard deviation, mean, min-max)
Address/location: schools,
primary health care, and day care centres.
Expressed need indicators
Prioritised neighbourhood areas according to needbudget allocation
Factor analysisCluster analysis
Inequality aspects at city, district and at neighbourhood levels
Socio-economic spatial
differentiation
Inequality conditions / quality of lifeDistribution of opportunities / accessibilityExpressed need vs. derived need
Base map
End user analysis Selection of indicators – indicators matrix
Interviews Liverpool
Questionnaires
Open questions
Comparative evaluation
Questionnaires
Open questions
Figure 3.1 Empirical model

43
3.7 Conclusions In this chapter, the important role of indicators in monitoring inequality has been explained, as well as its direct relation to urban policy. With the use of GIS, indicators can be used to monitor the different aspects of intra‐urban inequality. Thanks to the GIS capabilities, indicators can be constructed, aggregated at different geographical levels, and analysed. Whether GIS‐based indicators can be successfully implemented to monitor inequalities within urban areas depends on the capacity and willingness of local governments to compensate for inequalities. The following chapter describes how inequality affects both developing and developed countries, and tries to present the urban policy framework of the selected case studies.


45
Chapter 4 Urban inequalities in Rosario, Argentina, and Liverpool, England
This chapter and the next address the first and second research questions. This chapter introduces the case study area of Rosario and its local policy context. In addition, it presents the planning context of Liverpool, a city with a longer tradition in the application of indicators and area‐based policies and which serves as the contrast case study in this research. This chapter helps to frame the interviews that are discussed in Chapter 5 and influences the decision taken in the development of the methodology in Chapter 6 and the selection of indicators in particular.
4.1 Inequality in Latin America and Argentina Even though inequalities are found in most cities of developing and developed countries (UNDP, 2001), income inequality in Latin American countries is among the highest in the world. Hence, it can be expected that Latin American cities are more vulnerable to the consequences of inequalities.
The ratio between the average income of the population groups at the top and bottom of the income distribution is a good indicator of this disparity23. According to data from the UN Economic Commission for Latin America, the average income of the richest quintile is 22.5 times that of the poorest (ECLAC, 2004a). On the other hand, in Europe the disparity between the two groups in 2001 was an average of 4.4, with a 4.9 ratio for the UK and only 3.8 for the Netherlands. 24
In Latin America, Brazil and Bolivia have the highest income inequality; the ratios of the average incomes between the richest quintile and the poorest quintile are 36.9 and 44.2 respectively (ECLAC, 2004a). Argentina had an increase in income concentration between 1990 and 2002. The average income of the richest quintile was 13.5 times that of the poorest in 1990, rising to 21.8 times in 2002 (ECLAC, 2004a). In the same year, the richest decile received 42.1% of the income (the second–highest concentration ‒ after Brazil) while the poorest decile received 13.4% (ECLAC, 2004a).
These high levels of inequality in Latin America, and its increase in Argentina in particular, coincide with a period where concern about these differences vanished from government agendas. It was during the 1980s and 1990s, and coinciding with the New Right governments in the UK and the USA, that the reduction in government expenditure “undermined the social democratic consensus on which the welfare state was founded” (Pacione, 2001, p. 345). The removal of state interference in the market was seen as allowing “full pursuit of such natural instincts as individual initiative, the acceptance of inequality, and adoption of self‐help” (Joseph and Sumption, 1979, in Pacione, 2001). The consequence of this form of morality or “competitive individualism” was “a lack of concern for the ‘have‐nots’ by the ‘have lots’” (Pacione, 2001, p. 346). In the same period, there was a dissemination of ideologies that put the free market and
23 This ratio has the advantage of being unaffected by extreme values at either end of the income distribution. 24 Source: Eurostat, Structural Indicators, Table: Social Cohesion (socohe). Inequality of income distribution (S80/S20 quintile ratio). Update: January 2004.

46
reduced state intervention on the agenda of many developing countries (Devas, 1993). At the beginning of the 1990s, Argentina was the country within Latin America that had undergone major economic adjustments, privatisation and deregulation (Ciccolella, 1999). Cuts in public expenditure were usually a necessary component of the adjustments, including reductions in public health or education, which tend to have disproportionate impacts on the poor.
Zanetta (2002) explains that “while most countries in Latin America undertook reform programs consistent with the tenets of the ‘Washington Consensus’ few have endorsed neo‐liberal prescriptions as intently as Argentina during the past decade”. The Convertibility Plan was the plan that the Argentinean central government implemented in the 1990s to introduce public sector reforms focusing mostly on macroeconomic performance, and basically promoting fiscal responsibility, enhancing efficiency in the provision of services, and promoting private sector participation (Zanetta, 2002, p. 175). The same author explains that the “strong emphasis on macroeconomic performance and economic growth seems to have obscured the importance of social functions of the state, including poverty alleviation and redistribution”. Weyland (1990, in Zanetta, 2002) observes that “while many reforming governments in Latin America had resorted to compensatory programs to target benefits to the poor, Argentina did little to cushion the tough economic reforms implemented as part of the Convertibility Plan during the early 1990s”.
In Argentina, according to Bifarello (2000), from the 1940s to the 1970s the central government was the base of the welfare system. The same author indicates that “since 1980, however, many of the welfare institutions which depended on the central government have been progressively dismantled” and provincial and municipal governments “have become increasingly responsible for the provision of social services”. State intervention reductions plus a weak state apparatus have meant that the social and built environment conditions have worsened for those with less “market power” in the city. In Latin America, Argentina is one of the countries with the highest proportion of urban population. With 88% of the people living in urban areas, the problem of inequality is basically concentrated in cities.
The appearance of residential segregation and suburbanisation of the “elites” or affluents25 was one of the manifestations of growing inequalities among the population during the 1990s. This led to the consequent fragmentation of the space in the metropolitan area of Great Buenos Aires (Torres, 2001).
In the 1990s, although there was a concentration of the elites and a permanence of slum areas, it was in traditionally middle‐class neighbourhoods that the economic decline was more evident. Prevot Schapira (2002) describes how in Argentina in the 1990s the growth of income per inhabitant and low inflation went along with high unemployment and increase in poverty. She adds that poverty should not be thought a problem restricted to specific, clearly defined areas such as villas (slum areas) but recognised as a phenomenon that crosses neighbourhoods. During the recession period, poverty grew in middle‐class neighbourhoods. This poverty is of course less visible than the poverty concentrated in villas. Therefore, the same author doubts the usefulness of
25 In the form of gated communities (barrios cerrados).

47
area‐based policies compared with people‐based policies. She mentions that policies destined to target “the territories of poverty” cannot focus on the poverty of those impoverished middle classes. A policy response in this respect was the plan Jefas y Jefes de Hogar Desocupados (Unemployed Male/Female Household Heads), which was directed at individuals and not at specific territories (Prevot Schapira, 2002). This plan was carried out at the beginning of 2002, after the political and socio‐economic crisis erupted in December 2001. According to the central government, it was implemented to guarantee a minimum income (150 pesos26) for households where the head was unemployed27. This amount covers only half the requirements for a household not to be considered in extreme poverty. This might explain why after its implementation the population under the poverty lines did not drop (see Table 4.1). In spite of these general measures of income compensation, at local level area‐based policies can still address non‐economic aspects of inequality that affect the worst‐off neighbourhoods, such as lack of health coverage and education, or overcrowding.
Some of the characteristics of the inequalities that are present in Argentinean cities and affect the poorest households are described in the Argentinean report for the UN‐HABITAT Istanbul +5 session. Even though the report claims that there has been a general improvement in habitat conditions, there are still marked housing differences (inequalities) between neighbourhoods. At national level, in the best‐off neighbourhoods 100% of the households have electricity, street lighting and daily waste collection, 95% have access to potable water, and almost 80% have gas, rain drainage and sewage connections. On the other hand, all the services, with the exception of electricity, for those neighbourhoods classified as the worst‐off (basically slums) are much lower: sewage connections 22.4%, rain drainage 13.4%, and gas 17.3%. The same report states that the privatisation of all these services has brought some difficulties to the poorest households, owing to an increment in the tariff levels and because the companies have less profit (hence less interest) in the areas where this social group is localised (DNPH, 2000, p. 11).
In the human development report prepared by the UNDP for Argentina in 2002, the inequalities within the country regions are recognised in the following paragraph:
“A country of extreme contrasts throughout its jurisdictions discloses an unequal human development pattern. The map of poverty and inequality proves territorial inequity, as regards growth in the amount of indigents and their differential distribution as well as in the explosion of poverty and the widening of the income gap, which distinguishes children as the most affected. The differences among regions in quality of education, levels of infant mortality
26 Equivalent to approximately 50 euros (2003). According to INDEC, in April 2003 the extreme poverty line (línea de indigencia based on a basket of food) was 79 euros for a household of three members, and 109 euros for a household of five members. For the same period, the poverty line (línea de pobreza based on a basket of food and services) was for the same households 173 euros and 237 euros respectively. 27 Source: http://www.trabajo.gov.ar/programas/sociales/jefes/index.htm. Accessed 12/09/2003.

48
and unemployment rates conspire against territorial integration and equal opportunities” (UNDP, 2002, p. 2).
While in the 1990s there was a clear growth in inequalities and less interest in their compensation, nowadays in the region there is mounting concern among local administrations on social issues and reducing the disparities. In May 2001, the mayors of the cities of Montevideo (Uruguay), Belo Horizonte, Porto Alegre, Sao Paulo (Brazil); and Buenos Aires and Rosario (Argentina) signed an agreement to promote social cohesion. They claimed the failure of the neo‐liberal policies in Latin America during the 1980s and 1990s. According to them, the neo‐liberal policies brought more “poverty, inequality and a greater concentration of wealth in the hands of few”. At the same time, they declared that they should develop actions “to reverse this trend through new policies of social and economic transformation”. They added that the local level was “the first stage for applying these tasks, if we are to effectively reverse the social disintegration that affects Latin America”28. It is in Rosario, one of the cities that signed this agreement to promote social cohesion, that the main case study took place. In the following section, a description of its characteristics and local policy context is described. The role of policies to compensate for disparities comes under particular focus.
4.2 Study area Rosario (Argentina) Rosario is the third largest city in Argentina, after Buenos Aires and Córdoba. It is located in the south of the province of Santa Fé, along the western bank of the Paraná river, and is approximately 300 km north‐west of Buenos Aires (Figure 4.1).
Figure 4.1 Location Rosario
28 Dialogue on the topic of ʺSocial Inclusionʺ (Buenos Aires, May 12, 2001) in Strategic Plan Buenos Aires 2010. Source: http://www.buenosaires2010.org.ar/english/about/news/agreement.html.

49
Rosario is the main city within a metropolitan area (Gran Rosario) that has a population of around 1,300,000 inhabitants29 (Figure 4.2). The city of Rosario itself, according to the 2001 census, has a population of 922,444, living in an area of nearly 180 km2.
Figure 4.2 Metropolitan area of Rosario with districts. Adapted from Plan Director de Rosario (Municipalidad de Rosario, 1999)
Throughout its history, the city has benefited from economic prosperity characterised by its harbour and by the industrial, commercial and financial activity. Rosario was officially declared a “city” in 1852, with a population of approximately 3,000 inhabitants (Du Graty, 1858, in Videla and Fernández, 2001, p. 107). While the 1858 census showed 9,785 inhabitants (DGE, 2003), by the end of the 19th century Rosario had already reached 100,000 inhabitants, and between 1900 and 1914 the population doubled. In a similar way to the rest of the country, and owing to economic development and massive immigration (mostly from Italy and Spain), population growth in the city continued at a high level until 1926 (see Figure 4.3). It was during the so‐called “agricultural export” economic phase that Rosario grew and its spatial pattern was defined (URB‐AL, 2000). By 1905, the first pier had been opened and the main central area had already been defined by its civic, commercial and residential areas located near the harbour. The
29 The total population varies depending on the number of municipalities included in the metropolitan area. INDEC considers Gran Rosario, the city of Rosario, and the following municipalities to be within the metropolitan area: Villa Gobernador Gálvez, Granadero Baigorria, Pérez, Funes, Soldini, San Lorenzo, Cap. Bermúdez, F.L.Beltrán, Pto. San Martín, Roldán (Soldini from 1997 onwards).

50
Population Growth in Rosario 1763 - 2001
91,669 112,461
407,000467,937
671,852 697,257
797,337
907,175
222,592
150,686
23,169
50,914
922,444
0
100,000
200,000
300,000
400,000
500,000
600,000
700,000
800,000
900,000
1,000,000
1869
1887
1895
1900
1906
1914
1926
1947
1960
1970
1980
1991
(*)
2001
(*)
spatial growth of the city was structured around main roads, railroads and the coast along the river.
The urban expansion occurred during the so‐called “replacement of imports” economic phase, which from 1929 was related to light metalworking. Many small and medium companies and workshops developed, all of them founded with domestic capital (URB‐AL, 2000). Public transport systems were improved and resulted in an urban expansion characterised by unregulated zoning and the development of large deprived areas with high‐cost services. The typical regional expansion of this period witnessed the establishment of foreign manufacturing facilities. An urban agglomeration was consolidated along the riverside in the northern corridor, linking municipalities in an urban continuum30. The harbour was the most important exporter of grain in the country and was a driver of economic development (URB‐AL, 2000). In the second half of the 20th century, the first manufacturing activities were established, related to farming and grain exports (flourmills, meat processing plants), as well as to railway supplies.
Along with the industrial development, from the 1940s there was a constant growth in internal migration, with people being attracted by the benefits of the urban areas (Martín and Múgica, 2001, p. 199). Informal settlements (villas de emergencia) developed on redundant railway land and in vacant areas. In less than one century, Rosario turned from a semi‐rural village into the second urban agglomeration in the country (URB‐AL, 2000).
Figure 4.3 Population growth in Rosario 1763 – 2001 Source: DGE (2003) (*) analysis based on census data provided by INDEC
It was during the middle 1970s that a crisis affected the economic structure of the region (Plan Estratégico Rosario (PER), 1998). As in many other cities around the world, Rosario suffered the effects of de‐industrialisation. The adjustment and reconversion of some
30 For example, Granadero Baigorria, Capitán Bermúdez, Fray Luis Beltrán, San Lorenzo and Puerto San Martín

51
industries (e.g. iron, paper‐mills, steel and chemical industries) “put the region in a critical economic and social situation, with difficulties to compete in a frame of open economy context and international competition” (Plan Estratégico Rosario (PER), 1998, p. 9). Unemployment rates in Rosario during the 1990s reached 20% (Plan Estratégico Rosario (PER), 1998), being worse among vulnerable groups and young people. The socio‐economic and political crisis that erupted in Argentina in December 2001 increased the percentage of people living under the poverty line in Gran Rosario. The proportion of households with an income too low to acquire a basket of food and services rapidly grew to 61% in May 2003 (see Table 4.1). However, there was an improvement between the first semester of 2003 and the first semester of 2004, when the percentage of households under the poverty line dropped from 54.6% to 42% (see Table 4.2)
Table 4.1 Percentage of people living in households under poverty line, May 2001 ‐ 2003 May 2001 May 2002 May 2003
Metropolitan areas Total Pop. % Under
extreme poverty31
% Under poverty
line32
% Under extreme poverty
% Under poverty
line
% Under extreme poverty
% Under poverty
line Gran Buenos Aires 12,168,380 10.3 32.7 22.7 49.7 25.2 51.7
Gran Córdoba 1,408,756 10.2 34.0 26.9 55.7 22.2 54.7
Gran Rosario 1,313,380 14.6 35.8 28.0 56.2 32.6 61.0 Gran Mendoza 966,813 10.4 36.7 22.2 50.5 27.1 56.1 Source: INDEC‐ Household Survey: Encuesta Permanente de Hogares
Table 4.2 Percentage of people living in households under poverty line, first semester 2003‐2004 First Semester 200333 First Semester 2004
Metropolitan areas Total Pop. % Under
extreme poverty
% Under poverty line
% Under extreme poverty
% Under poverty line
Gran Buenos Aires 12,168,380 26.5 52.3 15.2 42.7
Gran Córdoba 1,408,756 26.7 54.4 17.4 48.2 Gran Rosario 1,313,380 29.3 54.6 16.5 42.0 Gran Mendoza 966,813 25.3 54.0 12.9 40.0 Source: INDEC‐ Household Survey: EPH Continua
31 Extreme poverty line: INDEC considers a household to be under de extreme poverty line when its income cannot afford a basket of food with the minimum amount of proteins and calories. 32 Poverty line: INDEC considers a household under poverty line when its income cannot afford a basket of food with the minimum amount of proteins and calories; plus transport, health, education and clothing related costs. 33 INDEC changed the methodology to measure the EPH survey. Until May 2003, two surveys were performed per year and the data published reflected the values for May and October. Since 2003 there is a continuous measurement taking place during 12 weeks every 3 months “EPH Continua”. Then the value published for the semester reflects the change of the phenomenon along a larger period of time.

52
Within the four most populated metropolitan areas, Gran Rosario is the one with the largest percentage of its population living under the poverty line. This can be explained by the (historical) presence of an important number of slums. In the second half of the 20th century, owing to urban and rural migration (caused mainly by the deterioration of regional economies), the number of informal settlements (villas de emergencia) started to grow. In 1996, the Municipal Bank Foundation (Fundación Banco Municipal, 1996) surveyed 91 slum settlements inhabited by 22,685 families (113,382 inhabitants, 11% of the total population of Rosario). It was then possible to appreciate the vulnerability to social exclusion of its inhabitants, since 50% of the slum population over 15 years old had not completed primary school (Plan Estratégico Rosario (PER), 1998).
The unequal characteristics of its population are reflected in the different levels of housing qualities and access to services (infrastructure and social services). It must be noted that one of the first social and housing problems in the city dated from the beginning of the 20th century. According to the 1910 census, 46.6% of the population were immigrants (Martín and Múgica, 2001). The population growth brought housing problems for the immigrants, who usually had to live in rooms within (shared) rented houses called conventillos. By 1910, there were 45,926 persons living in 2,006 conventillos. While a single‐family house was occupied by 6.9 persons on average, there were around 22 persons in a conventillo (Martín and Múgica, 2001, p. 163).
At the same time, the number of gated communities increased during the 1990s, causing an increase in housing inequalities, disparities and social segregation. Bragos et al. (2001) explain that, even though the first gated communities were built close to low‐income residential areas, in the last years developers have been trying to “clean” the land for new investments and (low‐income) families are moving out looking for cheaper land sold by the same developer. According to the same authors, this generates the formation of clusters of homogeneous groups of similar social condition, education, age, family type, and ideal way of life (Bragos et al., 2001).
The previous paragraphs illustrate the unequal levels of quality of life for a high percentage of the population of Rosario. Besides the degree of vulnerability that they are exposed to, it illustrates the importance of implementing a methodology to monitor and evaluate inequalities to support effective intervention policies. Considering that the use of urban indicators is policy‐oriented, the units of analysis in this research are delimited within the administrative boundaries of the city (Figure 4.4). Rosario falls within the context of a city under the influence of both globalisation (privatisation of services, deregulation, etc.) and a local administration that implemented a decentralisation process expressing the willingness to improve the welfare level of the people living in its districts and reduce disparities. The following section discusses how this is channelled within the local planning context.
4.3 Local planning context in Rosario During the second half of the 1990s, the city of Rosario started a process of modernising its local administration and implementing new planning tools such as the Strategic Plan of Rosario (PER). In the following sections, three levels of planning are described: strategic level (PER), urban level (Nuevo Plan Director) and district level (Decentralisation Programme). Finally, the public housing and the social welfare policy are described because of their capacity to address inequalities.

53
Figure 4.4 Urban expansion of Rosario with main roads and slums locations Source: adapted from Plan Director Rosario (Municipalidad de Rosario, 1999)
4.3.1 Strategic Planning The effects of globalisation and the increased competition between cities generated new planning tools to face these new challenges. Strategic plans were introduced worldwide during the 1990s, mostly with the objective of making cities more sustainable, competitive and attractive. During the 1990s, several Argentinean cities started implementing strategic plans34. However, Spanish experiences, such as those of the city of Bilbao, mostly influenced the Strategic Plan of Rosario (PER). Both Bilbao’s and Rosario’s strategic plans stress the role of public‐private partnership in defining consensually common actions. The PER process started in 1995 with a diagnostic phase, and two years later the plan was formulated. In the PER, strategic planning is defined as a process that allows the articulation of the initiatives of public and private stakeholders to potentialise the development of a city (Plan Estratégico Rosario (PER), 1998). The plan says that “due to the tensions created by the present tendencies of globalization, regionalization and localization; [strategic planning] it is about building consensus for a ‘Collective and Strategic Vision’ of the city, generating areas of work [projects] which repositions the city in the new scenarios. It is a plan with a guiding character, it is about
34 Including (among others) Rosario, Córdoba, Buenos Aires and Rafaela. Other examples can be found in Latin American cities (e.g. Santiago de Chile, Trujillo, Lima, La Habana) as well as within the USA (e.g. San Francisco, Detroit) and Europe (e.g. Madrid, Málaga, Glasgow) (Steinberg, 2002).

54
‘A tool for the local development which has the goal of strategic interventions that guarantee the quality of life, and economic and social progress’” (Plan Estratégico Rosario (PER), 1998).
The main difference from preceding plan formulations is that it is based on consensus building and it covers economic, social and environmental aspects. The main long‐term goal or vision (horizon) of the plan defined Rosario as “a city based on work and creation, with opportunities of life and progress for all its inhabitants ...” (Plan Estratégico Rosario (PER), 1998, p. 38). This horizon indicates a clear intention to see the city within a social justice perspective/egalitarian vision that takes into account local needs such as jobs and quality of life for all its inhabitants. The plan proposes five strategic lines as a way of reaching the main goal or horizon. The second line is called “The city of opportunities” and its objective is “To secure a city with possibilities for individual and social development for all, with a modern and participatory Municipality”.
Therefore, social equity is a prime objective of strategic planning. The PER explicitly mentions this issue in its plan formulation book under “The new role of cities”. Among the new roles that the city of Rosario is adopting are:
“The generation of new mechanisms to redistribute wealth and balance social inequalities generated by the high economic concentration, improving the quality of life of its citizens” (Plan Estratégico Rosario (PER), 1998, p. 13).
Steinberg (2002) recognises that, after two to three years of implementation, progress can be found in the five strategic lines of the PER. This author recognises the advancement in the “implementation of the neighbourhood improvement programme (Rosario Hábitat), in improved services, the creation of six Municipal District Centres as sub‐municipalities and social centres ... and the creation of a better environment for citizens in general”. A continuation of this plan has been seen since 2004 as the Plan Estratégico Metropolitano, which puts emphasis on the metropolitan area rather than the administrative city boundaries. Steinberg did a comparative study of different strategic plans in Latin America (Steinberg, 2005) and considers Rosario’s strategic plan to be an “example of a very advanced and fully developed case in Argentina”. He also considers the use of urban indicators within the plan an innovative practice in Latin America (Steinberg, 2005).
4.3.2 Secretariat of Planning ‒ Urban Plan (Nuevo Plan Director) Within the Municipality of Rosario, the Secretariat of Planning deals with policies related to urban planning. Since 1985, the office Dirección General del Plan Director has been responsible for the updating of the existing Urban Plan (Plan Regulador), which dates from 1967 and is still legally in place. The Urban Plan, updated in 1999, was sent for study and approval to the City Council in May 2002 and is still under debate/consideration.
The plan (called the Nuevo Plan Director) is defined as a “guiding plan” for urban change and not as a predefined model of a city (Municipalidad de Rosario, 1999). In this respect, this plan is related to the global tendency of turning urban plans and the actions of the local government into facilitators of urban transformation. The objective of

55
the Nuevo Plan Director is to define a “project of city” and it is presented as “an instrument inserted in an open and dynamic process, which will require a permanent adjustment to a changing reality” (Municipalidad de Rosario, 1999, p. 8). In this plan, it is recognised that in Rosario the history of urban planning has been closely related to theoretical propositions rather than concrete interventions. The main causes, according to the Planning Office, are the lack of resources and the lack of autonomy of the local government. Most of the projects that were proposed by the different plans required the approval of the provincial or central government and in many cases they were only partially completed or not at all. However, the most important factor in the failure of the concrete application of these plans is, according to the new plan, the lack of an adequate institutional reformulation of the municipal management. This reform should encourage the abandonment of “bureaucratic practices, and especially, practices that understand the urban management and the urban problem in a fragmented way”. This issue can be related with what later appears in the interviews (Chapter 5) as a lack of tradition in measuring and monitoring.
There is a relation between the Urban Plan and the PER since the former represents in the physical structure of the city the objectives and lines supported by the PER. It seems to be some sort of coordination between the Nuevo Plan Director and the PER, which can be reflected in the Central Area Regeneration Programme where both cooperate.
The Nuevo Plan Director consists of four main structural projects with the objective of guiding a series of urban projects on a smaller scale.
The four structural projects included in the plan are (Municipalidad de Rosario, 1999) the city–river system, the new territorial front (focusing on the transformation of the periphery), the city–airport system, and the new metropolitan axis. A number of actions are structured and articulate around the road linking the airport and the city downtown area in order to foster urban regeneration of deteriorated sectors and to release new land for commercial and services developments. The new metropolitan axis is closely related to policies that try to address uneven geographies in the city. This project operates at two scales: one is the spatial and functional regeneration of redundant, obsolete railway facilities that are to be replaced by a road axis and a metropolitan tramway; the other is the rehabilitation and integration of deprived neighbourhoods located in the geographical axis of the municipality. The latter takes into account informal settlements located along some avenues that, apart from the social problem they represent, also have a negative impact on the city pattern. The plan stresses the importance of solving the housing issue at the same time as solving more structural urban problems.
The Nuevo Plan Director recognises that the central government decentralisation policies and the deregulation of the economy in the 1990s had impacts on the transformation of the city and its territory. One of the negatives effects is the increasing imbalance in the quality of life and possibility of development for a large proportion of the population (Municipalidad de Rosario, 1999). The rehabilitation and integration of deprived neighbourhoods is an example of some of the actions that try to improve the imbalance between different areas of the city. In this respect, within the public housing

56
policy, it is explicitly stated that the main objective is to reduce the gap between different areas of the city.
One of the instruments of the Nuevo Plan Director is the cluster of plans specifically oriented towards the districts (Planes de Distritos) newly created by the Decentralisation Programme. The district plans deal with problems that are of a scale and dimension opposite to those in the Strategic Plan.
4.3.3 Decentralisation Programme The decentralisation policy, which started in Rosario in the second half of the 1990s, was, like the Strategic Plan, influenced by Spanish experiences, for example, the municipal decentralisation of Barcelona in the 1980s. This influence can be explained by the similarities in the objectives of both decentralisation projects. In Barcelona, the main objectives were (Amorós, 1995) to improve and increase services, to introduce new technology and rationalise municipal administration, to promote citizen participation, to bring the management closer to the citizens, and to fight imbalances and inequalities among different groups and areas.
Westendorff (2002, p. 162) mentions that some of the most socially progressive cities in the MERCOSUR region, such as Montevideo (Uruguay), Porto Alegre (Brazil) and Rosario (Argentina), “have become known for persistent and largely effective efforts to minimize the gaps in social provisioning between different urban neighbourhoods and social groups”. Another common aspect of these cities is that they have reorganised municipal administration through decentralisation participatory activities.
In 1995, the Municipality of Rosario started the decentralisation processes that led to the creation of six districts. As a first stage, an audit of the situation in the city was carried out to identify potentialities and to zone the districts; the second stage was the implementation of the Decentralisation Programme (URB‐AL, 2000). This programme was listed in 2000 as a “Good Practice” by the UN‐HABITAT “Best Practice” initiative35.. This decentralisation process goes hand in hand with new urban management models and the re‐emergence of a stronger role for local governments which appeared in the late 1980s supported by many donor agencies (Devas, 1993). Borja (1996), who was responsible for the decentralisation of Barcelona and was a consultant in Rosario, states that everything that can be decided and managed at a lower level should not be done at a higher level. With this philosophy in mind, in the main report on the decentralisation of the Municipality of Rosario, decentralisation is defined as:
“The administrative, social and political process, through which functions, competencies and resources are transferred from a central or unitary administration to organisations, with smaller territory jurisdiction” (Municipalidad de Rosario, 1996b, p. 9).
35 “Best Practices are initiatives which have made outstanding contributions to improving the quality of life in cities and communities around the world. The original call for Best Practices was launched in 1995 during preparations for the Second United Nations Conference on Human Settlements (Habitat II) as a means of identifying what works in improving living conditions on a sustainable basis”. Source: http://www.bestpractices.org.

57
In the same document, two goals are mentioned: “To decentralize so as to get a more balanced city and with more equity; and to get a more efficient, transparent and participative administration” (Municipalidad de Rosario, 1996b, p. 12). The final objective is to “bring closer the political and administrative decisions of the city management to the citizens’ interests”. Most of the objectives are related to the promotion of social equity and community participation, the improvement and modernisation of the city management, and the optimisation of the use of the resources.
The decentralisation process was structured around four principles: • An administrative re‐structuring: which is currently being implemented by
setting up Municipal District Centres (CMD) and a process of “continuous improvement” that allows monitoring achievements and assessing results to decide necessary adjustments.
• A functional, operational re‐structuring: an Urban Services Area (ASU) was set up in each district to decentralise work related to public services delivery and small and mid‐size public works execution.
• A redefinition of urban policies: setting out guidance to foster transformation. The Municipal District Centres are located as projects that can have a high impact on the urban transformation.
• A new city management model was defined, based on two essential issues: mechanisms to spread information, and the fostering of citizen involvement, aimed at the participation of citizens in the assessment, control and decision‐making processes (URB‐AL, 2000).
Three out of six Municipal District Centres (CMD) are fully operational. It is planned to open the remaining district centres in a second phase during 2005 and 2006. Once the six districts are fully operational, it will be crucial that the municipality can assess the needs of each district in order to assign resources based on quantified studies. The present administration explicitly communicated in different reports the intention to offset the existing inequities (intra‐ and inter‐district). The intention to reduce inequalities has been explicitly stated in the objectives of the Decentralisation Programme. In article 5.1 of the plan of action, the municipality defines a grid of needs and priorities:
“Once the ZG (District Managing Zone) is defined, a detailed survey of needs should be made. These needs include infrastructure, public services, health, social action, culture, etc. A grid of each district and a comparative analysis between them should be defined to adjust equity criteria in the assignment of resources.”
Within the organisational chart of the CMD, the Urban Development Area (which includes Public Works, Public Services, and Planning and Housing Service Office) and the Socio‐Cultural Development Area (e.g. Social Welfare and Public Health Departments) will be those offices that would benefit most from the use of indicators.
As mentioned earlier in this chapter, since 1980 the welfare institutions that depended on the central government have been dismantled (Bifarello, 2000). A process of

58
decentralisation makes provincial and municipal governments responsible for the provision of these services. Decentralisation has brought decision making closer to the people, and this is clearly reflected in the local decentralisation process that took place in Rosario. On the other hand, the withdrawal of central government from the provision of social services, combined with a lack of sufficient financial resources, has put a lot of pressure on local authorities, which are not always willing or able to accept the new responsibilities (Bifarello, 2000).
Westendorff (2002, p. 163), after analysing the decentralisation processes in Montevideo, Sao Paulo and Rosario, considers that “By establishing itself within the neighbourhoods, the municipalities have opened direct lines of communication with residents near their homes, providing information about affairs of the city that touch citizens’ lives on a daily basis and facilitating interaction with and sometimes organizing efforts of community organizations in public programs and campaigns”. According to this author, Rosario “has implemented a thorough programme of administrative and functional decentralization to the district level, established good working relations with civil society organizations and among ‘social democratic’ municipal governments in Latin America and Europe and has achieved distinction for innovative and effective social programmes”.
One of the positive effects of decentralisation is that it allows greater control and coordination of grouped functions, a more direct relation between fund raising and expenditure, and openness to local demands and diversities (Batley, 1993). This local or “micro‐scale” perception has the advantage of being more sensitive to the identification of target groups and their basic needs. GIS‐based indicators can quickly and efficiently supply information to this perspective.
Within the decentralisation process, the participatory budget is an instrument introduced to define priority themes within the budget in a participatory way. Around 15% of the total budget for 2003 (24 million out of 165 million pesos) was allocated through a participatory methodology where the neighbours prioritised different activities and projects within each district. It should be noted that the participatory budget is distributed per district in equal parts. It is ultimately each secretariat that elaborates and executes the budget, following the demand of the neighbours in each district (Municipalidad de Rosario, 2002).
4.3.4 Public Housing Service (SPV) Rosario Hábitat The central government of Argentina participated in housing projects in Rosario through the National Housing Fund (FONAVI: Fondo Nacional de la Vivienda) from 1972 until 1992, and through the National Mortgage Bank (BHN: Banco Hipotecario Nacional) until it was privatised in the 1990s (EPEV, 2001). The provincial government has also operated since 1964 through what is now known as the Housing and Urban Institute (DPVU: Dirección Provincial de la Vivienda y Urbanismo). The DPVU operated decisively in the 1980s, managing the funds of FONAVI (EPEV, 1991). In that period, the DPVU constructed 73.8% of the total public housing units built in Rosario. This shows the important influence of the central and the provincial government in housing policies. One of the main characteristics of the housing policies until the beginning of the 1990s was the construction of (state‐financed) multifamily apartments by private companies. These companies usually kept the right to choose the site and obtained subsidised credit. This

59
policy is regarded as “benefiting the interest of the construction business, which applied a strong control in the central government management” (EPEV, 2001, p. 15).
At local level, the Public Housing Service (SPV: Servicio Público de la Vivienda) is the municipal office responsible for housing matters in Rosario. It was created in 1927 as La vivienda del trabajador (The worker’s house). The main policy of the office is to solve the problem of informal settlements (villas de emergencia), improving not only the quality of life of their inhabitants but also regenerating the urban tissue. In this way, the interventions go beyond the single issue of improving the conditions of slum areas, and also take the opportunity to improve strategic areas of the city.
Owing to the diversity of programmes within SPV, there is a policy of segmentation of the housing demand, which classifies the demand for housing and analyses the needs of those asking for a housing unit (expressed demand/need). For this purpose, SPV keeps records of all the citizens that come to the office asking for a habitat solution. In the mid‐1990s, SPV worked with several programmes that show the variety of the housing demand. The habitat solutions ranged from programmes that offered materials and technical assistance to build extra rooms, to the provision of urbanised plots (including the services gas, electricity, water) with basic prefabricated units of 36 m2 with bathroom, kitchen and room. Other programmes were targeted at specific groups such as the elderly, where old abandoned houses were recovered to house self‐sufficient elderly people. In most cases, payment has to be considered, but in some cases, such as the Plan Emergencia, which focused on people in urgent need of habitat, a 100% subsidy was given.
In some of the SPV interventions, there is a need for houses to be relocated, while in others the urban pattern is reordered (opening of new streets and provision of services). Those that need a housing unit because of unavoidable reallocations receive a housing unit within an individual plot of around 120 m2 to 160 m2. Individual units are preferred to multifamily dwellings, since previous experience revealed that change in the usual living customs was mostly negative.
Social promotion and higher participation levels are also encouraged by the office. SPV tries to maintain the “solidarity net”, which is guaranteed if the inhabitants of the settlements participate in churches, NGOs, clubs, etc.
Since 2001, the main programme of SPV has been Rosario Hábitat: the Comprehensive Program for Rehabilitation of Unregulated Settlements. The programme is financed by the Inter‐American Development Bank (IADB). The existence of a strategic plan (PER) was a key factor in obtaining a loan of US$ 43 million from the Inter‐American Development Bank to implement this programme (Steinberg, 2005).
The objective of the programme is, according to SPV (2003), “to normalize the informal [land] occupation processes and to improve the quality of life of the population living in informal settlements in Rosario, promoting the physical and social integration of the informal areas into the formal city”. To reach this goal they mention the following actions: improvements in the urban infrastructure, the provision of social services, and the provision of tenure rights. The programme involves the upgrading of basic services such as water, sanitation, roads, electricity, garbage collection and recreational facilities. Technical and legal assistance will help residents to obtain property titles. The Rosario Hábitat programme includes the opening of streets to recompose the urban tissue (to

60
regenerate the urban pattern) and the provision of services. The result of this is that some families are relocated and some houses are moved or partially affected by the reshaping of the parcel.
In a first phase, it will benefit 6,600 families (around 34,000 persons)36. The areas presently selected are six in number and are concentrated mostly in the districts Sur and Sudoeste (see Figure 4.5). Some of these slums are located along railway lines and disrupt the continuity of the urban tissue, for example, the slum Villa Itatí (see Figure 4.6).
Figure 4.5 Slum areas selected by Rosario Hábitat: Las Flores (1), Villa Itatí (2), Villa Corrientes (3),
Molino Blanco (4), Empalme (5), and La Lagunita (6)
Figure 4.6 Slum area Villa Itatí. Source: Rosario Hábitat
The total number of people living in slum areas is 150,000 and they are distributed over 91 informal settlements (SPV, 2003). The extent of the problem suggests that this programme is just the start of a long‐term effort to solve completely the problem of slum areas in Rosario.
The main characteristic of the population living in informal settlements in Rosario is that it is composed of young families, with many children and low education levels. The lack of services and infrastructure creates severely deteriorated urban areas (see Figure 4.7) fragmented from the rest of the city, increasing the social and spatial segregation of the settlements (EPEV, 2001, p. 15).
36 Source: http://www.rosariohabitat.gov.ar.

61
Figure 4.7 Slum areas in Rosario: Barrio Las Flores
Source: SPV Programa Rosario Hábitat, Carpeta de Formulación Ejecutiva Proyecto Las Flores
The problems of the slum areas are not limited to physical aspects, and many other social problems require solutions. In this respect, the Rosario Hábitat programme also includes projects for job creation and training to increase the employability of the people living in informal settlements. Social services for families and children consist of youth training and employment programmes. The programme also tries to strengthen the social networks by involving residents in the process. These actions are coordinated with two other municipal secretariats: the Social Welfare Department and the Department of Production, Employment and Foreign Trade. Owing to these characteristics, it can be said that this programme is a typical example of the area‐based policies discussed in Section 2.2, where the geographical component (in this case the specific location of the slum areas) allows the development of cross‐sectoral and coordinated actions. According to the Inter‐American Development Bank (2004), the Rosario Hábitat programme qualifies as a social equity‐enhancing project and as a poverty‐targeted investment (PTI) since it is a neighbourhood improvement programme. Furthermore, the programme includes components for employment and income generation and early childhood stimulation for families living in poverty in unregulated settlements. For this category of loans, the bank offers an additional 10% financing.
Within the programme, there is a monitoring and evaluation component. According to the Inter‐American Development Bank (2004), the monitoring system will include field data and beneficiary surveys conducted before and after the implementation of the projects. These results will be compared with the non‐beneficiary areas, which will serve as control groups. The impact and process indicators planned

62
will include the satisfaction level of residents and users of urban sanitation and other services, coverage of vaccination, school retention rates and the performance of beneficiary children. The project specifies explicit performance indicators for measuring poverty reduction and social equity enhancement among the populations involved. One of the requirements of the project was the inclusion of performance indicators with targets such as “more than 80% of target population is satisfied with the physical, environmental and social changes brought about by the project” or more specific ones such as at least “50% of target families have received instruction and inputs for home food production” (Inter‐American Development Bank, 2004). However, the need for specific surveys to construct these indicators is an effort that cannot be underestimated by the local authorities.
4.3.5 Social Welfare Department The Social Welfare Department is responsible for the implementation of several social programmes aiming at reducing inequalities. Most of the programmes are formulated in a comprehensive and integrated manner since they involve other departments such as the Public Housing Service (SPV) and the Department of Production, Employment and Foreign Trade (SPEC). The Municipality of Rosario is developing a series of social programmes and employment and income‐generating initiatives for vulnerable groups, in particular for those living in slum areas. Since 1997, the municipality has prioritised aspects where human needs are most pressing: health, education, housing, recreation, social and cultural activities (Inter‐American Development Bank, 2004).
Articulated with other programmes such as Rosario Hábitat (previously described) are Crecer (Growth), the Social Enterprise Incubator Programme and Oportunidad (Opportunity).
The Social Welfare Department launched the Crecer programme in 1997. The aim was to increase social cohesion and address social needs. The strategy adopted was to take the at‐risk family unit as the point of departure. As part of this strategy, Crecer offers a point of entry for families to municipal social services. There are two objectives:
• “To articulate all the assistance resources (economic subsidies, study
fellowships, health and food assistance, housing subsidies, employment programmes, stimulation and continuity of education, etc.) to produce a real impact that modifies the family life and facilitates SOCIAL INCLUSION” (Municipalidad de Rosario, 1998) [emphasis in original].
• “To eliminate or minimize the effects of marginalisation and exclusion in childhood” (Municipalidad de Rosario, 1998).
Another specific objective is “the compensation of nutritional and psychological deprivations in children under risk in favour of their inclusion in the education under equal conditions”. The programme also addresses the family group with objectives such as “to prevent the violence and the dissolution of the family and social ties”. In this respect, the staff of the centres are trained to intercede in situations of family violence and in extreme cases of marginalization, and to help, for example, to return street children to their families (Inter‐American Development Bank, 2004).

63
The programme also guarantees children equality of opportunity in school enrolment, and provides young people and adults with opportunities to pursue non‐formal education to develop skills (Inter‐American Development Bank, 2004). Some of the projects included to meet these objectives are the Nutritional Project, the Food Production Project, the Pedagogic and Psychomotor Stimulation Project, and the Recreation Project. The activities related to these projects are day‐care services, with early stimulation activities, meals, nutritional and health examination for children under five; school enrolment or re‐enrolment of school‐age children; and social and occupational skills development for youth, to promote their entrance into the labour market. For adults, the centres offer training in home food production, nutritional workshops, as well as family guidance and counselling.
Consequently, the Crecer programme claims to attend to all the issues in an integral way involving all the family members, although a family might join the centre through a specific programme and through one of its members. The relation between the family and the rest of the community is also taken into account, since the programme revolves around two axes: the family group in an integral manner, and the work with other institutions and neighbourhood organisations.
By January 2005, there were 33 Crecer centres staffed by multidisciplinary groups and voluntary staff. Owing to the complexity of the problematic of families suffering deprivation or social exclusion, the relation with other institutions seems to be crucial. The centres are linked to schools, health centres, neighbourhood associations, churches, clubs and other municipal and provincial institutions (Municipalidad de Rosario, 1998). In cases of, for example, family violence or housing problems, the issues are referred to specific offices. Around 15,000 families are involved in the Crecer programme (Municipalidad de Rosario, 2003), including 5,000 children under five years of age (Inter‐American Development Bank, 2004). When one considers that the total number of households in slum areas is 22,685 (Fundación Banco Municipal, 1996), it can be seen that still more families can be targeted and reached by this programme.
The Social Enterprise Incubator Programme is an example of micro‐enterprise initiative within the Social Welfare Department. It involves a centre to promote male and female entrepreneurs in a deprived neighbourhood (Las Flores). This programme supports a building housing different social enterprises such as a carpentersʹ cooperative, a group of seamstresses, and a shoemakersʹ cooperative. Apart from the physical space, the municipality provides these groups with training and technical assistance in such areas as new production technologies, market identification and basic management skills (Inter‐American Development Bank, 2004).
Focusing on a specific population group, in 1997 the Social Welfare Department launched the Youth Employability Programme (ILO, 2004). The objective of the programme was to improve youth employability by providing a combination of training, education and work experience in different skills. This general programme coordinated the Oportunidad programme, aimed in particular at unemployed young people between 16 and 24 years of age, with little schooling and from poor neighbourhoods (Inter‐American Development Bank, 2004). Together with the private sector, the department identifies the particular skills in specific sectors of industry and services that are required.

64
The view is to promote social integration and personal development, since the participants are also encouraged to return to formal education. Between 1997 and 2003, it covered around 3,000 participants. In that period different neighbourhoods were targeted. There is no clear indication of a criterion for the prioritisation of these neighbourhoods, although recently it seems to have concentrated on those neighbourhoods targeted by Rosario Hábitat. This might suggest that the integration with other (existing) programmes is preferred. Although not explicitly stated in any of the policy documents consulted, the benefits of cross‐sectoral and coordinated actions within an existing area‐based policy are preferred to targeting other neighbourhoods independently.
The Social Welfare Department administers the national plan called Plan Jefes y Jefas de Hogar (Male and Female Headed Households Plan). This is a programme which targets people rather than areas, which means that the beneficiaries do not have to live in a particular neighbourhood. In Rosario, there are a total of 47,23237 recipients of this benefit, and it targets the specific group of unemployed household heads with at least one child under 18 years old going to school. This is clearly not geographically sensitive but targeted exclusively at families.
Finally, it should be noted that the local administration of Rosario has to accommodate health visits by inhabitants of neighbouring towns, generating a (positive) spillover effect that is paid for by the local residents. The city health system receives around 500,000 visits per year from non‐Rosarinos, at a cost to the city of about 10 million pesos per year (Westendorff, 2002). The dismantling of the (central government) welfare institutions is also a contributory factor. The responses to improve the welfare of the citizens, mostly generated by local government in Argentina, can be contrasted with the role the central government plays in the UK. The following sections explain the UK response to inequalities at central level and within the city of Liverpool.
4.4 Inequality in Western European cities As discussed before, inequality and poverty are not problems exclusively of developing countries (UNCHS, 2001), although income inequality is much higher in Latin America than in Europe. The problem of inequality in Europe is very much related to that of social exclusion/social cohesion and segregation. Increasing levels of inequalities within cities might be a symptom of the existence of this problem. Social exclusion within Western European cities is a common problem of debate and its relevance to area‐based policies is frequently addressed in the literature.
Referring to the Dutch case and particularly to the city of The Hague, Kruythoff et al. (1997) express the commonality and policy awareness of deprivation within Europe. The problem of deprived areas is not exclusively a Dutch problem and other cities have suffered this problem to an even greater degree. Kruythoff et al. mention the extended use of policy “to keep the contrasts between neighbourhoods and among population groups from getting out of hand”. The research carried out by Kruythoff et al. was commissioned by the Municipality of the Hague and the Dutch Ministry of Housing (VROM) to investigate the segregation problem and the policy measures taking place in six different European cities (The Hague, Barcelona, Birmingham, Brussels,
37 Lists of recipients, October 2004. Source: http://www.trabajo.gov.ar/programas/sociales/jefes.

65
Frankfurt and Lille). The comparative research lays emphasis on the influence of the housing system in the explanation of inequality, concluding that there are increasing income, unemployment and ethnic inequalities between urban areas in a more market‐oriented housing system (Priemus et al., 1998). The size of the areal unit of analysis within that research varies greatly, ranging from 1,620 inhabitants in Brussels to 165,000 inhabitants in Barcelona. As also recognised by the authors, it is evident that segregation tendencies are more markedly visible when an area is divided into smaller geographical units. The study also noticed an increment in socio‐spatial segregation in the cities of The Hague, Birmingham and Brussels.
It is interesting to note that some of the causalities or roots of segregation/inequality referred to in European cases are similar to those in cities such as Buenos Aires or Rosario. In the European cities (Priemus et al., 1998), the causalities recognised are the suburbanisation of the affluent, the influx of working‐class immigrants from abroad, the decline of the industrial sector, and cuts in government subsidies. As seen in the previous sections, the suburbanisation of the affluent, although later in time, is also taking place in Argentina (Bragos et al., 2001; Torres, 2001). The influx of working‐class immigrants from abroad can be compared to urban and rural migration that generates the slum areas (villas de emergencia) in Rosario or Buenos Aires. Similar causalities are also the decline of the industrial sector, which was pronounced in the metropolitan area of Rosario in the 1990s (Plan Estratégico Rosario (PER), 1998), and the cuts in government expenditure (due to externally imposed macroeconomic adjustments).
The role of the welfare state might explain some differences between cities and between Europe and Latin America. The above‐mentioned comparative research suggests that the “degree to which the residents of deprived areas are deprived depends heavily on the social assistance available to them” (Priemus et al., 1998). The authors suggest that this might explain the better position of cities in countries with strong social systems (Netherlands, France and Germany) compared with cities in the UK or Belgium, where “market‐oriented administrations have followed a more indirect method of counteracting impoverishment”. A report that compared social exclusion and integration in neighbourhoods in 11 cities in six European countries arrives at a similar conclusion38. In that research, Musterd and Murie (2001, p. 32) observe that when neighbourhoods are “within weak welfare state systems they are more likely to involve elements of greater inequality and crisis and there is a greater likelihood that households will have difficulty in coping with the circumstances which are experienced”. The same authors mention other key elements that limit and put neighbourhoods under risk, such as economic change and declining job opportunities; lack of market opportunities for low‐income households (e.g. employment, retail); limited quality and availability of public sector services (including housing); and limited strength of social networks (Musterd and Murie, 2001).
In the late 1990s, the UK was one of the European countries that implemented area‐based policies to reduce inequalities after decades of more market‐oriented
38 Amsterdam, Antwerp, Berlin, Birmingham, Brussels, Hamburg, London, Milan, Naples, Paris, Rotterdam.

66
administrations. The relevant role of indicators and indices of deprivation in the implementation and targeting of those polices should be noted.
4.5 UK planning context As stated before, the research of Priemus et al. (1998) suggests that the level of deprivation suffered by people living in deprived areas depends very much on the social assistance available to them. To understand the context of the city of Liverpool and the actions taken to cope with inequalities, the UK planning policy will be described in this section.
Cities are affected by nationally defined policies and goals, and in the case of the UK successive New Right governments (under Margaret Thatcher and John Major) “followed an economic policy that focused on national economic development largely irrespective of its consequences for the growth or decline of individual urban areas” (Pacione, 2001, p. 32).
The British urban policy that followed the second world war can be divided into five phases (Pacione, 2001):
The physical redevelopment phase lasted up to the late 1960s. Urban problems were seen in physical terms. The phase was characterised by slum clearance and the development of New Towns to decentralise the urban population.
The social welfare phase laid emphasis on improving the welfare of disadvantaged individuals and communities. During the 1970s, area‐based schemes were introduced but they operated from a “culture of poverty” perspective that considered poverty as self‐reproducing. However, the increase in unemployment and the oil crises in the 1970s made it clear that “the inadequacies of the poor” could not be the cause of urban deprivation. To address the root causes of urban decline with a multidimensional approach, the 1977 White Paper on policy for the inner cities combines environmental, economic and social programmes, and involves both central and local government. Caused by the need to improve the local economy, there was a shift away from New Towns to urban regeneration, which gave powers to local authorities to attract investment.
The entrepreneurial phase coincided with the Thatcher New Right Conservative government in 1979. According to Pacione (2001, p. 169), by competing in the global market the government expected a shift of resources away from traditional and inefficient industries to more flexible and competitive high‐technology sectors and production methods. To achieve such a transformation, the policy was centred on tax cuts and deficit spending, deregulation and privatisation, with geographically uneven impacts. The relation between central and local government was characterised by a transfer of power to non‐elected agencies; deregulation and reduction of local planning controls, encouraging property‐led regeneration; and partnerships between the central government and the private sector. Despite advantages for capital, property‐led regeneration has not succeeded in reviving the local economic activity.
The competitive phase started in the early 1990s. The policies applied since 1979 could not reverse urban decline, and the property‐based approach to regeneration was affected by the 1989‐1991 recession and a lower demand for property. The criticism of that approach is that it ignored “important ‘human issues’ such as affordable housing, education and training, social exclusion, and investment in basic infrastructure”

67
(Pacione, 2001). It promoted the competition between local authorities for urban regeneration funds. In 1994, the Single Regeneration Budget (SRB) combined the resources of 20 different programmes, and was a government response to the criticism that there was a lack of coordination between programmes.
The fifth phase started in 1997 with the New Labour government. In this phase, greater attention is given to the social consequences of economic policy. Goals such as the promotion of sustainable development, the rebuilding of neighbourhoods, and increasing economic opportunities for deprived areas have been established. The main characteristic of urban policy under the New Labour administration is the recognition of the interrelationship between the economic and the social dimensions.
Pacione (2001, p. 323) criticises the market‐led approach to urban regeneration and its supposed trickle‐down effect. According to this author, “in order to address problems of deprivation and disadvantage, urban policy must possess both a social and an economic dimension. It must be concerned as much about the distribution of wealth as about wealth creation.”
This concern has been addressed by the Department of the Environment, Transport and the Regions39 (DETR), which in November 2000 published the Urban White Paper called ʺOur Towns and Cities: the Future ‒‐ Delivering an Urban Renaissanceʺ. In this White Paper, the national government centres its goals and policies for urban areas. In an official press release, the Deputy Prime Minister John Prescott said:
ʺWe want to create sustainable communities in which everyone, no matter where they live, can enjoy a good quality of life ‐ communities in which economic prosperity and social justice go hand in hand … This is the only way we can successfully tackle the causes of urban decline, bring jobs and investment to disadvantaged areas, end an era of under‐investment and laissez‐faire planning and cut urban sprawl and wasteful use of landʺ (ODPM, 2000).
In this statement, it is clear that the new (Labour) administration wants to depart from the market‐led urban policy of previous decades. It also incorporates the issue of social justice and equality, which is also expressed in later policy reports, together with issues such as social exclusion and area‐based policies.
In the Urban White Paper, it is stated that all urban areas have to deal with certain challenges. One of them is “tackling the poor quality of life and lack of opportunity in certain urban areas” (DETR, 2000c, p. 4). It is also stressed that “To achieve a just society, we must reach the disadvantaged and excluded, helping everyone share prosperity and contribute to it” (DETR, 2000c, p. 8).
The importance of targeting disadvantaged areas was already expressed in an earlier report published by the DETR (1997) called “Regeneration Programmes – The Way Forward”. The governmentʹs regeneration policy aims to “tackle the combination of local needs and priorities associated with poverty and deprivation”. In that report, it is
39 After a series of reorganisations, the Department of the Environment, Transport and the Regions (DETR) became the Office of the Deputy Prime Minister (ODPM) in May 2002.

68
recognised that the task of regeneration is important where there are areas of multiple deprivation, areas that “are largely by‐passed by national economic success” (DETR, 1997, p. 3). Again, a social justice perspective and a moral concern can be found in the unacceptability of disadvantage within a prosperous society:
“it is unacceptable in an otherwise prosperous society to have large areas or numbers of people at a substantial and often growing disadvantage” (DETR, 1997, p. 3).
In its conclusion, this report expresses the importance of targeting and the concern about widening gaps (especially in income, unemployment rates, infant mortality and benefit dependency):
“Better targeting and concentration of resources are needed to prevent the excessive dilution of resources and ensure that an effective impact is made. The fact that in certain areas problems are getting worse and gaps are widening, [...] adds considerable force to the argument for better targeting” (DETR, 1997, p. 8). … “in many respects inequality between disadvantaged areas and other areas appears to be widening although lack of comparable data over time limits the amount of analysis it is possible to do” (DETR, 1997, p. 14) [emphasis in original].
The spatial concentrations of the inequality problems are also mentioned. The report expresses that (most likely) problems are becoming increasingly concentrated in social housing estates and in other small areas such as inner city neighbourhoods. However, it mentions the lack of data to probe further. In order to target smaller pockets of need, it suggests identifying the authorities with wards that are in the worst 10% nationally.
In May 2002, the Office of the Deputy Prime Minister (ODPM) became the department responsible for “policy on housing, planning, devolution, regional and local government and the fire service”. It is also responsible for the Social Exclusion Unit, the Neighbourhood Renewal Unit and the Government Offices for the Regions. The relevance given by the ODPM to inequalities and indicators is expressed by the fact that the ODPM has commissioned a group of universities40 to produce a Town & City Indicators Database. With this, the ODPM is trying to fulfil the objective of the Urban White Paper to establish a set of key indicators for urban analysis.
Neighbourhood renewal is one of the key strategies of the ODPM. The main characteristic of this programme is the application of area‐based renewal initiatives. The national plan New Commitment to Neighbourhood Renewal delivers aspects of the governmentʹs overarching strategy “to achieve social justice and quality of life for everyone”. The vision of the government is to narrow the gap between deprived neighbourhoods and the rest of the country. It states that:
“within 10 to 20 years, no‐one should be seriously disadvantaged by where they live. People on low incomes should not have to suffer conditions and
40 The Universities of Liverpool, Newcastle and Warwick.

69
services that are failing and so different from what the rest of the population receives” (ODPM, 2001, p. 8).
In one of its latest reports, the government mentions significant achievements since the national strategy was launched in 2001. The ODPM claims that “the gap between the poorest areas and the rest of the country in education, employment, crime and teenage conceptions has narrowed” (ODPM, 2005a). The report also claims that Local Strategic Partnerships have produced “impressive results” in cities such as Liverpool.
4.6 (Contrast) study area: Liverpool (UK)
Figure 4.8 Location Liverpool
The city of Liverpool is located in the North West region of England (Figure 4.8). Together with Knowsley, St Helens, Sefton and Wirral, it forms the Merseyside area with 1,362,034 inhabitants. Liverpool is situated on the eastern bank of the River Mersey estuary and, according to the 2001 census, has a population of 439,473 inhabitants. This figure represents a loss of 36,100 inhabitants (‐7.6%) compared with the previous census (ONS, 2003).
Liverpool was recognised as a town in 1207. Its port grew slowly but in the 18th century saw massive expansion, with a population reaching approximately 20,000 inhabitants in 1750 and 80,000 in 1800 (The Mersey Gateway project, 2003; The Mersey Partnership, 2003). Strong trade linked the city with the West Indies, North America, Africa and Europe, and later in the 19th century with India and China as well. Liverpool was an important centre for the slave trade, and raw materials from Liverpool and goods from Manchester were sold in Africa and replaced by slaves (The Mersey Partnership, 2003).

70
By the middle of the 19th century, Liverpool was the most important port after London. By 1821 the population had grown to 119,000 inhabitants and by 1871 to 493,000 (The Mersey Gateway project, 2003). The growth in trade and jobs brought massive population expansion and immigration (mostly Irish), with the population reaching approximately 685,000 inhabitants by 1901 (The Mersey Gateway project, 2003). Liverpool also transported people to the Americas until the 1950s. The wealth of the ship owners and merchants generated many contrasts in the city, between their houses and the slum areas with problems of overcrowding, malnutrition and disease.
Figure 4.9 Liverpool population growth 1700‐2001. Sources: The Mersey Gateway project (The Mersey Gateway project, 2003); UK Census 2001 (ONS, 2003)
The population of Liverpool reached its highest ever in 1937, numbering 867,000 inhabitants (The Mersey Gateway project, 2003). During the 1930s, the decline in world trade (particularly with the USA) brought unemployment to the city (The Mersey Partnership, 2003). During the second world war, Liverpool was the most bombarded city outside London, and slum clearance resulted from the re‐building after the war. During the 1950s and 1960s, the city experienced a period of economic growth, with good employment and the re‐emergence of world trade (The Mersey Partnership, 2003). Throughout the 1960s, there was a movement of population from the inner city areas to the satellite towns, which explains the beginning of the decline in population (see Figure 4.9).
In the 1970s, Liverpool and Merseyside suffered from a global recession and were affected by de‐industrialisation. As trade with the Commonwealth retreated, the European Union became Britain’s main trading destination. Liverpool’s port location was unsuitable for trading with Europe, and the decline in port labour and shipbuilding was one of the consequences. Although one of the solutions was to develop new industries, Liverpool “had a very large pool of unskilled labour with a reputation for volatility” (The Mersey Partnership, 2003).
During the 1980s, the city suffered decline and many social problems, the riots of 1981 in the Toxteth neighbourhood being one of the consequences. In the 1980s and
Liverpool Population Growth 1700-2001
80,000
286,487
493,405
684,958
867,000
610,000
477,000
53,853
510,000
6,000
118,972
745,000
439,473
20,0000
100,000
200,000
300,000
400,000
500,000
600,000
700,000
800,000
900,000
1,000,000
1700
1750
1790
1800
1821
1841
1871
1901
1937
1961
1971
1981
1991
2001

71
early 1990s, many of the city’s most vulnerable neighbourhoods were badly affected by the restructuring of the economy. In that period, and during the entrepreneurial phase of the urban policy in the UK, the central government introduced incentives to bring investment back into the city. An example of this action is the regeneration of Liverpool’s riverside and the restoration of the docklands into a complex of restaurants, shops, offices, museums and expensive housing (The Mersey Partnership, 2003). However, Liverpool is still one of the most deprived cities in the UK.
At that time, Liverpool lost 22% of its population and 18% of its jobs (City of Liverpool, 2002a). The cause of the loss of population can be explained by a combination of factors. First, the de‐industrialisation during Thatcher’s New Right Conservative government generated loss of jobs in the traditional industry. Secondly, there was a migration of more mobile and affluent groups to the suburbs, leaving in the city centre the older and the more deprived groups. Besides, there were natural losses in the ageing population (Lupton, 2004). According to Lupton (2004), “original inner city residents dying or moving away tended not to be replaced, as the overall population distribution of the country as a whole tilted towards the more prosperous south east and to smaller cities and towns with strong service industries and without the declined industrial legacy of the major conurbations”.
Between 1991 and 2001, the city centre population increased from 2,300 to more than 9,000 (ODPM, 2004c). The recovery in this area can be explained by the process of gentrification through the location of professional households (mostly childless) in renovated areas (see Figure 4.10 b) and by the growth in student numbers and their location outside university halls of residence and in inner urban neighbourhoods close to university campuses (Lupton, 2004).
Figure 4.10 a: Regeneration of Liverpool’s riverside and dockland; b: Regeneration in the city centre; c‐d: Vacant properties

72
During the last 10 years, there has been a trend that shows some improvement in a couple of indicators. Between 1995 and 2001, there was an increase in Liverpool’s per capita gross value added (indicator of local economic growth) of 44.4% (above the national average of 35.0%) (ODPM, 2004c). More jobs were created and the unemployment rate continuously dropped in Liverpool, from 16.2% in 1996 to 10.9% in 2001.
However, in relative terms, according to the Index of Multiple Deprivation 2000 (DETR, 2000d), Liverpool is the fifth most deprived urban area in England and 69% of its population is living in the 10% most deprived wards of England (ODPM, 2002). Twenty‐six of its 33 wards are in the “worst” 10% wards (City of Liverpool, 2002a). The unemployment rate is 6%, which is considerably higher than the 3.4% average for England and Wales (ONS, 2003). Liverpool ranks second on the Indices of Deprivation for employment deprivation and income (City of Liverpool, 2002a). Speke, Everton, Vauxhall and Granby are within the worst 10 wards, according to the Index of Multiple Deprivation 2000 (see Figure 4.11). According to the Index of Multiple Deprivation 2004, the percentage of the population living in low‐income families ranged from 10% to 18% in the worst ward (see Figure 4.12).
Figure 4.11 Index of Multiple Deprivation 2000 ranking of Liverpool wards. Own elaboration based on: Department of the Environment, Transport and the Regions, Indices of Deprivation 2000. Map source: 2001 Census, Output Area Boundaries41.
41 Source: 2001 Census, Output Area Boundaries. Crown copyright 2003. Crown copyright material is reproduced with the permission of the Controller of HMSO.

73
According to a DETR report (DETR, 1997) on the city of Liverpool, benefit dependency is very high on deprived social housing estates. The same report expresses that lone parent households are concentrated in deprived areas, “being three times more likely to live in some London boroughs and Liverpool, Knowsley and Manchester compared with the England average”. However, the infant mortality rate in Liverpool is lower than the North West average (DETR, 1997, p. 15).
Figure 4.12 Income deprivation, percentage of the population living in low‐income families. IMD 2000, IMD 200442. (1998 and 2001 benefits data)
Since the second half of the 1990s, the number of partnerships between the public and private sector to regenerate the area has been increasing. The city of Liverpool also became eligible for the European Union Structural Funds Objectives 1 and 2 (2000‐2006), its gross domestic product per capita being less than 75% of the EU average (Couch and Dennemann, 2000, p. 147). To improve the situation of the most deprived neighbourhoods in particular, different actions are being taken by the local authority and by partnership groups. The most relevant ones are Liverpool First, the Liverpool Neighbourhood Renewal Strategy, and Liverpool Vision. Although they are funded by existing partnership initiatives, in most of the cases they are triggered and supported by national government requirements and initiatives.
42 Source IMD 2004: Office of the Deputy Prime Minister, Indices of Deprivation 2004. Crown copyright 2003. Crown copyright material is reproduced with the permission of the Controller of HMSO.

74
4.7 Liverpool First: a community strategy In the year 2000, the UK Parliament passed a Local Government Act. The first part of the Act, called “Promotion of Economic, Social or Environmental Well‐Being”, requires local authorities to produce a “community strategy” promoting economic, social and environmental well‐being:
”Every local authority must prepare a [community] strategy ... for promoting or improving the economic, social and environmental well‐being of their area and contributing to the achievement of sustainable development in the United Kingdom” (Part I Section 4. ‐ (1) Local Government Act 2000).
The origin of such requirements and the importance of partnership in the development of community strategic plans are described in the explanatory notes accompanying this Act. The explanatory notes state that “In the White Paper, Modern Local Government: In Touch with the People [July 1998], the Government set out its view that community leadership should be at the heart of the role of modern local authorities” (DETR, 2000a). It also adds, citing the same White Paper, that “authorities would need the freedom to work with other local public, private and voluntary organisations to develop solutions to local problems”. The White Paper also proposes that authorities should be required to draft community strategies “developed [in partnership] with local people, business, public and voluntary organisations” … “to promote the well‐being of their local community” (DETR, 2000a).
The City Council of Liverpool, responding to this Act, works with the Liverpool Partnership Group (LPG), which is responsible for the production and implementation of Liverpoolʹs Community Strategy. Since 1997, the Liverpool Partnership Group has been effectively the City’s Local Strategic Partnership (City of Liverpool, 2002a). The Liverpool First Workbook and the Liverpool Neighbourhood Renewal Strategy together form the Community Strategy of Liverpool.
In the Urban White Paper’s North West regional case study, Liverpool First is presented as an “overarching strategy for the City of Liverpool” (DETR, 2000e, p. 3‐4). Created in 1999, Liverpool First is the framework for a 10‐year programme that integrates the actions of different partners throughout the whole city of Liverpool. It is a framework for social, economic and environmental regeneration, and its main goals encompass equality and social justice. Three overarching policy frameworks are mentioned (DETR, 2000e): competitiveness, jobs and the learning age; equality, social justice and local democracy; and city living and environmental sustainability.
According to the Consultation Workbook of Liverpool First, there is a vision for Liverpool “to become a premier European City. Achieved by building a more competitive economy, developing healthier, safer and more inclusive communities and enhancing individual life chances” (Liverpool Partnership Group, 2002). Liverpool First also aims “to make the most of the city’s assets and opportunities and to ensure that all of Liverpool’s communities can contribute to and share in sustainable prosperity and a good quality of life for the city” (City of Liverpool, 2002a). It is also recognised that Liverpool First sets a “key strategic imperative to reduce the polarisation and spatial

75
concentrations of deprivation and social exclusion which undermine the city’s prospects of growth and prosperity” (City of Liverpool, 2002a, p. 5)
From the six principles taken into account in the Liverpool First Community Strategy, the principle of social inclusion is the one that relates most to the aspects of social justice and inequality described in the second chapter of this book. Liverpool First (Liverpool Partnership Group, 2002, p. 45) stress that they “are making positive efforts to focus on and help people or areas experiencing a combination of linked problems such as unemployment, poor skills, low incomes, poor housing, high crime, poor health and family breakdown”. The actions mentioned are “[reducing] the numbers who go through experiences that put them at risk and targeting action to compensate for the impact of these experiences”. These actions show a clear social justice and compensatory approach. The same moral perspective is emphasised by another action aimed at “[the provision] of clear ways back into mainstream society for those who have lost their job or their housing, missed out on learning, etc.”. There is also a clear normative approach, with a notion of basic rights in the final action aimed at “getting the basics right – delivering basic standards to everyone – in health, education, employment, housing, environment and in tackling crime”. Most of these actions are replicated in the Neighbourhood Renewal Strategy and are particularly focused on 20 priority neighbourhoods.
4.8 Liverpool Neighbourhood Renewal Strategy (LNRS) The Liverpool Neighbourhood Renewal Strategy (LNRS) is the local response to the national New Commitment to Neighbourhood Renewal plan, which, as described earlier in Section 4.5, says that “no‐one should be seriously disadvantaged by where they live”.
The LNRS plan sets two long‐term goals: “To narrow the gap on these measures between the most deprived neighbourhoods and the rest of the country” and “In all the poorest neighbourhoods, to have common goals of lower worklessness and crime, and better health, skills, housing and physical environment” (City of Liverpool, 2002a). This plan operates at national, local, and area levels (see Figure 4.13).
At national level, it functions through the Public Service Agreements (PSA). Public agencies and government departments set targets for employment, housing, crime, education and health for the 10% most deprived English wards. At local level, it operates through the Local Strategic Partnerships (LSP). Within the local Neighbourhood Renewal Strategy, these provide solutions for their own particular areas. Finally, it operates at area level through the Neighbourhood Action Plans. Designed with local communities, they translate national targets into actions according to their area needs.
At local level, the Liverpool Partnership Group (LPG) was accredited as a Local Strategic Partnership (LSP) in February 2002 and developed the Liverpool Neighbourhood Renewal Strategy (LNRS). At area level, there are 20 Neighbourhood Action Plans. These area‐level plans are integrated under five Cluster Strategies, which set out detailed objectives and targets. Local regeneration partnerships have existed in Liverpool since 1995, covering 50% of the city and funded through the European Merseyside Objective 1 Programme. There are 11 Pathways partnerships and five of

76
these areas received extra financial support from the Single Regeneration Budget43. The partnerships, which have community involvement, promote skills, employment and economic development in order to tackle social and economic deprivation (City of Liverpool, 2002a, p. 7). In 2001, they were grouped into five regeneration districts or clusters.
“within 10 to 20 years, no-one should be seriously disadvantaged by where they live”
New Commitment to Neighbourhood Renewal Plan
Liverpool’s Community Strategy: “Liverpool First Workbook”Liverpool Neighbourhood Renewal Strategy
Office of the Deputy Prime Minister:Social Exclusion Unit,Neighbourhood Renewal Unit
Public Service Agreements (PSA)
Local Strategic Partnerships (LSP)
Neighbourhood Action Plans 20 Neighbourhood Action PlansTranslate PSA targets into actions
5 Cluster Partnerships (regeneration districts)
National level
Local level
Area level
Liverpool City CouncilThe Liverpool Partnership Group (LPG)
Public agencies and government departments
PSA targets
Partnerships with community involvement
Figure 4.13 The New Commitment to Neighbourhood Renewal applied at national, local and area
levels
The Cluster Partnerships gather together LPG partners, local businesses and communities for “the task of co‐ordinating regeneration action on the ground” (City of Liverpool, 2002a, p. 8). According to the LNRS plan, they also provide “a means of bringing the LPG into the community and of ensuring that local priorities are reflected in city‐level inter‐agency working”. The 20 neighbourhoods chosen as Neighbourhood Renewal Areas are located in the 26 Liverpool wards in the worst 10% group, following the Indices of Deprivation 2000. According to the LNRS plan, for the main part they are in the most deprived 5% of 8,400 wards in England (City of Liverpool, 2002a, p. 7). Even though the LNRS has a “clear geographic focus” it tries to target not only areas but also disadvantaged groups such as ethnic and cultural minorities through a policy of equality of opportunity (City of Liverpool, 2002a, p. 12).
The LNRS claims to be a plan with both a top‐down and bottom‐up process approach: top‐down because it has strategic targets developed by the LPG as policy
43 The Single Regeneration Budget (SRB) started in 1994 and combined the resources of 20 different programmes.

77
advice to the clusters and the neighbourhood areas; and bottom‐up because key community priorities, after local community consultation, are referred by the clusters to the LPG (City of Liverpool, 2002a, p. 10).
One of the challenges expressed in the LNRS plan is to combine both competitiveness and social inclusion. The plan states that “opportunities and needs have an important spatial dimension”, in the sense that they want to maximise the relationship between the centres of economic activity (e.g. the city centre) and the areas of “greatest social, housing and economic need” (City of Liverpool, 2002a, p. 6). The challenge, as put by the LNRS in the plan introduction “Aims and Objectives”, is to try to find better outcomes from mainstream services to “close the gap between the most and the least deprived neighbourhoods”. The LNRS recognises that reducing inequalities, or as they put it: “narrowing the gaps between the most and the least deprived communities of the city”, will also have an impact on the competitiveness and attractiveness of Liverpool (City of Liverpool, 2002a, p. 37). One of the challenges for the plan is that it is almost impossible for the Liverpool local authorities to re‐direct spending from “better” to more deprived areas. This limitation derives from the fact that Liverpool is one of the 16 local authorities where more than half of the population lives in the 10% most deprived wards of England. Liverpool is one of seven areas where the ratio of deprived to “better” areas is 70:30 (City of Liverpool, 2002a, p. 12).
The aim of the LNRS is “to support the Liverpool First vision of an inclusive premier European city by building thriving and sustainable neighbourhoods to level the playing field across Liverpool and to narrow down the gap with the rest of the UK”.
The LNRS plan follows the (national) New Commitment to Neighbourhood Renewal structure with six action fronts.
Reviving local economies This follows from the national policy that employment is “the best, permanent route out of social exclusion” and the fact that Liverpool ranks no. 2 on the Indices of Deprivation for employment deprivation and incomes. Unemployment in the 20 Neighbourhood Regeneration Areas is up to twice the Liverpool average and up to four times greater than the UK average. The Neighbourhood Regeneration Areas also contain 59% of the city’s population but 81% of its registered unemployed residents (City of Liverpool, 2002a, p. 16).
One of the strategies of the LPG states the objective of reducing “the gap in relation to worklessness and incomes between Liverpool and the rest of the country and to narrow the disparities within the city as a whole” (City of Liverpool, 2002a, p. 17).
Safe and stable communities This focuses on three sub‐aspects: education, crime and community safety, and housing.
One of the main housing problems in Liverpool is the high housing vacancy levels. The inner core (city centre) has vacancy levels of 16%, compared with 9% for the whole city. One third of the private sector homes are “unfit or in disrepair” (City of Liverpool, 2002a, p. 22). Actions to improve this situation vary from tenure and household income diversification to clearance of redundant stocks.

78
In terms of education, raising attainment level is the main objective, although it has been recognised that progress is being made, including in schools within the most deprived areas.
In terms of crime and community safety, the point of departure is the fact that eight of the wards in which the 20 priority neighbourhoods are located have burglary rates above the national rate (City of Liverpool, 2002a, p. 27).
Decent services This focuses on health and those mainstream services “which help to make neighbourhoods attractive places to live”.
Health starts from the baseline that Liverpool has one of the lowest levels of life expectancy for men and women. The life expectancy for males is 71.69 years and for females 76.97 years, compared with the English life expectancy of 75.20 and 80.10 years respectively. Actions to improve this include immunisation programmes, improved National Health Service access, encouraging breast‐feeding, prevention of child poverty, educational attainment, and teenage pregnancy prevention. The plan recognises that “The reasons for health inequalities are complex and rooted in inequality and poverty and tackling them requires concerted action at all levels” (City of Liverpool, 2002a, p. 30).
The LNRS plan recognises the importance of action on the underlying causes of ill‐health, and these will be targeted by other areas such as education, jobs, housing, environment and community safety.
In terms of services, it expresses the need for “a specific focus on the ‘liveability’ services – environmental maintenance – as well as estate management, on‐the‐spot housing management and links with crime and community safety services”. Involving communities The LNRS finds the engagement of the communities a prerequisite for sustainable change, and consequently their participation has been taken on board in the strategy development.
Effective information The role of information seems to be very important in the LNRS and, in fact, is one of the six action fronts described in the framework and action plan. Here, the use of effective information for better targeting and for tracking change is particularly addressed.
An information platform was set the task of gathering data as the baseline for the LNRS floor targets. This approach follows the national awareness of the New Commitment to Neighbourhood Renewal plan “about the importance of accurate data and analysis to set targets, track change and alter course if necessary” (City of Liverpool, 2002a, p. 10). However, the LNRS framework and action plan express the problem that, even though they wanted to gather data at Neighbourhood Regeneration Area level, in many cases they could only do so at ward level because of the problems of disaggregating to small areas (City of Liverpool, 2002a, p. 10). The need to use qualitative data is also mentioned, suggesting the need to measure residents’ perceptions of change and service improvements in their neighbourhoods.

79
Also mentioned is the importance of sharing information through the different partners, particularly for “capturing spend and impacts” (City of Liverpool, 2002a, p. 35).
Finally, it stresses the importance of a database with best practices for dissemination to the different partners.
Leadership and joint working The final action front is related to the importance of the integration and joint working of the plan at three levels: the city, the five clusters and the 20 Neighbourhood Regeneration Areas. The importance of capacity building is stressed in a skills and knowledge programme through the different partners to improve the delivery of the LNRS.
In the following section, the concrete application of the action fronts within a cluster is explained.
4.9 The South Liverpool Partnership Cluster Strategy The South Liverpool Cluster Partnership is one of the five clusters. It encompasses the six wards of Speke, St Marys, Valley, Netherley, Allerton and Woolton and has 70,339 inhabitants (City of Liverpool, 2002c). It is characterised as an area of contrasts, with some neighbourhoods facing significant social and economic challenges while others enjoy relative affluence (Figure 4.11).
Following the LNRS, these are some of the actions and programmes that are more directly related to reducing inequalities and improving the most deprived areas. Reviving local economies One of the challenges facing the LNRS is to combine both competitiveness and social inclusion. The plan states that “opportunities and needs have an important spatial dimension”, in the sense that they want to maximise the relationship between the centres of economic activity and the areas of “greatest social, housing and economic need” (City of Liverpool, 2002a, p. 6). In Liverpool, some areas of growth are surrounded by areas of acute deprivation. This is the case of Speke in South Liverpool, which is next to the new airport and the estuary development. This duality is described in the South Liverpool Strategy:
“[The South Liverpool Partnership area] is an area of great contrast including some communities that are coping with the highest levels of multiple deprivation and others that enjoy relative affluence [...].Their neighbours include the fast growing Liverpool John Lennon Airport, Garston Docks, significant areas of industrial and commercial development and the growing Mersey Retail Park. Nearby in the adjoining local authority area of Knowsley is the Jaguar car plant” (City of Liverpool, 2002c, p. 2).
One action that combines economic growth with the possibility for deprived areas to grow is the Speke/Halewood Strategic Investment Areas (SIA). It covers South Liverpool, an economic growth area that benefits from European Objective 1 funding. According to the South Liverpool Strategy, it represents economic opportunities for residents of South Liverpool. One of its main projects is the Liverpool John Lennon Airport.

80
The vision of Speke Halewood SIA is to create “an industrial and business friendly zone focused on output growth and creating sustainable employment opportunities (focused on) a major new economic development ‘growth pole’ ...“. Actions are focused around three strategic objectives: environment, economy and equity. The SIA Delivery Plan focuses not only on economic or physical aspects such as developing locations or developing business, but also on developing people. This aspect involves “preventing youth exclusion, enhanced supply of training and education, equity in the labour market, support for the workforce, developing JET South Liverpool and improvements to public transport”.
An example of the actions taken to reduce unemployment are the Jobs, Education and Training services (JETs44), which link the local regeneration partnerships and employers and are located in each of the five cluster partnerships. Being “labour market intermediaries”, they develop and coordinate local skills and employability programmes. At the same time as they guide work seekers to training and jobs, they also provide a recruitment service to employers. The JET South Liverpool has helped over 2,000 people into training, given advice to over 6,000 people, and helped over 1,700 local people to gain employment (City of Liverpool, 2002c).
Other actions try to “get people to work” by providing transport to jobs in areas with poor transport connections or childcare support.
One of the actions to improve the economic situation is the development of the social economy or the social enterprise45. In the case of South Liverpool, it includes varied actions, among others, the provision of affordable childcare and business support for small businesses (SMART); training (STEC: Speke Training and Education Centre); a community‐run community centre that offers a café, a laundrette and meeting rooms; a community transport scheme (LIFT); and the Riverside Credit Union. According to the plan, they focus on two key areas:
“The development of self sustaining community businesses which build upon opportunities to share resources between different communities and the potential created by the social enterprise. The delivery of local services which are additional to those supplied by mainstream service providers” (City of Liverpool, 2002c).
Safe and stable communities In terms of housing, the main characteristic within the cluster is the demolition of vacant houses and the improvement of former council housing stock. South Liverpool Housing (SLH) is the local housing company with the responsibility for clearing redundant stock among the 4,400 homes transferred to the company in 1999. One of the objectives of the cluster is to ensure that where demolition and relocation occurs, “it retains the identity of communities and creates decent homes”; another is to “ensure that new housing development takes into account the needs of vulnerable groups, especially the elderly”.
44 They started in the late 1990s with European Objective 1 and national SRB funding. 45 The concept of social enterprise is also used in Rosario (subsection 4.3.5).

81
Several actions are being taken to reduce crime under the City Safe partnership, including crime prevention and drugs reduction. It is interesting to note that City Safe not only coordinates several programmes but also monitors the progress against targets.
In terms of education, the application of area‐based policies is also noted. The ward Speke benefits from Education Action Zone, a five‐year programme initiated in January 2000 that will invest £ 5 million in education in the area. One of its strategic objectives is promoting social inclusion through every intervention. Another interesting programme is Partnership for Learning, a complex that aims to offer up to £250,000 of free or heavily subsidised training a year to the local community. It is supported by the training budgets of companies located in the area, such as Jaguar, Glaxo Smith Kline, Eli Lilly and Evans. Speke Sure Start targets pre‐school children to ensure that they are prepared when they start school. It includes a family centre offering advice and support to parents, a nursery, and access to health care and lifelong learning courses. Better core public services Primary care and social care are coordinated by the South Liverpool Primary Care Trust (PCT). One of its objectives is to address the national health inequality targets aiming at existing inequalities within the population: by the year 2010 “to reduce by at least 10% the gap between the quintile of areas with the lowest life expectancy at birth and the population as a whole”, and “to reduce the conception rate among under 18s in the worst quintile of wards by at least 60%” (City of Liverpool, 2002c). Health actions also target specific groups such as young people, the elderly, drug users and the unemployed.
One of the key roles then of South Liverpool is to enable partners to maintain an overview of the regeneration and key service needs of the cluster and its priority neighbourhoods. In this respect, it is very similar to the role of the Strategic Plan of Rosario (subsection 4.3.1), but at a district and neighbourhood scale. In general terms, the role of South Liverpool is to coordinate, develop and oversee the delivery of the Liverpool Neighbourhood Renewal Strategy in the area (as Cluster Strategy and Neighbourhood Action Plans) to apply the national and local Public Service Agreement targets to the priority neighbourhoods46 in South Liverpool.
The Cluster Strategy recognises three cross‐cutting themes: equality of opportunity, community engagement and the role of the voluntary sector, and building skills and capacity for regeneration. In terms of equality of opportunity, projects such as JET (see p. 80) and CREATE are examples in this direction. CREATE is related to the development of the social economy and it recycles white goods (freezers, washing machines) and provides salaried positions for the long‐term unemployed. The refurbished items are then sold cheaply to people in need. Apart from the benefits of diverting white goods from landfill, it also offers training to the long‐term unemployed. In terms of community engagement and related to participatory policies, the strategy plan formulation included three conferences during 2001 directed at local residents. From these conferences, priorities were identified and then circulated to over 450 community and voluntary groups. Further meetings with local agencies and community
46 Speke, St Mary’s, Netherley, Valley

82
groups took place until March 2002. The theme “Building Skills, Competencies and Capacity for Delivery of Change” emphasises the improvement of the institutional capacity, community capacity and professional skills to support the LNRS. Training and disseminating best practices among practitioners of different clusters are among the activities to fulfil that aim.
Finally, in terms of resources and funding, it is worth noting two of the recommendations that emphasise the importance of the geographical aspects in allocating resources and the difficulties in estimating the levels of spend in each of the priority neighbourhood areas.
“Changes need to be made to ensure more reliable and accurate data collection methods ... the following steps will be taken: The design and implementation of more detailed accounting systems to record expenditure by geographical location, including the Neighbourhood Renewal areas ... The establishment of service level agreements with key partners to ensure that more accurate, detailed area‐based expenditure information is available in subsequent years” (City of Liverpool, 2002c).
4.10 Liverpool Vision Within the local Liverpool strategy, Liverpool First recognises the vital role that the Liverpool city centre plays in the regeneration of not just Liverpool but also Merseyside and the North West region. In this context, Liverpool Vision is a regeneration agency that was established in 1999 as a partnership between the national regeneration agency, the developing agency of the North West region, the Liverpool City Council and the private sector. Together with resources from Europe (Objective 1) and the national government, Liverpool Vision is a regeneration company specifically for the city centre. The importance given to this area can be attributed to its relevant role in the region. The city centre “has the largest concentration of employment on Merseyside, comprising some 85,000 jobs across 2,500 businesses” (City of Liverpool, 2002a, p. 4). It is also regarded as “the hub of the public transport system and the largest centre for shopping, higher education, leisure, tourism, cultural activity and entertainment” (City of Liverpool, 2002a, p. 4).
Liverpool Vision published its strategic plan for the city centre in July 2000. The strategic regeneration framework establishes its vision or aim of “establishing Liverpool as a world class City of the 21st Century” (Liverpool Vision, 2000). The strategic plan is self‐defined as:
“a flexible framework to evaluate initiatives and to set out criteria that bring about a boost to wealth creation and investment and therefore sustainable job creation in the wider context of the City” (Liverpool Vision, 2000).

83
It has a comprehensive list of strategic goals that are mostly related to attracting investment and visitors47, but it also considers social aspects such as “To establish inclusive communities and a skilled and adaptable workforce able to contribute to and share the benefits of sustainable economic growth” (Liverpool Vision, 2000).
The plan establishes seven (geographical) action areas, in particular areas of the city centre, such as the train station (Lime Street). “Reinforcing City Communities” is one of the main themes closely related to the issue of inequalities, as can be seen from the following paragraph (Liverpool Vision, 2003, p. IV 50):
“competitiveness and social inclusion are twin elements of the same process, generating mutually reinforcing impacts. Sustainable economic growth is dependent on the eradication of the social and economic inequalities that undermine growth and prosperity. Increased social cohesion, in turn, will support the continuing expansion of the City Centre through a skilled workforce and higher local spending power.”
This clearly shows the willingness not only to generate investment and wealth through the regeneration but also establish a link between economic growth and equality, thus turning away from the more market‐oriented policies that characterised UK planning in previous decades. Specifically, the plan establishes the following strategic objective: “[to] reinforce City Communities by making the most of current and future City Centre opportunities so that economic and social disparities between communities are eradicated” (Liverpool Vision, 2003, p. IV 50). It lists particular interventions, mostly related to promoting employment and improving the employability of the population but also related to issues such as the reduction of crime, the provision of affordable housing in the city centre, and a walk‐in health centre.
4.11 Conclusions The discussions in the previous sections can generate some conclusions regarding similarities as well as differences between Liverpool and Rosario in terms of both inequality problems and the local policy approach to tackle them.
First of all, the difference in terms of income inequality should be highlighted. While in the UK the average income of the richest quintile is 4.9 times that of the poorest, in Argentina it is 21.8 times. This shows not only a fairer distribution of wealth but also a much stronger welfare system in the UK.
Both in Argentina and in the UK during the 1980s and at the beginning of the 1990s there was an emphasis on ideologies related to the free market. However, in the second half of the 1990s, there was growing awareness among policy makers of the problems that these policies caused for the most disadvantaged.
The analysis of unemployment and income deprivation in Rosario and Liverpool can lead to further conclusions. The unemployment rate continuously dropped in Liverpool, from 16.2% in 1996 to 10.9% in 2001. On the other hand, in Rosario
47 The strategic plan specifically supported Liverpool’s bid for the European Capital of Culture in 2008 and the construction of flagship projects such as the Fourth Grace for the celebration of the city’s 800th anniversary.

84
unemployment almost doubled between 1991 and 2001, growing from 10.9% to 20.1%. This can be explained by the socio‐economic and political crisis that erupted in Argentina in December 2001. The high unemployment rate in Rosario is reflected by the percentage of the population living under the poverty line, which reached 42% of the population in 2004. Income deprivation is captured in the UK through the Index of Multiple Deprivation. The 2004 index shows that the percentage of the population living in low‐income families was 30.6%. However, comparisons between the two measures are difficult to make because income deprivation in the UK is operationalised as the proportion of people “living in families reliant on means tested benefits”, whereas in Argentina it is operationalised as the proportion of people living in “households with an income inferior to acquire a basket of food and services”48.
From these figures, it can be seen that both cities have relatively high levels of poverty and deprivation. The origin of such inequalities can be explained by the de‐industrialisation that took place in the 1970s and affected their metropolitan areas. They have a similar history of social unrest (1989 lootings in Rosario and 1981 riots in Toxteth) arising from these socio‐economic problems, which can be seen as stemming from common roots and the consequences of inequality. Rosario in particular suffered from the general crisis that affected Argentina in 2001.
However, the location (and characteristics) of the deprived areas differs between the two cities. In the case of Liverpool, there are deprived areas in the city centre too, whereas in Rosario they are mostly concentrated in the periphery. This can be explained by the fact that Liverpool was affected by a population loss, leaving a residual, less mobile and deprived population in the city centre. On the other hand, Rosario attracted the migration of already impoverished groups, which settled in the periphery, either in existing slums or generating new slum areas. In this respect, deprived areas in Rosario are characterised by the development of slum areas (villas de emergencia) and in Liverpool by the deterioration and unoccupancy of the existing stock and in social housing estates. In the case of Rosario, the city centre is one of the least deprived areas and one of the best served, with a high concentration of health and education facilities. This can be explained by the characteristics of the Latin American cities, which (in comparison with other cities in the developed world) exhibit economic viability in their city centres, showing they do not suffer from economic and population decline (Pacione, 2001). The dominant role of the city centre can be explained by the continuing focus of the public transport network on that area and by the presence of the middle class (Pacione, 2001). This is certainly the case in Rosario, and the highly unequal distribution of facilities, favouring the city centre, was also one of the reasons why it was decided to decentralise the city.
In terms of policy approach, some similarities can be found, particularly in the expressed will to reduce inequalities and in the criticism of previous policies that were more market‐oriented and had less “equalising will”. Community participation in the formulation of strategies and actions exists in both cities. The regeneration of the riverside is present in both cities, although it started in Rosario in the 1990s and on a much smaller scale, with emphasis on the recreational use of the coast. Apart from 48 Although neither census collects income data, in Argentina the poverty line is calculated from the EPH survey, which obtains income data.

85
having clear intentions of improving the social aspects, both cities try to set the city in the regional and global context ‒ in the case of Liverpool through events such as the Cultural Capital of Europe 2008, and in the case of Rosario by being the Spanish Language Capital 2004. Again the resources available for both events are much scarcer for Rosario.
Some of the differences in the capacity to tackle inequalities can be explained by the availability of funds in Liverpool from national and supranational bodies such as the European Union Structural Funds Objectives 1 and 2 (2000‐2006). In Rosario, there is no similar fund from the MERCOSUR to reduce inequalities between the most deprived areas, and the main impact on reducing inequalities is expected to come from the Rosario Hábitat Programme, which has finance from the Inter‐American Development Bank.
The involvement of the national government in the reduction of inequalities between different neighbourhoods is only present in the UK, and it is reflected locally in programmes that try to fulfil the nationally agreed targets. This can explain a longer tradition in the application of indicators and area‐based policies. In this respect, urban regeneration policies and area‐based initiatives introduced by the British central government and implemented at local level might be a distinctive approach to solve inequalities.
One of the main differences between social and area‐based programmes in Liverpool and Rosario is that in Liverpool the private sector is actively involved in the partnerships (e.g. in Speke). Although the private sector participated in formulating the Strategic Plan of Rosario, there is no clear contribution of the private sector to Rosario Hábitat.
The diffusion of indicators ‒ baseline but particularly target indicators ‒ is notoriously larger in Liverpool than in Rosario. Indicators are present in almost every policy document consulted in this research. The prioritisation of neighbourhood areas is also clearly based on the ranking of wards within Liverpool. From the policy reports consulted, some aspects related to inequality start to arise: education, health, income, employment, housing and crime.
The use of indicators and GIS can help to monitor the inequalities that affect the different areas of the city but, as said before, they must be related to policies. Thanks to a series of interviews, the following chapter tries to describe and analyse how local policy makers in Rosario and Liverpool perceive inequality, which aspects they find more relevant, and their usage (or not) of indicators to monitor these processes. At the same time, and particularly in the case of Liverpool, we try to see how they apply compensatory (area‐based) policies to reduce inequalities.


87
Chapter 5 Inequality perception and indicators usage The objective of this chapter is to present and discuss the interviews that took place in Rosario and Liverpool and that were relevant to the selection of indicators. The inequality aspects valued by policy makers and their relation to indicators help to produce relevant indicators that fit into the Rosario context of policy making. The section dedicated to the contrast case study identifies which aspects of inequalities and indicator‐related issues emerge in a city with more experience both in indicators and in area‐based policies.
5.1 Characteristics and purpose of the interviews Twenty semi‐structured interviews were held in the city of Rosario in order to find out how local policy makers perceive inequality as a problem to solve, and to identify which aspects of inequality they find more relevant. These two objectives are closely related to a valid selection of indicators.
Among the interviewees were the 10 members of the municipal cabinet and the six directors of the decentralised districts. The criterion when selecting the interviewees was to cover key decision makers in the local government not only at city level but also at district level, considering the decentralisation process that is taking place (subsection 4.3.3). To gain more specialised perspectives, it was also decided to extend the interviews to the directors of the Public Housing Service, the Strategic Planning Office (PER), the Origin and Destination Survey Project (Public Service Secretariat), and the Decentralisation Programme.
To contrast the results of Rosario and to learn lessons from countries with more experience in the use of indicators and the application of compensatory policies, seven semi‐structured interviews were held in Liverpool. In the case of Liverpool, an explorative snowball‐type approach was used to select the interviewees. The list of potential interviewees was generated in consultation with experts in planning and census‐based indicators at the Department of Civic Design of the University of Liverpool. The objective was to find key decision makers that act at city and sub‐city level, with experience in area‐based policies, the use of indicators and the application of GIS in decision making. The interviewees included councillors of the Executive Board, the director of the Regeneration Portfolio, directors of Cluster Partnerships, a member of Liverpool Vision, the coordinator of monitoring progress/indicators at the Liverpool Partnership Group and members of the Education Portfolio. The directors of South Liverpool and Alt Valley were included because the vision of their clusters explicitly includes the goal of reducing inequality. Furthermore, they are areas facing disparities between neighbourhoods.
The sections that reflect the interviews in Liverpool describe the differences in policy responses to inequality and whether these responses target areas or groups. In this context, the aspects of inequalities considered more relevant and the policy measures taken to improve the situation are explored. Since in Rosario the lack of municipal autonomy is usually expressed as a drawback when it comes to implementing remedy policies, and the role of the national government in area‐based policies is limited, in the Liverpool section the role of the national government is taken into

88
account. In terms of indicators, the main question is why are indicators more used in the Liverpool context and what can be learned from the UK experience.
The interviews in Rosario and Liverpool were of the semi‐structured type. The interviewee was asked closed questions from a pre‐printed list, as well as open questions, and this was followed by a more informal dialogue (open‐ended type interview). The advantage of this approach is that not only can comparisons be made between the different answers but extra observations and opinions not contemplated in the predefined questions can also be incorporated. A disadvantage is that there is no interaction or discussion between the interviewees, which could bring new perspectives to the study. For practical reasons and because of the high profile of the interviewees, it was not possible to organise a workshop or a focus group. On the other hand, the semi‐structured interviews helped to identify the individual views and perspectives of the interviewees. Besides, the guarantee that their views would remain anonymous encouraged them to give critical responses49. The lack of a “shared view” of the problem, which would have been obtained with focus groups, was overcome by the analysis of policy reports. This was a clear advantage of using multiple sources of evidence in the case study (Yin, 1994).
The interviews in both Rosario and Liverpool consisted of two parts: the first part concentrated on inequalities and the second on indicators.
5.2 Prioritised inequality aspects in Rosario (Argentina) The interviewees were given a questionnaire with a list of 13 aspects related to inequality. A pre‐selection of aspects/domains of inequality was based on the existing literature as well as on recognised urban indicators programmes (see Section 3.4).
They were asked to indicate how important they considered each aspect, applying a Likert scale (1 = very important; 2 = important; 3 = neutral; 4 = unimportant; 5 = very unimportant). The aspects were grouped in three main classes: aspects related to the household and its members, aspects related to the dwelling, and aspects related to accessibility (Table 5.1).
The first group, aspects related to the household and its members, consisted of income, employment and education level. In this group, education was on average the most relevant according to the interviewees, and 70% of them evaluated it as a very important aspect to consider. Income was considered the least important in the group, although with a median and mode of 2 (important).
The second group, aspects related to the dwelling, consisted of legal tenancy of the house and the plot; quality of the house; overcrowding; and water, electricity, gas and sewage connections. In this group, overcrowding was considered the most relevant, and 75% of the interviewees regarded it as a very important aspect of inequality. It should also be noted that overcrowding, with an average of 1.25, was of all the listed aspects considered the most important by the majority of the interviewees. Of the four services (electricity, water, sewage and gas), water and sewage were considered the most important, with an average of 1.50 and 1.75 respectively. The reason for this becomes
49 This resulted in comments on the use of indicators in Liverpool reaching saturation point, or critical views on the present lack of use of quantitative data in the planning practice of Rosario.

89
clear later in the interviews: most interviewees expressed a relation between the lack of water and sewage connections and health problems.
The last group, aspects related to accessibility, included accessibility to schools, public health centres, green public spaces, and “new information networks” (e.g. internet). Of this group, school accessibility and health care accessibility were considered the most important aspects, scoring an average of 1.55 and 1.60 respectively.
Table 5.1 Importance assigned by policy makers to different aspects of inequality (5 point scale, 1 = highest priority)
Appreciation inequality aspects (Rosario)
N 5 points scale, 1 = highest priority
Valid Missing MeanStd. Dev. Min. Max.
Income level 20 0 1.70 .66 1 3 Employment 20 0 1.35 .49 1 2
Aspects related to the household and its members Education level 20 0 1.30 .47 1 2
Legal tenancy house and plot 20 0 2.10 1.07 1 5 Quality of the house 18 2 2.00 .91 1 4 Water connections 20 0 1.50 .61 1 3 Electricity connections 20 0 1.80 .70 1 3 Gas connections 20 0 2.35 .93 1 4 Sewage connections 20 0 1.75 .64 1 3
Aspects related to the dwelling
Overcrowding 20 0 1.25 .44 1 2
Accessibility schools 20 0 1.55 .60 1 3 Accessibility public health 20 0 1.60 .68 1 3 Access to public green areas 20 0 2.15 .75 1 4
Aspects related to accessibility
Access to internet 20 0 2.60 .82 1 4
Social networks 4 16 2.00 .00 2 2 Health insurance 1 19 2.00 2 2 Employment quality 2 18 1.00 .00 1 1 Gender equality 1 19 2.00 2 2 Public transport 2 18 1.50 .71 1 2 Job accessibility 1 19 1.00 1 1
Aspects suggested by the interviewees
Urban integration 1 19 2.00 2 2
At least one respondent in every group considered the following aspects to be “unimportant” or “very unimportant”: tenancy of the house and the plot, housing quality, gas connection, access to public green areas and access to internet. The variation in, and dispersion of, responses (according to their standard deviation) were very high in the case of tenancy, gas connections, housing quality, access to internet and access to public green areas. This might be explained by the influence of the different values or perceptions that are attached to this aspects (particularly house ownership relevance50). Education, health, overcrowding and employment showed less variation in responses, hence agreement on its importance. This can be related to the notion of basic needs that emerged further on during the interviews (education, health, housing, and employment), and to the crisis suffered by Rosario (and Argentina in general) in the 1990s. 50 See further discussion on p. 96.

90
5.3 Aspects suggested by the interviewees (Rosario, Argentina) Nine out of 20 of the interviewees suggested adding some of the following aspects of inequality:
• access to social networks – level of social cohesion; • access to public transport; • employment quality, sub‐employment; • urban (physical) and social integration; • access to health security/insurance; • egalitarian gender perspective in employment, health and education; • job accessibility.
Of those who suggested other aspects, 45% considered access to social networks a relevant aspect to add. Employment quality and access to public transport were suggested by two of the interviewees, while the rest were suggested by no more than one interviewee.
Access to social networks – level of social cohesion An awareness of the importance of social cohesion and participation can be associated with what the interviewees considered “access to social networks”. The following was stated by one of the interviewees:
“One aspect to consider, although I don’t know if it is easy to measure, is the existence of social networks. This is the participation within social and institutional networks because one of the important aspects of inclusion is participation. As Castells [Robert] says, exclusion is also disaffiliation from networks” (Interviewee 00).
The importance given to social cohesion can also be found in the comments of one interviewee who emphasised the role of public spaces in integrating segregated groups, in particular those living in slum areas. Further on, the interviewee talked about “places of social integration”, giving the example of sports clubs. In these places, tasks of social integration with other sectors of the neighbourhood can take place through activities such as workshops and recreation for the elderly and for adolescents.
Access to public transport Access to public transport was also suggested, and this is closely related to the concept of social cohesion/integration. Since this a physical aspect, it is easier to measure than other aspects of social cohesion. The following interviewee explained the importance of public transport for the most disadvantaged areas of the city:
“Without the possibility of having public transportation people would not have access to their job. There are neighbourhoods without schools and health centres so if they don’t have public transport they would hardly have access to schools and health centres” (Interviewee 06).
Urban, spatial and social integration This aspect is very similar to (if not integrated in) the previous two aspects. Interviewee 19 specified the physical integration within the different neighbourhoods of the city and

91
in particular the slum areas. The same policy maker gave the example of Rosario Hábitat as a policy programme that improves this aspect. The Rosario Hábitat programme tries to improve the condition of the slum areas, and recompose the urban fabric by creating new roads connected to the existing network and relocating only those informal dwellings that interfere with the roads (for more details see subsection 4.3.4).
Employment quality, sub‐employment This aspect was included by two of the interviewees, who considered it important to see not only formal but also informal employment. They explained that it was relevant to see not only whether or not someone has employment but also its quality.
Access to health security/insurance This indicator was also mentioned later in one interview. The interviewee concerned considered there was a decrease in the number of people covered by health security –reflecting the crisis suffered by the country and its effect on the middle class, which is usually the one that has a private health insurance.
5.4 Local capacity to influence and act on inequalities (Rosario, Argentina) The interviewees were asked whether intervention at local government level could reduce inequalities or not. As seen from Table 5.2, there is strong agreement among the interviewees that the inequality aspects related to the household and its members (e.g. income) cannot be directly influenced locally. Inequality in income and employment is also closely related to structural causes beyond the local level and is usually related to national and global circumstances.
Table 5.2 Percentage of respondents that agreed that it was possible to reduce the inequality at local level
Inequality aspects Percentage of respondents that
considered that it was possible to reduce inequalities at local government level
Aspects related to the household and its members
income level 10% employment 25% education level 20% Aspects related to the dwelling legal tenancy of the house and the plot 85% quality of the house 70% overcrowding 60% water connections 30% electricity connections 15% gas connections 70% sewage connections 30% Aspects related to accessibility accessibility to schools 80% accessibility to public health centres 100% accessibility to green public spaces 95% accessibility to “new information networks” (e.g. internet) 60%
There is variation between the aspects related to the dwelling and the infrastructure provision, and this can be explained by the fact that some of the services are privatised

92
(e.g. water and sewage). Finally, there is strong agreement that the accessibility aspects can be influenced locally.
In Table 5.3, the average importance given to the different aspects is compared with the percentage of policy makers that agree that local government is able to intervene at local level. This table indicates that, of the first five ranked aspects, only overcrowding and accessibility to schools gain the agreement of more than 50% of the interviewees that they can influence them locally.
Table 5.3 Level of importance of inequality aspects (mean) and percentage of policy makers that agreed it was possible to influence them locally
Only a very low percentage of the interviewees considered local influence could reduce disparities in the infrastructure provision/connection (e.g. water). Werna (2001, p. 28) explains the debate on public versus private provision and mentions that water supply can be an example of market failure, because even though the private sector could provide a good service it would not do so efficiently because of a tendency towards monopoly. In the case of Rosario, the water provision and sewage network is controlled by the French company Suez Lyonnaise des Eaux and regulated by the provincial government. The second point mentioned by the same author as a cause of market failure might coincide with the reality in Rosario, which is that “the private sector is unable or unwilling to take the risk of large‐scale and/or long‐term investments”. During the interviews, the local policy makers constantly complained about, or referred to, the company’s lack of willingness to extend the sewage network
Only 20% of the interviewees agreed that it was possible to influence the level of education locally, even though it was the second most important aspect. Nevertheless, during the interviews it was discovered that most of the policy makers agreed that it was still possible to exert influence by means of non‐formal education such as training courses, although formal education remained the responsibility of the provincial and national governments.
According to the 2001 census, 36% of the households in Rosario do not have sewage, which explains why there is such concern among the policy makers about this
Inequality aspects Level of importance
Local capacity to influence
overcrowding 1.25 60% education level 1.3 20% employment 1.35 25% water connections 1.5 30% accessibility to schools 1.55 80% accessibility to public health centres 1.6 100% income level 1.7 10% sewage connections 1.75 30% electricity connections 1.8 15% quality of the house 2 70% legal tenancy of the house and the plot 2.1 85% accessibility to green public spaces 2.15 95% gas connections 2.35 70% accessibility to internet 2.6 60%

93
aspect. Water and sewage were evaluated with an average of 1.50 and 1.75 respectively. On the other hand, and considering the health implications that this inequality problem brings, it is very worrying that only 30% of the interviewees agreed that they could solve this situation at local level.
It is remarkable that 100% of the interviewees agreed that it was possible to improve the accessibility to public health centres. This was later explained during the interviews by the very positive comments on the health sector, in terms not only of policy action but also of the long tradition this sector has in the use of indicators. The high agreement on the possibility to equalise tenancy (85%), house quality (70%), gas connections (70%) and overcrowding (60%) can be explained by the implementation of a new policy on slum improvement: Rosario Hábitat51. It should be noted that gas connections are an exception among the services provisions that are privatised. The interview revealed the explanation: the local government and the private company had agreed on the expansion of the network by means of a redistributive action52.
The responsibility for improving the situation regarding certain aspects of inequality seems to lie heavily with the national and provincial governments or a private company. In these cases, the local government can influence by lobbying or by making the private sector comply with the contracts. In other cases, its capacity is reduced to improving conditions in the new housing areas that the municipality builds, or to making the population more employable by providing informal education such as training.
On average, overcrowding was ranked as the most important aspect of inequality (1.25). Of the interviewees, 75% gave a score of 1 and 60% considered that it was possible for the local government to reduce this aspect of inequality. Although 60% of the interviewees agreed it was possible to influence overcrowding locally, the interviews revealed some limitations/restrictions of the programmes concerned. When asked about the possibility of reducing inequalities in overcrowding locally, one of the interviewees had some doubts. These were related to the fact that Rosario Hábitat provides housing units of only one size, whatever the size of the family concerned.
5.5 Inequality in the local policy context (Rosario, Argentina) The following subsections describe the relations between key concepts that came across during the interviews and might help to explain the role given to inequality in the local policy context.
5.5.1 “Inequality grew between 1991 and 2001” When the interviewees were asked to define the aspects in which they saw an increment in inequality, they usually began by referring to a crisis that started in the early 1990s and ended in the political and economic crisis of December 2001. The increase in inequality and the crisis in general had institutional and socio‐economic consequences. The crisis affected the local government in its capacity to plan and execute policy actions and programmes. This had socio‐economic consequences for the population as a whole
51 For further details on Rosario Hábitat, see subsection 4.3.4. 52 See further discussion on p. 99.

94
but particularly for the middle class, which was mentioned by the policy makers as one of the groups most affected in the last 10 years.
“The growing social inequality process in Argentina exploded. Because it was growing, but in December 2001 it exploded. Then poverty flooded us because you did not see what you see now” (Interviewee 18).
Almost every interviewee perceived an increase in inequality between 1991 and 2001, mostly in the aspect of employment. As Prevot Shapira (2002) explains, while in the 1980s the vulnerability of the people in Argentina was related to hyperinflation and the consequent income reduction, in the 1990s – in spite of the economic growth – the problem shifted to high unemployment rates. This was reflected in the interviews and some of the interviewees made a clear difference in the effects of inequality between the employed and the unemployed. Those who are unemployed devise “survival strategies” (as Interviewee 00 put it) such as cirugeo. This is the activity where people live from informal garbage collection by selling cardboard and other materials for recycling. The same interviewee recognised that in Argentina inequality was closely related to unemployment, under‐employment or informal employment.
As indicated in Section 4.2, unemployment rates in Rosario during the 1990s reached 20% (Plan Estratégico Rosario (PER), 1998). The consequence of the increase in unemployment was the high percentage of people living under the poverty line, which in Gran Rosario grew to 61% by May 200353. Some interviewees expressed how the loss of employment affected not only the income level but also important aspects of the quality of life, such as health.
One of the interviewees perceived the increment of inequality between 1991 and 2001 as ”The arrival of those who in 1991 still were part of middle class sectors into poverty sectors” (Interviewee 03). Some impoverished sectors of the middle classes that can no longer afford to rent or live in the city centre are forced to move to live with a relative. The direct consequence in the territory is that there is an increase of illegal subdivisions of parcels that are not yet reflected at cadastre level ‒ as was explained by one of the interviewees (Interviewee 06).
Another effect of unemployment and the impoverishment of the middle class is the increase in social exclusion. This was also perceived by many interviewees as one of the most significant consequences of the increment in inequality between the years 1991 and 2001. Some of them explicitly used the concept social exclusion, others referred to it as “people left outside the system”:
“There are more and more people outside the system. It is reflected in the lack of possibilities to access food, the increase in the demand in the health centres, the increase in the demand of ‘Centros Crecer’ [community/child‐care facilities], and in the increase of slum areas in areas that had already been relocated” (Interviewee 13).
53 For further details, see Table 4.1.

95
As expressed by several interviewees, the increase in inequalities, and particularly in unemployment, puts a higher demand on the public service (public welfare). However, the capacity to respond to this demand by the public authorities also seems to be affected by the economic crisis. Referring to the Rosario Hábitat programme54, Interviewee 00 explained that they had to start in phases because the money came in phases and not as planned. Another interviewee explained that several projects were postponed owing to the “tremendous crisis”, and he graphically explained that ”We are trying to ‘row’ against this inequality and the tremendous gap that has been opened in Argentina and which is very evident here in Rosario” (Interviewee 01).
5.5.2 Interrelation between inequality aspects Most of the inequality aspects are closely interrelated and this was also perceived by the policy makers. In the case of employment, Interviewee 00 explained that, because of the rise in unemployment between 1991 and 2001, there had also been a deterioration in educational aspects, related to school dropouts. Here, the explanation is that because their parents are unemployed, the children do not go to school but go out to work (most probably in the streets as garbage collectors, door openers, etc.). Furthermore, the lack of education generates a lack of awareness of how to access social benefits or the public health system, with consequent social exclusion. As explained by Interviewee 02, Rosario has internal migration from the northern part of the country, and these people do not have access to the public health services even though they may live only one block away from the primary health service, since they are unaware of their possibilities. Therefore, concluded the interviewee, “we have to educate them and we have to carry them to the health centres”.
Health can also be affected by unequal access to infrastructure, especially water and sewage. Referring to what people mostly demand, Interviewee 05 said that “In the neighbourhoods where there is no sewage network, they ask for the cleaning and maintenance of the ditches. This is because it is very much related to the quality of life and the health of the people because they are sources of infection”. In a similar way, Interviewee 10, relating health problems to the lack of sewage networks, said: “We detected through the public health centres an increment of infectious diseases in kids, health problems due to the presence of waste water in open ditches.” A more complex perspective of health and its interrelation with other aspects was mentioned by another policy maker:
“Health is related with the dwelling and neighbourhood characteristics, with the water quality. There are also many actions that require not only the participation of the state. It has to be guaranteed that all the kids get a vaccination but we had many times the problem that someone illiterate or with a low level of education did not carry his/her kid to receive the vaccination” (Interviewee 16).
The interdependency between employment, income and other aspects was brought up by the interviewees. Employment is assigned an important role in inequality aspects but
54 For further details on Rosario Hábitat, see Section 4.3.4.

96
the perception of its importance seems to be different once it is achieved. A policy maker (Interviewee 14) suggested that once a person had a job other aspects became more important, such as income and education level. Interviewee 17 suggested that the government might have a policy for maintaining income when there was no employment, thus reducing inequality aspects. As mentioned before, Interviewee 06 suggested that the lack of public transport might worsen other variables of inequality, such as access to education, jobs and health.
“Housing quality” is understood in different ways by policy makers, but in any case it is considered important and closely related to other aspects of quality of life. Some of the interviewees mentioned that housing quality “includes everything, for example water connection” (Interviewee 03). Housing quality, then, is highly related to indicators of infrastructure such as electricity or gas connections.
5.5.3 Values and basic needs in the perception of inequalities Innes (1990, p. 22‐31) understands that indicators are layered with meaning and shared images or values within a certain culture. Values seem to play an important role for policy makers at the moment of assigning relevance to a certain aspect of inequality or at the moment of perceiving inequality. A clear example of how cultural values can determine a certain perception of inequalities can be found in the aspect of legal tenancy of the house and the plot. Different values and perceptions can explain why tenancy has the highest standard deviation in the appreciation of inequality aspects (Table 5.1). While in some cultures homeownership is promoted and highly valued, in others renting is an alternative option equally valued. Interviewee 07 explained how tenancy relevance in inequality was attached to a cultural value: “Tenancy, is very important because there is a concept of the own house which is a typical Latin concept”. On the other hand, other interviewees assigned much less relevance to that aspect.
Policy makers do not always perceive employment and education level as related aspects. Because of the high levels of unemployment, one interviewee suggested that even those who were highly educated found difficulty in finding a job (Interviewee 16). Therefore, policy makers do not necessarily see unemployment as a direct consequence of the “inadequacy of the poor” ‒ as “the culture of poverty” perspective might suggest ‒ but as a result of structural factors.
For some interviewees, income was perceived as more relevant than other aspects of inequality and they suggested that this should be reflected when measuring poverty. In this respect, Interviewee 19 was doubtful about the use of unsatisfied basic needs (NBI) as an adequate indicator55. An NBI indicator combines household and dwelling characteristics but not income level (or it uses a proxy such as the education level of the head of the household). The interviewee considered it an indicator more valid in the 1980s. The interviewee believed that it was more useful to use indicators reflecting the income level, such as level of poverty or the poverty line. The interviewee believed that NBI was more valid in the 1980s, when poverty had been more related to the lack of access to certain services. Furthermore, the interviewee added that in those years poverty alleviation programmes had been concentrated in, and targeted at, slum areas. This contrasts greatly with the present situation of the new poor and the middle
55 For a discussion on NBI, see Section 3.4.

97
class with reduced income levels. This opinion reflects the perspective of certain researchers who also feel it is more important to target individuals rather than territories (Prevot Schapira, 2002), especially nowadays when there is a growing impoverished middle class in Argentina. The impoverished middle class seems to be “hidden” when only physical aspects such as dwelling characteristics are being measured. This author gives the example of the social plan implemented since April 2002 in Argentina (including Rosario). This is called Plan Jefes y Jefas de Hogar (Male and Female Headed Households Plan), and targets individuals rather than territories (subsection 4.3.5). A very different perspective is given by Werna (2001, p. 34‐36), who considers that income‐related indicators such as the poverty line are inaccurate. Poverty line indicators establish a level of income (poverty line) and then consider those that fall below this line to be poor. Following the UN‐HABITAT housing‐poverty perspective, Werna mentions some of the drawbacks of this approach that obscure the social and health dimensions of poverty or obscure underlying causes of poverty, disregarding the social and political causes of poverty.
The awareness of policy makers of the existence of minimum basic needs or basic rights can be seen from the interviews. When they were considering whether or not to include more aspects of inequality, it was common for them to check whether employment, education and health were covered. They regarded them as basic needs or basic rights. This relates to the discussion of equality as a right (subsection 2.1.2). To say that people have rights, according to Smith (1994, p. 34), is “to require them to be treated in a certain way, to get something to which they are entitled or at least to raise this expectation”. Interviewee 06 considered that there were certain aspects that were basic and were related to “the dignity of the person”, and gave the example of access to water. In the same direction, another interviewee considered that “everybody has the right to education, health, housing and employment” (Interviewee 10). It should be noted that most of the indicators related to minimum basic needs and basic rights, such as employment, health or education, were also ranked in the top places in the questionnaires.
5.5.4 Policies and institutional implications During the interviews, the policy makers explained how they tried to reduce inequalities with certain policy actions and policy goals. Some of them contrasted their actions with other approaches driven by political favouritism. Political favouritism was mentioned as a common practice in the application of social remedy actions in Argentina. Prevot Schapira (2002) recognises the same situation in the 1990s in Buenos Aires suburbs. Participation and the promotion of social networks are usually perceived as policy actions to break that tendency:
“This programme [Programa Crecer] helps to strengthen the citizenship, it does not only provide assistance [providing food] which can be asymmetric and influenced by political favouritism [clientelística or reserved for those that are “clients” of a particularly political party]. It is not always the case but some times political favouritism is part of assistance programmes” (Interviewee 00).

98
Another policy maker (Interviewee 19) considered that “micro‐social enterprises”, in particular, broke with political favouritism and generated citizenship since they did not have to depend on help or assistance from anyone. According to Interviewee 03, micro‐enterprise experiences and “social economy experiences”, such as self‐production of food and urban agricultural activities, created “solidarity networks” that improved the social cohesion in the areas. Interviewee 19 considered the level of organisation and participation to be important, as well as the levels of integration between the different sectors of the community/city. According to this interviewee, the Crecer programme56 encouraged integration within the community. The interviewee added, “It is not just a kindergarten, this is a place of reference in the neighbourhood for new activities.” This programme tries to ensure that the activity complements other activities rather than be limited to the mere provision of food.
Social cohesion is taken as a goal to tackle inequalities without falling into political favouritism. As remarked before (see p. 90), policy makers mentioned the issue of social cohesion many times. Sometimes they referred to social cohesion using words such as participation, consensus or integration. It can be interpreted that equality brings integration and hence social cohesion. Regarding integration and participation, Interviewee 14 explained that their policy took into account “places of social integration” where activities such as workshops for the youth and the elderly took place. NGOs such as neighbourhood associations are seen as places that help in the social cohesion of the neighbourhood. Confirming this, Interviewee 01 explained that of 48 health centres, 27 were owned by the local government but the rest belonged to the neighbourhood associations and were administered and financed by the local government.
If the policy objective is to generate social cohesion, the reduction of inequalities or differences seems to be the selected approach. This can be understood from the words of Interviewee 03 when describing the Rosario Hábitat programme:
“We have a programme with a general objective of integrating formal and informal areas, working for the physical and social integration. That integration implies to increase the level of provision of services and dwellings in slum areas” (Interviewee 03).
Policy makers expressly referred to concepts such as dual cities, inequality, social exclusion and positive discrimination. Interviewee 00 stated that their objective was “to have a balanced city, to have one city, not an excluded city and an inclusive city, not a legal city and an illegal city; for that we need to know which is the disadvantage so we are able to balance”. This also shows the importance they assign to reducing inequality and the need for better knowledge in this respect.
The introduction of the participatory budget was mentioned several times as one of the tools introduced to rank priorities between districts. Interviewee 08 said that thanks to the decentralisation and the participatory budget it had been possible to establish policies with a territorial base57.
56 For further details on Programa Crecer, see subsection 4.3.5. 57 See subsection 4.3.3 for further details on the participatory budget within the decentralisation process.

99
“To detect pockets of deprivation it helps to target a policy in such a way that people are positively discriminated. This is what enables the municipal decentralization, the city is a whole but it has parts, if there are parts that are lagging behind they should receive special treatment and should be positively discriminated in the budget” (Interviewee 05).
It was clear from the interviews that, even though the policy makers want to reduce certain aspects of inequalities through different policy actions, this is not always feasible because of the limitations on acting at local administrative level.
5.5.5 Local accountability and capacity to act on inequalities Some policy makers indicated that, although they were not able to reduce certain aspects of inequality, they could submit a request or lobby at a higher government level. The need to lobby a higher administrative level and ask for solutions might justify the presentation of objective reports elaborated with indicators. A couple of examples were given during the interviews. As mentioned before, in relation to the lack of proper performance by the private water provision company, one interviewee said that “The responsibility is provincial and there is a private company that has to comply with the contract and does not do it” (Interviewee 00). Interviewee 10 explained the problem of other privatised services, where the same private company was supposed to extend the sewage system but did not fulfil the contract. On the other hand, it should be noted that at local level it seems to be possible to influence the provision of services such as water or gas, particularly in the construction of new neighbourhoods. In the rest of the city, such influence is severely limited by the provincial or privatised provision. The use of an “equalising/remedy action” is explained in the extension of the gas network. This was possible thanks to the establishment of a special fund for that purpose. “Those who had already a connection to the gas network paid for the new networks in places without coverage, so it has a very redistributive content” (Interviewee 10).
An interviewee mentioned the presentation of a report to the provincial government to try to make the private company fulfil its contract. “We detected through the public health centres an increment of infectious diseases in kids, health problems due to presence of waste water in open ditches” (Interview 10).
The possibilities to influence locally some sources of inequality, such as income or employment, have their limitations. Nevertheless, it does seem to be possible to tackle the consequences through the provision of free primary health care and food assistance. For this reason, it is important to consider accessibility to primary health centres and Centros Crecer within the matrix of indicators58.
The role of the government at national level is very relevant when it comes to reducing inequality through taxation and redistribution. Interviewee 16 explained how the local government could not reduce some inequality aspects because taxation policies were decided at national level. He indicated that “at national level, the taxation system is regressive: those that have a higher concentration of power are those that proportionally pay fewer taxes. This talks about the inequality in the distribution of wealth.”
58 The matrix of indicators is presented in subsection 6.1.3.

100
Although taxation is primarily a national duty, the municipal budget assignment is clearly regarded as a tool to equalise at local level. In this respect, the municipality assigns 28% of the budget to public health, although it is a responsibility not of the local government but of the provincial level. Participatory budgeting is another tool with a clear redistributive aim.
5.6 Use of indicators by policy makers in Rosario, Argentina The second part of the interviews concentrated on the objective to identify the usage (or not) of indicators by policy makers in decision‐related issues and to explain the reasons.
To determine in which part of the policy cycle they have been using indicators and when they would like to use them in the future, a questionnaire was provided to the interviewees. They ranked policy phases59 according to the degree of use of indicators. They ranked them twice, first considering how they had been using indicators to date and secondly how they would use them in the future.
Diagnosis and problem identification were seen as the most important phase where indicators were used, as well as where they would like to use them in the future. Evaluation and correction were also ranked second place for both situations. That setting goals or targets was not highly prioritised or referred to during the interviews might be explained by the lack of a long tradition in the application of indicators. This is in clear contrast to the interviews in Liverpool, as shown later in this chapter.
From the qualitative interviews, it is possible to explain why in some cases indicators have not been used. The main topics mentioned by the interviewees are the lack of staff and/or experience, and the lack of funds and time to quantify. Remarkably, most of them agree that it is very important to quantify and use indicators in the different policy cycle phases but they refer to the tendency to replace quantitative studies and planning by intuition or local knowledge. Some justify this by the need to act urgently in a very unstable context. On the other hand, it is possible to find some examples of present use of indicators, although not in a clearly integrated manner across the different secretariats.
Innes (1990, p. 10), referring to the study carried out by Caplan (1975), explains similar attitudes by policy makers in the use of social science knowledge, where only 40% of the respondents reported the use of a database or special‐purpose studies.
“Respondents had positive attitudes towards such knowledge, but could give little evidence of actually using any of it. They preferred to get information from the people at the Congressional Research Service or from their own staff rather than to use no interactive, ‘cold’ sources, such as written materials or computer terminals” (Innes, 1990, p. 10).
59 Diagnosis and problem identification; Policy and programme formulation; Implementation and goal establishment; Evaluation and correction.

101
5.6.1 Institutional aspects of use of indicators In the case of Rosario, this research found some explanations for a lack of extended use of indicators within institutionally related aspects, such as the absence of a strong planning tradition or a preference for local knowledge and intuition.
Specific situations, such as the lack of staff and expertise, also explain why the interviewed policy makers do not use indicators more frequently. A couple of interviewees mentioned the lack of proper infrastructure to support the staff (e.g. computers), which is a consequence of the lack of sufficient local government resources.
Lack of information does not seem to be a problem in itself but more a problem of non‐systematisation of the existing information. The failure to collect and use information in a systematic way clearly poses a risk to the sustainable use of indicators.
In some cases, indicators have been prepared for a particular purpose and following a survey. However, it should be noted that the use of surveys carries its own problems: lack of continuity, comparability between years, and inability to monitor the problems throughout time. This lack of continuity also reflects the lack of a middle‐ and long‐term planning culture. One interviewee raised the issue that it was not a problem of lack of staff, resources or expertise but a problem of lack of planning culture:
“It is a cultural problem rather than a problem of resources or instruments. The public servant does not have incorporated, in general, the topic of evaluation and measurement. There is always a point in the development of the administration that it is necessary to evaluate, to correct and improve. That [evaluation], in general, does not take place and things are mostly done in an arbitrary and non‐rigorous way. This is also related to the lack of planning culture” (Interviewee 05).
Among the interviewees, there is agreement on the importance of planning and good use of information. On the other hand, decision makers seem to be driven by the urgency to solve things. The idea of urgency or crisis is permanent throughout the interviews. This concept seems to be opposed to the notion of planning and somehow menaces the possibility of appreciating and using planning tools. Nevertheless, interviewees were aware of this situation; they emphasised the need to plan and not only be “crisis managers” or “fire‐fighters”.
Even though the interviewees had used indicators, they said they were still exploring how to improve the link between indicators and policy or decision making. Another interviewee specifically mentioned the lack of use of indicators in decision making and its replacement with “more intuitive or empiric rather than based on information” (Interviewee 04). In the same direction, another interviewee added:
“We replace [indicators] with older indicators or by visiting the places daily. In any case, I don’t consider that it is the ideal, I would say that the local knowledge has secondary relevance for planning policies, is only for the emergencies” (Interviewee 14).
In relation to the need to act urgently, a policy maker (Interviewee 01) gave the example that during the crisis they had had to take a decision to cut funds from different

102
programmes. They ended up going to the poorest neighbourhoods and asked the people what their most urgent problems were. Based on that “expressed demand” they reassigned the budget in the area. Although these types of actions can be relatively easy to determine, they might turn out to be very ineffective, based on short‐term visions, or unjust and biased towards groups of people with more capacity to let their voice be heard or with lobbying power. Interviewee 14 also explained that, instead of rational planning, sometimes they just reacted with respect to those areas with a concentration of complaints. Problems of efficiency arose, since they ended up going on the same day to locations far apart in the city, without any well‐thought‐out schedule of priorities.
As said before, local knowledge and intuition are used to identify problem areas. Interviewee 19 suggested that they did not quantify or do any previous studies before they targeted the policies because they simply “find problems everywhere”. This remark is one of the most negative in terms of recognising the importance of using indicators and it is very much driven by the crisis that affected Argentina. On the other hand, during the interviews it was possible to find that in some programmes and policy actions they did make decisions such as prioritising one area rather than another and that they did make use of information. Referring to the Rosario Hábitat programme and explaining the scale of the policy interventions, Interviewee 00 said:
“Rosario Hábitat is thought for the whole city but the intervention is going to be done by neighbourhoods. The neighbourhoods that are in more strategic zones or in more urgent zones are prioritised.”
Policy makers also suggested that inequality was a multidimensional phenomenon that needed to be quantified by indicators considering that complexity. This is also reflected in the need to coordinate policies. According to Interviewee 06, however, when some new social housing areas were planned, this integration of aspects was not taken into account, resulting in areas designed without transport or education provision. The interviewee explained that sometimes this was a problem of interjurisdictional coordination and was linked to the lack of relation between local, provincial and national policies. There are cases where the provincial level does not comply with the local norms in terms of providing services (including education) when it comes to the construction of new housing areas.
In most cases, the use of indicators is found where the multidimensionality of inequality makes policy makers act in cooperation with different areas and secretariats. Interviewee 17 stressed the importance of synergy between different municipality areas when it came to reducing inequalities, mentioning the cooperation between the Public Housing Service, the Social Welfare Department, the Health Secretariat, and the Culture and Education Secretariat. Interviewee 07 mentioned that, because of the need to receive credit from an international agency, they started to cooperate with another area within the local government and indicators were presented and exchanged to prepare reports about the socio‐economic characteristics of these neighbourhoods. Interviewee 11 stated that they had used reports with indicators from the Strategic Planning Office to elaborate a diagnosis of a certain area of the district. Interviewee 12, a policy maker, also expressed the need for synergy between different offices, and the importance of indicators in

103
reflecting multiple aspects of inequalities and the quality of life. When asked if he was suggesting the use of a composite indicator of quality of life and whether he preferred a single figure or disaggregated indicators, he replied that “one number is very difficult because you know that this number is composed of the evaluation of a group of data and I consider important to evaluate those data [separately]”.
5.6.2 Minimum scale of policy application To know up to what level policy makers will require indicators, they were asked what was the minimum scale they considered when applying a policy. Neighbourhood level (barrio) was the most mentioned and the recognised minimum level of a policy implementation, and they usually related it to the decentralisation process. The minimum size suggested varied from five to 20 blocks (5 to 20 ha). Another interviewee suggested neighbourhoods with no more than 10,000 people. Policy makers recognised that small units of analysis could depict the differences better than larger areas could.
In recognition of the importance of evaluating and acting at low scales, nowadays the Decentralisation Office is dividing the districts into smaller units called neighbourhood areas. This shows an increasing interest in solving the problems at a smaller scale. They also recognise the importance of targeting those areas with greater inequalities since they have particular and concentrated problems.
Even though policy makers recognise the need to work in small areas, they are aware of the difficulties in finding data at such a high level of disaggregation. For example, interviewee 19 mentioned the problem they had in finding data on unemployment, or poverty in general, at low levels of aggregation.
5.6.3 Present usage of indicators Health seems to be one of the areas where more indicators are collected and used. This can be related to the importance assigned to health within the local government. All the interviewees agreed that the local government could improve inequalities in terms of access to public health centres ‒ the only aspect recognised by 100% of the interviewees. Biostatistics is one of the departments within the Municipality of Rosario that seems to have a tradition of collecting indicators and data. This department even has its own magazine reporting on indicators.
Another office that collects data and generates statistics is the Municipal Statistics Office. However, it does not produce indicators as such, since the statistics are not related – directly – to policy and decision making. The decentralised districts collect data and devise indicators related to measuring quality or “customer” service provided at each district centre (Interviewees 05 and 12).
Many of the interviewees mentioned the role of the Strategic Plan and the Decentralisation Programme as a general policy within the local government to reduce disparities. One of the objectives of the Strategic Plan is related to reducing inequalities, that is, “to offer equal access of opportunities to all the inhabitants” (Interviewee 01). This office started using indicators once it entered the monitoring phase of the plan. One of the strategies of the Decentralisation Programme is “to balance in the territory the presence of the local government and to give different responses in function to the location of the housing settlements” (Interviewee 04). One of the advantages seen by policy makers in the decentralisation is the proximity they gain to the problems. They find it easier to detect problem areas when the administrative area is smaller

104
(Interviewee 12). Furthermore, the Decentralisation Programme started in 1996 with a detailed quantitative and qualitative study of each district, which included the extensive use of maps.
5.6.4 Indicators usage and research demand Policy makers recognise that the problem of inequality in Argentina is very difficult to cope with. Based on this, they justify the need to monitor and keep track of any change in this phenomenon. The importance of monitoring and using indicators is stressed because they can be used “to satisfy the focalised needs” and “to target the distribution of resources and actions and to define priorities” (Interviewees, 00, 02 and 09). Policy makers see the need to optimise scarce resources as justification for the use of indicators to monitor inequalities. A just assignment of resources is also indicated as a very important aspect to consider:
“It does not exist the culture of measurement, and then the actions are purely done on intuition. Hence, many times many unjust decisions are applied in the budget assignment ... The inclusion of a culture of measurement and equalizing is a debt of the public administration” (Interviewee 05).
The demand for using indicators and monitoring studies seems to come in most cases from donor agencies, as many of the interviewees admitted.
Interviewee 15 explained that the advantage of indicators was that they could objectively reflect the reality. The same interviewee commented, “If there is a political decision to make those inequalities smaller, your influence as a local government can be very important.” It can be seen that ultimately political will is needed to monitor and reduce inequalities and, as discussed before, it is not always the responsibility of the local government.
As some policy makers indicated, there is still a need to improve the link between indicators and policy and decision making. Based on these different demands, a prescriptive use of indicators is also proposed in this thesis (Chapter 7, Section 7.5).
5.7 Summary Rosario, Argentina In Rosario the four most ranked aspects of inequality are overcrowding, education, employment, and water connections. This selection might be explained by the notion that most of the policy makers shared similar values about basic needs or basic rights. Almost every interviewee perceived an increase in inequality between 1991 and 2001, mostly in the aspect of employment. The deterioration in the quality of life affected the middle class and the new poor. The increase in employment and income inequality resulted in a higher number of people without health insurance, illegal plot subdivisions, school dropouts and more social exclusion. The increase in inequalities, and particularly unemployment, put a higher demand on the public service (public welfare). On the other hand, the capacity to respond to this demand by the local public authorities was affected by the economic crisis.
Most of the inequality aspects are seen as highly interrelated, especially unemployment, education, health and water and sewage infrastructure.

105
Participation and the promotion of social networks were mentioned as policy actions to break the national tendency towards political favouritism in the application of social remedy actions. In spite of social programmes, interviewees stated that they were unable to reduce certain aspects of inequality directly because it was the responsibility of either a higher administrative level (e.g. income or education) or a privatised public service (e.g. water or sewage). To reduce inequality in these aspects, they could influence or lobby a higher government level, and this could justify the presentation of objective reports elaborated with indicators. Although mention was made that the possibility of influencing some of the inequality sources, such as income and employment, was limited, locally it does seem possible to tackle its consequences. In recognition of the importance of evaluating and acting at a low scale, the districts are divided in smaller units called neighbourhood areas.
Most of the interviewees stated that lack of staff, experience, funds and time were the reasons why they did not use (or use more) indicators. Most of them agreed that it was very important to quantify and use indicators in the different policy cycle phases, particularly during the problem identification and the programme formulation phases. On the other hand, they referred to the tendency to replace quantification studies and planning by intuition or local knowledge ‒ this being justified by the need to act urgently in a very unstable context. One interviewee explained that the problem was not insufficient staff or resources but the lack of a planning culture. In general, there was agreement on the importance of planning, good use of information, and monitoring of inequalities.
5.8 Prioritised inequality aspects in Liverpool (UK) In the same way as in Rosario, and to identify what domains/factors of inequality the policy makers find more relevant, the interviewees in Liverpool were given a questionnaire with a list of aspects related to inequality. They were asked to indicate how important they considered each aspect, applying a Likert scale (1 = very important; 2 = important; 3 = neutral; 4 = unimportant; 5 = very unimportant). The aspects were grouped in three main classes: aspects related to the household and its members, aspects related to the dwelling, and aspects related to accessibility (Table 5.4).
The first group, aspects related to the household and its members, consisted of income, employment and education level. Of this group, income is on average the most relevant, followed by employment and education.
The second group, aspects related to the dwelling, consisted of legal tenancy of the house (ownership), quality of the house, overcrowding, central heating and sole use of bath and toilet60. Of this group, sole use of bath and toilet is considered the second most relevant, after quality of the house. It should also be noted that quality of the house, with an average of 1.33, is of all the listed aspects, considered the third most important by the majority of the interviewees. The last group, aspects related to accessibility, included accessibility to schools, public health centres, green public spaces, “new information networks” (e.g. internet) and jobs. Of this group, job accessibility is considered the most important aspect.
60 The aspects water, electricity, gas and sewage connections included in Rosario were replaced by these two aspects that better reflect the dwelling characteristics in the UK context.

106
Table 5.4 Importance assigned by policy makers to the different aspects of inequality (Liverpool) Appreciation inequality aspects (Liverpool)
N 5 points scale, 1 = highest priority
Valid Missing MeanStd. Dev. Min. Max.
Income level 6 0 1.17 .408 1 2 Employment 6 0 1.33 .516 1 2
Aspects related to the household and its members Education level 6 0 1.67 .516 1 2
Legal tenancy house (ownership) 6 0 2.67 .516 2 3 Quality of the house 6 0 1.33 .516 1 2 Overcrowding 6 0 1.83 .753 1 3 Central heating 6 0 2.17 .983 1 3
Aspects related to the dwelling
Sole use of bath/shower + toilet 6 0 1.67 .816 1 3
Accessibility schools 6 0 2.17 .983 1 3 Accessibility public health 6 0 2.00 .632 1 3 Accessibility green areas 6 0 2.00 .894 1 3 Access to internet 6 0 2.50 .837 1 3
Aspects related to accessibility
Job accessibility 6 0 1.67 .816 1 3
Crime 2 4 1.00 .000 1 1 Health 1 5 1.00 1 1 Adults Skills 1 5 1.00 1 1 Quality liveability services 1 5 1.00 1 1 Culture and sports 1 5 1.00 1 1 Participation 1 5 1.00 1 1 Transport accessibility 1 5 1.00 1 1 Advice and guidance access 1 5 1.00 1 1
Aspects suggested by the interviewees
Child care 1 5 2.00 2 2
Of all the groups, ownership and accessibility of internet are considered the least important, although free access to internet is provided in the public libraries. It should be noted that no interviewee marked the aspect house ownership as “very important” and it has the lowest importance level in the ranked list (see Table 5.4 and Table 5.5)
Table 5.5 Level of importance inequality aspects (mean) Liverpool Aspect Mean
Income level 1.17 Employment 1.33 House quality 1.33 Education level 1.67 Sole use of bath/shower and toilet 1.67 Accessibility to jobs 1.67 Overcrowding 1.83 Accessibility to health centres 2 Accessibility to public green areas 2 Central heating 2.17 Accessibility to schools 2.17 Accessibility to internet 2.5 Tenancy / ownership of accommodation 2.67

107
The following aspects were suggested by the interviewees:
• crime level; • adults’ skills; • access to advice and guidance; • childcare; • health level; • quality liveability services; • culture and sports; • citizen participation; • access to transport.
It should be noted that crime level was mentioned several times as a relevant aspect of inequality. In addition, adults’ skills, access to advice and guidance, and childcare were mentioned in relation to specific policies.
Crime level The importance given to crime level and security can be explained by the policy actions taken to reduce differences and deprivation in the neighbourhoods. One example is that in the South Liverpool Cluster Strategy, in the cluster strategy for “Skills, Training and Employment” (such as JET employment initiatives61), it is expected that the strategy will help to reduce youth nuisance and crime. The awareness of the crime problem might also be explained by the issue that a more secure city centre might help to attract investors. It is also clearly stated in the strategy that “Crime and the fear of crime continue to be key issues for local people. Communities are particularly concerned about car related crime, anti social behaviour and youths causing annoyance (often linked to underage drinking and drugs)” (City of Liverpool, 2002c, p. 28).
Adults’ skills / access to advice and guidance Adults’ skills and the access to advice and guidance are both aspects related to the fact that people who are deprived of skills or who have low education levels are less prepared to claim social benefits. One consequence of the lack of skills is that there are people who are unable to fill in forms to claim benefits. The relevance given to that issue is reflected in one of the policies of the South Liverpool Cluster Strategy62 and it is an example of the emphasis given to public and private partnerships. Partnership for Learning is a complex that aims to offer training to the local community and is supported by the training budgets of companies located in the area. According to the South Liverpool Cluster Strategy (City of Liverpool, 2002c), “its surplus income can be used to skill and up skill local people by accessing state of the art training facilities and high quality training.”
Childcare
The provision of childcare is related to the objective of giving mothers in deprived neighbourhoods the opportunity to go out to work. This aspect is usually 61 For further details on the JETs, see p. 80. 62 See Section 4.9 for further details on the South Liverpool Cluster Strategy.

108
related to employment objectives and employability measures. In the case of South Liverpool, it is mentioned as an action “for people” (as distinct from actions for businesses) to support the action of “reviving local economies”. Consequently, it is listed together with the following interventions (City of Liverpool, 2002c): Improving transport links and childcare provision; Advice and guidance; Skills development and training.
5.8.1 Income level Income level is ranked as the most important aspect of inequality. Even though the local authority might not control income level, this aspect certainly determines other levels of disadvantages and this might be the reason why it is ranked as the most important. This perspective can be found in the following:
“Income level is very important, more important than employment … in my ward I have a lot of old people who aren’t economically active and if they do not have a good income, whether through benefits and pensions, they are disadvantaged in so many different ways” (Interviewee 21).
Interviewee 24 also perceived income level as very important and justified it from an egalitarian and social justice or moral perspective, saying that there was “more cohesiveness and stability in society” if the income disparities were low. He considered that, when there were high‐income disparities, “it totally changes the whole moral and ethical fibre of that society”.
As mentioned before, house ownership is the aspect assigned the lowest importance level in the ranked list and none of the interviewees rated it as “very important” (see Table 5.5). However, one of the interviewees suggested that ownership was a good proxy for income level.
5.8.2 Education – employment Even though local authorities cannot directly improve income, education usually appears as a “facilitator” to improve the income level. The interviewees emphasised the importance of informal education such as apprenticeships in improving the skills and the employability of the population. This policy is a response to the mismatch found between the economic and labour opportunities and the skills of the unemployed people. It also justifies the importance of education by linking education level with the capacity to get a job and so having an adequate income to satisfy other needs such as housing.
Education was repeatedly mentioned as an important aspect prioritised by the Liverpool administration. Education is taken into account in the policy goals to reduce inequalities or to cut the tradition/cycle of poverty in some families. As Interviewee 21 put it, education “gives the key to the individual to improve their own situation”. Therefore, lack of skills is regarded as one of the components of the cycle of poverty that is repeated from one generation to the next.
“… we’ve got 4th generation, unemployment in parts of the city and so we’ve got this sort of cycle of: poverty, poor skills, unemployment, poor motivation, no aspirations, transferring from one generation to the another” (Interviewee 22).

109
This comment might be related to the explanation given by the “culture of poverty” perspective (which considers poverty as self‐reproducing). This can be contrasted to a more structural and multidimensional perspective (discussed on p. 66). However, it should be noted that nowadays in Liverpool there is an awareness that the issue is more complex, and other aspects besides education are also taken into account. For local authorities it might always be difficult to improve structural aspects that fall outside their administrative boundaries or jurisdictions. In the following section, it can be seen that the multiple and interrelated aspects of inequality are considered and that inequality, poverty and deprivation are not reduced to a problem of income deprivation or considered just the outcome of the mismatch between skills and lack of education.
5.8.3 Interrelation of aspects of inequalities Policy makers frequently mentioned some aspects of inequality as interrelated to each other. Education can lead to better employability and increase the chance of a better income, but health too is an aspect that affects employability and is in turn affected by the quality of the housing. One interviewee expressed the differences in terms of access to health of those living in deprived areas of the city centre compared with those living in other areas, and related poor health to poverty.
The quality of the dwelling and high overcrowding levels, in particular, are considered to have great influence on the health of the population. One interviewee explained that they took into account that good or bad health was “more than the actions of illness”. The interviewee considered that in this respect there was a holistic approach to Liverpool regeneration, and he put it this way:
“There’s no point making sure someone has a job if their home they are living in is not up to decent standards, there’s no point in improving a house within a community if the schools in the area are failing. There is no point building a new school if people are scared to go out at night because there’s going to be a crime. So the whole thing has to be tackled together” (Interviewee 21).
Figure 5.1 Row houses under demolition next to inhabited houses in a deprived ward
(Alt Valley ‐ North Liverpool)
Figure 5.1 shows houses ready to be demolished due to their low quality. The reason why there was so much emphasis on housing quality (on average the third most

110
appreciated aspect of inequality) can be found in the explanation given by one of the policy makers. According to Interviewee 27, in Liverpool there are many pre‐war houses and 1940s housing that have never been upgraded or modernised, and a very high percentage of terraced properties were built without an inside bathroom. Another reason can be found in the population decline in Liverpool (see Figure 4.9) and the resulting housing unoccupancy. According to one of the interviewees, population had been declining but people were now coming back to the city centre: “We have now increased the city centre population to nearly 12,000, it was 3,000 four years ago, now 12,000 people live here” (Interviewee 22). The regeneration areas and the improvement in the city centre are visible, with housing, and commercial as well as cultural facilities (see Figure 5.2).
Figure 5.2 Regeneration in the city centre, right: Ropewalks Square and FACT,
the Foundation for Art & Creative Technology
More awareness of the safety issue in the city centre, to attract both investors and population, might explain to some extent the emphasis given to crime as an important aspect to consider. Crime was mentioned as an aspect closely related to other problems. One interviewee suggested a relationship between poverty and crime and drug abuse ‒ specifically poverty leading to drug (and alcohol) abuse, and drugs to crime.
The problem of fuel poverty was discussed during the interviews and its link with other inequality aspects such as health. In the UK, there is an increasing awareness of this problem, which is related to the inclusion of prepayment meters (Speak and Graham, 1999). It is a fact that people with prepayment meters pay higher gas and electricity charges than those paying by direct debit63. The use of tokens to pay for services such as electricity and gas ‒ although justified by some interviewees as a tool to enable households to better administer their budgets ‒ also reveals a lack of access to credit or banking services.
The problem of money lending and the abuse by “loan sharks”, and the lack of access to bank accounts and credit are interrelated problems. One interviewee mentioned that poor people were vulnerable to loan sharks since they could lose their properties if they did not pay back. In this respect, policy makers in Liverpool mentioned some examples of policies that addressed access to finance, from institutionalised retail banking to the support of credit unions. Interviewee 24 indicated
63 National Energy Action. Source: http://www.nea.org.uk/facts/debtdis.htm.

111
that “It’s now becoming more possible for people to have special bank accounts, without an overdraft facility, but they would be in a position to open a [debit] bank account”. Within the local partnership, they support credit unions, where neighbourhoods form a club and where they regularly save small amounts of money they are entitled to borrow. However, although recognising the importance of credit unions, the interviewee also admitted that nowadays, owing to modern forms of transactions, it was necessary to have a telephone or internet connection and a debit or credit card, and some people still did not have access to these.
The lack of access to bank and credit is also related to the black economy phenomenon, which can be explained as a direct consequence of unemployment64. As Interviewee 22 explained, the parallel economy is very strong and this is particularly the case in the northern end of the city. Historically the port drew its pool of labour, unskilled jobs mostly for men, from that area. This is also combined with very low levels of education attainment and poor skills. Again Interviewee 22: “that’s actually quite a strong enterprising culture, so the parallel economy flourishes”. Another interviewee commented on the same issue: “Liverpool is very famous for a black economy, for people who make a bit of money on the side, unofficial, who are very bright and very able.” As recognised by the interviewee, some people in the parallel economy have ideas that can generate money and even employment for other people. However, some of them are not able to read or write properly to a level where they could prepare a business plan to get a loan from a bank. The policy maker explains that for this reason they implement some programmes to improve their situation and help them to build up legitimate businesses. This shows the interrelation between inequality aspects such as low education level and unemployment. It is clear that those who are unskilled or have lower education levels have less chances of being employed or getting out of the parallel economy. However, as we have seen, other structural aspects such as housing quality, overcrowding, health, and crime are related to inequality and deprivation.
5.9 Policy responses to inequalities/deprivation Promotion of the so‐called “social enterprises” is one of the policy responses to inequality problems such as unemployment and the black economy. Interviewee 24 described social enterprises as follows:
“Various forms of private services are developed and run by local people, so a hairdressers, a bakery, a joiner, an electrician, or a painter and decorator ... you actually get local people starting up one of those types of businesses” (Interviewee 24).
Another interviewee, director of one of the Cluster Partnerships, described social enterprises as one of the actions within their neighbourhood cluster. Describing them as businesses with a social impact and interest, the interviewee gave the example of how
64 Although this problem was not explicitly discussed in the interviews of Rosario, the black or parallel economy is present in the developing world and particularly in areas with high levels of unemployment. This is reflected in activities such as informal garbage collection (cirugeo) which, as one interviewee in Rosario put it, is one of the “survival strategies” that the unemployed find.

112
where the local private transport does not provide a proper service, accessibility to the place of work has been improved through a “community transport agency”:
“… it provides affordable transport to people ... they take people to work at times that the buses don’t run, so if you haven’t got a car then you might not be able to get a job in a factory because the shifts start earlier than the buses do” (Interviewee 21).
Development of the social economy or the social enterprise is present in the strategy of the neighbourhood clusters (as discussed in Section 4.9). The Liverpool City Council itself encourages the development of social enterprise, based on the notion of wealth and employment creation within neighbourhoods. There is one agency in particular (Liverpool Plus) that provides the strategic framework for the development of social enterprise in the city, including such aspects as research, project development and investment provision (City of Liverpool, 2002c).
During the interviews, reference was usually made to the relationship between deprivation and economic development. In Liverpool, some areas of growth are surrounded by areas of acute deprivation. This situation is seen as an opportunity by the Liverpool Neighbourhood Renewal Strategy (LNRS), with the challenge being to combine both competitiveness and social inclusion. The plan states that “opportunities and needs have an important spatial dimension” (City of Liverpool, 2002a, p. 6).
This is reflected in the policy response and what one interviewee referred to as a unique system of “twin pillars” or the linking of areas of opportunity with the areas of need. Interviewee 22 considered the link between economic competitiveness and deprivation to be very important in seeking a way out of social exclusion:
“One of the conclusions we came to 5 years ago was that the main route out of social exclusion was through the labour market. And because national labour market policy is not spatially sensitive, it works by targeting particular priority groups that can live anywhere, and in the city the geography is very important, so we clustered up the growth areas with the areas of need. We have developed new mechanisms for connecting up unemployed people with employers over and above national programmes” (Interviewee 22).
This comment reveals a recognition of the importance of targeting areas (and not only groups), especially for urban policies. It also indicates the role of the national government (to address employment policies), which targets groups, compared with the “spatial” approach of the local authority, which targets areas. The LNRS applies the regeneration policy down to the level of neighbourhoods (area level) through 20 neighbourhood action plans grouped into five clusters65 . These are partnerships with community involvement that promote skills, employment and economic development in order to tackle social and economic deprivation (City of Liverpool, 2002a, p. 7). The “twin‐pillar” approach is also present in the Cluster Partnerships, since they gather
65 For details on the LNRS policies at area level, see p. 75.

113
together both local businesses and communities. Referring to these partnerships, Interviewee 22 stressed the importance of local knowledge when it came to defining the area needs and opportunities. Public‐private partnerships have a key role in the policies implemented, as indicated by the words of the director of the South Liverpool Partnership:
“It has Community groups represented; it has the Council, the key partner and the driving force is the local authority. It also has private sector, mainly, a mix of strategic employers, and the big employers in the area like the airport, but also more medium sized enterprise business. And the Public agencies, the main ones being, the Police and Health, but also the large Registered Social Landlords (RSLs)” (Director of South Liverpool Partnership).
It is usually agreed that, while most of the deprivation problems appear within the cities, they are also areas of opportunity and (potential) growth. According to Interviewee 22, this perspective is acknowledged in the national policy when it comes to recognising the opportunities that “core cities”66 such as Liverpool have in the UK.
As explained in the previous chapter (Section 4.5), in 2001 the UK national government launched the New Commitment to Neighbourhood Renewal initiative. The vision of the government is to narrow the gap between deprived neighbourhoods and the rest of the country, and the aim is that within 10 to 20 years, no‐one should be seriously disadvantaged by where they live (ODPM, 2001, p. 8). Interviewee 22 explained that the local response to that strategy was to identify 21 priority neighbourhoods, areas of acute deprivation. At the same time, it is recognised that they had already been targeting deprived areas for the European Objective 1 Programme and a previous national scheme called the Single Regeneration Budget67.
According to the same interviewee, what the government is trying to do is to finally recognise that deprivation is multifaceted. Another interviewee had a similar perspective and recognised the role of the central government in promoting the reduction of gaps through the neighbourhood renewal agenda and in reacting against the previous market‐led approach of regeneration:
“the Labour government, has reacted against the trickle down economics – i.e. if you give tax cuts to private business, ... then the benefits will trickle down to the community. When Tony Blair came in he initiated this change and this concept of regeneration, which said that nothing can receive public money unless you can show what the direct benefits to the community are” (Interviewee 24).
66 The Core Cities Group of authorities currently comprises the eight major “regional cities” in England: Birmingham, Bristol, Leeds, Liverpool, Manchester, Newcastle, Nottingham and Sheffield. 67 The Single Regeneration Budget (SRB) started in 1994 and combined the resources of 20 different programmes.

114
The LNRS, at the same time as tackling disadvantaged wards, also includes within one of its actions the promotion of effective information68. This was demonstrated by one of the interviewees and by the City of Liverpoolʹs Regeneration Policy Division, which considers that “although good data is not a substitute for action, the process of changing the fortunes of these [deprived] neighbourhoods is highly dependent on setting meaningful targets and monitoring change” (City of Liverpool, 2002b, p. 1). It is also indicated that one reason why national policy has been slow to respond to the deterioration of the most vulnerable areas in the last 20 years is the absence of good information about local conditions.
The same report warns of the problem of obtaining up‐to‐date data or data at ward level, which was also mentioned during the interviews. The following section explains the use of indicators and reflects on the local intention to promote the use of effective information.
5.10 Indicators usage In the year 2000, the national government published the Index of Multiple Deprivation, focusing on six aspects: income; employment; health and disability; education, skills and training; and geographical access to services (DETR, 2000b). This index was consistently cited by the interviewees as one of the most used tools to identify deprived wards and target areas. The importance given to this measure might also be explained by the position of Liverpool in this index. In England there are a total of 8,414 wards. Each ward is given a rank and score for each of the six aspects of deprivation. The first rank indicates that the ward is the most deprived. Liverpool is ranked the fifth most deprived local authority in England (out of 354) and the second worst district for employment deprivation and incomes (City of Liverpool, 2002b). Interviewee 22, referring to the indices of deprivation, stressed the importance of selecting the right set of indicators to “capture the whole picture”.
This issue is related to the fact that an indicator focuses on and renders only intentionally selected areas of the reality (Innes, 1990). In the same direction, Interviewee 21 explained how a particular set of indicators can reflect a problem (or not), depending on the perspective of the policy. In the case of deprivation, and according to this interviewee, there was a change in the perception of deprivation after 1997, during the Blair administration:
“In the early 1990s we had a radical restructuring, which had a phenomenally destructive impact on the poorest communities. But the indicators that were in use at that time didn’t actually capture the whole picture and it was only really in 1997 with the Blair government, in fact, this government has actually said there is a problem with indicators so policy makers weren’t able to respond to what was actually happening” (Interviewee 22).
Interviewee 22 explained that the reason for comparing wards locally as well as nationally was to some extent related to the fact that resources were allocated by the central government to the local authorities. He also considered that this was part of the
68 For further details, see p. 78.

115
government “waking up” to the fact that deprivation had a major impact on the economic competitiveness of the country as a whole, and therefore needed a better understanding of where the problems were.
5.10.1 Targets / setting targets: Public Service Agreements (PSAT) As explained in Section 3.1, indicators can be classified as baseline, target and outcome indicators. By using target indicators, goals and objectives can be set after the areas of need have been identified with the descriptive/baseline indicators.
The British national government seems to be leading the issue of setting targets for the local authorities. Most of the interviewees mentioned the Public Service Agreement (PSA) targets69. These are called “floor targets”, and represent the bottom line to be achieved across the country and in each of the following areas: jobs, crime, education, health and housing (City of Liverpool, 2002b). The Liverpool Neighbourhood Renewal Strategy considers it very important to establish the baselines of current conditions in order to measure the gap to the floor targets (City of Liverpool, 2002b, p. 1). Interviewee 21 explained that:
“the big target is making sure that we not only close the gap nationally, but we close the gap in Liverpool. So we say, e.g. ‘no ward in Liverpool should have more than four times [unemployment than] the lowest ward in Liverpool.’”
In the following comments the role of the central government appears as a trigger for the establishment of targets. As Interviewee 23 put it: “sometimes the targets are a given, because the likes of the Public Service Agreements are given, and they can be quite challenging”. The PSA targets were further explained by another interviewee, who also linked these with the role of the neighbourhood renewal agenda in introducing the use of indicators to monitor performance:
“Neighbourhood renewal has a number of key themes and measures. The themes are crime, health, housing, education, and employment and improvement in public services. There are a number of different measures for that and there are targets set, which are called the Public Service Agreement PSA targets, and they are called shared targets […]. So this means to tackle employment levels it needs a health agenda as much as it needs a skills and training agenda” (Interviewee 24).
Another interesting point in this is the concept of shared targets, which emphasise the multidimensional aspects of inequality and the links between them. An additional important aspect is that even though the targets are set nationally, the set of baseline indicators ‒ or the “data platform” ‒ are collected locally both for the development of the community (or cluster strategy) and at city level (LNRS). Interviewee 22 indicated that they produced a very comprehensive data platform with a very broad basket of indicators, with population, education, employment, health, crime and housing as a kind of starting point. As the interviewee put it: “the baselines are crucially important because
69 See Section 4.8 and Figure 4.13 for further details.
116
that enables us to work out the distance that we’ve got to travel at a neighbourhood level and at city level”.
These baselines help the local authority (and their partners) to target and re‐focus the spend on areas of greatest need, which gives the regeneration policy a social justice perspective.
Nevertheless, these initiatives and the demand to target and measure performance have generated some negative reactions related to an overload of information.
5.11 Reaction to “too much information” Some interviewees indicated that to some extent measuring had reached saturation point. Nevertheless, those that see some negative aspects in the use of indicators further recognise the importance of a combination of qualitative and quantitative information. Indicators also seem to remain the best option when it comes to the “fight for money” or arguing for resources.
Comments such as “people are getting tired of this” or “indicators fatigue” were given during the interviews. This shows to some extent the problem of overloading policy makers with measurements, especially if there are overlapping sets of indicators or long lists of indicators. It seems that in the UK, as Interviewee 23 explained, the beginning of the Blair administration was the “big target time”. However, according to the same interviewee, some people are rebelling and official reports are also saying that they are “measuring too much”. The same perspective was given by Interviewee 21, who emphasised that there were overlapping collections of indicators and they had more than they had time to deal with:
“When I got here there were something like 300 key performance indicators […]. All of our partners have exactly the same regimes but their indicators may be different. So whilst the government is saying better alignment between the council and the public agencies, we all have different targets, the management information systems are all different, and there are times when you just drown in the number of indicators and targets” (Interviewee 22).
Interviewee 24 was particularly critical about the real usefulness of indicators. This interviewee commented that “understanding the gap between what your levels of deprivation are and what they should be is good but it doesn’t really help you ... you know things could be better, you don’t need to measure it to know that things need to be better in the area”70. In the same context, he added that indicators “create more problems than answers”:
“They create a whole range of issues that people knew were there but now you have given a handle for people to say this isn’t good enough, and it creates a whole positivist agenda for changing figures and numbers” (Interviewee 24).
70 This is comparable to the remark of one interviewee in Rosario who indicated that they did not quantify or do any studies before they targeted the policies because they simply “find problems everywhere.”

117
This last remark can be related to the issue that some policy makers feel that they are themselves being monitored and that indicators might judge their performance. It should not be interpreted as a negative effect of the indicators themselves but to some extent the context in which indicators are being imposed or implemented. In the case of the UK, when they are imposed by the national government rather than coming from a local demand, the risk of being rejected is related to the issue of feeling that indicators control or audit the policy makers or the administration performance. On the other hand, Interviewee 27 explained that some performance indicators might be more positive than what was happening in the field or perceived in reality in the communities. Maybe this is a good justification for indicators being complemented by indicators of expressed need71. Still, the same interviewee does recognise the role that indicators have to detect and prioritise problem areas.
Mention was also made of the importance of combining qualitative and quantitative data because “statistics don’t tell you the whole story”. The interviewee gave the example that reported crime statistics just identified crime that had been reported, whereas people in poor communities did not always report crime. However, it was explained that, if they needed to get money or argue for resources to solve a certain problem, it was still preferable to use quantitative data.
One problem mentioned is that sometimes the set of indicators is not carefully selected. One of the interviewees said that some selected indicators were “not good ones” and sometimes they came up against the problem that they did not know who had chosen them. Since indicators are not selected properly, they cannot be collected ‒ which is also an issue of data availability. Interviewee 23 commented that the biggest problems with indicators stemmed from “people not thinking sufficiently well about the choice at the beginning that indicators need to be ones that you can collect”.
Even though the importance of having good information is accepted, there seems to be some hesitation when it comes to putting planning and quantitative information within a timeframe. Interviewee 23 indicated that policy makers “don’t appreciate how indicators fit into the policy planning cycle, that ideally you should create a policy, do your action plan, find out what happened”.
Some interviewees see this as a consequence of what they referred to as a “blame culture”. One interviewee stated that to some extent policy makers were afraid of being evaluated by the use of indicators or targets; they felt they were being pointed at, and were afraid of being blamed for a policy failure. “They are so suspicious of indicators because they are going to be aware that someone’s going to point the finger at them and say ‘you didn’t do well enough.’”
The explanation for this fear might be that indicators have to measure outcomes rather than outputs. To measure equity, it is advisable to focus not on output measures of services but on the outcomes that the service brings, such as the changes in social conditions (Pacione, 2001). Following a similar approach, one interviewee explained the problem of measuring outputs instead of outcomes. Interviewee 23 explained that in the year 2000 the Audit Commission decided they wanted to develop a national set of
71 For a discussion on derived need and expressed need, see p. 28.

118
indicators that would measure the quality of life. The reason was they recognised that, although there were many sets of indicators, they generally measured outputs instead of outcomes. As one interviewee put it: “an indicator isn’t a measure of what they [policy makers] do, it’s counting what happens after they have done it”.
5.12 Use of GIS to construct indicators The need to use GIS to construct indicators for Liverpool clearly stems from the demand for analysing performance at ward level. As justified by Interviewee 21, there is a need to compare wards not only locally but also at national level because there are many “competing neighbourhoods” and there has to be some fairness in the distribution of resources. Therefore, they not only compare Liverpool at city level with the national average but also the ward average with the average for Liverpool.
However, the problem of lack of data with low levels of aggregation was often mentioned. An interviewee indicated that trying to get unemployment information from the National Employment Service at neighbourhood or household level was virtually impossible because “They either do not have it or they would not release it”. On the other hand, there are some agencies, such as the police, that are able to give reported crime statistics at ward level.
Even though the work within partnerships increases the cooperation between different agencies, there are some problems when it comes to exchanging information. The different definitions of administrative boundaries are usually a problem, especially when it comes to sharing data. At the same time, the need to share data makes the agencies cooperate with one another:
“What we try and do in Liverpool is work with other agencies, so e.g. Job Centre Plus ... They have reorganised their management centre, so they now have a manager for the cluster area, which is the same geographical area as mine, and that makes it a lot easier to work operationally and to get the statistics“ (Interviewee 21).
The need to exchange data is not only a demand arising from the need to share indicators within a partnership but also what is usually referred to as a consequence of the implementation of GIS systems. In this respect, another interviewee said:
“I’d like to see at the end of my time that all the partners in this partnership group have got an integrated information system ideally done through GIS” (Interviewee 23).
The combined use of GIS and indicators was found within the Education Portfolio of Liverpool. This department started using GIS in 1995, with funding from the European Union. The success in implementing GIS in this area can also be seen in the increasing demand for information. As Interviewee 25 put it: “there’s a lot more demand now ... once people see what GIS can do, you know, that it can present amazingly complex data in a very accessible way”.

119
It is not only in education that GIS can be a very useful tool for constructing indicators or analysing data. There is also recognition of the considerable amount of administrative data with a geographical reference that is generated:
“Typically because of the nature of the duties of the local authority, over 80% of the data that we deal with has a location aspect: an address or a piece of land that we are dealing with. The penetration of GIS into our systems is increasing by the day” (Interviewee 25).
However, the difficulties of combining different boundaries and lack of data at low levels of aggregation show that the use of GIS can still be improved.
The recognition of the value of GIS, which is demonstrated by the demand for spatial data, together with a greater demand for data at the disaggregated level, might generate an increasing use of GIS. One of the interviewees, when asked if indicators and GIS had a role in targeting the most deprived areas, responded affirmatively and gave the following example, related to the neighbourhood renewal strategy policy, of how it helped to narrow down the selection and focus on the areas in most need:
“70% of the city is in the worst 10% wards in the country. When we started the neighbourhood renewal strategy we realised that we could not deal with 70% of the city, so we used the Indices of Multiple Deprivation plus a number of other indicators to identify [priority neighbourhoods] … So in fact the priority neighbourhoods selected cover 50% of the city” (Interviewee 22).
Within the education department, the geocoding capabilities of GIS are also being used and data are recorded about not only the schools but also the pupils. Once a year a database recording the characteristics, including ethnic origin and exam results, of around 92,000 pupils is updated in this respect This is particularly useful for targeting children whose language is not English or children with special educational needs. The department can monitor them throughout their school career and knows not only the school they attend but also where they live and the socio‐economic characteristics of their neighbourhoods. One interviewee emphasised the importance of data quality and, in particular, the role of a National Gazetteer in handling these data. Since the systems currently handle addresses in different ways, this gazetteer can ensure the quality of the data with a unique reference code for each address.
The importance of capacity building within the department in order to be able to use the data generated is evident from the interviews, and training programmes for the six staff members involved have been implemented. They also work closely with other offices, such as regeneration and housing. As they all have their own GIS teams, they share data. The use of GIS across the Liverpool authority was introduced in 1998 with the establishment of Eurogise, a Europe‐funded team. As one interviewee explained: “They wanted to use education as a project to show how GIS could be used to support decision making.” This team has now been transformed into the Geodata Team, which develops the GIS facility within the Liverpool City Council.

120
5.13 Contrasting indicators usage: Rosario – Liverpool This section presents the similarities and contrasts observed from the interviews in relation to prioritised inequality aspects and the use of indicators. Many things can be learned from the UK case study, given the longer experience in both the use of indicators and the application of area‐based policies. Consequently, these remarks are taken into account in the construction of indicators proposed in Chapters 6 and 7, as well as in the recommendations presented in Chapter 8 for their implementation in Rosario.
5.13.1 Inequality aspects Whereas in Rosario the four highest ranked aspects of inequality are overcrowding, education, employment, and water connections, in Liverpool they are income, employment, house quality and education level. Education and employment are considered very important in both cities and the explanation may well be the shared idea that education, skills and employment can help in reducing economic and other disparities. On the other hand, the differences in physical aspects related to dwellings, such as water connections and overcrowding in Rosario and house quality in Liverpool, can be explained by the differences in housing development between the two cities. Lack of water connections in houses and a high overcrowding level are characteristic of slum areas. Bearing in mind the lack of slum or informal areas in Liverpool, the shift in attention towards house quality is reasonable, with low‐quality housing becoming the most important habitat problem. Therefore, it can be expected that, once the slum areas are eradicated in Rosario, attention here too will shift to aspects related to the quality of the dwelling.
The policies addressing the informal economy and unemployment, and in particular the emphasis on education and social enterprises, are mentioned in both Rosario and Liverpool. In the case of Liverpool, such policies have been implemented over a longer period (e.g. Jobs, Education and Training services (JETs))72. The role of the private sector within the partnerships is particularly stressed in Liverpool, whereas this does not seem to be the case in, for example, the Rosario Hábitat Programme. Although in Rosario the private sector was actively involved during the formulation of the Strategic Plan, the absence of “cluster strategies” such as strategic plans at neighbourhood level or local regeneration partnerships might explain the lack of public‐private partnership in concrete programmes at the small‐area level. Therefore, Rosario might also benefit from a similar implementation of strategic plans at neighbourhood level. The perception of inequalities and deprivation as a multidimensional problem has a clear correlation in the policy approach in the UK. The combination of economic development and competitiveness with social inclusion results in the attention given to several aspects of deprivation. The proximity of deprived areas to an area of growth is taken as an opportunity to reduce deprivation and inequalities, which is reflected in the creation of clusters and partnerships involving the private sector.
The interviews indicate less coordination between national and local policies in Rosario than in Liverpool. This can be explained by the fact that in the UK there is a stronger presence of the national government in the implementation of regeneration policies and in actions towards equalisation. Proof of this is the existence of the Index of
72 For further details on the JETs, see p. 80.

121
Multiple Deprivation and its measurement at national level. There is no similar initiative in Argentina, which can be partially explained by its federal system of government.
One topic that does not feature in the interviews in Rosario is the problem of security and crime. On the other hand, crime is mentioned in Liverpool as an aspect closely related to other problems, such as drug abuse and deprivation. In Rosario, only one interviewee mentioned crime and security, and he used them to describe the problem of concentration of crime in some slum areas and the stigmatisation that this generated in the population living in that area73.
5.13.2 Indicators Both in Liverpool and Rosario, supranational organisations have a role in the demand for and/or in the collection of indicators, as well as in the setting of targets. In Argentina, the IMF, the World Bank or the Inter‐American Development Bank makes local governments use indicators to monitor progress/performance and target areas. In the case of Liverpool, the role of the European Union is also mentioned as one of the reasons for using indicators and targeting deprived areas.
In both case studies, policy makers put in doubt the validity of indices. In the case of the Index of Multiple Deprivation, one interviewee in Liverpool observed how a movement or change in one of the indicators that composed the index might be cancelled out by a movement in another. There are some aspects that might explain why some policy makers react adversely to the use of indicators or quantitative measures in general. In the case of Rosario, concern is expressed at the lack of planning tradition, with the observation that there is less interest in measuring. In the case of Liverpool, one interviewee put it this way: “People want to get out there and do projects straight away and not put some time into planning, which is part of gathering information” (Interviewee 21). Some policy makers are afraid of being evaluated through the use of indicators or targets; they feel they are being pointed at and are afraid of being blamed for a policy failure. This explains why there is a feeling that the use of indicators has reached saturation point.
In any case, it can be noted that planning and the use of indicators are more embedded in the UK context. In both cases, policy makers clearly recognise the importance of having the best information possible when it comes to taking decisions or starting to implement programmes or actions. Indicators also seem to remain the best option when it comes to the “fight for money” or arguing for resources. Another reason why indicators may be implemented is to control the concession of privatised services, as indicated by two interviewees in Rosario and Liverpool. Besides, most of the interviewees recognise that they rely not only on quantitative but also on qualitative information, and they highly appreciate the combination of both.
In terms of data availability, even though policy makers in both cities recognise the need to work in small areas, they are also aware of the difficulties in finding data at such a high level of disaggregation. However, access to data is still better in Liverpool than in Rosario, which can be related to the greater amount of resources in the former.
73 However, during the years 2003 and 2004 there was an increase in awareness of the crime problem, which was reflected in the creation in Rosario of a local “urban guard” (Guardia Urbana), with patrol and crime prevention duties.

122
The economic difficulties that affected the implementation schedule of the 2001 census in Argentina are a clear example of this.
The longer tradition in using indicators can explain why some of interviewees in Liverpool were aware of problems concerning indicators that were not mentioned by interviewees in Rosario. This could also be related to a culture of setting targets and using performance indicators that are demanded by the central government. The clear demand from the national government can explain the extended and systematic use of indicators in Liverpool. In contrast, in Rosario there is almost a “voluntary use of indicator because it is not compulsory to have that information” (Interviewee 12).
The lack of staff or resources in Rosario might be seen as the immediate reason why indicators are less widely used here than in Liverpool. However, as lack of staff is also a problem mentioned in Liverpool, and lack of resources is an obvious difference between the two cities, the biggest difference that remains is the embedment of indicators generated by national government demand. The clear intention of reducing inequalities expressed by the ODPM explains the emphasis on the multiple aspects of deprivation in the construction of the Index of Multiple Deprivation and its measurement at national level. Finally, the correlation of this policy at local level in both neighbourhood renewal and the implementation of indicators to target the most deprived areas explains a more systematic and wider use of indicators in Liverpool than in Rosario.
It is important not to overload policy makers with indicator measurements. Although the national level can facilitate and promote the implementation of indicators, it can also make local policy makers believe their performance is in doubt. Hence, a combination of local demand and discussion with and participation of the local government at the moment of setting indicators and targets can guarantee a better embedment. The spatial component in the area‐based policies applied in Liverpool and the performance analysis at ward level triggers the use of not only indicators but also GIS. One positive result regarding the application of GIS is the coordination between areas to standardise administrative boundaries and exchange information.
Some of the previous findings are taken into account in developing the methodology and are reflected throughout the following chapter and, in particular, in the recommendations presented in Chapter 8. It is interesting to note that some of these findings relate to those obtained in other studies. Indicators are seen by policy makers as useful for raising awareness and particularly for helping to develop relationships across the local government departments (Higginson et al., 2003). The same report states that this is a very important value, considering that cross‐sector working is high on the modernisation agenda. However, as also found in this research, some policy makers feel that indicators are not yet influencing action or decision making as much as they would expect (Higginson et al., 2003). One of the explanations given is that “it is not always clear how policy is made and how information should be fed into the policy making process” (Higginson et al., 2003). In the particular case of indicators of quality of life, it is indicated that many aspects are beyond the responsibility and direct influence of local authorities. Lack of resources and dedicated staff in relation to indicator use are also reported. Insufficient communication of indicator findings is also mentioned as a problem (Innes, 1990; Higginson et al., 2003).

123
Another report carried out by Cecilia Wong, among others, from the University of Liverpool indicates that there are still issues difficult to measure, such as community participation (ODPM, 2004a). This is also indicated by a couple of policy makers in Rosario. The same report indicates the importance for future development of the potential of use of administrative data, which is also recognised in this research. One of the points mentioned that has to be overcome is that access to some data sets is restricted owing to confidentiality issues ‒ a situation also present in the case of Rosario.
The concern that some policy makers have about information overload and too many targets is also indicated in another recent study (ODPM, 2005b). Policy makers interviewed for that study also express concern that policies to tackle inequality such as area‐based initiatives are effective in tackling concentrations of problems but less suitable when dealing with “problems which cross boundaries, are scattered or related to individual circumstances”. Among the factors that make these area‐based policies successful is that they include an accurate diagnosis of causes of problems and “active community engagement in designing solutions”. The role of partnerships and the double approach ‒ economic and social ‒ to regeneration mentioned in Liverpool are also mentioned in this report as issues that policy makers consider to be successful factors in the application of area‐based and regeneration policies. The integration with other programmes and initiatives is another factor identified in this research, and one mentioned by the ODPM report as a common view among the policy community.


125
Chapter 6 Methodology This chapter addresses the second and third research questions. A set of indicators is proposed that is valid for describing intra‐urban inequalities, as well as a method of monitoring the change of the phenomena over time. By defining a methodology that can communicate gaps, rank neighbourhoods and target worst‐off areas, it is intended to offer a tool that is both descriptive and prescriptive. This methodology proposes to systematically monitor the most relevant aspects of intra‐urban inequalities through an indicator matrix and an approach to incorporate a geographical component into municipal budget allocation.
6.1 What set of GIS-based indicators is valid/relevant for describing intra-urban inequalities?
Since indicators are by definition related to policy, to be valid they have to be not only scientifically adequate but also related to the local policy context and policy applicable. Therefore, this research considers indicators valid and relevant when:
• they are scientifically adequate and valid (that is, the extent to which the
measure reflects the phenomenon (Innes, 1990), which in this case is inequality);
• they are related to the local policy context (that is, they reflect the priorities of policy makers);
• they are policy applicable (closely related to the previous two conditions since the (valid) measure and outcomes should mean something to the policy maker).
Consequently, Figure 6.1 shows the steps followed for the selection of indicators. First, a problem perspective was identified by analysing the conceptualisation of inequality described in Section 2.1, which resulted in a social justice perspective. Proportional equality based on needs was the policy goal inscribed in this perspective. To delimit the problem and identify its aspects and domains, a review was made of the literature on social and urban indicators, as well as on existing indicators initiatives (Section 3.4). It is in these three steps that indicators can be identified as scientifically adequate and valid. A pre‐selected list of inequality aspects was validated with policy makers, with the aim of selecting indicators that are policy‐relevant and policy‐applicable (Chapter 5).
6.1.1 Policy-relevant indicators As described in Chapter 5, 20 semi‐structured interviews were held in the city of Rosario to find out how local policy makers perceive inequality, and to see which domains/factors of inequality they find more relevant. One reason for incorporating policy and institutional aspects in the research is that, according to Innes (1990), a problem faced by the early social indicators movement in the 1960s was that the indicators emphasised the measurement task, often excluding political and institutional aspects.

126
Definition of policy goal
Delimitation of problem aspects / domains
Literature review in social and urban indicators
Academic and practice
Proportional equality based on needs
Preselection of aspects
Validation with policy makers
Final selection of indicators 10 most representative
Identification of problem perspective Social justice
Figure 6.1 Steps in the selection of inequality indicators
The criteria governing the selection of indicators, as well as the selection of accessibility methods or statistical analysis, took into account that indicators should be easily understood and transparent to policy and decision makers.
The pre‐selection of inequality aspects included in the interviews74 was based on the literature review of indicators, as described in Section 3.4, and they were adjusted according to the spatial inequality domains addressed by this research.
6.1.2 Policy-applicable indicators The indicators should facilitate the applicability of policy and, as said before, valid measures and outcomes should mean something to the policy maker. Within the decision‐making components, ideally indicators should help in identifying problems (descriptive input) and targeting areas (prescriptive input), and in implementation and monitoring (prescriptive and predictive input). Following the social justice perspective, they should facilitate equality in local government investment. In general, the indicators should be able to provide the following responses:
74 See Table 5.1 for the list of aspects and the priority given by policy makers.

127
Descriptive response: Policy makers should be able to know what the problems are, where they are concentrated, and whom they affect:
• Describing and (to some extent) explaining inequality. Prescriptive response: Policy makers should be able to know what to address first,
and where, and how much – or what proportion – to invest: • Ranking areas according to intensity of problems or need for intervention; • Allocating investments, subsidies, operational costs. Predictive response: Policy makers should be able to detect negative tendencies
towards inequality and policy performance: • Early warning system (ex‐ante monitoring); • Policy evaluation.
6.1.3 Indicator matrix Following the interviews, it was decided to include in the indicator matrix (Table 6.1) a representative set of indicators for the 10 most important aspects of inequality suggested by the policy makers. One reason for including this number of indicators was based on the experience of other initiatives, where a large set of indicators was difficult to update, Another reason was to avoid saturation or indicator overload, which was one of the criticisms expressed by policy makers in Liverpool (Chapter 5).
Income level was not included in the set since there were no income data available. Nevertheless, a socio‐economic status index was used as a proxy and constructed using factor analysis. Environment‐related indicators such as pollution levels, which are present in some indicators initiatives (Section 3.4) and influence quality‐of‐life conditions, were not included because they were not mentioned by the interviewees as an aspect of inequality and because of the lack of small‐area data. Even though crime (or security) can be considered an aspect of the socio‐economic environment, it was not included because it did not appear as a relevant topic within the interviews in Rosario and because of the lack of small‐area data. Still, including an indicator that represents security or crime is advisable. However, the problem here is that crime is usually under‐reported and therefore crime statistics are among the least reliable. In the case of car or property theft, data in police records might be available and reliable because of insurance claims; in the case of personal crimes, however, the reliability of the data is usually questionable. In many countries, less than 50% of the total crimes are reported and therefore registered in official statistics (UNCHS, 2000b).
Accessibility to internet, although it was considered the aspect of inequality of lowest importance, is still kept since it is necessary to cover the domain of accessibility to ICT and new technologies, bearing in mind its future implications for the quality of life of individuals and that technological diffusion is selective (Castells, 1996). Accessibility to day‐care centres (Centros Crecer) was included, since they represent a policy response to inequalities and they are related to several aspects of inequality, such as health and education. Expressed housing needs, calculated from administrative data were also included. This indicator is also relevant owing to the high importance of the habitat in the quality of life of the population, and it was included as an example of how administrative data can also be used to construct GIS‐based indicators.

128
Table 6.1 Final set of indicators
Domain Indicator Data Source Areal Unit
Conditions / Quality of Life Axis
Overcrowding Census Census block group (approx.1000p.)
Inadequate housing (housing quality) Census Census block group
(approx.1000p.) Physical environment
Expressed housing deprivation
Administrative data Point data
Education level Census Census block group (approx.1000p.)
Unemployment Census Census block group (approx.1000p.)
Health coverage Census Census block group (approx.1000p.)
Socio-economic environment
Income (Socio-economic status) Census Census block group
(approx.1000p.)
Distribution of Opportunities /
Accessibility Axis
Tap water in the dwelling Census Census block group (approx.1000p.)
Physical Infrastructure
Sewage connections Census Census block group (approx.1000p.)
Education (primary schools) accessibility
Administrative data Point data
Health (primary health facilities) accessibility
Administrative data Point data
Social infrastructure /
provision of services Centros Crecer (day-care
centres) Administrative
data Point data
ICT infrastructure % households with PC with internet Census Census block group
(approx.1000p.)

129
6.2 Calculating GIS-based indicators To construct the indicators, this research specified operational definitions75. These definitions reflect the issues discussed in Section 3.1 and follow, in particular, the guidelines and recommendations prepared by UN‐HABITAT for the Urban Indicators Programme (UNCHS, 1995; UNCHS, 2000a; UNCHS, 2000b). The reason is that UN‐HABITAT is internationally recognised for its experience in the development and application of urban indicators. Proof of this recognition is that UN‐HABITAT is the only international institution with a specific mandate to assemble information on urban areas (Hall and Pfeiffer, 2000, p. 199).
The operational definitions were also adapted to the data sources available locally. Data availability is then one of the criteria for the selection of the indicators, in addition to policy relevance. The definitions of the National Institute of Statistics and Censuses (INDEC) were also specified where necessary, considering that the main data source was the Argentinean census.
6.2.1 Areal units – census data The areal units of the indicators correspond to the geography of the census in Argentina. Small‐area census data are available in Argentina from the National Institute of Statistics and Censuses (INDEC). The census takes place every 10 years and is a complete count census, which means that every household in the country is visited. The population data obtained in the census correspond to the de facto76 population, which refers to all persons present in the household on the night of the census. The 2001 census took place on the 17th and 18th November 2001, and no sampling methods were used. During the census days, INDEC interviewed every household, using a single questionnaire (INDEC, 2003).
The spatial detail of the census data is determined by the boundaries of each census tract77. They are established so that every polygon has a similar amount of population regardless of its geographical size.
The census data are provided in digital format for the years 1991 and 2001 and cover variables related to the population, household and dwelling characteristics. The 2001 census included new variables to cover some of the lifestyle characteristics of the household, such as mobile phone ownership, availability of personal computer, cable TV, etc78. These new variables are useful for defining the socio‐economic status of the household.
Figure 6.2 A‐B shows the polygons that define the census tracts and their size and shape variations. The city of Rosario has 56 census tracts (fracciones), with an average of 16,182 people to each polygon. At the same time, census tracts are formed of 15 block groups (radios censales) on average.
75 For a complete description of the indicators and their interpretation, see Annex 3: Operational definitions of indicators. 76 In countries without a census (e.g. the Netherlands), the population data are de jure population, which refers to all the persons recorded in the municipal registers. 77 Other countries called these statistical areas “enumeration districts” or “output areas” (UK). 78 For a list of the different variables, see Annex 5: Variables census 1991 – 2001.

130
Figure 6.2 A‐B: Census tracts (fracciones censales) ‐ Block groups (radios censales)
In Rosario, there are a total of 901 block groups with an average of 1,015 people in each. Block groups are formed by blocks (manzanas), the lowest level of aggregation, but for reasons of confidentiality data at such a level are not available.
The indicators constructed with census data were calculated and mapped as a ratio measure and presented as percentages. Therefore, most of the GIS‐based indicators that appear in the next chapter were processed and standardised using as denominator the total population, households or dwellings within the census block groups. The use of absolute measures79 instead of ratios would have affected the comparability between different areas.
Two main issues arise in the analysis of changes in inequalities between 1991 and 2001: the change in census geography and the change in census variables. The strategy followed for the change in census boundaries was to summarise the 2001 census block groups into 1991 census block groups. This was feasible since the 2001 census increased the number of census block groups but kept them nested in the 1991 boundaries80. In the case of the variables, the main difference between 1991 and 2001 is the lack of variables related to lifestyle characteristics, which hinders the possibility of generating a proxy for income or an adequate factor analysis for 199181.
79 Absolute measures are counts or amounts and they represent the actual number of the variable within the census block group. 80 For a description of the aggregation of census blocks 1991 to 2001, see Annex 6: Aggregation block group 1991‐2001. 81 For a complete list of variables captured in the two censuses, see Annex 5: Variables census 1991 – 2001.
52
55
50
36
54
53
45
46
56
51
44 43
42
41
403938
37
444401
4402 4403 4404
4405 4 40 6 4407
4408
4409
44184417
44104412
4411
4414
44154 4 1 3
4416

131
6.2.2 Administrative data One of the disadvantages of census data is that the data are updated every 10 years. That is why administrative data can help to provide extra information during the inter‐census gap. However, the usefulness of census data is recognised, and a distinct advantage over administrative data is that the population census has “very reliable and very comprehensive data at a small area level” (Noble, 2000, p. 73).
The combination of census data and administrative data has already been used to develop local economic development indicators (Wong, 2002). Experience in the USA with neighbourhood indicator systems has also revealed the value of using administrative data (Accordino and Rugg, 2000). Confidentiality and the effort needed to integrate different data sources are other issues of concern (Accordino and Rugg, 2000). Other problems are related to the fact that every office might use different administrative areas.
In this research too, administrative data were not always readily available and accessibility could be restricted. The lack of continuity in the collection of the data might represent a problem if the monitoring of the phenomena has to be evaluated over time. This research proposes the use of two administrative data sources as an example of how administrative data can complement census data in Rosario. One represents the demand for housing solutions (Public Housing Service (SPV)) and the other represents neighbours’ complaints over the telephone (Oficina de Atención al Vecino (OAV)). In every case, it is important to detect whether the database uses a field containing an address, so that point data can be generated through geocoding using the street name and the house number. With geocoding, the addresses (street name + house number) are converted to specific point locations on a map. They can also be aggregated at block group or census tract level if need be. Geocoding and address matching are the GIS processes to generate map points from these data sources. The success of the geocoding can be assessed by the percentage of records that are matched. This of course will depend very much on the quality of the data and whether the street names have been correctly typed.
During the interviews in Rosario, it was possible to detect other potential administrative data sources but, for reasons of confidentiality or because of the lack of systematic distribution, they were not accessible. It is recommended that the municipality regulates the collection of data and implements metadata data facilities in this respect. In particular, the way the addresses are recorded influences the quality of the geocoding processes that are required to spatially georeference the data. Where confidentiality is a concern, it can be overcome by aggregating the data at census block group level.
The following data sources have potential for the future monitoring of inequality:
• Expressed income deprivation: database with the addresses of households
that receive unemployment benefits (Plan Jefas y Jefes de Hogar). For reasons of confidentiality, these data were not obtained.
• Under‐five mortality rate (per year and per neighbourhood area). This indicator could be elaborated by the Public Health Secretariat, which already collects data at the Vital Statistics Office (Bioestadística).

132
• Information on people receiving public assistance (food stamps, child help groups, etc.).
Census data and administrative data remain for Argentina the main sources of small‐area data. There is high potential in the use of block‐level census data. The obvious advantage of using data at such a level is the greater detail and the possibility of aggregating the data later on for other administrative or neighbourhood areas rather than the block groups. Unfortunately, for reasons of confidentiality, data at this level of aggregation are not available. In this respect, concern is expressed in the National Census Bureau publication (INDEC, 2001), although the absence of this level of detail has been justified in the previous censuses by disclosure restrictions (Law 17622). Either a new interpretation or a new law will be required to allow the release of data at block level.
The use of the postcode as an alternative areal unit has not been successfully implemented in Argentina. The introduction of the new eight‐digit postcode in 1999 has not generated extensive use of this element. Neither the Yellow Pages of the telephone companies (Telecom and Telefónica) nor the Census Bureau use the new postcode. The possibility of using data from the telephone directories remains limited. The two main telecommunications providers in Rosario (Telecom and Telefónica) publish the Yellow Pages and the telephone directories on CD‐ROM and on line on their internet pages. The street name and house number are the field provided to identify the geographical location of any given number. However, in this research a search for the location of Centros Crecer was unsuccessful. The effectiveness of these directories is poor; only one of the two directories gave the location of two of the 33 existing centres. The use of electoral roll data was analysed but data access remains an obstacle. Besides, the accuracy of the electoral roll and whether it is up to date is unknown. The electoral roll is based on registries and, although the population is supposed to advise of any change in domicile, this does not always occur in reality. In Argentina, there is no municipal population registry as such that updates the electoral rolls.
6.2.3 Derived and expressed need indicators One of the problems of constructing indicators at intra‐urban level is the lack of data other than census data – most research on spatial inequality is based on this source. Indicators from census data are good for measuring indirect need (or demand) but they cannot measure demand expressed by the population. This poses a problem: to find alternative sources that reflect need expressed by the population. Therefore, this research proposes to analyse inequalities obtained from both derived need (census and aggregated data) and expressed need (point data generated from administrative data). It also addresses the problem of ecological fallacy, usually faced when targeting unequal areas because the points of expressed need represent individual cases. The inequality analysis conducted with “traditional urban indicators”, or accessibility indicators and gap indicators, lacks the direct expression or demand from the population.
While studying the role of GIS in urban planning, Webster (1993) identified expressed demand as a component of descriptive analysis. Webster differentiates between imputed and expressed demand. Imputed demand (or derived demand) is evaluated indirectly by inference from locational information by means of demand

133
indicators. On the other hand, expressed demand is evaluated directly by recording the expressions of demand made by members of the public. In the case of housing needs, for example, needs can be evaluated indirectly by means of indicators or directly by recording the expressions of demand from citizens. The number of registered demands for good housing is also considered a good indicator of unsatisfied needs and may serve as an alternative indicator (Mega, 1995).
Figure 6.3 shows how derived and expressed need can be calculated and compared. Derived need can be calculated by mapping the location and the intensity of need measured with census data. On the other hand, expressed need can be calculated by mapping the locations of complaints about unsatisfied needs. Administrative data provided by the Public Housing Service (SPV) are used to measure expressed (housing) need. This database contains data on 12,926 cases of expressed demand for housing solutions reflecting the situation in 200182. The field selected for geocoding was the address of the person that voluntarily went to the SPV office and asked for a housing solution or expressed a housing problem. They can also be aggregated at block or census block group level. Thanks to this aggregation, it is possible to analyse the correlation with other GIS‐based indicators derived from census data.
Geocoding and address matching were the GIS processes used to map the expressed need, where the address provides the locational key of the need. The address matching capability of the ArcGIS geocoding tool (address locator) can generate point locations that represent events on a map containing (as in this case) a street network ready for geocoding. The map network has address ranges for the right and left sides of the streets assigned to the segments. ArcGIS reads the address from the event tabular data (the public housing service demand database) and estimates a map position. To know where most of the expressed need is coming from, the distribution of points of expressed need in areas with different levels of (derived) housing needs is calculated. To do so, a spatial join is performed in ArcGIS between the point map of expressed needs and the map of derived needs in order to find out in which area each point of expressed need is located. Later, the point map can be summarised by areas of different housing needs to obtain the total number of expressed needs per area of derived need. Finally, the distribution of cases of expressed need is also calculated as a ratio of the total number of inadequate houses along the areas with different levels of (derived) housing needs.
It was possible to geocode only 51% of the addresses of the SPV database. Such a low match was attributable to spelling mistakes in the street names and the use of abbreviations not recognised by the ArcGIS geocoding tool (address locator). After performing address scrubbing by correcting these mistakes and using a supervised rematch, it was possible to match 76% of the addresses. The remaining unmatched cases were due mainly to incomplete or inaccurate addresses, such as inexistent house numbers. These types of error do not differ from those reported elsewhere (Ratcliffe, 2004).
A similar procedure was followed to geocode administrative data provided by the Oficina de Atención al Vecino (OAV). This office keeps records of complaints made via the telephone or in the main municipality building. In this research, a database was 82 This year was chosen for comparability reasons: comparability with the census data of the same year.

134
taken with all the complaints for the year 2001 (17,283 cases). The resulting point map can show the locations of concern about the lack of a quality‐of‐life component, and also can be taken as an indicator of participation. Considering that most of the complaints are made by phone, and to avoid under‐representation of those without a phone line, it is suggested that the number of complaints be calculated as a ratio of the number of households with a phone line. As a coding system was used in the original database (e.g. C67550, instead of street names), 97% of the calls were matched. The calls per census block group were standardised according to the number of households with telephone lines.
Expressed income deprivation can also be analysed by geocoding the households that receive unemployment benefits (Plan Jefas y Jefes de Hogar). For reasons of confidentiality, these data were not provided.
Indicators derived from
census
Derived need Expressed need
Inequalities analysis (social justice/needs perspective)
Location and intensity of need Location of complaints of unsatisfied
needs
Measured by GIS-based indicators Measured by geocoding records of complaints or expressed need
Dat
a R
equi
rem
ents
Dat
a P
roce
ssin
g
Point maps SPV expressed housing needs
OAV expressed complains
Administrative data:(SPV housing records)
(OAV complaints records)
Streets network Rosario Street address
ranges
SPV housing demand per census block
group / households (Expressed need)
OAV complains per census block group /
households with phone (Participation proxy)
Census data (variables 1991/
2001)
Census block groups
Distribution of cases of expressed need over
areas with different levels of derived need.
Construction of indicators at census
block group levelGeocoding
Point on polygon / Spatial join
Aggregation at district and census block group
level
Summarise by housing needs
(inadequate housing indicator)
Map
Attribute table
GIS operation
Multiple maps
LegendConceptual input
Chart output Figure 6.3 Flowchart to calculate and compare derived need and expressed need

135
6.2.4 Accessibility indicators In Section 3.3, different accessibility measures were presented. Accessibility indicators measure access to the following social infrastructure:
• kindergartens and primary schools; • public health centres; • Centros Crecer (day‐care centres).
In the case of access to education facilities, kindergartens and primary schools are considered because they have a smaller catchment area83 than secondary or higher levels of education, and the lack of access to primary schools and kindergartens affects mostly poor neighbourhoods.
Figure 6.4 shows how accessibility indicators were constructed. Minimum distance (measured in metres) was chosen as the accessibility measure, first, because it can be easily communicated to policy makers and, secondly, because in the case of these facilities the externality effect is minimum (e.g. children go to schools within the neighbourhood). A distance table was created by calculating the distance from the centroids of the census block groups to the nearest social infrastructure represented in a point map. The resulting map enabled every census block group to be classified according to its accessibility indicators.
The accessibility indicators were further compared with the catchment or service area analysis of the social infrastructure. Accessibility was evaluated using a street network, and a walking time of 10 minutes84 to primary schools and kindergartens, while walking times of 10, 15 and 20 minutes to health centres and Centros Crecer were used in estimating a (ideal) service area. The street network was set with a travel cost of 3km/hour. The resulting catchment areas, overlaid with other indicators, can help policy makers in the allocation of new facilities. The service area analysis was performed within ArcView Network Analyst.
The concentration and provision of social infrastructure was also analysed per administrative area. Consequently, the “container view” approach was followed to measure the facilities per district and neighbourhood area (although in this case it should be noted that it was assumed that the social infrastructure had no externality effect). The use of accessibility indicators and other measures of accessibility provides valuable information to policy makers, not only because they can describe the current pattern of service provision but also because they can prescribe the location of new infrastructure in under‐serviced areas.
To complete the analysis, the correlation of the accessibility indicators with other indicators should be analysed, using the minimum distance accessibility measure indicator calculated per census block group. 83 In the case of primary schools and kindergartens, the externality effect is minimum (children go to schools within the neighbourhood). 84 This was considered taking into account the indications in Section 3.3. The upper limit for the elderly or for mothers with children is usually considered to be a walking distance of about 500 to 750 m.

136
Census block groups
Point map with location of social
infrastructure
Distance table
Calculation shortest distance between
census centroids and social infrastructure
Calculation census block
groups centroids
Point map of census block
groups centroids
Accessibility indicator per census block
group
Minimum distance
Point map with location of social
infrastructureStreet
network
Service area analysis
Set road network speed (3km/hour)Set travel cost in minutes
(10 minutes)
Social infrastructure
service area within 10 minutes walk
Assess relative accessibility between census block groups
Target areas outside social infrastructure catchments
(normative assessment 10 minutes walk)
Container view
Point map with location of social
infrastructure
Neighbourhood areas
Summarise amount of social infrastructure per neighbourhood /
administrative area
Rank of neighbourhood areas social infrastructure provision
per 10000 inhabitants
Social infrastructure provision per 10000
inhabitants per neighbourhood area
Assess social infrastructure provision per administrative
boundary
Correlation analysis with other indicators
Map
Attribute tableGIS operation
LegendConceptual input
Figure 6.4 Flowchart accessibility indicators construction
6.2.5 Factor analysis: socio-economic spatial differentiation
Section 3.2 described the usefulness of factor analysis in the study of patterns of inequality. Factor analysis is one of the preferred approaches for measuring urban socio‐economic spatial differentiation (Knox and Pinch, 2000). Typically, a socio‐economic status factor can be identified after the extraction. Another reason for the use of factor analysis in this research was to find an alternative to the lack of income data.
Socio‐economic status, family status and ethnic status appeared as the three general factors of differentiation in factorial ecologies of North American cities (Pacione,

137
2001). In the developed world in general, residential differentiation is dominated by the socio‐economic status dimension85 (Rees, 1979, in Knox and Pinch, 2000)
Although there is no tradition of similar studies in Latin American cities, several studies in Spanish cities show socio‐economic status as the predominant factor (Rodriguez‐Jaume, 2000). This suggests that socio‐economic status might also emerge in Rosario. In this respect, it is most likely that there will be a positive correlation between variables such as university education level and employment, and lifestyle variables such as ownership of cell phones or PCs with internet connection.
This exploratory, inductive approach was also chosen to compare the inequality indicators (selected after the interviews and the literature review) with the factors obtained through factor analysis and to identify common patterns within the (census) data. Each factor groups variables with similar patterns of variation. There are different types of factor analysis methods of extraction but principal component analysis was used since it is usually recommended for exploratory purposes (SPSS, 1999).
Figure 6.5 indicates the steps used to extract the socio‐economic status factor. First, to generate the factors, an extended set of variables obtained from the 2001 census was analysed. A further selection of variables was made by discarding those that had low communality and those that generated a “closed system” (e.g. households with cell phone and households without cell phone).
Figure 6.5 Extraction of socio‐economic factor ‐ income indicator proxy
85 Followed by family status or life‐cycle characteristics, and then by ethnic status or segregation.

138
A list of 57 variables was finally included to extract four factors86, using principal components and a rotated (orthogonal, Varimax) solution (which means that the factors do not correlate with each other but optimally with the common variance in the original variables). The socio‐economic factor and the total of four components retained took into account 72% of the variance. Table 6.2 shows the variables with the highest loadings in the socio‐economic component.
Table 6.2 Variables with the highest loadings in the socio‐economic component (from rotated component matrix)
Variables Loadings
% Owns freezer .874
% Owns microwave .871
% Owns PC with internet .864
% Owns cell phone .841
% Owns VHS .837
% Owns automatic washing machine .832
% Went to university .783
% Owns PC .746
% Employed .720
% Went to tertiary level of education .719
% Owns cable TV .658
% Has health insurance/coverage .654
% Goes to private school .648
% Job position: boss .631
% House quality material 1 .630
% Owns telephone .610
6.2.6 Cluster analysis: identifying homogeneous areas Whereas in factor analysis it is possible to identify how different variables cluster or group together, in cluster analysis it is possible to identify clusters of block groups with similar characteristics.
Cluster analysis is generally used in the field of geodemographics to classify neighbourhoods according to dwelling, household and socio‐economic characteristics (Webber, 1998). Although it has a much extended use for commercial and marketing purposes, there are also examples of using neighbourhood profiles in socially related issues (Brown et al., 1991; Brown et al., 2000).
This research suggests using it to target clusters of deprived neighbourhoods and to help policy makers by giving a “profile” of the worst‐off areas. There is no commercial database that provides clusters/lifestyle segmentation available at the moment in Argentina. Consequently, it is proposed to use the K‐cluster method as in 86 Although the factor extraction method of principal components generates a “component matrix”, it is common to call the components factors (SPSS, 1999).

139
SPSS 12, which identifies homogeneous groups of cases (block groups)87. The use of approximately eight clusters allowed different neighbourhood groups with areas of similar size to the neighbourhood (administrative) areas to be distinguished.
The relationship between geodemographics and indices of multiple deprivation is noted by Brown (1991, p. 223‐224) since they “represent attempts to capture the multidimensional nature of these phenomena”. He also mentions the major criticism of these composite measures and indices in the arbitrary selection of the indicators and weights. However, further on he warns that an approach based on single variables fails to reflect complexities.
6.2.7 Index of inequalities: measuring concentration of inequality aspects The advantage of a set of separate indicators is that they are easier to communicate to policy makers than complex indices that are not transparent to them (Bergström, 1997). A related criticism is made by Smith: “Many individual indicators are highly correlated with one another, and although composite indicators can overcome problems of data overlaps and redundancy, the statistical techniques required are incomprehensible to most politicians and ordinary people (and to not a few academics), which tends to obscure the meaning of the results” (Smith, 1994, p. 142).
As explained before (see Section 3.2), criticism also arises because composite indicators are considered too reductionist to translate a complex reality, and choices of weights are not always clear. There is also the question of whether they are meaningful to the users, such as policy makers and urban planners ‒ a criticism made by some interviewees (Chapter 5). However, it is still necessary to generate a composite indicator that reflects in one figure the whole complexity of spatial inequality. Therefore, and in spite of the above criticism, this research proposes the construction of an index of inequalities to show how policy makers can identify the concentration of inequality aspects.
In every composite indicator, it is necessary to explicitly indicate the importance that each component has in the overall measure. The measure of importance is then given by weights. Here it is suggested to start by assigning equal weight (50%) to the condition/quality of life and the distribution of opportunities/accessibility axes (see Table 6.3). Within the first one, physical environment and socio‐economic environment receive the same weight. In the second one, the ICT domain (access to internet) receives less weight (10%) because of the low importance assigned to this aspect of inequality by the policy makers. This approach takes into account that in the interviews all the other aspects, with the exception of ICT, were considered important or very important. Another approach would have been to give overcrowding a higher weight since it was highly prioritised by the policy makers.
It should be noted that, in practice, the weighting should be determined by a consultation procedure among policy makers and reflect a consensus on this issue, or it should be determined by policy relevance. For example, if a particular policy has to invest in training facilities for unemployed adults, both education level and unemployment should get higher weights.
87 Four block groups were excluded from the analysis because of almost non‐existent population and to avoid their distortion of the results by appearing as separate clusters.

140
To construct the inequality index, every separate indicator is standardised (max‐min standardisation method88) and the weighted summation method of multicriteria analysis is performed.
Table 6.3 Weight assignments for inequality aspects
A bivariate correlation matrix is calculated to identify the correlation between the indicators and the inequality index. The interpretation of the resulting matrix might help to explain some of the aspects that have most influence on the intra‐urban inequality.
88 The values from the different indicators can only be compared if the measurement units are the same. Therefore, with the standardisation procedure the measurement units are made uniform (Janssen et al., 2000). The different inequality indicators were standardised following the max‐min (interval) method. If they have a benefit effect, where a higher value means a benefit (e.g. education level), the formula used was (value‐lowest value) / (highest value‐lowest value). For cost effects (e.g. unemployment), the formula used was (value‐lowest value)/ (highest value‐lowest value) +1. With this standardisation method, the values are normalised with a linear function between absolute lowest score and the highest score. If the indicator is measured as a benefit effect, the absolute highest score is indicated with a 1, and the absolute lowest with a 0. For indicators with cost effect, it is the other way round.
Cost / benefit
Weight level 1
Weight level 2
Weight level 3
Conditions / Quality of Life 0.5
Physical environment 0.5
Overcrowding Cost 0.333
Inadequate housing Cost 0.333
Expressed housing deprivation Cost 0.333
Socio–economic environment 0.5
Education level Benefit 0.333
Unemployment Cost 0.333
Health coverage Benefit 0.333
Distribution of Opportunities / Acc. 0.5
Physical infrastructure 0.45
Tap water in the dwelling Benefit 0.500
Sewage connections Benefit 0.500
Social infrastructure 0.45
Primary schools and kindergartens Cost 0.333
Primary health Cost 0.333
Centros Crecer Cost 0.333
ICT infrastructure 0.10
Internet Benefit 1.000

141
6.3 Interpretation and use of indicators As a descriptive response, this methodology proposes the use of the indicator matrix to systematically monitor the most relevant aspects of intra‐urban inequalities and describe the related problems89. Together with gaps, dynamic indicators can show trends and the change in the phenomena between 1991 and 2001.
Finally, as a prescriptive response, this methodology proposes an approach to incorporate a geographical component into municipal budget allocation and target need areas. Therefore, policy makers should be able to know what to address first, and where, and how much – or the proportion – to invest to compensate for, and reduce, inequalities90.
The following subsections describe how these indicators can be used and be communicated at different levels of aggregation.
6.3.1 Data aggregation level, city, district and neighbourhood areas Bearing in mind that indicators should be related to policy actions, it is important to see how inequality is depicted at a level of aggregation coincident with the area of policy intervention. In many cities, this is the case with the municipality districts. Policy makers might prefer to act at district level, where neighbourhood participation activities also take place. In the case of Rosario, every district is subdivided by the municipality into six or seven areas barriales or neighbourhood areas. Moreover, this is the minimum scale of policy application mentioned by policy makers (subsection 5.6.2). To provide policy makers with an option for ranking these areas, it is proposed that the indicators constructed at block group level be aggregated and summarised within ArcGIS into neighbourhood areas, and ranked from worst‐off to best‐off. In the summarisation process, the maximum and minimum values and standard deviation of the block groups are also retained. To rank the neighbourhood areas, either the percentage or the total of affected population/households can be considered.
As seen in Section 2.4, the influence of the areal unit definition in the description of inequalities is highly relevant because of the scale factor. Previous research on segregation that involved comparative studies between European cities (Kruythoff, 1998) shows how the areal analysis unit (e.g. municipality, district, and neighbourhood) and the average population per unit influence appreciation of the phenomenon. As can be expected, spatial differences might be smaller in larger areal units of analysis. Initiatives to gather indicators at neighbourhood level are taking place and they reveal that differences within the city are so marked that averaging social indicators at district level leads to wrong diagnoses and policy allocation mistakes (Kingsley, 1999). Hence, using indicators at higher levels of aggregation can be misleading if this problem is not considered. In this research, it is suggested the internal variation within the neighbourhood area should be analysed by comparing the minimum and maximum value and the standard deviation.
89 A detailed description of every indicator and its interpretation is given in Annex 3: Operational definitions of indicators. 90 An illustration of this prescriptive use of GIS‐based indicators is given in the following chapter in Section 7.5.

142
6.3.2 Gap analysis Since this research follows an inequality perspective showing the progress in narrowing inequalities, it is proposed to measure gaps between different areas of the city. If the indicators of the best‐off block group and the worst‐off block group and between the best 10% and worst 10% are compared, it is possible to appreciate the gaps between them. The resulting table can help policy makers in understanding the gaps between these extreme groups.
In the context of compensatory policies and the application of indicators at a prescriptive level, it is very important to communicate the gaps between different administrative areas: city, districts and neighbourhood areas. The indicator of overcrowding will be a good example to demonstrate how intra‐urban indicators can clearly expose inequality. There are many reasons for choosing overcrowding. First, policy makers value overcrowding as the most important aspect of inequalities and the majority of them agree that it is possible to improve the situation through the local government (Chapter 5). Secondly, overcrowding appears to be highly correlated with other indicators such as health, education level and unemployment.
6.3.3 Dynamic indicators: monitoring spatial inequality This research proposes to compare the gap between each district and the city level, as well as the intra‐district gap, which is the gap between the best‐off and the worst‐off neighbourhood. Finally, if there was an improvement between the years 1991 and 2001, it will also be indicated at city and district levels. Here it is proposed that this multilevel approach will show the influence of scale in the appreciation of the problem. As discussed in Section 2.4, the spatial dimension of inequality is highly relevant, since the scale adopted will to a large extent define the problem itself, as the degree of inequality observed will be very much a function of scale (Smith, 1994).
In this methodology, temporal comparisons between the years 1991 and 2001 are also performed to monitor the trends in improving quality of life and reducing inequalities between neighbourhood areas. The Davidson model is followed, as shown in Figure 6.6 (1976, in Broadway and Jesty, 1998).
Figure 6.6 Outcome regions for change in spatial inequalities (Davidson, 1976, in Broadway and Jesty, 1998)

143
Three possible outcomes can be expected from the analysis:
• divergence: an increase in the inequalities (gaps are growing); • convergence: a decrease in the inequalities (gaps are being reduced); • maintenance of the status quo: no change (gaps remain).
It can be expected that, because of the perceived increase in inequalities in the 1990s by policy makers, this will be particularly reflected in unemployment and overcrowding indicators and in the periphery. The variation in every indicator between 1991 and 2001 is also calculated as the difference between the two values and analysed within the aggregated census blocks (polygon areas).
As indicated in Chapter 4, in 1995 the Municipality of Rosario started a decentralisation process that led to the creation of six districts and later in 2003 to 38 neighbourhood areas. The local government stated the importance of comparing different geographical areas “to adjust equity criteria in the assignment of resources”. Like many other local governments around the world, they are recognising the importance of having good information to support policy making. In the next chapter, it is shown how the use of GIS‐based indicators proves valuable in detecting need areas and communicating detailed geographical patterns of inequality. Here it is suggested that there is a good opportunity to integrate GIS into policy making via indicators linked to real problems and policy goals (in this case, “to adjust equity criteria in the assignment of resources” or to target need areas).
6.4 Conclusions The approach chosen to monitor intra‐urban inequalities with GIS‐based indicators consists of a methodology that takes into consideration policy makers in the selection of indicators and scale issues in the monitoring of gaps. In this respect, the use of methods that can easily be communicated to policy makers (and thus likely to be applied by them) was a selection criterion. A selection of indicators based exclusively on literature on social and inequality issues would have lacked validity and so hindered the possibility of policy makers applying the methods. Not to contemplate scale issues at the moment of calculating gaps would have ignored the spatial characteristics of inequality.
The use of GIS was clearly an advantage at the time of constructing the indicators, when visualising the change in gaps between the two years and, as usually happens, combining different data sources.
The prescriptive application of this methodology relies on the detection of problem areas, which should be prioritised, the ranking of neighbourhood areas, and the consequent budget allocation.
The following chapter applies the proposed matrix of indicators to the city of Rosario, and the consequent descriptive and prescriptive responses in terms of inequality description and monitoring, and budget allocation.


145
Chapter 7 Describing, analysing, and compensating for intra-urban inequalities
This chapter addresses the fourth research question. It applies the proposed matrix of GIS‐based indicators and the methodology explained in the previous chapter. It describes the main characteristics of intra‐urban inequalities in the city of Rosario and their changes between 1991 and 2001. It begins with the indicator matrix describing the main characteristics of spatial inequality in different domains at city and district levels. After that, it moves to a micro level to analyse with the use of GIS‐based indicators the intra‐urban inequalities, the relations between their different aspects, the gap between the best‐off and worst‐off areas and their change over time. Finally, within a prescriptive approach to compensate for these disparities, it proposes how to incorporate indicators in the budget allocation.
7.1 Describing and analysing intra-urban inequalities with GIS-based indicators As conceptualised in Chapter 2, social justice is concerned with the question of who gets what where and how. This is directly related to the use of GIS‐based indicators as a descriptive input for addressing the inequality problem. This section describes in detail the characteristics of spatial inequalities in their different domains, using the matrix of GIS‐based indicators proposed in Chapter 691.
As mentioned in subsection 6.3.1, it is obvious that problem areas and contrasts that appear when moving into lower levels of aggregation, such as district or neighbourhood area, will be hidden if any indicator is analysed at city level. The results presented in Table 7.1 indicate that as soon as intra‐urban inequalities are analysed by comparing the six districts, the pattern of inequalities starts to emerge: a well‐off city centre (in district Centro) as against a deprived periphery. It is noticeable that, if the districts are ranked from best‐off to worst‐off, the order remains almost the same for every indicator except those related to the social infrastructure domain. With the exception of accessibility to primary schools, this indicates that the provision of social infrastructure favours the worst‐off districts. This can be related to the fact that facilities such as the Crecer day‐care centres are specifically targeted at deprived groups.
91 Unless otherwise stated, tables and figures have been elaborated based on 1991 and 2001 census data provided by INDEC (National Institute of Statistics and Censuses ‐ Argentina). Expressed housing deprivation is based on data provided by SPV (Servicio Público de la Vivienda), Municipality of Rosario, Rosario, Argentina.
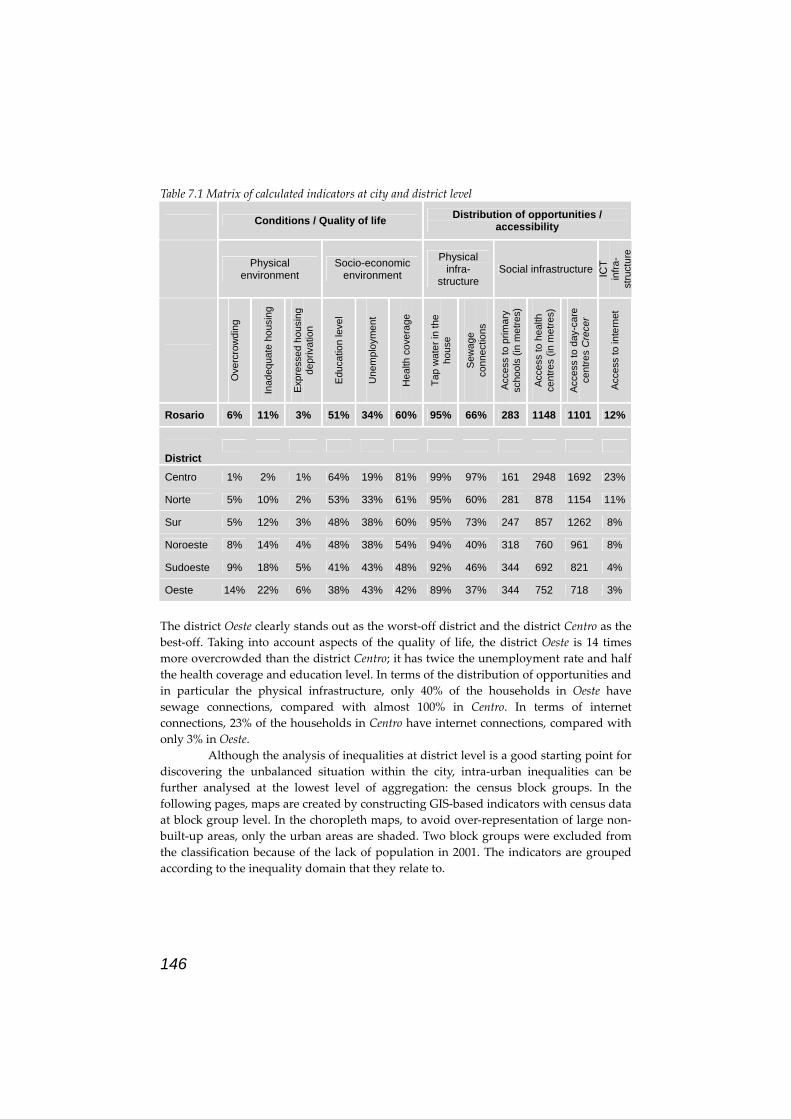
146
Table 7.1 Matrix of calculated indicators at city and district level
Conditions / Quality of life Distribution of opportunities / accessibility
Physical environment
Socio-economic environment
Physical infra-
structure Social infrastructure IC
T in
fra-
stru
ctur
e
Ove
rcro
wdi
ng
Inad
equa
te h
ousi
ng
Expr
esse
d ho
usin
g de
priv
atio
n
Educ
atio
n le
vel
Une
mpl
oym
ent
Hea
lth c
over
age
Tap
wat
er in
the
hous
e
Sew
age
conn
ectio
ns
Acce
ss to
prim
ary
scho
ols
(in m
etre
s)
Acce
ss to
hea
lth
cent
res
(in m
etre
s)
Acce
ss to
day
-car
e ce
ntre
s C
rece
r
Acce
ss to
inte
rnet
Rosario 6% 11% 3% 51% 34% 60% 95% 66% 283 1148 1101 12%
District
Centro 1% 2% 1% 64% 19% 81% 99% 97% 161 2948 1692 23%
Norte 5% 10% 2% 53% 33% 61% 95% 60% 281 878 1154 11%
Sur 5% 12% 3% 48% 38% 60% 95% 73% 247 857 1262 8%
Noroeste 8% 14% 4% 48% 38% 54% 94% 40% 318 760 961 8%
Sudoeste 9% 18% 5% 41% 43% 48% 92% 46% 344 692 821 4%
Oeste 14% 22% 6% 38% 43% 42% 89% 37% 344 752 718 3%
The district Oeste clearly stands out as the worst‐off district and the district Centro as the best‐off. Taking into account aspects of the quality of life, the district Oeste is 14 times more overcrowded than the district Centro; it has twice the unemployment rate and half the health coverage and education level. In terms of the distribution of opportunities and in particular the physical infrastructure, only 40% of the households in Oeste have sewage connections, compared with almost 100% in Centro. In terms of internet connections, 23% of the households in Centro have internet connections, compared with only 3% in Oeste.
Although the analysis of inequalities at district level is a good starting point for discovering the unbalanced situation within the city, intra‐urban inequalities can be further analysed at the lowest level of aggregation: the census block groups. In the following pages, maps are created by constructing GIS‐based indicators with census data at block group level. In the choropleth maps, to avoid over‐representation of large non‐built‐up areas, only the urban areas are shaded. Two block groups were excluded from the classification because of the lack of population in 2001. The indicators are grouped according to the inequality domain that they relate to.

147
7.1.1 Inequality conditions / quality of life The analysis of the quality‐of‐life conditions in Rosario indicates a spatial patterning of inequality with a concentration of needs in certain areas. The best‐off areas are shown in white and the worst‐off areas in dark blue. This concentration of needs seems to be repeated independent of the domain that is considered.
The indicators relating to the physical environment domain show how unequal the quality of life in Rosario is. While on average 6% of households suffer from overcrowding, some areas in the city centre have 0% overcrowding and the worst‐off in the periphery reach levels of up to 49% (see Figure 7.1). Overcrowding reflects how unsuitable a dwelling can be in terms of number of rooms and the mismatch between household size and the number of rooms. It represents a critical level of housing need. Among policy makers in Rosario, overcrowding was considered the most relevant: 75% of the interviewees regarded it as a very important aspect of inequality. It should also be noted that overcrowding, with an average of 1.25, was of all the listed aspects considered the most important by the majority of the interviewees. Of the first five ranked aspects, only overcrowding and accessibility to schools had more than 50% of the interviewees agreeing that they could influence them locally. Overcrowding is an aspect that reflects not only a dwelling problem (lack of enough rooms) but also certain household characteristics. As one policy maker explained, overcrowding in slum areas is very high; there are families with many children, and some of them are already parents at a young age. They usually do not leave the parental home but simply stay in the same house or add another room to it.
Figure 7.1 Quality of life – physical environment: overcrowding

148
Another indication of the housing needs suffered by households is the unsuitable type of dwelling (Figure 7.2). As indicated earlier, housing needs can also be evaluated according to expressions of need from citizens as the percentage of households that claim to live in an inadequate house. The advantage of GIS tools in constructing this indicator and the use of administrative data are explained in further detail in subsection 7.1.3.
Figure 7.2 Quality of life – physical environment: inadequate housing
Children living in an overcrowded or inadequate house might be hampered in their education through the lack of adequate space for study. At the same time, a person “trapped” in a deprived neighbourhood or in a villa miseria (slum) might have to cope with the stigma of living in an “unwanted” area and be discriminated against in job applications just because of his/her address. These assumptions have a correlation in space, and the results in this research indicate that the worst‐off areas in terms of physical environment and the worst‐off areas in terms of socio‐economic environment are almost the same (see Figure 7.1 to Figure 7.4). This visual interpretation from the maps is verified by the statistical correlation between the indicators92.
92 See Annex 7: Correlation between indicators.

149
In Chapter 5, according to the policy makers interviewed in Rosario, education was on average the most relevant aspect related to the household and its members, and 70% of them evaluated it as a very important aspect to consider. Education is usually taken into account in the policy goals to reduce inequalities or to cut the tradition/cycle of poverty in some families. Education level is also linked with the capacity to get a job and then have an adequate income to satisfy other needs such as housing, and this also justifies the importance of education.
Although the level of (formal) education cannot be directly influenced in Rosario, it is very useful for policy makers to detect the areas with lower education levels and target them with informal education and skills improvement and training activities. In this case, the indicator “level of education” reflects the percentage of adults that had attended a secondary school. The lowest percentage in this respect is concentrated in the periphery (Figure 7.3). A low percentage of adult population with secondary school education indicates a group of high vulnerability, since urban deprivation is most common among the unskilled (Langlois and Kitchen, 2001). It might also reflect the incapacity of households to obtain sufficient income for adequate living standards.
Policy makers in Rosario have stressed the importance of health in the aspects of inequality. This research proposes the calculation of a health coverage indicator based on the percentage of households with health insurance. The health condition of households without health insurance is more vulnerable and disadvantaged compared with that of households that do have health insurance (Figure 7.3). As mentioned in the interviews, because of low levels of education some families are unaware, for example, of the importance of vaccinating their children. Health is also related to physical characteristics such as housing conditions and the water and sewage connections.
Just as education can lead to better employability and increase the chance of a better income, so too is health one of the aspects that affect employability. Furthermore, the relation between health and employment is even more important when the consequences of unemployment in terms of other non‐monetary aspects of inequality and social exclusion are considered, such as lack of links with mainstream society, of self‐esteem, of aspirations, etc. As explained in subsection 2.1.8, the unemployed are socially excluded because they are deprived of access to income. Therefore, unemployment is a good proxy for measuring social cohesion, which was an aspect of inequality mentioned by some policy makers in Rosario (Chapter 5). Having said that, it does not measure whether the unemployed are excluded from non‐monetary aspects such as links with mainstream society or whether they are culturally excluded.

150
Figure 7.3 A‐B Quality of life – socio‐economic environment A: education level, B: health coverage

151
Figure 7.4 Quality of life – socio‐economic environment: unemployment
Unemployment rates can be extremely high in certain areas of Rosario, for example, in the districts Oeste and Sudoeste, where the unemployment rate in 2001 was around 43% (Figure 7.4). These high unemployment rates, representing high‐income deprivation, deepen the multiple deprivations of the worst‐off areas.
To calculate the unemployment indicators, two strategies are followed. In the first case, it is calculated as the percentage of unemployed within the adult population of working age (14 to 65 years old). In the second case, the unemployment ratio is calculated in the way suggested by INDEC and the International Labour Organization (ILO) (INDEC, 1997). The unemployment rate is then calculated as the ratio between the total unemployed and the labour force. The labour force equals the sum of the employed and the unemployed. Following the ILO definition, the inequality in employment is notorious ‒ ranging from 8% unemployed labour force in the best‐off block groups of the district Centro to 74% in the worst‐off block groups of the periphery. The extremely high unemployment rates are found in slum areas, where the unemployment can be up to twice the Rosario average. However, the extended high unemployment rates in other areas of the city reflect the economic decline in middle‐class neighbourhoods in the 1990s (Prevot Schapira, 2002).
However unemployment is measured, the relative inequality between the block groups remains the same.

152
7.1.2 Distribution of opportunities / accessibility The previous subsection demonstrates the pattern of inequality in the quality of life in Rosario. Here the question is whether the distribution of opportunities and the accessibility to social infrastructure accentuate those inequalities or, on the contrary, compensate for the disparities.
Figure 7.5 Distribution of opportunities, accessibility – physical infrastructure: tap water in the dwelling
On average, all the districts in Rosario have a high percentage of households with tap water inside the dwelling (Figure 7.5). Access to safe water represents the capacity of the household to fulfil one of the basic human needs, which is also closely related to health conditions. It is at the census block group level that this map reveals areas where a high percentage of the population is unable to fulfil this need. These are mostly slum areas. This confirms the concerns of the UN, which includes access to safe water as a key dimension to improving the lives of at least 100 million slum dwellers by 2020 (UN‐HABITAT, 2003a).
The case of the sewage network provides a clear example of the limitations of local governments in levelling disparities when the provision of a public service is carried out by a private company. When the water and sewage network was privatised in 1995, the plan was to provide the whole city with sewage connections within 10 years. With one year to go, however, almost one third of the households still do not have sewage connections. This is a reflection of the continuous conflict between the local and provincial government with the operator Suez Lyonnaise des Eaux (La Capital, 2004).
The lack of sewage network in certain areas of the city (Figure 7.6) represents a big problem for those already suffering from other deprivations. The tremendous effect

153
on the health of the population was referred to in the interviews, and it is frequently highlighted in the local press. A recent report prepared by the Red Cross revealed that 89% of a group of 900 hundred children surveyed in a neighbourhood of the district Noroeste suffered from respiratory diseases as well as from other complaints such as intestinal parasites and hepatitis A (Veiga, 2004).
Figure 7.6 Distribution of opportunities, accessibility – physical infrastructure: sewage connections
The municipal director of epidemiology considers these problems could be reduced if there were sewage connections (Veiga, 2004). Most parents of the children studied in the above report work as cartoneros, and hence they are in contact with garbage. The problem of cholera and hepatitis A is not exclusive to the district Noroeste; it is also common in other neighbourhoods without sewage, as reported by the local government (La Capital, 2004). Because of its relation to health and environment, inadequate sanitation also has negative implications for economic development (UN‐HABITAT, 2003a). Its relevance is confirmed by its inclusion as a key dimension in one of the targets of the UN Millennium Development Goals (UN‐HABITAT, 2003a). In some worst‐off areas, the lack of sewage network can be accompanied by an additional problem: the lack of tap water in the house.

154
One of the indicators that most reflects the gap between the worst‐off areas and the best‐off areas is access to internet, which is a consequence of the disparities in the socio‐economic level of the population. In this respect, Alberdi in the district Norte, Fisherton in the district Noroeste, and the riverfront in the district Centro have block groups where between 30% and 60% of the households have an internet connection, compared with less than 5% in the worst‐off areas (Figure 7.7). This indicator shows the lack of, and disparities in, access to ICT. Although it is not an indicator highly prioritised by policy makers, it points to future implications in the quality of life of individuals. Besides, it is agreed that technological diffusion is selective (Castells, 1996), and hence it is an aspect of inequality.
Figure 7.7 Distribution of opportunities, accessibility – ICT infrastructure: households with internet
The distribution of social infrastructure that is administered locally seems to reflect a decision to compensate for inequalities and favour the most disadvantaged areas. This is particularly so in the case of primary health and day‐care centres. Households that are further away from primary care facilities might have to travel to other areas of the city, and might delay treatment or fail to consult the doctor if they do not have the money to pay for public transport.
It should be noted that in the city centre, while there is no presence of (public) primary health centres, there is a significant presence of private clinics and doctors. Over the last decade, however, part of the middle class has been unable to pay for health insurance because of the economic crisis. As shown later in Section 7.4, the reduction in

155
health coverage (in terms of health insurance) in some areas of the city centre indicates that the opening of primary health centres might be needed in the district Centro.
Figure 7.8 Distribution of opportunities, accessibility – social infrastructure: primary health centres
Figure 7.9 Distribution of opportunities, accessibility – social infrastructure: day‐care centres (Centros Crecer)

156
The distribution of day‐care centres clearly favours worst‐off areas (Figure 7.9). As seen in subsection 4.3.5, because of their important role in providing social assistance, physical accessibility to these Centros Crecer represents an opportunity for households to obtain education, adult training and day‐care facilities. Therefore, working mothers have more opportunities if they are near to a day‐care facility.
Accessibility to primary schools is more or less uniform along the periphery but there is a clear concentration in the district Centro favouring best‐off areas (Figure 7.10). The average accessibility in Centro is 161 m, against an average accessibility of more than 300 m in the worst‐off district. The high concentration of primary schools in this district could have been explained by a higher population density; however, as the container approach shows, the number of schools standardised per 10,000 inhabitants is also higher in this district (Figure 7.11).
Figure 7.10 Distribution of opportunities, accessibility – social infrastructure: education (primary schools and kindergartens)
The physical accessibility to primary schools and kindergartens represents the opportunity to obtain education. Deprivation of that opportunity limits the life chances of those affected by this form of disadvantage (Pacione, 2001). The same author suggests that, apart from the educational benefits, those in proximity to schools can benefit from after‐school activities. This is particularly the case in Rosario, where the main meal of poor children is obtained at school. However, proximity to a primary school does not necessarily guarantee that the children in the area actually go to school. The problem of dropouts is not reflected by this indicator, and it is apparently difficult to trace. In the interviews in Rosario, it was suggested that, owing to the unemployment of their

157
parents, many children did not go to school but went out to work (most probably in the streets as garbage collectors, door openers, etc.).
The minimum distance approach was used to calculate the accessibility indicators (access to kindergartens and primary schools, health centres and day‐care centres Figure 7.8 to Figure 7.10). This approach is particularly useful for calculating an accessibility index for each census block group, describing accessibility inequalities, and then comparing the correlation with other indicators. Another approach that is also suitable at the prescriptive stage is the container approach, which can help to detect a concentration of social infrastructure in certain areas of the city. This is the number of social facilities per administrative area standardised by the number of inhabitants. This perspective reveals a high concentration of primary schools and kindergartens throughout the best‐off areas.
Figure 7.11 Concentration of social infrastructure: schools. Social infrastructure per 10,000 inhabitants at neighbourhood area level (container approach)
The accessibility indicators are further compared with the catchment or service area analysis of the social infrastructure. In Rosario, large sectors of the population do not have private transport, so then the actual distance from the primary social infrastructure is particularly critical. Taking a (walking) travel cost for the street network of 3km/hour, a person will be able to cover 500 m in 10 minutes. For primary schools and kindergartens, the optimal catchment considered was 10 minutes, and for the other two social infrastructures the upper limit was increased to 20 minutes (1,000 m).
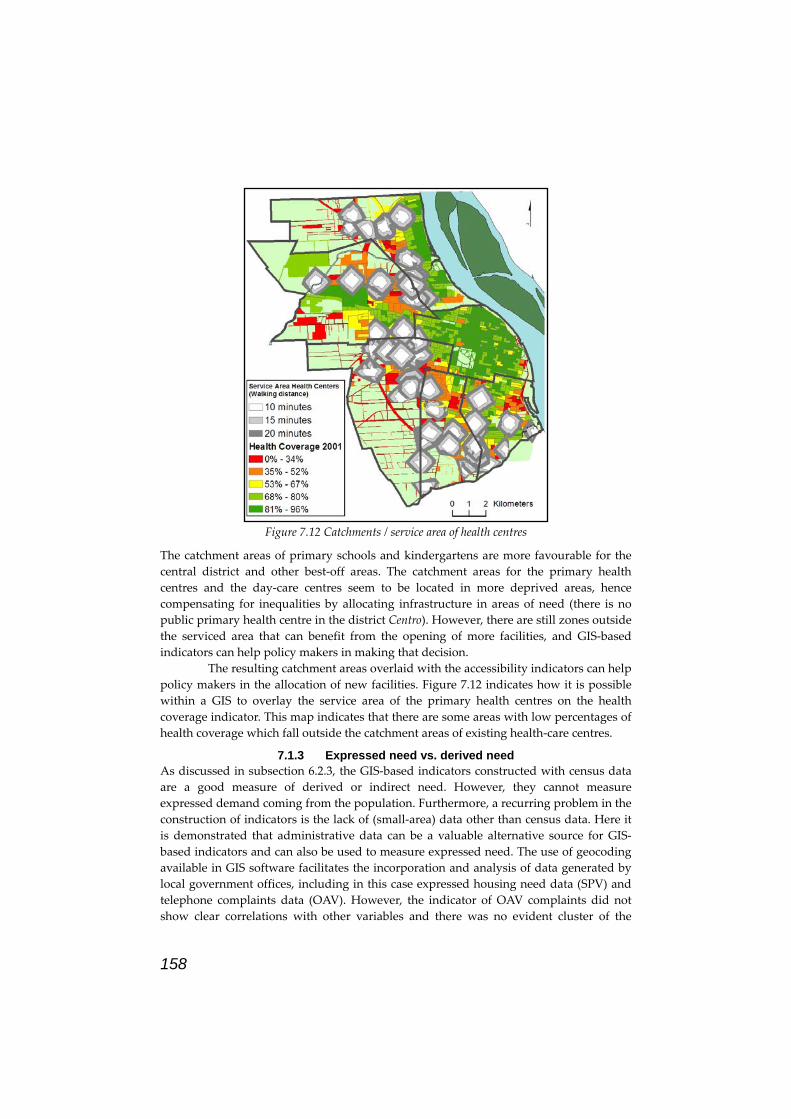
158
Figure 7.12 Catchments / service area of health centres
The catchment areas of primary schools and kindergartens are more favourable for the central district and other best‐off areas. The catchment areas for the primary health centres and the day‐care centres seem to be located in more deprived areas, hence compensating for inequalities by allocating infrastructure in areas of need (there is no public primary health centre in the district Centro). However, there are still zones outside the serviced area that can benefit from the opening of more facilities, and GIS‐based indicators can help policy makers in making that decision.
The resulting catchment areas overlaid with the accessibility indicators can help policy makers in the allocation of new facilities. Figure 7.12 indicates how it is possible within a GIS to overlay the service area of the primary health centres on the health coverage indicator. This map indicates that there are some areas with low percentages of health coverage which fall outside the catchment areas of existing health‐care centres.
7.1.3 Expressed need vs. derived need As discussed in subsection 6.2.3, the GIS‐based indicators constructed with census data are a good measure of derived or indirect need. However, they cannot measure expressed demand coming from the population. Furthermore, a recurring problem in the construction of indicators is the lack of (small‐area) data other than census data. Here it is demonstrated that administrative data can be a valuable alternative source for GIS‐based indicators and can also be used to measure expressed need. The use of geocoding available in GIS software facilitates the incorporation and analysis of data generated by local government offices, including in this case expressed housing need data (SPV) and telephone complaints data (OAV). However, the indicator of OAV complaints did not show clear correlations with other variables and there was no evident cluster of the
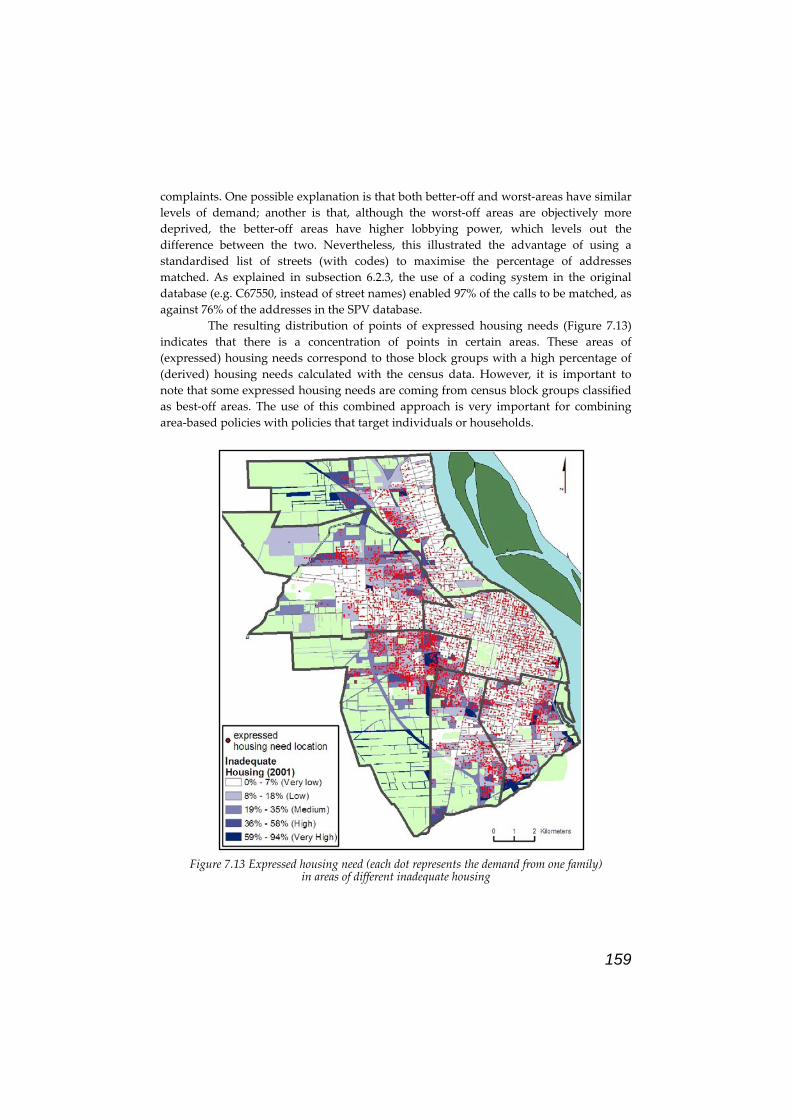
159
complaints. One possible explanation is that both better‐off and worst‐areas have similar levels of demand; another is that, although the worst‐off areas are objectively more deprived, the better‐off areas have higher lobbying power, which levels out the difference between the two. Nevertheless, this illustrated the advantage of using a standardised list of streets (with codes) to maximise the percentage of addresses matched. As explained in subsection 6.2.3, the use of a coding system in the original database (e.g. C67550, instead of street names) enabled 97% of the calls to be matched, as against 76% of the addresses in the SPV database.
The resulting distribution of points of expressed housing needs (Figure 7.13) indicates that there is a concentration of points in certain areas. These areas of (expressed) housing needs correspond to those block groups with a high percentage of (derived) housing needs calculated with the census data. However, it is important to note that some expressed housing needs are coming from census block groups classified as best‐off areas. The use of this combined approach is very important for combining area‐based policies with policies that target individuals or households.
Figure 7.13 Expressed housing need (each dot represents the demand from one family) in areas of different inadequate housing

160
The set of points representing the expressed demand locations was tested in order to see whether there were clustered areas of need. The resulting tests indicated a tendency towards clustering93. But what could be causing this pattern? And where is this need coming from? A moderate significant correlation was found between the expressed housing needs indicator and the following indicators: health coverage (‐0.619), education level (‐0.622), overcrowding (+0.597) and unemployment (+0.576). This might indicate that there is a concentration of expressed housing needs in areas with low education, low health coverage, and high unemployment and overcrowding. Besides, a negative correlation with the socio‐economic factor (‐0.555) indicates that the need is concentrated in areas characterised by lower socio‐economic groups. The correlation with derived housing needs (inadequate house indicator) was moderate (+0.544).
As explained in subsection 6.2.3, the distribution of points of expressed needs was also calculated in five areas classified94 according to different levels of derived housing needs (inadequate housing indicator). The results indicate that in both absolute values and relative values most of the demand is coming from block groups classified as having low or very low housing needs by the inadequate housing indicator95. Therefore, there is a high demand coming from better‐off areas (Figure 7.14).
Figure 7.14 Distribution of expressed housing needs (as a percentage of inadequate houses) over
derived housing needs (inadequate housing indicator)
93 The test was performed with the full set of points representing the expressed needs locations and the polygon representing the urbanised area of Rosario. The null hypothesis is rejected (R = 0.76, n = 9665), showing that a tendency towards clustering exists. 94 Two classification methods were used, natural breakpoints and standard deviation, resulting in five classes ranging from very low to very high housing needs. Independent of the classification method used, a higher proportion of the households living in less deprived housing areas express their housing needs. 95 With some variation in these two classes depending on the classification method used.
307%
57%27% 19% 9%
0%
50%
100%
150%
200%
250%
300%
350%
Very Low Low Medium High Very High
% o
ver
tota
l num
ber
of
hous
es o
f ina
dequ
ate
type

161
To conclude, these findings suggest that there are more expressed housing needs coming from the areas of low and very low housing inadequacies but, according to the correlation and accompanying analysis, they tend to cluster in more deprived areas.
This approach has proved to be efficient in detecting cases of housing needs where derived need via indicators shows low levels of need. This can help in detecting the new poor that are normally hidden by many indicators96. This new poverty is scattered throughout the cities; the people concerned are not living in recognisably poor neighbourhoods but can be found in any middle‐class apartment block (Minujin, 1995). These findings demonstrate how important it is to include expressed needs indicators to detect deprived people living in better‐off areas. This is closely related to the issue of ecological fallacy discussed in Section 3.2. Making inferences about individuals with data based on aggregates of people, such as census data, can be misleading. Not every person living in a better‐off area is necessarily well‐off.
7.2 Covariation and concentration of inequality aspects The objective of this section is to identify the characteristics and processes behind the accumulation and reinforcement of spatial inequality in the different domains. From the analysis of the correlation between the different indicators, it is possible to confirm that the different aspects of inequality covariate with each other, accentuating the concentration of deprivation in multiple aspects97.
Overcrowding is significantly positively correlated with inadequate housing and unemployment, and is negatively correlated with education level, health coverage, and water and sewage connections. This indicator correlates with at least one indicator of every domain of the matrix of indicators. It not only helps to describe the conditions of quality of life such as physical and socio‐economic environment but also the distribution of opportunities and accessibility to physical and social infrastructure. Therefore, a household suffering from overcrowding is more likely to suffer from every other aspect of inequality. This finding confirms the high relevance that policy makers in Rosario assigned to overcrowding, considering it the most important aspect of inequality (Chapter 5).
Within the domain of socio‐economic environment, education level is significantly positively correlated (> +0.9) with health coverage and access to internet, and negatively correlated with overcrowding and unemployment. These results indicate that the level of education can determine how better‐off people can be. If not the exclusive determinant, the education level might still explain aspects of income, health and housing deprivation.
Figure 7.15 shows how education level geographically relates with areas with a high percentage of unemployment. The worst‐off areas regarding unemployment (1.5 standard deviation) coincide with areas where most of the adult population did not go to secondary school. The negative correlation between the socio‐economic factor (which is an income proxy) and unemployment, on one hand, and the positive correlation with
96 See Martinez (2000). Evaluating housing needs with the use of GIS. Habitat International 24: 501‐515. 97 See correlation table in Annex 7: Correlation between indicators.

162
education, on the other, confirms that the lowly educated are most likely to suffer from income deprivation.
Figure 7.15 Percentage of the population that completed secondary school level and areas of worst‐off unemployment level
Health coverage is the indicator that correlates most with sewage network. This finding shows that households living in areas without sewage networks not only might be exposed to more health hazards but are also more vulnerable since they have no health insurance. Areas with a low percentage of population with health coverage highly correlate with unemployment, showing that people with income deprivation depend heavily on public hospitals. This confirms the comments of some interviewees in Rosario that an increase in unemployment between 1991 and 2001 also generated a higher burden on the public hospitals due to the number of middle‐class families that could no longer pay for private health insurance.
The indicators related to the distribution of opportunities and accessibility to social infrastructure confirm some of the assumptions that are visually detected in the maps (Figure 7.8 and Figure 7.9). In the case of primary school accessibility, a moderate but significantly negative correlation with overcrowding and a positive correlation with tap water in the house and sewage connection can be observed. This shows that the worst‐off areas are also more disadvantaged in terms of access to primary schools and kindergartens. On the other hand, access to primary health centres and day‐care centres

163
(Centros Crecer) has a significantly positively correlation with unemployment and a negative correlation with education level, health coverage, tap water inside the house and sewage network. The distribution of both Crecer day‐care centres and primary health care favour the worst‐off households: the unemployed, lowly educated and health‐vulnerable.
There are several theories that consider that the provision of services tends to favour certain groups and areas. According to the “underclass hypothesis”, the distribution of services might favour a power elite or discriminate against a particular ethnic minority or low‐income groups (Lineberry, 1977, in Pacione, 2001). Rosario seems to have “unpatterned inequality” in the provision of social infrastructure. According to this theory, some groups are favoured by the provision of certain services and disadvantaged by others (Levy, Meltsner and Wildavsky, 1974, in Pacione, 2001). Pacione (2001) suggests that support has been found for both hypotheses but that most of the evidence supports the unpatterned inequality theory. The same author explains that the “unpatterned” distribution of public services is the aggregate result of two patterns. On one side, there is what he calls a “socially regressive pattern” of “wealth‐related” services such as education, fire and sanitation services. While this pattern benefits middle‐class areas, there is a more “socially progressive pattern” of compensatory welfare‐related services such as day‐care centres and drug rehabilitation clinics (Pacione, 2001, p. 341).
Finally, access to internet seems to be unequally distributed, favouring basically those with a high level of education and a job.
The combined index of inequalities98 correlates with all the aspects of inequality, including a moderate but significant correlation with expressed housing needs, school accessibility and socio‐economic factors. The access to Crecer day‐care centres shows a weak but significantly negative correlation.
The indicator of expressed housing needs correlates moderately but significantly positively with unemployment, inadequate housing and overcrowding. This indicator can also be explained by a negative correlation with health coverage and education level.
7.3 Gap analysis The previous sections showed how GIS‐based indicators could describe inequalities in quality of life and access to physical and social infrastructure. However, it is in the analysis of the gaps between best‐off and worst‐off areas that the inequality problem becomes more evident. By describing gaps, it can be seen how (un)equal different areas are.
One approach to analysing the intra‐urban inequalities is to measure the gap between census block groups. By comparing the best‐off block group and the worst‐off block group, and the best 10% and the worst 10%, it is possible to appreciate the considerable gaps between them (see Table 7.2). The gaps remain quite important for every indicator. 98 This index has a scale of 0 to 1, where 0 is the worst‐off census block group and 1 the best‐off census block group. A map is also shown in Figure 7.34.

164
Table 7.2 Gaps between best‐off and worst‐off areas for the five most important aspects of inequality according to policy makers
Overcrowding Education level Unemployment
Tap water inside the dwelling
Access to schools
Best-off block group
0% 79% 8 % 100% 9 m
Worst-off block group
49% 9% 74% 18% 2995m
Best 10% 0% 67%–79% 8%–15 % 100% 9m–100m
Worst 10% 13%–49% 9%–34% 47%–74% 18%–88% 551m–2995m
The gaps between these two extreme groups are noticeable; for example, the percentage of overcrowding affecting households in the worst‐off 10% of the block groups is 13 to 50 times greater than in the best‐off deciles. Unemployment can affect up to 74% of the population of the worst‐off areas, compared with 8% to 15% in the best‐off area.
As indicated in subsection 6.3.2, for compensatory policies and for the application of indicators at a prescriptive level it is very important to communicate the gaps between different administrative areas: city, districts, and neighbourhood areas. The indicator of overcrowding is a good example of how intra‐urban indicators can clearly expose inequality.
Figure 7.16 shows how the problem of overcrowding becomes more evident when the indicator is disaggregated at different levels of administrative units. The gaps between districts and their best‐off and worst‐off neighbourhood areas are also notorious. Starting at city level, Rosario has overcrowding of 5.6%; however, when overcrowding is analysed at district level the inequalities start to emerge. In the district Oeste, 13.6% of the households are overcrowded, compared with only 0.9% in the district Centro. At the lowest administrative level, the gap in the overcrowding between the best‐off and worst‐off neighbourhood areas is even bigger. It also seems that districts with more overcrowding are also more unequal internally. In this respect, the district Oeste is the most overcrowded district and also has the highest disparity when it comes to the best‐off and worst‐off neighbourhood areas.
This is also confirmed by the higher standard deviation of the worst‐off neighbourhood areas and the width of the box representing the interquartile range in the boxplots99. These measures of dispersion show that most deprived areas are less homogeneous and have a higher variation in overcrowding levels. This is particularly evident when the districts Centro and Oeste are compared.
99 See Annex 8: Complete list of neighbourhood areas, and Annex 9: Boxplots overcrowding

165
5.6%
0.9%
0.5%
2.6%
1.0%
4.9%
14.1%
3.0%
13.2%
7.7%
1.7%
15.1%
8.9%
4.8%
12.0%
6.7%
13.6%
5.2%
23.6%
0.0%
5.0%
10.0%
15.0%
20.0%
25.0%
Rosario District Best-Off / Worst-Off Neighbourhood Area
District “Oeste”
District “Sudoeste”
District “Noroeste”
District “Sur”
District “Norte”
District “Centro”
Figure 7.16 Overcrowding at city and district level, and gap worst‐off / best‐off neighbourhood areas
In other words, the most deprived neighbourhood areas not only suffer from overcrowding but are also more unequal internally. This geographical proximity of extreme realities might have consequences for social cohesion. It reveals not only the low quality of life for the urban poor but also the coexistence of dual/divided cities. “Although absolute poverty is bad enough, it is worse when it occurs amid conditions of plenty” (UNCHS, 2001, p. 15). Any aspect of poverty (such as overcrowding) is a problem in itself but the presence of inequality adds another dimension that makes it even worse.
This multilevel approach shows the influence of scale in the appreciation of the problem. As explained before, the degree of inequality observed will be very much a function of scale (Smith, 1994).
The gaps were also measured between every census block group and the best‐off census block group of the different administrative levels: neighbourhood area, district and city. Using this approach, the intra‐neighbourhood area gap, the intra‐district gap and the intra‐urban or city gap were analysed. Although the resulting maps did not show significant differences, it was observed that census block groups of the district Centro are faced with a low level of inequalities independent of how the gap is
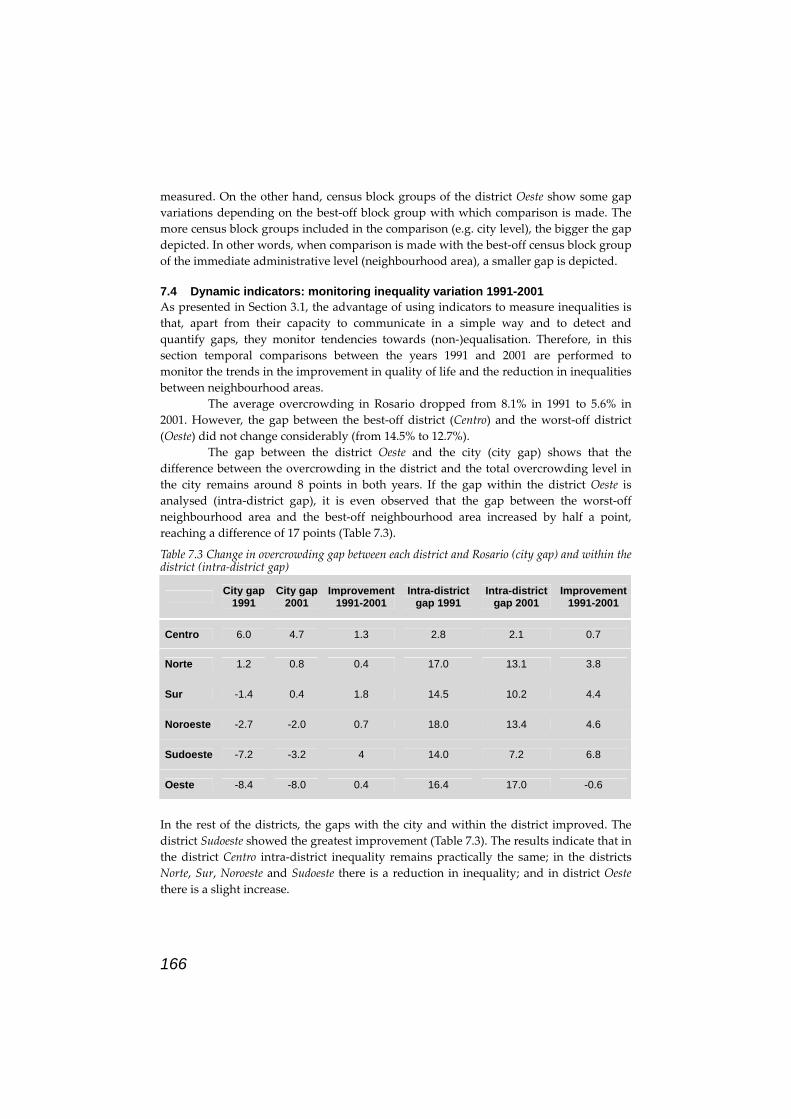
166
measured. On the other hand, census block groups of the district Oeste show some gap variations depending on the best‐off block group with which comparison is made. The more census block groups included in the comparison (e.g. city level), the bigger the gap depicted. In other words, when comparison is made with the best‐off census block group of the immediate administrative level (neighbourhood area), a smaller gap is depicted.
7.4 Dynamic indicators: monitoring inequality variation 1991-2001 As presented in Section 3.1, the advantage of using indicators to measure inequalities is that, apart from their capacity to communicate in a simple way and to detect and quantify gaps, they monitor tendencies towards (non‐)equalisation. Therefore, in this section temporal comparisons between the years 1991 and 2001 are performed to monitor the trends in the improvement in quality of life and the reduction in inequalities between neighbourhood areas.
The average overcrowding in Rosario dropped from 8.1% in 1991 to 5.6% in 2001. However, the gap between the best‐off district (Centro) and the worst‐off district (Oeste) did not change considerably (from 14.5% to 12.7%).
The gap between the district Oeste and the city (city gap) shows that the difference between the overcrowding in the district and the total overcrowding level in the city remains around 8 points in both years. If the gap within the district Oeste is analysed (intra‐district gap), it is even observed that the gap between the worst‐off neighbourhood area and the best‐off neighbourhood area increased by half a point, reaching a difference of 17 points (Table 7.3).
Table 7.3 Change in overcrowding gap between each district and Rosario (city gap) and within the district (intra‐district gap)
City gap 1991
City gap 2001
Improvement 1991-2001
Intra-district gap 1991
Intra-district gap 2001
Improvement 1991-2001
Centro 6.0 4.7 1.3 2.8 2.1 0.7
Norte 1.2 0.8 0.4 17.0 13.1 3.8
Sur -1.4 0.4 1.8 14.5 10.2 4.4
Noroeste -2.7 -2.0 0.7 18.0 13.4 4.6
Sudoeste -7.2 -3.2 4 14.0 7.2 6.8
Oeste -8.4 -8.0 0.4 16.4 17.0 -0.6
In the rest of the districts, the gaps with the city and within the district improved. The district Sudoeste showed the greatest improvement (Table 7.3). The results indicate that in the district Centro intra‐district inequality remains practically the same; in the districts Norte, Sur, Noroeste and Sudoeste there is a reduction in inequality; and in district Oeste there is a slight increase.

167
0% 5% 10% 15% 20% 25% 30%
Overcrowding 1991
0%
5%
10%
15%
20%
25%
30%
Ove
rcro
wdi
ng20
01
C 1C 2C 3
C 4
C 5C 6
C 7
N 1
N 2
N 3
N 4
N 5
N 6
N.O 1
N.O 2
N.O 3
N.O 4
N.O 5
N.O 6
N.O 7
O 1
O 2
O 3O 4
O 5O 6
S 1
S 2
S 3S 4
S 5
S 6
S.O. 1
S.O. 2
S.O. 3S.O. 4
S.O. 5
S.O. 6
City
ove
rcro
wdi
ng 1
991:
8.1
%
City overcrowding 2001: 5.6%
INVERSION TO BETTER OFF
INV
ERS
ION
TO
WO
RS
E O
FF
BETTER OFF
BETTER OFF
WORSE OFF
WORSE OFF
WORSE OFF CONVERGENT
WORSE OFF DIVERGENT
Figure 7.17 analyses in detail the change in overcrowding between 1991 and 2001 for all the neighbourhood areas. It follows the hypothesis of change presented in subsection 6.3.3. Three main outcomes are possible:
• convergence (a reduction in gap); • divergence (an increase in gap); • maintenance of the status quo (no significant change).
Figure 7.17 Change in overcrowding 1991‐2001 in Rosario’s neighbourhood areas
Five neighbourhood areas show a tendency towards equality (worse‐off convergence) and only one neighbourhood area (Sudoeste 3) is in the area where it can be considered that there is an inversion to better‐off or favoured. Only the district Centro has all its neighbourhood areas located in the better‐off area. Two neighbourhood areas of the district Oeste clearly appear in the worse‐off divergent zone (showing an increase in

168
deprivation levels). These findings are similar to those obtained for the gap analysis shown in Table 7.3. Figure 7.18 shows the census block groups where overcrowding is reduced and where it has got worse. The analysis of change between 1991 and 2001 should be very useful to policy makers in allocating resources and observing tendencies.
Figure 7.18 Change in overcrowding 1991‐2001
By comparing the distribution of overcrowding between 1991 and 2001, it can be observed that the best‐off areas remain much the same. There is a drop in overcrowding in most of the periphery, measured both in absolute values (total overcrowded households) or as a percentage of overcrowded households. However, in some block groups in the periphery more than 250 overcrowded households were incorporated or became overcrowded. To understand this situation better, it is necessary to analyse the population growth between the two years.
Figure 7.19 shows that between 1991 and 2001 the city centre lost population whereas the periphery gained population. The population in Rosario grew from 907,175 in 1991 to 922,444 in 2001, which represents an overall growth of only 2%, compared with the 14% growth registered in the previous two censuses. In the same period, natural growth amounted to 61,361 persons. The difference with the overall growth of 15,269 persons results in a net migration balance of 46,000 persons. The low population growth between the two years could be related to the de‐industrialisation that affected the metropolitan area (which started in the 1970s). Consequently, the city of Rosario

169
attracted fewer migrants. At the same time, other cities in the metropolitan area registered a higher population growth (e.g. Funes and Roldán100). The location of new gated communities in those areas might explain some displacement from the city centre and its population loss. On the other hand, the growth in the periphery might be related to the fact that in worst‐off areas families tend to be more numerous (which is confirmed by a higher percentage of children than in other areas) and/or that migrating families from other provinces settle in worst‐off areas.
Figure 7.19 Population growth 1991‐2001
In general terms, the best‐off areas lost population and the worst‐off areas gained population. This might explain why there is an increase in overcrowding in some areas of the periphery. According to the president of the municipal parliament of Rosario, the district Oeste is the area of the city with the greatest population growth in recent times and many deprivations are concentrated in this district. This is because new slums have emerged next to new housing areas. During the participatory budget sessions, he said that the demands from the district Oeste were evidence of the city’s “internal debt” with the peripheral neighbourhoods, with more investment being required (La Capital, 8 July 2004).
100 Located on the West axis of the metropolitan area (Figure 4.2), Funes grew from 8,952 in 1991 to 14,665 in 2001 and Roldán from 9,382 to 11,470 (source: INDEC).

170
Another phenomenon that might explain the increase in overcrowding in a few block groups of the city centre is the increase in the number of pensions (boarding houses). These are non‐tourist pensions, where dwellers pay a monthly rent for rooms that are usually located on the upper floor of shops or old houses.
If the change in inequalities in the quality of life is analysed taking into account the physical environment, there is an increase in inadequate housing in the city centre (most probably new poor) and an accentuation of deprivations in the periphery. On the other hand, the decrease in overcrowding and inadequate housing in some areas might be explained by the increase in public housing and the clearance of slum areas. Five years before the 2001 census, 15,000 people moved from slum areas to live in a public housing area (Dezorzi, 2001).
Figure 7.20 Change in housing inequalities 1991‐2001
The change in housing inequalities (Figure 7.20) shows that there is an increase in the percentage of inadequate housing in the district Centro. This is confirmed by analysing the change in the number of households who lived in pensions in 1991 and in 2001 (Table 7.4). A municipal report describing the situation in district Centro in 1996 suggests that the existence of a few deprived areas might be explained by the presence of pensions (Municipalidad de Rosario, 1996a). These results confirm this and indicate that the situation seems to have worsened since 1991. The presence of these pensions should be

171
taken into consideration in any sort of compensatory policy because they are in an area where better‐off households average out the indicators. A local newspaper has vividly described the situation in pensions in the city, showing how several families (and uniperson households), sometimes under conditions of extreme poverty, have to share bathrooms, and suffer from overcrowding and from health problems such as bronchitis because of the damp and the bad state of the pensions. These people are of different ages (including children and elderly people) and may be unemployed, workers, retired people or immigrants. In some cases, they have been evicted from other dwellings and are left with no other option than to rent a room in a pension. Most of them are left out of the formal renting sector (Dezorzi and Bazzoni, 2004).
Table 7.4 Total number of households living in pensions per district
District Year 1991 Year 2001 Change
Centro 838 1127 289
Sudoeste 18 61 43
Sur 70 87 17
Noroeste 26 42 16
Norte 48 44 -4
Oeste 51 26 -25
Table 7.4 shows that the pension is a dwelling type mostly concentrated in the district Centro. The explanation for this is the historical presence of conventillos, where many immigrants lived at the beginning of the 20th century, as well as the availability of old vacant dwellings that can be subdivided or squatted.
If the change in inequalities in the quality of life is analysed taking into account the socio‐economic environment (education level), a general improvement in the whole city can be observed, although there are areas in the district Oeste which have become worse (Figure 7.22). Another particularity is that in some block groups in the city centre the percentage of adult population with secondary school certification has decreased. Unemployment increased in the whole city, but has particularly affected the worst‐off periphery, with increases up to 40% in certain census block groups. Unemployment rose in the worst‐off census tract from 17% in 1991 to 55% in 2001, while in the best‐off census tracts it doubled, reaching levels between 8% and 15% in 2001. The economic crisis that affected Argentina is clearly reflected in this indicator, which is highly sensitive to economic changes. This coincides with the perception of policy makers interviewed in Rosario. They perceived an increase in inequality between 1991 and 2001, particularly in the aspect of unemployment (subsection 5.5.1). The health coverage reflects a stable situation for the majority of the best‐off core, but has particularly affected intermediate areas typically inhabited by the middle class (Figure 7.21). The impact of unemployment and the economic crisis on the middle class is clearly reflected in these two indicators. The deterioration in the quality of life affected the middle class and the new poor. The inability to pay for health insurance is one of the reasons. The number of people without

172
health insurance has increased in Rosario and in Argentina in general. During the interviews, policy makers explained that the city centre was traditionally populated by people that had their own health insurance (hence no public primary health centre was available or needed there). Nowadays, because some of them have lost their jobs and become the new poor, they no longer have private health insurance and have to go to public hospitals or travel to other districts to find a primary health centre and a family doctor. This is a good indication that the crisis has changed the social geography of the city and that the social areas within the city are not stable.
A policy maker interviewed in Rosario explained the extra burden on the public health sector that this reduction in health coverage represents: “It is evident that the [economic] model that was applied in Argentina in the last 10 years was a machine of poverty production. This is shown in a greater demand of social plans, the access to the public health service by those that used to have a private health service” (Interviewee 17).
Figure 7.21 Change in 1991‐2001 indicators socio‐economic environment: health coverage 101
101 Health coverage (possession of health insurance) and unemployment data were available at census tract level for 1991. To compare the two years, the 2001 data were dissolved and generalised from block group level to census tract level, with the consequent loss of geographical detail.

173
Figure 7.22 Change in 1991‐2001 indicators socio‐economic environment A: education level, B: unemployment

174
The increase in unemployment inequalities, together with the correlation with other quality‐of‐life aspects such as overcrowding and health coverage, indicates that families are unable to live in a suitable dwelling or afford certain services because of income deprivation resulting from joblessness. The incapacity to pay for health insurance makes them more vulnerable, which is enhanced by the lack of basic infrastructure such as sewage.
In terms of provision of infrastructure, there is a general improvement in water and sewage indicators, especially in the northern district (Alberdi), which reflects the betterment of the network. An improvement in the percentage of households with tap water inside the house can be observed, favouring worst‐off areas. In the case of sewage, there is an unpatterned improvement, with betterment in block groups of better‐off areas as well as in some worst‐off areas. However, there is still an unequal distribution of the networks, resulting in large areas of the periphery being without sewage connections. The increase in the provision can be explained by the betterment of the network between 1991 and 1995 (La Capital, 19 October 2004). On the other hand, when it comes to the areas where the sewage connections dropped, the reason is most probably the increase in the number of households in slum areas.
Owing to lack of data about the year of opening of school buildings, it is not possible to see whether there is a tendency towards equalisation in the accessibility to primary schools and kindergartens. The opening of Crecer day‐care centres from 1997 onwards shows a clear tendency towards equalisation in the distribution of social infrastructure in relation to 1991.
These results confirm some of the perceptions that policy makers had about the growth of inequalities in Rosario between 1991 and 2001 (subsection 5.5.1) ‒ in particular unemployment. Almost every interviewee perceived this as the aspect with growth. In the same direction, they perceived an impoverishment of the middle‐class sector and stated that some of them could no longer afford to rent and live in the city centre and had been forced to move in with relatives.
These temporal comparisons were performed to monitor the trends in the improvement in quality of life and in reducing inequalities in different areas of the city. The following sections will show how to translate the indicators into a prescriptive policy.
7.5 Prescriptive use of GIS-based indicators The previous sections showed how GIS‐based indicators are effective in providing policy makers with a description of inequalities. With the proposed set of indicators, policy makers can identify the main problems, where they are concentrated, and whom they affect. They not only describe but also (to some extent) help in explaining inequality by exposing the interrelations between its different aspects, the changes over time, and the gaps between different areas.
Following a social justice perspective, GIS‐based indicators should facilitate equity in local government investment. It is in this respect that the prescriptive response takes place. In this section, the application of a methodology is described that shows policy makers where to target first, and how much – or what proportion – to invest. Here the ranking of areas according to problem intensity or need for intervention is proposed, as well as budget allocation within the context of the participatory budget. The link with

175
the participatory budget is important for finding common ground between governance, participation and targeted policies. The participatory budget approach helps to identify themes perceived as urgent by the population, and area‐based budgeting helps to identify the geographical areas where the needs are concentrated.
It is beyond the scope of this research to propose a methodology for a predictive response or for policy evaluation. However, it is proposed that the sustained use of indicators by the local administration can help in detecting negative tendencies towards inequality. The use of dynamic indicators in the previous sections, showing the change in the gap in overcrowding between 1991 and 2001, is a clear example of this. The selection of targets such as “90% of households should have sewage connections by 2011” and indicators in relation to specific policies might be used for further policy evaluation. In this section, it will be shown how the use of GIS‐based (intra‐urban) indicators can be translated into concrete policy actions.
The use of area‐based policies to address inequality was discussed in Section 2.2. One of the arguments given in favour of geographically targeted policies (Smith, 1999, p. 4) is that, owing to the concentration of problems, targeted resources are more effective since a greater number of deprived people are reached.
In Rosario, with the exception of Rosario Hábitat102, which targets slum areas, the territorial or geographical dimension in the application of urban policies is recognised, although not implemented in the allocation of resources. Present social programmes in Argentina such as the national Plan Jefes de Hogar103 are not geographically sensitive since they target people and not particular areas.
As shown in this chapter, in Rosario the areas of need correlate with one another, increasing the negative burden on the population living in these areas. For this reason, targeting priority areas can be used as a complement to other socially sensitive policies. It should also be noted that individuals living in deprived areas are doubly disadvantaged: they are poor themselves, but they are trapped in a deprived area that increases their needs. If they apply for a job, they are usually discriminated against and labelled as villeros; their opportunity to access (some) social and physical infrastructure will be less than if they live in some other area of the city. The exception to this is that they might be more disadvantaged as regards access to primary health‐care facilities if they live in the city centre (e.g. households living in pensions). However, in absolute values the majority of deprived households and individuals cluster in the periphery.
Social justice is concerned with the question of who gets what where and how, and more precisely who should get what where and how (Smith, 1977). The answer to who gets what where and how is directly related to the use of GIS‐based indicators as a descriptive input. Who should get what, where and how is of course a prescriptive input that GIS‐based indicators can also provide. In any case, both inputs are interrelated and, before prescribing, it is necessary to describe the extent of the inequality problem.
In the following section, a straightforward methodology is used (easy to grasp and transparent to policy makers) where the GIS‐based indicators can be applied in a prescriptive way to target worse‐off areas and orient the budget allocation.
102 Rosario Hábitat is described in subsection 4.3.4. 103 Plan Jefes de Hogar is described in subsection 4.3.5.

176
As explained before, the city of Rosario is subdivided into six districts, and recently every district was subdivided into neighbourhood areas (subsection 4.3.3). There are two main administrative levels where budget allocation and compensation for inequalities can be effective. First of all, there is a clear demand from the local government to compensate for intra‐district disparities and there is a clear objective to use neighbourhood areas. Secondly, since 2003 the participatory budget has included in every district a Consejo Participativo (participatory forum/city parliament), in which every neighbourhood area has two delegates. It is the function of this Consejo Participativo to work with the local government in the planning and implementation of the participatory budget of its district104, to control the fulfilment of the priorities established for the district, and to formulate new proposals and initiatives.
In March 2005, the UNDP organised the third Latin American Fair on Governance in Rosario and recognised the city for its best practices, such as the participatory budgeting. It should be noted that until now every district has received the same share of the participatory budget independent of its needs. However, a more equitable distribution of resources is indicated as a “future challenge” for the participatory budgeting (Bifarello, 2005, p. 123). In the same direction and during one of the workshops at the same event, a delegate of the Consejo Participativo proclaimed the importance of finding a mechanism for redistributing the participatory budget among the districts based on needs.
7.5.1 Area-based budgeting As discussed earlier, a household suffering from overcrowding is more likely to suffer from every other aspect of inequality. For this reason, and because it is the aspect of inequality most valued by policy makers, it is suggested in the following example to base the ranking of the most deprived districts on overcrowding. The use of the 2001 index of inequalities would be another option, although less transparent to policy makers.
As indicated in subsection 5.6.4, the relevance of giving a prescriptive input with GIS‐based indicators to target and compensate for inequalities is justified by the constant reference made by policy makers to the importance of justly assigning resources. Most of the policy makers interviewed observed that it was possible to reduce inequalities through the budget. The introduction of the participatory budget seems to be a policy action to reach that goal. They also mentioned it as a tool to identify problems following a participatory approach and that, thanks to the decentralisation and the participatory budget, it was possible to establish policies with a territorial base. They also recognised the importance of targeting those areas with greater inequalities, since they had particular and concentrated problems.
In this section, it is proposed that this participatory budget process could be further improved by, or could benefit from, the use of GIS‐based indicators. As an illustration, it is proposed that one third of the participatory budget (8 million pesos105) 104 See subsection 4.3.3 for further details of the participatory budget within the decentralisation process. 105 Current cost of public investments in Rosario: new neighbourhood for 200 families, houses plus physical and social infrastructure = 12 million pesos (La Capital, 17/02/2004); 640 m2 of social‐sports facility = 364,000 pesos (La Capital, 05/11/2004).

177
be re‐oriented to guarantee the investment in the worse‐off neighbourhood areas. This could give a further territorial dimension to the assignment of resources at a scale other than district. The process suggested can be described as follows:
Thematic participatory budget at present: • The participatory budget is launched and the neighbourhood areas
propose their themes to be prioritised. • The five thematic areas securing the most votes are stated per district. • Each Secretariat incorporates the demands in the budget.
Area‐based budgeting proposed, ranking method: • The equivalent of one third of the participatory budget106 is destined for the
improvement of deprived areas. • The prioritised neighbourhood areas are defined (Step 1 in Figure 7.23).
In the application of area‐based policies, there is always a problem of how to define the number of prioritised neighbourhood areas. The cutoff point between best‐off and worst‐off areas will always remain a point of controversy, and areas that score better will not be targeted. Where can the boundary be established between the best‐off (affluent) and worst‐off (deprived) neighbourhood areas? Different strategies can be followed and have already been suggested or implemented. Statistical points can be used, such as the mean at city level (Broadway and Jesty, 1998), a particular break between natural groupings of the data values (natural breakpoints), or normative values. One normative option is used by Pacione to classify as “extreme poverty neighbourhoods” those block groups where 40% or more of residents have incomes below the official poverty line (Pacione, 2001).
In the case of Rosario three alternatives can be suggested. One option is to use the overcrowding measured at city level as a cutoff point. Another option, less justifiable but no less implemented107, is to aim at the 10 worst‐off neighbourhoods. Finally, a certain percentage of the affected population can be targeted, for example, 50% of the overcrowded households. In any case, the final decision to include a neighbourhood area or not should be taken by policy makers in context with other criteria, such as the existence of other programmes in the neighbourhood area (e.g. Rosario Hábitat) or being a priority area in the Urban Plan (Nuevo Plan Director).
Therefore, it is proposed here that the area‐based intervention should be coordinated at district as well as at city level and that the needs of deprived people within better‐off areas (not targeted) should be monitored with the combined use of expressed needs (subsection 7.1.3).
The area‐based budget is distributed among the prioritised neighbourhood areas in proportion to their number of overcrowded households. As a result, neighbourhood areas in greater need will have a higher share of the budget. This follows
106 This amount serves as an example and should be decided by the local government. 107 In Bristol (UK), the 10 most deprived neighbourhoods are designated as Neighbourhood Renewal Areas (Neighbourhood Renewal Unit, 2004). In Latin America, the city of São Paulo has selected the 10 most deprived neighbourhoods for the slum‐upgrading programme (Cities Alliance, 2002).

178
the social justice approach of proportional equality based on needs, presented in subsection 2.1.1.
• Every district is secured a budget allocation in every Secretariat equal to the sum of the neighbourhood area budgets geographically located in the district (Step 2 in Figure 7.23).
The administration of the resulting budget in every Secretariat and the decisions on the allocation of the resources might be done in consultation with the directors of the districts and the Consejo Participativo, in which every neighbourhood area has two delegates.
• Policy makers should ultimately determine which programmes or activities can make use of the budget, on the condition that they will be geographically located in the prioritised areas (Step 3 in Figure 7.23).
• A common concerted action within a partnership would be the approach for the intervention (Step 4 in Figure 7.23).
Cross sectoral – concerted - interventions
Area-based budgeting (1/3 participatory budget)
Prioritisation neighbourhood areas
Refine areas by:Indicators at census block group level,Cluster profiles(In)equality index 2001
Areas based interventions
Social and physical InfrastructureImprovements in slum areas
Programmes for specific groups.Vulnerable (e.g. children, woman headed households,etc.)Deprived: unemployed (income deprived), slum dweller (habitat deprived), unskilled (education deprived)
Deprived people in deprived areas
Budget allocation to programmes
Budget calculation proportional to overcrowded householdsBudget allocation to districts
1
2
3
4
Figure 7.23 Schematic diagram of proposed area‐based budgeting

179
A further “target area refinement” within every prioritised neighbourhood area can be decided with the use of the 2001 index of inequalities and indicators measured at census block group level (Figure 7.26 and Figure 7.27). The use of the cluster areas can help in identifying the characteristics of the selected neighbourhood areas (Figure 7.33). Other GIS tools such as accessibility analysis and catchment area of social infrastructure can help in the final decision (Figure 7.12).
A “thematic refinement” can be made with the use of other indicators. An example is to target census block groups with low education level and high unemployment to implement training policies.
A “target group refinement” can be made taking into account population groups such as children (Figure 7.29).
Two main purposes of targeting areas for area‐based policies in Rosario can be distinguished:
• To focus and intervene in the area itself (pure area‐based interventions):
Everyone in the area will benefit from the policy: If access to physical and social infrastructure is improved (e.g. if the sewage network is extended), it is to the advantage of the whole population residing in the area.
• To target individuals, households and disadvantaged groups within deprived areas: Deprived people in deprived areas or the “doubly deprived” will
benefit: After the prioritised areas have been defined, potential recipients should meet certain requirements (e.g. be unemployed, a woman‐headed household). A case in point would be targeting the unskilled through training activities to close the mismatch between labour demand and education‐level capacity of the area.
For ex‐post evaluations, it might be useful if the stakeholders who coordinate the different programmes (NGOs, local government, etc.) were to identify an indicator and a target that they want to reach. Ideally, every programme or action should be accountable for the success or failure reflected by the indicator.
It is also important to consider the possibility of linking areas of need with “opportunity” areas or best‐off areas. The application of a cluster approach such as that applied in Liverpool108 might be a good strategy to involve private and public partnerships within the district in the area‐based policies.
108 See the case of the Liverpool Neighbourhood Renewal Strategy and the South Liverpool Partnership Cluster Strategy in Sections 4.8 and 4.9.

180
7.5.2 Prioritised neighbourhood areas proportional to need The two worst‐off neighbourhood areas when ranked taking into account the percentage of overcrowding above city level are Oeste 5 and Oeste 6 (Table 7.5 and Figure 7.24). Considering the standard deviation (between block groups) and the min and max values, it can be observed that within the neighbourhood areas there are also better‐off block groups with overcrowding levels lower than the city level. Both neighbourhood areas also showed an increase in deprivation levels between 1991 and 2001 (see Figure 7.17). Looking down the table, it can be seen that other neighbourhood areas are not only better‐off but also more equal (less standard deviation)109. Both Oeste 5 and Oeste 6 also rank among the three worst‐off neighbourhood areas when the absolute number of overcrowded households is taken into account (Table 7.6).
Table 7.5 Prioritised neighbourhood areas (ranked on % overcrowding above city level)
Neighbourhood Area
% Overcrowding
Area-based Budget: 8 million
pesos
% Children Pop
0 – 14 years
Min Overc.
Max Overc.
Standard Deviation110
1 Oeste 5 23.6 $654,042 34.4 4.4 49.1 15
2 Oeste 6 23.2 $829,903 35.9 1.9 48.6 14
3 Oeste 2 20.3 $595,422 33.5 5.0 33.2 11
4 Noroeste 4 15.1 $542,730 30.7 3.7 33.3 8
5 Norte 1 14.1 $274,000 30.6 4.4 31.7 10
6 Sur 6 13.2 $374,115 29.4 4.6 24.3 9
7 Sudoeste 6 12.0 $512,432 28.9 2.7 22.5 8
8 Sudoeste 2 11.9 $646,797 26.9 1.9 29.9 7
9 Noroeste 1 11.4 $383,336 29.6 0.0 22.9 8
10 Noroeste 5 10.8 $766,672 26.2 0.5 36.4 8
11 Sudoeste 5 9.4 $120,534 28.2 2.2 18.8 8
12 Norte 4 9.0 $434,711 26.5 0.8 24.1 6
13 Oeste 3 8.1 $430,759 25.0 2.5 15.9 4
14 Sudoeste 1 7.2 $201,548 25.2 0.0 19.9 7
15 Oeste 4 7.2 $237,774 24.2 2.7 14.7 4
16 Oeste 1 6.7 $299,687 22.1 0.4 24.3 7
17 Sur 2 6.2 $500,576 22.5 0.0 23.4 6
18 Norte 2 5.9 $194,961 22.4 0.0 26.8 8
Rosario 5.6 21.7
109 See Annex 8: Complete list of neighbourhood areas 110 Standard deviation calculated among the block groups of the corresponding neighbourhood area.

181
Figure 7.24 Prioritised neighbourhood areas (ranked on overcrowding above city level and in red and italic worst 10)
Table 7.6 Prioritised neighbourhood areas (ranked on number of overcrowded households: 10 worst off and 1‐8 cutoff point up to 50% of overcrowded households in the city)
Ranking Neighbourhood
Areas
Neighbourhood Area
Total Overcrowded Households
% Accumulated Overcrowding
Area-based Budget: 8
million pesos
1 Oeste 6 1260 8% $1,122,619
2 Noroeste 5 1164 15.5% $1,037,086
3 Oeste 5 993 21.9% $884,731
4 Sudoeste 2 982 28.2% $874,930
5 Oeste 2 904 34.0% $805,434
6 Noroeste 4 824 39.3% $734,157
7 Sudoeste 6 778 44.3% $693,172
8 Sur 2 760 49.2% $677,135
9 Norte 4 660 53.4% $588,038
10 Oeste 3 654 57.6% $582,692

182
Figure 7.25 Distribution of budget per district (left: above city average 18NA; right: 58%
accumulated overcrowding, 10NA)
Table 7.7 Total budget per district
By comparing the share of the total budget per district between the two ranking methods, and taking the cutoff point of 58% of overcrowded households (10 worst‐off) into account, the districts Norte and Sur are less favoured (with a reduction of 35% and 23% in the budget). In any case, the district Oeste has the biggest share (see Figure 7.25 and Table 7.7). From a compensatory perspective, this is quite correct since the two worst‐off neighbourhood areas (Oeste 6 and Oeste 5) are also worst‐off divergent when comparing the change between 1991 and 2001. They are not only deprived now but it seems that the situation is worsening (see Figure 7.17).
If the different inequality aspects/domains of every block group within the prioritised neighbourhood area Oeste 6 (Figure 7.26) are analysed, it can be seen that there are internal differences. The block groups 4913‐4914 in the middle of the graph are relatively better‐off in their quality of life (physical and socio‐economic environment) as well as regarding access to physical infrastructure. The multiple deprivation of the worse‐off block groups is better captured (and can be better communicated) by the 2001 index of inequality (Figure 7.27). However, as indicated earlier, policy makers showed during the interviews a preference to work with individual indicators rather than a composite index when making a decision.
District Total budget per district
(above city average). 18 neighbourhood areas (NA)
Total budget per district (58% accumulated
overcrowding) 10 worst neighbourhood areas
Difference between two budgets (in %)
Oeste $3,047,588 $3,395,478 11
Noroeste $1,692,738 $1,771,244 5
Sudoeste $1,481,311 $1,568,103 6
Norte $903,672 $588,039 -35
Sur $874,691 $677,136 -23
Oeste38%
Noroeste21%
Norte11%
Sur 11%
Suroeste19%
Oeste43%
Noroeste22%
Norte7%
Sur8%
Suroeste20%

183
4807 4813 4901 4911 4912 4913 4914 4915 4916 4917 4918
Block Groups
0%
10%
20%
30%
40%
50%
60%
70%
Valu
e
Education LevelUnemploymentHealth Coverage
4807 4813 4901 4911 4912 4913 4914 4915 4916 4917 4918
Block Groups
0%
20%
40%
60%
80%
100%
Valu
e
WaterSewageInternet
4807 4813 4901 4911 4912 4913 4914 4915 4916 4917 4918
Block Groups
0%
20%
40%
60%
80%
Valu
e
OvercrowdingInadequate HousingExpressed housing deprivation
Figure 7.26 A‐C Analysis of the block groups within the prioritised neighbourhood area Oeste 6 A: Indicators of physical environment; B: Indicators of socio‐economic environment;
C: Indicators of access to physical infrastructure

184
4807 4813 4901 4911 4912 4913 4914 4915 4916 4917 4918
Block Groups
0.0
0.2
0.4
0.6
0.8
(in)e
qual
ity in
dex
2001
4807 4813 4901 4911 4912 4913 4914 4915 4916 4917 4918
Block Groups
0%
10%
20%
30%
40%
50%
% C
hild
ren
popu
latio
n (0
-14y
ears
)
Figure 7.27 Distribution of inequality index 2001 in neighbourhood area Oeste 6
(0.0 = worst‐off and 1.0 = best‐off)
While targeting resources, it is also very important to know the location and the characteristics of the most affected and vulnerable groups of spatial inequality. In Latin America as well as in many other parts of the developing world, poverty affects children in particular. As indicated in Section 4.1, one of the characteristics of inequality in Argentina is that the widening of the income gap and poverty distinguish children as the most affected (UNDP, 2002). In this research, it was found that areas with a high percentage of overcrowding have a strong significantly positive correlation with areas with a high percentage of child population111. This concentration of the child population among worst‐off neighbourhood areas is also reflected in Table 7.5 and visualised in Figure 7.29. This can explain why policy makers considered overcrowding and access to primary schools among the most important aspects of inequalities.
The higher percentage of children in multiply deprived areas can be seen when comparing the inequality index (Figure 7.27) with the distribution of child population throughout the block groups of neighbourhood area Oeste 6 (Figure 7.28).
Figure 7.28 Distribution of child population in neighbourhood area Oeste 6
111 See Annex 7: Correlation between indicators.

185
Figure 7.29 Concentration of child population in worst‐off areas
It should be noted that the proposed area‐based budgeting is an illustration of how indicators can be used to reallocate resources to compensate for disparities. As said before, there are several aspects, such as the weighting of indices and the cutoff point between best‐off and worst‐off neighbourhood areas, which have a subjective component, and have to be refined by policy makers in accordance with concrete policy goals.
In the following section, the problem of inequality in Rosario will presented at macro level for the purpose of presenting a schematic socio‐economic spatial differentiation of the city.
7.6 Socio-economic spatial differentiation and spatial distribution of inequalities in Rosario
As a result of the spatial inequalities that are described by every indicator at micro level (census block group level), it is possible to construct a general picture of the socio‐economic spatial differentiation in Rosario. Figure 7.30 shows the three main characteristics of such a schema.
The city of Rosario is characterised by a “best‐off core”, with middle and high socio‐economic status that is geographically located ‒ as in most Latin American cities ‒ around the main square with the cathedral and the municipality buildings. The socio‐economic status decreases away from the city centre. This development has a historical reason related to the colonial period when the Spanish rulers introduced the Ley de Indias (Laws of Indies), which involved a grid street pattern developed around a main square surrounded by religious and official buildings. In the case of Rosario, the location of the harbour enhanced the concentration of residential use and commercial activities around

186
this central area. Living close to the centre was a symbol of social status that was characteristic of the Latin American cities (Pacione, 2001). In Rosario, the city centre is one of the least deprived areas and one of the best served, with a high concentration of health and education facilities. The dominant role of the city centre can be explained by the fact that the public transport network continues to focus on that area and by the presence of better‐off residents. As explained in Section 4.2, the spatial growth of the city has been structured around its main roads, railroads, and the coast along the river. The proximity to the riverfront and its nautical activities probably explains why the city centre in Rosario remains an option for better‐off groups. Real estate agents confirm the preference of high‐income groups for living close to the river (Veiga, 2001).
Secondly, it is possible to distinguish three “best‐off axes”, attributable to the historical development of the city along main roads, together with their territorial linkage relevance (counterclockwise: Bv. Rondeau‐Av. Alberdi, Av. Eva Perón and Av. San Martín). Since the beginning of the 20th century, the neighbourhoods of Alberdi in the north, Fisherton in the west, and Saladillo in the south have reflected the other preference (besides the city centre) of the better‐off sectors of the society for proximity to nature, open space and the river. They were separate suburban settlements that emerged between 1886 and 1889 in direct relation to tramway concessions and the action of private developers (Rigotti, 2001). Nowadays these settlements have been absorbed by the built‐up area.
Finally, a “worst‐off ring” runs concentrically, generating a clear “periphery of need”.
Figure 7.30 Schematic socio‐economic spatial differentiations in Rosario:
best‐off core and axes and worst‐off periphery

187
Also at macro level, a schematic representation of changes between 1991 and 2001 can show that there is a best‐off stable area coinciding with the best‐off core and best‐off axes (Figure 7.31). In general, there is not so much variation in the periphery but a trend towards inequality reduction can be observed. This change is shown, for example, by an improvement in overcrowding level. Finally, there are some points of increased inequalities. They are located particularly in the periphery, coinciding with the formation of slum areas, and mostly in the district Oeste.
Although the city centre remains the best‐off area, there are some points of change owing to the increase in the number of pensions, as discussed in Section 7.4.
Figure 7.31 Schematic representation of inequality changes between 1991 and 2001
With the use of factor analysis, it was intended to identify the main characteristics behind inequalities that can explain the socio‐spatial differentiation in Rosario. The scheme presented in Figure 7.30 reflects the socio‐economic factor extracted with the use of principal components analysis112. This factor, which accounts for 23% of the variance, is represented by a combination of variables that reflects socio‐economic status such as education, employment and occupation, and material possessions. The high quality of the house (Quality material 1) and the possession of items such as PC, internet connection and cell phone are clear indications of the income level of the household113.
112 See subsection 6.2.5 for details. 113 Since income does not exist as a variable in the Argentinean census, this factor is a good proxy for income level.

188
As Figure 7.32 shows, the areas with a score of 1.5 standard deviation above the mean are those corresponding to the best‐off core and best‐off axes, as well as the best‐off stable area. On the other hand, areas with a score of ‐1.52 standard deviation correspond to the worst‐off ring.
Figure 7.32 Socio‐economic factor
As described in subsection 6.2.6, cluster analysis was performed to further describe these worst‐off and best‐off areas and to identify areas with similar characteristics (homogenous areas). As a result, the census block groups were classified into eight clusters of similar characteristics (Figure 7.33). Table 7.8 shows the final cluster centres with their most representative value.
It should be noted that it was not intended to generate an exhaustive or complete list of lifestyles present in Rosario by generating more classes (15 to 20 clusters) ‒ as is usually done in geomarketing or geodemographics studies. With this approach, it is possible to have a general profile of the best‐off and worst‐off areas. There are three clearly best‐off clusters (2, 3 and 5), with dwelling type (flat or house) being a discriminator. The population living in these areas has higher education levels, lower overcrowding and better health coverage.

189
The other clusters are located in the periphery. They are worst‐off and suffer from higher unemployment levels, worse dwelling conditions and are multiply deprived. Within the worst‐off group, cluster 6 suffers from less overcrowding than the others, which might be explained by the presence of public housing apartment units.
Table 7.8 Cluster areas and the most representative value for each cluster centre114 Cluster
1 Periphery (worse off ring) Low sewage connection
2 Best off core (flats)
3 Best off axis (houses)
4 Worst off sectors (slums)
5 Better off ring + axis
6 Worse off flats (public housing)
7 Worse off periphery. High unemploy. mixed quality of dwellings
8 Periphery (worse off ring) High sewage connection
% House type A 85.0 18.1 91.6 35.9 74.9 16.0 65.0 85.7
% House type B (slum) 7.3 .4 1.1 32.1 .6 1.2 17.8 4.0
% Rancho (slum) .4 .0 .0 5.0 .1 .1 2.1 .5
% Casilla (slum) 3.4 .0 .6 24.9 .4 .6 7.8 2.2
% Apartment, flat 3.6 79.8 6.4 1.8 23.4 81.8 6.9 7.3
% Dwelling quality 1 48.7 90.6 74.3 14.4 79.1 59.7 28.9 53.9
% Dwelling quality 2 38.5 9.0 23.4 20.8 18.7 35.2 39.6 37.3
% Dwelling quality 3 11.8 .4 2.2 52.3 1.9 4.7 27.6 8.0
% Dwelling quality 4 1.1 .0 .1 12.2 .2 .4 3.8 .8
% Inadequate housing 11.4 2.1 1.9 62.2 1.7 2.2 28.1 7.0
% Education level 43.5 64.7 59.9 21.5 58.7 51.6 32.2 48.1
% Sewage connection 9.3 99.0 52.7 14.3 95.6 94.8 30.6 77.5
% Overcrowding 5.9 .6 1.0 23.7 1.1 2.1 15.3 4.0
% Internet 5.1 25.3 17.0 1.0 16.2 6.0 1.9 7.1
% Water connection 95.7 99.6 99.3 68.3 99.4 98.6 87.4 97.5
% Health coverage 53.6 84.3 78.7 21.4 78.4 55.9 36.5 63.0
% Unemployment 22.9 9.3 14.2 31.7 13.2 25.0 27.5 19.2
% Expressed housing needs 4.3 1.0 1.4 5.4 1.7 2.5 6.7 3.4
Socio-economic status factor -.5 .8 .8 -.9 .2 -.7 -.9 -.6
114 Unemployment calculated as the percentage of unemployed within the adult population of working age (14 to 65 years old).

190
Figure 7.33 Cluster areas in Rosario
While factor analysis helped to analyse the socio‐economic spatial differentiation in Rosario and cluster analysis helped to identify homogeneous areas, the construction of a composite index of inequalities let us identify the location of block groups which are worst‐off and affected by a multiplicity of inequality aspects. The resulting distribution of the index of inequalities shown in Figure 7.34 helps us to understand the geography of multiple deprivation of Rosario.
If it is considered that the worst‐off (multi‐deprived) areas are those that are more than ‐1.5 standard deviation from the city mean, then a total of 146,906 persons are affected, where 39% are below 15 years of age, compared to 25% at city level. This shows the high number of vulnerable groups affected by multiple aspects of inequality.

191
Figure 7.34 Inequality index 2001
7.7 Conclusions The different GIS‐based indicators selected to analyse spatial inequalities indicate the existence of a clear and profound socio‐spatial differentiation and polarisation. Rosario is a dual or divided city and, as Hall et al. (2001, p. 154) suggest, this is based on the evidence of the social divisions within the city. This social polarisation also marks the spatial structure of the city. The socio‐economic factor extracted, the cluster analysis, and the composite index of inequalities confirm the clear existence of a better‐off core and axes against a worst‐off periphery. It is within the analysis of the GIS‐based indicators of the different aspects selected that intra‐urban inequalities become more visible. The inequalities between the districts and within their neighbourhood areas are marked in each aspect that was considered. However, in terms of the distributions of opportunities and the accessibility to social infrastructure (primary health centres and day‐care centres), the results indicate that there is a “socially progressive pattern” favouring worst‐off areas. The distribution of opportunities favours the worst‐off households: the unemployed, lowly educated and health‐vulnerable. However, the existence of privatised services such as sewage limits the capacity of the local government to improve certain aspects and compensate for inequalities. It is already acknowledged that the

192
privatisation of some services in Argentina has brought some difficulties for the poorest households. This is because of an increment in tariff levels and because the companies have less profit (hence less interest) in the areas where this social group is localised (DNPH, 2000, p. 11). The persistence of large sectors in Rosario without sewage connections confirms that “the private sector is unable or unwilling to take the risk of large‐scale and/or long‐term investments” (Werna, 2001, p. 28). As described in Section 2.3, this unwillingness of the private sector can be related to processes of social exclusion concerning territories and the new logics of globalisation where “areas that are non‐valuable from the perspective of informational capitalism, are bypassed by flows of wealth and information” (Castells, 1999, p. 74).
Through analysing the change in the different inequality aspects, it can be concluded that between 1991 and 2001 the gap between best‐off and worst‐off areas remained the same, and in certain aspects such as unemployment the situation has worsened, which confirms the perceptions of the policy makers (Chapter 5). The increase in inadequate housing in the city centre (pensions), together with a loss of population in the better‐off areas and an increase in population in worse‐off areas should be a warning sign to policy makers. Therefore, this research encourages the use of area‐based policies, but without omitting the targeting of the “new areas of need” that might appear in the city centre (traditionally the best‐off area) and that are averaged out by being located in wealthy areas. In this respect, the use of expressed need can help in identifying where individual need is concentrated. Clearly, administrative data together with GIS and its geocoding capabilities offer a good response.
The analysis of the correlation between the different indicators shows how the different aspects of inequalities correlate and how some areas are multiply deprived. In this respect, it can be concluded that there is a concentration and coexistence of problems in specific areas of Rosario. Owing to this characteristic of the inequality problem and the capacity of GIS‐based indicators to analyse it, the approach proposed to target, prioritise and redistribute compensatory resources among the most deprived neighbourhood areas can be of help to policy makers. This illustration is presented in the context of area‐based policies and participatory budgeting. Although consensus and a more democratic approach in the elaboration of the budget are being reached through participatory budgeting, GIS‐based indicators can still help in adding a spatial dimension to the budget allocation process. The connection between indicators and policy and the value of the participation of decision makers indicates how important it is to let policy makers fine‐tune some aspects of the prioritisation of neighbourhood areas. In this context, issues such as where to establish the cutoff point between best‐off and worst‐off neighbourhood areas and how many to target remain subject to their final decision.
Some advantages of GIS in constructing indicators emerge from this analysis. To operationalise indicators, it is necessary to organise data, to quantify and to communicate. In this particular case, it was possible to integrate different data sources such as census and administrative data, to quantify needs and analyse the gaps between best‐off and worst‐off areas, and to generate maps to communicate and detect problem areas.

193
Chapter 8 Conclusions and recommendations The aim of this chapter is to state the main contributions of this research and to revisit the findings in relation to the theory and practice. This chapter also suggests further research implications and recommendations, taking into account some questions and limitations that arise from the present study.
8.1 Conclusions The main objective of this research is to develop a methodology that combines the use of urban indicators and GIS as a valid diagnostic and prescriptive tool to generate policy‐relevant information on the complex and multidimensional aspects of spatial inequalities.
The coming subsections discuss the answers to the research questions introduced in Chapter 2. Subsection 8.1.1 examines what has been learned from the application of the methodology in the case study of Rosario and the role of GIS and indicators. Subsection 8.1.2 focuses on the inequality problem characteristics of Rosario. Section 8.2 presents some recommendations that are triggered by the case studies in Rosario and Liverpool in particular. Furthermore, it discusses what can be done in future research to further the knowledge acquired in this study.
8.1.1 GIS-based indicators: monitoring intra-urban inequalities The first question of this research is: Which aspects of inequality do policy makers find more relevant? In which part of the policy cycle have they been using indicators and when would they like to use them in the future?
To answer this complex question, it was necessary to analyse the policy context of Rosario (Chapter 4) and carry out a series of interviews with policy makers (Chapter 5). The findings of these interviews show that there is a clear demand for the use of a tool that can help in monitoring intra‐urban inequalities and reallocating resources to compensate for disparities. Owing to the decentralisation and participatory budgeting process taking place in the Municipality of Rosario, it was found that the GIS‐based indicators could not only be introduced as a descriptive tool in the diagnostic and problem identification phase of the policy cycle but also be used as a prescriptive tool to reallocate resources in a fairer way. As expected, the multidimensional characteristics of inequalities are reflected in the inequality aspects that policy makers value most, overcrowding being the most relevant one.
At the same time, it was important to complement these findings by studying a city with a longer tradition in the use of indicators and the application of remedy policies. Therefore it was relevant to ask: Which aspects of inequalities and indicator‐related issues emerge in a city with experience in both indicators and area‐based policies? And What problems related to the use of indicators might appear?

194
The explanation for the more intense and structural use of indicators in Liverpool can be found in the policy context described in Chapter 4 and Section 5.13. This research found that the relevance of indicators is equally important for both Rosario and Liverpool. In the case of Rosario, this can be explained by the external demand from donor agencies (e.g. IADB) and the intention of the local government to equalise the six districts. In the case of Liverpool, the role of the national government is crucial in the demand for targeting deprived areas and reducing uneven geographies. The ranking of deprived neighbourhoods and the application of area‐based policies and strategic cluster partnerships can be seen as good practices to tackle intra‐urban inequalities. The role of the national government also explains why in the case of Liverpool indicators are more widely used and embedded than in Rosario. In this respect, the importance of indicators is clearly seen in Liverpool, as they are considered the best option in the “fight for money” and in arguing for resources. Findings of the comparative case study in Liverpool, such as the setting of national targets and the reallocation of resources favouring deprived neighbourhoods, positively influenced the development of the proposed methodology and the elaboration of recommendations, which are discussed further in Section 8.2.
The second question of this research is: What set of indicators is valid for describing spatial inequality within urban areas?
To answer this question, it is necessary to conceptualise inequalities (Chapter 2) and consider aspects suggested both in the literature and by existing urban indicators initiatives (Section 3.4). The answers and findings from the first research question are very relevant to this one, since the resulting list of inequality aspects are refined by the interviews with policy makers (Chapter 5). Finally, in Chapter 6 a set of indicators is proposed in the form of a matrix. This matrix is able to mirror the multidimensional aspects of the phenomenon and to reflect both its socio‐economic and physical aspects in the quality‐of‐life conditions, as well as the distribution of opportunities and accessibility. Consultation with policy makers is also relevant to the refinement of inequality aspects and consequent selection of indicators. From this research and previous experience, it is also recommended that the final indicators matrix should include between 10 and 15 indicators. A larger number of indicators might exceed updating capacity and, more importantly, would cause a data/information overload among policy makers.
A sub‐question is: What are the current data needs, sources and gaps? This aspect is discussed in subsection 6.2.2. The lack of small‐area data other
than census data should encourage the use and geocoding of administrative data. However, administrative data are not always readily available and accessibility can be restricted ‒ a problem encountered in this research. The lack of continuity in the collection of administrative data might represent a problem for the monitoring of inequality over time.
The collection of new primary data especially for the construction of indicators might in the long‐term be difficult to sustain. This is particularly sensitive if it is intended to monitor the change in inequality over a period of time with the same set of indicators. Today the local government might have resources to collect primary data but there is no guarantee that it will in the future.

195
Another part of this question is: In what way is it possible to combine the different aspects of inequality into composite indices. In this research, it is proposed to use both factor analysis and a composite index of inequalities to detect different social areas and to determine the overlap of multiple aspects of inequality in the same geographical area. Individual indicators are better understood by policy makers and can give a clear picture of the aspect they measure (e.g. percentage of households without tap water in the house). Policy and decision makers then know what concrete problems to address, and that was also stressed by the interviewees. During the interviews, both in Rosario and Liverpool, policy makers expressed doubts about the usefulness of indices and, in particular, how changes in one component might be cancelled out by another without giving a specific indication of what aspect of inequality to address. On the other hand, the success of the implementation of area‐based policies resides in their capacity to address the concentration of overlapping and interacting problems. For this reason, the use of the index of inequalities proposed in this study is a good tool for detecting a concentration of problems and deciding whether to apply area‐based policies or not.
One sub‐question that has to be further addressed in future research is: How might values influence the operationalisation of indices. This research proposes an index with an equal weight of aspects; however, it is reasonable to think that different policy makers and administrations might value one aspect more than another, based on their own set of values. Not only personal values but also values related to a particular political orientation/ideology might influence the perspective on the problem. After the return of democracy to Argentina and since 1989, Rosario has had a series of continuous social‐democratic administrations115 (Socialist Party, PS) and it is considered one of the most socially progressive cities in the MERCOSUR area (Westendorff, 2002). However, it would be interesting to explore in further research how a different political orientation might change perception on the most relevant aspects of inequalities and the way spatial inequality is addressed (if addressed at all).
The third question of this research is: How can the methodology to monitor spatial inequality at the local level be improved by the combined use of GIS, urban indicators and other specific methods in order to better understand the multidimensional aspects of the phenomenon? How can inequalities or gaps be communicated and made visible?
Studies of patterns of inequality and the use of indicators for accessibility analysis have a tradition dating back many decades (Smith, 1973; Talen, 1998). The use of social indicators at sub‐city level can even be traced back to the beginning of the 20th century (Booth, 1902, in Pacione, 2001). However, some authors recognise that few studies have tried to develop GIS‐based indicators to analyse, for example, the quality of life at neighbourhood scale (Ghose and Huxhold, 2002). Usually indicators are collected at global, national and city levels but not disaggregated at district neighbourhood level. In Chapter 7, a methodology is applied that demonstrates how spatial inequality can be monitored at intra‐urban level with the combined use of GIS and urban indicators. The indicators matrix selected helped to depict the multidimensional aspects of the phenomenon. The approach chosen to monitor intra‐urban inequalities with GIS‐based
115 And in the case of the UK, area‐based policies and the use of indicators and targets were mostly introduced under the New Labour administration.

196
indicators consisted of a methodology that took policy makers into consideration in the selection of indicators and scale issues in the monitoring of gaps.
The use of GIS clearly facilitated the construction of indicators from census block group data. Some advantages of GIS in constructing indicators emerged from this study. To operationalise indicators, it is necessary to organise data, to quantify and to communicate. In this case, it is possible to integrate different data sources such as census and administrative data, to quantify needs and analyse the gaps between best‐off and worst‐off areas, and to generate maps to communicate and detect problem areas. The multilevel analysis of inequality at city, district and neighbourhood levels proved to be useful for describing gaps and making them visible. Another strong GIS capability is found in the construction of expressed need indicators. The inclusion of expressed need, calculated after geocoding administrative data, proved to be useful in detecting deprived households “hidden” in better‐off areas. The inclusion in the indicators matrix of accessibility indicators is also possible using GIS.
8.1.2 Intra-urban inequality aspects: understanding spatial inequality The fourth question of this research is: What are the circumstances and the processes behind increasing, decreasing and/or consolidating spatial inequalities as measured by indicators over a period of time?
This is an ambitious question to which this study can contribute a partial answer, and one that will certainly provoke further research questions. The analysis in Chapter 7 shows that correlation between certain aspects of inequalities is clearly present (e.g. between overcrowding, unemployment and low education level). This study shows that overcrowding is an indicator that correlates with most other aspects of inequality and might be used to predict other inequality aspects. However, taking into account the implications in practice, this finding does not necessarily mean that the construction of new housing and the improvement of housing in slum areas guarantee that other aspects of inequalities will improve because overcrowding has been reduced. Only the coordinated actions of different local government departments through area‐based policies can address the multidimensional aspects of inequalities. According to the interviews, both in Rosario and Liverpool, education and employment are very relevant aspects of inequality. This might be explained by the shared idea that economic and other disparities can be levelled through better education, skills and employment.
With regard to the period analysed in this study (1991‐2001), it can be observed that in Rosario the gaps between different districts and between different neighbourhood areas remain, with a worsening situation in unemployment and health coverage affecting the worse‐off areas in particular. This indicator, which is very sensitive to economic changes, clearly reflects the economic crisis that affected Argentina. The increase in unemployment inequalities and the correlation with other quality‐of‐life aspects such as overcrowding and health coverage explain that, through income deprivation resulting from unemployment, families are unable to live in a suitable dwelling or afford certain services. The incapacity to pay for health insurance makes them more vulnerable ‒ a vulnerability that is enhanced by the lack of basic infrastructure such as sewage.
This study shows that Rosario has a clear socio‐spatial differentiation and polarisation. It is a dual or divided city with a better‐off core and axes and a worst‐off

197
periphery. The district Oeste clearly stands out as the worst‐off district and the district Centro as the best‐off. The inequalities between the districts and within their neighbourhood areas are marked in every aspect that is considered. However, in terms of the distribution of opportunities, and the accessibility to social infrastructure in particular, a “socially progressive pattern” is found, favouring worst‐off areas. As demonstrated in Chapter 7, the distribution of opportunities seems to favour the worst‐off households: the unemployed, lowly educated and health‐vulnerable. In that sense and following the concepts discussed in Chapter 2 about social justice and equality, this is an example of a compensatory action that follows proportional equality based on need.
The analysis of the correlation between the different indicators shows how the different aspects of inequalities correlate and how some areas are multiply deprived. In this respect, the research has found a concentration and coexistence of problems in specific areas of Rosario. Why some neighbourhoods have evolved positively (reduction in inequalities) and others negatively (increase in inequalities) is a question that this research cannot answer. Better monitoring and knowledge of the geographical allocation of policies and resources might help to shed some light on this question.
This study observes that some macro structures related to globalisation (e.g. privatisation of services) somehow limit the equalising power of the local government, and this is reflected in the negative change in indicators such as unemployment or sewage network availability. On the other hand, at a local level, new urban management tools such as decentralisation and participatory budgeting seem to be able to act through compensatory policies in favour of providing a better distribution of opportunities such as social infrastructure. A macro‐micro model116 to further analyse spatial inequality at intra‐city level can be proposed (Figure 8.1). This research suggests that globalisation (and its effects at national and local scales) has a geographical outcome, which is spatial inequality (in different domains). The macro level structures influence at micro level the distribution of resources, generating unequal conditions in both the physical and the social environment. Furthermore, this restricts the individual capacity of (some) citizens to choose, access and move to a better neighbourhood or improve their quality of life; and the capacity of local governments to reduce gaps and reconcile undesirable differences. The outcome of this is spatial inequality; it can be expressed in terms of residential segregation, deprivation, social exclusion, and different levels of quality of life. In this proposed model, it is suggested that local governments and citizens might have limited capabilities to improve inequalities.
At macro level, certain policies such as the privatisation of infrastructures such as sewage and water provision might have an effect on the unequal conditions of the quality of life. Income and redistributive policies are also determined at national level, which at the same time are influenced by globalisation issues. Employment level or education level can hardly be influenced locally but access to health services clearly can
116 According to Coleman’s (1990) macro‐micro thesis, the analysis of relations between macro‐level phenomena is central to social sciences. “The explanation of macro‐level relations requires the specification of a behavioural mechanism at the micro level and the transformation of micro level outcomes back to the macro level” (Groenewegen, 1997).

198
be improved locally, and area‐based policies can address problems that overlap in space in identifiable geographical areas.
While some indicators can be used by the local government to target areas or provide new services, still others can be used to communicate and make inequality problems visible and eventually exert pressure/lobby at provincial or national level.
( STRUCTURES ) ( OUTCOMES )
( CONDITIONS/ RESOURCES ) ( RESPONSES / INDIVIDUAL BEHAVIOUR )
NATIONAL:PrivatisationDeregulation
Social (e.g. education, employment)
SPATIAL INEQUALITY
Physical (e.g. housing, infrastructure)
to access
to choose
Individuals Local Governments
to reduce gaps
to equaliseto move
UNEQUAL OPPORTUNITIES / CAPACITY
Deprivation
Social exclusion
Residential segregation
Unequal levels of quality of life
(MIC
RO
)(M
AC
RO
)
GLOBALISATION effects
UNEQUAL CONDITIONS
LOCAL / City level:DecentralisationEqualising willArea-based policiesParticipatory Budget
Figure 8.1 A proposed macro‐micro model of spatial intra‐urban inequalities
8.1.3 Relevance of GIS-based indicators in the local planning context Throughout this research, it was considered that the proposed methods should be feasible and relevant within the local urban planning and policy context of Rosario. The direct link between indicators and local policy is a prerequisite learned from the problems faced by the early social indicators movement in the 1960s. The interviews with policy makers suggest that the implementation of monitoring studies and the use of indicators are very relevant to the local planning context. The inclusion of the policy makers’ perspective on inequality aspects in the selection of indicators and the incorporation of the prescriptive component within the local participatory budget (Section 7.5) are attempts to make the implementation of this methodology feasible within the local context.
The interviews indicate that the demand for studies of this sort and the use of indicators is greatly influenced by the requirements of donor agencies such as the Inter‐American Development Bank. Some characteristics of area‐based policies can be seen in programmes such as Rosario Hábitat, and a more just budget allocation is also found in the participatory budgeting approach. These two examples show that there is enough opportunity for the implementation of studies of this type.
The implementation of this methodology, as well as the use of indicators for any other purpose, within the local planning system will also depend on strong commitment and support from the executive department of the municipality. In the following

199
sections, some recommendations are given that can improve the application of GIS‐based indicators and embed them in the local policy making.
8.2 Recommendations for policy makers and further research
8.2.1 Embedding GIS-based indicators in policy making Throughout this research, it has been demonstrated that GIS‐based indicators can be of help in monitoring intra‐urban inequalities. A multiplicity of inequality aspects coincide in space, which is a good reason for the application of area‐based policies and compensatory efforts from different local government departments. As seen in Section 2.2 and in the interviews carried out in Liverpool (Chapter 5), it is suggested that area‐based policies should be characterised by cross‐sectoral and concerted interventions. Therefore, GIS is an ideal platform to share indicators and data between offices in a more efficient way. Both GIS and indicators can be embedded in policy making (one will necessarily bring the other). To guarantee this, some actions with institutional and technical implications should be considered.
A recommendation that is related to better governance117 is the inclusion of policy makers in the selection and evaluation of indicators, as well as the communication of indicators to citizens before and after the application of area‐based policies. Then, policy makers can show the success of their policy and citizens can visualise the accountability of the local administration and claim better solutions. As seen from the interviews in Liverpool (Chapter 5), setting specific quantitative targets in reducing every inequality aspect and evaluating their fulfilment would be a good tool to increase accountability and evaluate policy success. In this respect, the use of indicators will be included within the whole policy cycle: from problem definition and policy formulation to implementation and policy evaluation.
Another recommendation, related to institutional aspects such as capacity building, is that staff should be trained in the use of GIS and indicators and a key person or leader within every secretariat/partner should be made responsible for their updating and maintenance. In the case of area‐based initiatives, the different actors and partners should agree on the exchange of data and the common use of indicators.
Considering that the lack of data ‒ of small‐area data in particular ‒ is usually a problem, a direct commitment from different municipality departments to share data would be necessary if duplication of efforts is to be avoided. Here, the experience of Liverpool in creating both an information platform (Section 4.8) and a GeoData Team (Section 5.12) is valuable. This increment in data exchange between partners generates the problem of different administrative boundary definitions, as shown during the interviews in Liverpool. To overcome this in Rosario, it is recommended that the census data should be provided by INDEC aggregated at block level rather than at block group level. Furthermore, better coordination between the national, provincial and local departments in charge of producing statistical data is recommended. A discussion on different boundary issues should recognise this problem and generate a starting point
117 Better governance implies that policy makers and the public sector are aware of the needs and differences within the civil society. Transparency, information and equity can be encouraged by introducing monitoring systems and indicators to reduce intra‐urban inequalities.

200
for finding a solution118. Census data and administrative data remain for Argentina the main sources of small‐area data, as discussed in subsection 6.2.2. This research suggests that one of the aspects that can be considered for further research is how to improve the generation of affordable and reliable small‐area data that can be accessible to local governments.
Beyond this, it is necessary to improve the provision and management of small‐area information. Therefore, better coordination between municipality departments is necessary to generate consistent administrative data that are suitable both for the construction of indicators and for the generation of geographical data. In the case of administrative data, as presented in subsection 6.2.2, better quality control and the standardisation of street naming and addresses in every department of the municipality are recommended. The use of the National Gazetteer referred to in Liverpool (Section 5.12) might be a means of ensuring the quality of the data, with a unique reference code for each address. Recent GIS software such as ArcGIS includes metadata capabilities that can also facilitate a systematic and sustainable use of indicators over time. Monitoring inequalities and detecting trends require the updating of data coming from different data sources, and metadata facilities can help in managing the accumulated data in a systematic way.
8.2.2 Implications in theory, and policy-practice: expressed and derived need approach
During the 1980s and 1990s, and coinciding with the New Right governments in the UK and in the USA, reduction in government expenditure undermined the welfare state (Pacione, 2001). The removal of state interference in the market was seen as allowing private initiative, the acceptance of inequality, and the adoption of self‐help (Joseph and Sumption, 1979, in Pacione, 2001). In many developing countries, there was a dissemination of ideologies that put free market and reduced state intervention on the agenda (Devas, 1993). Urban poverty and inequality became particularly problematic in countries such as Argentina, which has undergone macroeconomic adjustments.
Latin American countries have the world’s highest income inequality (UNDP, 2001, p. 17). Since the late 1990s, there has been a growing awareness among policy makers in the region of the problems that these policies have caused for the most disadvantaged. For example, the Charter of Porto Alegre (Westendorff, 2002) was signed in January 2001 by more than 50 mayors from South America and the agreement on social cohesion was signed in May 2001 by the mayors of Montevideo (Uruguay), Belo Horizonte, Porto Alegre, Sao Paulo (Brazil) and Buenos Aires and Rosario (Argentina). While claiming a failure of the neo‐liberal policies in Latin America during the 1980s and 1990s, they specifically addressed the importance of local government to promote social cohesion and reduce inequalities.
Ideally, a combination of a strong welfare state redistributive system and area‐targeting can better reduce intra‐urban inequalities. Musterd and Murie (2001) consider
118 Although there is no metropolitan administration, but considering that during the 1990s there was an increase of gated communities in municipalities close to Rosario, it might be necessary to consider the whole metropolitan area as the relevant study area. Because of the direct link between indicators and policy in this research, it was decided to limit the research area to the local administrative boundary of Rosario.

201
that area targeting alone might not be as effective as a strong welfare state redistributive system. Nevertheless, area‐targeting still carries a strong social justice perspective and might be the way for local authorities to respond to the inequality problem. In this respect, area‐based policies do have a clear vision of what the city should be and they implement redistribution or compensatory actions to reach that goal. The vision can be of a complete city as opposed to the dual‐city (as in the Dutch Big Cities Policy119); a vision of a country where no‐one should be seriously disadvantaged by where they live (as in the British New Commitment to Neighbourhood Renewal120); or a local strategic vision of a city with opportunities for life and progress for all its inhabitants (as in the Strategic Plan of the city of Rosario, Argentina121).
Whatever the ideology adopted, policy making implies a process that involves choices about goals and criteria, strategies and actions, leading to a later conflict between the losers and winners in these actions (Devas and Rakodi, 1993). For this reason, there is also the need to evaluate and monitor the impact of policies, in particular to see how dissimilar the different neighbourhoods in a city become.
This research addresses spatial inequality through budget redistribution with a geographical component. A social justice perspective (fairness in distribution), with proportional equality based on needs is considered. As discussed in Chapter 2, social justice is a normative perspective concerned with what should be, and with the question of who gets what where and how, and more precisely who should get what where and how (Smith, 1977; Smith, 1994). As a result of this research, the use of both derived and expressed need can be suggested. This is particularly sensitive if area‐based and people‐based policies have to be implemented. While derived need via individual indicators and an index of inequalities can catch the concentrated and predominant aspects of inequality, the expressed need can depict the individual cases that are in need and might be “hidden” in a well‐off area. The ecological fallacy of area‐based policies can then be overcome. In other words, while area‐based policies consider a multidimensional approach, the inclusion of expressed need can help to detect those individuals that might be left out from compensatory policies based on geographical areas. As an example, the increase in inadequate housing (pensions) in the city centre of Rosario, together with a loss of population in the better‐off areas and an increase in population in worse‐off areas, should be a warning sign to policy makers. This study encourages the application of area‐based policies, but without omitting to target the “new areas of need” that might appear in the city centre (traditionally the best‐off area) and that are averaged out by being located in wealthy areas. In this respect, the use of expressed need can help in identifying where individual need is concentrated. Clearly, administrative data together with GIS and its geocoding capabilities offer a good response to that.
If the deprived areas obtained in this research are compared with those obtained by mapping pockets of poverty using remote sensing and satellite imagery (Hall et al., 2001), it is worth noting that some deprived areas do not show up when exclusively using remote sensing and the physical aspects of the house. Individual cases “hidden” in a well‐off area or socio‐economic aspects such as unemployment are
119 See p. 17. 120 This policy is discussed on p. 75. 121 This policy is discussed on p. 53.

202
certainly not captured by remote sensing techniques. Furthermore, since poverty in Argentina has grown particularly in the middle‐class neighbourhoods, it should not be considered that poverty is restricted to specific, clearly defined areas such as villas (slum areas); rather it is a phenomenon that crosses neighbourhoods (Prevot Schapira, 2002). Having said that, the use of high spatial resolution imagery could be a strategy to follow up the change in slum areas in Rosario, and during the inter‐census gaps in particular.
The use in this research of the expressed need and derived need approach is an example of how administrative data can be incorporated in the analysis of inequalities. In the same way, expressed income deprivation can be calculated per year and per neighbourhood area or district. The administrative data can be obtained from the income support benefits list from the Social Welfare Department (Plan Jefes de Hogar). In this respect, it is remarkable that in 2004 almost 5,000 beneficiaries were already listed for the district Centro (which appears as the best‐off from other derived need indicators) (Dezorzi and Bazzoni, 2004).
It is also important to point out that indicators reflect only one part of the reality and that their results should not been overvalued. This research is not uncritical of the use of indicators. No set of indicators can show the richness and diversity of reality. Apart from the problems mentioned already, such as the under‐reporting of crime, there are aspects such as the informal economy which are difficult to depict. In the case of Liverpool, for example, the informal economy might not be fully reflected by indicators or registered by the statistics. As already mentioned, there are some limitations in the implementation of indicators. They can be time‐consuming and discouraging for policy makers if different initiatives overlap, resulting in an overload of indicators. The value of local knowledge and qualitative analysis are clearly important to complement indicators and especially for internal and local use. However, indicators are still the best option for the allocation of resources or for “external” consumption (e.g. funding agencies, higher levels of government).
The impact of using indicators to target areas, allocate resources and apply area‐based policies should be evaluated in following studies. Both positive and negative externalities should be taken into account. Some questions arise for further research in relation to whether the use of indicators improves the implementation of targeting/area‐based policies or not. Do they have a real impact on the quality of life in deprived areas? What is the impact of allocating extra resources to a targeted area? Do better indicators produce better policies resulting in a better quality of life and less unequal cities?
8.3 Final remarks Since the Agenda 21 declaration, the reduction of inequalities and disparities within cities has been constantly mentioned as important for sustainable development (United Nations, 1992b; European Commission, DG XI (1994), in Mega, 1996; UNCHS, 2001). Spatial inequality occurs in urban areas around the world. However, inequalities in habitat conditions or access to social and physical infrastructure are particularly evident in cities in developing countries. In these cities, problems concentrate in certain areas, affecting the quality of life of those living in the area. At the same time, local governments are encouraged to target these deprived areas. Recently, different urban indicators initiatives and governmental reports have expressed the need to use small‐area information, while at the same time encouraging the study of these intra‐urban

203
differences (Policy Action Team 18, 2000; UNCHS, 2000a). However, many cities suffer from an information crisis that undermines their capacity to develop effective urban policy (Moor, 2000). These cities do not have a sustained or systematic approach to assessing the urban problems and cannot evaluate the success of the implemented policies. Urban indicators are seen as a tool that can improve this situation (Moor, 2000). There is also recognition that GIS can be used for the collection and analysis of urban indicators.
The fact that for the first time, during the year 2000, Argentinean cities – including Rosario – participated in the UN‐HABITAT Urban Indicators Programme and that many cities in the region are implementing indicators systems122; shows that there is a growing demand for monitoring tools and the use of indicators. The major group of stakeholders that may benefit from the use of GIS‐based indicators includes not only policy makers but also residents, commercial and business organisations, NGOs or CBOs and external support agencies (adapted from UNCHS, 1995, p. 22).
This study intends to help in the application of remedy policies by better understanding inequalities and better targeting resources. Remedy policies and urban planning actions would reduce spatial inequality and result in a more sustainable urban environment, since it is agreed that social equity is a precondition for the achievement of sustainability. Inequitable distribution of wealth both causes unsustainable behaviour and makes it harder to change (Mega, 1995). The declaration resulting from the 1992 Rio Earth Summit, which established Agenda 21, particularly mentions in its fifth principle the importance of reducing inequalities for sustainable development:
“All States and all people shall cooperate in the essential task of eradicating poverty as an indispensable requirement for sustainable development, in order to decrease the disparities in standards of living and better meet the needs of the majority of the people of the world” (United Nations, 1992b, Principle 5).
Chapter 4 of Agenda 21 (“Information for decision‐making“) specifically promotes the use of information and indicators, and in Chapter 3 the importance of targeting areas is also emphasised:
“3.9. Governments should improve the collection of information on target groups and target areas in order to facilitate the design of focused programmes and activities, consistent with the target‐group needs and aspirations” (United Nations, 1992a).
Reducing aspects of inequality between countries, regions, cities and neighbourhoods will remain a challenge for the next generations. Most probably it will remain an ideal or be denied by many others, but recognition of the negative effects of inequality on issues such as quality of life, social cohesion and security cannot be ignored. This research has tried to shed some light on the intra‐urban inequalities and provide some tools for monitoring and hopefully helping to reduce them. 122 In Brazil the UNDP produced the Atlas of Human Development by disaggregating the human development index at local level (see Box 5.9 in UNDP, 2000).


205
Bibliography Abrahamson, P., 1997. Combating poverty and social exclusion in Europe. In: W. Beck,
L.v.d. Maesen and A. Walker (Editors), The Social Quality of Europe. Kluwer Law International, The Hague, pp. 127‐155.
Accordino, J. and Rugg, R., 2000. The Richmond Neighbourhood Indicators Project. URISA 2000 Annual Conference, Orlando, Florida.
Adriaanse, A., 1997. Environmental information management for use at the national level. In: T. Deelstra and D. Boyd (Editors), Indicators for Sustainable Urban Development. The International Institute for the Urban Environment, Delft, pp. 109‐123.
Amorós, M., 1995. Decentralisation and New Governance: A Comparison between Barcelona and Birmingham. Working Paper 110, Universitat Autònoma de Barcelona, Barcelona.
Andersen, H.T. and van Kempen, R., 2003. New trends in urban policies in Europe: evidence from the Netherlands and Denmark. Cities, 20(2): 77‐86.
Atkinson, R., 2000. Combating social exclusion in Europe: the new urban policy challenge. Urban Studies, 37(5‐6): 1037‐1055.
Batley, R., 1993. Political control of urban planning and management. In: N. Devas and C. Rakodi (Editors), Managing Fast Growing Cities: New Approaches to Urban Planning and Management in the Developing World. Longman, Harlow, pp. 176‐206.
Bergström, S., 1997. Sustainable development management. In: T. Deelstra and D. Boyd (Editors), Indicators for Sustainable Urban Development. The International Institute for the Urban Environment, Delft, pp. 197‐222.
Bessis, S., 1995. From social exclusion to social cohesion: towards a policy agenda. MOST ‐ UNESCO, Copenhagen.
Bifarello, M., 2000. Public‐Third Sector Partnerships: A Major Innovation in Argentinean Social Policy. Fourth Conference of the International Society for Third‐Sector Research, Dublin, Ireland.
Bifarello, M., 2005. Una ciudad participativa y eficaz. Derecho a un estado municipal transparente y cercano a la gente. In: Municipalidad de Rosario ‐ UNDP (Editor), Experiencia Rosario. Políticas para la Gobernabilidad. Municipalidad de Rosario ‐ UNDP, Rosario, pp. 63‐124.
Borgegård, L.‐E., Anderson, E. and Hjort, S., 1998. The divided city? Socio‐economic changes in Stockholm metropolitan area, 1970‐94. In: S. Musterd and W. Ostendorf (Editors), Urban Segregation and the Welfare State. Inequality and Exclusion in Western Cities. Routledge, London, pp. 206‐221.
Borja, J., 1996. Descentralización y Participación en la Gestión Local, Programa de Descentralización y Modernización. Municipalidad de Rosario, Rosario.
Borja, J. and Castells, M., 1997. Local and Global: The Management of Cities in the Information Age. Earthscan, London.
Botman, S. and van Kempen, R., 2002. Improving Dutch neighbourhoods: Tarwewijk and Hoogvliet in Rotterdam. In: C. Kesteloot (Editor), The Spatial Dimensions of

206
Urban Social Exclusion and Integration. URBEX Series, No. 21, Amsterdam, pp. 78‐86.
Bragos, O., Mateos, A. and Pontoni, S., 2001. Social and Spatial Segregation in Rosario West Side Expansion. 37th International ISOCARP Congress, Utrecht, The Netherlands.
Broadway, M.J. and Jesty, G., 1998. Are Canadian inner cities becoming more dissimilar? An analysis of urban deprivation indicators. Urban Studies, 35(9): 1423‐1438.
Brown, P., 1991. Exploring geodemographics. In: I. Masser and M.J. Blakemore (Editors), Handling Geographical Information: Methodology and Potential Applications. Longman Scientific & Technical, Harlow, pp. 221‐258.
Brown, P., Hirschfield, A. and Batey, P., 1991. Applications of geodemographic methods in the analysis of health condition incidence data. Papers in Regional Science, 70(3): 329‐344.
Brown, P., Hirschfield, A. and Batey, P., 2000. Adding value to census data: public sector applications of super profiles geodemographic typology. Journal of Cities and Regions, X: 19‐32.
Burgers, J., 1996. No polarisation in Dutch cities? Inequality in a corporatist country. Urban Studies, 33(1): 99‐105.
Castells, M., 1996. The Information Age: Economy, Society and Culture: Vol. I The Rise of the Network Society, 1. Blackwell, Oxford.
Castells, M., 1999. The Information Age: Economy, Society and Culture: Vol. III End Of Millennium, 3. Blackwell, Oxford.
Chakravorty, S., 1996. A measurement of spatial disparity: the case of income inequality. Urban Studies, 33(9): 1671‐1686.
Ciccolella, P., 1999. Globalización y dualización en la Región Metropolitana de Buenos Aires. Grandes inversiones y reestructuración socioterritorial en los años noventa. EURE, xxv(76): 5‐27.
Cities Alliance, 2002. Cities Without Slums. 2002 Annual Report, Cities Alliance, Washington.
City of Liverpool, 2002a. The Liverpool Neighbourhood Renewal Strategy Framework & Action Plan. City of Liverpoolʹs Regeneration Portfolioʹs Regeneration Policy Division, Liverpool.
City of Liverpool, 2002b. Liverpool Neighbourhood Renewal Strategy. Baseline Report, City of Liverpoolʹs Regeneration Portfolioʹs Regeneration Policy Division, Liverpool.
City of Liverpool, 2002c. South Liverpool Partnership. Neighbourhood Renewal Strategy: Cluster Strategy 2002/03. City of Liverpoolʹs Regeneration Portfolioʹs Regeneration Policy Division, Liverpool.
Coleman, J., 1990. Foundations of Social Theory. Harvard University Press, Cambridge, Massachusetts.
Couch, C. and Dennemann, A., 2000. Urban regeneration and sustainable development in Britain. The example of the Liverpool Ropewalks Partnership. Cities, 17(2): 137–147.

207
Couclelis, H., 1999. Spatial information technologies and societal problems. In: M. Craglia and H. Onsrud (Editors), Geographic Information Research: Trans‐Atlantic Perspectives. Taylor and Francis, London, pp. 15‐24.
van Delft, Y., 1997. An introduction to indicators and monitoring. In: T. Deelstra and D. Boyd (Editors), Indicators for Sustainable Urban Development. The International Institute for the Urban Environment, Delft, pp. 74‐79.
Department of the Environment, Transport and the Regions (DETR), 1997. Regeneration Programmes ‐ the Way Forward. Discussion paper, Department of the Environment, Transport and the Regions, London.
Department of the Environment, Transport and the Regions (DETR), 2000a. Explanatory Notes to Local Government Act 2000. Department of the Environment, Transport and the Regions, London.
Department of the Environment, Transport and the Regions (DETR), 2000b. Indices of Deprivation 2000. Department of the Environment, Transport and the Regions, London.
Department of the Environment, Transport and the Regions (DETR), 2000c. Our Towns and Cities: The Future ‐ Full Report. Department of the Environment, Transport and the Regions, London.
Department of the Environment, Transport and the Regions (DETR), 2000d. The State of English Cities. Department of the Environment, Transport and the Regions, London.
Department of the Environment, Transport and the Regions (DETR), 2000e. Urban White Paper. Regional Case Studies: North West. Department of the Environment, Transport and the Regions, London.
Devas, N., 1993. Evolving approaches. In: N. Devas and C. Rakodi (Editors), Managing Fast Growing Cities. New Approaches to Urban Planning and Management in the Developing World. Longman, Harlow, pp. 63‐101.
Devas, N. and Rakodi, C., 1993. Planning and managing urban development. In: N. Devas and C. Rakodi (Editors), Managing Fast Growing Cities. New Approaches to Urban Planning and Management in the Developing World. Longman, Harlow, pp. 41‐62.
Dezorzi, S., 2001. De la villa a la urbanización: un cambio de vida que llega con contradicciones. La Capital, 15 April 2001, Rosario.
Dezorzi, S. and Bazzoni, C., 2004. Pensiones en pleno centro: un lugar donde soledad y pobreza se comparten. La Capital, 25 April 2004, Rosario.
Dieleman, F.M. and Hamnett, C., 1994. Globalisation, regulation and the urban system (Editorsʹ introduction to the special issue). Urban Studies, 31(3): 357‐364.
Dirección General de Estadística (DGE), 2003. Evolución Demográfica Rosario. Dirección General de Estadística. Municipalidad de Rosario.
Dirección Nacional de Políticas Habitacionales (DNPH), 2000. National Report to Estambul+5. Dirección Nacional de Políticas Habitacionales, Buenos Aires.
Economic Commission for Latin America (ECLAC), 2004a. Social Panorama of Latin America 2002‐2003. Economic Commission for Latin America and the Caribbean, Santiago de Chile.

208
Economic Commission for Latin America (ECLAC), 2004b. Social Panorama of Latin America 2004. Economic Commission for Latin America and the Caribbean, Santiago de Chile.
Equipo para el Estudio de la Vivienda (EPEV), 1991. Vivienda Financiada por el Estado en Rosario, 1928 ‐ 1988. Facultad de Arquitectura, Planeamiento y Diseño, Universidad Nacional de Rosario, Rosario.
Equipo para el Estudio de la Vivienda (EPEV), 2001. Vivienda Financiada por el Estado en Rosario 1989/1999. Facultad de Arquitectura Planeamiento y Diseño, Universidad Nacional de Rosario, Rosario.
EURONET, 1997. Environment Planning and Development. The International Council for Local Environmental Initiatives (ICLEI). www.iclei.org.
European Commission, 1998. Non‐Monetary Indicators of Poverty and Social Exclusion. European Commission, Brussels.
European Commission, 2000. Towards a Local Sustainability Profile: European Common Indicators. Expert Group on the Urban Environment, Working Group on Measuring, Monitoring and Evaluation in Local Sustainability, Brussels.
European Communities, 2000. The Urban Audit. Towards the Benchmarking of Quality of Life in 58 European Cities. Volume I: The Yearbook, Luxemburg.
Fundación Banco Municipal, 1996. Asentamientos Irregulares en Rosario 1996. Fundación Banco Municipal, Rosario.
Ghose, R. and Huxhold, W.E., 2002. The role of multi‐scalar GIS‐based indicators studies in formulating neighbourhood planning policy. Journal of URISA, 14(2): 5 ‐17.
Groenewegen, P., 1997. Dealing with micro‐macro relations: a heuristic approach with examples from health services research. In: G.P. Westert and R.N. Verhoeff (Editors), Places and People: Multilevel Modelling in Geographical Research. Royal Dutch Geographical Society [KNAG], Utrecht, pp. 9‐18.
Grothe, M. and Walter, B., 1992. GIS measures elderly housing and neighbourhoods. GIS Europe, September 1992, pp. 20‐24.
Grubert, M., 1997. The urban audit. In: T. Deelstra and D. Boyd (Editors), Indicators for Sustainable Urban Development. The International Institute for the Urban Environment, Delft, pp. 124‐129.
Hall, B. and Conning, A., 1992. Integrating demographic and socio‐economic data with PC‐based GIS in Latin America. GISDECO Seminar, Utrecht, The Netherlands, pp. 87‐102.
Hall, B., Malcolm, N. and Piwowar, J., 2001. Integration of remote sensing and GIS to detect pockets of urban poverty: the case of Rosario, Argentina. Transactions in GIS, 5(3): 235‐253.
Hall, P. and Pfeiffer, U., 2000. Urban Future 21: A Global Agenda for Twenty‐First Century Cities. E&FN Spon, London.
Hall, T., 2001. Urban Geography. Routledge, London. Hamnett, C., 1994. Social polarisation in global cities: theory and evidence. Urban
Studies, 31(3): 401‐424. Hamnett, C., 1996. Why Sassen is wrong: a response to Burgers. Urban Studies, 33(1):
107‐110. Harvey, D., 2000. Spaces of Hope. Edinburgh University Press, Edinburgh.

209
Higginson, S., Walker, P., Terry, A. and Robbins, C., 2003. Making Indicators Count. How to Make Quality of Life Indicators Make a Difference to Quality of Life. New Economics Foundation ‐ Faculty of the Built Environment UWE, Bristol.
Huxhold, W.E., 1991. An Introduction to Urban Geographic Information Systems. Oxford University Press, New York.
Innes, J.E., 1990. Knowledge and Public Policy: The Search for Meaningful Indicators. Transaction Publishers, New Brunswick.
Instituto Nacional de Estadísticas y Censos (INDEC), 1997. Como Se Mide el Desempleo? INDEC, Buenos Aires.
Instituto Nacional de Estadísticas y Censos (INDEC), 2001. Alcances del Secreto Estadístico en el Censo. INDEC, Buenos Aires.
Instituto Nacional de Estadísticas y Censos (INDEC), 2003. Evolución de la Población y Variación Intercensal Absoluta y Relativa: Años 1869‐2001. INDEC, Buenos Aires.
Inter‐American Development Bank, 2004. Programa Rosario Hábitat ‐ Programa Integral de Recuperación de Asentamientos Irregulares (Ar‐0262).
International Labour Organization (ILO), 2004. Programa de Empleabilidad Juvenil. Observatorio de Experiencias, Centro Interamericano de Investigación y Documentación sobre Formación Profesional, ILO, Montevideo.
Janssen, R., van Herwijnen, M. and Beinat, E., 2000. DEFINITE Handout. Institute for Environmental Studies of the Free University of Amsterdam, Amsterdam.
Kearns, A., Gibb, K. and Mackay, D., 2000. Area deprivation in Scotland: a new assessment. Urban Studies, 37(9): 1535‐1559.
Kingsley, T.G., 1999. Building and Operating Neighbourhood Indicator Systems: A Guidebook, National Neighbourhood Indicators Partnership. The Urban Institute, Washington.
Knox, P., 1982. Urban Social Geography. Longman, New York. Knox, P., 1989. The vulnerable, the disadvantaged, and the victimized: who they are and
where they live. In: D.T. Herbert and D.M. Smith (Editors), Social Problems and the City. Oxford University Press, Oxford, pp. 32‐47.
Knox, P. and Pinch, S., 2000. Urban Social Geography: An Introduction. Prentice Hall, Harlow.
Kruythoff, H., Baart, B., van Bogerijen, W. and Priemus, H., 1997. Towards Undivided Cities in Western Europe: New Challenges for Urban Policy. Part 1 The Hague. Delft University Press, Delft.
Kruythoff, H., 1998. Segregation diagnostics, antisegregation remedies, six European case‐studies reviewed. In: H. Priemus, R. van Kempen and S. Musterd (Editors), Towards Undivided Cities in Western Europe. New Challenges for Urban Policy. Part 7 Comparative Analysis. Delft University Press, Delft, pp. 51‐94.
Kunzmann, K.R., 1998. Planning for spatial equity in Europe. International Planning Studies, 3(1): 101‐120.
Kwan, M.‐P., Murray, A.T., O’Kelly, M.E. and Tiefelsdorf, M., 2003. Recent advances in accessibility research: representation, methodology and applications. Journal of Geographical Systems, 5: 129‐138.

210
La Capital, 2004. Advierten que los barrios sin red cloacal corren más riesgos sanitarios. La Capital, 18 June 2004, Rosario.
Langlois, A. and Kitchen, P., 2001. Identifying and measuring dimensions of urban deprivation in Montreal: an analysis of the 1996 census data. Urban Studies, 38(1): 119‐139.
Liverpool Partnership Group, 2002. Liverpool First ‐ (2002‐2005) Workbook. Our Community Strategy, Liverpool Partnership Group, Liverpool.
Liverpool Vision, 2000. Liverpool Vision. Strategic Regeneration Framework, Liverpool Vision.
Liverpool Vision, 2003. Liverpool Vision recommends its Fourth Grace choice (press release). Liverpool Vision, Liverpool.
Lupton, R., 2004. High Poverty Neighbourhoods in Britain: What’s Changed During the 1990s? Inequality Summer Institute 2004, Multidisciplinary Program in Inequality & Social Policy, John F. Kennedy School of Government. Cambridge.
Maclaren, V.W., 1996. Urban sustainability reporting. Journal American Planning Association, 62(2): 184‐202.
Martín, M.P. and Múgica, M.L., 2001. La sociedad rosarina en el siglo XX: cambios, vida cotidiana y prácticas sociales. In: R. Falcón and M. Stanley (Editors), La Historia de Rosario. Economía y Sociedad. Homo Sapiens, Rosario, pp. 157‐227.
Martinez, J., 2000. Evaluating housing needs with the use of GIS. Habitat International, 24: 501‐515.
Masser, I., 1986. The design and implementation of cross‐national research projects. Some methodological considerations. In: I. Masser and R. Williams (Editors), Learning from Other Countries: The Cross‐national Dimension in Urban Policy‐making. Geo Books, Norwich.
Mega, V., 1995. Sustainability Indicators for European Cities. European Foundation for the Improvement of Working and Living Conditions, OECD/Rennes Conference on Urban Indicators. OECD, Rennes.
Mega, V., 1996. Our city, our future: towards sustainable development in European cities. Environment and Urbanisation, 8(1): 133‐154.
Mega, V. and Pedersen, J., 1998. Urban Sustainability Indicators. European Foundation for the Improvement of Living and Working Conditions, Dublin.
MERCOSUR, 2000. Carta de Buenos Aires sobre Compromiso Social en el Mercosur, Bolivia y Chile. Buenos Aires.
Minujin, A., 1995. Squeezed: the middle‐class in Latin America. Environment and Urbanization, 7(2): 153‐165.
Mitlin, D., Satterthwaite, D. and Stephens, C., 1996. City inequality (Editorsʹ introduction). Environment and Urbanization, 8(2): 3‐7.
Moor, J., 2000. Learning cities. The Global Urban Observatory, Habitat Debate, 6(1). Municipalidad de Rosario, 1996a. Distrito Centro. Situación Actual y Potencialidades.
Municipalidad de Rosario, Rosario. Municipalidad de Rosario, 1996b. Documento Base para la Descentralización de la
Municipalidad de Rosario. Programa de Descentralización y Modernización, Secretaría General de la Municipalidad de Rosario, Rosario.

211
Municipalidad de Rosario, 1997. Rosario, Números de una Ciudad en Crecimiento. Unidad de Información Municipal, Secretaria General, Municipalidad de Rosario, Rosario.
Municipalidad de Rosario, 1998. Programa Crecer. Informe de Gestión 1998, Secretaría de Promoción Social, Municipalidad de Rosario, Rosario.
Municipalidad de Rosario, 1999. Plan Director De Rosario. Bases para el Acuerdo. Tomo 1. Documento Integrado. Secretaria de Planeamiento Urbano, Plan Director, Municipalidad de Rosario, Rosario.
Municipalidad de Rosario, 2002. Presupuesto Participativo en Rosario. Municipalidad de Rosario, Rosario.
Municipalidad de Rosario, 2003. Programa Crecer. Municipalidad de Rosario, Rosario. Musterd, S. and Murie, A., 2001. The Spatial Dimensions of Urban Social Exclusion and
Integration. URBEX Series, No. 20, Amsterdam. Neighbourhood Renewal Unit, 2004. Improving Neighbourhoods Changing Lives.
Bristol’s Neighbourhood Renewal Strategy 2004‐2011. Neighbourhood Renewal Unit, Bristol.
New Economics Foundation, 2000. Prove It! Measuring the Effect of Neighbourhood Renewal on Local People. The New Economics Foundation, London.
Noble, M., 2000. Measuring deprivation at the small area level – beyond the census of population. In: N. Yeates and E. McLaughlin (Editors), Measuring Social Exclusion and Poverty. The Department for Social Development, Belfast, pp. 71‐82.
Office of the Deputy Prime Minister (ODPM), 2000. Government drives forward a better urban future (Press Notice 701). Office of the Deputy Prime Minister, London.
Office of the Deputy Prime Minister (ODPM), 2001. A New Commitment to Neighbourhood Renewal. National Strategy: Action Plan. Social Exclusion Unit, London.
Office of the Deputy Prime Minister (ODPM), 2002. The Development of a Town and City Indicators Database. Office of the Deputy Prime Minister, London.
Office of the Deputy Prime Minister (ODPM), 2004a. Developing a Town and City Indicators Database. ODPM, London.
Office of the Deputy Prime Minister (ODPM), 2004b. The English Indices of Deprivation 2004 (revised). Office of the Deputy Prime Minister, London.
Office of the Deputy Prime Minister (ODPM), 2004c. Making It Happen: Urban Renaissance and Prosperity in Our Core Cities – A Tale of Eight Cities. Office of the Deputy Prime Minister, London.
Office of the Deputy Prime Minister (ODPM), 2005a. Making It Happen in Neighbourhoods: The National Strategy for Neighbourhood Renewal – Four Years On. Office of the Deputy Prime Minister, London.
Office of the Deputy Prime Minister (ODPM), 2005b. State of the Cities: A Progress Report to the Delivering Sustainable Communities Summit. ODPM, London.
Office for National Statistics (ONS), 2003. Profile Liverpool. Census 2001, Office National Statistics, London.
Pacione, M., 1995. The geography of multiple deprivation in the Clydeside conurbation. Tijdschrift voor Economische en Sociale Geografie, 86(5): 407‐425.

212
Pacione, M., 2001. Urban Geography, a Global Perspective. Routledge, London. Pantazis, C. and Gordon, D., 2000. Tackling Inequalities: Where Are We Now and What
Can Be Done? Policy Press, Bristol. Parnell, S. and Poyser, M., 2001. The value of indicators as a tool for local government. In:
S. Parnell, E. Pieterse, M. Swilling and D. Wooldridge (Editors), Developmental Local Government: The South African Experiment. University of Cape Town Press, Cape Town, pp. 259‐270.
Plan Estratégico Rosario (PER), 1998. Plan Estratégico Rosario, Diagnóstico y Formulación. PER y Agencia Española de Cooperación Internacional, Rosario.
Policy Action Team 18, 2000. Report of Policy Action Team 18: Better Information. London.
Prevot Schapira, M.‐F., 2002. Buenos Aires en los años ‘90: metropolización y desigualdades. EURE, 28(85): 31‐50.
Priemus, H., Musterd, S. and van Kempen, R., 1998. Towards Undivided Cities in Western Europe: New Challenges for Urban Policy. Part 7 Comparative Analysis. Delft University Press, Delft.
Ratcliffe, J.H., 2004. Geocoding crime and a first estimate of a minimum acceptable hit rate. International Journal of Geographical Information Systems, 18(1): 61‐72.
Rigotti, A.M., 2001. Los procesos de conformación y expansión urbana. In: R. Falcón and M. Stanley (Editors), La Historia de Rosario. Economía y Sociedad. La Historia de Rosario. Homo Sapiens, Rosario, pp. 283‐294.
Rodriguez‐Jaume, M.J., 2000. Modelos Sociodemográficos: Atlas Social de la Ciudad de Alicante. Universidad de Alicante, Alicante.
Sabatini, F., Cáceres, G. and Cerdá, J., 2001. Segregación residencial en las principales ciudades chilenas: tendencias de las tres últimas década y posibles cursos de acción. EURE, xxvii(82): 21‐42.
Sassen, S., 1991. The Global City: New York, London, Tokyo. Princeton University Press, Princeton.
Servicio Público de la Vivienda (SPV), 2003. Programa Rosario Hábitat. Descripción, SPV. Municipalidad de Rosario, Rosario.
Smith, D.M., 1973. The Geography of Social Well‐being in the United States: An Introduction to Territorial Social Indicators. McGraw‐Hill, New York.
Smith, D.M., 1977. Human Geography: A Welfare Approach. Edward Arnold, London. Smith, D.M., 1994. Geography and Social Justice. Blackwell, Oxford. Smith, G., 1999. Area‐based Initiatives: The Rationale and Options for Area Targeting.
Centre for Analysis of Social Exclusion, London School of Economics, London. Soja, E.W., 2000. Postmetropolis: Critical Studies of Cities and Regions. Blackwell,
Oxford. Speak, S. and Graham, S., 1999. Service not included: private services restructuring,
neighbourhoods, and social marginalisation. Environment and Planning A, 31: 1985‐2001.
SPSS, 1999. SPSS 9.0 Applications Guide. SPSS, Chicago. Steinberg, F., 2002. Strategic Urban Planning in Latin America: Experiences of Building
and Managing the Future. IHS, Rotterdam.

213
Steinberg, F., 2005. Strategic urban planning in Latin America: experiences of building and managing the future. Habitat International, 29: 69‐93.
Stephens, C., 1996. Healthy cities or unhealthy islands? The health and social implications of urban inequality. Environment and Urbanization, 8(2): 9‐30.
Talen, E., 1998. Visualising fairness. Equity maps for planners. Journal of the American Planning Association, 64(1): 22‐38.
Talen, E., 1999. Constructing neighbourhood from the bottom up: the case for resident‐generated GIS. Environment and Planning B: Planning and Design, 26: 533‐554.
Talen, E. and Anselin, L., 1998. Assessing spatial equity: an evaluation of measures of accessibility to public playgrounds. Environment and Planning A, 30(4): 595‐613.
The Mersey Gateway Project, 2003. PortCities: Liverpool. Liverpool Population Statistics. Merseyside Local Authority Library Services, University of Liverpool, National Museums Liverpool, North West Sound Archive, Liverpool.
The Mersey Partnership, 2003. Summary of the History of Liverpool. The Mersey Partnership, Liverpool.
The World Bank, 1996. UMP Working Paper Series. Urban Poverty Research Sourcebook. Module II: Indicators of Urban Poverty. The World Bank, Washington.
The World Bank, 2001. How to Assess Urban Poverty: Collecting Indicators and Constructing Poverty Profiles. The World Bank, Washington.
Torres, H., 2001. Cambios socioterritoriales en Buenos Aires durante la década de 1990. EURE, 27(80): 33‐57.
UN‐HABITAT, 2003a. Guide to Monitoring Target 11: Improving the Lives of 100 Million Slum Dwellers. Progress towards the Millennium Development Goals, UN‐HABITAT, Nairobi.
UN‐HABITAT, 2003b. Slums of the World: The Face of Urban Poverty in the New Millennium? UN‐Habitat, Nairobi.
United Nations, 1992a. Agenda 21. United Nations, Rio de Janeiro. United Nations, 1992b. Rio Declaration on Environment and Development. Report of the
United Nations Conference on Environment and Development, Rio de Janeiro. United Nations Centre for Human Settlements (UNCHS), 1995. Indicators Programme,
Vols 1, 2 and 3. UNCHS, Nairobi. United Nations Centre for Human Settlements (UNCHS), 1999. The Habitat Agenda:
Monitoring Progress. Global Urban Indicators Database, Nairobi. United Nations Centre for Human Settlements (UNCHS), 2000a. The Global Urban
Observatory´s Training Manual. Nairobi. United Nations Centre for Human Settlements (UNCHS), 2000b. Urban Indicators
Toolkit ‐ Guide for Istanbul. UNCHS, Nairobi. United Nations Centre for Human Settlements (UNCHS), 2001. Cities in a Globalizing
World. Global Report on Human Settlements 2001, Earthscan, London. United Nations Development Programme (UNDP), 2000. Chapter 5: Using Indicators for
Human Rights Accountability. Oxford University Press, Oxford. United Nations Development Programme (UNDP), 2001. Human Development Report
2001. Oxford University Press, Oxford.

214
United Nations Development Programme (UNDP), 2002. 18 Challenges Faced By Argentine Reality. Contributions to Argentinaʹs Human Development/2002. UNDP, Buenos Aires.
URB‐AL, 2000. Documento Base. URB‐AL Red N7. Capítulo 2 Control y Gestión de la Urbanización. Nuevos Instrumentos urbanísticos: ejemplos de formulación y aplicación, URB‐AL, Rosario.
Veiga, D., 2001. Cómo viven quienes integran la clase social más alta de Rosario. La Capital, 3 June 2001, Rosario.
Veiga, D., 2004. Las enfermedades vinculadas a la pobreza castigan a la zona noroeste de la ciudad. La Capital, 11 October 2004, Rosario.
Videla, O.R. and Fernández, S.R., 2001. La evolución económica rosarina durante el desarrollo agroexportador. In: F. Ricardo and S. Myriam (Editors), La Historia de Rosario. La Historia de Rosario. Homo Sapiens, Rosario, pp. 55‐99.
Vranken, J., 2001. No Social Cohesion without Social Exclusion? Eurex Lecture 4. European Online Seminar on Urban Transformation, Poverty, Spatial Segregation and Social Exclusion.
Webber, R., 1998. Developments in cross‐border standards for geodemographic segmentation. In: P. Burrough and I. Masser (Editors), European Geographic Information Infrastructures: Opportunities and Pitfalls. Taylor and Francis, pp. 71‐84.
Webster, C.J., 1993. GIS and the scientific inputs to urban planning. Part 1: Description. Environment and Planning B: Planning and Design, 20: 709‐728.
Werna, E., 2001. Combating Urban Inequalities: Challenges for Managing Cities in the Developing World. Edward Elgar Pub., Northampton, MA.
Wessel, T., 2000. Social polarisation and socioeconomic segregation in a welfare state: the case of Oslo. Urban Studies, 37(11): 1947‐1967.
Westendorff, D., 2002. From Unsustainable to Inclusive Cities. United Nations Research Institute for Social Development (UNRISD) / Swiss Agency for Development Cooperation, Geneva.
Wong, C., 1994. Quality of urban living: an infrastructural dimension. In: S. Neary, M. Symes and F. Brown (Editors), The Urban Experience: A People‐Environment Perspective. E&FN Spon, London, pp. 257‐269.
Wong, C., 2002. Developing indicators to inform local economic development in England. Urban Studies, 39(10): 1833‐1863.
World Commission on Environment and Development (WCED), 1987. Our Common Future. Oxford University Press, Oxford.
van der Wusten, H. and Musterd, S., 1998. Welfare state effects on inequality and segregation. In: S. Musterd and W. Ostendorf (Editors), Urban Segregation and the Welfare State: Inequality and Exclusion in Western Cities. Routledge, London, pp. 238‐248.
Yin, R., 1994. Case Study Research. Design and Methods. Sage, London. Zanetta, C., 2002. The failings of Argentina’s reform program: a view from the municipal
and housing sectors. Cities, 19(3): 173‐182.
215
Samenvatting in het Nederlands
Monitoren van ongelijkheid binnen steden met op GIS gebaseerde indicatoren Waarom ongelijkheden binnen steden monitoren? Ruimtelijke ongelijkheid, en de er mee verbonden problemen als segregatie en sociale uitsluiting en polarisatie, komt overal in de wereld in stedelijke gebieden voor. Ongelijkheden zijn vooral manifest in steden in ontwikkelingslanden, waar bevolkingsgroei en kwetsbaarheid voor armoede permanent aan de orde zijn. Slechte woonomstandigheden, achteruitgang van de stedelijke dienstverlening, misdaad en werkloosheid zijn kenmerkend voor deze steden. Er is sprake van toenemende aandacht voor deze problemen getuige de rapporten en initiatieven van internationale organisaties, zoals de Verenigde Naties en de Europese Unie, waarin het belang van het monitoren van ruimtelijke ongelijkheden binnen steden wordt onderstreept.
De toenemende kloof tussen rijke en arme woonbuurten zet politici er toe aan gebiedsgericht beleid te introduceren om ongelijkheid te compenseren en te bestrijden. De ruimtelijke dimensie van ongelijkheid maakt het een geschikt onderwerp om te analyseren met behulp van geografische informatiesystemen (GIS). Beleidsindicatoren zijn, door hun specifieke karakteristieken, een geëigend instrument om deze complexe verschijnselen met behulp van kwantificeerbare maten te doorgronden en te communiceren. Door het systematisch gebruik van stedelijke indicatoren en GIS‐analysetechnieken kan het probleem en zijn effecten op de leefkwaliteit van de bevolking beter bewaakt worden. Op GIS gebaseerde indicatoren kunnen helpen bij het monitoren van ongelijkheid, het opsporen van misdeelde gebieden, het stellen van prioriteiten en het herschikken van middelen. Zorg over ongelijkheid is een morele en normatieve kwestie die gepaard gaat met compenserend en vaak gebiedsgericht beleid. In andere woorden, één van de redenen om beschrijvende en beoordelende studies naar ongelijkheid uit te voeren is het vervolgens implementeren van beleid gericht op verbetering van de achterstandsgebieden.
Hoewel de literatuur over (het meten van) ongelijkheid toeneemt, is er nog onvoldoende discussie over de operationalisering en bruikbaarheid van te gebruiken methoden en technieken en de rol die GIS daarbij kan spelen. Dit wordt ook omschreven, bijvoorbeeld door Kunzmann, als het probleem van het ontbreken van ‘ruimtelijk relevante indicatoren’. Er zijn vele studies naar het monitoren van stedelijke armoede en duurzaamheid uitgevoerd, vaak op een globaal en gegeneraliseerd niveau. Er is meer onderzoek nodig om ongelijkheid binnen steden gedetailleerder te analyseren en indicatoren te verbinden met beleidsvorming.
Het monitoren van binnenstedelijke ongelijkheid met op GIS gebaseerde indicatoren Het hoofddoel van dit onderzoek is het ontwikkelen van een methodologie ‐ op basis van stedelijke indicatoren en GIS – die gebruikt kan worden als een valide diagnostisch en prescriptief instrument om beleidsrelevante informatie te genereren over de complexe en multidimensionele aspecten van ruimtelijke ongelijkheid.

216
De voorgestelde methodologie gaat uit van een systematische monitoring van de meest relevante aspecten van binnenstedelijke ongelijkheden met behulp van een matrix van indicatoren en een benadering om een geografische component aan de gemeentelijke budgettoewijzing toe te voegen. De methodologie wordt toegepast in een gevalstudie voor Rosario (Argentinië) en aangetoond wordt hoe GIS in staat is aspecten van ongelijkheid zoals leefkwaliteit en toegang tot fysieke en sociale infrastructuur te beschrijven en te bewaken.
Op GIS gebaseerde indicatoren worden geconstrueerd door verschillende gegevensbronnen te combineren, zoals volkstellingen en administratieve registers. Soms is er kritiek op gebiedsgericht beleid om ongelijkheid te verminderen vanwege het feit dat dit niet gebaseerd is op behoeften en op homogene gebieden (‘ecological fallacy’ of ‘ecologische dwaling’). Om de problemen (en kritiek) ten aanzien van ecologische dwaling te minimaliseren, richt het onderzoek zich op kleine ruimtelijke eenheden en lage niveaus van aggregatie en wordt meer nadruk gelegd op behoeften dan op andere distributieve criteria. Ook wordt het construeren van indicatoren los van een beleidsperspectief vaak bekritiseerd, bijvoorbeeld door Innes. Daarom verbindt deze studie de ontwikkeling en het gebruik van op GIS gebaseerde indicatoren met beleid.
Het onderzoek houdt rekening met de beleidsomgeving in Rosario waar de gemeente in 1995 met een proces van decentralisatie is begonnen dat geleid heeft tot het creëren van zes districten. Het verminderen van ongelijkheid is expliciet als doelstelling van het decentralisatieprogramma vastgelegd. In artikel 5.1 van het actieplan wordt het belang om verschillende geografische gebieden te vergelijken gerechtvaardigd ‘om billijkheidscriteria te kunnen gebruiken bij het toekennen van hulpbronnen’.
De empirische analyse wordt daarom ingebed in zowel een analyse van begrippen als een onderzoek naar de perceptie van beleidsmakers over stedelijke ongelijkheid en het omgaan met gegevens en indicatoren in de besluitvorming. Twintig deelsgestructureerde interviews zijn in Rosario afgenomen met het doel na te gaan hoe locale beleidsmakers ongelijkheid als een op te lossen probleem ervaren en welke dimensies van en factoren voor ongelijkheid zij het meest ter zake doend vinden. Deze beide doelstellingen hebben te maken met een valide keuze van indicatoren. Om de uitkomsten van de interviewcampagne in Rosario goed te kunnen interpreteren is gekozen voor een contraststudie in de stad Liverpool. Het doel van deze aanvullende gevalstudie is te zien hoe in een stad met ervaring in zowel het gebruik van indicatoren als het toepassen van gebiedsgericht beleid met deze problematiek omgegaan en over indicatoren gedacht wordt.
Volgens de beleidsmakers in Rosario zijn bewoningsdichtheid, opleidingsniveau, arbeid, aansluiting op waterleiding en toegang tot basisscholen de vijf belangrijkste aspecten van ongelijkheid. Het belang van monitoring en het gebruik van indicatoren wordt benadrukt vanwege de mogelijkheden om specifieke behoeften te bevredigen en om de distributie van middelen en het stellen van prioriteiten mogelijk te maken. Politici zien de betekenis van het optimaliseren van schaarse hulpbronnen als rechtvaardiging voor het gebruik van indicatoren en het monitoren van ongelijkheden. Ook een rechtvaardige toewijzing van middelen blijkt een belangrijke overweging te zijn. In Liverpool is de rol van de nationale overheid cruciaal bij de ontwikkeling van beleidsmaatregelen voor achterstandswijken en het reduceren van geografische

217
ongelijkheid. Het opstellen van rangordes van buurten en wijken en de toepassing van buurtgericht beleid en strategische partnerschappen worden gezien als goede voorbeelden om binnenstedelijke ongelijkheden te bestrijden.
Welke zijn de uitkomsten van dit onderzoek? De GIS‐gebaseerde indicatoren die geselecteerd zijn om ruimtelijke ongelijkheden te analyseren duiden op het bestaan van duidelijke en diepgaande sociaal‐ruimtelijke verschillen en polarisatie. Rosario is een duale en verdeelde stad waar welgestelden in de binnenstad en een aantal assen naar buiten wonen en achterstandsgroepen in de wijken aan de stadsrand. Deze sociale polarisatie is kenmerkend voor de sociaal‐ruimtelijke structuur van de stad. De uitgevoerde factoranalyse en clusteranalyse en de ontwikkelde samengestelde ongelijkheidsindex bevestigen de ruimtelijke tegenstellingen tussen arm en rijk.
Het district Oeste is duidelijk het meest achtergestelde district en Centro is het meest welvarend. De ongelijkheden tussen de districten en de buurten hebben betrekking alle onderzochte aspecten. Echter, wat betreft de spreiding van voorzieningen, met name de bereikbaarheid van sociale voorzieningen, is een ‘sociaal‐progressief’ patroon gevonden dat de achterstandsgebieden bevoordeelt. Zoals in hoofdstuk zeven wordt aangetoond komt de verdeling van voorzieningen over de stad (zoals Crecer, kinderdagverblijven) ten goede aan werklozen, laagopgeleiden en mensen met gezondheidsrisico’s. Dit is een voorbeeld van sociale rechtvaardigheid en gelijkheid, zoals besproken in hoofdstuk twee, die leidt tot proportionele billijkheid gebaseerd op behoefte. Maar de privatisering van voorzieningen zoals riolering beperkt de mogelijkheden van de locale overheid om verbeteringen aan te brengen en ongelijkheden te compenseren.
In de onderzochte periode (1991‐2001) is de kloof tussen de districten en buurten van Rosario blijven bestaan, waarbij de situatie met betrekking tot werkloosheid en gezondheidszorg zelfs verslechterd is ten koste van de achterstandsgroepen. Deze indicatoren, die erg gevoelig zijn voor economische veranderingen, weerspiegelen duidelijk de economische crisis waar Argentinië mee te maken had.
De analyse in hoofdstuk zeven toont aan dat er correlatie bestaat tussen bepaalde aspecten van ongelijkheid, zoals tussen woondichtheid, werkloosheid en opleidingsniveau. Daaruit kan geconcludeerd worden dat er in Rosario sprake is van concentratie en accumulatie van problemen in specifieke gebieden.
Gegeven deze kenmerken van het ongelijkheidprobleem en de mogelijkheden om het met GIS‐gebaseede indicatoren te analyseren, wordt in dit onderzoek een benadering voorgesteld om beleidsmakers te helpen de meeste achtergestelde gebieden te onderkennen, te prioriteren en om beschikbare compenserende middelen te herverdelen. Het voorbeeld wordt uitgewerkt in de context van gebiedsgerichte aanpakken en participatieve budgettering. Hoewel in Rosario consensus is bereikt over een meer democratische benadering van budgettoewijzing, kunnen GIS‐gebaseerde indicatoren toch helpen om een ruimtelijke dimensie toe te voegen aan dit proces van budgettoewijzing. Tot nu toe heeft elk district hetzelfde aandeel van het participatieve deel van het budget ontvangen, onafhankelijk van de behoeften. Een billijkere verdeling van middelen wordt echter beschouwd als één van de toekomstige uitdagingen van de

218
participatieve budgettering. Deze studie geeft een voorbeeld hoe het participatieve budgetteringsproces kan profiteren van het gebruik van GIS‐gebaseerde indicatoren door ook het buurtniveau te betrekken bij de toewijzing van middelen. Een perspectief van sociale rechtvaardigheid (eerlijk delen) met proportionele gelijkheid gebaseerd op behoeften is uitgewerkt. Zoals in hoofdstuk twee, vooral op basis van werk van Smith, is besproken is sociale rechtvaardigheid een normatief gezichtspunt dat uitgaat van hoe het behoord te zijn en van de vraag wie hoe wat waar krijgt respectievelijk zou moeten krijgen.
Indicatoren afgeleid uit volkstellinggegevens zijn goede maten om indirecte of afgeleide behoeften te meten, maar zij kunnen door de bevolking geuite behoeften en de verdeling van voorzieningen, in de zin van bereikbaarheid van sociale en fysieke infrastructuur, niet aangeven. Gebaseerd op dit onderzoek kan het gebruik van zowel afgeleide als geuite behoefte aanbevolen worden. Dit is vooral belangrijk wanneer zowel gebieds‐ als persoons‐ en/of groepsgericht beleid geïmplementeerd wordt. Terwijl afgeleide behoefte via individuele indicatoren en een ongelijkheidsindex het belang en de concentratieaspecten van ongelijkheid kan vangen, kan de geuite behoefte ook zicht geven op individuele gevallen van behoeftigheid die verborgen zijn in welgestelde gebieden. Ecologische dwaling bij gebiedsgericht beleid kan hiermee voorkomen worden. In andere woorden, terwijl gebiedsgericht beleid uitgaat van een multidimensionele benadering, kan de toevoeging van geuite behoefte helpen om die individuele gevallen op te sporen die anders buiten geografisch compenserend beleid zouden vallen. De studie beveelt de toepassing van gebiedsgericht beleid aan maar zonder nieuwe behoefteclusters die verschijnen in de binnenstad, traditioneel het welvarende deel, te veronachtzamen. Ze worden ‘uitgemiddeld’ doordat de clusters binnen gegoede wijken vallen. Het gebruik van geuite behoefte kan dus helpen om de locaties van individuele behoeftigen op te sporen. Het is duidelijk dat administratieve gegevens in combinatie met (de functies voor geocodering van) GIS hiervoor een goede aanpak is.
Enkele afsluitende opmerkingen Gebiedsgericht beleid gericht op de bestrijding van ongelijkheid moet gekenmerkt worden door geïntegreerde en goed afgestemde interventies. Daarom is GIS een ideaal instrument om indicatoren en gegevens tussen afdelingen doelmatig te delen. Zowel GIS als indicatoren kunnen ingebed worden in beleidsvorming (beide is noodzakelijk). Een aantal voordelen van GIS voor het bouwen van indicatoren zijn uit dit onderzoek naar voren gekomen. Om indicatoren te kunnen operationaliseren is het noodzakelijk de gegevens te organiseren en ze te kwantificeren en communiceren. In deze studie was het mogelijk om verschillende databronnen te integreren zoals volkstellingen en administratieve gegevens, om behoeften te kwantificeren en om de kloof tussen welgestelde en achtergebleven gebieden te analyseren. Ook konden kaarten gemaakt worden om probleemgebieden op te sporen en resultaten weer te geven. Om het gebruik van GIS‐gebaseerde indicatoren tot een succes te maken wordt aanbevolen de systeemontwikkeling te baseren op locale beleidsbehoeften.
Het meenemen van het perspectief van beleidsmakers op aspecten van ongelijkheid bij de selectie van indicatoren en het incorporeren van een prescriptieve

219
component in locale participatieve budgetten zijn pogingen om de implementatie van deze methodologie in de locale context mogelijk te maken. Een aanbeveling die gerelateerd is aan het streven naar beter bestuur is het betrekken van beleidsmakers bij de selectie en evaluatie van indicatoren. Dat geldt ook voor de communicatie over indicatoren met burgers voor en na de toepassing van gebiedsgericht beleid. Op die manier kunnen politici het succes aantonen van hun beleid en kunnen burgers de aanspreekbaarheid van de beleidsmakers visualiseren en betere oplossingen eisen. Zoals blijkt uit de interviews in Liverpool (hoofdstuk vijf) is het vastleggen van specifieke kwantitatieve doelen voor elk aspect van ongelijkheid en het evalueren van het halen van de doelstellingen een goede aanpak om aansprakelijkheid te vergroten en politiek succes te evalueren. Zo kunnen indicatoren in de hele beleidscyclus een rol spelen: van probleemdefinitie tot implementatie en beleidsevaluatie.
Het is ook belangrijk te wijzen op het feit dat indicatoren slechts een deel van de werkelijkheid weergeven en dus de indicatorwaarden niet overgewaardeerd moeten worden. De studie is niet onkritisch ten opzichte van indicatoren. Geen enkel stel indicatoren kan de volledige rijkheid en diversiteit van de werkelijkheid tonen. De waarde van lokale kennis en kwalitatieve analyse is zeker ook belangrijk om de indicatoren te aan te vullen, in het bijzonder voor intern en locaal gebruik. Indicatoren zijn echter nog steeds de beste optie voor de toewijzing van middelen of voor ‘externe’ communicatie, bijvoorbeeld naar geldgevers en hogere overheden.
Het verminderen van ongelijkheid tussen landen, gebieden, steden en buurten zal een uitdaging blijven voor de komende generaties. Hoogstwaarschijnlijk zal het een ideaal blijven of door veel anderen worden ontkend, maar het beseffen van de negatieve gevolgen van ongelijkheid wat betreft aspecten als leefkwaliteit, sociale cohesie en veiligheid kan niet genegeerd worden. Dit onderzoek heeft getracht meer inzicht te geven in binnenstedelijke ongelijkheden en een aantal instrumenten opgeleverd voor de monitoring er van en hopelijk ook om ze te helpen verminderen.

220
Resumen en castellano
Monitoreo de desigualdades intra‐urbanas mediante SIG e indicadores ¿Por qué monitorear las desigualdades intra‐urbanas? Las desigualdades espaciales y con problemas relacionados tales como la segregación espacial, la exclusión social y la polarización afectan áreas urbanas de todo el mundo. Las desigualdades son particularmente evidentes en ciudades en países en vías de desarrollo, donde se presenta un estado permanente de crecimiento y vulnerabilidad a la pobreza urbana. Condiciones de hábitat inadecuado, degradación de la infraestructura urbana de servicios, acceso desigual a la infraestructura física y social, criminalidad y desempleo son problemas que afectan a estas ciudades. Diversos informes e iniciativas de organismos internacionales como las Naciones Unidas y la Unión Europea, reflejan una preocupación cada vez mayor sobre esta problemática y enfatizan la importancia de monitorear las desigualdades espaciales presentes en las ciudades.
La creciente brecha entre los barrios más y menos favorecidos alienta a los creadores de políticas y tomadores de decisión a introducir políticas con un fuerte componente espacial123 y a combatir esas desigualdades. La dimensión espacial de las desigualdades las hace adecuadas para el análisis y el seguimiento con Sistemas de Información Geográfica (SIG). Los indicadores, debido a su función inherente, son una herramienta que permite simplificar y comunicar fenómenos complejos en medidas cuantificables. El uso sistemático de indicadores urbanos y de técnicas de análisis SIG facilitan el monitoreo de este problema y sus efectos sobre la calidad de vida de la población. Por lo tanto, los SIG y los indicadores pueden ayudar a monitorear las desigualdades, focalizar áreas necesitadas, fijar prioridades, y reasignar recursos. La preocupación por la desigualdad plantea una cuestión moral y normativa que conlleva a políticas compensatorias. En otras palabras, una de las razones para implementar estudios descriptivos y de monitoreo de la desigualdad es con el fin de concentrar los esfuerzos en aquellas áreas en desventaja e implementar políticas compensatorias y reparadoras.
Pese a que existe un incremento de la temática de la desigualdad dentro de la literatura así como del interés por la importancia de su cuantificación; no hay suficiente discusión sobre los métodos y las herramientas (básicamente indicadores), qué tan convenientes son, y el uso de los SIG para ponerlos en operación. Esta preocupación también es expresada por Kunzmann, como un problema de falta de indicadores “espacialmente relevantesʺ. Mientras que muchos estudios se han propuesto monitorear la pobreza y sustentabilidad urbana, y se han formulado indicadores a nivel global; se requiere una investigación más profunda sobre cómo monitorear la desigualdad espacial en las ciudades y la vinculación de los indicadores con la toma de decisión y el diseño de políticas.
123 Con una creciente difusión en el Reino Unido a partir del gobierno del Nuevo Laborismo y denominadas en inglés area‐based policies (políticas basadas en áreas o zonas)

221
Monitoreo de desigualdades intra‐urbanas con indicadores y SIG El objetivo principal de esta investigación es desarrollar una metodología que combine el uso de indicadores urbanos y los SIG como herramientas válidas de diagnóstico y prescripción para generar información político‐relevante sobre los aspectos complejos y multidimensionales de las desigualdades espaciales.
Esta investigación propone una metodología para monitorear sistemáticamente los aspectos más relevantes de las desigualdades intra‐urbanas con una matriz de indicadores y un enfoque para incorporar el componente geográfico‐espacial en la asignación del presupuesto municipal. Esta metodología se aplica en un estudio de caso en Rosario (Argentina) y se demuestra cómo los indicadores urbanos y los SIG pueden describir y monitorear aspectos de la desigualdad tales como la calidad de vida y el acceso a la infraestructura física y social.
Los indicadores propuestos se construyen mediante un SIG combinando diversas fuentes de datos tales como el censo y datos administrativos. Algunas críticas a las estrategias de políticas enfocadas a áreas o zonas para reducir las desigualdades afirman que las áreas no son seleccionadas teniendo en cuentas las necesidades y que las áreas resultantes no son homogéneas (problema conocido como “falacia ecológica”). Para reducir al mínimo posible estos problemas esta investigación se centra en el uso de unidades de área pequeña y niveles bajos de agregación y hace hincapié en la ʺnecesidadʺ más que en otro criterio de distribución. Además, la construcción de indicadores fuera de la perspectiva de la política también es criticada extensamente, por ejemplo por Innes. Por lo tanto, esta investigación propone vincular el desarrollo y el uso de indicadores basados en SIG a políticas locales específicas.
Esta investigación considera el contexto de las políticas aplicadas en Rosario, donde el municipio a partir de 1995 comenzó a implementar un proceso de descentralización que condujo a la creación de seis distritos. La intención de reducir desigualdades se ha indicado explícitamente en los objetivos del Programa de Descentralización y en el artículo 5.1 del plan de acciones, donde la importancia de comparar diversas áreas geográficas se justifica para ajustar “los criterios de equidad en la asignación de recursosʺ.
El análisis empírico aquí incluido se encuadra dentro de un análisis de conceptos y de la opinión de diferentes hacedores de políticas sobre las desigualdades urbanas y de cómo utilizan datos e indicadores en la toma de decisiones. Veinte entrevistas semi‐estructuradas fueron llevadas a cabo en Rosario con el objetivo de descubrir cómo los hacedores de políticas locales perciben la desigualdad como un problema a solucionar; y para identificar qué aspectos de la desigualdad encuentran más relevantes. Estos dos objetivos se vinculan a una selección válida de indicadores. La ciudad de Liverpool (Reino Unido) fue elegida para poner en contraste los resultados de las entrevistas en Rosario. El objetivo del estudio de caso adicional en Liverpool es examinar cómo se están utilizando los indicadores en una ciudad con experiencia en el uso de éstos y en la puesta en práctica de políticas basadas en áreas para abordar el problema de la desigualdad.
El hacinamiento, el nivel de la educación, el empleo, el agua potable en la vivienda, y el acceso a la educación primaria son los cinco aspectos más importantes de

222
la desigualdad según hacedores de políticas públicas en Rosario. Enfatizan también la importancia de monitorear y de usar indicadores para ʺsatisfacer necesidades localizadasʺ y para ʺfocalizar la distribución de recursos y acciones y definir prioridadesʺ. Los hacedores de políticas ven la necesidad de optimizar los escasos recursos como justificación para el uso de indicadores. Una asignación justa de recursos se indica también como un aspecto muy importante a considerar. En Liverpool, el papel del gobierno nacional es crucial en la demanda para detectar y focalizar áreas desfavorecidas y reducir las desigualdades geográficas. El establecimiento de un ranking de barrios carenciados y el uso de las políticas basadas en áreas y la creación de planes estratégicos para clusters o grupos de barrios se pueden considerar como buenas prácticas para abordar desigualdades intra‐urbanas.
¿Cuáles son los resultados de esta investigación? Los diferentes indicadores seleccionados para analizar las desigualdades espaciales indican la existencia de una clara y profunda diferenciación y polarización socio‐espacial. Rosario es una ciudad dual con una periferia carenciada y un centro más próspero. Esta polarización social también marca la estructura espacial de la ciudad. El factor socioeconómico ‐ obtenido a partir del análisis factorial ‐, el análisis de cluster, y el índice compuesto de desigualdades confirman la existencia de esta dualidad.
El distrito Oeste aparece claramente como el distrito más carenciado y el distrito Centro como el más favorecido. Las desigualdades entre los distritos y dentro de sus áreas barriales son marcadas en todos los aspectos considerados. Sin embargo, en términos de distribución de oportunidades, y de accesibilidad a la infraestructura social, se encuentra un “patrón social progresivoʺ, que favorece a las áreas más carenciadas. Como se demuestra en el capítulo 7, la distribución de oportunidades (por ejemplo centros Crecer) parece favorecer aquellas áreas con mayor concentración de hogares carenciados: con alto nivel de desempleo, bajo nivel educativo y mayor vulnerabilidad en términos de salud. En ese sentido y de acuerdo a los conceptos discutidos en el capítulo 2 sobre justicia e igualdad social, este es un ejemplo de una acción compensatoria que sigue el criterio de igualdad proporcional basado en la necesidad. Sin embargo, la existencia de servicios privatizados tales como agua potable y aguas residuales limitan la capacidad del gobierno local para mejorar ciertos aspectos y compensar las desigualdades.
Con respecto al período analizado por este estudio (1991‐2001), se puede observar que en Rosario se mantiene la brecha entre los distritos, y entre las diversas áreas barriales; con un empeoramiento en la situación del desempleo que afecta a los sectores más carenciados en particular. El indicador de desempleo, que es muy sensible a los cambios económicos, refleja claramente la crisis económica que afectó a Argentina.
El análisis en el capítulo 7 demuestra que existe claramente una correlación entre ciertos aspectos de las desigualdades (por ejemplo, entre el hacinamiento, el desempleo y el nivel bajo de educación). Es así que se puede concluir que hay una concentración y una coexistencia de problemas en zonas específicas de Rosario.
Debido a esta característica del problema de la desigualdad y la capacidad de los indicadores basados en SIG de analizarla, es que el enfoque propuesto en esta investigación para focalizar, priorizar y redistribuir los recursos compensatorios entre las

223
áreas barriales más carenciadas puede ayudar a los hacedores de políticas y tomadores de decisión. El ejemplo propuesto se presenta en el contexto de políticas basadas en áreas y en el presupuesto participativo. En Rosario, si bien se reconoce que se ha logrado un consenso y un enfoque más democrático en la elaboración del presupuesto mediante la inclusión del presupuesto participativo, los indicadores basados en SIG pueden todavía ayudar al agregar una dimensión espacial al proceso de la asignación del presupuesto. Hasta este momento cada distrito de la ciudad ha recibido la misma porción del presupuesto participativo independiente de sus necesidades. Sin embargo, una distribución más equitativa de recursos se indica como el ʺdesafío futuroʺ para el presupuesto participativo. Esta investigación brinda un ejemplo de cómo el proceso del presupuesto participativo podría beneficiarse mediante el uso de indicadores basados en SIG, añadiendo una dimensión territorial a la asignación de recursos. En el enfoque propuesto se tiene en cuenta una perspectiva de justicia social (equidad en la distribución), con un criterio de igualdad proporcional basado en las necesidades. Según lo discutido en el capítulo 2, principalmente en base al trabajo de Smith, la justicia social es una perspectiva normativa que concierne a lo qué debe ser, y a la cuestión de “quién obtiene qué dónde y cómo”, y más precisamente “quién debe obtener qué, dónde y cómo”.
Los indicadores generados con datos censales son adecuados para medir la necesidad indirecta o derivada pero no pueden medir la necesidad expresada directamente por la población, ni reflejan la ʺdistribución de oportunidadesʺ inherente a la accesibilidad a la infraestructura social y física. Como resultado de esta investigación, se sugiere el uso conjunto de indicadores que midan tanto la necesidad derivada como la expresada. Esto es particularmente sensible si se deben implementar tanto políticas enfocadas a áreas como a individuos y/o grupo de personas. Mientras que la necesidad derivada vía indicadores individuales y un índice de desigualdades pueden reflejar los aspectos concurrentes y predominantes de la desigualdad, la necesidad expresada puede ayudar a detectar los casos individuales que aún estando necesitados están “ocultos” en un área privilegiada. De este modo, el error de falacia ecológica de las políticas basadas en áreas puede ser superado. Es decir, mientras que las políticas basadas en áreas o zonas consideran un enfoque multidimensional, la inclusión de la necesidad expresada puede ayudar a detectar a aquellos individuos que pudieron ser dejados fuera de las políticas compensatorias basadas en áreas geográficas. Este estudio alienta el uso de políticas basadas en áreas, pero sin omitir la necesidad de focalizar ʺnuevas áreas de necesidadʺ que pudieran aparecer, por ejemplo, en el centro de la ciudad (tradicionalmente el área más privilegiada) y que quedarían diluidas al ser promediadas dentro un área privilegiada. A este respecto, el uso de la necesidad expresada puede ayudar en identificar donde se concentra la necesidad individual. Claramente, el uso conjunto de datos administrativos y su geocodificación con SIG ofrecen la posibilidad de localizar, por ejemplo la demanda expresada de vivienda. Algunas observaciones y conclusiones Las políticas basadas en áreas para afrontar las desigualdades se deben caracterizar por un enfoque multi‐sectorial y de intervenciones concertadas. Por lo tanto, los SIG son una plataforma ideal para compartir indicadores y datos entre las secretarías u oficinas de

224
una manera más eficiente. Los SIG y los indicadores pueden ser incorporados en la definición de políticas. Algunas ventajas de los SIG para construir indicadores emergen de este análisis. Para construir indicadores, es necesario organizar datos, cuantificarlos y comunicarlos. En este caso particular, fue posible integrar diferentes fuentes de datos tales como datos censales y administrativos, con el fin de cuantificar necesidades y analizar la brecha entre áreas más y menos favorecidas, y generar mapas para detectar y comunicar las áreas problemáticas. Se puede recomendar que para tener éxito en la adopción de indicadores basados en SIG se responda a las necesidades locales y que estos indicadores sean requeridos por políticas concretas.
La inclusión de la perspectiva de los hacedores de políticas en aspectos de la desigualdad en la selección de indicadores y la incorporación del componente prescriptivo dentro del presupuesto participativo son tentativas para hacer la puesta en práctica de esta metodología factible dentro del contexto local. Una recomendación que se relaciona con una mejor gobernabilidad es la inclusión de los hacedores de políticas en la selección y la evaluación de indicadores, así como la comunicación de dichos indicadores a los ciudadanos antes y después del uso de políticas basadas en área. De esa forma, los hacedores de políticas podrían demostrar el éxito de su política y los ciudadanos podrían visualizar la responsabilidad de la administración local y de ser necesario reclamar por mejores soluciones. Según lo visto en las entrevistas realizadas en Liverpool (capítulo 5), el establecimiento de metas cuantitativas específicas en la reducción de cada aspecto de la desigualdad y la evaluación de su cumplimiento serían una buena herramienta para aumentar la responsabilidad o rendición de cuentas y evaluar el éxito de las políticas aplicadas. De esta forma, el uso de indicadores se incluye en cada una de las fases de la acción de gobierno: desde la identificación de problemas y la formulación de las políticas hasta la puesta en práctica y la evaluación de las mismas.
Es también importante indicar que los indicadores reflejan solamente una porción de la realidad y que sus resultados no deben ser sobreestimados. Esta investigación no carece de algunas objeciones hacia el uso de indicadores. Ningún sistema de indicadores puede reflejar la complejidad y la diversidad de la realidad. El conocimiento local y el análisis cualitativo son claramente importantes para complementar a los indicadores, y especialmente para el uso interno y local. Sin embargo, los indicadores son todavía la mejor opción para la asignación de recursos o para el uso ʺexternoʺ (ej. agencias de financiamiento, niveles más altos del gobierno).
La disminución de la desigualdad entre los países, las regiones, las ciudades y los barrios seguirá siendo un desafío para las generaciones futuras. Probablemente permanecerá como un ideal o será negado por muchos otros, pero el reconocimiento de los efectos negativos de la desigualdad en aspectos como la calidad de vida, la cohesión social y la seguridad no podrán ser ignorados. Esta investigación ha intentado esclarecer algunos aspectos de las desigualdades intra‐urbanas y proporcionar una herramienta para monitorearlas y posiblemente ayudar a reducirlas.

225
Annex 1: List of reports on urban indicators
• Indicators Programme, Volumes 1, 2 and 3. Nairobi, UNCHS. (UNCHS, 1995) • Urban Indicators Toolkit ‐ Guide for Istanbul +5. Nairobi, UNCHS. (UNCHS, 2000b) • The Global Urban Observatoryʹs Training Manual. (UNCHS, 2000a) • Guide to Monitoring Target 11: Improving the Lives of 100 Million Slum Dwellers.
Progress towards the Millennium Development Goals. Nairobi, UN‐HABITAT. (UN‐HABITAT, 2003a)
• UMP Working Paper Series. Urban Poverty Research Sourcebook. Module II:
Indicators of Urban Poverty. (The World Bank, 1996) • How to Assess Urban Poverty: Collecting Indicators and Constructing Poverty
Profiles. (The World Bank, 2001) • Non‐Monetary Indicators of Poverty and Social Exclusion. Brussels, European
Commission. (European Commission, 1998) • The Urban Audit: Towards the Benchmarking of Quality of Life in 58 European
Cities. (European Communities, 2000) • Indices of Deprivation 2000. London, Department of the Environment, Transport
and the Regions. (DETR, 2000b) • The Development of a Town & City Indicators Database. London, Office of the
Deputy Prime Minister. (ODPM, 2002)

226
Annex 2: Policy areas and domains under several indicators initiatives
The UNCHS distinguishes seven policy areas in its Urban Indicators Programme (UNCHS, 1995):
• Socio‐economic development; • Infrastructure; • Transportation; • Environmental management; • Local government; • Housing affordability and appropriateness; • Housing provision.
UNCHS E+5 (and GUO) distinguishes six policy chapters (with 20 policy goals) (UNCHS, 2000a; UNCHS, 2000b):
• Shelter; • Social development and eradication of poverty; • Environmental management; • Economic development; • Governance; • International cooperation.
UN Millennium Development Goals cover eight goals, and target 11 is particularly related to urban and habitat issues (UN‐HABITAT, 2003a):
• Goal 1. Eradicate extreme poverty and hunger; • Goal 2. Achieve universal primary education; • Goal 3. Promote gender equality and empower women; • Goal 4. Reduce child mortality; • Goal 5. Improve maternal health; • Goal 6. Combat HIV/AIDS, malaria and other diseases; • Goal 7. Ensure environmental sustainability;
o Target 11: Achieve significant improvement in lives of at least 100 million slum dwellers by 2020 (five key dimensions):
Access to safe water Access to sanitation Secure tenure Durability of housing Sufficient living area
• Goal 8. Develop a global partnership for development.

227
World Bank policy goal areas for key urban poverty indicators (The World Bank, 1996):
• Poverty, productivity and employment; • Access to housing; • Access to transport, production and market infrastructure; • Access to services and social infrastructure; • Affordability of urban and social services; • Level of infrastructure provision; • Gender‐specific indicators.
World Bank poverty dimensions (The World Bank, 2001):
• Income; • Health; • Education; • Tenure security; • Personal security; • Empowerment.
In the report Non‐Monetary Indicators of Poverty and Social Exclusion, the European Commission establishes five domains of human development (European Commission, 1998):
• Income generation; • Education and training; • Health and social services; • Environment and territory; • Human rights and democracy.
The EU Urban‐Audit Indicators programme has the following aspects (European Communities, 2000):
• Socio‐economic (with 11 sub‐aspects); 1 Population 2 Nationality 3 Household structure 4 Labour market and unemployment 5 Income, disparities and poverty 6 Housing 7 Health 8 Crime 9 Employment change 10 Economic activity 11 Civic involvement
• Levels of training and education; • Environment; • Culture and recreation.

228
The UK Indices of Deprivation 2000 has the following six domains (DETR, 2000b): • Income; • Employment; • Health deprivation and disability; • Education, skills and training; • Housing; • Geographical access to services.
The Town & City Indicators Database recognises the following underlying concepts of Urban White Paper visions (ODPM, 2002):
• Increasing community participation in governance; • Increasing participation in civil and civic society; • Improving desirability of urban living; • Removing dereliction and encouraging renewal; • Increasing self‐containment and improving balance of work and
home‐life by reducing time and distance of journeys to work; • Improving attractiveness of town centre and city‐fringe locations; • Improving environmental quality; • Reducing resource consumption; • Reducing pollution; • Improving safety of urban environment; • Improving attractiveness of urban environment; • Creating prosperity; • Sharing prosperity; • Improving education; • Improving housing; • Improving public transport; • Improving health; • Improving the environment; • Improving leisure services.

229
Annex 3: Operational definitions of indicators Overcrowding Definition: Percentage of households with three or more persons per room.
INDEC calculates overcrowding (hacinamiento por cuarto) by dividing the total number of persons living in the household by the total number of rooms “of household exclusive usage”. Following recommendations of Habitat (UNCHS, 1995), a household is considered overcrowded when more than two persons share one bedroom. The definition of cuarto according to INDEC is: “Room separated by walls (from floor to roof) that can have a bed for an adult. The kitchen and the bathroom are not considered rooms, neither garages, corridors or laundry rooms. In houses with more than one household, the common rooms are not counted as rooms.”
Interpretation: When households live in a house with a number of bedrooms inadequate for the type of family, it represents a critical level of housing need. This indicator measures the mismatch between the housing needs of the households and the house size.
Data source: INDEC: National housing and population census 1991 – 2001. Inadequate housing Definition: Percentage of dwellings of inadequate type.
It is proposed that those dwellings considered by the National Census Bureau (INDEC) as inadequate (viviendas deficitarias) be considered houses of inadequate type, as well as hostels and hotels (not used for tourism).
INDEC distinguishes two types of inadequate houses: Viviendas deficitarias (include type B houses) and viviendas precarias (hut‐shanty, pensions, casa de inquilinato, rooms not built for housing, and mobile houses).
There are different sub‐classes of individual dwellings124:
• Casa / House: dwelling with direct exit to the exterior (its residents do not cross any garden, corridor or shared entrance.
• Casa tipo B / House type B: house that meets at least one of the following conditions: it has no indoor water plumbing connection; it has no toilet with water flush; it has a floor made of soil or any other material that is not ceramic, tiles, wood, carpet, plastic, cement or brick.
124 According to INDEC, there are two main classes of dwellings/viviendas: Collective dwellings (viviendas colectivas):
elderly asylums, minors asylums, boarding schools, camps, hospitals, prisons, barracks, convents, hotels.
Individual dwellings (viviendas particulares): any kind of structure destined for residence of one or more households.

230
• Casa tipo A / House type A: the rest of the houses are considered house type A.
• Rancho / Hut‐shanty: house with exterior exit. It is made out of materials such as mud and soil and usually found in rural areas.
• Casilla / Hut‐shanty: house with exterior exit. It is made out of materials of bad quality or waste materials and usually found in urban areas.
• Departamento / Apartment: dwelling with individual toilet and kitchen where the entrance is from a lift, garden, stair or internal corridors of common use.
• Casa de inquilinato: dwelling with many rooms accessed from common spaces and shared by many households.
• Pension u hotel / Hostel or Hotel: only those where households reside permanently and rent is paid weekly or monthly.
• Local no construido para habitación / Room not built for habitat but being used as such on the day of the census.
• Tipo de vivienda móvil / Mobile home: it can be moved to any place (motor‐home, ship, train wagon, etc.)
• Tipo de vivienda ignorada o desconocida / Unknown type of house.
Interpretation: This indicator can show those areas with housing needs. It should be noted that there is no reference in this indicator to the legal status of the dwelling (such as squatter settlements). Together with overcrowding, this is a key measure of the basic human need for shelter. Data source: INDEC: National housing and population census 1991 – 2001.
Education level Definition: Percentage of the population, 19 years or older, who went to secondary school. Interpretation: Areas with a low percentage of adult population with secondary school education represents a group of high vulnerability, since urban deprivation is most common among the unskilled (Langlois and Kitchen, 2001). It might also reflect the incapacity of the household to obtain enough income for adequate living.
Data source: INDEC: National housing and population census 1991 – 2001. Unemployment Definition: Percentage of unemployed adults. As the quotient resulting from dividing the total unemployed by the labour force (the sum of the employed and the unemployed). INDEC considers as unemployed a person who, not having a job, has been looking for a job during the four weeks up to the day of the census. In this case, the long‐term unemployed who have lost hope of finding a job might be under‐represented.
231
“According to the currently used resolution adopted by the 13th International Conference of Labour Statisticians, unemployed persons are defined as those individuals without work, seeking work in a recent past period, and currently available for work” (UNCHS, 2000b).
Interpretation: This indicator represents income deprivation and is closely related to situations of poverty and lack of well‐being and quality of life. It is also a proxy for social exclusion.
Data source: INDEC: National housing and population census 1991 – 2001.
Health Coverage Definition: Percentage of households without health security/insurance.
Interpretation: This indicator represents a proxy for the health condition of the household in terms of lack of access to health insurance. They are relatively disadvantaged compared with those households who have health insurance. Consequently, it can be assumed that their health condition is more vulnerable. In the case of data availability, it should be complemented by mortality rate for under fives and life expectancy.
Data source: INDEC: National housing and population census 1991 – 2001. Tap water inside the dwelling Definition: Percentage of households with tap water inside the dwelling.
Interpretation: The access to safe water represents the capacity of the household to fulfil one of the basic human needs, which is also closely related to health conditions. Especially in developing countries, the lack of access to safe water affects poor areas in particular. Its relevance can be confirmed by its inclusion as a key dimension of one of the targets of the UN Millennium Development Goals ‒ improving the lives of at least 100 million slum dwellers by 2020 (UN‐HABITAT, 2003a).
Data source: INDEC: National housing and population census 1991 – 2001. Sewage connections Definition: Percentage of households that are connected to the sewage system (households with WC, with disposal to the public network).
Interpretation: Households without adequate sanitation are exposed to health problems. Besides, through its relation to health and environment inadequate sanitation has negative implications for the economic development (UN‐HABITAT, 2003a). Its relevance is

232
confirmed by its inclusion as a key dimension of one of the targets of the UN Millennium Development Goals (UN‐HABITAT, 2003a).
Data source: INDEC: National housing and population census 1991 – 2001.
Access to kindergartens and primary schools Definition: Distance from the centroids of the block groups to the nearest kindergarten or primary school represented in a point map. Minimum distance (measured in metres) was chosen as the accessibility measure since it can be easily communicated to policy makers and because in the case of primary schools the externality effect is minimum (children go to schools within the neighbourhood).
Interpretation: The physical accessibility to primary schools and kindergartens depicts the opportunity to obtain education. Deprivation of this opportunity limits the life chances of those affected by this form of disadvantage (Pacione, 2001). The same author suggests that apart from the educational benefits, those in proximity to schools can benefit from after‐school activities. This is particularly so in the case of Rosario, where the main meal obtained by children in poverty is obtained in the school.
Data source: administrative data published at www.rosario.gov.ar.
Access to public health centres Definition: Distance from the centroids of the block groups to the nearest primary care health services. Minimum distance (measured in metres) was chosen as the accessibility measure since it can be easily communicated to policy makers and because in the case of primary care health services the externality effect is minimum.
Interpretation: Households who are further away from primary care facilities might have to travel to other areas of the city and might delay treatment or not consult the doctor if they do not have the money to pay for public transport.
Data source: administrative data published at www.rosario.gov.ar.
Access to Centros Crecer Definition: Distance from the centroids of the block groups to the nearest Centro Crecer (day‐care centre) represented in a point map. Minimum distance (measured in metres) was chosen as the accessibility measure since it can be easily communicated to policy makers and because (as with primary schools) the externality effect is minimum. Interpretation: Due to their important role in providing social assistance and fighting social exclusion (subsection 4.3.5), physical accessibility to these Centros Crecer depicts the opportunity

233
that households have to obtain education, adult training, and day‐care facilities. Working mothers have more opportunities if they are near to a day‐care facility. Data source: administrative data published at www.rosario.gov.ar.
Access to internet Definition: Percentage of households with PC with internet connection.
Interpretation: This indicator can show the differential access to information and communication technologies (ICT). Although it is not a highly prioritised indicator, it points to the future implications in the quality of life of individuals. Besides, it is agreed that technological diffusion is selective (Castells, 1996); hence it is an aspect of inequality where a differential access to ICT between areas (and socio‐economic groups) can be expected.
Data source: INDEC: National housing and population census 1991 – 2001.

234
Annex 4: List of interviewees Rosario (Argentina), 2002: Alfonso, Laura Inés. Directora Centro Municipal Distrito Sur ʺRosa Ziperovichʺ Bifarello, Mónica. Coordinadora Técnica. Plan Estratégico Rosario Bonfatti, Antonio. Secretario Secretaría de Gobierno Borghi, Gerardo. Director Centro Municipal Distrito Norte ʺVilla Hortensiaʺ Capiello, Miguel Ángel. Secretario Secretaría de Salud Pública Ciciliani, Graciela. Coordinadora Centro Municipal Distrito Centro Elías, Ángel. Secretario Secretaría de la Producción Flamini, Fabián. Director Centro Municipal Distrito Oeste ʺFelipe Moréʺ Garzia, Maria Isabel. Directora Servicio Público de la Vivienda Ghirardi, Horacio. Director Programa de Descentralización y Modernización Grieco, Gerardo. Coordinador Centro Municipal Distrito Suroeste Levín, Mirta. Responsable Encuesta Origen Destino de Viajes Lifschitz, Roberto Miguel. Secretario Secretaría de Servicios Públicos Romeu, Marcelo. Secretario Secretaría de Cultura y Educación Sandoz, Patricia. Secretaria Secretaría de Obras Públicas Sciara, Ángel. Secretario Secretaría de Hacienda y Economía Tenaglia, Marcelo. Coordinador Centro Municipal Distrito Noroeste Vidal, Daniel Esteban. Secretario Secretaría de Planeamiento Urbano Zabalza, Juan Carlos. Secretario Secretaría General Zamarini, Miguel Ángel. Secretario Secretaría de Promoción Social Liverpool (UK), 2003: Bradley, Warren. Councillor Leisure and Tourism Dunne, Eamonn. Programme Co‐ordinator Liverpool Vision Krajewska, Sophy. Head of Regeneration Policy / Regeneration Portfolio / Liverpool City Council
Melville, Ann. Director Education and Lifelong Learning Portfolio. (With team GIS systems in education)
Murphy, Liam. Director Alt Valley Partnership Spencer, Lynn. Director South Liverpool Partnership Williams, Jess. Monitoring and Review Co‐ordinator, Liverpool Partnership Group

235
Annex 5: Variables census 1991 – 2001
Availability of a place to cook Availability of water in the kitchen Type of fuel used to cook Number of rooms for sleeping Total number of rooms Housing tenancy type Land tenure type Availability of fridge with / without freezer (or freezer) Availability of automatic washing machine Availability of washing machine Availability of VCR Availability of telephone Availability of cable television Availability of microwave Availability of personal computer with/without intranet Demographic data 1991 2001 Relatives relationship Sex Age Illiteracy Receipt of pension Association with an emergency service Association with a private health service Association with a social service (obra social)
Household 1991 2001 Geographical location Reason why the survey did not take place List of persons that spent the night in the household Existence of descendents or members of an indigenous group Existence of handicapped person
Housing conditions of the household 1991 2001 Type of housing Predominant floor material Predominant material of the external walls Coating of the external walls Predominant roof material Existence of ceiling Water provision Water origin Existence of water closet Toilet drainage Shared or exclusive use of the bathroom

236
Migration 1991 2001 Place of residence (regular) Place of residence five years ago Place of birth Number of years lived in Argentina Education 1991 2001 School attendance (present) Type of school (public-private) now attended Level Last degree or year attended Highest level attended Last degree or year attended Level finished (completed) Title of university degree Marital status 1991 2001 Marital status Marriage (legal) or partnership Degree of marriage (first, second ...) Year when the partnership started Employment 1991 2001 Condition of the economic activity Type of economic activity Name of the activity / job Tasks developed in the job Employment category Private or public employment Pension payments (employees) Pension payments (employers) Salary obtained from a relative Number of persons working in the same company Fertility 1991 2001 Number of children born alive Number of children who are alive Number of children born during the last year

237
Annex 6: Aggregation block group 1991-2001 The 2001 census block group boundaries were aggregated into 1991 census block groups. As shown in the following figures, centroids for the 2001 block groups were calculated to merge with those located within the same 1991 block groups. Of the census block groups of 1991, 3% were subdivided in 2001, increasing the number of census block groups from 856 to 901. The variables of 2001 were summarised and a new table was generated with indicators for 1991 and 2001 to calculate the change between the two years.
Aggregation of census block groups 2001 into 1991

238
Centroids of census 2001 block groups manually edited (1991 census borders in dashed lines)
Aggregation census block groups 2001 (A) into 1991 (B)

239
Annex 7: Correlation between indicators
Correlation between indicators. Spearmanʹs rho. Correlation is significant at the 0.01 level
(2‐tailed). N=898 125
125 For a definition of unsatisfied basic needs, see p. 35.
Overcrowding
Inadequate Housing
Expressed housing
deprivation
Education Level
Unemployment
Health Coverage
Tap Water
Sewage Network
Primary Schools Access
Health Centres Access
Day Care Access
Internet Access
Index 2001
Socio Economic Factor
Unsatisfied Basic Needs
Population 0 – 14 years
Complains OAV
Ove
rcro
wdi
ng
1.00
0 .7
87
.597
-.8
30.7
67
-.838
-.769
-.6
93-.4
10.5
35
.421
-.8
06-.7
71
-.670
.8
54
.796
.1
67
Inad
equa
te H
ousi
ng
1.
000
.544
-.7
26.6
19
-.729
-.847
-.6
75-.3
74.4
00
.292
-.6
68-.7
90
-.550
.8
94
.686
.1
30
Exp
ress
ed h
ousi
ng
depr
ivat
ion
1.00
0-.6
22.5
76
-.619
-.532
-.4
61-.2
17.4
36
.368
-.6
09-.5
50
-.555
.6
00
.569
.1
34
Edu
catio
n Le
vel
1.
000
-.856
.907
.7
42
.701
.4
01
-.661
-.455
.911
.7
70
.824
-.8
21
-.773
-.1
62
Une
mpl
oym
ent
1.00
0-.8
63-.6
50
-.700
-.374
.701
.4
88
-.891
-.712
-.7
88
.715
.7
90
.199
Hea
lth C
over
age
1.
000
.739
.7
11
.406
-.6
49-.4
74.9
01
.794
.7
80
-.807
-.8
21
-.170
Tap
Wat
er
1.00
0 .6
83
.424
-.4
42-.3
44.6
96
.752
.5
49
-.807
-.7
17
-.169
Sew
age
Net
wor
k
1.00
0.4
67
-.656
-.375
.703
.7
75
.498
-.6
74
-.729
-.2
44
Prim
ary
Sch
ools
A
cces
s
1.
000
-.294
-.151
.381
.4
54
.267
-.3
70
-.458
-.1
92
Hea
lth C
entre
s A
cces
s
1.00
0.5
27
-.730
-.407
-.6
11
.499
.6
25
.232
Day
-Car
e A
cces
s
1.
000
-.512
-.136
-.4
29
.376
.4
72
.140
Inte
rnet
Acc
ess
1.
000
.715
.8
53
-.777
-.7
99
-.163
Inde
x 20
01
1.00
0 .5
86
-.775
-.7
15
-.120
Soc
io E
cono
mic
Fa
ctor
1.00
0 -.6
76
-.564
-.0
87
Uns
atis
fied
Bas
ic
Nee
ds
1.00
0 .7
37
.123
Pop
ulat
ion
0 –
14
year
s
1.00
0 .2
06
Com
plai
ns O
AV
1.
000

240
Annex 8: Complete list of neighbourhood areas
Prioritised neighbourhood areas (ranked on % overcrowding above city level)
126 Standard deviation calculated among the block groups of the corresponding neighbourhood area.
Ran
king
Neighbourhood Area
% Overcrowding
% Children
Pop 0 – 14 years
Min Overcrowding
Max Overcrowding
Standard Deviation126
1 Oeste 5 23.6 34.4 4.4 49.1 15 2 Oeste 6 23.2 35.9 1.9 48.6 14 3 Oeste 2 20.3 33.5 5.0 33.2 11 4 Noroeste 4 15.1 30.7 3.7 33.3 8 5 Norte 1 14.1 30.6 4.4 31.7 10 6 Sur 6 13.2 29.4 4.6 24.3 9 7 Sudoeste 6 12.0 28.9 2.7 22.5 8 8 Sudoeste 2 11.9 26.9 1.9 29.9 7 9 Noroeste 1 11.4 29.6 0.0 22.9 8
10 Noroeste 5 10.8 26.2 0.5 36.4 8 11 Sudoeste 5 9.4 28.2 2.2 18.8 8 12 Norte 4 9.0 26.5 0.8 24.1 6 13 Oeste 3 8.1 25.0 2.5 15.9 4 14 Sudoeste 1 7.2 25.2 0.0 19.9 7 15 Oeste 4 7.2 24.2 2.7 14.7 4 16 Oeste 1 6.7 22.1 0.4 24.3 7 17 Sur 2 6.2 22.5 0.0 23.4 6
Prio
ritis
ed n
eigh
bour
hood
are
as
18 Norte 2 5.9 22.4 0.0 26.8 8 Rosario 5.6 21.7
19 Noroeste 3 5.2 24.8 0.5 13.8 4 20 Sudoeste 3 4.9 27.7 1.2 10.7 3 21 Sudoeste 4 4.8 21.8 0.0 9.7 3 22 Sur 5 3.9 21.0 0.0 29.3 7 23 Sur 1 3.6 19.2 0.0 22.4 5 24 Norte 6 3.4 17.7 0.0 26.6 5 25 Noroeste 2 3.2 22.1 0.0 34.4 8 26 Sur 3 3.2 18.1 0.3 10.2 3 27 Sur 4 3.0 18.2 0.0 16.6 4 28 Noroeste 6 2.9 18.8 0.4 11.5 2 29 Centro 4 2.6 18.1 0.0 26.9 5 30 Noroeste 7 1.7 16.1 0.0 3.0 1 31 Norte 3 1.4 16.6 0.0 5.5 1 32 Centro 5 1.1 15.9 0.0 6.9 1 33 Centro 7 1.0 13.8 0.0 6.2 1 34 Centro 6 1.0 14.6 0.0 6.7 1 35 Norte 5 1.0 16.0 0.0 8.1 2 36 Centro 2 0.5 11.5 0.0 2.7 1 37 Centro 3 0.5 12.3 0.0 2.4 1
38 Centro 1 0.5 12.0 0.0 2.2 1

241
Prioritised neighbourhood areas (ranked on number of overcrowded households: 10 worst‐off and
1‐8 cutoff point up to 50% of overcrowded households in the city)
Ran
king
Neighbourhood Area
Total Overcrowded Households
% Accumulated Overcrowding
Min Overcrowded Households
Max Overcrowded Households
Standard Deviation
1 Oeste 6 1260 8% 5 389 108 2 Noroeste 5 1164 15.5% 1 217 48 3 Oeste 5 993 21.9% 14 428 141 4 Sudoeste 2 982 28.2% 4 149 39 5 Oeste 2 904 34.0% 18 258 87 6 Noroeste 4 824 39.3% 8 395 98 7 Sudoeste 6 778 44.3% 6 170 48 8 Sur 2 760 49.2% 0 69 18 9 Norte 4 660 53.4% 3 133 31
Prio
ritis
ed n
eigh
bour
hood
are
as
10 Oeste 3 654 57.6% 7 83 20
11 Noroeste 1 582 61.3% 0 103 44 12 Sur 6 568 65.0% 19 187 73 13 Oeste 1 455 67.9% 1 131 34 14 Norte 1 416 70.6% 15 170 55 15 Sur 1 406 73.2% 0 96 17 16 Oeste 4 361 75.5% 10 92 23 17 Norte 6 341 77.7% 0 151 25 18 Sur 5 327 79.8% 0 77 18 19 Sudoeste 1 306 81.7% 0 101 32 20 Norte 2 296 83.6% 0 113 31 21 Sudoeste 4 265 85.3% 0 102 24 22 Sudoeste 3 215 86.7% 4 51 13 23 Noroeste 3 210 88.1% 2 91 28 24 Centro 4 202 89.4% 0 79 15 25 Sudoeste 5 183 90.5% 13 94 43 26 Noroeste 2 179 91.7% 0 66 17 27 Noroeste 6 178 92.8% 1 46 11 28 Centro 6 153 93.8% 0 19 3 29 Centro 5 144 94.7% 0 27 5 30 Sur 4 134 95.6% 0 63 15 31 Sur 3 133 96.4% 1 58 16 32 Centro 2 90 97.0% 0 9 2 33 Norte 3 89 97.6% 0 12 3 34 Noroeste 7 88 98.1% 0 8 3 35 Centro 3 81 98.7% 0 9 2 36 Centro 7 76 99.2% 0 12 2 37 Norte 5 67 99.6% 0 35 7
38 Centro 1 65 100.0% 0 7 2

242
Cen
troN
oroe
ste
Nor
teO
este
Sudo
este
Sur
Dis
tric
ts
0%10%
20%
30%
40%
50%
Overcrowding
3615
1124
1123
1204
0606
0702
4807
4713
4917
4723
4725
4408
4612
5508
4208
4009
4013
4004
4005
1202
1002
1209
0717
0302
0308
0707
0807
0301
4918
4609
5512
5407
Annex 9: Boxplots overcrowding
Boxplots: overcrowding at block group, grouped by district

243
Centro
1Centro
2Centro
3Centro
4Centro
5Centro
6Centro
7NO 1NO 2NO 3NO 4NO 5NO 6NO 7Nort
e 1Norte 2Norte 3Norte 4Norte 5Norte 6Oeste
1Oeste
2Oeste
3Oeste
4Oeste
5Oeste
6SO 1SO 2SO 3SO 4SO 5SO 6Sur
1Sur 2Sur 3Sur 4Sur 5Sur 6
Nei
ghbo
urho
od A
reas
0%10%
20%
30%
40%
50%
Overcrowding
2210
2012
4013
8110
1113
3201
1204
1202
1209
3209
0605
0404
1509
3416
3404
3211
4909
3215
4725
4513
4203
5108
5309
5408
4004
4005
3812
1702
1116
1002
3210
0716
0907
0807
4613
4408
4609
5107
5508
5407
Boxplots: overcrowding at block group, grouped by neighbourhood areas

244
Curriculum Vitae Javier Martínez‐Martín was born in Rosario, Argentina, on July 16, 1969. He completed his secondary education at Colegio Normal Nacional Superior Domingo F. Sarmiento in Villa Cañás, Argentina, in 1987. In March 1995, he graduated as an architect from the Faculty of Architecture, Planning and Design (Universidad Nacional de Rosario) in Rosario, Argentina. From August 1993 to January 1994, as part of an exchange programme he was a stagiair (intern) with the research group Technisch Ontwerp & Informatica of the Faculteit Bouwkunde, Technische Universiteit Delft, where he worked with CAD and 3D animations. After finishing his university studies in Argentina, he worked with the Grupo GiS (research on informatics and urbanism) in the Faculty of Architecture, Planning and Design in Rosario, Argentina, where he was also a student assistant in urban analysis.
In 1996, he moved to Enschede, the Netherlands, to study at the International Institute for Geo‐Information Science and Earth Observation (ITC). In 1998, he graduated with an MSc degree in geo‐information for urban planning (with distinction); his thesis was entitled “Evaluating housing needs with the use of GIS”. Between 1999 and 2001, he worked in the Strategic Plan Rosario office (PER).
In March 2001, he started the first phase of his PhD research at ITC. In September 2001, he joined the PhD programme of the Netherlands Graduate School of Housing and Urban Research (Nethur) at the Urban and Regional research centre Utrecht (URU), Faculty of Geographical Sciences, Utrecht University. At Utrecht, he worked under the auspices of the PhD Pilot Programme of Utrecht University and the Ryoichi Sasakawa Young Leaders Fellowship Fund (SYLFF). At both ITC and Utrecht University, he worked on his PhD thesis and in different teaching activities. He carried out fieldwork research in Rosario, Argentina, and Liverpool, UK.

245
ITC dissertation list 1. Akinyede (1990), Highway cost modelling and route selection using a geotechnical
information system 2. Pan He Ping (1990), 90‐9003‐757‐8, Spatial structure theory in machine vision and applications
to structural and textural analysis of remotely sensed images 3. Bocco Verdinelli, G. (1990), Gully erosion analysis using remote sensing and geographic
information systems: a case study in Central Mexico 4. Sharif, M. (1991), Composite sampling optimization for DTM in the context of GIS 5. Drummond, J. (1991), Determining and processing quality parameters in geographic
information systems 6. Groten, S. (1991), Satellite monitoring of agro‐ecosystems in the Sahel 7. Sharifi, A. (1991), 90‐6164‐074‐1, Development of an appropriate resource information system
to support agricultural management at farm enterprise level 8. Zee, D. van der (1991), 90‐6164‐075‐X, Recreation studied from above: Air photo interpretation
as input into land evaluation for recreation 9. Mannaerts, C. (1991), 90‐6164‐085‐7, Assessment of the transferability of laboratory rainfall‐
runoff and rainfall ‐ soil loss relationships to field and catchment scales: a study in the Cape Verde Islands
10. Ze Shen Wang (1991), 90‐393‐0333‐9, An expert system for cartographic symbol design 11. Zhou Yunxian (1991), 90‐6164‐081‐4, Application of Radon transforms to the processing of
airborne geophysical data 12. Zuviria, M. de (1992), 90‐6164‐077‐6, Mapping agro‐topoclimates by integrating topographic,
meteorological and land ecological data in a geographic information system: a case study of the Lom Sak area, North Central Thailand
13. Westen, C. van (1993), 90‐6164‐078‐4, Application of Geographic Information Systems to landslide hazard zonation
14. Shi Wenzhong (1994), 90‐6164‐099‐7, Modelling positional and thematic uncertainties in integration of remote sensing and geographic information systems
15. Javelosa, R. (1994), 90‐6164‐086‐5, Active Quaternary environments in the Philippine mobile belt
16. Lo King‐Chang (1994), 90‐9006526‐1, High Quality Automatic DEM, Digital Elevation Model Generation from Multiple Imagery
17. Wokabi, S. (1994), 90‐6164‐102‐0, Quantified land evaluation for maize yield gap analysis at three sites on the eastern slope of Mt. Kenya
18. Rodriguez, O. (1995), Land Use conflicts and planning strategies in urban fringes: a case study of Western Caracas, Venezuela
19. Meer, F. van der (1995), 90‐5485‐385‐9, Imaging spectrometry & the Ronda peridotites 20. Kufoniyi, O. (1995), 90‐6164‐105‐5, Spatial coincidence: automated database updating and
data consistency in vector GIS 21. Zambezi, P. (1995), Geochemistry of the Nkombwa Hill carbonatite complex of Isoka District,
north‐east Zambia, with special emphasis on economic minerals 22. Woldai, T. (1995), The application of remote sensing to the study of the geology and structure
of the Carboniferous in the Calañas area, pyrite belt, SW Spain 23. Verweij, P. (1995), 90‐6164‐109‐8, Spatial and temporal modelling of vegetation patterns:
burning and grazing in the Paramo of Los Nevados National Park, Colombia 24. Pohl, C. (1996), 90‐6164‐121‐7, Geometric Aspects of Multisensor Image Fusion for
Topographic Map Updating in the Humid Tropics 25. Jiang Bin (1996), 90‐6266‐128‐9, Fuzzy overlay analysis and visualization in GIS 26. Metternicht, G. (1996), 90‐6164‐118‐7, Detecting and monitoring land degradation features
and processes in the Cochabamba Valleys, Bolivia. A synergistic approach

246
27. Hoanh Chu Thai (1996), 90‐6164‐120‐9, Development of a Computerized Aid to Integrated Land Use Planning (CAILUP) at regional level in irrigated areas: a case study for the Quan Lo Phung Hiep region in the Mekong Delta, Vietnam
28. Roshannejad, A. (1996), 90‐9009284‐6, The management of spatio‐temporal data in a national geographic information system
29. Terlien, M. (1996), 90‐6164‐115‐2, Modelling Spatial and Temporal Variations in Rainfall‐Triggered Landslides: the integration of hydrologic models, slope stability models and GIS for the hazard zonation of rainfall‐triggered landslides with examples from Manizales, Colombia
30. Mahavir, J. (1996), 90‐6164‐117‐9, Modelling settlement patterns for metropolitan regions: inputs from remote sensing
31. Al‐Amir, S. (1996), 90‐6164‐116‐0, Modern spatial planning practice as supported by the multi‐applicable tools of remote sensing and GIS: the Syrian case
32. Pilouk, M. (1996), 90‐6164‐122‐5, Integrated modelling for 3D GIS 33. Duan Zengshan (1996), 90‐6164‐123‐3, Optimization modelling of a river‐aquifer system with
technical interventions: a case study for the Huangshui river and the coastal aquifer, Shandong, China
34. Man, W.H. de (1996), 90‐9009‐775‐9, Surveys: informatie als norm: een verkenning van de institutionalisering van dorp ‐ surveys in Thailand en op de Filippijnen
35. Vekerdy, Z. (1996), 90‐6164‐119‐5, GIS‐based hydrological modelling of alluvial regions: using the example of the Kisaföld, Hungary
36. Pereira, Luisa (1996), 90‐407‐1385‐5, A Robust and Adaptive Matching Procedure for Automatic Modelling of Terrain Relief
37. Fandino Lozano, M. (1996), 90‐6164‐129‐2, A Framework of Ecological Evaluation oriented at the Establishment and Management of Protected Areas: a case study of the Santuario de Iguaque, Colombia
38. Toxopeus, B. (1996), 90‐6164‐126‐8, ISM: an Interactive Spatial and temporal Modelling system as a tool in ecosystem management: with two case studies: Cibodas biosphere reserve, West Java Indonesia: Amboseli biosphere reserve, Kajiado district, Central Southern Kenya
39. Wang Yiman (1997), 90‐6164‐131‐4, Satellite SAR imagery for topographic mapping of tidal flat areas in the Dutch Wadden Sea
40. Saldana‐Lopez, Asunción (1997), 90‐6164‐133‐0, Complexity of soils and Soilscape patterns on the southern slopes of the Ayllon Range, central Spain: a GIS assisted modelling approach
41. Ceccarelli, T. (1997), 90‐6164‐135‐7, Towards a planning support system for communal areas in the Zambezi valley, Zimbabwe; a multi‐criteria evaluation linking farm household analysis, land evaluation and geographic information systems
42. Peng Wanning (1997), 90‐6164‐134‐9, Automated generalization in GIS 43. Lawas, C. (1997), 90‐6164‐137‐3, The Resource Usersʹ Knowledge, the neglected input in Land
resource management: the case of the Kankanaey farmers in Benguet, Philippines 44. Bijker, W. (1997), 90‐6164‐139‐X, Radar for rain forest: A monitoring system for land cover
Change in the Colombian Amazon 45. Farshad, A. (1997), 90‐6164‐142‐X, Analysis of integrated land and water management
practices within different agricultural systems under semi‐arid conditions of Iran and evaluation of their sustainability
46. Orlic, B. (1997), 90‐6164‐140‐3, Predicting subsurface conditions for geotechnical modelling 47. Bishr, Y. (1997), 90‐6164‐141‐1, Semantic Aspects of Interoperable GIS 48. Zhang Xiangmin (1998), 90‐6164‐144‐6, Coal fires in Northwest China: detection, monitoring
and prediction using remote sensing data 49. Gens, R. (1998), 90‐6164‐155‐1, Quality assessment of SAR interferometric data 50. Turkstra, J. (1998), 90‐6164‐147‐0, Urban development and geographical information: spatial
and temporal patterns of urban development and land values using integrated geo‐data, Villaviciencia, Colombia

247
51. Cassells, C. (1998), 90‐6164‐234‐5, Thermal modelling of underground coal fires in northern China
52. Naseri, M. (1998), 90‐6164‐195‐0, Characterization of Salt‐affected Soils for Modelling Sustainable Land Management in Semi‐arid Environment: a case study in the Gorgan Region, Northeast, Iran
53. Gorte B.G.H. (1998), 90‐6164‐157‐8, Probabilistic Segmentation of Remotely Sensed Images 54. Tegaye, Tenalem Ayenew (1998), 90‐6164‐158‐6, The hydrological system of the lake district
basin, central main Ethiopian rift 55. Wang Donggen (1998), 90‐6864‐551‐7, Conjoint approaches to developing activity‐based
models 56. Bastidas de Calderon, M. (1998), 90‐6164‐193‐4, Environmental fragility and vulnerability of
Amazonian landscapes and ecosystems in the middle Orinoco river basin, Venezuela 57. Moameni, A. (1999), Soil quality changes under long‐term wheat cultivation in the Marvdasht
plain, South‐Central Iran 58. Groenigen, J.W. van (1999), 90‐6164‐156‐X, Constrained optimisation of spatial sampling: a
geostatistical approach 59. Cheng Tao (1999), 90‐6164‐164‐0, A process‐oriented data model for fuzzy spatial objects 60. Wolski, Piotr (1999), 90‐6164‐165‐9, Application of reservoir modelling to hydrotopes
identified by remote sensing 61. Acharya, B. (1999), 90‐6164‐168‐3, Forest biodiversity assessment: A spatial analysis of tree
species diversity in Nepal 62. Akbar Abkar, Ali (1999), 90‐6164‐169‐1, Likelihood‐based segmentation and classification of
remotely sensed images 63. Yanuariadi, T. (1999), 90‐5808‐082‐X, Sustainable Land Allocation: GIS‐based decision support
for industrial forest plantation development in Indonesia 64. Abu Bakr, Mohamed (1999), 90‐6164‐170‐5, An Integrated Agro‐Economic and Agro‐
Ecological Framework for Land Use Planning and Policy Analysis 65. Eleveld, M. (1999), 90‐6461‐166‐7, Exploring coastal morphodynamics of Ameland (The
Netherlands) with remote sensing monitoring techniques and dynamic modelling in GIS 66. Yang Hong (1999), 90‐6164‐172‐1, Imaging Spectrometry for Hydrocarbon Microseepage 67. Mainam, Félix (1999), 90‐6164‐179‐9, Modelling soil erodibility in the semiarid zone of
Cameroon 68. Bakr, Mahmoud (2000), 90‐6164‐176‐4, A Stochastic Inverse‐Management Approach to
Groundwater Quality 69. Zlatanova, Z. (2000), 90‐6164‐178‐0, 3D GIS for Urban Development 70. Ottichilo, Wilber K. (2000), 90‐5808‐197‐4, Wildlife Dynamics: An Analysis of Change in the
Masai Mara Ecosystem 71. Kaymakci, Nuri (2000), 90‐6164‐181‐0, Tectono‐stratigraphical Evolution of the Cankori Basin
(Central Anatolia, Turkey) 72. Gonzalez, Rhodora (2000), 90‐5808‐246‐6, Platforms and Terraces: Bridging participation and
GIS in joint‐learning for watershed management with the Ifugaos of the Philippines 73. Schetselaar, Ernst (2000), 90‐6164‐180‐2, Integrated analyses of granite‐gneiss terrain from
field and multisource remotely sensed data. A case study from the Canadian Shield 74. Mesgari, Saadi (2000), 90‐3651‐511‐4, Topological Cell‐Tuple Structure for Three‐Dimensional
Spatial Data 75. Bie, Cees A.J.M. de (2000), 90‐5808‐253‐9, Comparative Performance Analysis of Agro‐
Ecosystems 76. Khaemba, Wilson M. (2000), 90‐5808‐280‐6, Spatial Statistics for Natural Resource
Management 77. Shrestha, Dhruba (2000), 90‐6164‐189‐6, Aspects of erosion and sedimentation in the Nepalese
Himalaya: highland‐lowland relations

248
78. Asadi Haroni, Hooshang (2000), 90‐6164‐185‐3, The Zarshuran Gold Deposit Model Applied in a Mineral Exploration GIS in Iran
79. Raza, Ale (2001), 90‐3651‐540‐8, Object‐oriented Temporal GIS for Urban Applications 80. Farah, Hussein (2001), 90‐5808‐331‐4, Estimation of regional evaporation under different
weather conditions from satellite and meteorological data. A case study in the Naivasha Basin, Kenya
81. Zheng, Ding (2001), 90‐6164‐190‐X, A Neural ‐ Fuzzy Approach to Linguistic Knowledge Acquisition and Assessment in Spatial Decision Making
82. Sahu, B.K. (2001), Aeromagnetics of continental areas flanking the Indian Ocean; with implications for geological correlation and reassembly of Central Gondwana
83. Alfestawi, Y. (2001), 90‐6164‐198‐5, The structural, paleogeographical and hydrocarbon systems analysis of the Ghadamis and Murzuq Basins, West Libya, with emphasis on their relation to the intervening Al Qarqaf Arch
84. Liu, Xuehua (2001), 90‐5808‐496‐5, Mapping and Modelling the Habitat of Giant Pandas in Foping Nature Reserve, China
85. Oindo, Boniface Oluoch (2001), 90‐5808‐495‐7, Spatial Patterns of Species Diversity in Kenya 86. Carranza, Emmanuel John (2002), 90‐6164‐203‐5, Geologically‐constrained Mineral Potential
Mapping 87. Rugege, Denis (2002), 90‐5808‐584‐8, Regional Analysis of Maize‐Based Land Use Systems for
Early Warning Applications 88. Liu, Yaolin (2002), 90‐5808‐648‐8, Categorical Database Generalization in GIS 89. Ogao, Patrick (2002), 90‐6164‐206‐X, Exploratory Visualization of Temporal Geospatial Data
using Animation 90. Abadi, Abdulbaset M. (2002), 90‐6164‐205‐1, Tectonics of the Sirt Basin – Inferences from
tectonic subsidence analysis, stress inversion and gravity modelling 91. Geneletti, Davide (2002), 90‐5383‐831‐7, Ecological Evaluation for Environmental Impact
Assessment 92. Sedogo, Laurent G. (2002), 90‐5808‐751‐4, Integration of Participatory Local and Regional
Planning for Resources Management using Remote Sensing and GIS 93. Montoya, Lorena (2002), 90‐6164‐208‐6, Urban Disaster Management: a case study of
earthquake risk assessment in Carthago, Costa Rica 94. Ahmad, Mobin‐ud‐Din (2002), 90‐5808‐761‐1, Estimation of Net Groundwater Use in
Irrigated River Basins using Geo‐information Techniques: A case study in Rechna Doab, Pakistan
95. Said, Mohammed Yahya (2003), 90‐5808‐794‐8, Multiscale perspectives of species richness in East Africa
96. Schmidt, Karin (2003), 90‐5808‐830‐8, Hyperspectral Remote Sensing of Vegetation Species Distribution in a Saltmarsh
97. Lopez Binnquist, Citlalli (2003), 90‐3651‐900‐4, The Endurance of Mexican Amate Paper: Exploring Additional Dimensions to the Sustainable Development Concept
98. Huang, Zhengdong (2003), 90‐6164‐211‐6, Data Integration for Urban Transport Planning 99. Cheng, Jianquan (2003), 90‐6164‐212‐4, Modelling Spatial and Temporal Urban Growth 100. Campos dos Santos, Jose Laurindo (2003), 90‐6164‐214‐0, A Biodiversity Information System
in an Open Data/Metadatabase Architecture 101. Hengl, Tomislav (2003), 90‐5808‐896‐0, PEDOMETRIC MAPPING, Bridging the gaps between
conventional and pedometric approaches 102. Barrera Bassols, Narciso (2003), 90‐6164‐217‐5, Symbolism, Knowledge and management of
Soil and Land Resources in Indigenous Communities: Ethnopedology at Global, Regional and Local Scales
103. Zhan, Qingming (2003), 90‐5808‐917‐7, A Hierarchical Object‐Based Approach for Urban Land‐Use Classification from Remote Sensing Data

249
104. Daag, Arturo S. (2003), 90‐6164‐218‐3, Modelling the Erosion of Pyroclastic Flow Deposits and the Occurrences of Lahars at Mt. Pinatubo, Philippines
105. Bacic, Ivan (2003), 90‐5808‐902‐9, Demand‐driven Land Evaluation with case studies in Santa Catarina, Brazil
106. Murwira, Amon (2003), 90‐5808‐951‐7, Scale matters! A new approach to quantify spatial heterogeneity for predicting the distribution of wildlife
107. Mazvimavi, Dominic (2003), 90‐5808‐950‐9, Estimation of Flow Characteristics of Ungauged Catchments. A case study in Zimbabwe
108. Tang, Xinming (2004), 90‐6164‐220‐5, Spatial Object Modelling in Fuzzy Topological Spaces with Applications to Land Cover Change
109. Kariuki, Patrick (2004), 90‐6164‐221‐3, Spectroscopy and Swelling Soils; an integrated approach
110. Morales, Javier (2004), 90‐6164‐222‐1, Model Driven Methodology for the Design of Geo‐information Services
111. Mutanga, Onisimo (2004), 90‐5808‐981‐9, Hyperspectral Remote Sensing of Tropical Grass Quality and Quantity
112. Šliužas, Ričardas V. (2004), 90‐6164‐223‐X, Managing Informal Settlements: a study using geo‐information in Dar es Salaam, Tanzania
113. Lucieer, Arko (2004), 90‐6164‐225‐6, Uncertainties in Segmentation and their Visualisation 114. Corsi, Fabio (2004), 90‐8504‐090‐6, Applications of existing biodiversity information: Capacity
to support decision‐making 115. Tuladhar, Arbind (2004), 90‐6164‐224‐8, Parcel‐based Geo‐information System: Concepts and
Guidelines 116. Elzakker, Corné van (2004), 90‐6809‐365‐7, The use of maps in the exploration of geographic
data 117. Nidumolu, Uday Bhaskar (2004), 90‐8504‐138‐4, Integrating Geo‐information models with
participatory approaches: applications in land use analysis 118. Koua, Etien L. (2005), 90‐6164‐229‐9, Computational and Visual Support for Exploratory
Geovisualization and Knowledge Construction 119. Blok, Connie A. (2005), Dynamic visualization variables in animation to support monitoring
of spatial phenomena 120. Meratnia, Nirvana (2005), 90‐365‐2152‐1, Towards Database Support for Moving Object Data 121. Yemefack, Martin (2005), 90‐6164‐233‐7, Modelling and monitoring Soil and Land Use
Dynamics within Shifting Agricultural Landscape Mosaic Systems 122. Kheirkhah, Masoud (2005), 90‐8504‐256‐9, Decision support system for floodwater spreading
site selection in Iran 123. Nangendo, Grace (2005), 90‐8504‐200‐3, Changing forest‐woodland‐savanna mosaics in
Uganda: with implications for conservation 124. Mohamed, Yasir Abbas (2005), 04‐15‐38483‐4, The Nile Hydroclimatology: impact of the Sudd
wetland (Distinction) 125. Duker, Alfred, A. (2005), 90‐8504‐243‐7, Spatial analysis of factors implicated in mycobacterium
ulcerans infection in Ghana 126. Ferwerda, Jelle, G., (2005), 90‐8504‐209‐7, Charting the Quality of Forage: Measuring and
mapping the variation of chemical components in foliage with hyperspectral remote sensing