monitoring inland storm surge and flooding from hurricane ike … · 2009-03-30 · monitoring...
TRANSCRIPT
Monitoring Inland Storm Surge and Flooding from Hurricane Ike in Texas and Louisiana, September 2008
Open-File Report 2008–1365
U.S. Department of the Interior U.S. Geological Survey

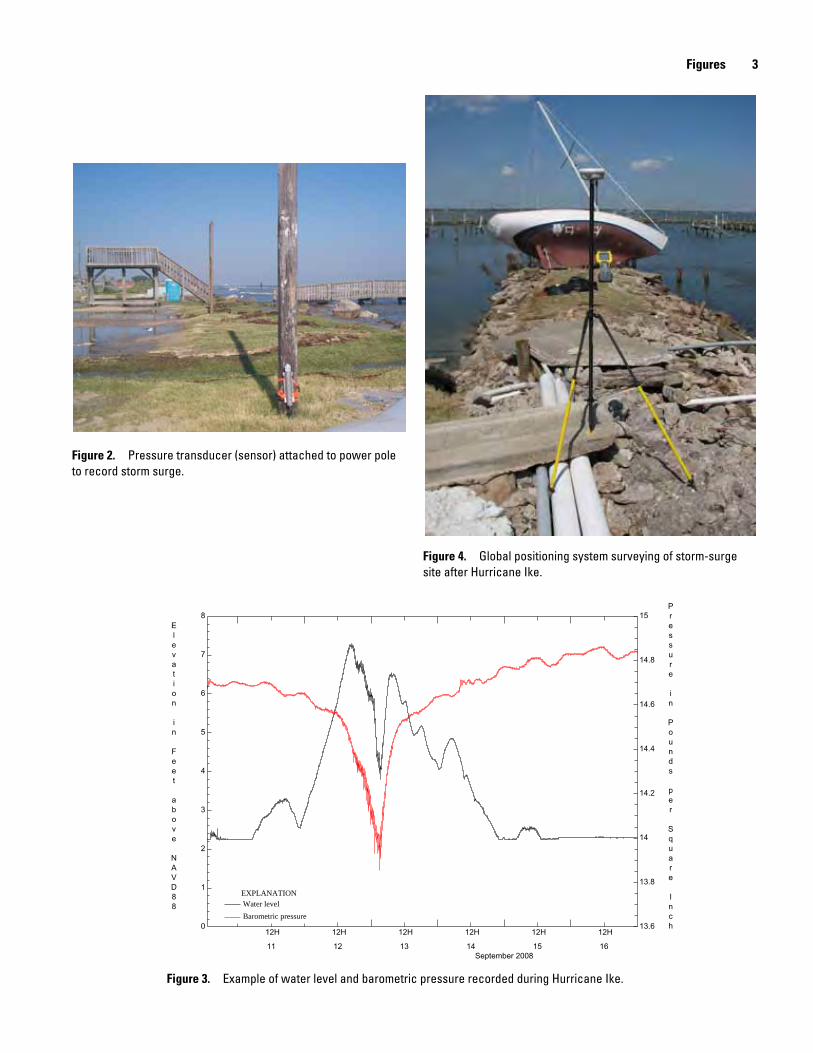
Cover left: Pressure transducer (sensor) attached to power pole to record storm surge.
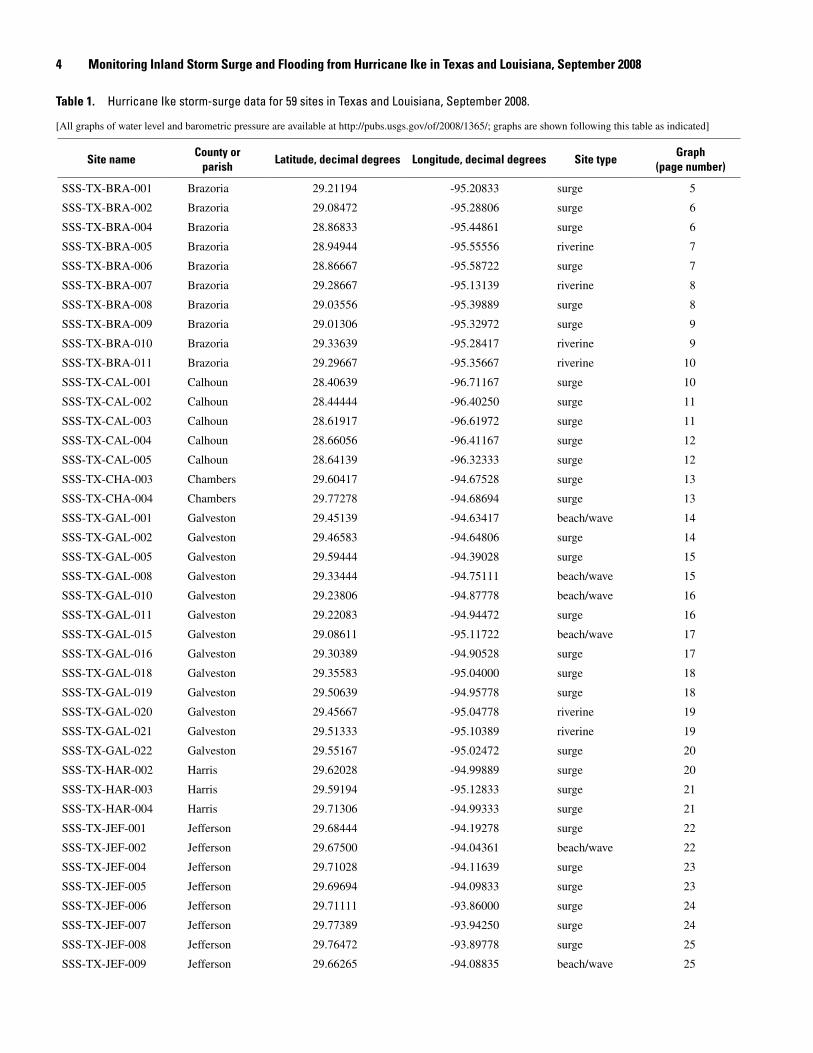
Cover right: Global positioning system surveying of storm-surge site after Hurricane Ike.
Monitoring Inland Storm Surge and Flooding from Hurricane Ike in Texas and Louisiana, September 2008
By Jeffery W. East, Michael J. Turco, and Robert R. Mason, Jr.
Open-File Report 2008–1365
U.S. Department of the InteriorU.S. Geological Survey
U.S. Department of the InteriorDIRK KEMPTHORNE, Secretary
U.S. Geological SurveyMark D. Myers, Director
U.S. Geological Survey, Reston, Virginia: 2008
For product and ordering information: World Wide Web: http://www.usgs.gov/pubprod Telephone: 1-888-ASK-USGS
For more information on the USGS—the Federal source for science about the Earth, its natural and living resources, natural hazards, and the environment: World Wide Web: http://www.usgs.gov Telephone: 1-888-ASK-USGS
Any use of trade, product, or firm names is for descriptive purposes only and does not imply endorsement by the U.S. Government.
Although this report is in the public domain, permission must be secured from the individual copyright owners to reproduce any copyrighted materials contained within this report.
Suggested citation:East, J.W., Turco, M.J., and Mason, R.R., Jr., 2008, Monitoring inland storm surge and flooding from Hurricane Ike in Texas and Louisiana, September 2008: U.S. Geological Survey Open-File Report 2008–1365 [http://pubs.usgs.gov/of/2008/1365/].

Monitoring Inland Storm Surge and Flooding from Hurricane Ike in Texas and Louisiana, September 2008
By Jeffery W. East, Michael J. Turco, and Robert R. Mason, Jr.
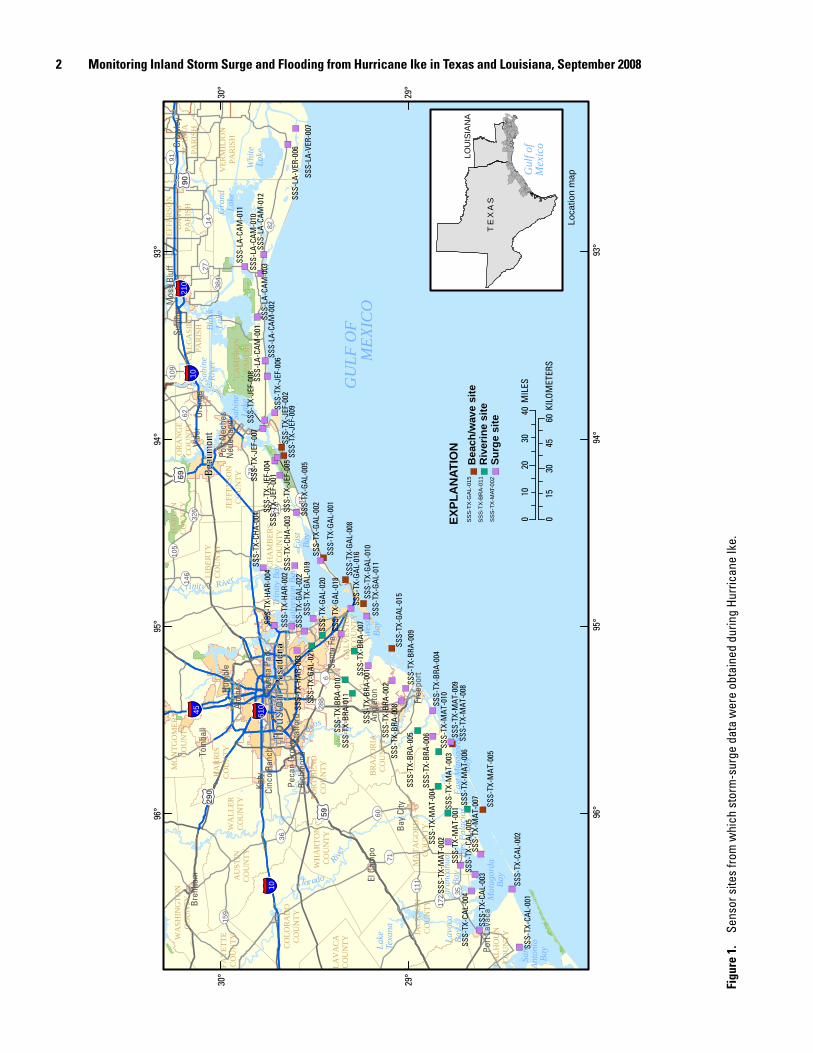
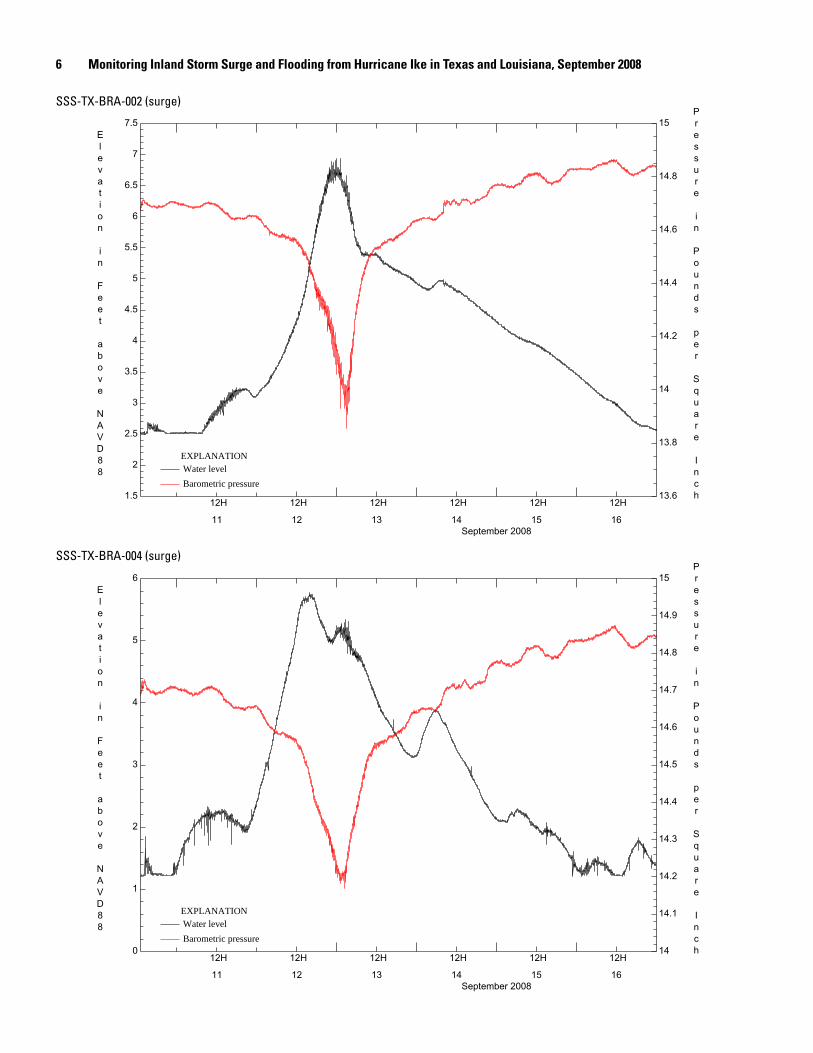
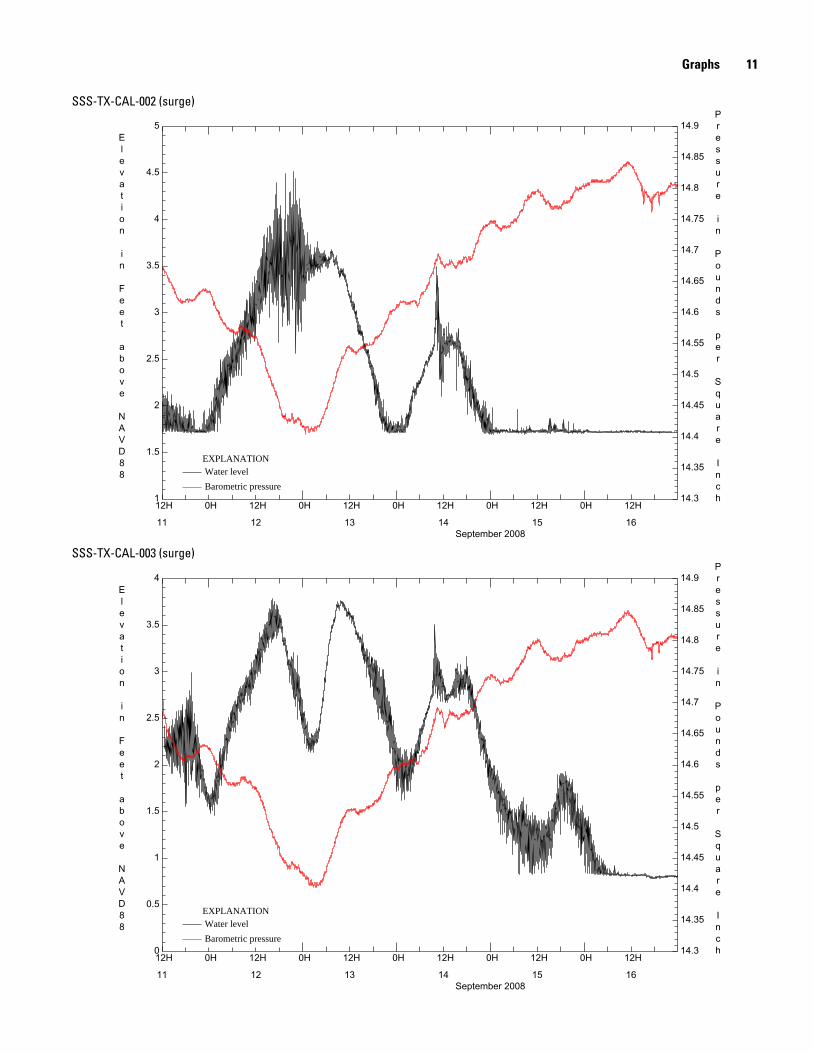
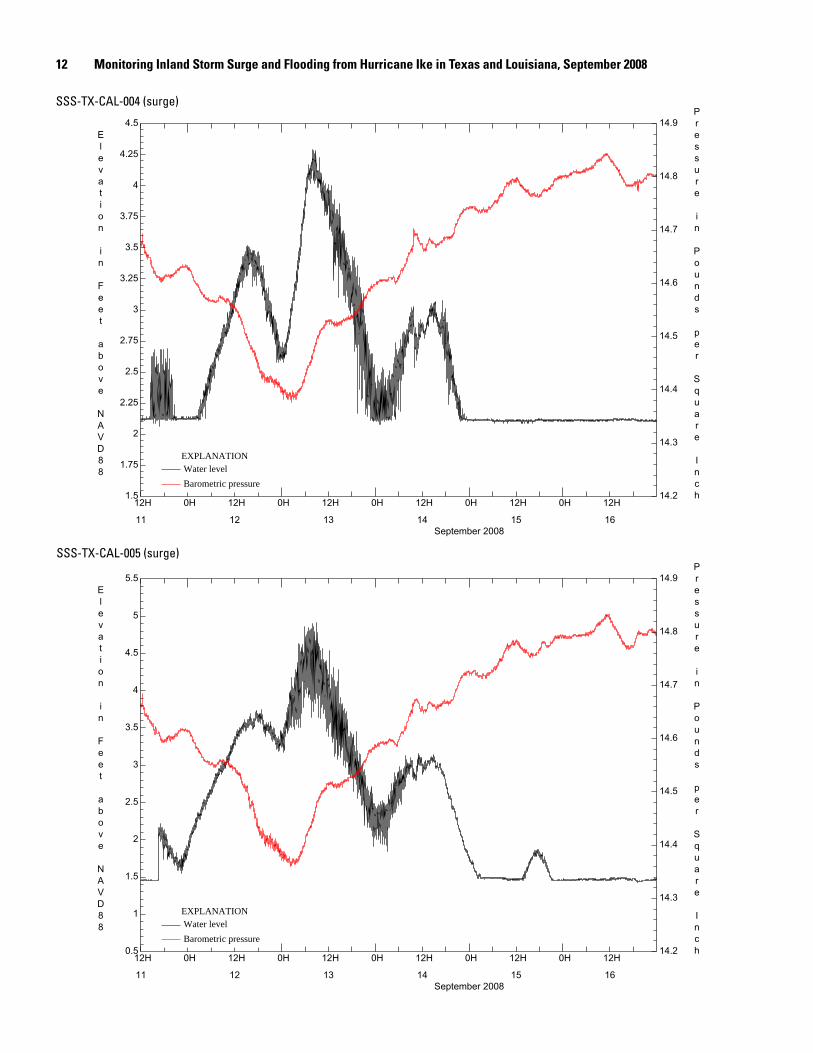
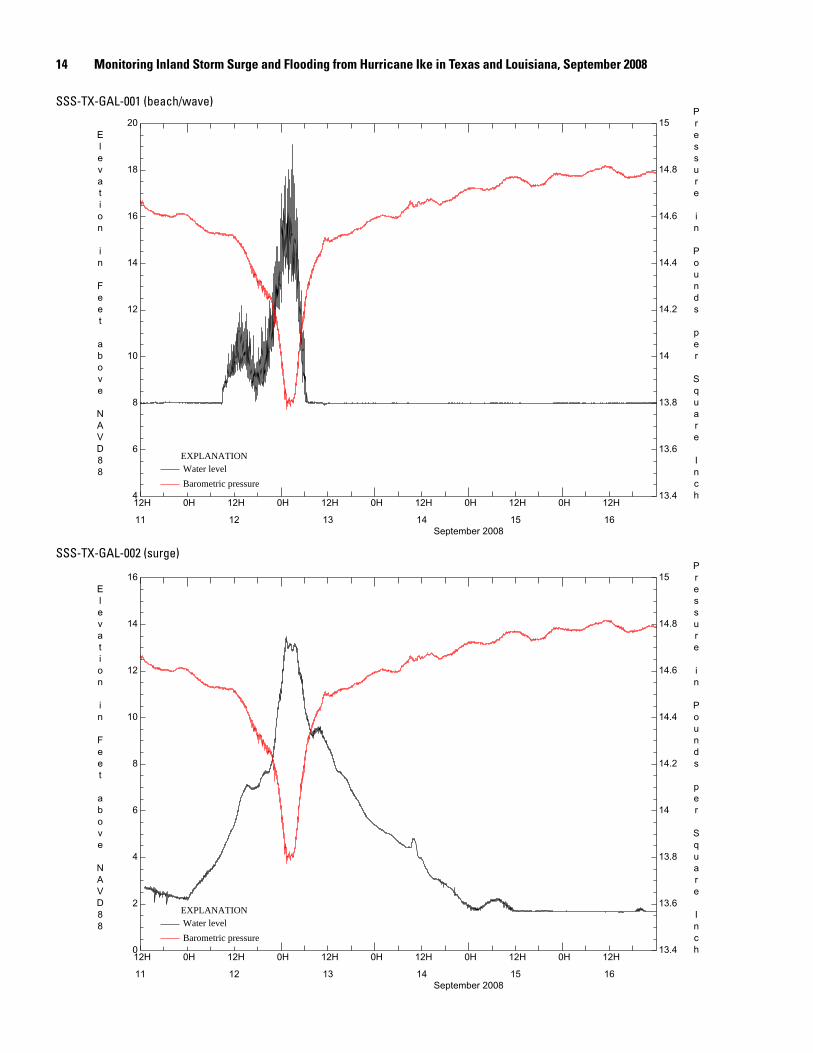
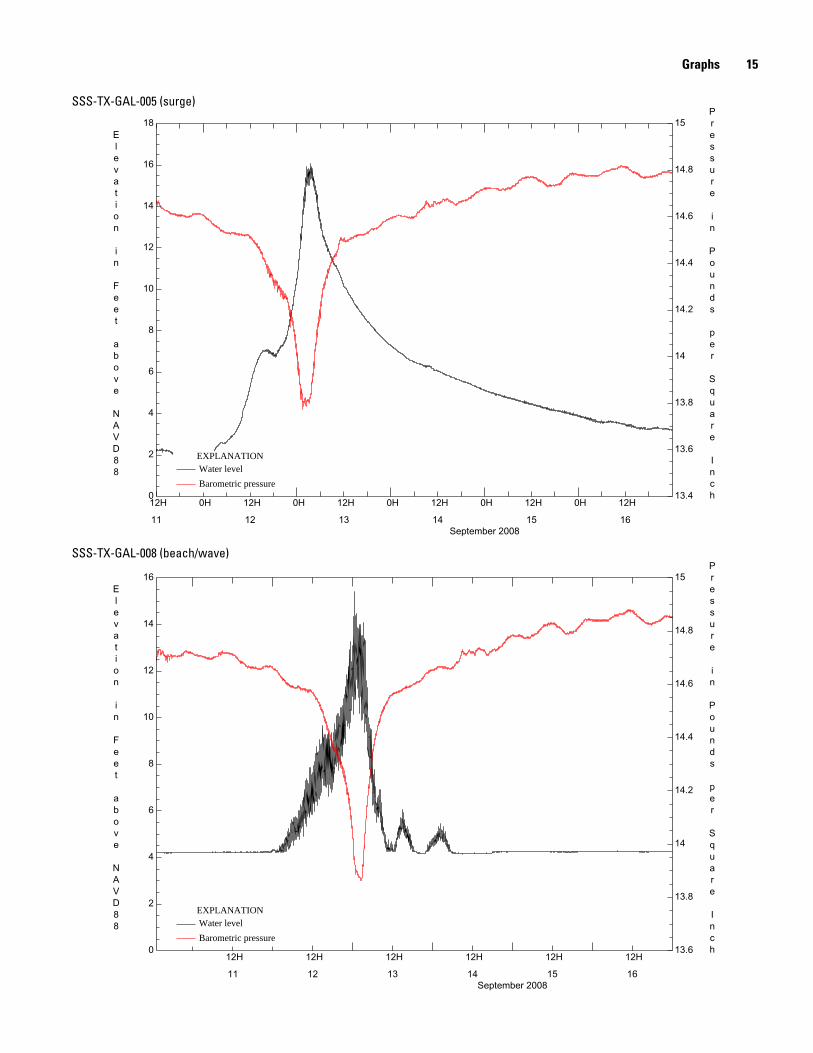
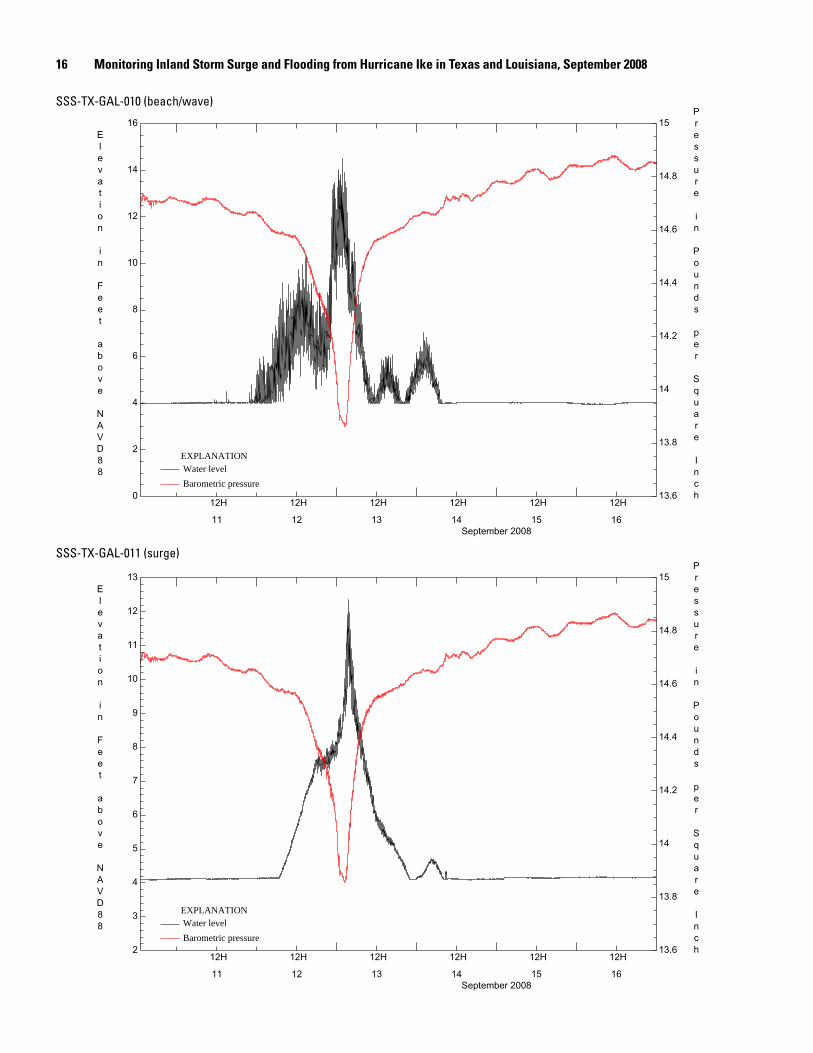
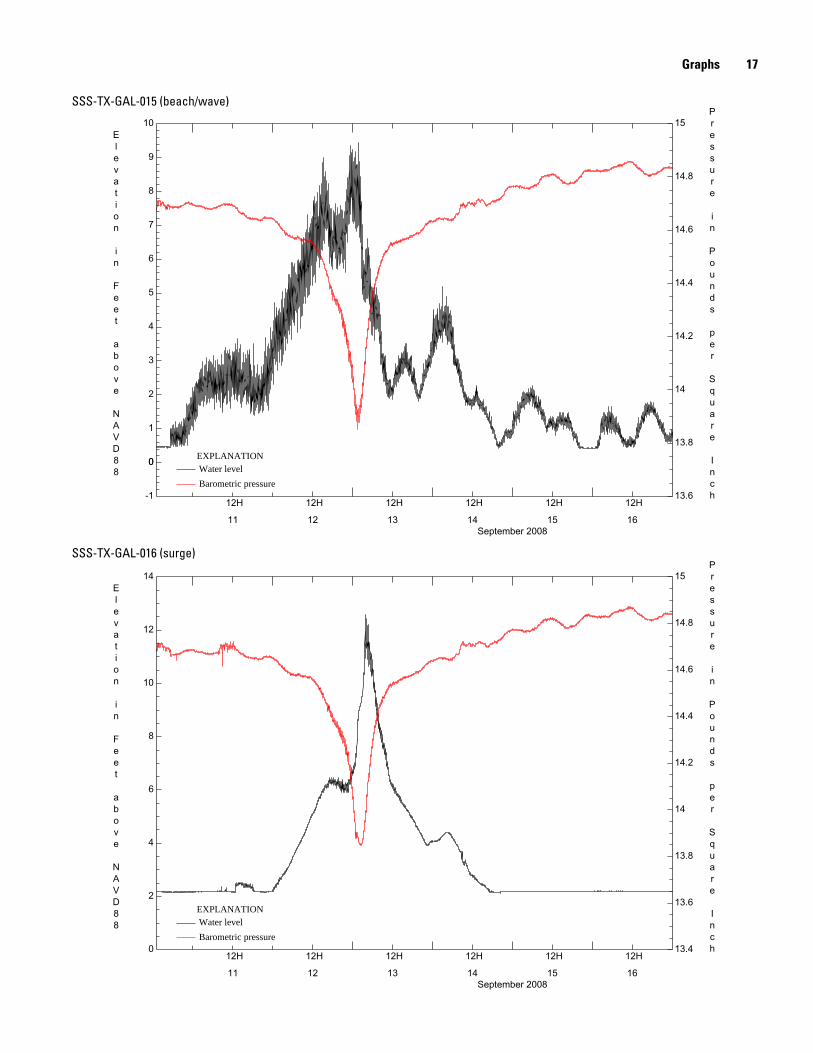
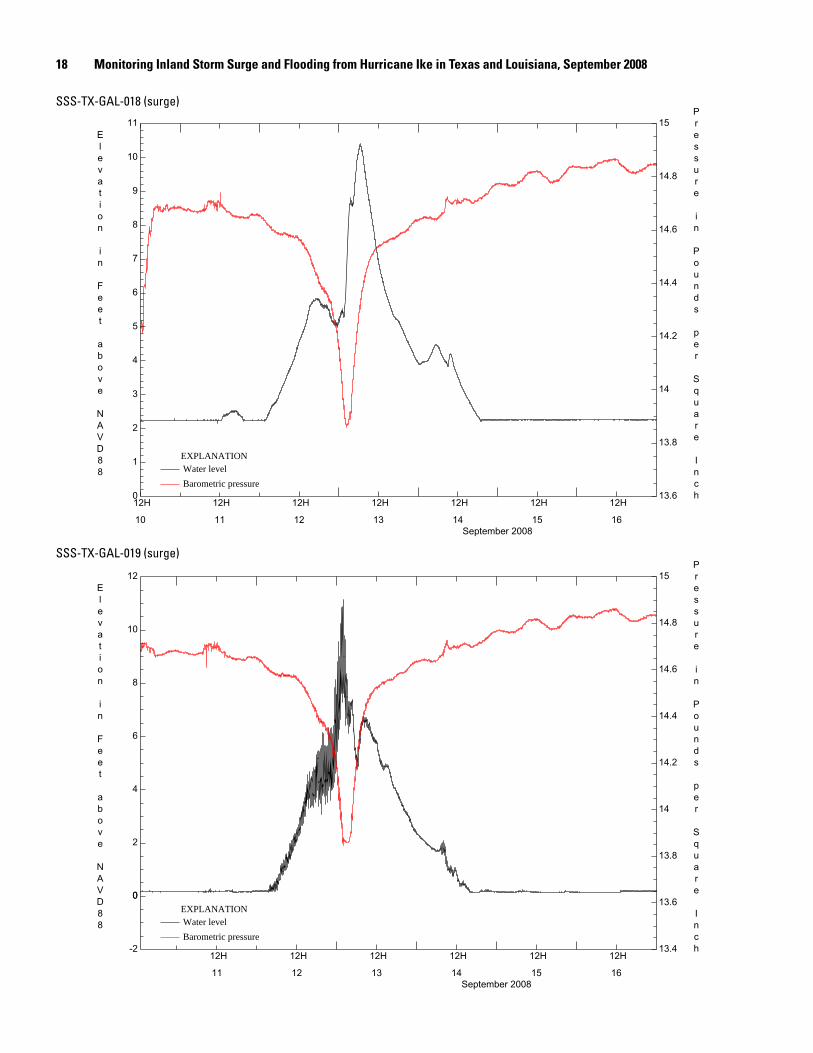
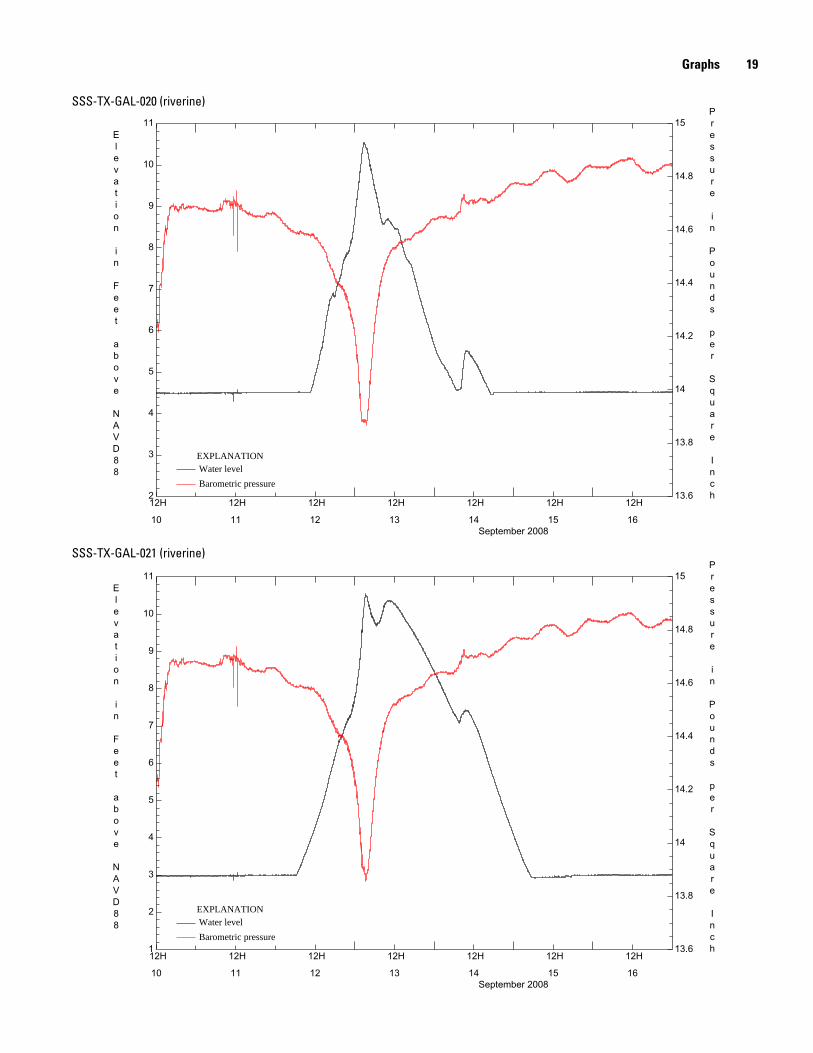
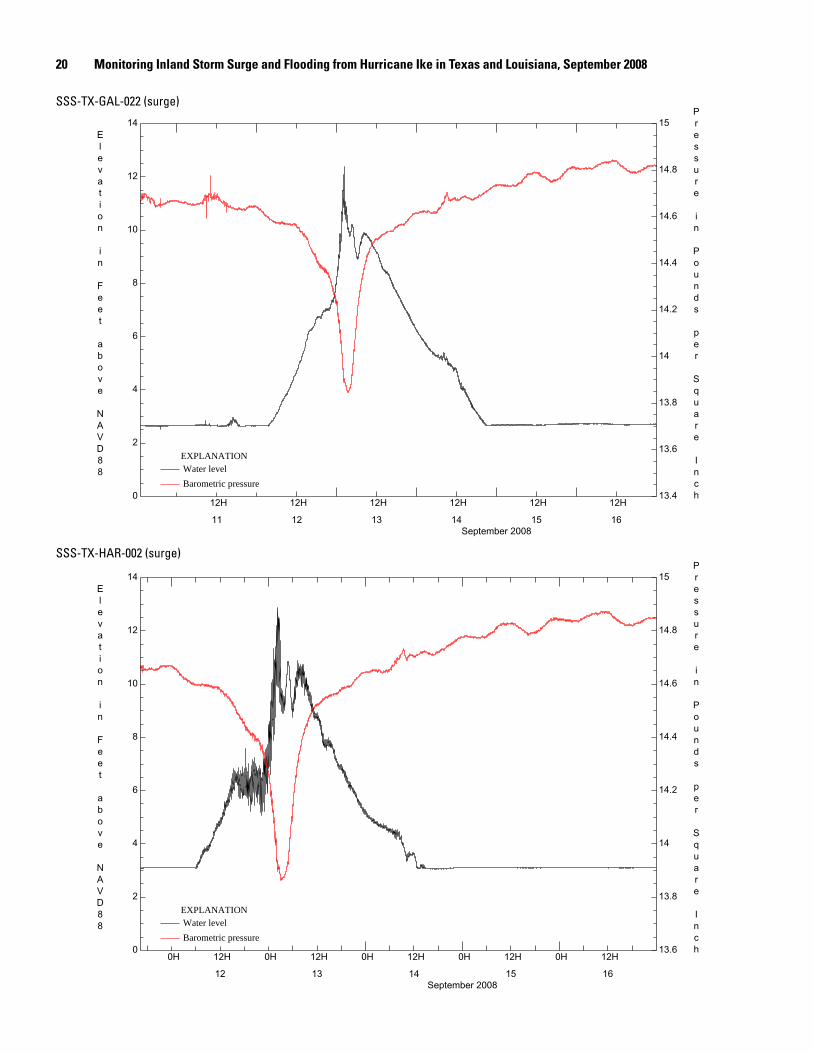
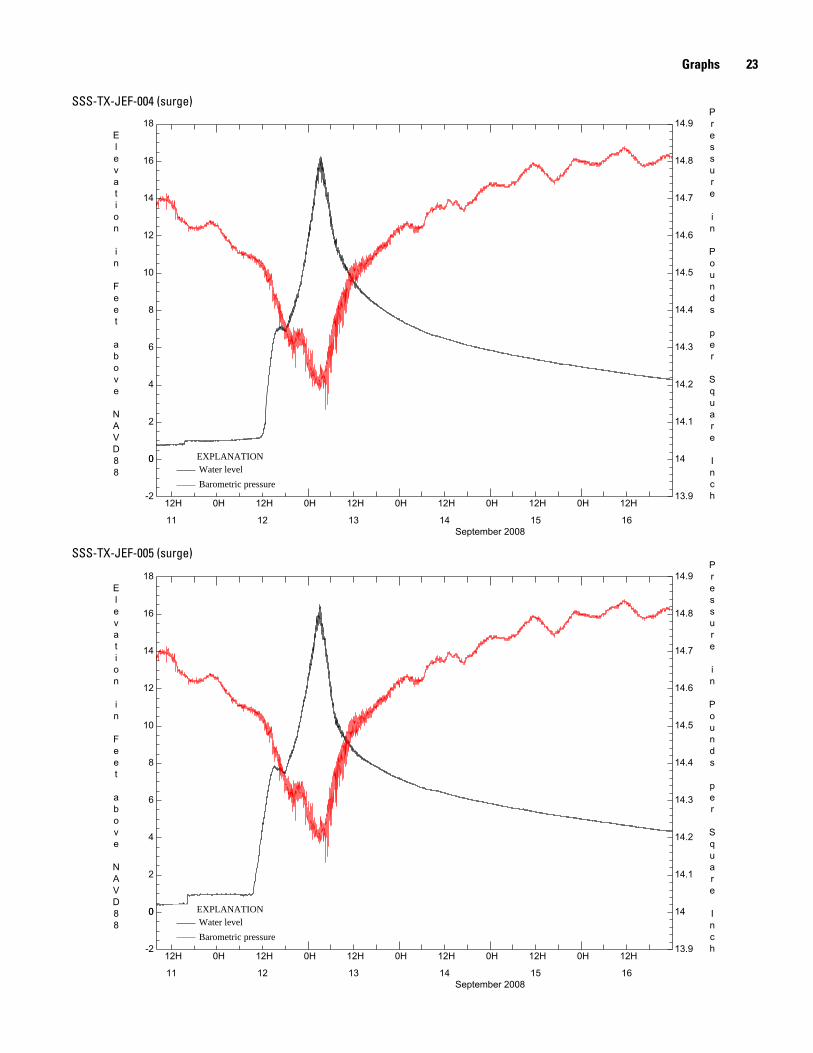
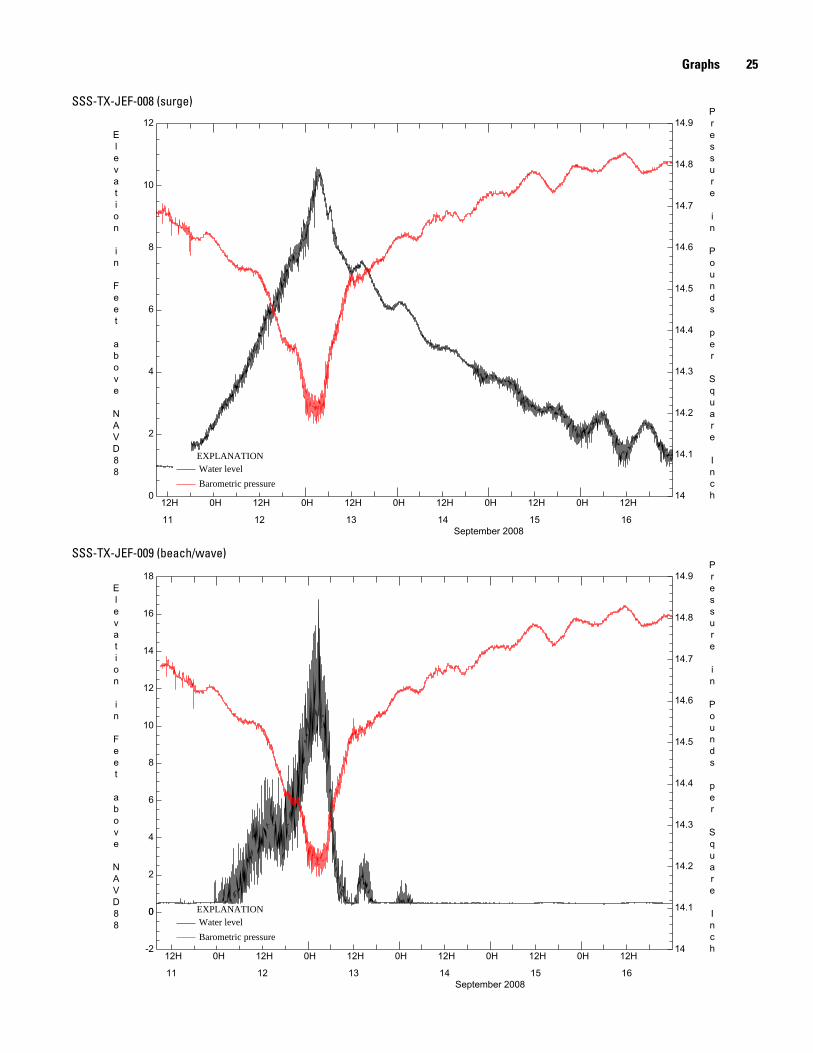
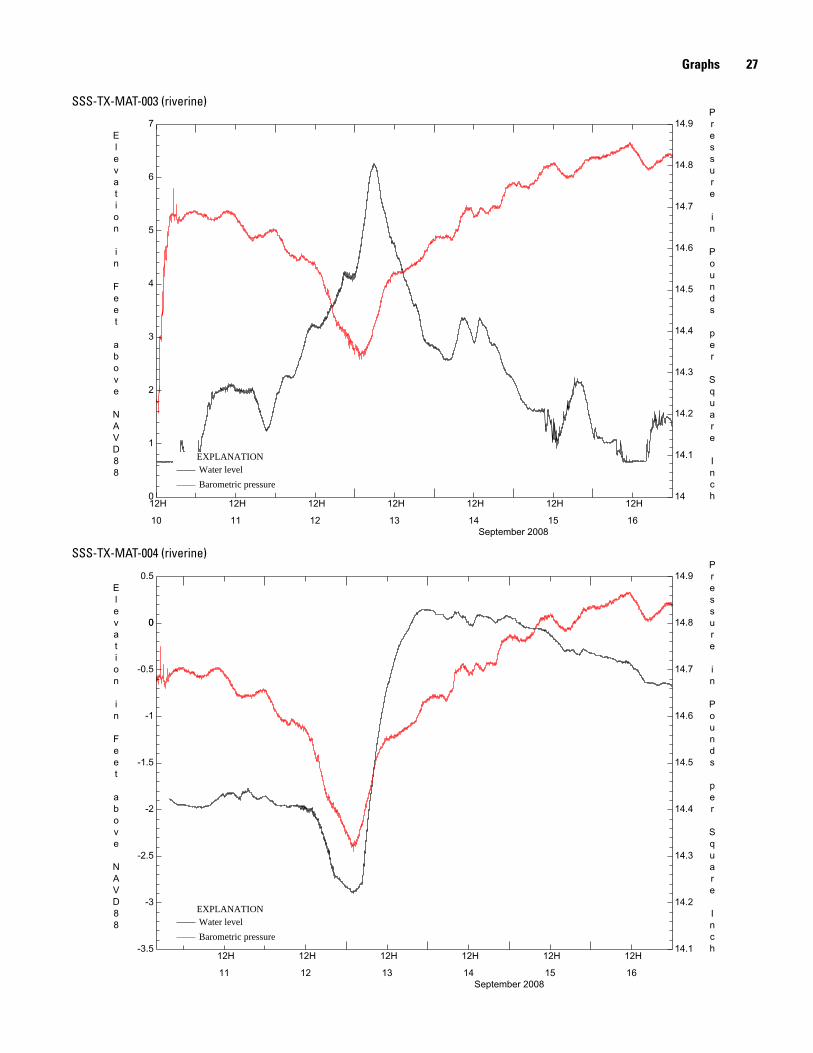
The U.S. Geological Survey (USGS) deployed a tempo-rary monitoring network of 117 pressure transducers (sensors) at 65 sites over an area of about 5,000 square miles to record the timing, areal extent, and magnitude of inland hurricane storm surge and coastal flooding generated by Hurricane Ike, which struck southeastern Texas and southwestern Louisiana September 12–13, 2008. Fifty-six sites were in Texas and nine were in Louisiana. Sites were categorized as surge, riverine, or beach/wave on the basis of proximity to the Gulf Coast. One-hundred five sensors from 59 sites (fig. 1) were recovered; 12 sensors from six sites either were lost during the storm or were not retrieved. All 59 sites (41 surge, 10 riverine, 8 beach/wave) had sensors to record water pressure (fig. 2), which is expressed as water level in feet above North American Verti-cal Datum of 1988 (NAVD88), and 46 sites had an additional sensor to record barometric pressure, expressed in pounds per square inch. Figure 3 shows an example of water level and barometric pressure over time recorded by sensors during the storm.
Data were collected and processed following protocols established by McGee and others (2005), which included correcting water pressure for changes in barometric pressure and salinity. Quality-control checks were made by colocating water-level sensors at a subset of sites and comparing data from those sensors to water levels computed from recorded pressure data at those sites; and by comparing water levels computed from recorded pressure data to water levels recorded at nearby USGS gaging stations and to independent high-water marks where possible. Elevation surveys using global position-
ing systems (fig. 4) and differential levels were done to relate all water-level data, reference marks, benchmarks, and sensor measuring points to NAVD88.
The data from the Hurricane Ike storm-surge network constitute an extensive collection of continuous water-level records documenting a single land-falling hurricane. The data can be used to evaluate the performance of storm-surge models for maximum and incremental water level and flood extent and site-specific effects of storm surge on natural and anthropogenic elements of the environment. The data are available on a provisional basis in tab-delimited, ASCII format by site for each sensor (see table 1 at http://pubs.usgs.gov/of/2008/1365/). Data for each site comprise date, time, water level, corresponding water pressure, barometric pres-sure, temperature from water-pressure sensor, temperature from barometric-pressure sensor, and indicators of missing data. The data-processing date is in the file header. The data also are available in a single folder at http://pubs.usgs.gov/of/2008/1365/.
Reference
McGee, B.D., Goree, B.B., Tollett, R.W., Woodward, B.K., and Kress, W.H., 2005, Hurricane Rita surge data, southwestern Louisiana and southeastern Texas, September to November 2005: U.S. Geological Survey Data Series 220, available at http://pubs.usgs.gov/ds/2006/220/.
2 Monitoring Inland Storm Surge and Flooding from Hurricane Ike in Texas and Louisiana, September 2008
")
")
")
")
")
")
")")
")
")")
")
")
")
")
")
")
")
")
")
")")
")")
")
")
")
")")
")")
")
")
")
")
")
")")
")")
")
")")
")
")
")") ")
")
")")
")")
")
")")
")")
")
Sabi
ne
Colorado
River
Brazos River
Trinity River
Lake
Texa
na
Lava
caBa
y
San
Anto
nio
Bay
Mat
agor
daBa
y
Car
anca
hua
Bay
Tres
Pal
acio
sBa
yEa
st M
atag
orda
Bay
Wes
tBa
y
East
Bay
Gal
vest
on B
ay
Trin
ity B
ay
Riv e
rG
rand
Lake
Whi
teLa
ke
GU
LF O
F
MEX
ICO
Sabi
neLa
ke
Blac
kLa
ke
UV288
UV36
UV6
UV111
UV105
UV87
UV14
UV71
UV82
UV109UV91
UV146UV326
UV62
UV124
UV172
UV73
UV60
UV384UV159
UV27
UV35
£ ¤59
£ ¤69
£ ¤290
£ ¤90
§̈ ¦210
§̈ ¦610
§̈ ¦10
§̈ ¦45§̈ ¦10
Peca
n Gr
ove
Bren
ham El
Cam
po
Cinc
o Ra
nch
Sulp
hurM
oss
Bluf
fCr
owle
y
Port
Lava
ca
Free
port
Bay
City
Vido
r
Sant
a Fe
Port
Nec
hesOr
ange
Ned
erla
nd
Staf
ford
Rich
mon
d
Katy
Gale
na P
ark
Angl
eton
Aldi
ne
Tom
ball
Hum
ble
Bea
umon
t
Pasa
dena
Hou
ston
LAV
AC
AC
OU
NTY
JAC
KSO
NC
OU
NTY
FORT
BEN
DC
OU
NTY
FAY
ETTE
CO
UN
TY CO
LOR
AD
OC
OU
NTY
CA
LCA
SIEU
PAR
ISH
AC
AD
IAPA
RIS
H
CA
LHO
UN
CO
UN
TY
OR
AN
GE
CO
UN
TY
LIB
ERTY
CO
UN
TYJE
FFER
SON
CO
UN
TY
HA
RR
ISC
OU
NTY
CH
AM
BER
SC
OU
NTY
BR
AZO
RIA
CO
UN
TY
MO
NTG
OM
ERY
CO
UN
TYH
AR
DIN
CO
UN
TY
AU
STIN
CO
UN
TY
WH
AR
TON
CO
UN
TY
WA
SHIN
GTO
NC
OU
NTY
WA
LLER
CO
UN
TY
MA
TAG
OR
DA
CO
UN
TY
VER
MIL
ION
PAR
ISH
JEFF
ERSO
ND
AV
ISPA
RIS
H
CO
UN
TY
CA
MER
ON
PAR
ISH
GA
LVES
TON
SSS-
LA-V
ER-0
07
SSS-
TX-C
AL-0
04SS
S-TX
-CAL
-005
SSS-
TX-C
HA-0
03
SSS-
TX-B
RA-0
01
SSS-
TX-C
HA-0
04
SSS-
TX-G
AL-0
01
SSS-
TX-G
AL-0
08
SSS-
TX-G
AL-0
02SS
S-TX
-GAL
-005
SSS-
TX-G
AL-0
16
SSS-
TX-G
AL-0
18
SSS-
TX-J
EF-0
01SS
S-TX
-JEF
-002
SSS-
TX-J
EF-0
04
SSS-
TX-J
EF-0
05
SSS-
TX-G
AL-0
10
SSS-
TX-G
AL-0
19
SSS-
TX-G
AL-0
20SS
S-TX
-GAL
-021
SSS-
TX-G
AL-0
22
SSS-
TX-H
AR-0
02
SSS-
TX-H
AR-0
03
SSS-
TX-H
AR-0
04
SSS-
TX-M
AT-0
01
SSS-
TX-J
EF-0
06
SSS-
TX-M
AT-0
02SS
S-TX
-MAT
-003
SSS-
LA-C
AM-0
11
SSS-
TX-J
EF-0
07
SSS-
TX-M
AT-0
05
SSS-
TX-J
EF-0
08
SSS-
TX-M
AT-0
04
SSS-
TX-J
EF-0
09
SSS-
TX-M
AT-0
06
SSS-
TX-B
RA-0
04
SSS-
TX-B
RA-0
05 SSS-
TX-M
AT-0
08SS
S-TX
-MAT
-009
SSS-
TX-G
AL-0
11
SSS-
TX-G
AL-0
15
SSS-
TX-M
AT-0
10
SSS-
TX-B
RA-0
11
SSS-
TX-C
AL-0
01SS
S-TX
-CAL
-002
SSS-
LA-C
AM-0
01
SSS-
TX-B
RA-0
06
SSS-
TX-M
AT-0
07
SSS-
TX-B
RA-0
07
SSS-
TX-B
RA-0
08
SSS-
TX-B
RA-0
09
SSS-
LA-C
AM-0
02SS
S-LA
-CAM
-003
SSS-
TX-B
RA-0
10
SSS-
LA-C
AM-0
10
SSS-
TX-B
RA-0
02
SSS-
LA-C
AM-0
12 SSS-
LA-V
ER-0
06
SSS-
TX-C
AL-0
03
93°
94°
95°
96°
30°
29°
30°
29°
93°
94°
95°
96°
020
3040
10M
ILES
600
3015
KILO
MET
ERS
45
EX
PL
AN
AT
ION
Bea
ch/w
ave
site
Riv
erin
e si
teS
urg
e si
te
") " ")
SS
S-T
X-G
AL-
015
SS
S-T
X-B
RA
-011
SS
S-T
X-M
AT-0
02)
Loca
tion
map
TE
XA
S
LOU
ISIA
NA
Gul
f of
Mex
ico
Figu
re 1
. Se
nsor
site
s fro
m w
hich
sto
rm-s
urge
dat
a w
ere
obta
ined
dur
ing
Hurr
ican
e Ik
e.
Elevation
in
Feet
above
NAVD88
Pressure
in
Pounds
per
Square
Inch
September 200811
12H
12
12H
13
12H
14
12H
15
12H
16
12H0
1
2
3
4
5
6
7
8
13.6
13.8
14
14.2
14.4
14.6
14.8
15
Water level
Barometric pressure
EXPLANATION
Figures 3
Figure 2. Pressure transducer (sensor) attached to power pole to record storm surge.
Figure 3. Example of water level and barometric pressure recorded during Hurricane Ike.
Figure 4. Global positioning system surveying of storm-surge site after Hurricane Ike.
4 Monitoring Inland Storm Surge and Flooding from Hurricane Ike in Texas and Louisiana, September 2008
Table 1. Hurricane Ike storm-surge data for 59 sites in Texas and Louisiana, September 2008—Continued.
Site nameCounty or
parishLatitude, decimal degrees Longitude, decimal degrees Site type
Graph (page number)
SSS-TX-BRA-001 Brazoria 29.21194 -95.20833 surge 5
SSS-TX-BRA-002 Brazoria 29.08472 -95.28806 surge 6
SSS-TX-BRA-004 Brazoria 28.86833 -95.44861 surge 6
SSS-TX-BRA-005 Brazoria 28.94944 -95.55556 riverine 7
SSS-TX-BRA-006 Brazoria 28.86667 -95.58722 surge 7
SSS-TX-BRA-007 Brazoria 29.28667 -95.13139 riverine 8
SSS-TX-BRA-008 Brazoria 29.03556 -95.39889 surge 8
SSS-TX-BRA-009 Brazoria 29.01306 -95.32972 surge 9
SSS-TX-BRA-010 Brazoria 29.33639 -95.28417 riverine 9
SSS-TX-BRA-011 Brazoria 29.29667 -95.35667 riverine 10
SSS-TX-CAL-001 Calhoun 28.40639 -96.71167 surge 10
SSS-TX-CAL-002 Calhoun 28.44444 -96.40250 surge 11
SSS-TX-CAL-003 Calhoun 28.61917 -96.61972 surge 11
SSS-TX-CAL-004 Calhoun 28.66056 -96.41167 surge 12
SSS-TX-CAL-005 Calhoun 28.64139 -96.32333 surge 12
SSS-TX-CHA-003 Chambers 29.60417 -94.67528 surge 13
SSS-TX-CHA-004 Chambers 29.77278 -94.68694 surge 13
SSS-TX-GAL-001 Galveston 29.45139 -94.63417 beach/wave 14
SSS-TX-GAL-002 Galveston 29.46583 -94.64806 surge 14
SSS-TX-GAL-005 Galveston 29.59444 -94.39028 surge 15
SSS-TX-GAL-008 Galveston 29.33444 -94.75111 beach/wave 15
SSS-TX-GAL-010 Galveston 29.23806 -94.87778 beach/wave 16
SSS-TX-GAL-011 Galveston 29.22083 -94.94472 surge 16
SSS-TX-GAL-015 Galveston 29.08611 -95.11722 beach/wave 17
SSS-TX-GAL-016 Galveston 29.30389 -94.90528 surge 17
SSS-TX-GAL-018 Galveston 29.35583 -95.04000 surge 18
SSS-TX-GAL-019 Galveston 29.50639 -94.95778 surge 18
SSS-TX-GAL-020 Galveston 29.45667 -95.04778 riverine 19
SSS-TX-GAL-021 Galveston 29.51333 -95.10389 riverine 19
SSS-TX-GAL-022 Galveston 29.55167 -95.02472 surge 20
SSS-TX-HAR-002 Harris 29.62028 -94.99889 surge 20
SSS-TX-HAR-003 Harris 29.59194 -95.12833 surge 21
SSS-TX-HAR-004 Harris 29.71306 -94.99333 surge 21
SSS-TX-JEF-001 Jefferson 29.68444 -94.19278 surge 22
SSS-TX-JEF-002 Jefferson 29.67500 -94.04361 beach/wave 22
SSS-TX-JEF-004 Jefferson 29.71028 -94.11639 surge 23
SSS-TX-JEF-005 Jefferson 29.69694 -94.09833 surge 23
SSS-TX-JEF-006 Jefferson 29.71111 -93.86000 surge 24
SSS-TX-JEF-007 Jefferson 29.77389 -93.94250 surge 24
SSS-TX-JEF-008 Jefferson 29.76472 -93.89778 surge 25
SSS-TX-JEF-009 Jefferson 29.66265 -94.08835 beach/wave 25
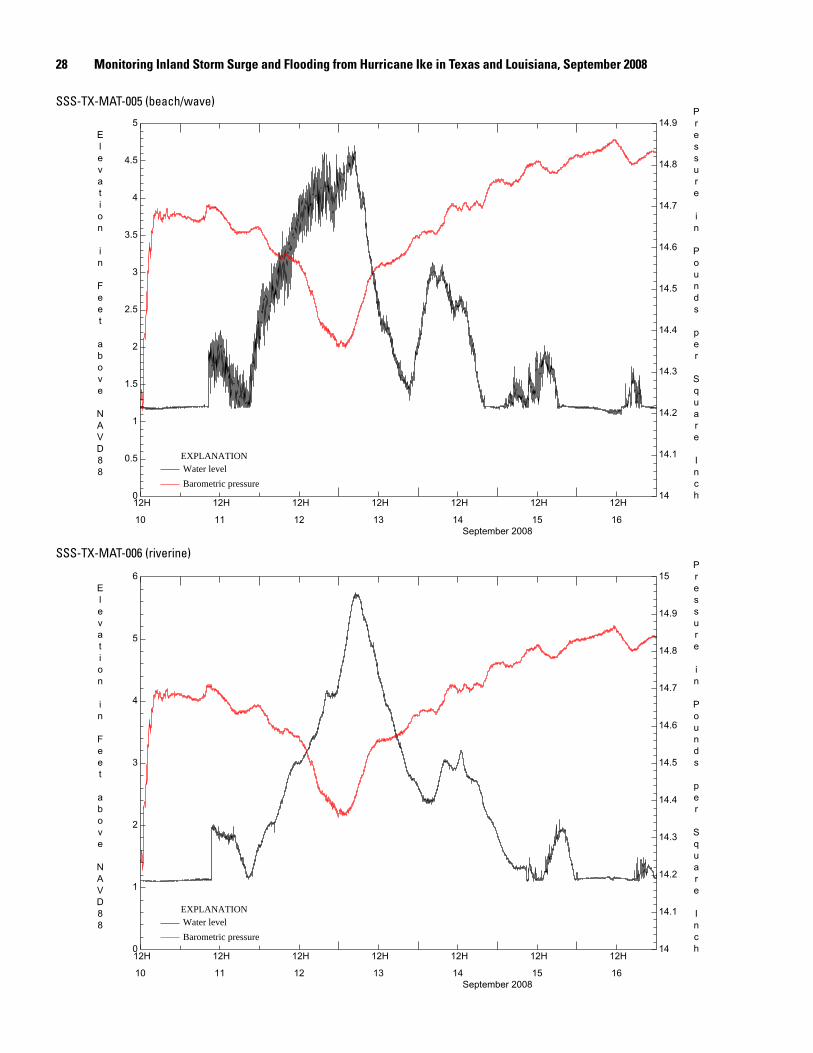
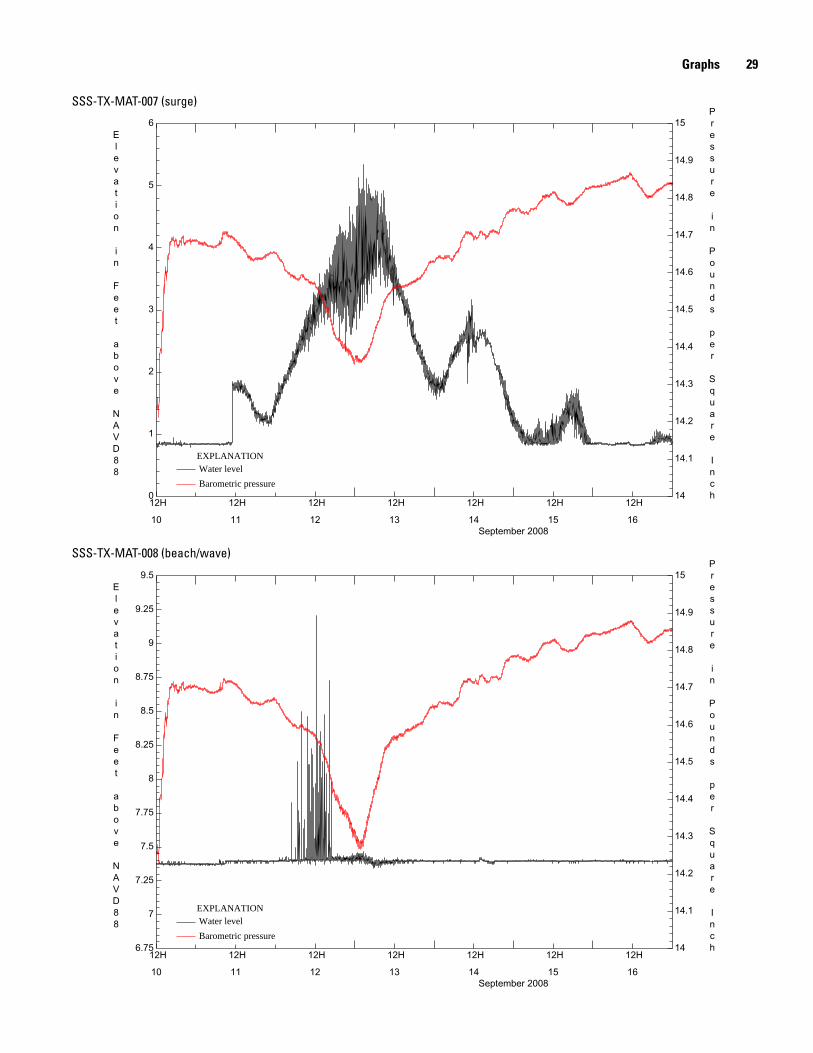
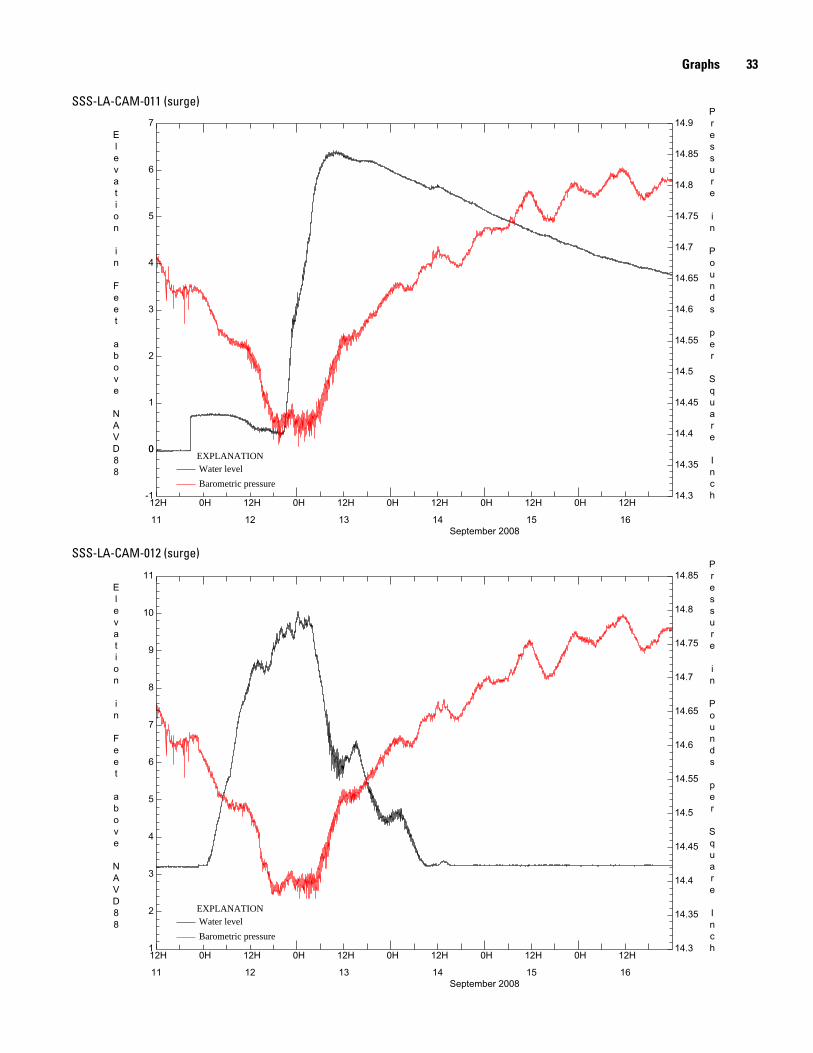
Table 1. Hurricane Ike storm-surge data for 59 sites in Texas and Louisiana, September 2008.
[All graphs of water level and barometric pressure are available at http://pubs.usgs.gov/of/2008/1365/; graphs are shown following this table as indicated]

Elevation
in
Feet
above
NAVD88
Pressure
in
Pounds
per
Square
Inch
September 200811
12H
12
12H
13
12H
14
12H
15
12H
16
12H0
1
2
3
4
5
6
7
8
13.6
13.8
14
14.2
14.4
14.6
14.8
15
Water level
Barometric pressure
EXPLANATION
SSS-TX-BRA-001 (surge)
Table 1 5
Table 1. Hurricane Ike storm-surge data for 59 sites in Texas and Louisiana, September 2008—Continued.
Site nameCounty or
parishLatitude, decimal degrees Longitude, decimal degrees Site type
Graph (page number)
SSS-TX-MAT-001 Matagorda 28.72056 -96.27389 surge 26
SSS-TX-MAT-002 Matagorda 28.78639 -96.15028 surge 26
SSS-TX-MAT-003 Matagorda 28.78750 -95.99583 riverine 27
SSS-TX-MAT-004 Matagorda 28.83889 -95.85278 riverine 27
SSS-TX-MAT-005 Matagorda 28.60056 -95.97806 beach/wave 28
SSS-TX-MAT-006 Matagorda 28.68306 -95.97556 riverine 28
SSS-TX-MAT-007 Matagorda 28.61139 -96.21528 surge 29
SSS-TX-MAT-008 Matagorda 28.76417 -95.62694 beach/wave 29
SSS-TX-MAT-009 Matagorda 28.77056 -95.61667 surge 30
SSS-TX-MAT-010 Matagorda 28.83639 -95.66833 riverine 30
SSS-LA-CAM-001 Cameron 29.75028 -93.66361 surge 31
SSS-LA-CAM-002 Cameron 29.76194 -93.58250 surge 31
SSS-LA-CAM-003 Cameron 29.80417 -93.34889 surge 32
SSS-LA-CAM-010 Cameron 29.78611 -93.11500 surge 32
SSS-LA-CAM-011 Cameron 29.87056 -93.07972 surge 33
SSS-LA-CAM-012 Cameron 29.77056 -93.01444 surge 33
SSS-LA-VER-006 Vermilion 29.64111 -92.42694 surge 34
SSS-LA-VER-007 Vermilion 29.60028 -92.34167 surge 34
Elevation
in
Feet
above
NAVD88
Pressure
in
Pounds
per
Square
Inch
September 200811
12H
12
12H
13
12H
14
12H
15
12H
16
12H0
1
2
3
4
5
6
14
14.1
14.2
14.3
14.4
14.5
14.6
14.7
14.8
14.9
15
Water level
Barometric pressure
EXPLANATION
Elevation
in
Feet
above
NAVD88
Pressure
in
Pounds
per
Square
Inch
September 200811
12H
12
12H
13
12H
14
12H
15
12H
16
12H1.5
2
2.5
3
3.5
4
4.5
5
5.5
6
6.5
7
7.5
13.6
13.8
14
14.2
14.4
14.6
14.8
15
Water level
Barometric pressure
EXPLANATION
6 Monitoring Inland Storm Surge and Flooding from Hurricane Ike in Texas and Louisiana, September 2008
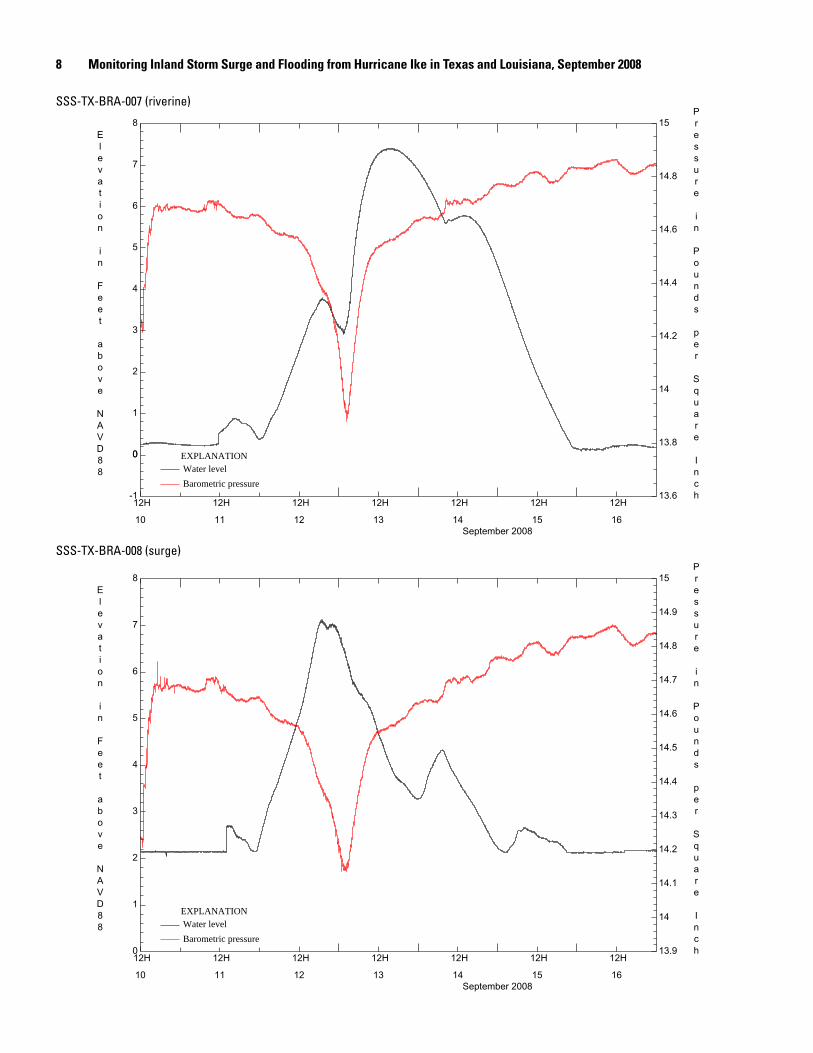
SSS-TX-BRA-002 (surge)
SSS-TX-BRA-004 (surge)

Elevation
in
Feet
above
NAVD88
Pressure
in
Pounds
per
Square
Inch
September 200811
12H
12
12H
13
12H
14
12H
15
12H
16
12H1
1.25
1.5
1.75
2
2.25
2.5
2.75
3
3.25
3.5
3.75
4
14.1
14.2
14.3
14.4
14.5
14.6
14.7
14.8
14.9
15
Water level
Barometric pressure
EXPLANATION
Elevation
in
Feet
above
NAVD88
Pressure
in
Pounds
per
Square
Inch
September 200811
12H
12
12H
13
12H
14
12H
15
12H
16
12H0.5
1
1.5
2
2.5
3
3.5
4
4.5
5
5.5
6
14
14.1
14.2
14.3
14.4
14.5
14.6
14.7
14.8
14.9
Water level
Barometric pressure
EXPLANATION
Graphs 7
SSS-TX-BRA-005 (riverine)
SSS-TX-BRA-006 (surge)
Elevation
in
Feet
above
NAVD88
Pressure
in
Pounds
per
Square
Inch
September 200810
12H
11
12H
12
12H
13
12H
14
12H
15
12H
16
12H0
1
2
3
4
5
6
7
8
13.9
14
14.1
14.2
14.3
14.4
14.5
14.6
14.7
14.8
14.9
15
Water level
Barometric pressure
EXPLANATION
Elevation
in
Feet
above
NAVD88
Pressure
in
Pounds
per
Square
Inch
September 200810
12H
11
12H
12
12H
13
12H
14
12H
15
12H
16
12H-1
00
1
2
3
4
5
6
7
8
13.6
13.8
14
14.2
14.4
14.6
14.8
15
Water level
Barometric pressure
EXPLANATION
8 Monitoring Inland Storm Surge and Flooding from Hurricane Ike in Texas and Louisiana, September 2008
SSS-TX-BRA-007 (riverine)
SSS-TX-BRA-008 (surge)

Elevation
in
Feet
above
NAVD88
Pressure
in
Pounds
per
Square
Inch
September 200810
12H
11
12H
12
12H
13
12H
14
12H
15
12H
16
12H-2
00
2
4
6
8
10
13.8
13.9
14
14.1
14.2
14.3
14.4
14.5
14.6
14.7
14.8
14.9
15
Water level
Barometric pressure
EXPLANATION
Elevation
in
Feet
above
NAVD88
Pressure
in
Pounds
per
Square
Inch
September 200810
12H
11
12H
12
12H
13
12H
14
12H
15
12H
16
12H0
1
2
3
4
5
6
7
8
13.9
14
14.1
14.2
14.3
14.4
14.5
14.6
14.7
14.8
14.9
15
Water level
Barometric pressure
EXPLANATION
Graphs 9
SSS-TX-BRA-009 (surge)
SSS-TX-BRA-010 (riverine)

Elevation
in
Feet
above
NAVD88
Pressure
in
Pounds
per
Square
Inch
September 200811
12H
12
0H 12H
13
0H 12H
14
0H 12H
15
0H 12H
16
0H 12H1.25
1.5
1.75
2
2.25
2.5
2.75
3
3.25
3.5
3.75
4
4.25
4.5
14.3
14.35
14.4
14.45
14.5
14.55
14.6
14.65
14.7
14.75
14.8
14.85
14.9
Water level
Barometric pressure
EXPLANATION
Elevation
in
Feet
above
NAVD88
Pressure
in
Pounds
per
Square
Inch
September 200810
12H
11
12H
12
12H
13
12H
14
12H
15
12H
16
12H10
12
14
16
18
20
22
24
26
28
13.8
13.9
14
14.1
14.2
14.3
14.4
14.5
14.6
14.7
14.8
14.9
15
Water level
Barometric pressure
EXPLANATION
10 Monitoring Inland Storm Surge and Flooding from Hurricane Ike in Texas and Louisiana, September 2008
SSS-TX-BRA-011 (riverine)
SSS-TX-CAL-001 (surge)
Elevation
in
Feet
above
NAVD88
Pressure
in
Pounds
per
Square
Inch
September 200811
12H
12
0H 12H
13
0H 12H
14
0H 12H
15
0H 12H
16
0H 12H0
0.5
1
1.5
2
2.5
3
3.5
4
14.3
14.35
14.4
14.45
14.5
14.55
14.6
14.65
14.7
14.75
14.8
14.85
14.9
Water level
Barometric pressure
EXPLANATION
Elevation
in
Feet
above
NAVD88
Pressure
in
Pounds
per
Square
Inch
September 200811
12H
12
0H 12H
13
0H 12H
14
0H 12H
15
0H 12H
16
0H 12H1
1.5
2
2.5
3
3.5
4
4.5
5
14.3
14.35
14.4
14.45
14.5
14.55
14.6
14.65
14.7
14.75
14.8
14.85
14.9
Water level
Barometric pressure
EXPLANATION
Graphs 11
SSS-TX-CAL-002 (surge)
SSS-TX-CAL-003 (surge)
Elevation
in
Feet
above
NAVD88
Pressure
in
Pounds
per
Square
Inch
September 200811
12H
12
0H 12H
13
0H 12H
14
0H 12H
15
0H 12H
16
0H 12H0.5
1
1.5
2
2.5
3
3.5
4
4.5
5
5.5
14.2
14.3
14.4
14.5
14.6
14.7
14.8
14.9
Water level
Barometric pressure
EXPLANATION
Elevation
in
Feet
above
NAVD88
Pressure
in
Pounds
per
Square
Inch
September 200811
12H
12
0H 12H
13
0H 12H
14
0H 12H
15
0H 12H
16
0H 12H1.5
1.75
2
2.25
2.5
2.75
3
3.25
3.5
3.75
4
4.25
4.5
14.2
14.3
14.4
14.5
14.6
14.7
14.8
14.9
Water level
Barometric pressure
EXPLANATION
12 Monitoring Inland Storm Surge and Flooding from Hurricane Ike in Texas and Louisiana, September 2008
SSS-TX-CAL-004 (surge)
SSS-TX-CAL-005 (surge)

Elevation
in
Feet
above
NAVD88
Pressure
in
Pounds
per
Square
Inch
September 200811
12H
12
0H 12H
13
0H 12H
14
0H 12H
15
0H 12H
16
0H 12H0
2
4
6
8
10
12
14
16
18
13.4
13.6
13.8
14
14.2
14.4
14.6
14.8
15
Water level
Barometric pressure
EXPLANATION
Elevation
in
Feet
above
NAVD88
Pressure
in
Pounds
per
Square
Inch
September 200811
12H
12
0H 12H
13
0H 12H
14
0H 12H
15
0H 12H
16
0H 12H0
2
4
6
8
10
12
14
13.4
13.6
13.8
14
14.2
14.4
14.6
14.8
15
Water level
Barometric pressure
EXPLANATION
Graphs 13
SSS-TX-CHA-003 (surge)
SSS-TX-CHA-004 (surge)
Elevation
in
Feet
above
NAVD88
Pressure
in
Pounds
per
Square
Inch
September 200811
12H
12
0H 12H
13
0H 12H
14
0H 12H
15
0H 12H
16
0H 12H0
2
4
6
8
10
12
14
16
13.4
13.6
13.8
14
14.2
14.4
14.6
14.8
15
Water level
Barometric pressure
EXPLANATION
Elevation
in
Feet
above
NAVD88
Pressure
in
Pounds
per
Square
Inch
September 200811
12H
12
0H 12H
13
0H 12H
14
0H 12H
15
0H 12H
16
0H 12H4
6
8
10
12
14
16
18
20
13.4
13.6
13.8
14
14.2
14.4
14.6
14.8
15
Water level
Barometric pressure
EXPLANATION
14 Monitoring Inland Storm Surge and Flooding from Hurricane Ike in Texas and Louisiana, September 2008
SSS-TX-GAL-001 (beach/wave)
SSS-TX-GAL-002 (surge)
Elevation
in
Feet
above
NAVD88
Pressure
in
Pounds
per
Square
Inch
September 200811
12H
12
12H
13
12H
14
12H
15
12H
16
12H0
2
4
6
8
10
12
14
16
13.6
13.8
14
14.2
14.4
14.6
14.8
15
Water level
Barometric pressure
EXPLANATION
Elevation
in
Feet
above
NAVD88
Pressure
in
Pounds
per
Square
Inch
September 200811
12H
12
0H 12H
13
0H 12H
14
0H 12H
15
0H 12H
16
0H 12H0
2
4
6
8
10
12
14
16
18
13.4
13.6
13.8
14
14.2
14.4
14.6
14.8
15
Water level
Barometric pressure
EXPLANATION
Graphs 15
SSS-TX-GAL-005 (surge)
SSS-TX-GAL-008 (beach/wave)
Elevation
in
Feet
above
NAVD88
Pressure
in
Pounds
per
Square
Inch
September 200811
12H
12
12H
13
12H
14
12H
15
12H
16
12H2
3
4
5
6
7
8
9
10
11
12
13
13.6
13.8
14
14.2
14.4
14.6
14.8
15
Water level
Barometric pressure
EXPLANATION
Elevation
in
Feet
above
NAVD88
Pressure
in
Pounds
per
Square
Inch
September 200811
12H
12
12H
13
12H
14
12H
15
12H
16
12H0
2
4
6
8
10
12
14
16
13.6
13.8
14
14.2
14.4
14.6
14.8
15
Water level
Barometric pressure
EXPLANATION
16 Monitoring Inland Storm Surge and Flooding from Hurricane Ike in Texas and Louisiana, September 2008
SSS-TX-GAL-010 (beach/wave)
SSS-TX-GAL-011 (surge)
Elevation
in
Feet
above
NAVD88
Pressure
in
Pounds
per
Square
Inch
September 200811
12H
12
12H
13
12H
14
12H
15
12H
16
12H0
2
4
6
8
10
12
14
13.4
13.6
13.8
14
14.2
14.4
14.6
14.8
15
Water level
Barometric pressure
EXPLANATION
Elevation
in
Feet
above
NAVD88
Pressure
in
Pounds
per
Square
Inch
September 200811
12H
12
12H
13
12H
14
12H
15
12H
16
12H-1
00
1
2
3
4
5
6
7
8
9
10
13.6
13.8
14
14.2
14.4
14.6
14.8
15
Water level
Barometric pressure
EXPLANATION
Graphs 17
SSS-TX-GAL-015 (beach/wave)
SSS-TX-GAL-016 (surge)
Elevation
in
Feet
above
NAVD88
Pressure
in
Pounds
per
Square
Inch
September 200811
12H
12
12H
13
12H
14
12H
15
12H
16
12H-2
00
2
4
6
8
10
12
13.4
13.6
13.8
14
14.2
14.4
14.6
14.8
15
Water level
Barometric pressure
EXPLANATION
Elevation
in
Feet
above
NAVD88
Pressure
in
Pounds
per
Square
Inch
September 200810
12H
11
12H
12
12H
13
12H
14
12H
15
12H
16
12H0
1
2
3
4
5
6
7
8
9
10
11
13.6
13.8
14
14.2
14.4
14.6
14.8
15
Water level
Barometric pressure
EXPLANATION
18 Monitoring Inland Storm Surge and Flooding from Hurricane Ike in Texas and Louisiana, September 2008
SSS-TX-GAL-018 (surge)
SSS-TX-GAL-019 (surge)
Elevation
in
Feet
above
NAVD88
Pressure
in
Pounds
per
Square
Inch
September 200810
12H
11
12H
12
12H
13
12H
14
12H
15
12H
16
12H1
2
3
4
5
6
7
8
9
10
11
13.6
13.8
14
14.2
14.4
14.6
14.8
15
Water level
Barometric pressure
EXPLANATION
Elevation
in
Feet
above
NAVD88
Pressure
in
Pounds
per
Square
Inch
September 200810
12H
11
12H
12
12H
13
12H
14
12H
15
12H
16
12H2
3
4
5
6
7
8
9
10
11
13.6
13.8
14
14.2
14.4
14.6
14.8
15
Water level
Barometric pressure
EXPLANATION
Graphs 19
SSS-TX-GAL-020 (riverine)
SSS-TX-GAL-021 (riverine)
Elevation
in
Feet
above
NAVD88
Pressure
in
Pounds
per
Square
Inch
September 200812
0H 12H
13
0H 12H
14
0H 12H
15
0H 12H
16
0H 12H0
2
4
6
8
10
12
14
13.6
13.8
14
14.2
14.4
14.6
14.8
15
Water level
Barometric pressure
EXPLANATION
Elevation
in
Feet
above
NAVD88
Pressure
in
Pounds
per
Square
Inch
September 200811
12H
12
12H
13
12H
14
12H
15
12H
16
12H0
2
4
6
8
10
12
14
13.4
13.6
13.8
14
14.2
14.4
14.6
14.8
15
Water level
Barometric pressure
EXPLANATION
20 Monitoring Inland Storm Surge and Flooding from Hurricane Ike in Texas and Louisiana, September 2008
SSS-TX-GAL-022 (surge)
SSS-TX-HAR-002 (surge)

Elevation
in
Feet
above
NAVD88
Pressure
in
Pounds
per
Square
Inch
September 2008
12H
11
12H
12
12H
13
12H
14
12H
15
12H
16
12H0
2
4
6
8
10
12
14
13.6
13.8
14
14.2
14.4
14.6
14.8
15
Water level
Barometric pressure
EXPLANATION
Elevation
in
Feet
above
NAVD88
Pressure
in
Pounds
per
Square
Inch
September 200810
12H
11
12H
12
12H
13
12H
14
12H
15
12H
16
12H0
2
4
6
8
10
12
14
16
13.6
13.8
14
14.2
14.4
14.6
14.8
15
Water level
Barometric pressure
EXPLANATION
Graphs 21
SSS-TX-HAR-003 (surge)
SSS-TX-HAR-004 (surge)

Elevation
in
Feet
above
NAVD88
Pressure
in
Pounds
per
Square
Inch
September 200811
12H
12
0H 12H
13
0H 12H
14
0H 12H
15
0H 12H
16
0H 12H2
4
6
8
10
12
14
16
18
20
13.9
14
14.1
14.2
14.3
14.4
14.5
14.6
14.7
14.8
14.9
Water level
Barometric pressure
EXPLANATION
Elevation
in
Feet
above
NAVD88
Pressure
in
Pounds
per
Square
Inch
September 200811
12H
12
0H 12H
13
0H 12H
14
0H 12H
15
0H 12H
16
0H 12H0
2
4
6
8
10
12
14
16
18
13.9
14
14.1
14.2
14.3
14.4
14.5
14.6
14.7
14.8
14.9
Water level
Barometric pressure
EXPLANATION
22 Monitoring Inland Storm Surge and Flooding from Hurricane Ike in Texas and Louisiana, September 2008
SSS-TX-JEF-001 (surge)
SSS-TX-JEF-002 (beach/wave)
Elevation
in
Feet
above
NAVD88
Pressure
in
Pounds
per
Square
Inch
September 200811
12H
12
0H 12H
13
0H 12H
14
0H 12H
15
0H 12H
16
0H 12H-2
00
2
4
6
8
10
12
14
16
18
13.9
14
14.1
14.2
14.3
14.4
14.5
14.6
14.7
14.8
14.9
Water level
Barometric pressure
EXPLANATION
Elevation
in
Feet
above
NAVD88
Pressure
in
Pounds
per
Square
Inch
September 200811
12H
12
0H 12H
13
0H 12H
14
0H 12H
15
0H 12H
16
0H 12H-2
00
2
4
6
8
10
12
14
16
18
13.9
14
14.1
14.2
14.3
14.4
14.5
14.6
14.7
14.8
14.9
Water level
Barometric pressure
EXPLANATION
Graphs 23
SSS-TX-JEF-004 (surge)
SSS-TX-JEF-005 (surge)

Elevation
in
Feet
above
NAVD88
Pressure
in
Pounds
per
Square
Inch
September 200811
12H
12
0H 12H
13
0H 12H
14
0H 12H
15
0H 12H
16
0H 12H-2
00
2
4
6
8
10
12
14
13.9
14
14.1
14.2
14.3
14.4
14.5
14.6
14.7
14.8
14.9
Water level
Barometric pressure
EXPLANATION
Elevation
in
Feet
above
NAVD88
Pressure
in
Pounds
per
Square
Inch
September 200811
12H
12
0H 12H
13
0H 12H
14
0H 12H
15
0H 12H
16
0H 12H-2
00
2
4
6
8
10
12
14
16
13.9
14
14.1
14.2
14.3
14.4
14.5
14.6
14.7
14.8
14.9
Water level
Barometric pressure
EXPLANATION
24 Monitoring Inland Storm Surge and Flooding from Hurricane Ike in Texas and Louisiana, September 2008
SSS-TX-JEF-006 (surge)
SSS-TX-JEF-007 (surge)
Elevation
in
Feet
above
NAVD88
Pressure
in
Pounds
per
Square
Inch
September 200811
12H
12
0H 12H
13
0H 12H
14
0H 12H
15
0H 12H
16
0H 12H-2
00
2
4
6
8
10
12
14
16
18
14
14.1
14.2
14.3
14.4
14.5
14.6
14.7
14.8
14.9
Water level
Barometric pressure
EXPLANATION
Elevation
in
Feet
above
NAVD88
Pressure
in
Pounds
per
Square
Inch
September 200811
12H
12
0H 12H
13
0H 12H
14
0H 12H
15
0H 12H
16
0H 12H0
2
4
6
8
10
12
14
14.1
14.2
14.3
14.4
14.5
14.6
14.7
14.8
14.9
Water level
Barometric pressure
EXPLANATION
Graphs 25
SSS-TX-JEF-008 (surge)
SSS-TX-JEF-009 (beach/wave)

Elevation
in
Feet
above
NAVD88
Pressure
in
Pounds
per
Square
Inch
September 200810
12H
11
12H
12
12H
13
12H
14
12H
15
12H
16
12H-1
-0.5
00
0.5
1
1.5
2
2.5
3
3.5
4
4.5
14
14.1
14.2
14.3
14.4
14.5
14.6
14.7
14.8
14.9
15
Water level
Barometric pressure
EXPLANATION
Elevation
in
Feet
above
NAVD88
Pressure
in
Pounds
per
Square
Inch
September 200810
12H
11
12H
12
12H
13
12H
14
12H
15
12H
16
12H0
0.5
1
1.5
2
2.5
3
3.5
4
4.5
5
14
14.1
14.2
14.3
14.4
14.5
14.6
14.7
14.8
14.9
15
Water level
Barometric pressure
EXPLANATION
26 Monitoring Inland Storm Surge and Flooding from Hurricane Ike in Texas and Louisiana, September 2008
SSS-TX-MAT-001 (surge)
SSS-TX-MAT-002 (surge)
Elevation
in
Feet
above
NAVD88
Pressure
in
Pounds
per
Square
Inch
September 200811
12H
12
12H
13
12H
14
12H
15
12H
16
12H-3.5
-3
-2.5
-2
-1.5
-1
-0.5
00
0.5
14.1
14.2
14.3
14.4
14.5
14.6
14.7
14.8
14.9
Water level
Barometric pressure
EXPLANATION
Elevation
in
Feet
above
NAVD88
Pressure
in
Pounds
per
Square
Inch
September 200810
12H
11
12H
12
12H
13
12H
14
12H
15
12H
16
12H0
1
2
3
4
5
6
7
14
14.1
14.2
14.3
14.4
14.5
14.6
14.7
14.8
14.9
Water level
Barometric pressure
EXPLANATION
Graphs 27
SSS-TX-MAT-003 (riverine)
SSS-TX-MAT-004 (riverine)
Elevation
in
Feet
above
NAVD88
Pressure
in
Pounds
per
Square
Inch
September 200810
12H
11
12H
12
12H
13
12H
14
12H
15
12H
16
12H0
1
2
3
4
5
6
14
14.1
14.2
14.3
14.4
14.5
14.6
14.7
14.8
14.9
15
Water level
Barometric pressure
EXPLANATION
Elevation
in
Feet
above
NAVD88
Pressure
in
Pounds
per
Square
Inch
September 200810
12H
11
12H
12
12H
13
12H
14
12H
15
12H
16
12H0
0.5
1
1.5
2
2.5
3
3.5
4
4.5
5
14
14.1
14.2
14.3
14.4
14.5
14.6
14.7
14.8
14.9
Water level
Barometric pressure
EXPLANATION
28 Monitoring Inland Storm Surge and Flooding from Hurricane Ike in Texas and Louisiana, September 2008
SSS-TX-MAT-005 (beach/wave)
SSS-TX-MAT-006 (riverine)
Elevation
in
Feet
above
NAVD88
Pressure
in
Pounds
per
Square
Inch
September 200810
12H
11
12H
12
12H
13
12H
14
12H
15
12H
16
12H6.75
7
7.25
7.5
7.75
8
8.25
8.5
8.75
9
9.25
9.5
14
14.1
14.2
14.3
14.4
14.5
14.6
14.7
14.8
14.9
15
Water level
Barometric pressure
EXPLANATION
Elevation
in
Feet
above
NAVD88
Pressure
in
Pounds
per
Square
Inch
September 200810
12H
11
12H
12
12H
13
12H
14
12H
15
12H
16
12H0
1
2
3
4
5
6
14
14.1
14.2
14.3
14.4
14.5
14.6
14.7
14.8
14.9
15
Water level
Barometric pressure
EXPLANATION
Graphs 29
SSS-TX-MAT-007 (surge)
SSS-TX-MAT-008 (beach/wave)

Elevation
in
Feet
above
NAVD88
Pressure
in
Pounds
per
Square
Inch
September 200810
12H
11
12H
12
12H
13
12H
14
12H
15
12H
16
12H1.5
2
2.5
3
3.5
4
4.5
5
5.5
6
6.5
14
14.1
14.2
14.3
14.4
14.5
14.6
14.7
14.8
14.9
Water level
Barometric pressure
EXPLANATION
Elevation
in
Feet
above
NAVD88
Pressure
in
Pounds
per
Square
Inch
September 200810
12H
11
12H
12
12H
13
12H
14
12H
15
12H
16
12H0
1
2
3
4
5
6
7
14
14.1
14.2
14.3
14.4
14.5
14.6
14.7
14.8
14.9
15
Water level
Barometric pressure
EXPLANATION
30 Monitoring Inland Storm Surge and Flooding from Hurricane Ike in Texas and Louisiana, September 2008
SSS-TX-MAT-009 (surge)
SSS-TX-MAT-010 (riverine)

Elevation
in
Feet
above
NAVD88
Pressure
in
Pounds
per
Square
Inch
September 200811
12H
12
0H 12H
13
0H 12H
14
0H 12H
15
0H 12H
16
0H 12H6
7
8
9
10
11
12
13
14
15
16
14.1
14.2
14.3
14.4
14.5
14.6
14.7
14.8
14.9
Water level
Barometric pressure
EXPLANATION
Elevation
in
Feet
above
NAVD88
Pressure
in
Pounds
per
Square
Inch
September 200811
12H
12
0H 12H
13
0H 12H
14
0H 12H
15
0H 12H
16
0H 12H2
4
6
8
10
12
14
16
18
14.1
14.2
14.3
14.4
14.5
14.6
14.7
14.8
14.9
Water level
Barometric pressure
EXPLANATION
Graphs 31
SSS-LA-CAM-001 (surge)
SSS-LA-CAM-002 (surge)

Elevation
in
Feet
above
NAVD88
Pressure
in
Pounds
per
Square
Inch
September 200811
12H
12
0H 12H
13
0H 12H
14
0H 12H
15
0H 12H
16
0H 12H0
1
2
3
4
5
6
7
8
9
10
11
14.2
14.3
14.4
14.5
14.6
14.7
14.8
14.9
15
Water level
Barometric pressure
EXPLANATION
Elevation
in
Feet
above
NAVD88
Pressure
in
Pounds
per
Square
Inch
September 200811
12H
12
0H 12H
13
0H 12H
14
0H 12H
15
0H 12H
16
0H 12H0
1
2
3
4
5
6
7
8
9
10
11
14.2
14.3
14.4
14.5
14.6
14.7
14.8
14.9
Water level
Barometric pressure
EXPLANATION
32 Monitoring Inland Storm Surge and Flooding from Hurricane Ike in Texas and Louisiana, September 2008
SSS-LA-CAM-003 (surge)
SSS-LA-CAM-010 (surge)
Elevation
in
Feet
above
NAVD88
Pressure
in
Pounds
per
Square
Inch
September 200811
12H
12
0H 12H
13
0H 12H
14
0H 12H
15
0H 12H
16
0H 12H1
2
3
4
5
6
7
8
9
10
11
14.3
14.35
14.4
14.45
14.5
14.55
14.6
14.65
14.7
14.75
14.8
14.85
Water level
Barometric pressure
EXPLANATION
Elevation
in
Feet
above
NAVD88
Pressure
in
Pounds
per
Square
Inch
September 200811
12H
12
0H 12H
13
0H 12H
14
0H 12H
15
0H 12H
16
0H 12H-1
00
1
2
3
4
5
6
7
14.3
14.35
14.4
14.45
14.5
14.55
14.6
14.65
14.7
14.75
14.8
14.85
14.9
Water level
Barometric pressure
EXPLANATION
Graphs 33
SSS-LA-CAM-011 (surge)
SSS-LA-CAM-012 (surge)

Elevation
in
Feet
above
NAVD88
Pressure
in
Pounds
per
Square
Inch
September 200811
12H
12
0H 12H
13
0H 12H
14
0H 12H
15
0H 12H
16
0H 12H1
2
3
4
5
6
7
8
9
14.3
14.35
14.4
14.45
14.5
14.55
14.6
14.65
14.7
14.75
14.8
14.85
14.9
Water level
Barometric pressure
EXPLANATION
Elevation
in
Feet
above
NAVD88
Pressure
in
Pounds
per
Square
Inch
September 200811
12H
12
0H 12H
13
0H 12H
14
0H 12H
15
0H 12H
16
0H 12H0
1
2
3
4
5
6
7
8
14.3
14.35
14.4
14.45
14.5
14.55
14.6
14.65
14.7
14.75
14.8
14.85
Water level
Barometric pressure
EXPLANATION
34 Monitoring Inland Storm Surge and Flooding from Hurricane Ike in Texas and Louisiana, September 2008
SSS-LA-VER-006 (surge)
SSS-LA-VER-007 (surge)