monitoring forest regrowth following large scale fire...
TRANSCRIPT
�
European Journal of Remote Sensing - 20�3, 46: xxx-xxx doi: �0.572�/EuJRS20�346xx Received xx/xx/20�x, accepted xx/xx/20�3European Journal of Remote Sensing - 20�3, 46: xxx-xxx doi: �0.572�/EuJRS20�346xx Received xx/xx/20�x, accepted xx/xx/20�3
European Journal of Remote SensingAn official journal of the Italian Society of Remote Sensing
www.aitjournal.com
Monitoring forest regrowth following large scale fire using satellite data
-A case study of Yellowstone National Park, USA-
Shannon Franks1*, Jeffrey G. Masek2and Monica G. Turner3
�SGT, Inc., Greenbelt, USA2NASA, Goddard Space Flight Center, Greenbelt, USA
3Department of Zoology, University of Wisconsin, Madison, USA*Corresponding author, email address: [email protected]
AbstractMonitoring forest regrowth following major fires is important for understanding controls on forest regeneration and succession and detecting change in postfire plant communities. In this study we examined the extent to which forest regrowth following the �988 Yellowstone National Park fires can be characterized by optical remote sensing data, and the spatial patterns associated with regrowth. Using a near-annual time series of Landsat satellite imagery, several satellite-based metrics were compared with field-based data of burn extent and post-fire stand structure and function. While there was little correlation between lodgepole pine density and our satellite metrics, single year regressions produced results over 80% and trend analysis of multiyear sites were able to explain 60 to 70% of the variability found between the ground collected data and the satellite metrics.Keywords: Yellowstone national park, regression, fire, ecology, Landsat, burn severity
IntroductionDisturbance has long been recognized as a major driver of heterogeneity in forests [Watt, �947] and is an important natural process in ecological communities [Wu and Loucks, �995]. Understanding how forest landscapes recover following such disturbance events is critical for understanding ecologic controls on recovery, and for assessing changes in forest carbon stocks through the disturbance cycle [Hurtt et al., 2004]. In addition, climate change may alter the frequency of disturbance events as well as the resilience of vegetation communities [Bernhardt-Römermann et al., 20��; Westerling et al., 20��]. The �988 fires in Yellowstone National Park were one of the largest fire complexes in recent US history and present an opportunity to study forest recovery following a major stand-replacing fire [Romme et al., 20��]. Previous studies have examined spatial heterogeneity of regrowth [Kashian et al., 2004], estimated the amount of coarse woody debris within the burned area [Huang et al., 2009], and examined how fire has affected wildlife populations [Singer et al., �989]. Other studies have used satellite imagery to quantify burn intensities [Crabtree et al.,

Franks et al. Monitoring forest regrowth
2
2009] and delineate boundaries of burn severities [Turner et al., �994].Post-fire forest recovery generally occurs in phases, with initial dominance by herbaceous vegetation followed by increasing tree productivity as the posftire cohort of tree seedlings grow in size. Depending on forest type and the initial postfire density of tree seedlings, it may take a decade or longer before trees again become the dominant component in the vegetation canopy. In addition, forest fires leave “standing dead” snags that persist for years before falling. Thus, while photosynthetic productivity may be restored relatively quickly through growth of herbaceous vegetation, the accrual of live woody biomass is a much slower process. Multispectral and hyperspectral optical data have been used to assess vegetation recovery from disturbance [Riaño et al., 2002; Schroeder et al., 2007; Vila and Barbosa, 20�0; Vicente-Serrano et al., 20��]. In general, spectral metrics based on the visible and near infrared (e.g. the normalized-difference vegetation index or NDVI) tend to be sensitive to leaf area, and thus provide an indication of “early” regeneration, but not necessarily the later succession to treed canopies. Indices that incorporate the shortwave-infrared tend to be more sensitive to shadow fraction and thus changing vegetation structure [Schroeder et al., 2007; Powell et al., 20�0]. However, the specific utility of indices depends on biome-specific conditions of tree density, forest type, and background condition. The choice of remote sensing platform for fire recovery monitoring depends on both the severity and size of the fire. As noted by Corona et al. [2008] burned areas larger than 50 ha can be mapped by medium to low resolution sensors such as WiFS-IRS, NOAA AVHRR, MODIS, or Spot-Vegetation. However, most of these records lack the long archive of Landsat which hinders monitoring burn recovery across several decades. The exception (AVHRR) offers three decades of data but at relatively coarse resolution (typically 4-8km) that precludes mapping heterogeneous recovery within a single burn. In particular, the 40-year Landsat archive provides a unique opportunity to analyze rates of vegetation recovery on a near-annual basis, and to understand geographic controls on regeneration and recovery of forest biomass. We combined field observations acquired during the last twenty years [Litton et al., 2004; Turner et al., 2004; Levitt, 2006; Turner et al., 2009] with Landsat time series data to understand the relation between specific ecological metrics of forest regrowth and multispectral observations.
Study AreaYellowstone National Park (YNP), USA is the country’s oldest park having been established in �872. It encompasses nearly 9000 km2 and lies mostly in the northwest corner of Wyoming with 3% in Montana and the remaining �% within Idaho’s borders. Elevation in the park ranges from �600 m to roughly 3500 m and consists primarily of high, forested subalpine plateaus. Seven species of conifers are found in the park, but approximately 80% of park forest is dominated by lodgepole pine (Pinus contorta var. latifolia). The climate is generally cool and dry with mean January temperatures at Mammoth of -�3 oC, mean July temperatures of 27 oC, and precipitation ranging from 26 cm at the north boundary to 205 cm in the southwest corner.The focus of our study was on the subalpine plateaus affected by the �988 fires (Fig. �). The �988 fires in YNP burned approximately 250,000 ha (roughly 36% of the park) of conifer-dominated forest, largely due to extreme drought and high winds [Renkin and Despain, �992; Bessie and Johnson, �995]. Fires of this magnitude occur in Yellowstone every 250 - 400 years, with the last such event happening in the early �700’s [Houston, �973; Romme, �982]. The summer of �988 was the driest on record since �886, with precipitation in June,

3
European Journal of Remote Sensing - 2013, 46: xxx-xxx
July, and August at 20%, 79%, and �0% of their monthly mean [Renkin and Despain, �992]. Almost 250 different fires started in Yellowstone and the surrounding National Forests between June and August. Seven of them were responsible for 95% of the total burned area [Schullery, �989]. Smaller fires burned into each other, propelled by dry storms which brought winds and dry lightning strikes but no rain. On August 20, the single worst day of the fires and later dubbed “Black Saturday”, more than 60,000 ha (600 km2) were consumed during one of many firestorms. The plume was so great that ash from the fire throughout the park drifted as far away as Billings, Montana, �00 km to the northeast [Franke, 2000]. Relief didn’t come until early September, when colder weather brought rain and snow that slowed the spread of fire through the park. The fires continued to burn well into November, and it wasn’t until November �8th that all the fires in YNP were officially declared out. By the end, there had been involvement from over 25,000 firefighters, �20 helicopters and fixed wing aircraft, close to 800 miles of fireline was created, and cost more than US $�20 million to extinguish [Romme and Despain, �989; Schullery, �989; Franke, 2000].
Figure 1 - Map of Yellowstone National Park and study sites.
MethodsData used in StudyLandsat Reflectance ImageryLandsat data are widely used for studies of land cover and ecosystem changes [Adams et al., �995; Harris et al., 2005; Leimgruber, 2005; Yuan et al., 2005; Huang et al., 2009]. To track vegetation changes both before and after the �988 fires, we sought an annual, cloud-free

Franks et al. Monitoring forest regrowth
4
view of the YNP area, on near-anniversary dates in order to minimize changes in illumination condition and phenology. Landsat data, having a pixel size of 30 meters also closely approximated the ground sampling that was performed at 50 meters [Turner et al., 2004].Landsat images for Worldwide Reference System (WRS-2) path 38, row 29 from �986 through 2006 were downloaded from the USGS Earth Resources Observations and Science (EROS) center archive through the Global Visualization Viewer (www.glovis.usgs.gov) portal. Mostly cloud-free data were found for all years except �992 and 2004 (see Tab. � for image acquisition dates). These data were then processed to surface reflectance using the Landsat Ecosystem Disturbance Adaptive Processing System (LEDAPS) tool developed at NASA’s Goddard Space Flight Center [Masek et al., 2006]. The pixels of the satellite imagery were resampled by the cubic convolution method from 30 to 60 meters to decrease the size of each file and to more closely match the resolution of the plot size of the field collected data (50 m) that was to be used in the regressions. Lastly, the data were stacked using the layer stacking capability in ITT’s ENVI software so that the data were more easily accessed and time series profiles of the satellite data could be compiled for different pixel locations.
Table 1 - Image acquisition dates.Dates of acquisition Sensor
7/�7/�986 TM
9/6/�987 TM
7/22/�988 TM
8/2/�989 TM
9/�4/�990 TM
7/�5/�99� TM
9/22/�993 TM
8/24/�994 TM
9/�2/�995 TM
7/�2/�996 TM
7/�5/�997 TM
7/�8/�998 TM
8/22/�999 TM
7/�5/2000 ETM+
7/2/200� ETM+
7/29/2002 TM
8/�/2003 TM
7/2�/2005 TM
8/9/2006 TM
For the analysis, we concentrated on two satellite-derived metrics associated with vegetation condition. The first, the Normalized Difference Vegetation Index (NDVI), is widely used as an assessment of vegetation “greenness”. NDVI is calculated as:

5
European Journal of Remote Sensing - 2013, 46: xxx-xxx
NDVI NIR VIS NIR VIS= −( ) +( ) [ ]/ �
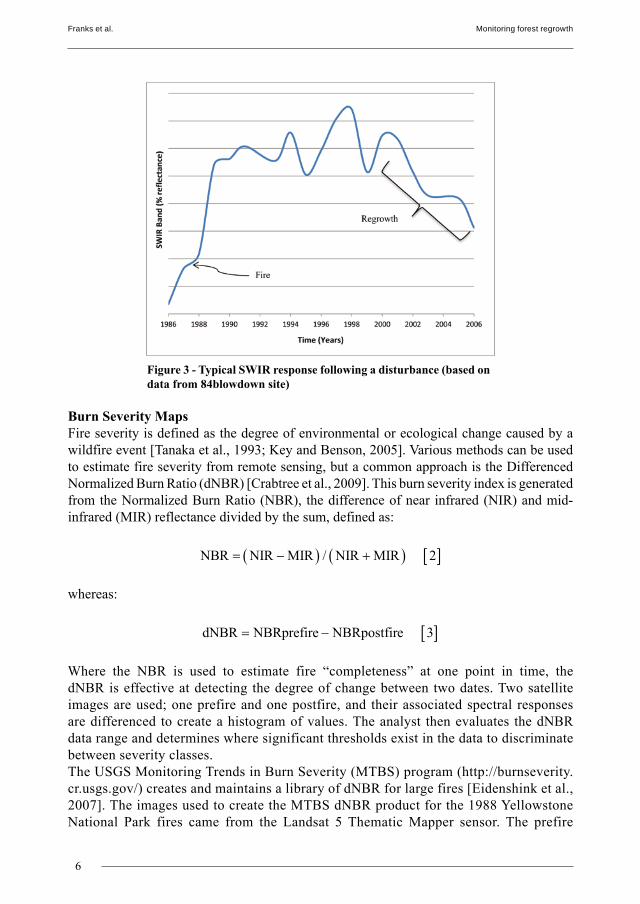
where VIS and NIR stand for the spectral reflectance measurements acquired in the visible (generally red) and near-infrared regions of the electromagnetic spectrum, respectively [Tucker, �979; Tucker & Sellers, �986]. NDVI measures the amount of light absorbed by the vegetation canopy (fraction of absorbed photosynthetically active radiation or FPAR), and can be related to the green leaf area (LAI) up to some saturation level (typically ~ LAI=3) [Ludeke et al., �99�]. For sparse vegetation systems NDVI can also be related to fractional cover and biomass [Gamon et al., �995]. The typical NDVI response after a fire event in a forested area like YNP would be a high pre-fire value sharply dropping at the time of the event and then slowly recovering several years after the event as the vegetation re-grows (Fig. 2).The second metric that was used to assess fire response was Landsat band 5, which falls in the short wave infrared (SWIR) portion of the spectrum. This band provides a good contrast between different types of vegetation, and indices including the shortwave infrared have been shown to provide better discrimination of vegetation structure (e.g. woody biomass, height) than other spectral metrics [Freitas et al., 2005]. As White et al. [�996] noted this band also has the largest variation between pre and post fire conditions so the signal change should be most discernible. This metric, unlike NDVI, has a low value when undisturbed, but responds by sharply increasing when there is a disturbance (Fig. 3). We particularly wished to explore the extent to which the SWIR could separate tree growth from herbaceous and shrub growth in the Yellowstone region. While NDVI is a reliable indicator of the vitality of vegetation, the response is generally sensitive to overall leaf area and FPAR rather than the vegetation structure and type. Thus we hypothesized that NDVI would be sensitive to early (herbaceous) recovery, but the SWIR would be better correlated with subsequent tree growth.
Figure 2 - Typical NDVI response following a disturbance (based on data from 84blowdown site).
Franks et al. Monitoring forest regrowth
6
Figure 3 - Typical SWIR response following a disturbance (based on data from 84blowdown site)
Burn Severity MapsFire severity is defined as the degree of environmental or ecological change caused by a wildfire event [Tanaka et al., �993; Key and Benson, 2005]. Various methods can be used to estimate fire severity from remote sensing, but a common approach is the Differenced Normalized Burn Ratio (dNBR) [Crabtree et al., 2009]. This burn severity index is generated from the Normalized Burn Ratio (NBR), the difference of near infrared (NIR) and mid-infrared (MIR) reflectance divided by the sum, defined as:
NBR NIR MIR NIR MIR= −( ) +( ) [ ]/ 2
whereas:
dNBR NBRprefire NBRpostfire= − [ ]3
Where the NBR is used to estimate fire “completeness” at one point in time, the dNBR is effective at detecting the degree of change between two dates. Two satellite images are used; one prefire and one postfire, and their associated spectral responses are differenced to create a histogram of values. The analyst then evaluates the dNBR data range and determines where significant thresholds exist in the data to discriminate between severity classes. The USGS Monitoring Trends in Burn Severity (MTBS) program (http://burnseverity.cr.usgs.gov/) creates and maintains a library of dNBR for large fires [Eidenshink et al., 2007]. The images used to create the MTBS dNBR product for the �988 Yellowstone National Park fires came from the Landsat 5 Thematic Mapper sensor. The prefire

7
European Journal of Remote Sensing - 2013, 46: xxx-xxx
image was captured in August of �986 and the postfire image was acquired August of �989. The MTBS product recorded five classes of burn severity (see Fig. 4) ranging from “unburned” to “high” severity. As noted by others, the ecological interpretation of these burn classes is not entirely clear [Allen and Sorbel, 2008; Hoy et al., 2008] although higher severity classes are associated with greater char and residual burned material, and less green vegetation (including herbaceous vegetation) in the year following a fire.
Figure 4 - (Left): Landsat bands 7,4,3 post fire image with fire boundary for North Fork portion of 1988 Yellowstone National Park fires; (Right) USGS MTBS dNBR map for the same area.
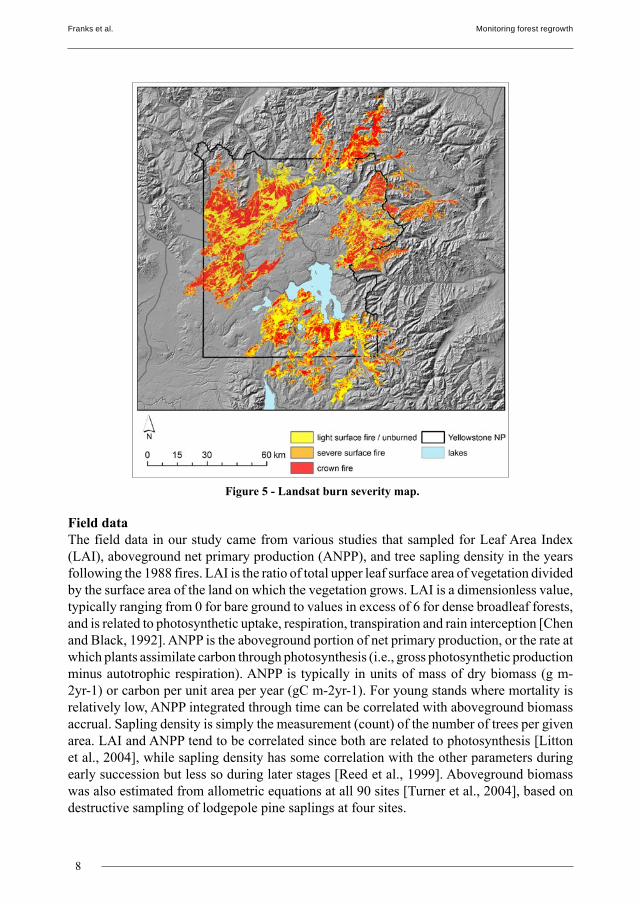
A second source of information on burn severity came from Turner et al. [�994], who used visual interpretation of post-fire Landsat imagery combined with field observations to create a more ecologically-oriented burn severity map. The classes include “unburned”, “Light-Surface Burn”, “Severe-Surface Burn”, and “Crown Fire” (see Fig. 5). The spatial pattern of classes in Turner et al. [�994] was closely related to the MTBS dNBR classes (Fig. 4, 5; see Tab. 2 for a comparison of the two classification systems). Unfortunately, a digital version of the burn severity map was no longer available. Since the MTBS map was digitized and hence, more convenient to work with, future references to burn severity in this paper will refer to the MTBS severity classes.
Table 2 - Classification cross-walk of burn severity maps from MTBS and Turner et al. (1994).
Burn Severity Landsat map dNBR map
� Increased greeness
2 Unburned Unburned
3 Light Surface Low
4 Severe Surface Moderate
5 Crown High
Franks et al. Monitoring forest regrowth
8
Figure 5 - Landsat burn severity map.
Field dataThe field data in our study came from various studies that sampled for Leaf Area Index (LAI), aboveground net primary production (ANPP), and tree sapling density in the years following the �988 fires. LAI is the ratio of total upper leaf surface area of vegetation divided by the surface area of the land on which the vegetation grows. LAI is a dimensionless value, typically ranging from 0 for bare ground to values in excess of 6 for dense broadleaf forests, and is related to photosynthetic uptake, respiration, transpiration and rain interception [Chen and Black, �992]. ANPP is the aboveground portion of net primary production, or the rate at which plants assimilate carbon through photosynthesis (i.e., gross photosynthetic production minus autotrophic respiration). ANPP is typically in units of mass of dry biomass (g m-2yr-�) or carbon per unit area per year (gC m-2yr-�). For young stands where mortality is relatively low, ANPP integrated through time can be correlated with aboveground biomass accrual. Sapling density is simply the measurement (count) of the number of trees per given area. LAI and ANPP tend to be correlated since both are related to photosynthesis [Litton et al., 2004], while sapling density has some correlation with the other parameters during early succession but less so during later stages [Reed et al., �999]. Aboveground biomass was also estimated from allometric equations at all 90 sites [Turner et al., 2004], based on destructive sampling of lodgepole pine saplings at four sites.

9
European Journal of Remote Sensing - 2013, 46: xxx-xxx
The four campaigns that acquired the field data were as follows: �999 campaign:Turner et al. [2004] documented the differing spatial patterns of regrowth within YNP �� years following the �988 fires. Vegetation was sampled in 0.25-ha plots during the summers of �999 (n = 88) and 2000 (n = 2) to measure postfire stand density and to estimate ANPP and LAI across a range of conditions represented across the burned landscape. This study examined the causes and implications of the spatial variability and how LAI and ANPP varied across the landscape. Of the four datasets we used in our study this campaign had the greatest number of sites.200� campaign:Vegetation data were sampled for �7 sites in 200� [Litton et al., 2004]. These data differed in that the site locations were not exactly the same as the other studies and the spatial resolutions of the collection plots were at 20 m2 rather than 50 m2. For these reasons, we used the data for single year regressions, but not in trend calculations.2003 campaign:From the 90 sites that were initially sampled in �999, Turner et al. [2009] re-sampled a subset of �4 sites that spanned a range of postfire lodgepole pine densities and ANPP values observed in �999. This campaign was undertaken in July of 2003 to understand how foliar nitrogen varied with stand density and ANPP. Foliar nitrogen, stand density, and ANPP were compared with LAI. Turner et al. [2009] found that tree density had not changed significantly since �999, and ANPP remained positively correlated with tree density. However, LAI was not correlated with tree density in 2003. In addition, foliar nitrogen concentrations and total foliar N patterns were closely associated with postfire tree density.2005 campaign:Seventeen years after the fire, Levitt [2006] resampled 23 of the 90 study plots that were sampled initially in �999 and 2000, in order to understand soil nitrogen as a driver of lodgepole pine stand variability. This study provided additional measurements of tree density, ANPP, and LAI.
Study SitesFor each year of postfire field data, regression analysis was done between remote sensing indices and the field-measured variables using all the sites that were sampled during that campaign. Although single year regressions were possible using all of the sites per field campaign, for the trend analysis (described below), it was critical that the same points were sampled and compared to the spectral responses of the satellite data. To achieve this, �3 sites were chosen (see Fig. � for a map of the sites) that were common in 3 of the 4 campaigns for the trend regressions. The exception was the Gibbon Falls site, where the values were statistical outliers and the researchers were uncertain about why (Monica Turner, personal communication). Thus it was not included in the analysis.
Regression AnalysisRegression analysis was performed to characterize the relationship between satellite observed NDVI and Band 5 reflectance with field-observed LAI, ANPP and sapling density. The data were first stratified by burn severity and field campaign year. The Landsat product closest in time to each field campaign date was used for these regressions. Multi-year trend
Franks et al. Monitoring forest regrowth
�0
analysis was also performed in order to relate changes in satellite metrics to changes in ecological structure. As was found in other studies [Huete et al., 2002; Glenn et al., 2008], the variables of interest do not follow a linear trend so a 2nd order polynomial regression was performed. This was sufficient as adding a third term did not significantly improve the relationship.
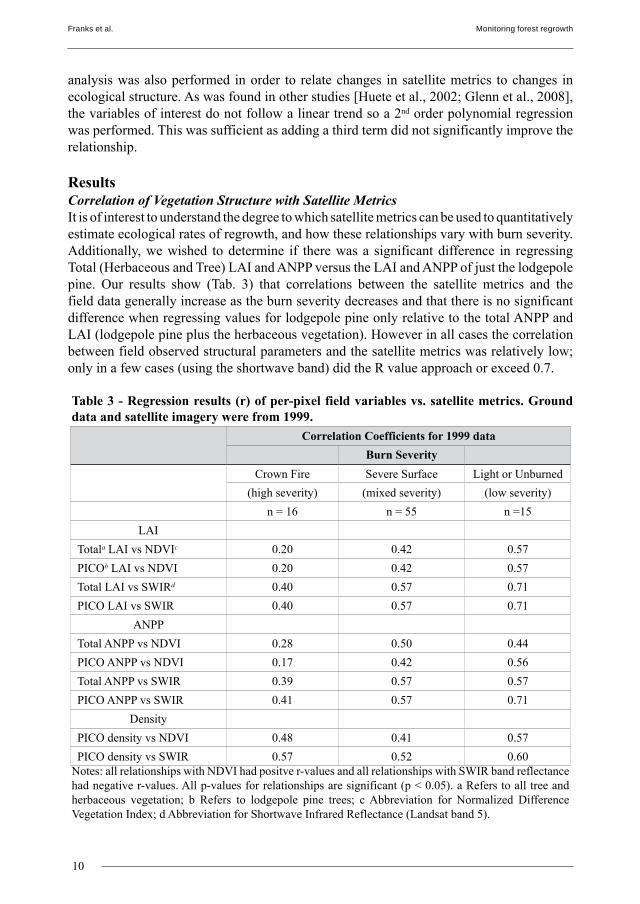
ResultsCorrelation of Vegetation Structure with Satellite MetricsIt is of interest to understand the degree to which satellite metrics can be used to quantitatively estimate ecological rates of regrowth, and how these relationships vary with burn severity. Additionally, we wished to determine if there was a significant difference in regressing Total (Herbaceous and Tree) LAI and ANPP versus the LAI and ANPP of just the lodgepole pine. Our results show (Tab. 3) that correlations between the satellite metrics and the field data generally increase as the burn severity decreases and that there is no significant difference when regressing values for lodgepole pine only relative to the total ANPP and LAI (lodgepole pine plus the herbaceous vegetation). However in all cases the correlation between field observed structural parameters and the satellite metrics was relatively low; only in a few cases (using the shortwave band) did the R value approach or exceed 0.7.
Table 3 - Regression results (r) of per-pixel field variables vs. satellite metrics. Ground data and satellite imagery were from 1999.
Correlation Coefficients for 1999 dataBurn Severity
Crown Fire Severe Surface Light or Unburned(high severity) (mixed severity) (low severity)
n = �6 n = 55 n =�5LAI
Totala LAI vs NDVIc 0.20 0.42 0.57PICOb LAI vs NDVI 0.20 0.42 0.57Total LAI vs SWIRd 0.40 0.57 0.7�PICO LAI vs SWIR 0.40 0.57 0.7�
ANPPTotal ANPP vs NDVI 0.28 0.50 0.44PICO ANPP vs NDVI 0.�7 0.42 0.56Total ANPP vs SWIR 0.39 0.57 0.57PICO ANPP vs SWIR 0.4� 0.57 0.7�
DensityPICO density vs NDVI 0.48 0.4� 0.57PICO density vs SWIR 0.57 0.52 0.60
Notes: all relationships with NDVI had positve r-values and all relationships with SWIR band reflectance had negative r-values. All p-values for relationships are significant (p < 0.05). a Refers to all tree and herbaceous vegetation; b Refers to lodgepole pine trees; c Abbreviation for Normalized Difference Vegetation Index; d Abbreviation for Shortwave Infrared Reflectance (Landsat band 5).

��
European Journal of Remote Sensing - 2013, 46: xxx-xxx
We also analyzed each field vegetation dataset separately to determine the temporal variability in correlations with satellite metrics. The ground collection campaigns occurred, respectively, ��, �3, �5 and �7 years after the fire. The results show (Tab. 4), with one exception, a general increase in correlation between field-measured and satellite-derived structural metrics with increasing time after the fire event. The exception to this trend was the correlations between the satellite metrics to the 200� ground collected data. This was most likely because, as previously noted, this data set was collected at a finer resolution (20m) than the other campaign data sets (50m). It is possible that the 50 meter resolution of the other studies was a larger than desired sampling resolution for correlations to the 30m resolution (900m2 per pixel) satellite data.
Table 4 - Regression results (r) for four different years following fire event.
1999 2001 2003 2005
(n = 89) (n = �6) (n = �3) (n = 22)
all severities all severities all severities all severities
LAI
PICOa LAI vs NDVIb 0.37 0.93 0.70 0.77
PICO LAI vs SWIRc 0.54 0.89 0.6� 0.82
ANPP
PICO ANPP vs NDVI 0.37 0.92 0.70 0.79
PICO ANPP vs SWIR 0.55 0.87 0.72 0.84Notes: all relationships with NDVI had positve r-values and all relationships with SWIR band reflectance had negative r-values. All p-values for relationships are significant (p < 0.05). a Refers to lodgepole pine trees; b Abbreviation for Normalized Difference Vegetation Index; c Abbreviation for Shortwave Infrared Reflectance (Landsat band 5).
Finally, we wanted to evaluate the extent to which temporal changes in satellite metrics could predict temporal changes in vegetation structure. In theory the change in spectral metrics could be a better indicator of structural change than single-date correlations. For each sample site, the rate of change of the field metrics (ie. from �999 to 2005) was plotted against the rate of change of the satellite metrics (also from �999 to 2005). In essence, we wish to understand how well we can estimate the regrowth of the forest (gauged by the increase in LAI and ANPP) using satellite data. It would have been desirable to have the dates extending from soon after the fire in �988, but we don’t know of LAI or productivity observations prior to �999. As can be seen in Figure 6, for the �3 common sites, the ground data correlates (all p-values < 0.05) slightly better with the satellite Band 5 (short wave infrared) than with the calculated NDVI, predicting just under 70 percent of the variability found in the PICO ANPP.

Franks et al. Monitoring forest regrowth
�2
Figure 6 - 1999-2005 trend data.
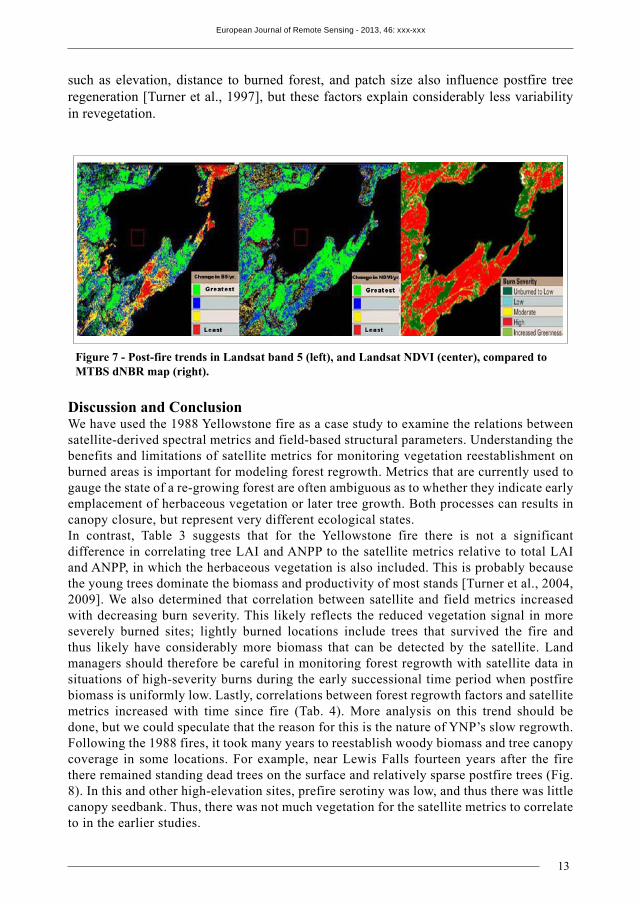
Comparison of trend mapsTo understand how burn severity influences vegetation recovery rates, the spatial patterns of trends in post-fire satellite metrics were compared to the burn severity map (Fig. 7). Time series of NDVI and band 5 reflectance data for the post-fire era were assembled for each pixel, and a linear regression was performed to estimate the “slope” (rate of change) for the metric for �989-2009. These slopes were then classified into quartiles for mapping purposes (Fig. 7). The digital version of the burn severity map was no longer available, so visual comparison of the post-disturbance satellite trend maps to the burn severity map was made and revealed certain patterns. It appears that NDVI rebounds back to its pre-fire state most rapidly in areas that had the highest burn severity. Also, the pattern of NDVI recovery seems to have a closer correspondence to the burn severity map than does the pattern of band 5 reflectance recovery. Variability in sapling density is strongly related to spatial heterogeneity of percent serotiny in the prefire forest and to burn severity [e.g., Turner et al., �997, �999; Kashian et al., 2004]. Our results show that vegetation recovered fast in areas that of severe surface fire compared to either light surface fire or crown fire, consistent with extensive field observations [Turner et al., �999; Cocke et al., 2005; Lentile et al., 2005]. Numerous studies have demonstrated more abundant tree regeneration in locations with higher pre-fire serotiny and in or near areas of severe-surface fire, in which canopy trees were killed by the fire but needles and cones were not consumed [Turner et al., �997]. Other factors,
�3
European Journal of Remote Sensing - 2013, 46: xxx-xxx
such as elevation, distance to burned forest, and patch size also influence postfire tree regeneration [Turner et al., �997], but these factors explain considerably less variability in revegetation.
Figure 7 - Post-fire trends in Landsat band 5 (left), and Landsat NDVI (center), compared to MTBS dNBR map (right).
Discussion and ConclusionWe have used the �988 Yellowstone fire as a case study to examine the relations between satellite-derived spectral metrics and field-based structural parameters. Understanding the benefits and limitations of satellite metrics for monitoring vegetation reestablishment on burned areas is important for modeling forest regrowth. Metrics that are currently used to gauge the state of a re-growing forest are often ambiguous as to whether they indicate early emplacement of herbaceous vegetation or later tree growth. Both processes can results in canopy closure, but represent very different ecological states. In contrast, Table 3 suggests that for the Yellowstone fire there is not a significant difference in correlating tree LAI and ANPP to the satellite metrics relative to total LAI and ANPP, in which the herbaceous vegetation is also included. This is probably because the young trees dominate the biomass and productivity of most stands [Turner et al., 2004, 2009]. We also determined that correlation between satellite and field metrics increased with decreasing burn severity. This likely reflects the reduced vegetation signal in more severely burned sites; lightly burned locations include trees that survived the fire and thus likely have considerably more biomass that can be detected by the satellite. Land managers should therefore be careful in monitoring forest regrowth with satellite data in situations of high-severity burns during the early successional time period when postfire biomass is uniformly low. Lastly, correlations between forest regrowth factors and satellite metrics increased with time since fire (Tab. 4). More analysis on this trend should be done, but we could speculate that the reason for this is the nature of YNP’s slow regrowth. Following the �988 fires, it took many years to reestablish woody biomass and tree canopy coverage in some locations. For example, near Lewis Falls fourteen years after the fire there remained standing dead trees on the surface and relatively sparse postfire trees (Fig. 8). In this and other high-elevation sites, prefire serotiny was low, and thus there was little canopy seedbank. Thus, there was not much vegetation for the satellite metrics to correlate to in the earlier studies.

Franks et al. Monitoring forest regrowth
�4
Figure 8 - After fourteen years, there was little forest regeneration near Lewis Falls, a high-elevation site in which few pre-fire trees bore serotinous cones. In contrast, forest regeneration was abundant in locations were pre-fire serotiny was high.
Leaf area index (LAI), aboveground net primary production (ANPP), and sapling density were the three ground-measured attributes used to determine ecological indices of ecological response. The satellite indices we used correlated well with changes in LAI and ANPP, but did not model the changes in sapling density. Fundamentally optical satellite data are most sensitive to leaf area and photosynthetic absorption (which drives ANPP), rather than demographic parameters such as the number of individuals, or structural parameters such as tree height or volume. As such, managers or users of data that wish to measure change in tree density would be wise to use others means rather than solely using spectral information. Limitations on the data used in this study may also limit the correlation between satellite and field-derived metrics. As previously noted, the resolution of the field sampling does not correspond exactly to that of a Landsat pixel. Additionally, misregistration of pixels were another source of variability. As Strahler et al. [�986] found, if the pixel and plot do not perfectly align, it is preferable for the field plot resolution to be larger than the pixel resolution. Conversely, others [Anderson et al., �993; Reese et al., 2003] found it more suitable to have a larger satellite pixel footprint than plot footprint. In our study, the original pixel resolution was smaller but the pixels were aggregated to reduce the noise and smooth spectral variability of pixel mismatch. Regardless, without actually designing the plots around the centroid of the satellite pixels, it is rare to not have errors of misregistrations. Another source of variability was that although we attempted to use satellite images in the same season, it was impossible to have every image acquired on anniversary dates. As can be seen in Figure �, all the imagery was acquired in the late summer time period (July, August, and September), but both seasonality and local climate conditions were somewhat variable. Lastly, although not a limitation to the study, it would have been desirable to have ground sampled data that were closer to the fire event, thus being able to determine correlation in early years. This study was able to show that satellite metrics were able to describe over 80% of the variability found in ground collected variables of forest regrowth (LAI, ANPP) for individual years, and roughly 60-70% over a six year span during vegetation recovery. Additionally,

�5
European Journal of Remote Sensing - 2013, 46: xxx-xxx
the change in LAI and ANPP is correlated with the change in NDVI and Band 5 (Fig. 7). These relations allow us to infer spatial variability of regrowth rate from temporal trends in satellite metrics, and investigate correlations with burn intensity. Such information is useful for monitoring or modeling how forest respond following large scale fire disturbance, but care must be taken to understand the limitations of these satellite-derived metrics.
AcknowledgementsThis work was supported by NASA Land Cover/Land-Use Change and Terrestrial Ecology Programs. Special thanks to Brian Harvey for recreating the Landsat Burn Severity Map (Fig. 5) from data collected for the �994 study conducted by Turner et al. The authors would also like to thank the anonymous reviewers for their useful and constructive comments.
ReferencesAdams J.B., Sabol D.E., Kapos V., Filho R.A., Roberts D.A., Smith M.O., Gillespie A.R.
(�995) - Classification of multispectral images based on fractions of endmembers: Application to land-cover change in the Brazilian Amazon. Remote Sensing of Environment, 52 (2): �37-�54. doi: http://dx.doi.org/�0.�0�6/0034-4257(94)00098-8.
Allen J.L., Sorbel B. (2008) - Assessing the Normalized Burn Ratio’s ability to map burn severity in the boreal forest and tundra ecosystems of Alaska’s national parks. International Journal of Wildland Fire, �7: 463-475. doi: http://dx.doi.org/�0.�07�/WF08034.
Anderson G.L., Hanson J.D., Haas R.H. (�993) - Evaluating Landsat Thematic Mapper derived vegetation indices for estimating above-ground biomass on semiarid rangelands. Remote Sensing of Environment, 45: �65-�75. doi: http://dx.doi.org/�0.�0�6/0034-4257(93)90040-5.
Bernhardt-Römermann M., Gray A., Vanbergen A. J., Bergès L., Bohner A., Brooker R. W., De Bruyn L., De Cinti B., Dirnböck T., Grandin U., Hester A. J., Kanka R., Klotz S., Loucougaray G., Lundin L., Matteucci G., Mészáros I., Oláh V., Preda E., Prévosto B., Pykälä J., Schmidt W., Taylor M. E., Vadineanu A., Waldmann T., Stadler J. (20��) - Functional traits and local environment predict vegetation responses to disturbance: a pan-European multi-site experiment. Journal of Ecology, 99: 777 -787. doi: http://dx.doi.org/�0.����/j.�365-2745.20��.0�794.x.
Bessie W.C., Johnson E.A. (�995) - The relative importance of fuels and weather on fire behavior in subalpine forests. Ecology, 76: 747-762. doi: http://dx.doi.org/�0.2307/�93934�.
Chen J.M., Black T.A. (�992) - Defining leaf area index for non-flat leaves. Agricultural and Forest Meteorology, 57: � -�2. doi: http://dx.doi.org/�0.�0�6/0�68-�923(9�)90074-Z.
Cocke A.E., Fulé P.Z., Crouse J.E. (2005) - Comparison of burn severity assessments using Differenced Normalized Burn Ratio and ground data. International Journal of Wildland Fire, �4: �89 -�98. doi: http://dx.doi.org/�0.�07�/WF040�0.
Corona P., Lamonaca A., Chirici G. (2008) - Remote sensing support for post fire forest management. iForest, �: 6-�2. doi: http://dx.doi.org/�0.3832/ifor0305-00�0006.
Crabtree R., Potter C., Mullen R., Sheldon J., Huang S., Harmsen J., Rodman A., Jean C. (2009) - A modeling and spatio-temporal analysis framework for monitoring
Franks et al. Monitoring forest regrowth
�6
environmental change using NPP as an ecosystem indicator. Remote Sensing of Environment, ��3: �486-�496. doi: http://dx.doi.org/�0.�0�6/j.rse.2008.�2.0�4.
Eidenshink J., Schwind B., Brewer K., Zhu Z., Quayle B., Howard S. (2007) - A project for monitoring trends in burn severity. Fire Ecology, 3 (�): 3-2�. doi: IND4404�099.
Franke M.A. (2000) - The Role of Fire in Yellowstone. Yellowstone in the Afterglow. National Park Service. Available at: http://www.nps.gov/yell/planyourvisit/upload/chapter2.pdf (last accessed 9/0�/20�2).
Freitas S.R., Longo K.M., Silva Dias M.A.F., Silva Dias P.L., Chatfield R., Prins E., Artaxo P., Grell G., Recuero F.S. (2005) - Monitoring the transport of biomass burning emissions in South America. Environmental Fluid Mechanics, 5: � -2. doi: http://dx.doi.org/�0.�007/s�0652-005-0243-7.
Glenn E.P., Huete A.R., Nagler P.L., Nelson S.G. (2008) - Relationship between Remotely-Sensed Vegetation Indices, Canopy Attributes and Plant Physiological Processes: What Vegetation Indices Can and Cannot Tell us about the Landscape, Sensors, 8: 2�36-2�60. doi: http://dx.doi.org/�0.3390/s8042�36
Gamon J.A., Field C.B., Goulden M.L., Griffin K.L., Hartley A.E., Joel G., Penuelas J., Valentini R. (�995) - Relationships between NDVI, Canopy Structure, and Photosynthesis in three Californian Vegetation types. Ecological Applications, 5 (�): 28-4�. doi: http://dx.doi.org/�0.2307/�942049.
Harris G.M., Jenkins C.N., Pimm S.L. (2005) - Refining Biodiversity Conservation Priorities. Conservation Biology, �9 (6): �957-�968. doi: http://dx.doi.org/�0.����/j.�523-�739.2005.00307.x.
Huete A., Didan K., Miura T., Rodriguez E.P., Gao X., Ferreira L.G. (2002) - Overview of the radiometric and biophysical performance of the MODIS vegetation indices. Remote Sensing of the Environment, 83: �95-2�3. doi: http://dx.doi.org/�0.�0�6/S0034-4257(02)00096-2.
Houston D.B. (�973) - Wildfires in Northern Yellowstone National Park. Ecology 54 (5): ����-���7. doi: http://dx.doi.org/�0.2307/�935577.
Hoy E.E., French N.H., Turetsky M.R., Trigg S.N., Kasischke E.S. (2008) - Evaluating the potential of Landsat TM/ETM+ imagery for assessing fire severity in Alaskan black spruce forests. International Journal of Wildland Fire, �7: 500-5�4. doi: http://dx.doi.org/�0.�07�/WF08�07.
Huang C., Kim S., Altstatt A., Song K., Townshend J.R.G., Davis P., Rodas O., Yanosky A., Clay R., Tucker C.J., Musinsky J. (2009) - Assessment of Paraguay’s Forest Cover Change Using Landsat Observations. Global and Planetary Change, 67: �-�2. doi: http://dx.doi.org/�0.�0�6/j.gloplacha.2008.�2.009.
Huang S., Crabtree R. L., Potter C., Gross P. (2009) - Estimating the quantity and quality of coarse woody debris in Yellowstone post-fire forest ecosystem from fusion of SAR and optical data. Remote Sensing of Environment, ��3: �926-�938. doi: http://dx.doi.org/�0.�0�6/j.rse.2009.05.00�.
Hurtt G.C., Dubayah R., Drake J., Moorcroft P., Pacala S., Fearon M. (2004) - Beyond Potential Vegetation: Combining Lidar Remote Sensing and a Height-Structured Ecosystem Model for Improved Estimates of Carbon Stocks and Fluxes. Ecological Applications, �4 (3): 873-883. doi: http://dx.doi.org/�0.�890/02-53�7.
Kashian D.M., Tinker D.B., Turner M.G., Scarpace F.L. (2004) - Spatial heterogeneity of

�7
European Journal of Remote Sensing - 2013, 46: xxx-xxx
lodgepole pine sapling densities following the 1988 fires in Yellowstone National Park, Wyoming, USA. Canadian Journal of Forest Research, 34: 2263-2276. doi: http://dx.doi.org/�0.��39/x04-�07.
Key C.H., Benson N.C. (2005) - Landscape Assessment: Remote sensing of severity, the normalized burn ration; and ground measure of severity, the composite burn index. In: Lutes D.C., Keane R.E., Caratti J.F., Key C.H., Benson N.C., Gangi L.J. Eds., FIREMON: Fire effects monitoring and inventory system, Ogden, Utah: USDA Forest Service, Rocky Mountain Res. Station.
Leimgruber P., Kelly D.S., Steininger M.K., Brunner J., Mueller T., Songer M. (2005) - Forest cover change patterns in Myanmar (Burma) 1990-2000. Environmental Conservation, 32: 356- 364. doi: http://dx.doi.org/�0.�0�7/S0376892905002493.
Lentile L.B., Smith F.W., Shepherd W.D. (2005) - Patch structure, fire-scar formation, and tree regeneration in a large mixed-severity fire in the South Dakota Black Hills, USA. Canadian Journal of Forest Research,35 (�2): 2875 -2885. doi: http://dx.doi.org/�0.��39/x05-205.
Levitt E.A. (2006) - Sources of variation in soil nitrogen availability among post-fire lodgepole pine stands in Yellowstone National Park. MS Thesis, University of Wisconsin, Madison.
Litton C.M., Ryan M.G., Knight D.H. (2004) - Effects of Tree Density and Stand Age on Carbon Allocation Patterns in Postfire Lodgepole Pine. Ecological Applications, �4 (2): 460-475. doi: http://dx.doi.org/�0.�890/02-529�.
Ludeke M., Janecek A., Kohlmaier G.H. (�99�) - Modelling the seasonal CO2 uptake by land vegetation using the global vegetation index, Tellus, 43B: �88-�96.
Masek J.G., Vermote E.F., Saleous N., Wolfe R., Hall F.G., Huemmrich F., Gao F., Kutler J. Lim T.K. (2006) - A Landsat surface reflectance dataset for North America, 1990-2000. Geoscience and Remote Sensing Letters, 3: 68-72. doi: http://dx.doi.org/�0.��09/LGRS.2005.857030.
Powell S.L., Cohen W.B., Healey S.P., Kennedy R.E., Moisen G.G., Pierce K.B., Ohmann J.L. (20�0) - Quantification of Live Aboveground Forest Biomass Dynamics with Landsat Time-Series and Field Inventory Data: A Comparison of Empirical Modeling Approaches, Remote Sensing of Environment ��4: �053-�068. doi: http://dx.doi.org/�0.�0�6/j.rse.2009.�2.0�8.
Reed R.A., Finley M.E., Romme W.H., Turner M.G. (�999) - Aboveground Net Primary Production and Leaf-Area Index in Early Postfire Vegetation in Yellowstone National Park. Ecosystems, 2: 88-94. doi: http://dx.doi.org/�0.�007/s�002�990006�.
Reese H., Nilsson M., Pahlén, T.G., Hagner O., Joyce S., Tingelöf U., Egberth M., Olsson H. (2003) - Countrywide estimates of forest variables using satellite data and field data from the National Forest Inventory. AMBIO: A Journal of the Human Environment, 32 (8): 542-548.
Renkin R.A., Despain D.G. (�992) - Fuel moisture, forest type, and lightning-caused fire in Yellowstone National Park. Canadian Journal of Forest Research, 22: 37-45. doi: http://dx.doi.org/�0.��39/x92-005.
Riaño D., Chuvieco E., Ustin S., Zomer R., Dennison P., Roberts D., Salas J. (2002) - Assessment of the vegetation regeneration after fire through the multitemporal analysis of AVIRIS images in the Santa Monica Mountains. Remote Sensing of Environment, 79:
Franks et al. Monitoring forest regrowth
�8
60-7�. doi: http://dx.doi.org/�0.�0�6/S0034-4257(0�)00239-5.Romme W.H. (�982) - Fire and landscape diversity in subalpine forests of Yellowstone
National Park. Ecological Monographs, 52 (2): �99-22�. doi: http://dx.doi.org/�0.2307/�9426��.
Romme W.H., Despain D.G. (�989) - Historical perspective on the Yellowstone Fires of 1988. Bioscience, 39 (�0): 696 -699. doi: http://dx.doi.org/�0.2307/�3��000.
Romme W.H., Boyce V., Gresswell R., Merrill E.H., Minshall G.W., Whitlock C., Turner M.G. (20��) - Twenty Years After the 1988 Yellowstone Fires: Lessons About Disturbance and Ecosystems. Ecosystems, �4 (7): ��96-�2�5. doi: http://dx.doi.org/�0.�007/s�002�-0��-9470-6.
Schroeder T.A., Cohen W.B., Yang Z. (2007) - Patterns of forest regrowth following clearcutting in western Oregon as determined from a Landsat time-series, Forest Ecology and Management, 243: 259-273. doi: http://dx.doi.org/�0.�0�6/j.foreco.2007.03.0�9.
Schullery P. (�989) - The Fires and Fire Policy. Bioscience 39 (�0): 686 -694. doi: http://dx.doi.org/�0.2307/�3�0999.
Singer F., Schreier W., Oppenheim J., Garton E.O. (�989) - Drought, Fires, and Large Mammals Bioscience, 39 (�0): 7�6 -722.
Strahler A.H., Woodcock C.E., Smith J.A. (�986) - On the nature of models in remote sensing. Remote Sensing of Environment, 20: �2�. doi: http://dx.doi.org/�0.�0�6/0034-4257(86)900�8-0.
Tanaka S., Kimura H., Suga Y. (�993) - Preparation of a 1:25000 Landsat map for assessment of Burnt area on Etaijima Island. International Journal of Remote Sensing, 4: �73�.
Tucker C.J. (�979) - Red and Photographic Infrared Linear Combinations for Monitoring Vegetation. Remote Sensing of Environment, 8 (2): �27-�50. doi: http://dx.doi.org/�0.�0�6/0034-4257(79)900�3-0.
Tucker C.J., Sellers P.J. (�986) - Satellite Remote Sensing of Primary Production. International Journal of Remote Sensing, 7:�395-�4�6. doi: http://dx.doi.org/�0.�080/0�43��68608948944.
Turner M.G., Hargrove W.W., Gardner R.H., Romme W.H. (�994) - Effects of Fire on Landscape Heterogeneity in Yellowstone National Park, Wyoming. Journal of Vegetation Science, 5 (5): 73� -742. doi: http://dx.doi.org/�0.2307/3235886.
Turner M.G., Romme W.H., Garner R.H. Hargrove W.W. (�997) - Effects of Fire Size and Pattern on Early Succession in Yellowstone National Park. Ecological Monographs, 67 (4): 4�� -433. doi: http://dx.doi.org/�0.2307/2963464.
Turner M.G., Romme W.H., Gardner R.H. (�999) - Prefire heterogeneity, fire severity and plant reestablishment in subalpine forests of Yellowstone National Park, Wyoming. International Journal of Wildland Fire, 9: 2�-36. doi: http://dx.doi.org/�0.�07�/WF99003.
Turner M.G., Tinker D.B., Romme W.H., Kashian D.M., Litton C.M. (2004) - Landscape patterns of sapling density, leaf area, and aboveground net primary production in postfire lodgepole pine forests, Yellowstone National Park (USA). Ecosystems, 7: 75�-775. doi: http://dx.doi.org/�0.�007/s�002�-004-00��-4.
Turner M.G., Smithwick E.A.H., Tinker D.B., Romme W.H. (2009) - Variation in foliar nitrogen and above ground net primary production in young postfire lodgepole pine.

�9
European Journal of Remote Sensing - 2013, 46: xxx-xxx
Canadian Journal of Forest Research, 39: �024-�035. doi: http://dx.doi.org/�0.��39/X09-029.
Vicente-Serrano S.M., Perez-Cabello F., Lasanta T. (20��) - Pinus halepensis regeneration after a wildfire in a semiarid environment: assessment using multitemporal Landsat images. International Journal of Wildland Fire, 20 (2): �95-208. doi: http://dx.doi.org/�0.�07�/WF08203.
Vila J.P.S., Barbosa P. (20�0) - Post-fire vegetation regrowth detection in the DeivaMarina region (Liguria-Italy) using Landsat TM and ETM+ data. Ecological Modelling, 22�: 75 -84. doi: http://dx.doi.org/�0.�0�6/j.ecolmodel.2009.03.0��.
Watt A.S. (�947) - Pattern and process in the plant community. Journal of Ecology, 35: �-22. doi: http://dx.doi.org/�0.2307/2256497.
Westerling A.L., Turner M.G., Smithwick E.A.H., Romme W.H., Ryan M.G. (20��) - Continued warming could transform Greater Yellowstone fire regimes by mid-21st century. Proceedings of the National Academy of Sciences, �08: �3�65-�3�70. doi: http://dx.doi.org/�0.�073/pnas.���0�99�08.
White J.D., Ryan K.C., Key C.C., Running S.W. (�996) - Remote sensing of forest fire severity and vegetation recovery. International Journal of Wildland Fire, 6: �25 -�36. doi: http://dx.doi.org/�0.�07�/WF9960�25.
Wu J., Loucks O.L. (�995) - From balance of nature to hierarchical patch dynamics: a paradigm shift in ecology. Q. Rev. Biol., 70: 439-466. doi: http://dx.doi.org/�0.�07�/WF9960�25.
Yuan F., Sawaya K.E., Loeffelholz B.C., Bauer M.E. (2005) - Land cover classification and change analysis of the Twin Cities (Minnesota) Metropolitan Area by multitemporal Landsat remote sensing. Remote Sensing of Environment, 98 (2-3): 3�7-328. doi: http://dx.doi.org/�0.�0�6/j.rse.2005.08.006.