monitoring, evaluation, and verification component of the ... · monitoring, evaluation, and...
TRANSCRIPT

e-Pact is a consortium led by Oxford Policy Management and co-managed with Itad in association with the Institute for
Fiscal Studies.
This evaluation was commissioned by the UK Department for International Development and was funded with UK aid
from the UK government.
This material has been funded by UK aid from the UK government; however the views expressed do not necessarily reflect the UK government’s official policies.
Monitoring, Evaluation, and
Verification Component of the
WASH Results Programme
Evaluation Synthesis Report - Volume 2.1 – SWIFT
Case Study
Evaluation of the WASH Results Programme SWIFT Case Study
This evaluation is being carried out by e-Pact. Julia Larkin is the team leader for the evaluation and Zach White is project manager for the evaluation ([email protected]). The project director for the whole MVE contract (evaluation and verification) is Don Brown.
The contact point for the client is Stephen Lindley-Jones ([email protected]). The client reference number for the project is PO6507.
e-Pact Level 3 Clarendon Centre Tel +44 (0) 1865 207300
52 Cornmarket St Fax +44 (0) 1865 207301
Oxford OX1 3HJ Email [email protected]
Registered in England: 3122495 United Kingdom Website www.opml.co.uk
Acknowledgements
This case study report is the culmination of evaluation activities undertaken by Oxford Policy
Management (OPM) between November 2014 and January 2019.
We would like to thank Guy Howard, Stephen Lindley-Jones, Leonard Tedd, and Laura Westcott at
the UK Department for International Development, the suppliers and their partner, and the
monitoring and verification team for their time and inputs during this period.
This case study was written by Zach White and Jeremy Colin with support from Faith Muniale. The
case study was reviewed internally by Julia Larkin and Lucrezia Tincani.
The evaluation team are extremely thankful to all those on SWIFT who facilitated the fieldwork. In
particular: Joanna Trevor, James Origa, and Francesco Rigamonti.
Evaluation of the WASH Results Programme SWIFT Case Study
e-Pact i
Table of contents
Acknowledgements 1
List of tables, figures, and boxes ii
Abbreviations iii
1 Introduction 1
1.1 Structure of the WRP reporting 1
1.2 Purpose of this report 1
1.3 Structure of the remainder of this report 1
2 Evaluation approach for SWIFT 2
2.1 Stakeholders met 2
2.2 Evaluation themes covered with country stakeholders 2
2.3 Limitations 1
3 The SWIFT consortium 2
3.1 Overview of SWIFT 2
3.2 SWIFT targets and the verification approach 8
3.3 Achievements 15
3.4 SWIFT in Kenya 20
3.5 SWIFT in DRC 28
3.6 Linkages or synergies with other WASH programmes 33
4 Findings and analysis 35
4.1 Relevance 35
4.2 Effectiveness 40
4.3 Efficiency 57
4.4 Impacts 64
4.5 Sustainability 68
Annex A Evaluation questions 77
Annex B Framework for assessing the prospects for inclusive WASH: SWIFT Kenya (overall) 79
Annex C Sustainability risk framework: Oxfam ASAL (urban water supply) 80
Annex D Sustainability risk framework: WSUP (urban water supply) 83
Annex E Sustainability risk framework: Sanergy (urban sanitation) 86
Annex F Sustainability risk framework: OxPAC ASAL (rural sanitation and hygiene) 89
Annex G Sustainability risk framework: OxPAC ASAL (rural water supply) 92

Evaluation of the WASH Results Programme SWIFT Case Study
e-Pact ii
List of tables, figures, and boxes
Table 1: Evaluation findings reporting 1 Table 2: Key data collection limitations and implications 1 Table 3: Overview of implementing partners and areas of operation 3 Table 4: Implementation approaches used in SWIFT across the phases 5 Table 5: SWIFT deliverables as per the contract annex 8 Table 6: SWIFT payment/verification rounds 10 Table 7: Number of verification indicators per consortium partner 12 Table 8: Common deliverable package indicators 14 Table 9: SWIFT performance on key deliverables 16 Table 10: Achievement against target 17 Table 11: Cases where there was underachievement against targets on outcome delivery targets* 17 Table 12: Final verified outcome results in hygiene 18 Table 13: Sanitation: verification results summary Q4 2017 19 Table 14: Final verified outcome results in water 20 Table 15: Overlaps and synergies with other WASH programmes 34 Table 16: Functionality over the course of the outcome phase 42 Table 17: Latrine use over the course of the outcome phase 44 Table 18: Hygiene outcomes over the course of the outcome phase 45 Table 19: Framework used to assess equity focus – Kenya 67 Table 20: Summary of sustainability risks by partner grouping 70 Table 21: Evaluation questions 77
Figure 1: Structure of payments over the course of the WASH Results Programme for SWIFT 9 Figure 2: Rural sanitation and water access (2012 and 2015) 21 Figure 3: SWIFT programme areas in Kenya 25 Figure 4: Rural sanitation and water access (2012 and 2015) 28 Figure 5: SWIFT programme areas in DRC* 31
Box 1: The steps of the VEA approach implemented by SWIFT 7 Box 2: Common elements across suppliers of the verification framework 10 Box 3: The VEA programme in DRC 32 Box 4: Overall evaluation questions related to this section’s discussion 35 Box 5: Overall evaluation questions related to this section’s discussion 40 Box 6: Overall evaluation questions related to this section’s discussion 57 Box 7: MV assessment of whether the ASAL drought was exceptional for the region 59 Box 8: Overall evaluation questions related to this section’s discussion 64 Box 9: Overall evaluation questions related to this section’s discussion 68

Evaluation of the WASH Results Programme SWIFT Case Study
e-Pact iii
Abbreviations
BBCMA BBC Media Action CHEWs Community Health Extension Workers CHVs Community Health Volunteers CLTS Community-led total sanitation DAC Development Assistance Committee DEQ Detailed evaluation question DFID Department for International Development DRC Democratic Republic of Congo FDLR Democratic Forces for the Liberation of Rwanda FGD Focus group discussion FLT Fresh life toilet FSM Faecal sludge management HEQ High-level evaluation question IDP Internally displaced person INGO International non-governmental organisation JMP Joint Monitoring Programme for Water Supply and Sanitation KAP Knowledge, attitudes, and practices KAWASEPRO Kakuma Water Services Provider LOWASCO Lodwar Water and Sanitation Company M&E Monitoring and evaluation MDGs Millennium Development Goals MEAL Monitoring, evaluation, and learning MV Monitoring and verification MVE Monitoring, verification, and evaluation NGO Non-governmental organisation ODF Open defecation free OECD Organisation for Economic Co-operation and Development OPM Oxford Policy Management OxPAC Oxfam, Practical Action, and Concern PbR Payment by results pppy Per person per year SAWRP South Asia WASH Results Programme SNV Netherlands Development Organisation SSH4A Sustainable Sanitation and Hygiene for All SWIFT Sustainable WASH in Fragile Contexts UNICEF UN Children’s Fund VFM Value for money VEA Village et Ecole Assainis VFM Value for money WASH Water, sanitation, and hygieneWASREB Water Services Regulator Board WHO World Health Organization WSB Water Service Board WSP Water Service Provider WSUP Water and Sanitation for the Urban Poor WUA Water Users Association

Evaluation of the WASH Results Programme SWIFT Case Study
e-Pact 1
1 Introduction
1.1 Structure of the WRP reporting
The endline evaluation of the WRP is presented across five separate volumes. This is due to the
size and complexity of the programme. Vol. 1 presents the summary findings across the three
Suppliers and addresses the evaluation questions. Vol. 1.2 contains the annexes to the summary
report. Vols. 2.1, 2.2, and 2.3 are supplier-specific case studies and seek to provide far greater
contextual information and discuss the evidence under the relevant thematic headings.
Table 1: Evaluation findings reporting
Volume Contents
Vol. 1.1 Summary report - These volumes address the evaluation questions across the three
suppliers.
- Provides lessons and recommendations Vol. 1.2 Summary report annexes
Vol. 2.1 SWIFT case study See below for details of the report structure
The structure of the three case studies is the same to allow for issues to
be compared across the three suppliers.
Vol. 2.2 SSH4A case study
Vol. 2.3 SAWRP case study
1.2 Purpose of this report
This report summarises the main findings of the WASH Results Programme endline evaluation, for
the Sustainable WASH in Fragile Contexts (SWIFT) programme only. It summarises the findings
from the country visit to Kenya in early 2018, remote interviews with SWIFT programme managers
in the UK and the Democratic Republic of Congo (DRC), and a review of relevant documentation;
and it incorporates findings from the midline assessment where relevant. In addition, the report
draws on insights gained from roundtable meetings and learning events with suppliers and verifiers
during the output and outcome phases of the programme.
This report does not seek to answer the evaluation questions directly as these pertain to the
programme as a whole, and are addressed directly in Vol. 1.1. Rather, this report notes the
evaluation team’s reflections as they pertain to SWIFT across the relevant thematic areas. This
report is best viewed as documenting the supporting evidence from SWIFT that contributes to
addressing the evaluation questions.
1.3 Structure of the remainder of this report
Section 2 provides details of the evaluation approach with reference to the SWIFT specific
data collection, limitations, and potential sources of bias;
Section 3 provides an overview the SWIFT consortium, the results, and the implementation in
each of the SWIFT counties; and
Section 4 discusses the findings of the evaluation under each of the DAC criteria and under
thematic headings related to the evaluation questions.

Evaluation of the WASH Results Programme SWIFT Case Study
e-Pact 2
2 Evaluation approach for SWIFT
2.1 Stakeholders met
Evaluation activities Kenya DRC Comment (e.g. if not met / only able to meet partially)
Supplier global managers
All country partners (Oxfam, Practical Action, Concern, Water and Sanitation for the Urban Poor (WSUP), Sanergy, BBC Media Action (BBCMA) met at midline and endline
Lead verifier Met at regular intervals throughout the four years of the programme
Country verifiers Met at midline and endline
Learning partner Overseas Development Institute (ODI) interviewed at endline only
Supplier country staff
All country partners in Kenya (Oxfam, Practical Action, Concern, WSUP, Sanergy, and BBCMA) met at midline and endline. DRC country management staff interviewed at endline.
Remote interviews conducted with DRC country management (Oxfam and Tearfund) staff at endline
Local implementing partners
n.a. × Local implementing staff interviewed in Kenya
Government counterparts × County and sub-county actors met in Kenya
Community members (service users)
× × A limited number conducted as part of the Kenya case study at midline and endline
Other sector experts × UN Children’s Fund (UNICEF) and former World Bank staff in Pakistan
2.2 Evaluation themes covered with country stakeholders
Country context: other large sanitation and hygiene programmes; government prioritisation;
national context.
Programme design and functioning: scale; staff and partners; contracting; theory of change;
implementation activities prior to 2015 and 2016–2017.
Monitoring: outcome targets; indicator definitions; progress monitoring; survey design.
Implementation progress and quality of implementation: progress to date; quality of
implementation; variation in quality; district-wide focus; handwashing.
Inclusion, sustainability, and health: progress; variations in achievements; challenges;
faecal sludge management (FSM).
How PbR played out in-country: verification process; verification indicators; evidence
requirements; changes in approach; payment deductions; lead verifier; benefits of PbR;
negative consequences.
Degree of learning: approach; innovations and evolutions; lessons.

Evaluation of the WASH Results Programme SWIFT Case Study
e-Pact 1
2.3 Limitations
There were a number of limitations on endline data collection; see Table 1.
Table 2: Key data collection limitations and implications
Limitation/ issue Implications and mitigating action
Staff turnover between phases: The SWIFT Kenya programme experienced a number of staff changes during the outcome phase. In particular, the Programme Coordinator and Monitoring, Evaluation and Learning (MEAL) Officer both left during the final six months of the programme and the new incumbents were unable to provide an overview of activities and associated issues, challenges, and lessons learned over the full course of the outcome phase. However, there was more continuity within the various sub-programmes.
Findings from midline interviews with earlier programme managers
enabled the team to contextualise the findings from the endline interviews. Furthermore, the global manager had previously been involved in the DRC SWIFT programme.
Range and variety of projects in Kenya: Given the number and variety of sub-programmes making up SWIFT in Kenya, the evaluation team could only spend a brief amount of time with each one, allowing limited opportunity to explore project-specific issues in depth.
In the event, the team were able to engage with staff from all six of the partners working in Kenya at midline and endline. The variety of the projects mean that throughout the report the team have had to present key results by supplier separately, or grouped where the interventions and intervention areas are similar enough to do so. Similarly, care has been taken to clarify findings which hold for some partners or groups but not for others.
DRC country programme review: The review team did not visit DRC, and therefore this part of the evaluation was limited to a review of documents, remote interviews with country programme managers, and interviews with consortium managers and the lead verifier in the UK.
This is a more serious limitation as the views of implementing partner and government staff are not directly captured by the evaluation. This limitation is a feature of the design. In the analysis careful attention is paid
to clarifying where the DRC findings reveal significant similarities or differences between the two country programmes.
Limited view of financial data: Due to the commercial and PbR nature of the contracts, partners were (understandably) unwilling to share financial information with the evaluation team.
This restriction severely hampers the scope for commenting reliably on
value for money (VFM), beyond that represented by the ‘prices’ paid by DFID as set out in the contracts. The analysis and discussion of efficiency and VFM aspects is based solely on the qualitative reflections of the supplier staff and discussed in relation to contract value as a whole.
Limited direct engagement with beneficiaries: The evaluation design meant that limited third-party data were collected.
As part of addressing this limitation the evaluation team considered using some of the beneficiary feedback mechanisms established by suppliers, but no viable options were identified.

Evaluation of the WASH Results Programme SWIFT Case Study
e-Pact 1
2.3.1 Bias
There are several sources of potential bias arising from the data collection. While in all cases
mitigating action was taken in the analysis, where possible, these remain important to consider in
relation to the analysis:
Programme staff interviews: The vast majority of the analysis is based on interviews with
SWIFT programme staff. This data focus is largely the result of the fact that the evaluation is
explicitly for learning purposes, rather than accountability, and as such the experiences of
implementers was seen as one of the most important sources of learning. The result is that the
majority of the analysis rests on a primary data source that has an incentive to cast the
programme in a positive light. While during the analysis a focus was placed on triangulating
data from interviews to arrive at the summary conclusions the evaluation team do not seek to
question the experiences of the implementing staff as reported, and a focus was placed on
accurately reflecting the reported experiences, while triangulating these with other perspectives
and sources of data.
Limited primary data on results - The evaluation team did not collect primary data on outputs
and outcomes, given DFID’s investment in the results verification. As such, the results data are
assumed to be accurate as the evaluation team have limited means to validate these. Thus,
should there be any inaccuracies in the results data the analysis based on these data will have
those errors embedded within it.
Monitoring, verification, and evaluation (MVE) contract: The verification team and the
evaluation component were commissioned under a single contract. However, the verification
workstream (led by Itad) and the evaluation component (led by Oxford Policy Management
(OPM)) are managed separately; OPM and Itad were contracted jointly as the e-Pact
consortium. This is a potential source of bias as regards the evaluation team’s judgements
relating to the verification framework. Several steps were taken to minimise the risk of this
affecting the analysis, most significant of which was the fact that the verification and the
evaluation were independently managed workstreams.
2.3.2 External validity/generalisability
The analysis is deeply rooted in the context of the particular PbR modality used. Salient features
are: that there was no grant component and payments were only made on the basis of verified
results packages/deliverables; there were no upside incentives – only penalties for
underperformance; the programme was a DFID centrally managed programme; the programme
used a non-governmental organisation (NGO) delivery channel; and the programme had a very
tight deadline for results to be delivered.
As such, the analysis is best viewed as pertaining not to all forms of PbR contracting but rather to
this particular formulation. Throughout this report attention is placed on documenting the
contextual factors that affected implementation and how the suppliers operationalised the modality.
While there is learning related to the use of PbR contracting for WASH programmes more broadly,
the findings are firmly situated in the context of this particular application of PbR. Furthermore, it is
worth noting that the three supplier consortia (South Asia WASH Results Programme (SAWRP),
SWIFT, and Sustainable Sanitation and Hygiene for All (SSH4A)) all had different results packages
and verification frameworks arising from how the tenders were formulated and contracts
negotiated.

Evaluation of the WASH Results Programme SWIFT Case Study
e-Pact 2
3 The SWIFT consortium
This section seeks to provide an overview of the SWIFT consortium and is structured as follows:
Section 3.1 provides a broad overview of the consortium structure, implementation areas, and
the implementation approaches. (These facets are explored in more detail, as they pertain to
country-specific implementation, in Sections 3.4 and 3.5).
Section 3.2 provides details of the consortium’s contractual targets, how these were translated
into payment milestones, and the verification approach and indicators.
Section 3.3 presents the consortium’s achievements.
3.1 Overview of SWIFT
3.1.1 Consortium make-up
The Oxfam-led SWIFT consortium operated in DRC and Kenya; a third country programme in
Liberia was also planned but had to be cancelled due to the Ebola crisis in 2015. Out of the three
suppliers that delivered the WASH Results Programme globally, SWIFT was the only one
contracted under Lot A, meaning that the programme had a substantial water supply component,
in addition to sanitation and hygiene promotion. The bulk of the results come from DRC, where the
programme operated within the framework of a national sanitation programme.
In Kenya many of the partnerships formed were new, though for each of the partners, the scope of
work, represented an extension or expansion of existing work. Similarly, in DRC both organisations
were previously working in the country – in line with a well-defined national approach – and the
work under SWIFT represented a continuation or expansion of previous work.
Table 3 outlines the SWIFT consortium partners (hereafter referred to as just ‘partners’) and their
implementing partners (hereafter referred to as ‘implementing partners’ to distinguish them from
‘consortium partners’). In addition to the implementing organisations, ODI provided cross-cutting
monitoring, evaluation, and learning (MEAL) advice to the consortium.

Evaluation of the WASH Results Programme SWIFT Case Study
e-Pact 3
Table 3: Overview of implementing partners and areas of operation
Country Partner Implementing partners
Project details Location Urban/rural
Kenya
Oxfam
Water supply
Turkana
Urban
Water supply, sanitation, and hygiene
Rural PACIDA*
ALDEF*
Water supply, sanitation, and hygiene
Wajir
Practical Action
n.a.
Water supply, sanitation, and hygiene
Turkana Rural
Hygiene Nairobi Urban
Concern Worldwide
ADSMKE*
WASDA*
Water supply
Marsabit Rural Sanitation and hygiene
BBCMA n.a. Hygiene promotion
ASAL region
Rural
Hygiene promotion Nairobi Urban
WSUP n.a. Water supply Nairobi – Dandora
Urban
Sanergy n.a. Sanitation Nairobi – Mukuru
Urban
DRC
Oxfam
YME Grands Lacs
Water supply, sanitation, and hygiene
North Kivu
Rural and semi-urban
HYFRO Water supply, sanitation, and hygiene
CEPROSSAN Output phase only
PPSSP
Output phase only
Tearfund n.a. Water supply, sanitation, and hygiene
North Kivu
South Kivu
Maniema
PPSSP – Programme de Promotion de Soins Santé Primaires, CEPROSSAN – Centre de Promotion Socio Sanitaire, AVUDS – Action des Volontaires Unis pour le Développement et la Santé, HYFRO – Hydraulique sans Frontières. ASAL – Arid and semi-arid lands
*Note: Were contracted during the output phase only

Evaluation of the WASH Results Programme SWIFT Case Study
e-Pact 4
Box 1: Role of the advisory partners
The role of ODI
ODI were involved in the consortium from the design stage. Broadly speaking, their role was to support across the MEAL aspects. Specifically, this included:
a) ‘backstopping monitoring’ – e.g. advising on indicator selection, and support on surveys (training and analysis);
b) evaluation – supporting internal reviews; this included a mid-term review focusing on the programme in Kenya (DRC did their own). This was done with the intention of informing programming between phases; and
c) operational learning – formative research and operational research to support better programming.
Governance of SWIFT was achieved through a series of management teams within the various
partner organisations. In each country there was also a SWIFT programme manager employed by
Oxfam with responsibility for liaison with the country partners, coordinating the results reporting,
and interfacing with the SWIFT global management team. There was also a global management
team (including an overall SWIFT consortium manager) in Oxfam who served as the interface with
DFID. Management arrangements within the consortium partners varied in line with the scope and
scale of their sub-programmes. The partners were relatively autonomous in terms of their
implementation and management approaches.
Oxfam was the contract holder with DFID, and between the lead partners there was a PbR
arrangement contract whereby partners were paid pro-rata against achievement, in line with a
fixed price per beneficiary1.
SWIFT originally included a third country – Liberia. Here the programme was suspended and later
terminated due to the Ebola crisis. This resulted in Oxfam re-negotiating the contract with DFID.
This is further documented in Section 4.3.1.
In 2017 Oxfam’s contract with DFID was extended until 2020, with an additional £9,782,547 million
in budget allocated to continue the programme in DRC2
3.1.2 Overview of implementation approaches
The WASH Results Programme was divided into two phases: the output phase lasted between
2013/4 and March 2016,3 and the outcome phase lasted between January 2016 and March 2018.
During the output phase, payments were based on the delivery of output-level results only, and
similarly during the outcome phase payments were based only on outcome-level results. The
delineation of these phases had varying significance to different partners – these are discussed
below in relation to each country/partner.
The Kenya and the DRC programmes were very different with respect to their scope and scale. In
DRC the two main consortium partners implemented the programme in more focused geographical
1 The evaluation team understand that this varied by partner and country, and the price per beneficiary differed according to the main contract with DFID – though we lack details of the internal contracting arrangements within SAWRP. 2 The programme was not continued in Kenya – this was the supplier’s choice, rather than enforced by DFID. 3 With a one-quarter extension later added – the original timeframe was for the output phase to end in December 2015.

Evaluation of the WASH Results Programme SWIFT Case Study
e-Pact 5
areas and operated at a comparatively larger scale within those areas (discussed further in
sections 3.1.3 and 4.1.2).
The water and hygiene targets (beneficiary numbers) for DRC were double those for Kenya, and
nearly 17x those for sanitation. The DRC programme implementation used a standardised
approach aligned with a national government programme. The Kenya programme differed from
that in DRC (and from the SAWRP and SSH4A programmes) in several respects:
there were multiple implementing partners delivering a portfolio of discrete projects, some of
them stand-alone initiatives unrelated to others in the consortium;
a substantial part of the work was urban, and rural sanitation had a fairly low profile overall;
the implementing partners were all INGOs (some with local partners); and
each implementing partner had fairly modest output targets.
The defining feature of SWIFT in Kenya was the range, rather than the scale, of activities. This
makes it difficult to define it as a single programme beyond the fact that all of the projects were
funded from a common source and shared the same broad objectives. Only the rural ASAL
projects were similar in terms of technical content and operational approaches, and here there was
some inter-partner support on water supply. Though the majority of the implementing partners
used tried and tested models, several of the projects making up the Kenya programme used
implementation models that were not fully tested and refined before the programme began and a
number of challenges arose during implementation, not all of which could be fully resolved in the
time available (discussed further in Sections 3.1.3 and 4.1.2). Table 4 provides an overview of the
implementation approaches used in Kenya, and VEA approach used in DRC is discussed below.
Table 4: Implementation approaches used in SWIFT across the phases
Country Partner Implementation area
Output-phase approaches Outcome-phase approaches
Kenya
Oxfam
Urban water supply (Lodwar Water and Sanitation Company
(LOWASCO) and Kakuma Water Services Provider (KAWASEPRO), Turkana)
Hardware construction by the NGO partners
Institutional support to strengthen service delivery. Some direct implementation to support functionality
Rural water supply (Turkana and Wajir)
Direct implementation to deliver services – focus on solar boreholes
Institutional support to community-based management structures
Rural sanitation and hygiene promotion (Turkana and Wajir)
CLTS and hygiene promotion in Turkana County; also initiated in Wajir but results later transferred to Turkana due to slow progress. In-kind subsidy in the form of latrine slabs
Hygiene promotion continued through government extension workers
Practical Action
Rural water supply (Turkana)
Direct implementation to deliver services – focus on boreholes with solar pumps
Institutional support to community-based management structures
Community-led total sanitation
CLTS promotion without a subsidy component; working
CLTS strategy modified to include in-kind slab

Evaluation of the WASH Results Programme SWIFT Case Study
e-Pact 6
In DRC, SWIFT partners predominantly used the VEA approach in rural areas to increase access
to improved water supplies and sanitation. In semi-urban areas a different approach4 was used
and Community Health Clubs were also part of programming. The VEA has a specified step-by-
step process of village mobilisation. The VEA approach integrates drinking water, sanitation,
personal hygiene, and solid waste disposal, and its structure is decentralised, community-based,
and community-driven. It is the structures that are established or engaged under the VEA
approach that are often responsible for managing and maintaining the services. The steps of the
VEA approach as implemented by SWIFT are outlined in Box 1. SWIFT also highlight that with
their partners ADIR5 they focused on developing new approaches for semi-urban contexts. Oxfam
and Tearfund differed slightly in their implementation; Tearfund implemented directly with
government and had an explicit memorandum of understanding (MoU). Oxfam implemented
through partners and directly; in coordination with government. Further detail on the VEA
approach is provided in Section 3.5.2.
Compared to SWIFT in Kenya there was a more unified approach for the consortium partners in
DRC, as both partners followed the VEA approach. In this respect the transition from the output to
4 See SWIFT website for details: http://swiftconsortium.org/portfolio/the-asurep-a-promising-water-management-model-in-the-drc/ 5 An organisation based in Kinshasa that worked with SWIFT to look specifically at water management approaches called ASUREPs
(CLTS), hygiene promotion (Turkana)
with local government staff and volunteers as the field promotors/facilitators
subsidy. Hygiene promotion continued through government extension workers
Hygiene promotion Nairobi
Household-level hygiene promotion through community health extension workers and Community Health Volunteers
Concern Worldwide
Rural water supply, sanitation, and hygiene promotion (Marsabit)
Water supply system construction and CLTS by the NGO partners
Strategic partnership with county water and public health departments to consolidate existing gains
WSUP Urban water supply, Dandora
Work with the utility responsible for informal settlements (Nairobi Water) to lay the infrastructure for piped water to the settlement, and community engagement and promotional work, including establishment of the community sub-office
Focus on extending metered connections (including opening a site office in the settlement). Focus on increasing revenue and Nairobi City Water and Sewerage Company (NCWSC) capacity
Sanergy Urban sanitation (Mukuru)
Social enterprise focused on constructing and franchising the operation of toilet facilities. Another separate company runs emptying services
Strategy overhauled to focus on residential over commercial facilities. Ongoing operation of the business model
BBCMA Hygiene promotion via radio (ASAL and Nairobi)
Capacity building of radio stations and hygiene promotion though radio
Largely limited to monitoring
DRC Oxfam
WASH VEA approach in rural areas; SWIFT ‘semi-urban approach’; and community health clubs Tearfund

Evaluation of the WASH Results Programme SWIFT Case Study
e-Pact 7
outcome phase was less of a discontinuity. Though the programme in DRC did shift away from the
delivery of outputs.
Box 1: The steps of the VEA approach implemented by SWIFT
Step 1: A village takes the initiative by making a formal application to the Chief Medical Officer of the Health Zone. If the application is successful, an agreement is signed between village leaders and the local Health Zone office, setting out each party’s commitments.
Step 2: The village forms a managing committee.
Step 3: The community conducts a knowledge, attitudes and practices (KAP) analysis of its WASH situation.
Step 4: The zonal health team works with a SWIFT partner to help the village’s managing committee develop an action plan. The support provided may include: training of community motivators in hygiene awareness; assistance with conducting the KAP survey; provision of supplies needed to construct household latrines that are unavailable locally; and training and salaries for qualified masons if they are needed for construction work.
Step 5: The action plan must ensure that the village’s facilities, hygiene practices, and disease prevention strategies match a set of seven VEA standards: there should be a dynamic managing committee; at least 80% of the village population should have access to clean drinking water; at least 80% of households should use a hygienic toilet; at least 80% of households should safely dispose of their rubbish; at least 60% of the population should wash their hands with soap or alternative cleanser before eating and after using the toilet; at least 70% of households should understand the routes of faecal-oral transmission of disease and how to avoid infection; and at least once a month the village should be cleaned and grass verges cut.
Step 6: The village has between six months and a year to upgrade its toilets, dig its rubbish pits, conduct sufficient hygiene promotion sessions to instil the habit of handwashing, and organise protection of its water points.
Step 7: When the village has completed its action plan, the zonal health team carries out a post-programme KAP survey.
Step 8: VEA certification is conferred by the Chief Medical Officer of the Health Zone at a special celebration.
Source: SWIFT materials, from SWIFT website
3.1.3 Significant changes to design during implementation
There were several changes to implementation approaches and programme areas, including the
following:
i) The termination of the programme in Liberia following the Ebola crisis.
ii) Practical Action’s work on urban sanitation in Nairobi could not move forward as planned and led to a significant transfer of sanitation beneficiary numbers from Kenya to DRC.
iii) Over the course of SWIFT, Sanergy significantly adjusted their strategy and elements of their business model and company structure – these changes were largely not attributed to the SWIFT programme, but rather were part of wider organisational changes.
iv) Practical Action adapted their rural sanitation approach to include an in-kind subsidy in the form of latrine slabs, following repeated latrine collapse. It should be noted that this was Oxfam’s approach from the outset.
Evaluation of the WASH Results Programme SWIFT Case Study
e-Pact 8
Finally, though not a deviation from design the evaluation team noted a high turnover of staff in
senior positions between the output and outcome phases.
3.2 SWIFT targets and the verification approach
3.2.1 Targets set in the contract
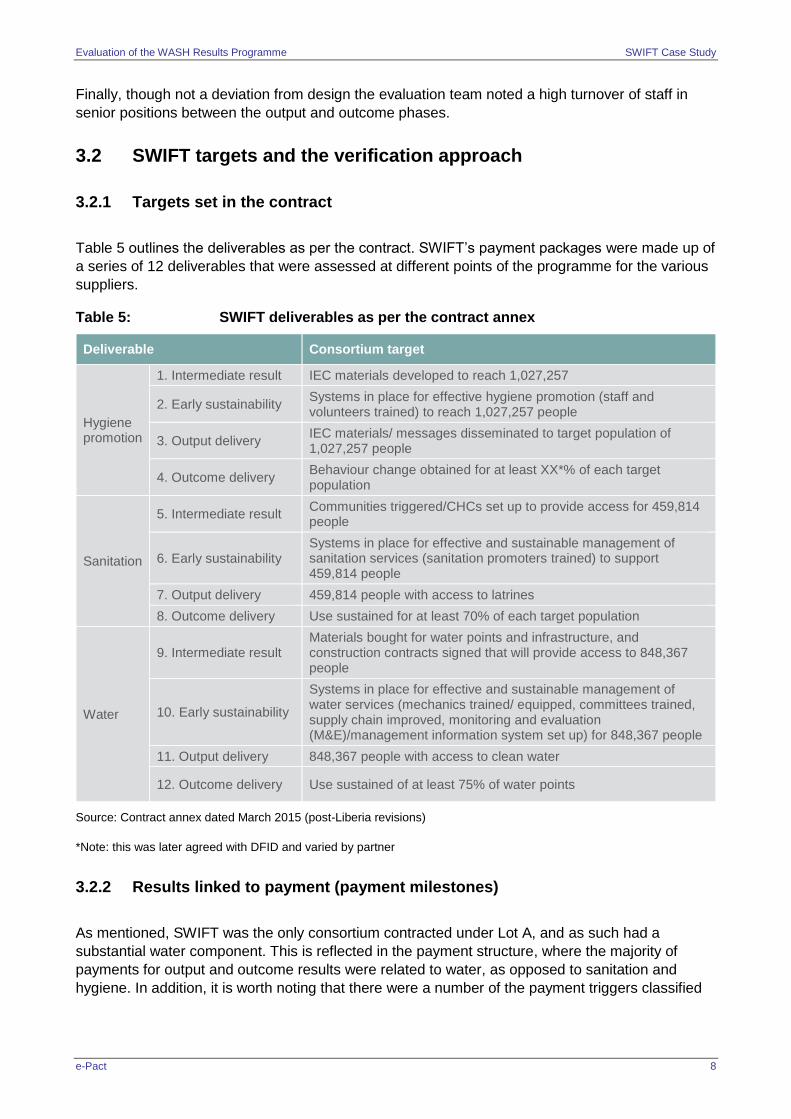
Table 5 outlines the deliverables as per the contract. SWIFT’s payment packages were made up of
a series of 12 deliverables that were assessed at different points of the programme for the various
suppliers.
Table 5: SWIFT deliverables as per the contract annex
Deliverable Consortium target
Hygiene promotion
1. Intermediate result IEC materials developed to reach 1,027,257
2. Early sustainability Systems in place for effective hygiene promotion (staff and volunteers trained) to reach 1,027,257 people
3. Output delivery IEC materials/ messages disseminated to target population of 1,027,257 people
4. Outcome delivery Behaviour change obtained for at least XX*% of each target population
Sanitation
5. Intermediate result Communities triggered/CHCs set up to provide access for 459,814 people
6. Early sustainability Systems in place for effective and sustainable management of sanitation services (sanitation promoters trained) to support 459,814 people
7. Output delivery 459,814 people with access to latrines
8. Outcome delivery Use sustained for at least 70% of each target population
Water
9. Intermediate result Materials bought for water points and infrastructure, and construction contracts signed that will provide access to 848,367 people
10. Early sustainability
Systems in place for effective and sustainable management of water services (mechanics trained/ equipped, committees trained, supply chain improved, monitoring and evaluation (M&E)/management information system set up) for 848,367 people
11. Output delivery 848,367 people with access to clean water
12. Outcome delivery Use sustained of at least 75% of water points
Source: Contract annex dated March 2015 (post-Liberia revisions)
*Note: this was later agreed with DFID and varied by partner
3.2.2 Results linked to payment (payment milestones)
As mentioned, SWIFT was the only consortium contracted under Lot A, and as such had a
substantial water component. This is reflected in the payment structure, where the majority of
payments for output and outcome results were related to water, as opposed to sanitation and
hygiene. In addition, it is worth noting that there were a number of the payment triggers classified

Evaluation of the WASH Results Programme SWIFT Case Study
e-Pact 9
as process- or input-related payments. These are discussed below and relate to payments for
‘intermediate results’, ‘intermediate outcomes’, ‘early sustainability’, and ‘MEAL, admin, and
contingency-’ related payments.
Figure 1: Structure of payments over the course of the WASH Results Programme for SWIFT
Sources: Analysis is based on the contract annex for the supplier. The coding of the data by results area is by the authors
Figure 1 presents an analysis of the contract structure, with payment milestones classified6 by
input-, process-, output-, and outcome-related payments. Over the four years of the programme,
approximately 80% of the payments were planned to be made in the output phase (April 2014–
December 20157), and the remaining 30% of the payments were planned for the outcome phase. It
is also notable that ~40% of the payments were seen to be related to processes or inputs (as per
the analysis of the authors).
SWIFT was paid over 10 payment milestones, with seven verification/payment points in the output
phase and three in the outcome phase. All deliverables were verified by the independent e-Pact
monitoring and verification (MV) team. It is worth noting that there were originally only nine
payment milestones, with six – as opposed to seven – verification/payment rounds in the output
phase. DFID agreed to a time extension on output-phase results, adding the verification/payment
round in Quarter 1 (Q1) 2016.
6 By the authors. 7 Later extended by one quarter.

Evaluation of the WASH Results Programme SWIFT Case Study
e-Pact 10
Table 6: SWIFT payment/verification rounds
2014 2015 2016 2017
Output- and process-related payment Outcome-related
payment
Calendar quarter-> 2 3 4 1 2 3 4 1 2 3 4 1 2 3 4
Verification of SWIFT deliverables X X X X X X X X X X X
Source: MV reports
Notes: Input-related payments were planned over the course of the contract
The definition of the indicators and their verification was negotiated and established through the
verification framework. The formulae for calculating the aggregation of results were defined within
the verification framework. There were two levels of aggregation. First, the results were
aggregated across the indicators that pertain to a certain deliverable – the weightings for the
various indicators as well as the thresholds for proportional payments are contained in the Form
2s. Second, the results were aggregated across the various partners within a country to produce
an overall picture of achievements in that country. These data informed payments for the SWIFT
consortium partners in that country.
It is also worth noting that during the course of the programme there were some significant
transfers in beneficiary numbers between countries and partners:
i) Following the Ebola crisis in West Africa in 2014–15 the SWIFT activities in Liberia were officially suspended in August 2014, with the programme later terminated in Liberia and the contract renegotiated, with the contract value revised downwards in March 2015.
ii) In August 2015 there was a significant transfer of sanitation beneficiary numbers from Kenya to DRC following partners in Kenya being unable to meet their targets.
3.2.3 Verification process
As with all the suppliers the verification process was built around the supplier’s existing M&E
frameworks, though with the MV team requiring additional internal quality assurance processes
and evidence as part of the results packages. Box 2 outlines the common elements of the
verification framework under the WASH Results Programme.
Box 2: Common elements across suppliers of the verification framework
Due to the PbR financing modality of the programme, suppliers were only paid for results that were
independently verified. Therefore, the verification process, which confirmed whether or not the supplier
had delivered the agreed results, was a central element of the programme. The independent verification of
suppliers’ results was based on a systems-based approach. This approach was not specified in the
terms of reference but was chosen by the MV provider to match the budgetary envelope of the terms of
reference.
Systems-based verification means that evidence regarding the achievement of results was not established
through independent data collection by the verification agent, but was instead based on data generated by
the supplier’s internal monitoring and reporting systems. This implies that a strong focus of the verification
process was appraising the robustness of the supplier’s internal monitoring and reporting systems. The

Evaluation of the WASH Results Programme SWIFT Case Study
e-Pact 11
MV provider set out their approach for verification at the end of the inception phase in September 2014.
The approach was based on three core elements:
A systems appraisal of the supplier’s internal monitoring and reporting systems: A
comprehensive systems appraisal was conducted ahead of the first full verification cycle to map which
internal monitoring and reporting systems would generate the evidence needed for verification. If
systems were deemed to be insufficient, corrective action was recommended by the verifiers. The
systems appraisal was repeated ahead of each verification cycle until the systems were deemed to
meet the required standard for evidence generation, and/or if evidence requirements changed over
time.
Desk-based verification of supplier-generated evidence: First, a list of evidence requirements was
drawn up by the MV team (the ‘Form 2’), tailored to each verification round as necessary. This
evidence was then submitted by each supplier and checked for completeness by the MV team.
Field-based verification using MV-generated data: In parallel to the desk-based verification of
evidence described above, the MV team carried out field visits to double-check the veracity of
evidence submitted and the quality of results achieved, and to assess the likely sustainability of result
achieved.
These three elements took place in parallel and informed the conclusion by the verification team
regarding whether a given supplier had delivered the agreed results (the quarterly verification report).
This conclusion was passed on to DFID, who made a payment decision on the results to be paid for that
quarter. An After-Action Review was frequently held thereafter to identify lessons and agree on actions
to take in forthcoming verification rounds.
All verification forms (Form 2s) were built around the same elements: for each verification indicator, the
form specified the indicator definition, data source, and data requirements for suppliers, and the
methodology of analysis for the verifier. Indicators usually included a numeric assessment of the number
of results achieved and a list of the documentation required to establish the veracity of the result and also
its quality, if applicable. Each Form 2 also included the methodology for how a payment decision was
made, based on the aggregate analysis of all the indicators which pertained to that deliverable, such as
whether payment was proportional to the number of results achieved or whether it was made based on a
pass or fail.
To ensure that the verification process was feasible and appropriate, the evidence requirements set out in
the Form 2s were tailored for each supplier, and for each results deliverable, and in some cases even
tailored for different countries or implementing partners. This resulted in 42 different Form 2s for the output
phase. As the verification methodology was designed and adjusted while supplier implementation
activities were ongoing, several modifications were made to the evidence requirements during the output
phase.
For SWIFT, the large number of consortium partners meant that the verification had to take place
over those partners. For example, each consortium partner had a separate systems appraisal
conducted at the various stages of the programme. Furthermore, as the systems for data collection
changed between the output and the outcome phase separate verification methodologies and
systems appraisals were conducted for the two different systems. The output-phase results were
largely drawn from the supplier’s own monitoring systems, whereas during the outcome phase
supplier-organised surveys were used to assess outcomes.

Evaluation of the WASH Results Programme SWIFT Case Study
e-Pact 12
3.2.4 Verification and payment indicators
Each of the deliverables had one or multiple indicators used for verification. The ‘intermediate
results’ and ‘early sustainability systems’ milestones were largely process-related and meant that
these two sets of deliverables had to have supplier-specific verification requirements related to
their implementation. Similarly, the outcomes and indicators for the various consortium partners
were also specific to their respective sub-programmes. Consequently, the indicators used for each
of the deliverables differ by partners. Some partners are grouped when their activities are close
geographically or by type of result – for example the ASAL partners’ (Oxfam, Practical Action, and
Concern – OxPAC) outcome-phase results were jointly assessed. Similarly, the outcome-phase
results for the DRC partners (Oxfam and Tearfund) were also jointly assessed.
For SWIFT, for the reasons discussed above in Section 3.2.1, there were a large number of Form
2s – far more than any other consortia. In total, there were 39 Form 2s developed for the
programme – with a total of 117 indicators aggregated across the 12 deliverables. Furthermore,
each indicator would often have several criteria related to the evidence requirements to be
submitted by the supplier to the verification team.
Table 7 (overleaf) shows how the various Form 2s map to particular suppliers or supplier groups.
Each coloured cell indicates a different Form 2 and the number in the cell is the number of
indicators used to assess that indicator for that supplier. It should also be noted that, even when
the suppliers were grouped, the evidence requirements for the verification and the multipliers used
to calculate the outputs and outcomes varied by supplier.
Table 7: Number of verification indicators per consortium partner
Deliverable Partner groups*
DAS DRC ASAL BBC SGY WSUP PAN
Hygiene
promotion
1 Intermediate result 3 3 3 3
2 Early sustainability 4 4 4 4
3 Output delivery 3 3 3 3
4 Outcome delivery 4 2 3
Sanitation
5 Intermediate result 2 2 3
6 Early sustainability 4 4 3
7 Output delivery 3 3 2
8 Outcome delivery 2 1 3
Water
9 Intermediate result 3 3 3
10 Early sustainability 3 3 3
11 Output delivery 4 3 3
12 Outcome delivery 3 3 2
Source: final versions of the Form 2s used in the verification rounds Q4 2015 and Q4 2017
*DAS = all partners operating in DRC and the ASAL region, partners operating in DRC = Oxfam and Tearfund, partners operating in ASAL=Oxfam, Practical Action, and Concern, BBC=BBCMA, PAN=Practical Action in Nairobi, SGY=Sanergy
Due to the large number of indicators that were tailored to quite specific programme approaches it
is not practical to discuss all indicators individually; Table 8 provides an overview of the common
formulation of the set of indicators within each Form 2 by results package. Generally:

Evaluation of the WASH Results Programme SWIFT Case Study
e-Pact 13
the ‘intermediate results’ indicators are composed of indicators that measure progress towards
that particular results area, and an assessment of quality by the supplier and the MV team;
the ‘early sustainability’ indicators relate to capacity building in the area linked to service
delivery or engaging users or the groups that will later manage the services, and an
assessment of quality by the supplier and the MV team;
the ‘output delivery’ indicators include some sort of evidence requirement that the activities that
led to the output took place, and importantly an estimate of the number of people reached (for
sanitation and hygiene generally these are calculated using multipliers based on the estimated
population that would use hardware delivered, and for water based on either the village
population of the capacity of the system), and an assessment of quality by the supplier and the
MV team; and
the ‘outcome delivery’ is based on the use/functionality of the systems/infrastructure.

Evaluation of the WASH Results Programme SWIFT Case Study
e-Pact 14
Table 8: Common deliverable package indicators
Deliverable Common indicators used
Hygiene promotion
1. Intermediate result
Promotion materials developed
Supplier quality assessment
MVE quality assessment
2. Early sustainability
Numbers of staff trained
Number of beneficiaries to be reached (multiplier)
Quality – supplier training plans and reports provided
MVE quality assessment
3. Output delivery
Evidence promotion events/activities took place
Number of people reached by hygiene promotion messaging events
Quality of events/activities
4. Outcome delivery
Proxy indicator (presence of a handwashing facility)
Knowledge indicator
Self-reported practice
MVE quality assessment
Sanitation
5. Intermediate result Evidence of community engagement
Plans/contracts in place
6. Early sustainability
Number of staff trained
Number of beneficiaries to be reached (using a multiplier based on the above)
Supplier quality assessment of plans
MVE quality assessment
7. Output delivery
Number of latrines built
Supplier assessment of the quality of latrines provided
MVE quality assessment
8. Outcome delivery Continued use of hygienic latrines
MVE assessment of outcomes delivered
Water
9. Intermediate result
Construction contracts signed
Number of people to be reached by the water network constructed/rehabilitated
Environmental management plans in place
10. Early sustainability
Number of people trained/engaged in the structures that will support the water service
Number of beneficiaries to be reached through above activities
11. Output delivery
Beneficiaries with access to improved levels of water supply
Supplier quality assessment of plans
MVE quality assessment
12. Outcome delivery
Functionality of water systems
User feedback
MVE quality assessment
Evaluation of the WASH Results Programme SWIFT Case Study
e-Pact 15
In Kenya the outcome-phase targets and indicators varied by partner and location. The overall
targets for the outcome levels were the same as for the consortium as a whole (outlined in Section
3.2.1). For hygiene this was that behaviour change obtained for at least 15%8 of each target
population. For sanitation it was that use was sustained for at least 70% of each target population,
and for water it was that use was sustained of at least 75% of water points.
The outcome-phase targets were derived from combining the baseline results on certain indicators
with the estimated total area population (accounting for assumed population growth in the
respective areas), and then adding the number of people reached through the SWIFT programme
(the estimated output beneficiaries). For example, if the area population was 200 people, baseline
access was 40% (80 people), and SWIFT reached 100 people with the intervention. The
population with access in that area would be assumed to be 140 people at the end of the output
phase. The targets in each area were set as the expected percentage change in behaviour/use
based on the output level achieved among the whole population. Picking up on the example, if the
target was 70% use then the target in that area would be 1109 people (40+(100*0.7) using that
service. This was then assessed via surveys that used the entire area population as the sample
frame.
As with Kenya (outlined in Section 3.4.4) the targets in DRC for the outcome phase were derived
by estimating the area populations where the programme was active, and combining this with the
baseline figures for specific indicators and the population reached during the output phase to arrive
at an estimated area population endline target. Unlike for Kenya, in DRC there was greater
continuity in the assessment and the DRC partners had a common Form 2 for outcomes.
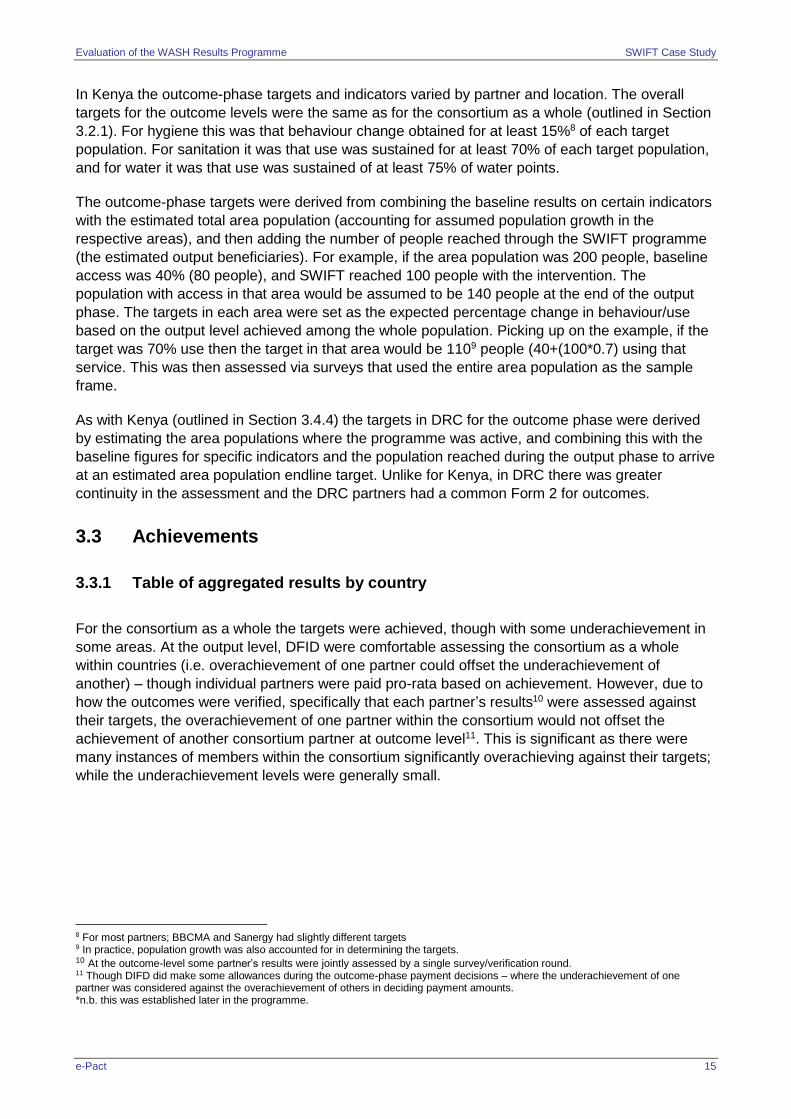
3.3 Achievements
3.3.1 Table of aggregated results by country
For the consortium as a whole the targets were achieved, though with some underachievement in
some areas. At the output level, DFID were comfortable assessing the consortium as a whole
within countries (i.e. overachievement of one partner could offset the underachievement of
another) – though individual partners were paid pro-rata based on achievement. However, due to
how the outcomes were verified, specifically that each partner’s results10 were assessed against
their targets, the overachievement of one partner within the consortium would not offset the
achievement of another consortium partner at outcome level11. This is significant as there were
many instances of members within the consortium significantly overachieving against their targets;
while the underachievement levels were generally small.
8 For most partners; BBCMA and Sanergy had slightly different targets 9 In practice, population growth was also accounted for in determining the targets. 10 At the outcome-level some partner’s results were jointly assessed by a single survey/verification round. 11 Though DIFD did make some allowances during the outcome-phase payment decisions – where the underachievement of one partner was considered against the overachievement of others in deciding payment amounts. *n.b. this was established later in the programme.

Evaluation of the WASH Results Programme SWIFT Case Study
e-Pact 16
Table 9: SWIFT performance on key deliverables
Deliverable Consortium-wide Country Target Claimed Verified % of target
Hygiene promotion
3. Output delivery
IEC materials/ messages disseminated to population
Kenya 373,353 329,997
DRC 703,706 697,257
Total 1,027,257 1,077,059
1,027,254 100.0%
4. Outcome delivery
Behaviour change obtained for at least 15%
Kenya 73,953 73,299 73,299 99.1%
DRC 104,589 104,589 104,589 100.0%
Total 178,542 177,888 177,888 99.6%
Sanitation
7. Output delivery
People with access to latrines
Kenya 30,900 30,900
DRC 428,914 428,914
Total 459,814 459,814 459,814 100.0%
8. Outcome delivery
Use sustained in target population 75%
Kenya 21,630 21,630 21,630 100.0%
DRC 300,241 300,241 300,241 100.0%
Total 321,871 321,871 321,871 100.0%
Water
11. Output delivery
People with access to clean water
Kenya 205,378 201,329
DRC 650,166 643,923
Total 848,367 855,544 845,252 100%
12. Outcome delivery
Use sustained in target population 75%
Kenya 189,975 180,418 160,918 84.7%
DRC 485,300 485,300 485,300 100.0%
Total 650,166 650,166 643,923 99.0%
Source: Targets – contract annex dated March 2015 (post-Liberia revisions); achievement – verification reports (figures contain rounding errors)
As noted in Section 3.2.1, there were some instances12 where projects were cancelled and targets re-allocated or dropped. It should also be noted that there were instances where the MV team did not initially verify results due to concerns over the evidence submitted – predominantly these related to questions surrounding the process of data collection rather than a specific questioning of the number of beneficiaries claimed. As a consortium as a whole the output targets were met. In the vast majority of cases partner-specific output targets were met with only a small number of instances where partners delivered below what was initially envisaged; and in these cases results were transferred to other partners within the consortium. It is also noted that DFID did offer supplier the 3-month extension on outputs at the end of the output-phase - which was benefited many consortium partners; and was particularly significant for Tearfund in DRC. Without this they wouldn’t have achieved their results and suffered a big financial loss.
3.3.2 Outcome-phase results
Table 10 presents the aggregated results against the target for SWIFT. As discussed in Section
3.2.1, the targets set by the supplier varied by supplier group to reflect that supplier’s
implementation modality; with some suppliers grouped where the results were similar enough to be
assessed jointly. The assessment of progress against targets was based on surveying the
programme areas and comparing this to the baseline figures for that indicator accounting for
12 The Liberia country programme and Practical Action’s urban sanitation work in Nairobi.

Evaluation of the WASH Results Programme SWIFT Case Study
e-Pact 17
progress under the programme and population growth. In the sections below present the outcome
results by supplier group and area.
Table 10: Achievement against target
Area Achievement against target
Hygiene 99.6% of target achieved
Sanitation 100% of target achieved
Water 98.6% of target achieved
Source: Q4 2017 verification report
Table 11 describes the instances where there was small underachievement against targets during
the outcome phase. As is clearly highlighted by Table 9, this underachievement was small in the
context of the whole programme.
Table 11: Cases where there was underachievement against targets on outcome delivery targets*
Quarter Partner and indicator
Description
Q4 2018
OxPAC – ASAL
simple water system functionality
~80% of the target achieved. This was attributed to the prolonged drought in the region. Following the payment decision meeting the MV team were asked by DFID to make a judgement as to whether the drought could have been considered ‘exceptional’ and as such taken into consideration in deciding on the payment amount. It was the MV team’s recommendation to DFID that the drought was exceptional and had contributed directly to systems failing in the ASAL region.
Q4 2018 Sanergy –
Hygiene
Small underachievement against target for Sanergy’s hygiene indicator in Q4 2017 – This indicator related specifically to the number of Fresh Life Toilets (FLTs) which had a handwashing station and soap at the time of the survey.
Q4 2016 OxPAC –
Sanitation
Small underachievement against target. It was notable that the proportion of sanitation beneficiaries relative to the whole programme was very low. The outcome target was ~12,000.
Q4 2018
OxPAC – ASAL
simple water system functionality
For this indicator at this time there was some debate over using the survey results or the results from focus group decisions (FGDs) with water user associations. With the latter more favourable to the survey results in this instance. At the payment decision meeting it was decided by DFID that the FGD results represented the better measure of long-term functionality.
Source: MV reports
*Completed for the outcome phase only as corporately for SWIFT the output targets were largely achieved
Outcome-phase results in hygiene
The aggregate results for hygiene across SWIFT was that 99.6% of the target was achieved. In
DRC there was significant overachievement against all three of the indicators used, with high
results for the knowledge indicator and demonstration of handwashing practice. The proxy
indictors for the presence of a handwashing facility was markedly lower – though still much higher
than the target. Similarly, the partner in the ASAL region overachieved against target. There, the
indicators were quite different though it is notable the proxy indicator for a handwashing facility was
lower than that in DRC. The only area of underachievement was with regards to Sanergy where

Evaluation of the WASH Results Programme SWIFT Case Study
e-Pact 18
fewer than targeted FLTs had a handwashing station with soap and water available. However, the
Sanergy target was a small proportion of the total results and the underachievement level was
small, resulting in the vast majority of the target being met, with significant overachievement in
DRC and the ASAL region.
Table 12: Final verified outcome results in hygiene
Partner(s) Indicator Survey result
Target Verified Verifier remarks13 % Number
DRC
Knowledge of key moments for handwashing
77.1% 599,825 104,589 104,589
Significant overachievements against target
Presence of an observable handwashing proxy near the latrines
46.5% 361,762 104,589 104,589
Handwashing practice / demonstrated competency
78.0% 606,826 104,589 104,589
OxPAC
Presence of an observable handwashing proxy within the household (50% weighting)
18.8% 50,112 35,998 35,998 Overachievement
Handwashing practice – self-reporting behaviour in the last two days (50% weighting)
33.3% 88,763 35,998 35,998 Overachievement
Sanergy
70% of FLTs with soap and water for handwashing present at FLT handwashing stations
65.1% 8,672 9,325 8,672 Underachievement
Aggregate for hygiene1 149,911 149,258 99.6% of target achieved
BBCMA
70% of people exposed to media programmes should be able to identify at least two critical times to wash hands
87.9% 268,886 28,630 268,886 Significant overachievement against target
Source: Q4 2017 verification report for DRC, OxPAC, and Sanergy. Q2 2017 for BBCMA
1 The aggregate numbers include agreed weightings defined in the various Form 2s
Outcome-phase results in sanitation
The aggregate results for sanitation reports that 100% of the target was achieved, with high levels
(~75%) of usage reported in DRC, the ASAL region, and Nairobi. One of Sanergy’s results appears
odd as it is over 100%; this is because the specific beneficiary numbers were estimated from the
volume of faeces collected from those toilets. In this case the figure being over 100% indicates that
13 Reproduced from tables in verification reports
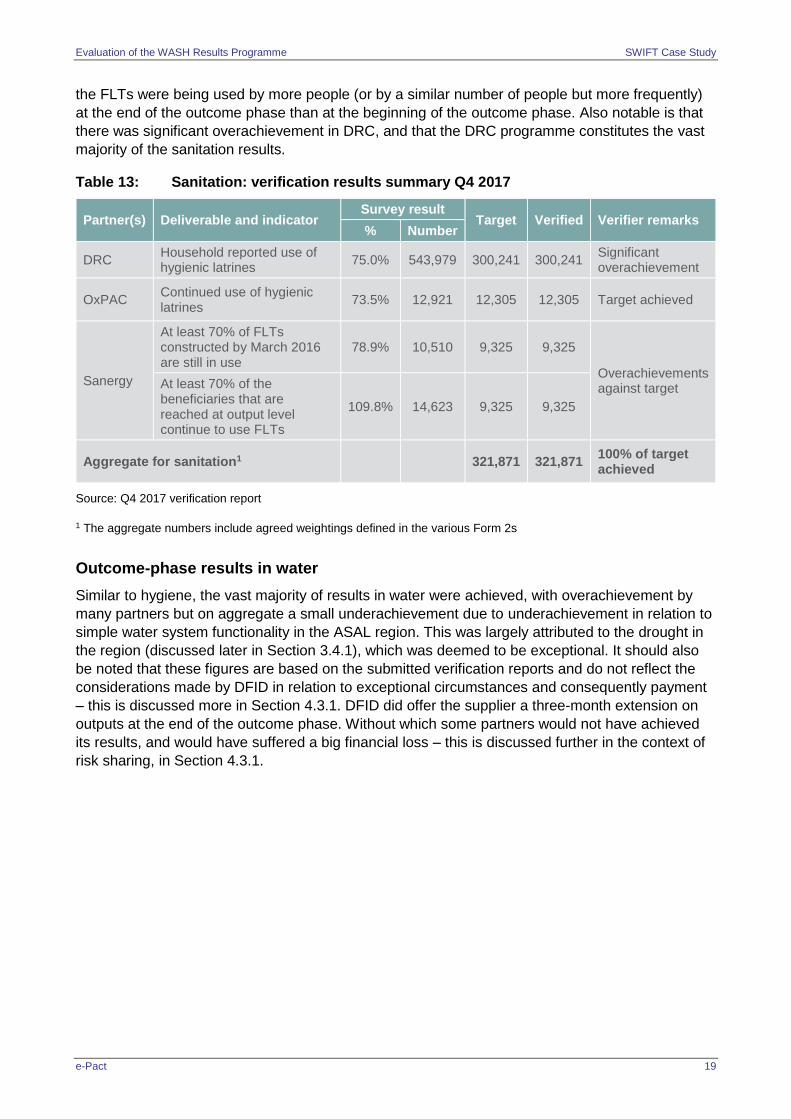
Evaluation of the WASH Results Programme SWIFT Case Study
e-Pact 19
the FLTs were being used by more people (or by a similar number of people but more frequently)
at the end of the outcome phase than at the beginning of the outcome phase. Also notable is that
there was significant overachievement in DRC, and that the DRC programme constitutes the vast
majority of the sanitation results.
Table 13: Sanitation: verification results summary Q4 2017
Partner(s) Deliverable and indicator Survey result
Target Verified Verifier remarks % Number
DRC Household reported use of hygienic latrines
75.0% 543,979 300,241 300,241 Significant overachievement
OxPAC Continued use of hygienic latrines
73.5% 12,921 12,305 12,305 Target achieved
Sanergy
At least 70% of FLTs constructed by March 2016 are still in use
78.9% 10,510 9,325 9,325
Overachievements against target At least 70% of the
beneficiaries that are reached at output level continue to use FLTs
109.8% 14,623 9,325 9,325
Aggregate for sanitation1 321,871 321,871 100% of target achieved
Source: Q4 2017 verification report
1 The aggregate numbers include agreed weightings defined in the various Form 2s
Outcome-phase results in water
Similar to hygiene, the vast majority of results in water were achieved, with overachievement by
many partners but on aggregate a small underachievement due to underachievement in relation to
simple water system functionality in the ASAL region. This was largely attributed to the drought in
the region (discussed later in Section 3.4.1), which was deemed to be exceptional. It should also
be noted that these figures are based on the submitted verification reports and do not reflect the
considerations made by DFID in relation to exceptional circumstances and consequently payment
– this is discussed more in Section 4.3.1. DFID did offer the supplier a three-month extension on
outputs at the end of the outcome phase. Without which some partners would not have achieved
its results, and would have suffered a big financial loss – this is discussed further in the context of
risk sharing, in Section 4.3.1.

Evaluation of the WASH Results Programme SWIFT Case Study
e-Pact 20
Table 14: Final verified outcome results in water
Partner(s) Indicator Survey result
Target Verified Verifier remarks % Number
DRC Use of SWIFT water points, via household survey reports
90.2% 583,654 485,300 485,300 Overachievement
OxPAC
(simple systems)
Functionality reported by Water User Committee
66.2% 51,395 58,227 51,395 Underachievement
People that continue to use a SWIFT water point (household survey)
54.5% 42,312 58,227 42,312 Underachievement
OxPAC
(complex systems)
Actual meter readings confirm the number of people served by the volume of water supplied by SWIFT boreholes
81.7% 58,549 53,748 53,748
Targets achieved
Functionality reported by Water User Committee
78.6% 56,328 53,748 53,748
WSUP
75% sustained supply of good quality water
87.7% 50,653 39,000 39,000 Overachievement
Metered connections at household level
138% 1,380 1,000 1,000 Overachievement
Aggregate for water1 636,275 627,650 98.6% of target achieved
Source: Q4 2017 verification report
1 The aggregate numbers include agreed weightings defined in the various Form 2s
3.4 SWIFT in Kenya
3.4.1 Country context
Progress in WASH
Between 2010 and 2015 there was a slight overall increase in access to water and sanitation
services in the country. The UNICEF/World Health Organization (WHO) Joint Monitoring
Programme for Water Supply and Sanitation (JMP) estimated that in 2015 63% of Kenyans (82%
in urban areas and 57% in rural areas) had access to improved drinking water sources, compared
to 60% in 2010 (83% urban, 53% rural)14.
14 WHO/UNICEF, 2015

Evaluation of the WASH Results Programme SWIFT Case Study
e-Pact 21
Figure 2: Rural sanitation and water access (2012 and 2015)
Progress on water has thus been driven by increases in rural access. In urban areas, the
proportion of the population with access to piped water fell between 2010 and 2015, from 47% to
45%. There was a one percentage-point rise in those using other improved sources and
unimproved sources. With regard to sanitation, 30% of Kenyans (31% of urban and 30% of rural)
had access to private improved sanitation in 2015, compared to 29% in 2010. In rural areas, open
defecation was estimated to still be practised by 12% of the population in 2015 (compared to 13%
in 2010).
Kenya’s progress compared to other lower middle-income countries and the eastern and southern
Africa region average is poor, with Kenya being below the average level of progress for both water
and sanitation. Though there has been a moderate increase in access to improved sanitation in
most areas, the rate of progress is behind what is needed to meet government targets. In 2015
JMP classified Kenya as having made ‘little to no progress’ with regard to sanitation and ‘good
progress’ with regard to water over the Millennium Development Goal (MDG) period15.
Institutional context
In 2010 a new constitution was adopted in Kenya which has significantly reshaped the political and
administrative landscape. It created 47 new county governments and devolved powers to them in
line with citizens’ rights established in the constitution. The aim of the devolution was to bring
service delivery ‘closer to the people’. Promulgation of the constitution began in the 2013/4 fiscal
year.
Kenya’s policy direction is rooted in ‘Vision 2030’. Adopted in 2008, Vision 2030 is ‘the national
long-term development policy that aims to transform Kenya into a newly industrializing, middle-
income country providing a high quality of life to all its citizens by 2030’. Priority sectors noted in
the Vision 2030 Medium-Term Plan II (for the 2013–2017 political cycle) include education,
15 Ibid.
0
10
20
30
40
50
60
70
80
90
100
2012 2015
KenyaSurface water
Unimproved
Limited service
0
10
20
30
40
50
60
70
80
90
100
2012 2015
Kenya
Open defecation UnimprovedLimited service Basic serviceSafely managed service

Evaluation of the WASH Results Programme SWIFT Case Study
e-Pact 22
governance, energy, infrastructure, and information and communication technology. These sectors
receive around 75% of allocated spending on ministries, departments, and agencies. In
comparison, the health and environment sectors (including expenditure on water and sanitation)
have received an average of just 7% of total budgeted spending on ministries, departments, and
agencies.
The structure of the WASH sector in Kenya is currently being adjusted in response to changes in
responsibilities as a result of devolution and recently passed legislation (the Water Act 2016) that
seeks to clarify responsibilities in the light of devolution. Sector reforms began in Kenya in the
2000s, in response to the Water Act 2002. Those reforms focused on professionalising the
operation and management of water and sanitation services, creating independent utilities, known
as Water Service Providers16 (WSPs), regional Water Service Boards17 (WSBs), and a national
regulator, the Water Services Regulator Board (WASREB).
At the national level, responsibility for WASH is divided across two ministries: the Ministry of Water
and Irrigation has responsibility for national policy related to water, and the Ministry of Health has
responsibility for national policy related to sanitation. Both ministries also have responsibilities for
M&E and capacity building in their respective sub-sectors. The WSBs, WSPs, and the county
governments have responsibility for developing and managing services. The WSBs are the asset
holders for the water and sanitation infrastructure in their respective jurisdictions (usually several
counties within one or more basins) and manage large-scale investments in WASH infrastructure.
The WSPs are the service delivery agents in the water sector. All WSPs are commercialised, with
the vast majority being state owned. Under a service provision agreement, the WSPs usually have
a mandate to supply water (operate and maintain water and sewage infrastructure) and to collect
tariff revenue in their service areas. The newly formed county administrations also have a mandate
for ensuring water and sanitation services in their jurisdiction. This has resulted in some
overlapping responsibilities, which the Water Act 2016 seeks to clarify.
There are several salient features of the sector funding that should be noted:
i. there is an extremely limited flow of funds between the national ministries and the county ministries with responsibility for water;
ii. the WSPs have the ability to collect revenue locally in the form of tariffs, which are retained by the WSPs for their operation (with a small proportion, ~4%, paid to the regulator);
iii. few county governments receive international transfers or have access to commercial finance;
iv. there are differences in terms of who provides services within WSP service areas and who does so outside of them, with those living inside WSP service areas receiving funds from a wider range of sources – note that currently only roughly half of the Kenyan population live within a WSP service area; and
v. service delivery functions are performed by a wide range of actors – some with overlapping responsibilities.
The WSPs have a central role in water service delivery. One of the decisions in devolution was to
transfer the responsibility of their management from the WSBs to the new county governments.
During the first few years of devolution this created considerable confusion. More recently, county
authorities have established new management structures and service-level agreements with
WSPs, adding clarity and improving efficiency. The WSPs collect tariff revenue from those they
16 The WSPs were formed following the Water Act (2002). There are currently 91 licensed WSPs, with roughly 20 million people in their service areas (WASREB, 2015). 17 The WSBs were formed following the Water Act (2002) and were established between 2003 and 2004.

Evaluation of the WASH Results Programme SWIFT Case Study
e-Pact 23
serve. This revenue is protected and is used by the WSPs for the provision of WASH services; the
revenue is sizeable and is often greater than the counties’ recurrent budget allocation to WASH.
Despite this, many WSPs are in a dire financial position, with expenditure often far exceeding
revenues.
Currently, less than half of the population in Kenya live within a WSP service area, with even fewer
actually provided with services by the WSP. Outside of service provider areas most counties report
relying on communities to manage their own services through community-based organisations,
whose responsibilities extend to collecting tariffs or fees for operations and maintenance.
Socioeconomic and cultural context
Kenya has a population of approximately 48 million people, with 74% of the population living in
rural areas18. Kenya also has a very youthful population, with 73% of the population aged below 30
years; this is driven by relatively high population growth of 2.6% per annum. In recent years Kenya
has made good progress on reducing poverty, and sustained economic growth has meant that in
2015 Kenya gained lower middle-income country status. In the previous three years gross
domestic product (GDP) growth has largely kept pace with the relatively high East African
Community average, and has averaged over 5.5%. However, Kenya has one of the highest levels
of income inequality in east Africa, with an estimated Gini coefficient of 0.43 in 201319, and an
estimated 46% of the population live below the national poverty line20; this rises to 51% in rural
areas.
Kenya has long been considered a financial and transport hub in east Africa, and has a service-
based economy (63.4% of real GDP in 2015), driven by tourism and financial services21. Kenya is
running a persistent current account deficit; in 2015 the current account deficit equalled 11.4% of
GDP – the highest deficit as a share of GDP in the East African Community region, and far above
the continental average22. This current account deficit is increasingly financed by foreign exchange
income from remittances. Despite a consistent growth in tax revenues, a fiscal expansion following
devolution has resulted in recurring fiscal deficits (reaching -8.1% of GDP in 2014/15) and public
debt accumulation.
2017 was an election year for Kenya. The 2007/8 elections were marked by significant violence,
and, as such, ahead of the 2017 elections there were concerns about similar events. The elections
passed without violence though the Supreme Court annulled the verdict of the election held in
August 2017 on constitutional grounds, citing irregularities with how results were transferred from
electronic voting machines, as opposed to the voting process itself. This triggered a re-run of the
election, in which the opposition leader called for a boycott. Uhuru Kenyatta was re-elected in the
re-run but voter turnout was reported to be only 34% of registered voters, considerably lower than
the 80% seen in the first round which was annulled. The election was a significant event with
relation to outcome-phase activities and implementation, with many staff reportedly returning home
over the period and concerns (particularly in urban areas) over election-related violence.
It is also worth noting that Kenya hosts a large and long-term refugee population, mostly from
neighbouring Somalia. A large proportion of this refugee population is in the ASAL region – notably
the Dadab camp (~230,000 people) in Garissa Country, and the Kakuma (~60,000 people) and
18 World Bank data: https://data.worldbank.org/indicator/SP.RUR.TOTL.ZS?locations=KE [last accessed September 2017). 19 KNBS and Society for International Development, 2013 20 Poverty is estimated according to the headcount ratio – the national poverty line is determined by the cost of a basket of food and non-food items deemed to be the minimum requirement. 21 African Development Bank (2014). 22 World Bank (2016).

Evaluation of the WASH Results Programme SWIFT Case Study
e-Pact 24
Kalobeyei (~185,000 people) camps in Turkana County. The latter two camps are very close to the
SWIFT implementation areas. There is also instability along the Somali–Kenyan boarder and there
have been many recent terror attacks, with responsibility claimed by Al-Shabaab. This affected
some of the programme activities – the SWIFT monitoring reports in Q4 2014 noted that staff
movement in Wajir was restricted as a result of ongoing conflicts and insecurity. Insecurity in early
2015, notably an attack on Garissa University that left 147 dead, resulted in a curfew in Wajir,
Garissa, Mandera, and Tana. The magnitude of this incident resulted in an additional travel ban to
Wajir, which affected programme activities for a short period of time.
Physical and environmental context
Kenya’s climate varies between several main climatic zones. The central and northern ASAL
counties are comparatively arid compared to the more tropical coastal areas. There are two rainy
seasons in Kenya: the ‘long rains’ are generally between March and May and the ‘short rains’
between October and December, though there is significant inter-annual variation in these rains.
The Kenyan government officially declared a drought emergency in February 2017, following very
low rainfall in the short rains of 2016. This followed the drought of 2010/11, which was considered
to be the worst in 60 years, as well as three further years of drought. This was one reason cited by
UNICEF in assessing the 2016/17 drought as more severe than the 2010/11 drought23.
Scope and scale of SWIFT in Kenya
In Kenya, only the consortium lead (Oxfam) was on a PbR contract with DFID. Other INGO
partners had PbR arrangements with Oxfam, while implementing partners were engaged via
routine grant funding.
SWIFT’s rural component operated in three sparsely populated counties in the ASAL region.
These are home to some of the poorest communities in Kenya and subject to both environmental
stress and ongoing conflicts. The urban projects in Nairobi, however, were in slums, which are not
‘fragile’ locations in the same sense, though the urban poor are subject to a government that does
not provide services or protection on a consistent or impartial basis.
23 https://reliefweb.int/sites/reliefweb.int/files/resources/HOA_CALL_FOR_ACTION_Leaflet_Feb2017_1.pdf
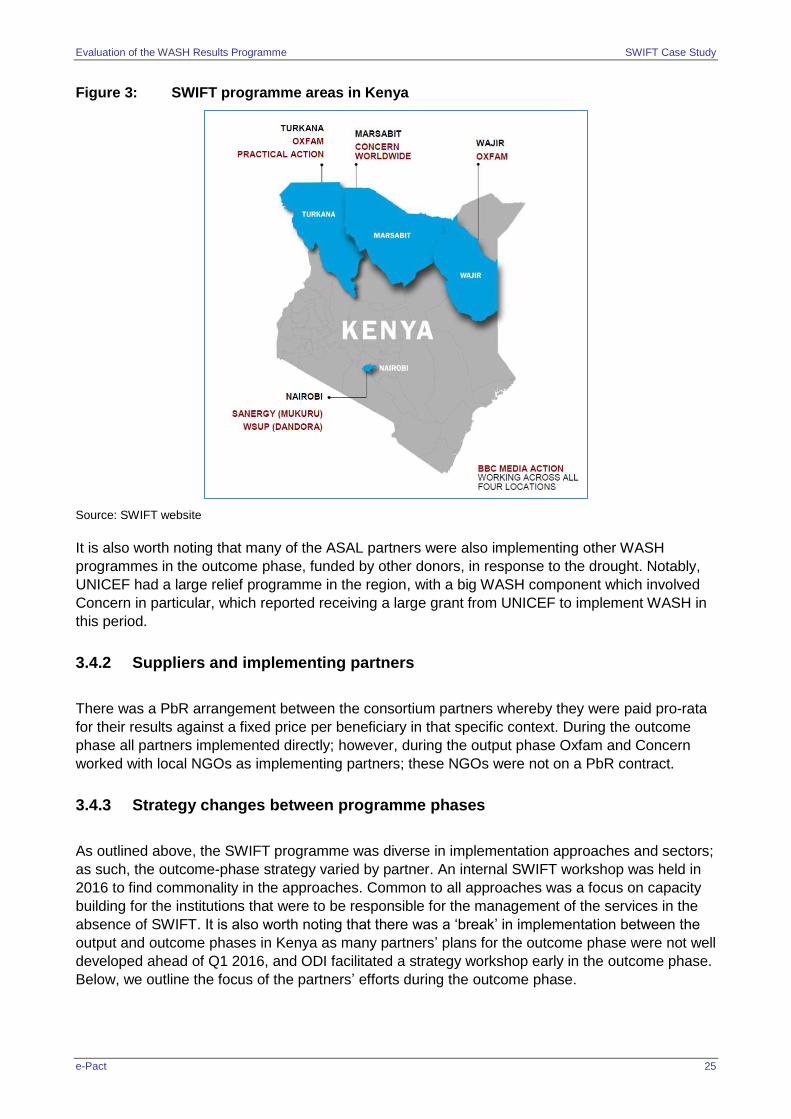
Evaluation of the WASH Results Programme SWIFT Case Study
e-Pact 25
Figure 3: SWIFT programme areas in Kenya
Source: SWIFT website
It is also worth noting that many of the ASAL partners were also implementing other WASH
programmes in the outcome phase, funded by other donors, in response to the drought. Notably,
UNICEF had a large relief programme in the region, with a big WASH component which involved
Concern in particular, which reported receiving a large grant from UNICEF to implement WASH in
this period.
3.4.2 Suppliers and implementing partners
There was a PbR arrangement between the consortium partners whereby they were paid pro-rata
for their results against a fixed price per beneficiary in that specific context. During the outcome
phase all partners implemented directly; however, during the output phase Oxfam and Concern
worked with local NGOs as implementing partners; these NGOs were not on a PbR contract.
3.4.3 Strategy changes between programme phases
As outlined above, the SWIFT programme was diverse in implementation approaches and sectors;
as such, the outcome-phase strategy varied by partner. An internal SWIFT workshop was held in
2016 to find commonality in the approaches. Common to all approaches was a focus on capacity
building for the institutions that were to be responsible for the management of the services in the
absence of SWIFT. It is also worth noting that there was a ‘break’ in implementation between the
output and outcome phases in Kenya as many partners’ plans for the outcome phase were not well
developed ahead of Q1 2016, and ODI facilitated a strategy workshop early in the outcome phase.
Below, we outline the focus of the partners’ efforts during the outcome phase.

Evaluation of the WASH Results Programme SWIFT Case Study
e-Pact 26
For OxPAC, working in the ASALs, the focus was on working with the institutions responsible
for maintaining service delivery:
For urban water supply (Oxfam only), the focus was on supporting the WSPs to improve
their processes and management through training and capacity building. There was also
ongoing support to ensure the functionality of the systems. In the case of LOWASCO (a
more developed WSP) there was a focus on introducing an e-billing system. In the case of
KAWESPRO the focus was more on basic governance and management as the WSP had
a lower capacity.
For rural water supply the focus was more on supporting the community-based
management structures (Water Users Associations (WUAs)) in managing their services and
again providing ongoing support to ensuring functionality. The Catholic Diocese also
operate a water insurance scheme24 in the area, which the SWIFT project encouraged
WUAs to form a relationship with.
For rural sanitation the partners continued hygiene promotion through working with and
supporting Public Health Officers, Community Health Extension Workers (CHEWs), and
Community Health Volunteers (CHVs) to conduct ongoing hygiene promotion in their areas,
with the CHEWs and CHVs being the key functionaries in door-to-door follow-up visits. Also
notable is that Practical Action introduced an in-kind subsidy, in the form of providing slabs,
to overcome challenges related to latrine collapse.
For WSUP’s work in urban water supply the focus was on extending formal shared metered
connections to the infrastructure constructed during the output phase. This entailed working
with the local utility to register new clients, and improve metering and billing efficiency, among
other processes. During the output phase WSUP also established a field office in the area in
which they were working (Dandora), to better manage costumer relationships – previously
people would have to travel 5 km to make an application or manage their account. Another key
feature of the outcome phase was convincing the residents of the benefits of metered
connections and overcoming challenges with the informal sector and illegal connections.
For Sanergy, working in urban sanitation, the work in the outcome phase involved continuing
the operation of their business models. Sanergy is divided into two parts: i) a non-profit entity –
which covers the costs of containment and emptying (i.e. grants fund getting the contained
faeces from the toilets to a 'transfer station’), and ii) a for-profit entity, which covers taking the
waste from the transfer station to treatment and then disposal (Sanergy partners/sub-contracts
with the not-for-profit entity and also gets revenue from the sale of fertiliser made from the
waste). Sanergy is also the FLT commercial operators, who operate independently as a
franchised entity managing the commercial toilets and collecting money from people using
toilets (pay per use). The Sanergy business model has evolved over time, and substantial
changes were made to the strategy during the outcome phase, including the following:
Developing an exit strategy from the not-for-profit entity being dependent on grant funding
(at the moment there is effectively a ~50% subsidy on the services they deliver from a
variety of grant and other sources (including the SWIFT funding). This is focused on getting
the government to pay Sanergy (via a public–private partnership management contract
model) to deliver its services in low-income areas. Currently this is about $10 per person
per year (pppy) (which is its grant funded amount at the moment).
There was also a shift in focus towards providing 'residential' units, as opposed to
commercial units (operated by the FLT). The commercial units are run on a pay-per-use
24 Which carries out repairs in the event of a breakdown, but policy holders must be formally registered societies

Evaluation of the WASH Results Programme SWIFT Case Study
e-Pact 27
model where an operator collects the money from users and runs the FLT as a business.
The residential units pay Sanergy a fixed monthly fee for collection.
BBCMA’s work in the outcome phase was, by design, largely limited to monitoring and
providing ongoing support to the local radio stations.
Over the course of SWIFT, Oxfam revised its country strategy for Kenya. At the time of the endline
evaluation visit, Oxfam was preparing to close it office in Turkana as it will no longer be
implementing projects directly, though some work through local partners could possibly continue.
3.4.4 Approach to sustainability
For the ASAL partners the approach to sustainability in water can be broadly characterised as
providing ongoing capacity support to the institutions with responsibility for maintaining service
functionality beyond the life of SWIFT – while at the same time taking an active role in ensuring
functionality throughout the outcome phase. In the case of WSUP’s work in Nairobi this institutional
strengthening was even clearer as there was an explicit MoU with NCWSC, and a clear handover
of responsibilities at the end of the outcome phase. However, WSUP differed in that the outcome-
phase activities to an extent still entailed enabling access to supplies (through signing people up to
a metered connection), as opposed to maintaining a service level established in the output phase.
For those partners working in sanitation and hygiene the picture was more mixed. BBCMA’s
engagement with the local radio stations during the outcome phase was less than during the
output phase, in which the majority of the capacity building efforts were focused. As a social
enterprise Sanergy’s efforts towards sustainability centred on the financial sustainability of its
business model – with the shifts in strategy highlighted above being the major developments
during the outcome phase.
3.4.5 Supplier monitoring approach and verification
In all cases the suppliers continued to monitor progress alongside the outcome assessments
linked to verification. The monitoring of outputs for the purposes of verification and payment was
done through the suppliers’ own systems. The outcome assessment for the purposes of payment
was conducted using surveys. The ASAL partners (OxPAC) were assessed jointly via surveys,
which used the implementing area of the three partners as the sample frame. The suppliers
implemented the surveys themselves but hired enumerators, rather than using their own staff.
Sanergy’s outcome assessment was built around its established monitoring systems, but specially
adapted for SWIFT. Sanergy did not count beneficiaries as part of its normal monitoring and
therefore had to estimate them based on the quantity of faeces collected each day. For the
outcome phase Sanergy assessed functionality through surveys implemented by its staff as part of
its quality assurance processes. WSUP’s outcome monitoring also took place via surveys
implemented by its own staff specifically for the purposes of SWIFT. Even though WSUP has
experience of carrying out similar surveys as part of its programmes. BBCMA also implemented its
own surveys, and reported few issues as there is significant capacity within the BBC for doing this
kind of research.

Evaluation of the WASH Results Programme SWIFT Case Study
e-Pact 28
3.5 SWIFT in DRC
3.5.1 Country context
Progress in WASH
Between 2010 and 2015 there was a three-percentage point increase in access to improved water
sanitation services nationally. Despite the inequities in access between urban and rural areas
progress was relatively balanced between rural and urban areas between 2010 and 2015.
However, over the MDG period the JMP classified DRC as having made ‘little or no progress’ on
water. Access to improved sanitation fell between 2010 and 2015 from 42% to 41% nationally.
Over the same period, open defecation rates rose in both rural and urban areas. As with water, the
WHO/UNICEF JMP assessment for the MDG period was that DRC had made ‘little or no progress’
on sanitation.
Figure 4: Rural sanitation and water access (2012 and 2015)
Currently, access to an improved water source stands at 42% nationally (21% in rural areas and
70% in urban areas). A further 12% of people have limited access, while 36% of the population use
unimproved sources and 10% surface water. Access to basic sanitation stands at 20% nationally,
with only a small difference between urban and rural areas. Despite the low access to basic
service, open defecation rates are relatively low, at 12%, with the majority (68%) of the population
using limited or unimproved services.25
25 The source for all data in this paragraph is the WHO/UNICEF 2017 country file for DRC [accessed June 2018].
0
10
20
30
40
50
60
70
80
90
100
2012 2015
DRCSurface water Unimproved
Limited service Basic service
Safely managed service
0
10
20
30
40
50
60
70
80
90
100
2012 2015
DRC
Open defecation UnimprovedLimited service Basic serviceSafely managed service
Evaluation of the WASH Results Programme SWIFT Case Study
e-Pact 29
Institutional context26
DRC is still trying to emerge from a series of conflicts that began in the 1990s and which between
1994 and 2003 are estimated to have claimed the lives of 5 million people. The wars have
devastated the country’s infrastructure and much of the development assistance balances
humanitarian response against longer-term development priorities in the context of state fragility.
The current constitution (DRC’s sixth) was promulgated in 2006 and established the institutional
responsibilities in the WASH sector. The central government has exclusive responsibility for
national planning, the conservation of natural resources, and legislation on hygiene. Provincial
governments are responsible for public services and the production of water. Due to vague
definitions, there are overlapping responsibilities in the areas of: management of water and forests;
the prevention of epidemics; and hydrology programmes. A new water law introduced in 2015 sets
out a legal and institutional framework for WASH service delivery. The new law gives the national
government power to set national policy and group institutional responsibilities under a single line
ministry. Provincial government, local authorities, and the WUAs assume the role of the asset
owners, and are responsible for investments in new infrastructure. The provincial governments are
also required to delegate responsibility for service delivery to a public or private entity which is able
to charge cost-based tariffs for the services they manage. The Water Law 2015 addresses
sanitation and outlines that the principles of the various roles of the central and provincial
government are to be in line with the principles of the constitution, but that specific responsibilities
are to be assigned under the new ministry via ministerial decree.
The sector is heavily dominated by external funding; in 2015 USD 13 million was allocated to the
WASH sector (this excludes household expenditure on water bills); this compares to USD 85
million allocated to the sector from external sources. External funding to the sector is channelled
through two main routes: between 2005 and 2020 donors committed USD 1,082 million to the
urban water WASH sector – 88% of which was allocated to the national utility REGIDESO; over
the same period, USD 431 million was allocated to rural WASH – of which 92% was channelled
into the VEA programme.
Socioeconomic and cultural context
DRC’s population is approximately 77 million, with over 60% of people living in rural areas. The
population is also very youthful, with 40% of the population under 15. Despite strong GDP growth
between 2003 and 2015, and a fall in the poverty rate from 71% to 64% between 2012 and 2015,
DRC remains one of the poorest countries in the world – ranking 176 of 187 countries on
UNICEF’s Human Development Index27. Population growth is high and has been consistently
above 3% in the last decade. One result is that though the poverty rate has decreased, the
absolute number of people living in poverty in DRC has increased in recent years. This rapid
population growth has been accompanied by rapid urbanisation. However, it should also be noted
that, contrary to common trends, the urban poverty rate (62.5%) is similar to the rural poverty rate
(64.8%).28
During the most intense periods of the conflict (1994–2003) GDP growth was negative in most
years of the conflict GDP growth between 2004 and 2008 GDP growth was over 6% in most years.
Then, following a fall in 2009, growth increased steadily up to 9.5% in 2014. Between 2010 and
26 This section draws heavily on the institutional analysis conducted under the WASH Poverty Diagnostics assessment in DRC. Unless
otherwise stated all figures referenced in this section are taken from that assessment. https://openknowledge.worldbank.org/bitstream/handle/10986/27320/116679.pdf?sequence=4&isAllowed=y
27 http://hdr.undp.org/en/countries/profiles/COD 28 Wolrd Bank WPD.

Evaluation of the WASH Results Programme SWIFT Case Study
e-Pact 30
2015 DRC consistently outperformed the sub-Saharan Africa average (4.1% in 2013) and low-
income countries average (5.8% in 2013)29. However, it has fallen back more recently and growth
in 2016 was recorded at 2.4%30. The slowdown in growth is attributed to shrinking global demand
for the raw materials that are DRC’s main foreign exchange (forex) earners – particularly copper
and cobalt. This caused a rapid depreciation of the currency and rapid rises in inflation – which
was estimated at 24% in 2016.31
Following the official end of the conflict many of the groups involved remained active in parts of the
country: notably, the Democratic Forces for the Liberation of Rwanda (FDLR). It was noted that a
‘sea-change’ in the conflict came about in late 2008 when Rwanda and DRC joined forces to
combat the FDLR in the provinces of North and South Kivu (two of the SWIFT districts). The group
M23 also remained active in the east of the country (particularly North Kivu) between 2012 and
2013.
The SWIFT internal progress reports note ongoing conflicts with FDLR and the possibility of this
affecting implementation – particularly through influxes of internally displaced persons (IDPs) into
programme areas. The risk of kidnappings by the FDLR groups, and fighting between the
Congolese army and the groups was noted throughout 2015/6 – particularly in North Kivu.
Similarly, in Maniema in late 2015 an influx of 30,000 people was noted in the SWIFT reports –
with Tearfund preparing a humanitarian response and re-allocating some SWIFT staff to this
response. The influx of IDPs to the programme areas was noted by SWIFT as a major change in
the context over the course of the output phase. In the outcome phase this manifested as tensions
over paying monthly water user fees as the IDPs were using the sources without paying the fees.
SWIFT also reported increased instability in the territory of Fizi. In five villages in Kalunguta Health
Zone (Beni), activities were interrupted from November 2016 until April 2017 due to armed conflict
between national armed forces and Mai Mai guerrillas.
Elections were due to be held in November 2016 but were delayed due to an outdated electoral
register. This led to a political crisis which resulted in an agreement (signed late 2016) for a power-
sharing arrangement with the opposition party during a transition period – with elections planned at
the time to be held by the end of 2017. The elections did not take place in 2017 and are now
planned to be held in December 2018. This is the second term for President Kabila and the
constitution prevents him running for a third term. The SWIFT internal reports ahead of the election
flag it as a concern and note heightened political tension.
Physical and environmental context
DRC is one of the largest countries in Africa, covering 2.3 million square kilometres. It is an
extremely resource-rich country, with large mineral and metal deposits as well as large areas of
arable land. DRC lies on the Equator, with the more southerly two-thirds of the country in the
Southern Hemisphere and the remaining third in the Northern Hemisphere. South of the Equator
the rainy season lasts from October to May, whole north of the Equator it lasts from April to
November. Along the Equator, rainfall is fairly regular throughout the year. The project districts lie
close to, but just south of, the Equator. The dry season coincides with the start of the migration of
Banyamulenge herdsmen. This was noted to affect project activities as the herdsmen dig down to
pipes for the piped systems to access water, disrupting supplies and creating the need for repairs.
29 http://documents.worldbank.org/curated/en/469851468186549157/pdf/ACS14542-WP-P147553-Box394836B-PUBLIC-ENGLISH-DRC-Education-PER-FRE.pdf 30 All data from World Bank development indicators database [accessed June 2018]. 31 www.worldbank.org/en/country/drc/overview

Evaluation of the WASH Results Programme SWIFT Case Study
e-Pact 31
The wet season also severely affected SWIFT staff’s ability to move – this was mitigated by
ensuring that programme activities and monitoring took place in the dry season window.
3.5.2 Scope and scale
SWIFT in DRC operates in three neighbouring provinces in the east of the country: North and
South Kivu, and Maniema. Tearfund operates in all three of the provinces and Oxfam in South and
North Kivu. Tearfund implements its programmes directly while Oxfam implements through
partners.
Figure 5: SWIFT programme areas in DRC*
Source: SWIFT website
*Note: Oxfam also worked with two other partners in the outcome phase that are not included in the figure above.
Both partners implement the VEA approach; with an adapted approach used in semi-urban areas.
UNICEF takes a leading role in DRC in implementing VEA; Box 3 provides an overview of the
history of the VEA programme and organisations implementing the approach.

Evaluation of the WASH Results Programme SWIFT Case Study
e-Pact 32
Box 3: The VEA programme in DRC
The VEA (or ‘healthy villages and schools’) programme is a national programme in DRC that has been running since the 1990s and is the government’s main initiative to provide safe water and sanitation to rural and peri-urban areas in DRC. The programme was initiated with support from the US Agency for International Development but became inactive during the conflict. The programme was re-launched in 2006 by the Ministry of Health with UNICEF support.
A recent ODI report on DRC noted that the programme is heavily reliant on external funds. UNICEF provided USD 250 million for the implementation. The programme also draws on wider donor support from DFID, USAID, and the Japanese International Cooperation Agency, in addition to UNICEF, which is also the main implementing partner. Since 2012, the Dutch development organisation SNV has been supporting the capacity building of VEA partners and local authorities through cooperation and partnership agreements with UNICEF.32
It is also worth noting the DRC WASH Consortium’ (http://consortiumwashrdc.net/) plays an active role in implementing the programme. The DRC WASH Consortium is a collection of five NGOs – Concern Worldwide, Action Against Hunger, ACTED, Catholic Relief Services, and Solidarités International – the consortium is largely also funded by DFID.
3.5.3 Suppliers and implementing partners
In DRC, Tearfund and Oxfam were the only two international partners. There was a PbR
agreement between the two consortium members, where payments were made pro-rata against
the targets at a fixed price per beneficiary. Tearfund implemented their programmes directly with
government, whereas Oxfam implemented through a selection of local implementing partners (all
NGOs) in coordination with government. The local implementing partners were contracted through
grant agreements and the PbR modality was not cascaded to the implementation level.
3.5.4 Strategy changes between programme phases
Tearfund reported a slight reduction in staffing between the output and outcome phases, with a
change in the type of key staff deployed – more focus on monitoring and fewer technicians and
public health promoters. Oxfam reduced the number of implementing partners it was working with
from three to one. The remaining one partner continued to work only in their implementation area.
In the other two partner programme areas the Oxfam staff directly took on the monitoring
responsibilities. Oxfam staff also reportedly took on greater responsibility for the monitoring
functions and engagement with community structures. Oxfam reported that the decision to reduce
the number of partners was mainly financial.
Activities on the ground were implemented in partnership with government staff. In the case of
Tearfund a MoU was signed with the government counterparts, setting out the responsibilities of
local government and the partner, with provision for allowances associated with government staff
operational costs (e.g. travel). With regards to local government the engagement in water was
primarily with the department for local water (SNHR) and for sanitation with the local health
department (BCZ). At the community level the engagement was with the Water User Committees
and village committees responsible for sanitation.
32 www.odi.org/sites/odi.org.uk/files/resource-documents/10818.pdf
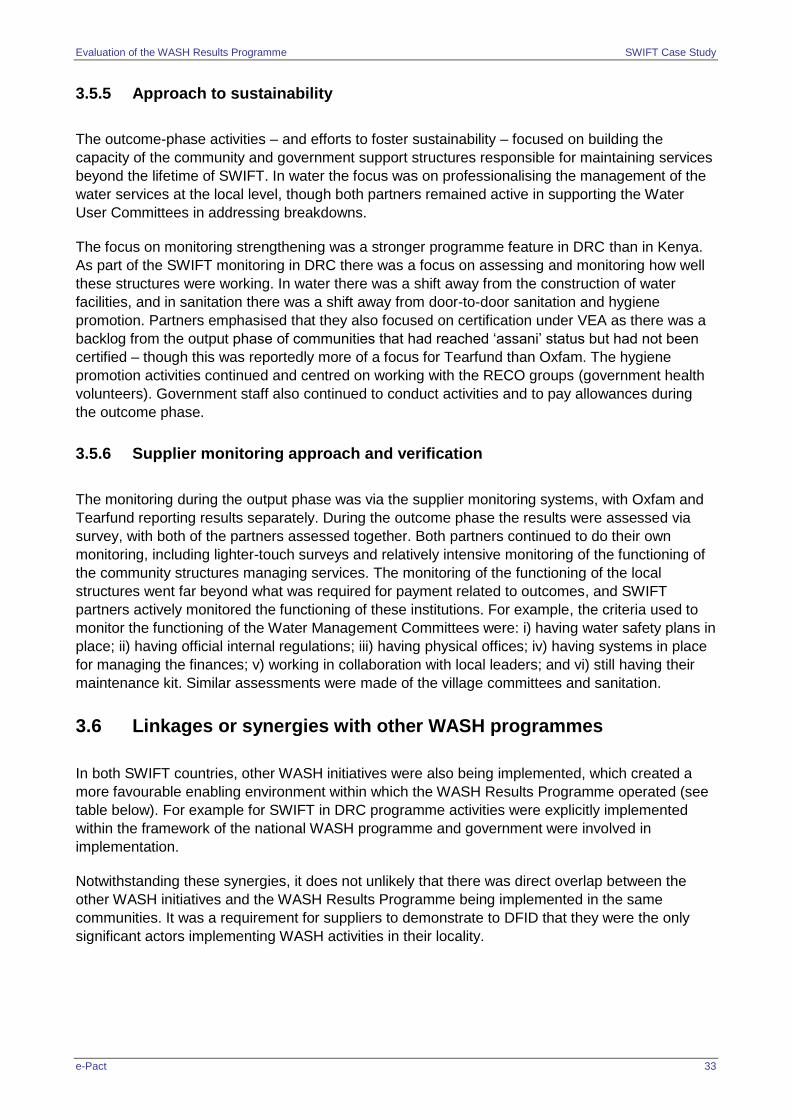
Evaluation of the WASH Results Programme SWIFT Case Study
e-Pact 33
3.5.5 Approach to sustainability
The outcome-phase activities – and efforts to foster sustainability – focused on building the
capacity of the community and government support structures responsible for maintaining services
beyond the lifetime of SWIFT. In water the focus was on professionalising the management of the
water services at the local level, though both partners remained active in supporting the Water
User Committees in addressing breakdowns.
The focus on monitoring strengthening was a stronger programme feature in DRC than in Kenya.
As part of the SWIFT monitoring in DRC there was a focus on assessing and monitoring how well
these structures were working. In water there was a shift away from the construction of water
facilities, and in sanitation there was a shift away from door-to-door sanitation and hygiene
promotion. Partners emphasised that they also focused on certification under VEA as there was a
backlog from the output phase of communities that had reached ‘assani’ status but had not been
certified – though this was reportedly more of a focus for Tearfund than Oxfam. The hygiene
promotion activities continued and centred on working with the RECO groups (government health
volunteers). Government staff also continued to conduct activities and to pay allowances during
the outcome phase.
3.5.6 Supplier monitoring approach and verification
The monitoring during the output phase was via the supplier monitoring systems, with Oxfam and
Tearfund reporting results separately. During the outcome phase the results were assessed via
survey, with both of the partners assessed together. Both partners continued to do their own
monitoring, including lighter-touch surveys and relatively intensive monitoring of the functioning of
the community structures managing services. The monitoring of the functioning of the local
structures went far beyond what was required for payment related to outcomes, and SWIFT
partners actively monitored the functioning of these institutions. For example, the criteria used to
monitor the functioning of the Water Management Committees were: i) having water safety plans in
place; ii) having official internal regulations; iii) having physical offices; iv) having systems in place
for managing the finances; v) working in collaboration with local leaders; and vi) still having their
maintenance kit. Similar assessments were made of the village committees and sanitation.
3.6 Linkages or synergies with other WASH programmes
In both SWIFT countries, other WASH initiatives were also being implemented, which created a
more favourable enabling environment within which the WASH Results Programme operated (see
table below). For example for SWIFT in DRC programme activities were explicitly implemented
within the framework of the national WASH programme and government were involved in
implementation.
Notwithstanding these synergies, it does not unlikely that there was direct overlap between the
other WASH initiatives and the WASH Results Programme being implemented in the same
communities. It was a requirement for suppliers to demonstrate to DFID that they were the only
significant actors implementing WASH activities in their locality.

Evaluation of the WASH Results Programme SWIFT Case Study
e-Pact 34
Table 15: Overlaps and synergies with other WASH programmes
Country Donor Programme Timeframe
DRC World Bank Urban Water Supply Project (additional financing and restructuring)
2016
Kenya
World Bank Kenya Informal Settlements Improvement Projects (KISIP)
2015
World Bank Kenya Urban Water and Sanitation OBA Fund for Low Income Areas
2014-2019
Source: The databases that were searched to identify WASH synergies included DevTracker [DFID], World Bank Projects & Operations, African Development Bank Project Portfolio, Asian Development Bank Projects, WSSCC Global Sanitation Fund Countries and the UNICEF Evaluation database

Evaluation of the WASH Results Programme SWIFT Case Study
e-Pact 35
4 Findings and analysis
4.1 Relevance
Box 4: Overall evaluation questions related to this section’s discussion
Detailed Evaluation Question (DEQ) 1.1: To what extent were the programme objectives clearly articulated?
DEQ 1.2: To what extent did the programme’s design (i.e. the theory of change) set out a clear and realistic process for how programme activities were to achieve the intended outputs, outcomes, and impacts?
DEQ 1.3: To what extent were the scale and pace of the programme (including the December 2015 deadline) realistic for achieving the intended outputs and outcomes given the capacity of suppliers and their local partners?
DEQ 1.4: To what extent was the PbR modality appropriate for achieving sustainable and inclusive WASH outcomes, given the capacity of suppliers and the timeline of the programme?
DEQ 1.5: How likely was it that the programme design would encourage ‘innovative’ private sector partnerships?
DEQ 1.6: How likely was it that the programme design would encourage suppliers to propose ‘innovative WASH interventions’?
DEQ 1.7: How likely was it that the programme design would encourage inclusive outputs and outcomes?
DEQ 1.8: How appropriate was the WASH Results Programme’s design for achieving the programme ‘learning objectives’?
DEQ 1.9. To what extent was the design of each consortium sub-programme appropriate for achieving DFID’s key objectives?
4.1.1 WASH context and alignment with national policy context
Though Kenya is a lower middle-income country, fewer than 50% of the rural population have
access to basic services. There are few authoritative figures for the county level as the nationally
representative surveys (DHS, MICS, etc.) on which the JMP draws are representative of the first
administrative level of the countries they are conducted in – so prior to 2013/14 there are no
figures for the county level. The ASAL region is known to be one the poorest and most water
stressed regions of Kenya. Similarly, there are no accurate disaggregated urban WASH data,
though the areas targeted by SWIFT are among the poorest in the city. In the case of both
Sanergy and WSUP the focus was on upgrading the service levels people experienced. Baseline
access in Kenya was mixed: in the ASAL region of northern Kenya the level of access to WASH
facilities was very low. In small towns and urban Nairobi, the level of WASH access was higher but
the partners focused on under-served areas and informal settlements.
In Kenya, responsibility for WASH is devolved to the county level, and there is no overarching
national programme in either water or sanitation. As such, the alignment with government policy is
largely dependent on the degree to which implementation is aligned with policy priorities at the
country level. In this respect the design of SWIFT in Kenya by most partners built in engagement
with the relevant government structures.

Evaluation of the WASH Results Programme SWIFT Case Study
e-Pact 36
In the drought-prone ASAL region, water is an issue that is high on the political agenda.
Sanitation is a less prominent issue in the region, in terms of priority. OxPAC’s implementation
was designed around working with the government structures at the county level. With regard
to water this involved engaging with the WSPs, the community-based management structures,
and to a lesser extent the county authorities. With regard to sanitation promotion the county
public health department was engaged directly in implementation.
In the case of WSUP, working in urban areas in Nairobi, its government partner – NCWSC –
has exclusive responsibility for providing services in these areas. WSUP’s implementation
model was based on a clear signed MoU with NCWSC detailing the responsibilities of both
parties. The WSUP project in Dandora supported a longer-term initiative of the NCWSC to
expand the number of legal connections in informal settlements. WSUP has coordinated
closely with the utility, which is gradually taking over WSUP’s role at community level.
As a social enterprise Sanergy largely operated outside of the government structures, though
its exit strategy from grant funding entailed a close relationship with NCWSC.
Similarly, BBCMA’s engagement was primarily directly with the local radio stations, as opposed
to working in close partnership with government.
DRC has some of the lowest levels of access to improved services and one of the highest
incidences of poverty in the world. The need for basic services is evidently high. Partners followed
the VEA approach and were fully aligned with the government’s own approach, and
implementation was in conjunction with the relevant government or community structures. In the
case of Tearfund this was formalised through a MoU with the relevant local government
authorities; though Oxfam staff noted they did not have the same MoUs, which meant they did not
go through all the steps to full ‘assani’ certification.
While there are varying definitions of ‘fragile’ states and contexts, the term really only applies to
SWIFT’s work in DRC and the ASAL region of Kenya, both of which have ongoing security
concerns. The context for the urban work in Kenya is acute poverty, weak public institutions, and
constraints relating to land tenure and access to public services, but not environmental fragility or
conflict.
4.1.2 Programme design
The partnerships that made up the SWIFT consortium were reportedly formed well ahead of the final invitation to tender documents being published. Oxfam was explicit that one of the aims for it as a consortium lead was to forge new partnerships and in new programme areas in which it had comparatively less experience (notably urban WASH). This is part of the context that explains why such a diverse set of implementing organisations and approaches was seen in Kenya. SWIFT cannot be viewed as having had a single overarching programme approach and the evaluation team are unaware of an overarching explicit theory of change; though understand that country level ToCs were submitted as part of the tender33. Though the programme objectives can be viewed as having been clearly articulated through the targets and indicators used for payment.
Implementation approaches: The projects making up the programme in Kenya were largely
stand-alone initiatives, with little connecting them except in the ASAL region, albeit with good inter-
agency communication. In DRC the programme was more cohesive, in part due to the presence of
a national programme (VEA) with a clearly articulated approach.
33 Though the evaluation tem have not been privy to these documents

Evaluation of the WASH Results Programme SWIFT Case Study
e-Pact 37
In Kenya the partners used a variety of approaches, some of which were new, though in most
cases they were building on existing work. Specifically:
In the case of the ASAL partners mostly used using tried and tested approaches and had
worked in the region before. A notable exception was that Practical Action had not previously
implemented rural sanitation (specifically CLTS).
At the start of the programme Sanergy had a business model focused on pay-and-use public
toilets. Over the course of SWIFT this changed, with Sanergy adopting a much greater focus
on providing residential facilities.
Similarly, though WSUP worked in an area familiar to it, its partnership with NCWSC and the
specific implementation approaches taken were new and developed over the course of the
programme.
BBCMA built on existing work with the local radio stations and further developed this.
Practical Action’s unsuccessful sewerage project in Nairobi was a new initiative for it In DRC
Tearfund was building on existing WASH programmes that had worked under the VEA approach
and was scaling up its work. At the time of tender Tearfund consulted across five countries in
which it worked, with each country making a proposal to the UK team. This process started ahead
of all the invitation to tender documents being issued. Tearfund’s decision to focus on two
countries (DRC and Liberia) was due to clarifications from DFID at full tender and as the expected
budget envelope was less than Tearfund had expected. The key considerations in the countries
that Tearfund selected were how confident it was of reaching the numbers and the cost. Also,
Tearfund considered where there was need and where it could work well with government
counterparts. Tearfund had existing programmes in DRC and Liberia – it was scaling up there as
opposed to working in new areas. The five other countries considered also had existing
programmes but Tearfund was not confident it could scape up the work to meet the numbers in the
tight timeframe. In DRC Oxfam had done some WASH work previously in Beni and Grand Nord.
The choice of Oxfam’s implementation areas (North and South Kivu) was reportedly largely based
on negotiations with the DRC government.
Output–outcome-phase split: Measuring and being accountable for outcomes was a new
departure for the consortium partners and led to some changes in implementation approaches –
although this cannot be separated from the influence of tight timelines, which is discussed below.
In many cases the SWIFT partners emphasised that they continued programme activities further
beyond the point of delivering infrastructure than normal – giving rise to the phrase ‘pay-to-stay’.
That is, the existence of the outcome phase incentivised partners to continue working with the
community-based and government structures for longer than they usually would beyond the point
of handing over infrastructure. Though it is important to note that this did not necessarily change
the activities that they would undertake as part of programming, but rather their timing – for
example, longer engagement with community management structures beyond the point of ‘handing
over’ infrastructure. Within SWIFT there were also cases where the output/outcome-phase split did
not strongly influence programme activities/ approaches – notably with WSUP and Sanergy in
Kenya – though this is largely a reflection of the specific implementation approaches used. It
should also be noted that the two phases had very different payment amounts within the phases,
with 80% of the SWIFT contract value paid during the output phase (as outlined in Section 3.2.1).
Overall, the PbR modality did not reportedly have a significant influence on the initial
choice of programme activities or locations. However, in the case of some partners
(particularly Tearfund) this did impact the choice of countries. This pertains mainly to the
confidence the partners had in their ability to scale up the programme and deliver results within the

Evaluation of the WASH Results Programme SWIFT Case Study
e-Pact 38
timeframe, though for others (particularly in Kenya) these considerations were balanced against
broader supplier objectives related to forming new partnerships or working in new areas.
Strength of evidence: moderate/strong
There was consistent feedback from different suppliers and at different implantation levels in relation to the key conclusions, and the assessment of the importance of design factors is based primarily on interviews with the implementers.
4.1.3 Coordination and synergies with other initiatives
In the ASAL region during the outcome phase, all three of the OxPAC partners began
implementing emergency drought response projects, with substantial funding from other sources.
This included emergency water provision (tanker trucks) in some of the urban project locations,
with the partners engaging with the same institutional structures in delivering these relief services.
There is a potential risk that these projects could have undermined efforts to promote self-reliance
via development projects such as SWIFT, though the evaluation team are unaware of any
evidence that this has happened so far.
In DRC, DFID is providing substantial support to WASH beyond SWIFT. The project ‘Increasing
sustainable access to water sanitation and hygiene in the Democratic Republic of Congo’ has
funding of £164.8 million between 2013 and 2020. The main components are: £85 million in
funding to UNICEF to implement VEA; £30 million in funding for the rural WASH Consortium led by
Concern Worldwide; up to £38 million for IMAGINE, (an urban WASH programme implemented by
Mercy Corps); and £6 million for Oxfam GB to implement a pilot sanitation marketing programme,
implemented by Oxfam GB (of which only £1.5 million was spent prior to closure in 2017, on
completion of the pilot’s first phase). The SWIFT partners all highlighted an awareness of, and
engagement with, these other programmes, though as the evaluation team did not visit DRC a
comprehensive assessment of the level of engagement with other organisations working in the
sector was not possible.
Across SWIFT there was seen to be a reasonable level of alignment with government
programmes – though this was far more explicit in the DRC programme. For the programme
in Kenya there were varying degrees of engagement with government by partner, though in all
cases there was coordination with local government.
Strength of evidence: suggestive/moderate
In Kenya the evaluation focused on engaging the SWIFT staff as reported engagement with other organisations was limited. The coordination element was more significant in DRC due to the programme context, though as the team did not conduct a case study there our ability to comment on this, and the extent of opportunities taken or missed, is limited.
4.1.4 Timelines and how realistic the targets were
The 2015 deadline for the delivery of outputs (later extended to March 2016) had a profound effect
on programme activities: with urban results in Kenya being heavily dependent on action by
government agencies, delivering them on time was particularly challenging. The fact that the
programme had no inception phase – yet involved a considerable amount of inception work –

Evaluation of the WASH Results Programme SWIFT Case Study
e-Pact 39
meant that the implementation period was effectively just 18 months. Procurement was also
unavoidably slow in some projects – particularly where this was done via a public utility, as in the
WSUP project. Partners were, therefore, under considerable pressure to meet targets, with the
added pressure of payments being contingent on results.
While some partners were unable to meet their targets the overall SWIFT targets were
largely achieved. However, as noted elsewhere in this report, this was partially because some
beneficiaries were transferred between project locations/counties when it became clear some of
the consortium partners were unable to meet their targets. This was particularly the case for
Practical Action’s urban work in Nairobi and Sanergy. Sanergy highlighted that the SWIFT funding
came at a time when it thought it was in a position to scale up its approach – though, as outlined in
Section 3.4, it overhauled its strategy and elements of the business model over the course of
SWIFT. Practical Action’s transferred beneficiaries related to an urban sanitation sewage project.
In both cases it is debateable as to whether or not the reason for underachievement was primarily
related to timeline constraints or was linked to more fundamental decisions related to programme
approach.
Strength of evidence: strong
There was consistent feedback from different suppliers that the tight timelines were a design element that significantly influenced implementation.
4.1.5 Operationalisation of the PbR modality by supplier
The PbR risks were shared between the consortium’s INGO partners, and each partner was
accountable for its own results and paid pro-rata against performance. At the start of the
programme, it took a considerable amount of time (and legal support) to develop and finalise the
PbR agreements between Oxfam and its INGO partners. However, it should be noted that during
the outcome phase the results for OxPAC in the ASAL region and Oxfam and Tearfund in DRC
were assessed jointly via a single survey. As such, they were jointly accountable for the results,
though the partners reported that the risk-sharing agreement for the outcome phase was not
clearly outlined in advance.
Where the INGO consortium partners had local implementing partners (notably Oxfam in DRC34)
these partners were not on PbR contracts but rather grant contracts. Oxfam staff highlighted the
challenge of communicating the requirements of PbR to these partners as many were unfamiliar
with the modality. In moving between the first WASH Results Programme and the ‘WASH Results
Programme extension’ in DRC Oxfam changed the way it structured the grant agreements to have
a greater performance focus and more frequent contract break points, to allow it to more
intensively manage the performance of the local implementing partners.
SWIFT partners highlighted that the management and M&E burden was higher than they
anticipated and was an under-budgeted area. This is discussed further under Section 4.3.2
The contracting arrangement of SWIFT shared the risk among the consortium partners, and
broadly the risk-sharing arrangements did not significantly influence programme design or
location. Pre-financing was not raised as a major challenge by the INGO partners.
34 And Tearfund in Liberia when the programme was active there.

Evaluation of the WASH Results Programme SWIFT Case Study
e-Pact 40
Strength of evidence: moderate/strong
Consistent feedback from different suppliers on the key points.
4.2 Effectiveness
This section considers the relationship between the outputs and outcomes in the programme. The
WASH Results Programme was unusual in relation to other WASH programmes at the time in that
there were explicit payments linked to outcomes, combined with more intensive monitoring of
outcomes linked to the verification. At the time of the WASH Results Programme’s design the
WASH sector globally lacked reliable benchmarks for reasonable outcome levels and this was a
key point in the negotiations between the supplier consortia and DFID – with each of the three
suppliers negotiating different targets for the outcome levels, and in some cases different outcome
levels for different countries within a consortium.
Box 5: Overall evaluation questions related to this section’s discussion
DEQ 2.1: Did the programme achieve the intended outputs at scale?
DEQ 2.2: To what extent have the utilisation of water and sanitation services and the uptake of hygiene practices reached all members of target populations (inclusive outcomes)?
DEQ 2.3: To what extent have services continued to function and have behaviours continued to be used since their initial implementation (sustainable outcomes)?
DEQ 2.4: How did programme design and external factors affect the achievement of output and outcome objectives within consortia sub-programmes?
DEQ 2.5: Under which circumstances did the PbR framework help/hinder the achievement of intended outputs and outcomes?
DEQ 2.6: Under which circumstances did the PbR framework affect the quality of programme implementation (positive or negative)?
DEQ 2.7: Under which circumstances did suppliers implement innovative approaches and focus on learning?
4.2.1 Effectiveness by programme area
Throughout this section, data are presented from the various surveys undertaken as part of the
outcome-phase monitoring and verification. The survey methodologies varied considerably by
partner. In some cases the results are for the general population, whereas for others they pertain
just to the beneficiaries of the programme.
The outcome verification approach is discussed in more detail in above. Notes on interpreting the
results data are included at relevant points in the text below. Given the different methods used, the
focus of the discussion is on trends in outcomes, as opposed to assessing the overall outcome
level itself. Where the data are representative of not just beneficiaries but the whole population of
an area there are questions surrounding attribution – these are discussed in Section 4.2.8 below.

Evaluation of the WASH Results Programme SWIFT Case Study
e-Pact 41
4.2.1.1 Water outcomes
SWIFT’s outcome target for water was ‘Use of at least 75% of water points sustained35’. SWIFT
was the only consortium with a substantial water component and was contracted under Lot A,
though SAWRP also had a water component to their programme (albeit much smaller). The
SAWRP target for water outcomes was that 90% of all water points remaining functional. The
reasons for the quite different target levels are not entirely clear, though it is noted that SAWRP
and SWIFT worked in very different contexts.
The aggregate achievement level for SWIFT on water was 98.6%, which can broadly be interpreted as meaning that the vast majority of systems by supplier group remained functional above the 75% target established in the Form 2s. However, due to the way the data were aggregated it cannot be interpreted as meaning that just under 75% of all systems remained functional across SWIFT (i.e. 98.6% achievement does not mean 73.95% functionality). In fact, there was significant overachievement in many areas. The DRC survey results indicated that over 90% of water points were used (as reported via household surveys), and around 80% of the complex systems in the ASAL region remained functional (both as reported by household surveys and by Water User Committees). Similarly, WSUP reported that nearly 90% of facilities were providing a sustained supply of good water and the extension of metered connections was well above its target36 (140%).
The one area where the endline data suggested functionality below 75% was the simple water
systems in the ASAL region in Kenya. There the functionality was 55%, as assessed by survey,
and 66% as reported by WUAs. The primary reason advanced for the low functionality was the
prolonged drought in the ASAL region (discussed in Section 3.4.1), and ultimately this was
considered by DFID in deciding on the payment amount. However, regardless of the payment
amount (which relates primarily to the approach taken to risk sharing and is discussed in Section
4.3.1) the survey data do highlight the relative vulnerability of different system types to
environmental shocks. Similarly, these systems have different institutional support mechanisms –
with the complex systems more often existing in denser/ more urban areas. These points are
discussed further in Section 4.5 (sustainability).
Another dimension to consider is how functionality evolved over the course of the outcome phase.
In the case of DRC it improved between Q4 2016 and Q4 2017 – the upward trend is encouraging
and suggests the outcome-phase activities in water were effective in sustaining functionality. The
one area where there was a substantial drop in functionality was the simple systems in the ASAL
region.
All partners in DRC and Kenya highlighted that they took an active role in ensuring functionality,
and at times repaired systems directly. Partners (particularly in DRC) also highlighted that the
majority of the outcome-phase payments were based around water (see Section 3.2.2 for details),
and as a result this was a focus area as part of their risk management approach. The combination
of the improvement in functionality over survey rounds and supporting interviews evidence mean
that in the view of the evaluation team it is likely that without the outcome-phase efforts by partners
functionality would have been lower. However, considering what an active role they played in
ensuring functionality during this time this does have implications regarding the degree to which
these levels of functionality can be sustained.
35 N.b. the wording of this indicator was change to focus on the functionality of water points in the Form 2s for DRC 36 It is noted that the original intention was to have had all connections metered, but the target was negotiated down by WSUP on the grounds that delays by NW in providing meters meant the original target could not be met. DFID agreed to a lower target.

Evaluation of the WASH Results Programme SWIFT Case Study
e-Pact 42
Table 16: Functionality over the course of the outcome phase
Partner(s) Indicator Survey result (%)
Q4 2016* Q4 2017
DRC Use of SWIFT water points, via household survey reports
88.1% 90.2%
OxPAC
(simple systems)
Functionality reported by Water User Committee 91.4% 66.2%
People that continue to use a SWIFT water point (household survey)
58.5% 54.5%
OxPAC
(complex systems)
Actual meter readings confirm the number of people served by the volume of water supplied by SWIFT boreholes
88.9% 81.7%
Functionality reported by Water User Committee 78.2% 78.6%
WSUP 75% sustained supply of good quality water n.a. 87.7%
Metered connections at household level n.a. 138%
Note: *WSUP was not assessed in Q4 2016 but Q2 2017 due to issues in scheduling the survey.
Source: Q4 2016 and Q4 2017 verification reports.
In discussing the results it is important to note some of the nuance in the measurement of the target. Specifically, that there were different methodologies used for different system types (complex vs simple), and locations. In general, three main approaches were used: surveys of users; FGDs; and meter readings/ quantitative measures of actual use. The indicators used for payment varied by measurement method; Specifically, the indicator used in the surveys measured functionality at the time of the survey37, against the indicators used in the Focus Group Discussions (FGDs) with the Water Users Associations which reviewed functionality over time.
This is not just an academic discussion: in the context of this programme it was relevant in
arbitrating on payment decisions related to outcomes in Kenya. Specifically, in the Q4 2016
verification round the results from the WUA FGDs and survey results presented a different view of
functionality, with the FGDs suggesting higher functionality than the survey results. The debate on
this point was compounded by the fact that prior to that verification round the weighting of these
two sources of evidence was not finalised (either 50:50 or 70:30 weighting for survey:FGDs). At
that payment decision meeting it was argued by SWIFT that the FGDs were the better measure,
which was accepted by DFID and consequently considered in deciding on payment amounts. This
point has implications for considering what the more appropriate evidence is for assessing
functionality in future programmes; notably that there was a clear preference expressed by the
supplier and accepted by DFID for considering the FGDs a better measure of functionality..
A final reflection is that these data could be viewed as providing a reasonable benchmark for
anticipated levels of functionality after two years in the context of ongoing external support.
However, this assertion should be treated with caution as the analysis and reflections of the
supplier highlight i) that results are highly contingent on the implementation context, modality, and
the indicators and their measurement; and ii) the significance of external factors on the
functionality level. This is both in the context of risks that materialised (environmental shocks in the
ASAL), and those that did not (conflict in DRC). In the context of DRC one interviewee remarked
37 Although there were also questions included in the survey that reviewed non-functionality at other times.

Evaluation of the WASH Results Programme SWIFT Case Study
e-Pact 43
that it was ‘fortunate’ that conflict did not break out in most programme areas, though plausibly it
could have done.
The outcome results broadly lend strong support to the notion that the programme
activities were effective in sustaining results – though the variation in performance and
where there was underachievement highlights that this was variable across the programme.
Specifically, the environmental context and system type were significant. In DRC the improvement
in functionality over the course of the outcome phase is a positive indication that programme
activities contributed to sustaining functionality. In the ASAL region the decline in functionality is a
cause for concern – though, as discussed, this finding should be situated in the context of
persistent drought.
Strength of evidence: moderate
Analysis is based primarily on the verified survey data, and complemented with interviews with supplier staff. The verified data are regarded as credible – though with the caveats that no third-party data were collected as part of the evaluation, the nature and variety of the survey methodologies make comparison challenging, and that there is an absence of reliable context specific benchmarks.
4.2.1.2 Sanitation outcomes
The SWIFT outcome target for sanitation was that ‘use is sustained for at least 70% of each target
population’. This is considerably lower that the targets set for SAWRP and SNV, which were that
use/functionality (or equivalent indicator) was sustained at 75% and 100%, respectively.
The aggregate achievement level in the final verification round was 100%. This can be interpreted as meaning that the use of sanitation facilities by beneficiaries was above the 70% threshold across the partner groupings. However, Sanergy is slightly idiosyncratic in the measurement of use due to the implementation modality38. For the OxPAC and DRC partners the survey results indicated that around 75% of the latrines were used (and functional). Although the target was achieved this does imply a degree of slippage/non-use among the population. In the sanitation sector this is largely anticipated – though the relationship between outputs (latrines) and use is not well understood in all contexts – particularly what a reasonable level of ‘slippage’ is. Predominantly we discuss the success of the programme in relation to the stated targets. In the synthesis there is some further discussion on this in the context of the variations in the level of ambition between suppliers.
.
What is encouraging is that the survey results improved over the course of the outcome phase. As
with water there is also evidence that the suppliers remained active in ensuring functionality. A key
example is Practical Action adapting its approach to include an in-kind subsidy to avoid repeated
latrine collapse (this is discussed below under Section 4.2.5). As with water these survey data
combined with what is known of programme implementation support the view that the programme
activities contributed to the results. Unlike water this indicator pertains more to the behaviour of
individuals, as opposed to the functionality of a given piece of infrastructure. Many implementers
remarked that changing behaviours is challenging and something that takes time. Most of the
outcome-phase activities of the partners (with the exception of Sanergy) focused on continued
household-level promotion – most often through government health extension workers or
community-level volunteers.
38 Measurement of use was based on the quantity of fecal sludge being collected from the toilets.

Evaluation of the WASH Results Programme SWIFT Case Study
e-Pact 44
Table 17: Latrine use over the course of the outcome phase
Partner(s) Deliverable and indicator Survey result (%)
Q4 2016 Q4 2017*
DRC Household-reported use of hygienic latrines 68% 75.0%
OxPAC Continued use of hygienic latrines 61.8% 73.5%
Sanergy
At least 70% of FLTs constructed by March 2016 are still in use
86.8% 78.9%
At least 70% of the beneficiaries that are reached at output level continue to use FLTs
76.7% 109.8%
Source: Q4 2016 and Q4 2017 verification reports.
The improving results across the outcome phase are encouraging as they suggest an
upward trend, with the promotion primarily through functionaries who will remain present
at the community level. However, this is set in the context of the overall achievement level,
which, though above the target, implies that the intervention did not change certain people’s
behaviours. As the evaluation did not collect any primary data at the household level for SWIFT it
is difficult to comment on who these people might be, and if certain groups of people were more
difficult to reach than others – and consequently it is difficult to comment on the degree of equity in
the intervention, though equity considerations as they pertain to programme approach are
discussed in Section 4.4.2.
Strength of evidence: moderate
Justification as for water
4.2.1.3 Hygiene outcomes
The SWIFT target for hygiene was that ‘Behaviour change obtained for at least 15% of each target
population’. The measurement of this indicator is more complex and there is considerable sector
debate surrounding the appropriate measurement and measurement validity. Broadly speaking,
hygiene behaviour change is measured through a mix of self-reported practice, indicators related
to an observable facility, knowledge, and (less often) a demonstration of the steps taken. In
SWIFT’s case the separate partners were assessed on one or more of the first three of these
indicators – with an aggregate score generated through weighting the results in different areas.
The hygiene output payments were made on the basis of the number of people reached with
messages – and the outcome payments reflect the degree to which people reached with
messages changed their behaviours.
The aggregate achievement level in the final verification round was that 99.6% of the target was
achieved. Due to the aggregation methods this is not readily translated into an overall figure for
beneficiary numbers across partners. The only area of underachievement was in relation to
Sanergy and there being water and soap available at its FLTs.
As with some water and sanitation indicators there was a positive trend on most of the hygiene
indicators, indicating an improving situation within the programme areas. However, the results
were noticeably lower in the ASAL region than in DRC – and in both cases the endline surveys

Evaluation of the WASH Results Programme SWIFT Case Study
e-Pact 45
were of the whole population in the programme area. During the outcome phase many of the ASAL
partners reflected that one of the most challenging areas was carrying out hygiene promotion in
the context of a drought in the area. This was highlighted both by the CHVs and supplier staff
interviewed as part of the evaluation.
Table 18: Hygiene outcomes over the course of the outcome phase
Partner(s) Indicator Survey result (%)
Q4 2016 Q4 2017*
DRC
Knowledge of key moments for handwashing 73.9% 77.1%
Presence of an observable handwashing proxy near the latrines
41.5% 46.5%
Handwashing practice / demonstrated competency 74% 78.0%
OxPAC
Presence of an observable handwashing proxy within the household (50% weighting)
-0.9% 18.8%
Handwashing practice – self-reported behaviour in the last two days (50% weighting)
14.3% 33.3%
Sanergy 70% of FLTs with soap and water for handwashing present at FLT handwashing stations
75.9% 65.1%
Source: Q4 2016 and Q4 2017 verification reports.
BBCMA’s results are not discussed above as these were assessed at Q2 2017 in the outcome
phase. One of the main indicators for BBCMA was that 70% of people exposed to the hygiene
promotion message should be able to name at least two critical times to wash their hands; on this
indicator there was significant overachievement. The second main indicator was that ‘among those
people with access to water within 30 minutes collection time, the proportion of those exposed to
the media programming who report practise of handwashing with soap/soap substitute at two
critical times was five percentage points higher than for those not exposed’. Strictly speaking, this
indicator was not met, though BBCMA presented compelling arguments in support of impact which
the MV analysis agreed with. MV proposed re-defining the indicator to exclude the requirement of
a facility being within 30 minutes – which meant BBCMA achieved the target. Importantly,
BBCMA’s analysis of reveals the important finding of the additional benefit of radio promotion
alongside other promotion approaches, through the fact the analysis compares listeners to non-
listeners, and that differences were statistically significant. The additional benefit of hygiene
promotion by radio is a topic of interest in the sector and was an important consideration under this
PbR arrangement as there was a need to avoid double counting. BBCMA’s analysis lends strong
support to the additional benefit seen from using radio for hygiene promotion – though with the
caveat that this analysis lacks access to financial data and as such does not consider VFM.
As with sanitation the improvement in outcome-level results over the course of the
outcome phase was encouraging and suggests the programme activities were effective in
supporting behaviour change, especially as a degree of slippage could have reasonably been
assumed. The fact that the surveys were area-wide and the results were relatively high in DRC
(though notably lower in Kenya) was also encouraging.

Evaluation of the WASH Results Programme SWIFT Case Study
e-Pact 46
Strength of evidence: moderate
Justification as for water
4.2.2 Quality of results
A technical assessment of the infrastructure quality was not within the evaluation’s scope. Instead,
this section focuses on the influence PbR had on the supplier’s approach to quality
In Kenya it is difficult to generalise about quality given the diverse range of partners and activities
in the country programme, but the verifiers did not identify serious quality concerns over the course
of the output phase. Some examples of good quality work include Oxfam’s use of durable
components for water supply schemes and its plan to complement infrastructure development with
institutional strengthening in the outcome phase.
Oxfam’s consultancy report from November 2016 on outcome-phase plans commented that the
initial three-day training provided for WUAs/WMCs during the output phase was comprehensive,
but too brief to address critical aspects (e.g. tariff setting, revenue generation, financial
management, and technical capacity) in sufficient detail, and since the training there had been
significant turnover of membership of these bodies, so much of the learning had likely been lost.
Substantive, structured capacity building support was needed for the outcome phase, but Practical
Action and Concern had insufficient personnel to engage adequately with either communities or
county governments. In the event, Oxfam had a lot of engagement with county governments and
provided significant technical / capacity building support to a range of actors within and beyond
government (e.g. handpump mechanics). It appears that Practical Action and Concern did
somewhat less in this area.
A large proportion of Tearfund’s output results in water were realised in the one-quarter extension
granted by DFID39. Tearfund outlined that this was needed, but also that it likely could have
achieved the original deadline by cutting quality (the example given was to use plastic as opposed
to concrete tanks). In this respect the tight timeline for results can be seen as imposing a risk to
quality – albeit one that did not manifest itself in this programme.
Ultimately, there is no strong evidence either way on the relationship between quality and
PbR from the outcome-phase interviews. However, nearly all40 partners highlighted that being
accountable for outcome-level results meant that they could not walk away from infrastructure and
services developed earlier in the programme: they had to follow up and ensure that functionality /
use continued at least up to the end of the outcome phase. In the case of Practical Action this was
a motivating factor behind its decision to address the problem of latrine pit collapse in some
locations.
39 Discussed in more detail later in the report 40 With the exceptions of BBCMA, WSUP, and Sanergy.

Evaluation of the WASH Results Programme SWIFT Case Study
e-Pact 47
Strength of evidence: suggestive
Hampered by the lack of a review of much of the infrastructure seen, though the small sample seen as part of the Kenya case study was of good quality. Reasonable confidence in the mechanisms described. Very limited scope to comment on the situation in DRC – points above are rooted in the Kenya programme context.
4.2.3 Effectiveness of supplier monitoring systems
The discussion in this section centres on the degree to which the supplier monitoring systems
generated data that were fit-for-purpose – and the influence of the PbR modality and the
verification on this. How efficient these systems were is considered separately, in Section 4.3.3.
There was near unanimous feedback from SWIFT partners that independent verification
contributed to the strengthening of monitoring systems. This is further evidenced through the
repeated rounds of system appraisals that were conducted as part of the verification, which show a
clear pattern of improvement over the course of the programme. At midline the Oxfam Country
Director remarked that she could now talk about reported results with confidence, knowing that
they were accurate.
One of the most significant areas of improvement related to outcome measurement, given that
outcome assessment is not common in WASH programmes. Explicitly linking payments to
outcomes triggered a much deeper discussion around outcome measurement and the validity of
those measurements. Furthermore, though most suppliers had conducted some surveys in the
past, most highlighted that the level of rigour applied in the surveys in the outcome phase was
above and beyond what they had previously done. In this respect many also highlighted the
valuable capacity ODI provided within the consortium.
There is also evidence that the verification framework was sufficient to identify some issues related
to data collection. Notable examples in the outcome phase included: identifying issues in
Sanergy’s data transfer protocols and raising concerns over a large number of unexplained non-
responses in WSUP’s survey, as well as FGD evidence not being well triangulated with survey
results. In both cases these triggered action through the After-Action Review process with DFID
and the MV team, and subsequent systems appraisals identified improvements. In the case of
Sanergy the issues identified by the MV team contributed to an overhaul of its data collection
systems and processes – including changing from paper-based to computer assisted personal
interview data collection via a specifically developed app.
SWIFT’s indicator measurement at the output level (and consequently at the outcome level) relied
heavily on the use of multipliers41, and the multipliers used for calculating beneficiary numbers was
one of the most contested aspects of verification (especially during the output phase). This was not
surprising, given that payments to suppliers were based on the number of beneficiaries reached.
In the case of sanitation, debate centred on the number of users per toilet in the ASAL CLTS
projects. Using baseline survey findings, Oxfam originally adopted an average number of 17 users
per facility on the basis that each boma (homestead) was occupied by four households and
typically only one, shared, toilet would be built per boma in response to CLTS triggering. As the
41 The number of people assumed to be using a particular piece of infrastructure – used to calculate beneficiary numbers based on the delivery of outputs such as latrines or boreholes.

Evaluation of the WASH Results Programme SWIFT Case Study
e-Pact 48
programme progressed, however, it became clear from partner surveys and verifier visits that in
the Oxfam project in Turkana, which focused on four relatively large villages near Kakuma town,
people were proving more willing to build individual household toilets, and the average number of
users dropped to 10, and later seven. This meant that, in order to deliver the target number of
beneficiaries, more toilets would have to be built. In the Practical Action project, however, the
average remained at 17 because this project worked in more remote rural areas where sanitation
promotion was more challenging.
In the case of water, debate centred on the supply capacity of the systems vis-à-vis the population
they were intended to serve. This became part of the verification of outcomes; in some cases
meter readings were taken to provide approximate estimates of the actual volume of water
delivered by systems, and by extension to assess if this was a sufficient volume for the population
multiplier used.
Another challenge related to the calculation of the number of people ‘reached’ with hygiene
promotion via radio broadcasts in the ASAL region. DFID guidance is that people reached via
mass media cannot be included in hygiene promotion results – only direct interpersonal
communication can be counted. They relaxed this rule for the WASH Results Programme;
nevertheless, it was decided that only people living outside the project areas covered by the other
SWIFT NGOs could be included in the BBCMA results. Consequently, only a small percentage of
those reached by radio broadcasts were counted against programme targets.
Aside from the precise numbers used for the multipliers there is an important point related to
process – namely, that the verification protocol triggered scrutiny and debate surrounding these
multipliers, with effort invested in gathering data to support more reliable multipliers and
consequently more reliable estimates of beneficiary numbers.
A further important point in this discussion relates to the value of the data generated and for what
purposes they are used. This is significant as different levels of data quality are needed for
different purposes. In particular, global management, though recognising improvements in the
strength of their monitoring and the credibility of the data, viewed the effort as beyond that needed
for programme management, and regarded the investment in more credible data as primarily for
upward accountability purposes; and DFID’s requirements for credible data (as expressed through
the verification framework) led to an investment in processes beyond that which the suppliers
viewed as necessary for improving programme management,. For some partners this was more
marked, and the verification requirements were viewed simply as ‘compliance’. A further point is
that it was primarily quantitative data that were used for key payments; and these data can be less
useful to programme managers than more qualitative information on the programme functioning.
While the two are not mutually exclusive, where there is a resource constraint there can be a
trade-off in terms of where effort is invested. It should be noted that this point was raised primarily
by programme staff at the global level, as opposed to the implementation levels. The extent to
which the improved monitoring fed back into improved programming is discussed more in Section
4.2.5. A final point to note is that not all partners chose to carry forward the higher standard of
monitoring into other programmes.
The discussion in this section has one major caveat: beyond the lot quality sampling done by the
MV team there was no third-party data collected on the programme. While there is reasonably
strong evidence from the verification reports and suppliers that data quality improved. The lack of
any third-party data with which to compare the supplier-generated data means that the evaluation
team cannot carry out an overall assessment of the accuracy of the verified data – though this was
Evaluation of the WASH Results Programme SWIFT Case Study
e-Pact 49
intentionally not included as part of the scope of the evaluation given the investment in DFID in the
verification.
Overall, there is strong evidence that the MV function contributed to suppliers
strengthening their monitoring systems. This is based on clear and consistent feedback from
suppliers and supporting documentary evidence in the verification reports. However, in light of
clear evidence of improvement, the limited third-party data collected as part of the WASH Results
Programme and verification approach mean that an overall assessment of the veracity of the data
is not possible. While this is not to suggest that the evaluation team have strong grounds to
question these data it remains the case that the monitoring data drew on a range of assumptions,
and it is inherently very difficult to ‘verify’ a survey.
Strength of evidence: strong
Consistent feedback from suppliers as to the benefit of the verification to strengthening monitoring, and documentary evidence related to monitoring system strengthening through the verification reports.
4.2.4 Flexibility and innovation in practice
Innovation in this context is taken to refer to innovations in programme approach – that is, where
there was an application of novel approaches to overcome previous challenges. This framing of
innovation around programme approach is rooted in the assumption42 that PbR enables greater
scope for innovation by removing donor requirements related to implementation approaches.
Similarly, the framing of flexibility here is also rooted in the programme context and the PbR nature
of the contract. Specifically, that under PbR suppliers are seen to have greater autonomy over
implementation activities and budget as these are not reporting requirements to the donor43. The
team recognise that this is a specific framing of flexibility44.
4.2.4.1 Innovation
In Kenya a number of the operational models were new for the suppliers – for example, Practical
Action and Oxfam’s application of CLTS in ASAL – but the approaches themselves were well
established in the sector. Similarly, while the introduction of solar-powered pumping was relatively
new for Oxfam and Practical Action (outside of refugee camps at least), the technology is
becoming quite common in the sector. BBCMA’s work with small, community-based radio stations
was an unusual feature of a WASH programme but perhaps not innovative in itself, as it was part
of BBCMA’s established core business. The introduction of water ATMs by Oxfam (which
succeeded in Lodwar but not in Kakuma) was somewhat innovative (though, again, it is gaining
popularity in the sector) but was funded under another project, not SWIFT, and cannot be
attributed to the PbR modality.
In DRC, too, the programme introduced some approaches that were new to the partners – and the country. For example, the programme initially adopted the Community Health Clubs concept
42 From much of the PbR literature; this was the causal mechanism included in the PbR theory of change developed by the evaluation team and used in the contribution analysis. 43 Supplanted by reporting only on results. 44 Particularly that flexibility is often framed in terms of the ability to respond to changes in context, and is distinguished from adaptation (a change in knowledge of a context). Arguably, these framings are partially covered by the framing used by the evaluation team, but these were not used in the framing of questions in interviews.
Evaluation of the WASH Results Programme SWIFT Case Study
e-Pact 50
(originally developed in Zimbabwe) for sanitation and hygiene promotion, though this was later dropped.
In Nairobi, Sanergy’s promotion of container-based sanitation for public and shared residential
toilets in slums was probably the most innovative feature of SWIFT, but this innovation pre-dated
the programme, rather than emerging from it. Similarly, WSUP’s approach to working in
partnership with NCWSC had innovative features – though, again, this was rooted in pre-existing
relationships and an organisational approach and is not attributed specifically to the use of the PbR
modality.
The fact that several partners adopted implementation approaches that were not fully tested at the
start (at least not in the targeted locations) exacerbated PbR-related risks. For Sanergy, its
operational model changed significantly over the course of the programme – and for good reason –
and this meant that the verification and payment criteria had to be revised when the programme
focus shifted from public to shared residential toilets (strategic changes that were not related
exclusively to SWIFT).
Overall – and as discussed above in Section 4.1.2 on programme design – the evaluation found little evidence of innovation stimulated by the PbR modality, and the bulk 45 of programme activity was based on tried and tested operational approaches.
4.2.4.2 Flexibility
The flexibility to transfer target results between project locations and organisations was used to
positive effect when it became clear that some partners would be unable to meet their original
targets. Transferring results was not always straightforward, however, as unit costs varied hugely
between projects and locations, and it was essential to work within the overall budget ceiling for
the country programme. Furthermore, taking on additional work was problematic when it took
projects into locations where no baseline had been done previously, and when transferring results
between countries (some went to DRC), prior approval was needed from DFID. Timing was
another factor: some partners declined offers of additional funding when there were doubts about
meeting the output deadline. As outlined in Section 3.1.1, there was a PbR arrangement between
the consortium partners. As such, the transfer of results between partners had financial
implications for the partners who were unable to meet their initial targets – this is discussed more
in Section 4.3.1 (approach to risk sharing).
DFID’s one-quarter extension of the deadline for output results from Q4 2015 to Q1 2016 was
significant – particularly in DRC. Without this extension, SWIFT partners would have not achieved
their results. That one quarter could be so significant highlights both the very tight timelines under
this programme and the financial risks faced by suppliers. In DRC, Tearfund’s results realised in
the final quarter (Q1 2016) were associated with a single large water rehabilitation scheme serving
some 78,000 people, amounting to nearly 25% of beneficiaries for the water results. If it had been
held to December 2015 Tearfund indicated it likely could have rushed to meet the original deadline
by cutting quality.
45 The exceptions being Sanergy (who’s business model is innovative and evolving), WSUP (who’s partnership model with NW has innovative features), and Practical Action’s urban work in Nairobi (which was a new area of work for them – but not the sector).

Evaluation of the WASH Results Programme SWIFT Case Study
e-Pact 51
In DRC programme managers highlighted that the cost of water supply provision was higher than
expected – but programme managers were able to offset this against savings in another element
of the programme. A reflection from the programme manager was that, under grant agreements,
there can be an upward spend pressure in the context of underspends (implying wasteful
spending) and that in this case the flexibility to balance the over- and underspends against one
another between programme components enhanced VFM.
The programme in DRC was on a larger scale than that in Kenya and the country-level programme
management did report greater flexibility in budget management and the ability of country
programme management to re-allocate funds in response to changes on the ground. However, this
is tempered by the caveat that this did not necessarily mean the programme approach changed
greatly. Programme managers in DRC highlighted the need to manage the local implementing
partners tightly.
Risks associated with non-payment increased when progress depended on government partners
meeting agreed deadlines or funding commitments. This was a particular challenge for Practical
Action, WSUP, and Oxfam when working with utilities. Practical Action’s inability to secure timely
utility support for the proposed sewerage investment in Nairobi resulted in a significant financial
loss, as much had been invested in the design of the programme. WSUP worked with the same
utility, which felt some pressure to prioritise SWIFT over its other projects in low-income areas.
This caused some stress at times; nevertheless, this collaboration was more productive and the
final outcome was very positive.
For some organisations – most notably Sanergy and WSUP – the PbR modality had a very limited
impact on implementation. In the case of Sanergy this is largely as Sanergy had substantial other
funds beyond SWIFT, and that comparatively flexible funding from foundations formed a large part
of this funding, as well as other funding from DFID outside of SWIFT. In the case of WSUP the
implementation approach was quite well specified and associated with a specific location and
water supply system, limiting the scope for flexibility in moving resources between geographical
areas or programme components.
For others – especially the ASAL partners – the fact that partners were accountable for delivering
outcomes was very significant and was influenced the programme approach. Although
accountability for outcomes was intimately linked to the PbR modality, arguably this could also be
fostered under other contracting modalities. Beyond financial penalties for underachievement,
reputational risk was a very significant factor in suppliers’ motivation to meet targets, and
additionally suppliers’ own priorities led to their assiduously pursuing outcomes.
Among the programme managers in Kenya there was no consensus view on the strengths and
weaknesses of PbR and the benefits in terms of greater flexibility; this perhaps reflects the diverse
portfolio of projects. However, in DRC PbR was cited as a key benefit, with greater financial
freedom being said to enable the organisations to respond to changes on the ground. The
organisational culture and implementation approach appear significant in terms of to what degree
the modality afforded greater flexibility. For example, neither WSUP nor Sanergy cited this as a
key benefit – though in both cases they were implementing very specific approaches in specific
areas. In the case of Sanergy the SWIFT funding afforded arguably less flexibility than its other
funding.
Oxfam’s country programme management in Kenya remained not entirely comfortable with PbR.
One concern expressed was that it placed too much focus on physical results, billing, and revenue,
and not enough on socio-structural aspects, which are very important to Oxfam’s core work. This
Evaluation of the WASH Results Programme SWIFT Case Study
e-Pact 52
was cited as one reason why Kenya did take up the opportunity for an extension. Similarly, WSUP
and Sanergy had limited interest in pursuing the extension. Partners reported that it was
challenging working to standard unit costs per beneficiary across such a diverse range of projects
and contexts, though they did not seek out ‘sweet spots’ where the unit costs were relatively low.
In the outcome phase some partners reported feeling constrained by their outcome targets and
that they limited their scope for responding appropriately to changing priorities on the ground. This
was largely discussed in relation to hygiene promotion in the ASAL region in the context of the
drought. The comment from partners highlighted that not only was it more difficult to achieve the
handwashing target, but some respondents felt it was inappropriate to be asking rural households
about their handwashing practices where they did not even have enough water to drink, and that
an adjustment of the programme objectives would have been appropriate. However, while the
results were specified by DFID the locations were not and it was SWIFT’s decision to work to those
targets in those areas at the start of the programme, and the ASAL region is known to be drought-
prone. Though related to this point SWIFT global management highlighted that the SWIFT
programme was designed prior to it being known it was to be under a PbR modality.
On the whole, increased operational flexibility – in the context of suppliers, this included greater
choice over implementation activities and fewer restrictions on re-allocating budget – was not cited
as a key benefit by suppliers, as the degree of flexibility afforded by the PbR modality (fewer
requirements related to financial and activity reporting) was tempered by other operational
constraints. In Kenya this was often associated with the scale of the activities – that is, there was
less scope for re-allocating resources across programme areas in small or focused projects.
However, arguably small projects can be more flexible and dynamic in other respects as it is
relatively easier to adjust programme approaches. In DRC the tight timelines and budget (the
Brexit devaluation of the pound was reportedly significant) in the context of a prescriptive approach
limited the degree to which suppliers could change in response to changes in context.
The degree of flexibility from DFID – notably in the output-phase extension, allowing the transfer of
beneficiaries, and arbitrating on the significance of the drought in Kenya – was significant to
partners avoiding significant financial losses. This is discussed further under Section 4.3.1
(approach to risk sharing and programme implementation).
Within SWIFT the benefit of the additional degree of flexibility afforded by PbR varied
across the countries and partners – and was balanced against other programme
constraints. Generally speaking, additional flexibility in budget was noted by partners in Kenya. In
DRC the budget flexibility was cited by programme management as a key benefit – though it was
explicit that this greater flexibility (budget and otherwise) was not cascaded to the implementation
level.

Evaluation of the WASH Results Programme SWIFT Case Study
e-Pact 53
Strength of evidence: moderate/strong
The overall conclusions related to operational flexibility not being a key benefit is well supported by the interviews – though noting there was disagreement on this point between SWIFT partners. This point was also the focus of one of the evaluation questions that was included in the contribution analysis, and so was a focus in all interviews.
4.2.5 Experiences of adaptation and learning at the implementation level
This section discusses the degree to which adjustments at the implementation level were made to
improve effectiveness, based on insights gained from near real-time monitoring data or
evaluations. This is distinguished from innovation in the programme approach more broadly, as
well as flexibility (as framed above). As with innovation and flexibility, this framing is rooted in the
context of this programme and an assumption46 that the PbR modality would incentivise such
adaptation at the implementation level to ensure targets are met effectively, and therefore facilitate
or increase payments.
As with regard to the level of innovation, the team found little evidence of the PbR modality either
enabling or encouraging programme adaptation at the implementation level, though there were
examples of remedial action being taken in response to key programme design features. Most
significantly, the accountability for outcomes triggered action. Partners saw value in the improved
monitoring as – combined with greater accountability for outcomes – it helped them improve
programme operations. For example:
Practical Action revised their stance on hardware support when monitoring revealed that in
some project locations many toilets had collapsed due to soil conditions;
surveillance of rural water points led partners to intervene and ensure that repairs were
undertaken where necessary, to ensure that functionality was sustained at least until the end of
the outcome phase; and
In DRC they identified some latrine collapse in areas with sandy soils and with the heavy rains.
As a response, they did re-fresher trainings for the RECOs (government health volunteers)
focusing on improved designs, with a focus on using local materials – though still strictly no-
subsidy. When re-building there was slower uptake of new designs, and some hesitance in the
community to re-build, with some people waiting to see if the new designs were robust.
Similarly to the finding in the discussion surrounding flexibility, the timeframe in which partners had
to adapt was limited – especially in the output phase; in the words of one programme manager
from DRC: ‘there simply wasn’t enough time to do adaptive programming’.
46 Included in the PbR theory of change developed by the evaluation team and used in the contribution analysis as a testable
proposition.

Evaluation of the WASH Results Programme SWIFT Case Study
e-Pact 54
Strength of evidence: moderate
A key limitation here is the large number of programmes and the breath and diversity of the programmes, when compared to how much time the evaluation team could spend with field-level implementation staff. However, the interview evidence from the programme manager level was clear and relatively consistent.
4.2.6 Learning in practice
During the output phase there were many meetings between consortium members, and a programme website was established. There were two internal reviews, one on SWIFT’s experience of PbR under the WASH Results Programme, and the other a mid-term review. While partners highlighted that learning took place within organisations – especially related to how to manage a PbR contract – there was no conscious effort to share lessons with other sector stakeholders in Kenya. In DRC SWIFT hosted two learning events on PBR in the DRC (Kinshasa and Goma), and a more recent event in Kinshasa in May 2018 on semi-urban WASH.
Some partners were also explicit about the fact that they viewed retaining the learning on
managing PbR contracts as part of maintaining a competitive edge over other organisations – this
was especially relevant as over the course of 2016/17 DFID was conducing early market
engagement around ‘WASH 2020’, Which was signalled as being a successor to the WASH
Results Programme.
Planned activities in support of learning were not a prominent feature of the Kenya programme
during the outcome phase, though Oxfam hosted a regional learning event for SWIFT in Nairobi in
[2017]. The DRC programme was substantially larger in terms of results (though narrower in
technical scope) and more resources were devoted to learning there, including some ongoing
operational research initiatives led by ODI – with some recent publications associated with the
work.
Partners in both DRC and Kenya highlighted the benefit of having ODI within the consortium – in
particular, the role it played in conducting formative and operational research (predominantly in
DRC) and in supporting survey implementation (relevant in both countries). Similarly, ODI
highlighted that working with a consortium was new for it and delivered learning on how to conduct
operational research in this context. However, ODI also highlighted that its role in conducting
research was, in practice, slightly crowded out in favour of supporting monitoring efforts –
especially in the output phase.
As noted earlier, the focus of the monitoring efforts was on upward accountability. Both the
learning partner and global management highlighted that utilising these data for learning was
perhaps a missed opportunity. Constraints here were that the monitoring requirements evolved
over time so it was challenging to plan learning around them; there was limited time to devote
efforts to this in the output phase; and that the data were associated with payment and therefore
somewhat sensitive.
Programme managers at the global level highlighted that for many staff there was significant
personal development under the programme, and that often this was skills-based as opposed to
knowledge-based. Key examples include: experience and knowledge of how to implement a PbR
contract, a greater focus on project management as a discrete skill set, and an up-skilling on
monitoring.
There were clear benefits in terms of learning, though this was largely confined to learning
around PbR within the consortium, though SWIFT has published some summary pieces on
Evaluation of the WASH Results Programme SWIFT Case Study
e-Pact 55
its learning for wider consumption. The learning partner specifically highlighted that its support
to the monitoring function was greater than originally envisaged and especially during the output
phase was the focus of its efforts/support in relation to learning.
Strength of evidence: moderate
Relevant staff at the global and country levels interviewed.
4.2.7 Significance of external factors
The relevance of external factors has been discussed above. In this section we briefly summarise
the most significant factors and their most salient impacts:
i) The drought in the ASAL: Though the region is drought-prone this most recent drought was
deemed to be exceptional and directly impacted on programme performance. During the
outcome phase many partners began implementing emergency relief programmes funded
from other sources.
ii) The DRC partners were affected by instability: Most notably, DRC partners were affected
when IDPs entered the programme areas, raising tensions surrounding water and other
resources. However, the programme management highlighted that it was ‘fortunate’ that
widespread violence had not affected the programme areas.
iii) The Ebola crisis led to the suspension and then termination of the programme in Liberia:
There were some financial implications of this, as SWIFT had invested some sunk costs in
establishing the programme there.
iv) The elections and political uncertainty in Kenya throughout 2017: This raised some
concerns among partners, but ultimately the elections had only a limited impact on
programme implementation. Examples of this impact include some infrastructure damage
in the Nairobi programme areas, and a large number of staff leaving the urban areas ahead
of the elections.
Strength of evidence: moderate
Confident that key external factors have been identified and discussed in relation to the findings. Interviews with the country programme management level are seen as sufficient to identify these.
4.2.8 Extent of attribution
The methodology for this evaluation means that the team are unable to establish a quantitative
counterfactual to compare progress against. Rather, this section outlines where other resources
were leveraged by SWIFT towards the achievement of outcomes, other factors that may have
contributed to the programmes results, and the significance of the monitoring and verification
approach to considering attribution – particularly the use of sample frames for the surveys that
include non-beneficiaries.
In only a few cases did the programme explicitly leverage other organisations’ resources in support
of programme outputs and outcomes. These included the following:

Evaluation of the WASH Results Programme SWIFT Case Study
e-Pact 56
In DRC, government staff were key functionaries at the implementation level. In line with the
signed MoU, SWIFT partners paid allowances for travel and other activities, while staff salaries
were paid by the government authorities. These resources can be seen as directly contributing
to the programme outputs and outcomes.
The same is true of the WSUP project in Dandora in Nairobi – where NCWSC staff time and
other resources were leveraged and contributed directly to programme outputs and outcomes.
In the ASAL region in Kenya, key programme actors in rural sanitation were either government
staff (Public Health Officers or CHEWs) or community volunteers (CHVs).
In regard to urban water supply in the ASAL region, the partners had a relationship with
LOWASCO and KAWASEPRO, and the resources of these organisations contributed to the
results for which SWIFT were paid for by DFID.
In the case of Sanergy the organisation had substantial other grant funding and the SWIFT
funding was reportedly only a small portion of Sanergy’s external funding. Nevertheless, the
results reported under SWIFT were the total number of latrines constructed by Sanergy over
the output phase. As such, Sanergy’s other grant funding can be seen to have contributed
directly to the SWIFT outputs.
A second, more nebulous, set of factors that contributed to outputs and outcomes were other
externally-supported programmes that contributed to the outputs and the outcomes. This is
relevant in DRC, where there is significant donor investment (including non-SWIFT DFID support)
in the VEA. Arguably, these other programmes and their expenditure worked towards creating a
more favourable enabling environment within which SWIFT operated. The same is true of partners’
work where they were building on a significant investment by other development partners. For
example, BBCMA’s work built on previous World Bank funding which helped to develop the
relationship and fund some of the infrastructure used.
The outcome surveys in the ASAL region and DRC sampled the whole population in the areas (i.e. included output beneficiaries and non-beneficiaries). The targets were based on population-level changes in key indicators. As such, the trend in these areas for those indicators is an important facet to consider in relation to attribution to programme activities. However, there are limited data on this so it is difficult to make a judgement. Nonetheless it is important in discussing attribution to recognise that the measurement/verification approach did not provide a quantitative counterfactual.
Neither the evaluation design nor the monitoring data take into account a quantitative
counterfactual – as such, it is not possible to reliably comment on the extent of attribution
with regards to the wider trends of key indicators. Nonetheless, this section has highlighted
instances where external resources contributed to programme results. This is seen to be most
significant where the programme was implemented in direct partnership with government (in DRC
and in WSUP’s work in Nairobi).

Evaluation of the WASH Results Programme SWIFT Case Study
e-Pact 57
Strength of evidence: suggestive
The lack of detailed financial data and a quantitative counterfactual mean this assessment in weak.
4.3 Efficiency
Box 6: Overall evaluation questions related to this section’s discussion
DEQ 3.1: How efficient was the tendering and procurement process, and what effect did this have on programme delivery?
DEQ 3.2: To what extent were the individual sub-programmes designed and delivered in a cost-efficient and cost-effective manner?
DEQ 3.3: Under which circumstances did the PbR modality affect the cost-efficiency and cost-effectiveness of individual sub-programmes?
DEQ 3.4: Under which circumstances did the PbR modality strengthen the programme monitoring and management arrangements of individual sub-programmes?
DEQ 3.5: Under which circumstances did key programme features affect cost-efficiency and cost-effectiveness?
DEQ 3.6: Under which circumstances did consortium complexity affect the efficiency of the programme management arrangements of individual sub-programmes?
DEQ 3.7: To the extent new PbR risk-sharing arrangements were applied within consortia, how did this affect programme delivery?
4.3.1 Approach to risk sharing and programme implementation
During the output phase the partners within the consortium had a PbR arrangement between
themselves. That is, each partner was paid pro-rata for their results. This was significant for some
partners – particularly those that underachieved at the output level, as a portion of their results
were transferred to other consortium partners, in effect reducing their overall budget and
increasing the ratio of their sunk costs and overheads to the overall programme budget.
Transferring results from one project or location to another was also potentially problematic in that
actual unit costs varied widely across the consortium. However, this was not flagged as a
constraint by respondents – perhaps because such transfers were relatively few and, as
highlighted, there was flexibility in budget implementation to respond to such changes in costs. The
implication of the transfer of beneficiaries for VFM is not entirely clear as the transfer was from an
area of relative underachievement (some Kenyan partners) to an area of significant
overachievement (the DRC sanitation component). The net effect was that SWIFT was more able
to meet its output targets and consequently to receive a higher proportion of the payment for those
beneficiaries, though it is not clear if this transfer of beneficiaries resulted in more people being
reached as a result (as this was in the context of overachievement in DRC).
At the outcome level some partners’ results were assessed jointly (in DRC and in the ASAL in
Kenya) – in effect, meaning that the risk was pooled between them (though partners were clear
that no risk-sharing arrangement was agreed prior to the outcome phase, and that any potential
disallowances would be dealt with on a case-by-case basis). Partners in DRC did not view this as
a major concern as the outcome payments were a small proportion of the overall contract and that
there was a sense that they trusted their consortium partners. This approach to risk sharing at the
Evaluation of the WASH Results Programme SWIFT Case Study
e-Pact 58
outcome level is not seen to have impacted greatly on implementation as partners largely
managed their programmes separately.
As noted earlier, where country partners (notably Oxfam in DRC) worked with implementing
partners they felt it necessary to closely manage operational performance to reduce the risk of
non-delivery, and there were concerns surrounding cascading the greater budget flexibility to the
implementation level without proper controls. For example, the Oxfam DRC field teams and the
implementing partners reportedly had their finance managed quite tightly, though there could be
more changes than under a grant and budgets were updated more often. It is also worth noting
that a key difference between Tearfund and Oxfam is that Oxfam in DRC had local implementing
partners under a grant agreement whereas Tearfund implemented directly, with Oxfam highlighting
that its grant management had to be very tight to minimise the risk of partners not delivering as
their activities were pre-financed by Oxfam.
There were several examples of cases where the risk sharing with DFID came into play in relation
to the programme. As with the partners’ own arrangements on the outcomes, the risk-sharing
arrangements were not clearly outlined at contract stage and were dealt with on a case-by-case
basis, with the MV team often involved in gathering additional evidence to assist in arbitrating on
key decisions related to payment. Section 4.2.4 outlines where flexibility was needed from DFID in
relation to payment; here we discuss how this was situated within the risk-sharing arrangements,
and how these were managed. This is most notable in relation the termination of the Liberia
programme and in the case of the ASAL drought.
Prior to the Ebola outbreak, Liberia was a comparatively low-risk environment. When the
programme in Liberia was terminated the initial reduction in the budget was proposed to be £8
million, though SWIFT later negotiated47 for £1.2 million to be re-allocated back to the budget so
the net reduction was £6.8 million. Between the two contracts the budget for ‘MEAL, admin and
contingency’ remained the same; an increase in the ratio of these costs relative to other
programme expenditure could be interpreted as a worsening of VFM. However, it should also be
noted that the SWIFT price per beneficiary decreased between the two contracts – which would
signal improved VFM. This highlights the difficulty in using price data to meaningfully assess VFM
– a point well captured in SWIFT’s internal mid-term review:
‘[…] there was an apparent improvement in VfM following the removal of the Liberia
component of SWIFT’s contract, when the budget was revised and the price per beneficiary
fell from £27.41 to £23.18. This reduction, which results from removing the relatively higher
cost of reaching beneficiaries in Liberia, cannot meaningfully be said to represent an
increase in the impact on poor people’s lives.’
In the case of the drought in the ASAL region the debate surrounding risk sharing was conducted
in the context of the Q4 2017 verification round and underachievement against the target for
simple water systems in the ASAL. SWIFT partners argued that the drought was exceptional and
that consideration of this fact should be made in deciding the payment amount. As the ASAL
region is known to be a drought-prone region there was some debate as to how reasonable an
argument this was and the MV team were asked to arbitrate by collecting more evidence and
making a judgement on this. Though the conditions as regards what could be considered
exceptional (e.g. is it a once-in-10-, 20-, or 50-year event?) were not specified prior to this
assessment. A summary of the MV team’s assessment is reproduced in Box 7. Consequently,
47 On the grounds of their being sunk start-up and closedown costs.

Evaluation of the WASH Results Programme SWIFT Case Study
e-Pact 59
DFID made adjustments in the payment amount despite SWIFT not meeting its targets – and in
doing so in effect accepted post-hoc some of the financial risk associated with environmental risks.
Box 7: MV assessment of whether the ASAL drought was exceptional for the region
Was the drought exceptional?
‘Although SWIFT had provided some discussion of the drought in the summer of 2017, this was not backed up in its main evidence submission in March 2018. The additional evidence paper presented in May therefore covered this in its first two sections.48 These discussed the context of the drought, and its effects on the population. SWIFT shows, using external and internal references, that the drought was indeed severe, and exacerbated in relation to previous droughts by the growing population and degraded infrastructure. Although it is not clear whether overall numbers affected were as large as in the drought of 2011/12 (called the most serious in 60 years at the time), the 2017 event resulted in 16 million people being food-insecure across Somalia, Ethiopia and Kenya. 2016 had already been dry and rainfall in 2017 was as low as at any time in the previous 36 years, resulting in the failure of the only permanent river in Turkana County.
Turkana, Wajir and Marsabit all had large populations in ‘Crisis’ (Phase 3 of the Integrated Food Security Phase Classification – ‘Emergency’ and ‘Famine’ are Phases 4 and 5). Areas of neighbouring Somalia and the Somali region of Ethiopia entered the ‘Emergency’ phase. At the time of the end-line survey, in November 2017, the drought was still severe, although the worst impacts on food security were past.
MV considers that SWIFT has now presented evidence to show that the drought was severe in relation to previous climate records. A judgement needs to be made as to whether SWIFT should have planned for a drought of this particular severity. In our view the severity of the event was unusual and could not have been expected in a typical five-year period (the period of the WASH Results Programme).’
Source: Annex to verification reports submitted Q4 2017
The case of the drought in the ASAL region highlights some important process-related points:
specifically, that there were not pre-defined standards for arbitrating on such matters, and that the
approach to risk sharing between DFID and SWIFT was on a case-by-case basis and involved the
MV team. This highlights a tension raised by the MV team both at midline and endline related to
the various roles they played: specifically, that there is at least a tension, if not a potential conflict
of interest, in performing the functions of verifying the results, informing key payment decisions,
and advising on programme implementation.
The operationalisation of the modality and the approach to risk sharing within SWIFT was
not seen to have negatively affected implementation, and partners did not raise significant
challenges related to issues such a pre-financing. However, it is noted that in the context of some
partners underachieving there was likely some negative financial consequences (though the risk-
sharing arrangements within SWIFT regarding this aspect – i.e. if partners were compensated for
sunk costs – are unknown to the evaluation team). Risk-sharing arrangements with DFID were
significant in the context of the Liberia programme and the ASAL drought, and the level of risk
sharing was in effect agreed post-hoc and on a case-by-case basis.
48 SWIFT (2018) ‘Effects of the drought – ASAL region’, SWIFT report dated 24 May 2018.

Evaluation of the WASH Results Programme SWIFT Case Study
e-Pact 60
Strength of evidence: suggestive/moderate
Interviews with the country programme management are seen as sufficient to identify the key dimensions related to risk sharing and implementation. However, the evaluation team lack access to the specific details of the – understandably private – agreements between consortium partners, and lack access to the detailed financial data also.
4.3.1.1 Effect of the PbR modality on supplier staff
Being accountable for outcome-phase targets meant that suppliers had to keep up their
engagement with programme communities to ensure the use and functionality of WASH facilities at
least until programme end. From the verifiers’ perspective there was a feeling that, because
implementing agencies knew they were under scrutiny, they had become more diligent in
programme delivery. This is also considered in relation to the verification – which was seen to
enhance accountability. In addition, the verifiers in Kenya also said that they were able to give
useful feedback on technical aspects of what they had seen and learned during field visits, though
they were not supposed to give direct technical advice on anything other than monitoring.
Partners in Kenya highlighted that they tended to give SWIFT priority over their other projects,
given the reputational and financial risks associated with the programme. Alternative resources
were sometimes used to resolve short-term problems, plug gaps, and ensure a smooth flow of
funds. This is understandable given that the WASH Results Programme was a new departure for
the sector, but if all future projects operated on a PbR basis they could not all be given special
treatment.
For some partners – notably Practical Action in Kenya – it was highlighted that an unexpected
benefit of PbR was that it fostered greater collaboration between departments within the
organisation. For example, the M&E team’s and finance team’s functions had greater overlap and
integration.
The combination of outcomes being more rigorously measurement, outcome-level results
being an explicit programme aim (and payments being contingent on deliverables), and the
verification of results is seen to have enhanced the accountability for results.
Strength of evidence: moderate
Key programme staff at all implementation levels interviewed in Kenya and programme management in DRC. Clear feedback on the most significant aspects.
4.3.1.2 Effect of the PbR modality on relationships with partners and government
In the case of Kenya, the INGO partners largely implemented directly, without a lead role for
implementing partners49 or government in output delivery. The urban water supply projects in
Nairobi and ASAL were implemented in close partnership with utilities, which co-financed some
components, but government involvement was more limited in Sanergy operations and the rural
projects. Rural sanitation and hygiene promotion was led by NGO teams, with CHVs and CHEWs
expected to make follow-up and monitoring visits after CLTS triggering; and Public Health Officers
49 Though Concern in Marsabit and Oxfam in Wajir both had local implementing partners during the output phase.

Evaluation of the WASH Results Programme SWIFT Case Study
e-Pact 61
based at sub-county level having a supervisory role and making some joint visits with NGO staff. It
is unclear, however, whether these personnel did in fact play an active role in the programme,
though they had a general responsibility to promote hygiene at community level (amongst other
things) and their reports were used as a source of progress data by SWIFT. Similarly, rural water
supply projects were led by NGO staff. County Water Officers also made some joint monitoring
and supervision visits with NGO personnel but did not play a lead role.
The WSUP project in Nairobi was implemented in close collaboration with the government50, with
an explicit MoU signed between parties outlining responsibilities. NCWSC was overwhelmingly
positive about the relationship with WSUP, and highlighted that this was more collaborative than
with other development partners with whom it works. However, NCWSC did express some
frustration surrounding WSUP being subject to a tight timeline and the implications for NCWSC. In
particular, NCWSC was aware that WSUP was on a PbR contract and was aware of the
implications for timelines, though at points it struggled to marshal the resources it had committed to
the project, which created frustrations on both sides of the partnership.
The programme in DRC had much greater government involvement in implementation (especially
in the case of Tearfund) – though government implementing staff were not interviewed in DRC –
limiting the evaluation team’s ability to comment on the effect of the PbR modality on them. In
DRC, both Tearfund and Oxfam country programme management highlighted that they had
difficulty in communicating the PbR requirements related to verification to their field teams/
partners – in some cases as this elicited push pack from the field teams/partners.
Overall, the PbR modality was not seen as having greatly influenced the modes of working
and the relationship between the partners and government, though cases are noted where
there were some minor issues.
Strength of evidence: suggestive
The programme in Kenya had limited cases where the programme approach closely involved government. Where relevant, local governments were interviewed in the ASAL region and Nairobi regarding their involvement in the programme and generally reported the level of engagement as sufficient. The team have limited evidence related to DRC.
4.3.1.3 Relations with DFID
The relationship with DFID was managed by Oxfam on behalf of the consortium. Broadly speaking,
working relationships within the consortium were harmonious, though some partners noted that at
times they would have preferred a direct relationship with DFID management. One partner
described using its relationships and ‘back channels’ to reach DFID management when they
wanted to raise key points.
4.3.2 Efficiency of management arrangements
Oxfam, as the consortium lead, was responsible for aggregating the results and reporting these to
DFID. Due to the number of projects and verification requirements the project management burden
was reportedly considerable – especially during the output phase, when the verification rounds
50 NCWSC, as with all WSPs in Kenya, is an independent company, though it is owned by the Nairobi government.
Evaluation of the WASH Results Programme SWIFT Case Study
e-Pact 62
were more frequent. There were many meetings of the implementing partners in the early stages,
when operational systems were being established, which were time-consuming, though
appreciated by implementing partners, who said that they were kept well-informed of each other’s
activities and of programme developments generally. As the output phase progressed, the
management burden also involved tracking the progress of each sub-project to ensure that it would
meet its targets and deadlines – and where necessary arranging the transfer of some results to
other partners. It was also noted that the management burden lessened considerably during the
outcome phase, and less time was spent on coordination, joint meetings etc. The partners
collaborated on the outcome surveys but otherwise worked largely independently. Arguably, the
large number of partners in Kenya increased the ratio of management staff to results, which could
be viewed as an area of inefficiency.
Due to the lack of detailed financial data it is extremely difficult for the evaluation to make a
firm appraisal of the efficiency of the management arrangements. The large number of
partners in Kenya arguably may have increased the management burden as it necessitated inter-
agency coordination, though arguably this burden may have been similar within a large programme
implemented by a single organisation.
Strength of evidence: suggestive
Qualitative reflections included from the evaluation team based on interviews. The lack of financial data means these cannot be well evidenced.
4.3.3 Efficiency of programme monitoring
Country programme management staff in both countries and globally consistently highlighted that
the monitoring and verification requirements were greater than expected and one area they initially
under-budgeted for. This was especially the case in the output phase, as compared to the outcome
phase. Implementing partners in Kenya were slower in establishing appropriate monitoring and
reporting requirements under PbR than was the case in DRC. One reason for this, according to
SWIFT management, is that they were given the impression at the planning stage that existing
monitoring systems in Kenya would suffice, but only after the programme began did it become
clear that changes would be needed to meet MVE requirements. Appraisals found, for example,
that partners carried out spot checks on fieldwork but this was ad hoc and inadequate. In DRC,
there were no substantive monitoring systems in place prior to SWIFT so the need to establish
systems which met MV requirements was realised sooner.
Baseline surveys were a particular challenge; some of them proved unacceptable to the verifier –
for example, when there was a mismatch between the communities surveyed and those locations
where work actually went ahead. With regards to output monitoring, the process was described as
quite cumbersome in terms of the number51 of people required to comment on the evidence
prepared for each milestone payment52. Dealing with this level of scrutiny and feedback was very
time-consuming for the implementing partners, though the fixed quarterly timetable for reporting
and verification was generally adhered to.
51 Before or during checks by the verifiers the data would be reviewed, and perhaps commented on, by: the partner NGO’s management at local, national and (often) international level; by SWIFT management at national and global level, including the MEAL service provider (ODI) on some occasions; and sometimes by DFID. 52 Partners used terms such as ‘tedious’ and ‘tiresome’ to describe the reporting requirements introduced under PbR.

Evaluation of the WASH Results Programme SWIFT Case Study
e-Pact 63
The large number of SWIFT partners meant tailored monitoring and verification requirements had
to be developed for each partner (creating a large number of Form 2s). The level of investment
required to develop these forms was relatively fixed in relation to the results, and it was noted that
negotiations with each individual partner surrounding its individual verification requirements was
time-consuming. Similarly, a relatively fixed level of effort was required to conduct the systems
appraisals, in comparison to the results.
The other aspect of the SWIFT verification that may have created inefficiencies was the need to
verify the milestones for ‘intermediate results’ (broadly speaking, preparatory work, designs,
procurement, and triggering) and ‘early sustainability systems’ (broadly speaking, capacity building
activities). As outlined in Section 3.2.2 these are broadly classified as relating to processes or
activities. There was a clear benefit from a supplier perspective to having payments linked to
activities as they had more control over these than either outputs or outcomes, and payments
earlier in the programme improved cash flow. However, beyond the purposes of securing payment
and improving cash flow the rationale for verifying activities is not entirely clear. That is, the
inclusion of these milestones was not seen to significantly influence suppliers’ implementation
approaches, nor is it clear that their inclusion sought to incentivise specific programme elements
that otherwise would not have been addressed.
In summary, there were some potential inefficiencies in the verification under SWIFT. The
large number of consortium partners necessitated the creation of a large number of specifically
tailored verification frameworks, and the inclusion of payments and verification related to process
and activity-related milestones did not clearly contribute to improved results. However, if the
improvement in the general capacity of the sector to conduct better M&E is taken to be an
objective then the additional investment per supplier is more justifiable as in most cases the
verification led to improvements in the respective partners’ monitoring systems.
Strength of evidence: moderate
Qualitative reflections included from the evaluation team based on interviews. However, the lack of financial data means these cannot be well evidenced.
4.3.3.1 Relations with verifiers
The relationship with the verifiers was generally reported to be cordial. However, it was noted
that developing and agreeing the verification protocols and indicators at the start of the programme
was a time-consuming process. It is with noting that verifier staff were all experienced WASH
professionals – both at the global level (the lead verifier) and as regards the country verifiers. A
recurring theme both at the global and country levels is that the verification staff felt they had
relevant advice to offer on programming but were limited by their role, and that there could have
been benefits to a more collaborative relationship, where that experience could have been utilised.

Evaluation of the WASH Results Programme SWIFT Case Study
e-Pact 64
Strength of evidence: moderate
Key verification staff and suppliers both interviewed. There was a gap in not having interviewed the country verifiers in DRC.
4.4 Impacts
Box 8: Overall evaluation questions related to this section’s discussion
DEQ 4.1: How likely was it that the programme would achieve its health and non-health impacts?
DEQ 4.2: Under which circumstances did the WASH Results Programme activities have any unintended/ unplanned positive or negative impacts?
4.4.1 Prospects for health impacts
To what extent have services and behaviours continued to function and be used since their initial implementation (sustainable outcomes)?
The outcome-phase survey results (see Section 4.2.1) across both countries were positive, with
both overachievement against the target as well as high overall functionality (especially with
regards to water and sanitation).
If access to safe water for rural communities is sustained, then this will contribute to safeguarding
the health of the communities concerned. However, the enabling environment for the long-term
operation and maintenance of rural piped schemes remains weak, and recent experience shows
that hand-dug wells are at risk of running dry in times of drought.
Improvements to urban water supply in Lodwar and Kakuma stand a better chance of being
sustained given Oxfam’s holistic approach to capacity building support, which covered not only
technical but also financial and governance aspects of service provision, and included measures to
meet the needs of the poorest service users. The utility supplies continued to function during the
drought (albeit at a reduced level) and there is scope for further improvements to both level of
service and coverage in the coming years, with alternative sources of investment funds potentially
available.
Sanitation improvements in ASAL were mostly on a small scale and only a handful of villages
became open defecation free (ODF). Handwashing facilities were promoted and ‘tippy taps’ were
in place at the sites visited, but many were without water (not surprisingly, given the recent
drought). The provision of latrine slabs (and rings in some locations) undoubtedly benefitted the
communities involved and gave them access to durable facilities, but no means were established
for continuing or scaling up access to these components after SWIFT ended. For all these reasons
it does not seem likely that the rural sanitation and hygiene component will deliver health impacts.
To what extent have the utilisation of water and sanitation services and the uptake of hygiene practices reached all members of target populations (inclusive outcomes)?
The evaluation team, and to an extent the suppliers also, lack detailed data on the distribution of
benefits within communities, particularly as the outcome survey results were population wide.

Evaluation of the WASH Results Programme SWIFT Case Study
e-Pact 65
These outcome survey results, while indicating that the programme likely achieved its functionality
targets, do highlight that within the target population areas there remain many people without
functional services.
In the case of sanitation community-wide safe practices are likely to be important in breaking
faecal-oral transition pathways. The programme in DRC (particularly Tearfund, as against Oxfam)
did place an emphasis on ‘assani’ certification – implying community-wide benefits. Similarly, in the
ASAL region ODF certification became a greater focus in the outcome phase (though this was not
explicitly a programme goal at the outset). These design factors provide suggestive evidence
towards the programme approach striving for community-level outcomes. However, ultimately the
lack of a reliable data source for assessing the intra-community distribution of benefits and
community-level coverage levels hampers this analysis.
To what extent has the programme advocated for, and successfully influenced, attempts to bring sustainable WASH services across entire districts (or beyond)?
In DRC the programme was operating at a comparatively greater scale within the target districts
compared to the programme within Kenya. In neither country was there an explicit advocacy
component though it is noted that the programme approaches used by nearly all53 partners
entailed either close coordination or joint implementation.
What other obstacles exist to the realisation of full potential health benefits of the WASH Results Programme, in areas such as nutrition, shelter, livelihoods, and education?
With the data available to the evaluation team it is not possible to assess the extent of potential
other barriers to health impacts.
Strength of evidence: suggestive
Neither the programme nor the evaluation sought to measure impact-level indicators. The experimental evidence relating to the relationship between WASH outcomes and health impacts is developing and there is an increasing body of evidence supporting which factors are most significant – though the evidence base remains incomplete and there are significant areas of uncertainty.
4.4.2 Equity and inclusion
The framework for assessing extent to which the programme included an equity focus was
developed during the design phase of the evaluation and refined ahead of the endline case
studies. The logic and justification for the indicators included is contained within an annex to the
Evaluation Design Document. The framework was only applied in Kenya, as the remote interviews
with the DRC programme managers did not provide enough insight to reliably apply the framework
there.
4.4.2.1 Extent of focus on inclusion
Broadly speaking, the programme design was seen to support an equity focus – especially with
regards to the location selection (programme targeting). In addition, some project designs included
53 Sanergy and BBCMA are notable exceptions.

Evaluation of the WASH Results Programme SWIFT Case Study
e-Pact 66
specific measures intended to ensure that affordable services could be accessed by the poorest
and/or marginalised members of the targeted communities. For example:
Oxfam’s inclusion of kiosks in improved/expanded piped water supply networks in Lodwar and
Kakuma, Turkana, with water sold at a low fixed rate.
WSUP’s promotion of legal piped connections to shared residential plots in Nairobi slums, paid
for by landlords;
Oxfam and Practical Action’s provision of free slabs (plus rings for pit lining in the case of
Practical Action) to rural ASAL communities in Turkana,54 where soil conditions had earlier
resulted in pit collapse. With this support and continued promotional efforts by health extension
workers, Practical Action made further progress with CLTS, and in Lolupe they reported the
achievement of ODF status across a whole health department unit, comprising 10 communities
and a population of over 26,000. When the evaluation team visited in February 2018, a
government-led team was due to carry out a formal verification the next day.
Sanergy’s strategic shift in focus from pay-and-use public toilets to free-to-use residential
facilities, each located on a shared plot and for the exclusive use of the tenants, with landlords
paying for installation and regular emptying via a lease contract.
Across the SWIFT partners broadly it is the evaluation team’s understanding that output monitoring
did not generate disaggregated beneficiary data. In regard to water and sanitation, multipliers were
used for the populations reached, without monitoring who was and was not excluded from services
within service areas.
54 Concern continued with a subsidy-free approach to CLTS in Marsabit.

Evaluation of the WASH Results Programme SWIFT Case Study
e-Pact 67
Table 19: Framework used to assess equity focus – Kenya
Areas of investigation Achievement
Programme planning and implementation
1. Within targeted locations, did the programme endeavour to meet the needs of all, including communities that were harder to reach or serve?
Yes
2. Was technology selection (where relevant) and detailed design undertaken with the full participation of the intended beneficiaries?
Yes
3. Within targeted communities, did operational approaches address the needs of marginalised groups/households and of those with physical disabilities and infirmities?
Unlikely
4. Did women participate actively in programme implementation and were they adequately represented in decision-making processes?
Somewhat
Monitoring
5. Did monitoring at output level generate disaggregated beneficiary data confirming that the programme provided access to WASH facilities for marginalised groups and those with special needs?
Somewhat
6. Did outcome-phase surveys confirm the use of WASH facilities and adoption of hygienic behaviour by marginalised groups and those with special needs?
n.a.
Addressing institutional barriers
7. Where relevant, did the suppliers, in collaboration with other development agencies, work to strengthen the policy and institutional environment for equity and inclusion?
Unlikely
8. Where discriminatory practices existed within government institutions, did the suppliers advocate for a more inclusive approach? [May be relevant to urban water projects in Kenya, but probably not to other projects]
Yes (WSUP)
Though the partners did not generally track equity-related indicators within routine
monitoring, it was nevertheless evident that SWIFT projects targeted some of the poorest
and most under-served communities in Nairobi and the ASAL region. Generally speaking, the
programme scores well in terms of its pro-poor approach, but we are unaware of specific
measures taken in Kenya to address gender (beyond seeking a gender balance in WUAs) or
disability.
Strength of evidence: suggestive/moderate
There is limited quantitative evidence from either the programme or the evaluation that accurately describes the intra-community or intra-household distribution of benefits. However, there is reasonable evidence supporting the elements of the assessment related to targeting and programme design.
4.4.2.2 Effect of PbR on inclusion focus
As discussed in Section 4.1.2, the PbR modality is not seen to have significantly affected
programme design or the partners’ choice of approaches and locations. Similarly, the PbR
modality is not seen to have greatly influenced the equity elements related to programme design –
though these were positive areas in the equity assessment.
Overall, the PbR modality is not seen to have inhibited the suppliers from including an
equity focus. Similarly, this can be framed in reverse: there was limited evidence that the
Evaluation of the WASH Results Programme SWIFT Case Study
e-Pact 68
PbR modality incentivised an equity focus. This is most explicit in relation to the targets, which
generally did not include any requirements related to equity.
Strength of evidence: moderate
Given the caveats related to quantitatively assessing the level of equity, there was consistent interview evidence on how the PbR modality affected the equity focus.
4.4.3 Unintended positive or negative impacts
No examples were cited by respondents, but it was noted that the Kenya partners’ work with local
health departments enabled their CLTS monitoring system to work, at least at sub-county level in
project locations.
4.5 Sustainability
Box 9: Overall evaluation questions related to this section’s discussion
DEQ 5.1: To what extent were the individual sub-programmes designed and implemented to maximise the likelihood of achieving long-term sustainable WASH outcomes and impacts?
DEQ 5.2: Under which circumstances has the PbR modality affected the likelihood of long-term sustainability of the outcomes and impacts?
DEQ 5.3: Under which circumstances have other programme features affected the likelihood of the long-term sustainability of the outcomes and impacts?
DEQ 5.4: Under which circumstances did the WASH Results Programme contribute to enhanced sector learning to inform better evidence-based WASH policy and programming?
4.5.1 Prospects for sustainability
A risk-based framework was developed by the evaluation team to assess the risks to sustainability.
As with the equity framework the logic and justification for the indicators included is contained
within an annex to the Evaluation Design Document. The framework was only applied in Kenya, as
the remote interviews with the DRC programme managers did not provide sufficient insight to
complete the assessment reliably. Within the Kenya framework the diversity of the projects was
such that a separate assessment was done for each of the partners of groups of partners where
the implementation approach and context was similar.
Annex D to Annex G contain the detailed frameworks, and Table 20 (overleaf) presents the
summary findings. Risks scoring 1–2 are considered to be negligible risks and are colour coded
green; risks scoring 3–4 are considered to be moderate risks and are colour coded amber; risks
scoring 6+ are considered to be high risk areas and colour coded red. The strength of evidence
supporting the assessment is included in parenthesis and is high (H), medium (M), or low (L).
There are some general patterns of note across the SWIFT partners in Kenya:
i) Broadly speaking, the risks at the community level associated with technology choice and
construction, community-level institutions, and behavioural factors are negligible or
moderate.

Evaluation of the WASH Results Programme SWIFT Case Study
e-Pact 69
ii) Community-level risks associated with lifecycle financial costs, operation and maintenance,
and the environment are a concern in many projects.
iii) Risks at the local government and national levels are relatively high in the ASAL region.
iv) The urban projects generally had less prominent risks as compared to the rural projects,
with the exception of those associated with revenues being sufficient to meet lifecycle
costs.
Partners took a strong role in ensuring functionality during the outcome phase, but the real
sustainability challenge comes now that the programme had ended. One finding which is true for
both urban and rural ASAL projects is that the enabling environment for sustainability remains
weak in several key areas:
County governments (particularly water and health departments) have a pivotal role to play in
terms of backup technical support and ongoing sanitation and hygiene promotion to WUAs and
rural communities in general. However, NGOs have very little control or influence over county
government priorities, budget allocations, or responsiveness to community needs, and in the
context of recent devolution local government spending priorities are increasingly politicised.
The remoteness of many rural communities makes it difficult and expensive for them to access
essential hardware and skills. The promotion of small WASH enterprises, as is often done via
sanitation marketing, for example, is probably not viable in such a sparsely populated
environment.
Poverty compounded by environmental fragility poses additional challenges to communities,
with the return of drought being an ever-present risk. Moreover, SWIFT operated alongside
humanitarian relief projects under which communities received direct material assistance and
this can make it doubly difficult to resume a development-oriented approach based on self-
reliance once the emergency is over.
Beyond this, it is difficult to generalise about the risks across such a diverse range of projects, and
the remainder of this section discusses the results by partner.

Evaluation of the WASH Results Programme SWIFT Case Study
e-Pact 70
Table 20: Summary of sustainability risks by partner grouping
Dimension Criteria for assessment
Oxfam ASAL (urban water)
WSUP (urban water)
Sanergy (urban san.)
OxPAC ASAL (rural
san. and hygiene)
OxPAC ASAL (rural water)
User / community level
Functional 1. Are the selected technologies and systems fit-for-purpose and fit-for-context? 2 (H) 3 (M) 3 (H) 2 (H) 2 (M )
2. Is the construction quality of physical infrastructure adequate? 2 (L) 2 (H) 4 (M)
Institutional
3. Are the responsibilities of service users and support organisations clearly and appropriately established?
1 (H) 2 (H) 2 (H) 2 (H) 2 (M)
4. Are service users organised, trained, and equipped to undertake management tasks for which they are competent and capable?
N/A N/A 3 (H) 2 (H) 6 (M)
5. Do service users have the means and mechanisms to report faults and request technical assistance?
2 (M) 2 (H) 3 (H) N/A 3 (H)
Behavioural
6. Has the programme achieved its outcome-level targets? (latrine use; adoption of handwashing with soap; and (where relevant) consumption of safe water)
2 (H) 3 (H) 2 (H) 2 (H) 9 (H)
7. Has there been substantive action during the outcome phase to consolidate latrine use and the adoption of handwashing with soap?
N/A N/A 2 (H) 3 (M) N/A
Financial
8. Did service users make a substantial capital cost contribution? (For household sanitation, this should be the full capital cost, barring cases of exceptional hardship)
3 (M) 1 (H) 2 (H) 2 (H) 4 (L)
9. Is there real demand for the services developed, demonstrated through use and payment of operating / repair / replacement costs?
2 (H) 1 (M) 4 (H) 3 (M) 3 (H)
10. Will funds collected meet the full lifecycle costs? If not, are arrangements in place for the shortfall to be met by local government or another permanent organisation?
6 (L) 4 (L) 9 (M) N/A 6 (M)
Environmental
11. Has the long-term adequacy of the quality and quantity of water resources been assessed and, if necessary, addressed? (Including the possible impact of sanitation)
4 (M) 3 (L) N/A N/A 6 (M)
12. Have the potential impacts of climate change been assessed and addressed in technology choice and system design?
4 (M) 3 (L) N/A N/A 6 (M)
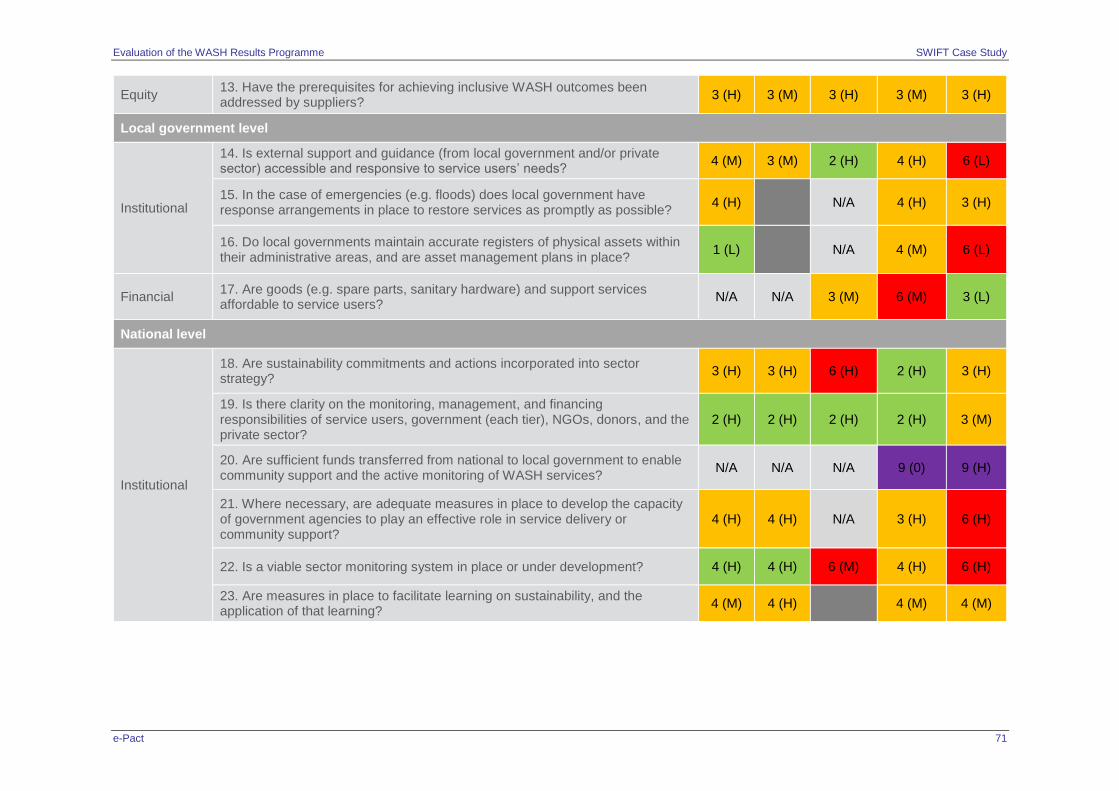
Evaluation of the WASH Results Programme SWIFT Case Study
e-Pact 71
Equity 13. Have the prerequisites for achieving inclusive WASH outcomes been addressed by suppliers?
3 (H) 3 (M) 3 (H) 3 (M) 3 (H)
Local government level
Institutional
14. Is external support and guidance (from local government and/or private sector) accessible and responsive to service users’ needs?
4 (M) 3 (M) 2 (H) 4 (H) 6 (L)
15. In the case of emergencies (e.g. floods) does local government have response arrangements in place to restore services as promptly as possible?
4 (H) N/A 4 (H) 3 (H)
16. Do local governments maintain accurate registers of physical assets within their administrative areas, and are asset management plans in place?
1 (L) N/A 4 (M) 6 (L)
Financial 17. Are goods (e.g. spare parts, sanitary hardware) and support services affordable to service users?
N/A N/A 3 (M) 6 (M) 3 (L)
National level
Institutional
18. Are sustainability commitments and actions incorporated into sector strategy?
3 (H) 3 (H) 6 (H) 2 (H) 3 (H)
19. Is there clarity on the monitoring, management, and financing responsibilities of service users, government (each tier), NGOs, donors, and the private sector?
2 (H) 2 (H) 2 (H) 2 (H) 3 (M)
20. Are sufficient funds transferred from national to local government to enable community support and the active monitoring of WASH services?
N/A N/A N/A 9 (0) 9 (H)
21. Where necessary, are adequate measures in place to develop the capacity of government agencies to play an effective role in service delivery or community support?
4 (H) 4 (H) N/A 3 (H) 6 (H)
22. Is a viable sector monitoring system in place or under development? 4 (H) 4 (H) 6 (M) 4 (H) 6 (H)
23. Are measures in place to facilitate learning on sustainability, and the application of that learning?
4 (M) 4 (H) 4 (M) 4 (M)

Evaluation of the WASH Results Programme SWIFT Case Study
e-Pact 72
ASAL urban water supply (Oxfam)
The findings here are based largely on Oxfam support to the service providers LOWASCO and
KAWASEPRO (the WSPs) in Turkana. These projects are rated low to medium risk in most
aspects, and the only high risks identified concern the sector framework at national level,
specifically the adequacy of government funding to local government agencies and the existence
of a viable sector monitoring system. Oxfam provided considerable support to develop the
technical and managerial capacity of these service providers during the outcome phase. The
support from Oxfam was evident, and the interviewees (particularly in KAWASEPRO) clearly
outlined improvements in processes and revenue collection over the course of SWIFT.
Nonetheless, the region remains drought-prone and the WSPs highlighted that the recent drought
had affected yields and system functionality – with load shedding and water rationing necessary,
alongside emergency distribution through tanker trucks.
Nairobi urban water supply (WSUP)
The sustainability prospects for the Dandora project look very positive: the bulk supply to the
settlement has been improved and the transition from illegal to legal, shared connections is
progressing well. Legal users receive a better service than before, while the utility is increasing its
revenue via metered connections and an improved billing and payment system. Having a utility
sub-office based in the community has been particularly helpful.
If there continued to be large numbers of illegal connections this would be a threat to the
sustainability of the official service, but this risk is now considered low as control measures have
been successfully enforced and the scheme has widespread community support – even some
former cartel members are actively supporting the new arrangements. Losses through leakage
also need to be managed but this, too, is manageable given that most of the distribution network is
new, and bulk meters are being installed at strategic points to help monitor losses.
Another positive is that, while WSUP/NCWSC earlier expected that there would be a continuing
need for kiosks / ATMs in some locations, demand for shared metered connections has been
higher than expected. Following the midline survey, WSUP conducted a small affordability survey,
which found that the connections are affordable for the great majority of residents (landlords pay
for the connections and metered consumption but may pass on some of the costs in increased
rent). This said, there are some people living illegally on railway land at the edge of the settlement,
and NCWSC cannot install services there. Alternative solutions still need to be sought in this
regard.
Nairobi urban sanitation (Sanergy)
When Sanergy made the strategic shift to focus on shared residential toilets, many of the public
toilets established during the output phase closed down due to a drop in demand. (Out of 257 in
total, only 202 were still in operation by February 2018).
While the technical feasibility of FLTs has been established, Sanergy acknowledges that the
service is unlikely to become financially self-sustaining: at present roughly half of the operating
costs are funded by donors. This is viewed as one of the greatest risks to long-term sustainability
at present. Sanergy is in the process of developing its financial exit strategy. Currently, its
operating costs are approximately $20 pppy. Its revenues from running services stands at $12

Evaluation of the WASH Results Programme SWIFT Case Study
e-Pact 73
pppy, with the rest funded from grants and foundations. For reference: $50 pppy is the estimated
cost of operating sewered services in currently non-sewered areas; $12 pppy is the spending
target outlined in the Kenya Environmental Sanitation and Hygiene Policy; and $3 pppy is the
current estimated level of government spending.
Sanergy’s medium-term objective is to further reduce the operating cost through increasing the
density of its network, and to replace the grant funding with a service contract from NCWSC or the
municipality for the provision and emptying of shared residential toilets. It is far from certain that
this will happen, however, given especially that Sanergy serves informal settlements. These are
not a government priority and there is no indication so far that city authorities would be interested
in paying for the service.
ASAL rural sanitation and hygiene promotion (Oxfam, Practical Action, Concern)
The provision of latrine slabs (and rings in some locations) has undoubtedly benefitted the
communities involved but no means were established for continuing or scaling up access to these
components after SWIFT ended. This was a component Oxfam included from the start and
Practical Action added later following repeated latrine collapse. There is a risk that the projects
may have created an expectation that hardware support will continue, which could undermine
promotional efforts that do not offer subsidies. One respondent noted that a number of villages
targeted under SWIFT are located near refugee camps where hardware components for latrine
construction are provided free, and local residents are aware of this. In addition the partners had to
obtain specific permission to use this approach from the county public health authorities, who use
a no-subsidy promotion approach.
The promotion of handwashing with soap in the middle of a drought did not gain much traction, and
partners felt uncomfortable pursuing this component when communities had more urgent priorities.
Many of the latrines built were shared by extended families, and some were built with shallow pits.
These are reportedly filling fast, and it remains to be seen whether the users replace them, though
it should be fairly easy to re-use slabs and superstructures. However, it was noted that in Practical
Action communities there was an appetite to re-construct following collapse. It was reportedly a
criteria of the slab subsidy that a household had tried three times to construct a latrine before the
slab was provided.
ASAL rural water supply (Oxfam, Practical Action, Concern)
The projects scored well in the areas of technology selection (which included the use of high
quality pipes and tanks, plus solar-powered pumping for borehole supplies); allocation of roles and
responsibilities; and outcome target achievement. High risk was identified in relation to service
user capacity for operation and maintenance; cost recovery; external support; and local
government resources for community support.
Oxfam reportedly had many problems with the functionality of solar pumping in Wajir. There were
also problems with two Practical Action solar schemes but the users were able to fix these
themselves. The drought affected hand-dug wells much more than boreholes, which mostly
continued to function. This is reflected in the endline survey results, which highlighted that the
simple systems had a much lower functionality than the more complex (often urban) projects.

Evaluation of the WASH Results Programme SWIFT Case Study
e-Pact 74
There were noticeable differences between the three partners in terms of the level of action taken
in support of sustainability. Oxfam’s outcome-phase activities included substantial efforts to build
the capacity of user groups, county government personnel, and other key actors. Other partners
focused their efforts at community level and had less engagement with government agencies.
Beyond SWIFT, the sustainability model for rural water supply in ASAL generally is not well
defined. In broad terms, it seems that communities are expected to manage simple operation and
maintenance tasks themselves but can call on the county water department in cases where there
is something they cannot manage. If, however, the NGO which installed or improved a scheme is
still present in the locality, the users are more likely to approach them for assistance. Oxfam
respondents said that at times, PbR-related risks led them to fix a water point that should actually
have been dealt with by the county.
In the case of Practical Action, site visits and interviews revealed that the formation and training of
WUAs, and establishment of viable operation and maintenance arrangements, had been quite
problematic. A complicating factor was apparently that, as an NGO, Practical Action was not
allowed to directly facilitate the formation of a WUA; this role fell to the Sub-County Water Officer,
but in one case there was a longstanding dispute between this officer and the community
concerning the WUA membership. Furthermore, repair and maintenance arrangements seemed
rather ad hoc. The Sub-County Water Officer would sometimes respond to repair requests, but
slowly, and their involvement could prove expensive for the community in terms of the expenses
charged. This was clearly highlighted by the fact that DFID had earlier separately funded a system
in one of the same communities where a SWIFT water point was installed using the same
technology (a borehole with solar-powered pumping). At the time the evaluation team conducted
the site visit the system DFID had previously funded was non-functional and had reportedly been
so for the last six months. This was largely attributed by the WUA to the poor relations with the
Sub-County Water Officer. Given that the SWIFT system is in the long run also dependent on the
same institutions for repairs, the risk associated with the institutional support is clear.
It should also be noted that at the time of visiting, Oxfam was in the process of closing its office in
Turkana and handing over the assets to the county authorities. This is associated with its broader
strategic shift to end direct project implementation in WASH or any other sector in Kenya.
Respondents from the county water department indicated that they still needed technical support
for some water point repairs and maintenance and felt that the closure of the Oxfam ASAL office
would leave a gap in the short term. There are in-principle indications that Oxfam will play a
continuing advisory / influencing role in the sector, but no specific plans had been developed at the
time of the evaluation team’s visit.
Overall, the risks to sustainability were variable by partner. However, broadly speaking, it
remains the case that for each partner there remain clear risks to sustainability, though it is
noted that in many cases the highest rated risks are largely associated with financial and
environmental areas related to water. While it is clear that the efforts of the partners in supporting
the WSPs (NCWSC, LOWASCO, and KAWASEPRO) has contributed to an improvement in
revenue collection there remain clear financial pressures highlighted by the WSPs themselves.
Arguably, many of the most salient risks are outside the direct control of the partners.

Evaluation of the WASH Results Programme SWIFT Case Study
e-Pact 75
Strength of evidence: moderate
The diversity of the projects in Kenya poses a challenge to making overall conclusions, though the combination of the evidence of the outcome survey results and interviews build a relatively clear picture by partner. However, the evidence for DRC is more limited.
4.5.1.1 Effect of PbR on sustainability
In the case of the ASAL partners, many highlighted that the length of engagement they had with
the community-based and county-level institutions was longer than in normal programming. This
was attributed to the length of the outcome phase and the fact that the partners remained
accountable for functionality. This particular change in programming can be clearly associated with
the payment structure and incentive created through the output/outcome phase structure of the
programme. However, for rural water supply in the ASAL, concerns remain surrounding the
sustainability of new and improved facilities, irrespective of the PbR modality.
Regarding utility water supply in ASAL, Oxfam has sought to address a range of factors affecting
sustainability, not only technical (by providing high quality, and durable infrastructure) but also
institutional, financial, and socioeconomic, by addressing the needs of the poorest consumers.
However, again, it seems likely that they would have done much the same under grant funding so
long as the programme had a focus on outcomes, not just the delivery of short-term outputs.
Sanergy and WSUP have both put in place measures that support the long-term use and
functionality of shared water points and toilets in slums. However, this is not directly attributable to
features of the PbR modality per se: in both cases it seems highly likely that the partners would
have implemented in a similar way had the programme been grant funded, given how well
developed their implementation approaches were at tender stage, and it seems likely that in both
cases the SWIFT implementation took place within the context of organisation-wide approaches.
Accountability for outcomes incentivised partners to ensure the continued functionality of
water and sanitation facilities up to the end of the outcome phase, though significant efforts
were also made to strengthen the structures for sustainability in the long term.
Strength of evidence: moderate
There was reliable interview evidence on how the PbR modality affected the approach to sustainability.
4.5.1.2 Dissemination and learning
SWIFT has some ongoing operational research in DRC. Learning initiatives in Kenya during the
outcome phase included a cross-country learning event in Nairobi in 2017; Oxfam and Practical
Action are also developing (separate) papers on the applicability of CLTS in ASAL; and Oxfam has
some learning work on utilities via a research project with Oxford University, though this is not part
of SWIFT.
The programme has not (so far) been actively involved in sharing lessons from SWIFT with
national government or other sector stakeholders in Kenya or DRC. The learning partners
and global management highlighted that external learning was not necessarily a focus of the

Evaluation of the WASH Results Programme SWIFT Case Study
e-Pact 76
programme, and that at times the support from ODI was weighted towards strengthening
monitoring over learning, and that much of the key learning was within the SWIFT consortium and
related to how to effectively work under PbR.

Evaluation of the WASH Results Programme SWIFT Case Study
e-Pact 77
Annex A Evaluation questions
Table 21: Evaluation questions
Evaluation question Midline Endline Evaluation
method
High-level evaluation question 1 (HEQ1) Relevance: Were the programme objectives appropriate, and achievable, and to what extent was DFID’s programme design and the consortium sub-programme design consistent with achieving these objectives?
DEQ 1.1: To what extent were the programme objectives clearly articulated?
Document
review
DEQ 1.2: To what extent does the programme’s design (i.e. the theory of change) set out a clear and realistic process for how programme activities were to achieve the intended outputs, outcomes, and impacts?
Document
review
DEQ 1.3: To what extent were the scale and pace of the programme (including the December 2015 deadline) realistic for achieving the intended outputs and outcomes given the capacity of suppliers and their local partners?
Document
review
DEQ 1.4: To what extent was the PbR modality appropriate for achieving sustainable and inclusive WASH outcomes, given the capacity of suppliers and the timeline of the programme?
Process evaluation
DEQ 1.5: How likely was it that the programme design would encourage ‘innovative’ private sector partnerships?
Critique of theory of change
DEQ 1.6: How likely was it that the programme design would encourage suppliers to propose ‘innovative WASH interventions’?
Critique of theory of change
DEQ 1.7: How likely was it that the programme design would encourage inclusive outputs and outcomes?
Critique of theory of change
DEQ 1.8: How appropriate was the WASH Results Programme’s design for achieving the programme ‘learning objectives’?
Critique of theory of change
DEQ 1.9. To what extent was the design of each consortium sub-programme appropriate for achieving DFID’s key objectives?
Critique of theory of change
HEQ2 Effectiveness: To what extent and under which circumstances did the programme operate as intended and which factors helped/hindered the achievement of output and outcome objectives?
DEQ 2.1: Did the programme achieve the intended outputs at scale?
Process
evaluation
DEQ 2.2: To what extent have the utilisation of water and sanitation services and the uptake of hygiene practices reached all members of target populations (inclusive outcomes)?
Process
evaluation
DEQ 2.3: To what extent have services continued to function and have behaviours continued to be used since their initial implementation (sustainable outcomes)?
Wording updated
Process evaluation
DEQ 2.4: How did programme design and external factors affect the achievement of output and outcome objectives within consortia sub-programmes?
Contribution
analysis
DEQ 2.5: Under which circumstances did the PbR framework help/hinder the achievement of intended outputs and outcomes?
Contribution
analysis

Evaluation of the WASH Results Programme SWIFT Case Study
e-Pact 78
DEQ 2.6: Under which circumstances did the PbR framework affect the quality of programme implementation (positive or negative)?
Contribution
analysis
DEQ 2.7: Under which circumstances did suppliers implement innovative approaches and focus on learning?
Process
evaluation
HEQ3 Efficiency: Has the programme been designed and implemented in a cost-efficient manner?
DEQ 3.1: How efficient was the tendering and procurement process and what effect did this have on programme delivery?
Process
evaluation
DEQ 3.2: To what extent were the individual sub-programmes designed and delivered in a cost-efficient and cost-effective manner?
Removed n/a
DEQ 3.3: Under which circumstances did the PbR modality affect the cost-efficiency and cost-effectiveness of individual sub-programmes?
Removed n/a
DEQ 3.4: Under which circumstances did the PbR modality strengthen the programme monitoring and management arrangements of individual sub-programmes?
Wording updated
Process evaluation
DEQ 3.5: Under which circumstances did key programme features affect cost-efficiency and cost-effectiveness?
DEQ 3.6: Under which circumstances did consortium complexity affect the efficiency of the programme management arrangements of individual sub-programmes?
Wording updated
Process evaluation
DEQ 3.7: To the extent new PbR risk-sharing arrangements were applied within consortia, how did this affect programme delivery?
(New
evaluation question)
Process evaluation
HEQ4 Impact: How likely is it that the programme will achieve its final impact objectives while minimising unintended negative consequences?
DEQ 4.1: How likely is it that the programme will achieve its health and non-health impacts?
Process
evaluation
DEQ 4.2: Under which circumstances did the WASH Results Programme activities have any unintended/ unplanned positive or negative impacts?
Impact
assessment
HEQ5 Sustainability: How likely is it that the WASH outcomes achieved by the programme will be sustained beyond the end of the programme in 2018?
DEQ 5.1: To what extent were the individual sub-programmes designed and implemented to maximise the likelihood of achieving long-term sustainable WASH outcomes and impacts?
Process
evaluation
DEQ 5.2: Under which circumstances has the PbR modality affected the likelihood of the long-term sustainability of the outcomes and impacts?
Process
evaluation
DEQ 5.3: Under which circumstances have other programme features affected the likelihood of the long-term sustainability of the outcomes and impacts?
Process
evaluation
DEQ 5.4: Under which circumstances did the WASH Results Programme contribute to enhanced sector learning to inform better evidence-based WASH policy and programming?
Wording updated
Process evaluation

Evaluation of the WASH Results Programme SWIFT Case Study
e-Pact 79
Annex B Framework for assessing the prospects for inclusive WASH: SWIFT Kenya (overall)
Areas of investigation
Achievement
Justification Strength
of evidence
Low (1)
Medium (2)
High (3)
Programme planning and implementation
1. Within targeted locations, did the programme endeavour to meet the needs of all, including communities that were harder to reach or serve?
SWIFT targeted some of the poorest and most under-served urban and rural communities in Kenya. When improving networked services, the needs of the poorest customers were prioritised while sanitation interventions sought to achieve ODF status village-wide.
H
2. Was technology selection (where relevant) and detailed design undertaken with the full participation of the intended beneficiaries?
Operational approaches were highly participatory and this included consultation on technology selection where relevant: very detailed in the case of Sanergy and WSUP, and Oxfam/Practical Action when resolving the problems of pit collapse in ASAL).
M
3. Within targeted communities, did operational approaches address the needs of marginalised groups/households, and of those with physical disabilities and infirmities?
No evidence identified of specific measures taken to do this. M
4. Did women participate actively in programme implementation and were they adequately represented in decision-making processes?
Partners sought to achieve gender balance in WUAs / user groups but, beyond this, little evidence of specific measures in this area.
L
Monitoring
5. Did monitoring at output level generate disaggregated beneficiary data confirming that the programme provided access to WASH facilities for marginalised groups and those with special needs?
Internal narrative reports include monitoring of inclusion. Survey reports presented disaggregated data.
H
6. Did outcome-phase surveys confirm the use of WASH facilities and the adoption of hygienic behaviour by marginalised groups and those with special needs?
n.a. Insufficient evidence to score – outcome survey reports not seen and these aspects were beyond the scope of outcome verification.
L
Addressing institutional barriers
7. Where relevant, did the suppliers, in collaboration with other development agencies, work to strengthen the policy and institutional environment for equity and inclusion?
In Kenya, the programme did not include any advocacy policy level.
H
8. Where discriminatory practices existed within government institutions, did the suppliers advocate for a more inclusive approach? [May be relevant to urban water projects in Kenya, but probably not to other projects]
(WSUP) Again, this was not part of the programme strategy, except in the case of WSUP, which encouraged and supported the legalisation of water connections in informal settlements.
M

Evaluation of the WASH Results Programme SWIFT Case Study
e-Pact 80
Annex C Sustainability risk framework: Oxfam ASAL (urban water supply)
Aspect Areas of investigation Likelihood
(1-3)
Consequence
(1-3)
Risk55
(1-9) Justification
Strength of
evidence
User / community level
Functional
1. Are the selected technologies and systems fit-for-purpose and fit-for-context?
1 2 2 1. Are the selected technologies and systems fit-for-purpose and fit-for-context?
1
2. Is the construction quality of physical infrastructure adequate?
1 2 2 2. Is the construction quality of physical infrastructure adequate?
1
Institutional
3. Are the responsibilities of service users and support organisations clearly and appropriately established?
1 1 1 3. Are the responsibilities of service users and support organisations clearly and appropriately established?
1
4. Are service users organised, trained, and equipped to undertake management tasks for which they are competent and capable?
N/A 4. Are service users organised, trained, and equipped to undertake management tasks for which they are competent and capable?
N/A
5. Do service users have the means and mechanisms to report faults and request technical assistance?
1 2 2 5. Do service users have the means and mechanisms to report faults and request technical assistance?
1
Behavioural
6. Has the programme achieved its outcome-level targets? (latrine use; adoption of handwashing with soap; and (where relevant) consumption of safe water).
1 2 2
6. Has the programme achieved its outcome-level targets? (latrine use; adoption of handwashing with soap; and (where relevant) consumption of safe water).
1
7. Has there been substantive action during the outcome phase to consolidate latrine use and the adoption of handwashing with soap?
N/A 7. Has there been substantive action during the outcome phase to consolidate latrine use and the adoption of handwashing with soap?
N/A
Financial
8. Did service users make a substantial capital cost contribution? (For household sanitation, this should be the full capital cost, barring cases of exceptional hardship).
3 1 3
8. Did service users make a substantial capital cost contribution? (For household sanitation, this should be the full capital cost, barring cases of exceptional hardship).
3
9. Is there real demand for the services developed, demonstrated through use and payment of operating / repair / replacement costs?
1 2 2
9. Is there real demand for the services developed, demonstrated through use and payment of operating / repair / replacement costs?
1
10. Will funds collected meet the full lifecycle costs? If not, are arrangements in place for
2 3 6 10. Will funds collected meet the full lifecycle costs? If not, are arrangements in place for the
2
55 Risk is calculated as the product of the likelihood and consequence scores.

Evaluation of the WASH Results Programme SWIFT Case Study
e-Pact 81
the shortfall to be met by local government or another permanent organisation?
shortfall to be met by local government or another permanent organisation?
Environmental
11. Has the long-term adequacy of the quality and quantity of water resources been assessed and, if necessary, addressed? (Including the possible impact of sanitation).
2 2 4
11. Has the long-term adequacy of the quality and quantity of water resources been assessed and, if necessary, addressed? (Including the possible impact of sanitation).
2
12. Have the potential impacts of climate change been assessed and addressed in technology choice and system design?
2 2 4 No assessments carried out under SWIFT, but services remained functional during the recent drought, with reduced yield.
M
Equity 13. Have the prerequisites for achieving inclusive WASH outcomes been addressed by suppliers?
1 3 3 SWIFT support sought to ensure that service improvements benefit all, including very low-income users.
H
Local government level
Institutional
14. Is external support and guidance (from local government and/or private sector) accessible and responsive to service users’ needs?
2 2 4
Local government has limited technical and financial capacity for technical support; however, this is available to some extent from regional and central government (e.g. the regulator and Water Sector Trust Fund).
M
15. In the case of emergencies (e.g. floods) does local government have response arrangements in place to restore services as promptly as possible?
N/A Not directly relevant to urban piped schemes under utility management.
16. Do local governments maintain accurate registers of physical assets within their administrative areas, and are asset management plans in place?
1 1 1
Registers not seen but SWIFT has provided training and guidance on a range of technical and managerial issues, including asset management. Technology choice and network size mean that asset management is relatively simple.
L
Financial 17. Are goods (e.g. spare parts, sanitary hardware) and support services affordable to service users?
N/A Not relevant since these are utility-operated services.
M
National level
Institutional
18. Are sustainability commitments and actions incorporated into sector strategy?
1 3 3 Sector strategy aims to ensure that utilities become viable businesses that are technically and financially sustainable.
H
19. Is there clarity on the monitoring, management, and financing responsibilities of service users, government (each tier), NGOs, donors, and the private sector?
1 2 2
Regulatory system is in place and operational for formal utilities such as these, which are obliged to meet targets for key performance indicators.
H
20. Are sufficient funds transferred from national to local government to enable
N/A Not directly relevant to networked utility services.

Evaluation of the WASH Results Programme SWIFT Case Study
e-Pact 82
community support and the active monitoring of WASH services?
21. Where necessary, are adequate measures in place to develop the capacity of government agencies to play an effective role in service delivery or community support?
2 2 4 Central government offers some level of technical and capacity building support to utilities, e.g. via the Water Sector Trust Fund.
H
22. Is a viable sector monitoring system in place or under development?
1 2 2 System in place though not fully functional nationwide.
H
23. Are measures in place to facilitate learning on sustainability, and the application of that learning?
2 2 4 In place to some extent via regulator (WASREB) and Water Sector Trust Fund.
M
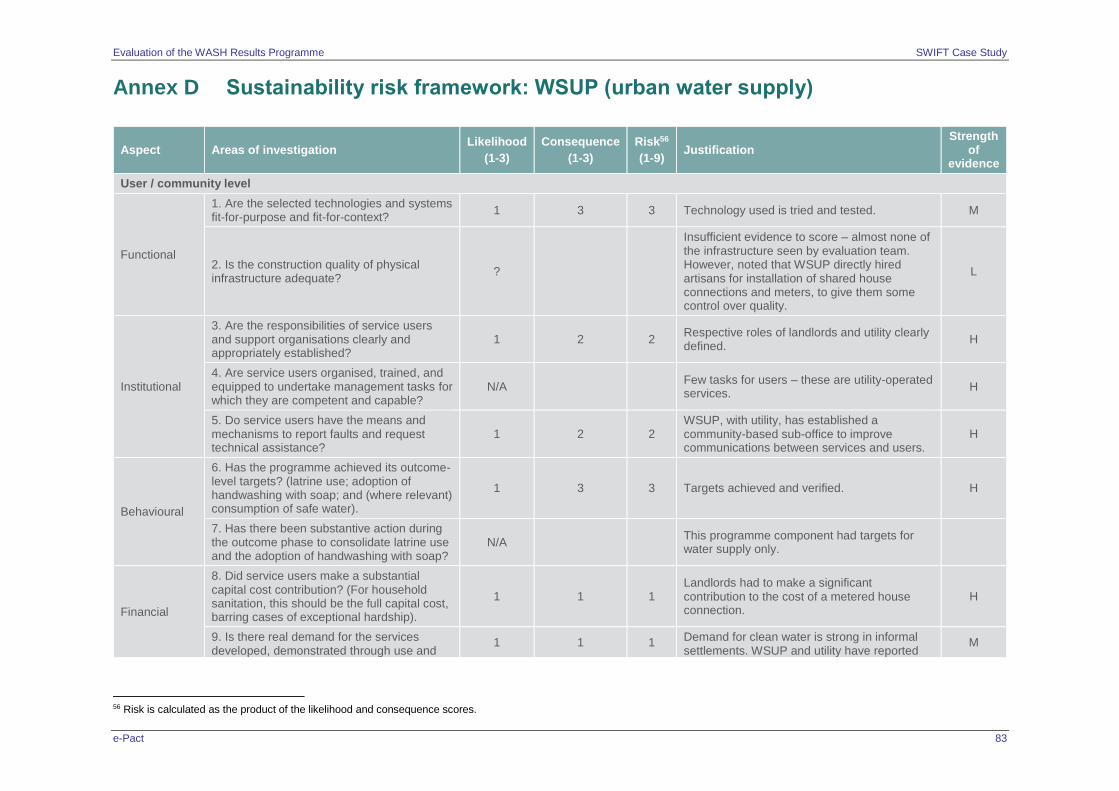
Evaluation of the WASH Results Programme SWIFT Case Study
e-Pact 83
Annex D Sustainability risk framework: WSUP (urban water supply)
Aspect Areas of investigation Likelihood
(1-3)
Consequence
(1-3)
Risk56
(1-9) Justification
Strength of
evidence
User / community level
Functional
1. Are the selected technologies and systems fit-for-purpose and fit-for-context?
1 3 3 Technology used is tried and tested. M
2. Is the construction quality of physical infrastructure adequate?
?
Insufficient evidence to score – almost none of the infrastructure seen by evaluation team. However, noted that WSUP directly hired artisans for installation of shared house connections and meters, to give them some control over quality.
L
Institutional
3. Are the responsibilities of service users and support organisations clearly and appropriately established?
1 2 2 Respective roles of landlords and utility clearly defined.
H
4. Are service users organised, trained, and equipped to undertake management tasks for which they are competent and capable?
N/A Few tasks for users – these are utility-operated services.
H
5. Do service users have the means and mechanisms to report faults and request technical assistance?
1 2 2 WSUP, with utility, has established a community-based sub-office to improve communications between services and users.
H
Behavioural
6. Has the programme achieved its outcome-level targets? (latrine use; adoption of handwashing with soap; and (where relevant) consumption of safe water).
1 3 3 Targets achieved and verified. H
7. Has there been substantive action during the outcome phase to consolidate latrine use and the adoption of handwashing with soap?
N/A This programme component had targets for water supply only.
Financial
8. Did service users make a substantial capital cost contribution? (For household sanitation, this should be the full capital cost, barring cases of exceptional hardship).
1 1 1 Landlords had to make a significant contribution to the cost of a metered house connection.
H
9. Is there real demand for the services developed, demonstrated through use and
1 1 1 Demand for clean water is strong in informal settlements. WSUP and utility have reported
M
56 Risk is calculated as the product of the likelihood and consequence scores.

Evaluation of the WASH Results Programme SWIFT Case Study
e-Pact 84
payment of operating / repair / replacement costs?
substantially increased revenue from Dandora since the new services were introduced.
10. Will funds collected meet the full lifecycle costs? If not, are arrangements in place for the shortfall to be met by local government or another permanent organisation?
2 2 4
Insufficient data available to know whether full lifecycle costs will be recovered, but indications are that revenue from Dandora will be much greater than before.
L
Environmental
11. Has the long-term adequacy of the quality and quantity of water resources been assessed and, if necessary, addressed? (Including the possible impact of sanitation).
1 3 3
No information available on assessments, but these services from part of the overall service provision for Nairobi as a whole. Considerable technical assistance and external funding has been (and continues to be) provided to the utility to improve the coverage, quality, and reliability of services.
L
12. Have the potential impacts of climate change been assessed and addressed in technology choice and system design?
1 3 Comments as for water resource management.
L
Equity 13. Have the prerequisites for achieving inclusive WASH outcomes been addressed by the suppliers?
1 3 3
The targeted settlement is overwhelmingly poor and the intervention was designed to meet the needs of all. Take-up by landlords has been higher than expected but the intention is to provide alternative water points (e.g. public standposts, water vending machines) for any remaining unserved households.
M
Local government level
Institutional
14. Is external support and guidance (from local government and/or private sector) accessible and responsive to service users’ needs?
1 3 3
The utility is in the process of taking over from WSUP and intends to retain a sub-office in the settlement. It is also introducing communication with users via SMS and online.
M
15. In the case of emergencies (e.g. floods) does local government have response arrangements in place to restore services as promptly as possible?
? Insufficient information to score.
16. Do local governments maintain accurate registers of physical assets within their administrative areas, and are asset management plans in place?
? Insufficient information to score, though full details of assets improved under SWIFT are available.
Financial 17. Are goods (e.g. spare parts, sanitary hardware) and support services affordable to service users?
N/A Not relevant since this is a utility-operated service. Users are not expected to source their own meters.
M
National level

Evaluation of the WASH Results Programme SWIFT Case Study
e-Pact 85
Institutional
18. Are sustainability commitments and actions incorporated into sector strategy?
1 3 3 Sector strategy aims to ensure that utilities become viable businesses that are technically and financially sustainable.
H
19. Is there clarity on the monitoring, management, and financing responsibilities of service users, government (each tier), NGOs, donors, and the private sector?
1 2 2
Regulatory system is in place and operational for formal utilities such as these, which are obliged to meet targets for key performance indicators.
H
20. Are sufficient funds transferred from national to local government to enable community support and the active monitoring of WASH services?
N/A Not directly relevant to networked utility services.
21. Where necessary, are adequate measures in place to develop the capacity of government agencies to play an effective role in service delivery or community support?
2 2 4
NCWSC is receiving substantial external technical and financial support. In addition, central government offers some level of technical and capacity building support to utilities, e.g. via Water Sector Trust Fund.
H
22. Is a viable sector monitoring system in place or under development?
1 2 2 System in place though not fully functional nationwide.
H
23. Are measures in place to facilitate learning on sustainability, and the application of that learning?
2 2 4 In place to some extent via regulator (WASREB) and Water Sector Trust Fund.
H

Evaluation of the WASH Results Programme SWIFT Case Study
e-Pact 86
Annex E Sustainability risk framework: Sanergy (urban sanitation)
Aspect Areas of investigation Likelihood
(1-3)
Consequence
(1-3)
Risk57
(1-9) Justification
Strength of
evidence
User / community level
Functional
1. Are the selected technologies and systems fit-for-purpose and fit-for-context?
1 3 3
Sanergy worked intensively to develop and test appropriate technology options and services for public and domestic sanitation in informal urban settlements.
H
2. Is the construction quality of physical infrastructure adequate?
1 2 2 Quality is closely monitored. Designs and operational processes are adapted as necessary.
H
Institutional
3. Are the responsibilities of service users and support organisations clearly and appropriately established?
1 2 2
Services are either franchised to FLT operators, who collect user fees (public toilets), or offered on a lease contract to residential landlords (shared domestic toilets, no user fees).
H
4. Are service users organised, trained, and equipped to undertake management tasks for which they are competent and capable?
1 3 3 Training and mentoring for FLT operators is integral to Sanergy’s operational approach.
H
5. Do service users have the means and mechanisms to report faults and request technical assistance?
1 3 3 Sanergy maintains close contact with FLT operators – many are met on a daily basis.
H
Behavioural
6. Has the programme achieved its outcome-level targets? (latrine use; adoption of handwashing with soap; and (where relevant) consumption of safe water).
2 1 2
Final verified results show only a small shortfall.
H
7. Has there been substantive action during the outcome phase to consolidate latrine use and the adoption of handwashing with soap?
1 2 2
Sanergy has ongoing dialogue with FLT operators and landlords who lease shared toilets, to promote and guide their effective use. In this project, the focus is not directly on toilet users.
H
Financial
8. Did service users make a substantial capital cost contribution? (For household sanitation, this should be the full capital cost, barring cases of exceptional hardship).
1 2 2
FLT operators have to make a large capital outlay in order to become franchisees, while landlords pay a significant monthly charge for Sanergy services.
H
57 Risk is calculated as the product of the likelihood and consequence scores.
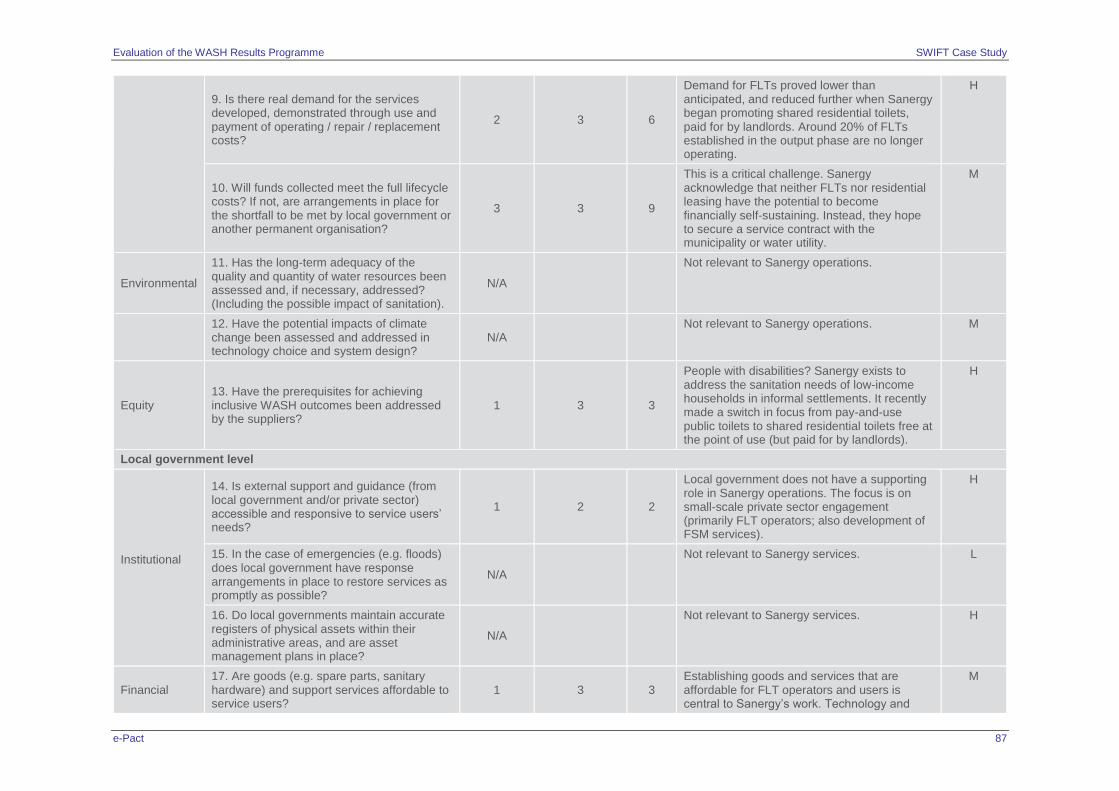
Evaluation of the WASH Results Programme SWIFT Case Study
e-Pact 87
9. Is there real demand for the services developed, demonstrated through use and payment of operating / repair / replacement costs?
2 3 6
Demand for FLTs proved lower than anticipated, and reduced further when Sanergy began promoting shared residential toilets, paid for by landlords. Around 20% of FLTs established in the output phase are no longer operating.
H
10. Will funds collected meet the full lifecycle costs? If not, are arrangements in place for the shortfall to be met by local government or another permanent organisation?
3 3 9
This is a critical challenge. Sanergy acknowledge that neither FLTs nor residential leasing have the potential to become financially self-sustaining. Instead, they hope to secure a service contract with the municipality or water utility.
M
Environmental
11. Has the long-term adequacy of the quality and quantity of water resources been assessed and, if necessary, addressed? (Including the possible impact of sanitation).
N/A
Not relevant to Sanergy operations.
12. Have the potential impacts of climate change been assessed and addressed in technology choice and system design?
N/A Not relevant to Sanergy operations. M
Equity 13. Have the prerequisites for achieving inclusive WASH outcomes been addressed by the suppliers?
1 3 3
People with disabilities? Sanergy exists to address the sanitation needs of low-income households in informal settlements. It recently made a switch in focus from pay-and-use public toilets to shared residential toilets free at the point of use (but paid for by landlords).
H
Local government level
Institutional
14. Is external support and guidance (from local government and/or private sector) accessible and responsive to service users’ needs?
1 2 2
Local government does not have a supporting role in Sanergy operations. The focus is on small-scale private sector engagement (primarily FLT operators; also development of FSM services).
H
15. In the case of emergencies (e.g. floods) does local government have response arrangements in place to restore services as promptly as possible?
N/A
Not relevant to Sanergy services. L
16. Do local governments maintain accurate registers of physical assets within their administrative areas, and are asset management plans in place?
N/A
Not relevant to Sanergy services. H
Financial 17. Are goods (e.g. spare parts, sanitary hardware) and support services affordable to service users?
1 3 3 Establishing goods and services that are affordable for FLT operators and users is central to Sanergy’s work. Technology and
M
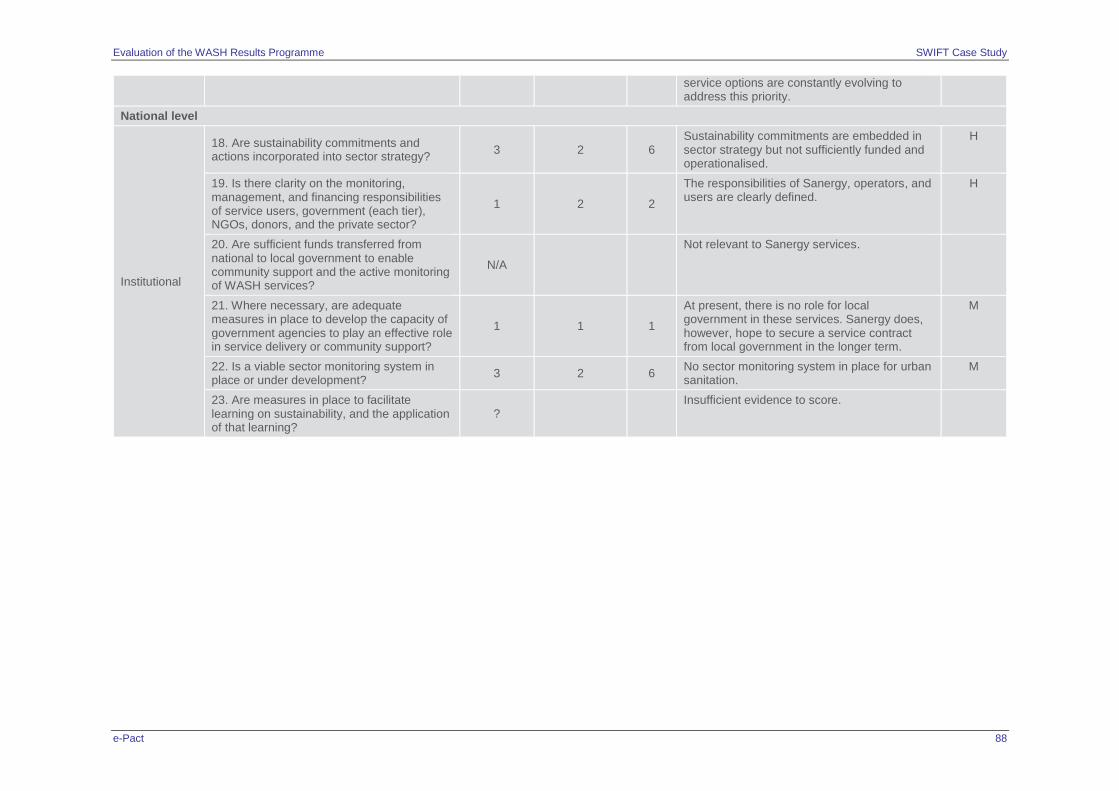
Evaluation of the WASH Results Programme SWIFT Case Study
e-Pact 88
service options are constantly evolving to address this priority.
National level
Institutional
18. Are sustainability commitments and actions incorporated into sector strategy?
3 2 6 Sustainability commitments are embedded in sector strategy but not sufficiently funded and operationalised.
H
19. Is there clarity on the monitoring, management, and financing responsibilities of service users, government (each tier), NGOs, donors, and the private sector?
1 2 2
The responsibilities of Sanergy, operators, and users are clearly defined.
H
20. Are sufficient funds transferred from national to local government to enable community support and the active monitoring of WASH services?
N/A
Not relevant to Sanergy services.
21. Where necessary, are adequate measures in place to develop the capacity of government agencies to play an effective role in service delivery or community support?
1 1 1
At present, there is no role for local government in these services. Sanergy does, however, hope to secure a service contract from local government in the longer term.
M
22. Is a viable sector monitoring system in place or under development?
3 2 6 No sector monitoring system in place for urban sanitation.
M
23. Are measures in place to facilitate learning on sustainability, and the application of that learning?
? Insufficient evidence to score.

Evaluation of the WASH Results Programme SWIFT Case Study
e-Pact 89
Annex F Sustainability risk framework: OxPAC ASAL (rural sanitation and hygiene)
Aspect Areas of investigation Likelihood
(1-3)
Consequence
(1-3)
Risk58
(1-9) Justification
Strength of
evidence
User / community level
Functional
1. Are the selected technologies and systems fit-for-purpose and fit-for-context?
1 2 2 SWIFT promotes simple technologies and designs using locally available (often free) materials.
H
2. Is the construction quality of physical infrastructure adequate?
2 2 4
There have been some problems with pit collapse in selected locations due to sandy soil. Oxfam and Practical Action provided slabs and (in the case of Practical Action) rings for pit lining to address this.
M
Institutional
3. Are the responsibilities of service users and support organisations clearly and appropriately established?
2 2 4
Maintenance of private toilets is a household responsibility. Pit emptying services might be needed in the long term, but most rural households have space to dig new pits when the first one fills.
H
4. Are service users organised, trained, and equipped to undertake management tasks for which they are competent and capable?
1 2 2
Management tasks are very simple and can be dealt with by households individually (though FSM will be an issue in the longer term).
H
5. Do service users have the means and mechanisms to report faults and request technical assistance?
2 2 4
Households could ask for assistance from sub-county health staff after the NGO has left. However, there is no guarantee that any support would be provided, as health departments are under-resourced.
H
Behavioural
6. Has the programme achieved its outcome level targets? (latrine use; adoption of handwashing with soap; and (where relevant) consumption of safe water).
1 2 2
Final verification report confirms that outcome targets were achieved.
H
7. Has there been substantive action during the outcome phase to consolidate latrine use and the adoption of handwashing with soap?
1 3 3 CPs sought to ensure that latrine use continued to the end of the outcome phase. Practical Action reported
M
58 Risk is calculated as the product of the likelihood and consequence scores.

Evaluation of the WASH Results Programme SWIFT Case Study
e-Pact 90
achievement of a fully ODF unit (10 communities) during the outcome phase.
Financial
8. Did service users make a substantial capital cost contribution? (For household sanitation, this should be the full capital cost, barring cases of exceptional hardship).
1 2 2
Oxfam provided free slabs in Turkana; Practical Action provided slabs and rings in locations where pits built earlier under SWIFT had collapsed, but pit digging and superstructures were paid for entirely by households.
H
9. Is there real demand for the services developed, demonstrated through use and payment of operating / repair / replacement costs?
2 3 6
Verified results indicate that the vast majority of toilets have remained functional and in use throughout the outcome phase. Sector experience suggests a risk of post-project slippage remains: for example, when pits fill or if superstructures are damaged by rains.
M
10. Will funds collected meet the full lifecycle costs? If not, are arrangements in place for the shortfall to be met by local government or another permanent organisation?
N/A
Not applicable to private household facilities.
Environmental
11. Has the long-term adequacy of the quality and quantity of water resources been assessed and, if necessary, addressed? (Including the possible impact of sanitation).
N/A
Not relevant to rural household sanitation.
12. Have the potential impacts of climate change been assessed and addressed in technology choice and system design?
N/A Not relevant to rural household sanitation.
Equity 13. Have the prerequisites for achieving inclusive WASH outcomes been addressed by the suppliers?
1 3 3
Efforts were made to ensure that all community members could access toilets. This often involved sharing within extended families.
M
Local government level
Institutional
14. Is external support and guidance (from local government and/or private sector) accessible and responsive to service users’ needs?
2 2 4
In principle, the health department should provide technical assistance and ongoing hygiene promotion, but there is no assurance that this will happen, even though there is a national ‘ODF 2020’ commitment. Health departments are severely under-resourced.
H
15. In the case of emergencies (e.g. floods) does local government have response arrangements in place to restore services as promptly as possible?
2 2 4 Government is under-resourced to provide effective emergency response. However, considerable technical and financial
H

Evaluation of the WASH Results Programme SWIFT Case Study
e-Pact 91
support is available in emergencies from external agencies.
16. Do local governments maintain accurate registers of physical assets within their administrative areas, and are asset management plans in place?
2 2 4
Health departments have data on toilets built under SWIFT, but probably not for the county as a whole.
M
Financial 17. Are goods (e.g. spare parts, sanitary hardware) and support services affordable to service users?
3 3 6
Basic pit latrines can be made at low cost using locally available (mostly free) materials. However, concrete slabs and pit linings are probably not affordable for many rural households.
M
National level
Institutional
18. Are sustainability commitments and actions incorporated into sector strategy?
1 3 3 Sustainability commitments are embedded in sector strategy but not sufficiently funded and operationalised.
H
19. Is there clarity on the monitoring, management, and financing responsibilities of service users, government (each tier), NGOs, donors, and the private sector?
1 2 2
Construction and maintenance of domestic toilets is widely acknowledged as a household responsibility, with the health department responsible for sanitation and hygiene promotion. However, no FSM services have been established in the ASAL.
H
20. Are sufficient funds transferred from national to local government to enable community support and the active monitoring of WASH services?
3 3 9 These services remain chronically under-funded despite recent progress in decentralisation.
21. Where necessary, are adequate measures in place to develop the capacity of government agencies to play an effective role in service delivery or community support?
2 2 4
External support agencies have provided valuable support in selected locations, but no funded national / regional programme(s) are in place for this.
H
22. Is a viable sector monitoring system in place or under development?
1 2 2 A national CLTS monitoring system exits but its operation around the country is patchy.
H
23. Are measures in place to facilitate learning on sustainability, and the application of that learning?
2 2 4
A number of external agencies have supported, and continue to support, learning on achieving and sustaining ODF status.
M

Evaluation of the WASH Results Programme SWIFT Case Study
e-Pact 92
Annex G Sustainability risk framework: OxPAC ASAL (rural water supply)
Aspect Areas of investigation Likelihood
(1-3)
Consequence
(1-3)
Risk59
(1-9) Justification
Strength of
evidence
User / community level
Functional
1. Are the selected technologies and systems fit-for-purpose and fit-for-context?
1 2 2
Use of hybrid solar pumping for borehole-fed piped schemes, but also some dug wells with handpumps, which are more vulnerable to the effects of drought.
M
2. Is the construction quality of physical infrastructure adequate?
?
Insufficient evidence to score, as very few schemes seen. However, there is anecdotal evidence of technical problems with some new schemes (yield, reliability, solar-powered pumping).
L
Institutional
3. Are the responsibilities of service users and support organisations clearly and appropriately established?
1 2 2 Broad division of roles and responsibilities between WUAs and county government is generally understood.
M
4. Are service users organised, trained, and equipped to undertake management tasks for which they are competent and capable?
2 3 6 WUAs formed and trained during output phase, then strengthened during outcome phase.
M
5. Do service users have the means and mechanisms to report faults and request technical assistance?
1 3 3
WUAs can request assistance from Sub-County Water Office and/or implementing NGO (if still present), though government response may be slow.
H
Behavioural
6. Has the programme achieved its outcome-level targets? (latrine use; adoption of handwashing with soap; and (where relevant) consumption of safe water).
1 2 2
Verification confirms outcome targets met. H
7. Has there been substantive action during the outcome phase to consolidate latrine use and the adoption of handwashing with soap?
N/A Not relevant to water supply.
Financial
8. Did service users make a substantial capital cost contribution? (For household sanitation, this should be the full capital cost, barring cases of exceptional hardship).
2 2 4
Contributions mostly in the form of labour? (Need more information on this.)
L
1 3 3 ASAL region faces severe water supply challenges, hence very high demand for
H
59 Risk is calculated as the product of the likelihood and consequence scores.

Evaluation of the WASH Results Programme SWIFT Case Study
e-Pact 93
9. Is there real demand for the services developed, demonstrated through use and payment of operating / repair / replacement costs?
improved services. Some level of revenue connection by WUA established for all/most schemes.
10. Will funds collected meet the full lifecycle costs? If not, are arrangements in place for the shortfall to be met by local government or another permanent organisation?
2 3 6
Very unlikely that revenue would fund full lifecycle costs. Expectation is that county government or NGOs will fund major repairs and replacements, but this is not assured.
M
Environmental
11. Has the long-term adequacy of the quality and quantity of water resources been assessed and, if necessary, addressed? (Including the possible impact of sanitation).
2 3 6
No water resource assessments carried out by SWIFT in ASAL; however, WRM challenges are well known and have been under assessment for many years by multiple agencies. Given the area is drought-prone the risk is seen to be high.
M
12. Have the potential impacts of climate change been assessed and addressed in technology choice and system design? 2 3 6
Some water systems installed under SWIFT mostly remained functional during drought, though with reduced yield; some did not. Programme also installed hand-dug wells, which proved less resilient to drought.
M
Equity 13. Have the prerequisites for achieving inclusive WASH outcomes been addressed by the suppliers?
1 3 3 Programme has sought to ensure that services are accessible and affordable for all.
H
Local government level
Institutional
14. Is external support and guidance (from local government and/or private sector) accessible and responsive to service users’ needs?
2 3 6
Sub-County Water Offices accessible but unpredictable and sometimes very slow in their response to requests for assistance. County government charges for assistance are sometimes prohibitive.
L
15. In the case of emergencies (e.g. floods) does local government have response arrangements in place to restore services as promptly as possible?
1 3 3
Government is under-resourced to provide effective emergency response. However, considerable technical and financial support is available in ASAL from external agencies, to supplement government resources.
H
16. Do local governments maintain accurate registers of physical assets within their administrative areas, and are asset management plans in place?
3 2 6
County governments do not have updated asset registers.
L
Financial 17. Are goods (e.g. spare parts, sanitary hardware) and support services affordable for service users?
1 3 3
Essential spare parts for RWS are generally available in market centres, from county government or external support agencies. However, many communities are in remote locations far from these suppliers.
L
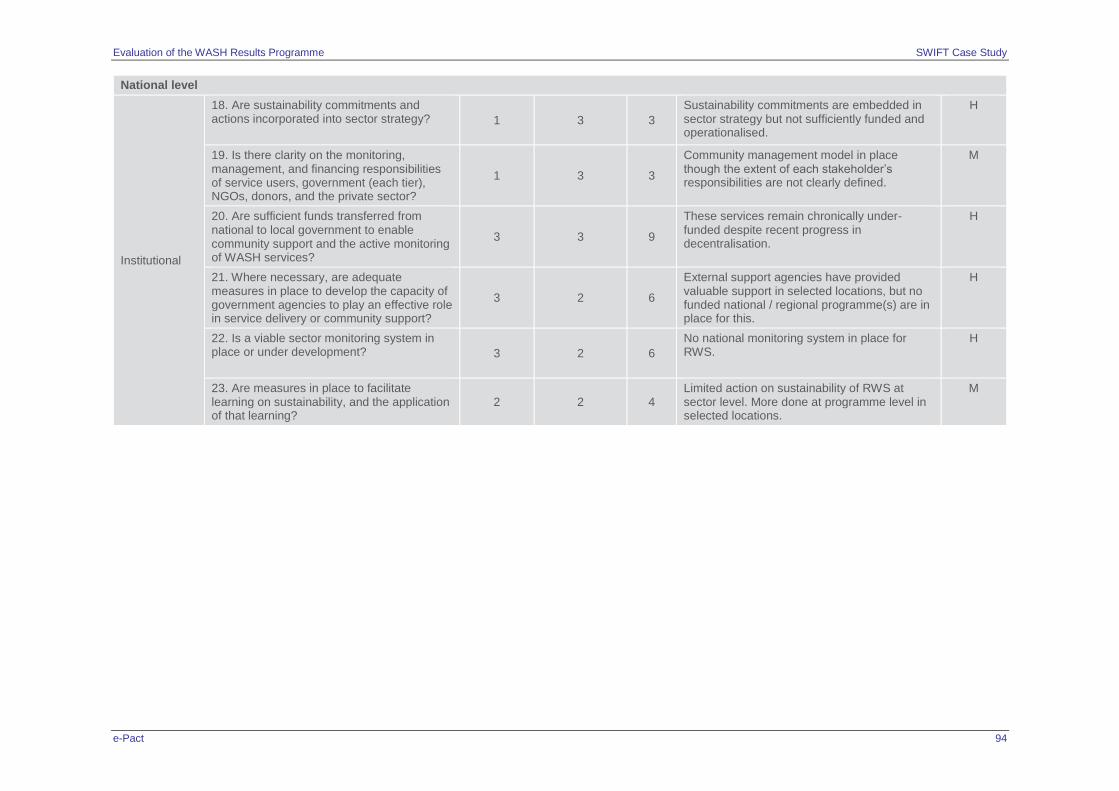
Evaluation of the WASH Results Programme SWIFT Case Study
e-Pact 94
National level
Institutional
18. Are sustainability commitments and actions incorporated into sector strategy?
1 3 3
Sustainability commitments are embedded in sector strategy but not sufficiently funded and operationalised.
H
19. Is there clarity on the monitoring, management, and financing responsibilities of service users, government (each tier), NGOs, donors, and the private sector?
1 3 3
Community management model in place though the extent of each stakeholder’s responsibilities are not clearly defined.
M
20. Are sufficient funds transferred from national to local government to enable community support and the active monitoring of WASH services?
3 3 9
These services remain chronically under-funded despite recent progress in decentralisation.
H
21. Where necessary, are adequate measures in place to develop the capacity of government agencies to play an effective role in service delivery or community support?
3 2 6
External support agencies have provided valuable support in selected locations, but no funded national / regional programme(s) are in place for this.
H
22. Is a viable sector monitoring system in place or under development?
3 2 6
No national monitoring system in place for RWS.
H
23. Are measures in place to facilitate learning on sustainability, and the application of that learning?
2 2 4 Limited action on sustainability of RWS at sector level. More done at programme level in selected locations.
M