monitoring capability for volcanic eruptions: limb...
TRANSCRIPT

October 2007 Atmospheric Limb Workshop
Adam E. Bourassa Limb Scanning Satellites
Monitoring capability for volcanic eruptions: Limb scanning satellites
Adam E. Bourassa and the OSIRIS Team
University of Saskatchewan, Canada
Keck Institute for Space Studies
Monitoring of Geoengineering Effects and their Natural and Anthropogenic Analogues
November 15-16, 2011

October 2007 Atmospheric Limb Workshop
Adam E. Bourassa Limb Scanning Satellites
The Limb View
A view of the Earth’s limb from the ISS
0.5 º

October 2007 Atmospheric Limb Workshop
Adam E. Bourassa Limb Scanning Satellites
The Limb View of the Atmosphere
Earth Radius
(about 6370 km)
Low Earth Orbit
(about 600 km)
0.5º
30 km at the Tangent Point
Rule of Thumb: 1 arcminute ≈ 1 km at the tangent point

October 2007 Atmospheric Limb Workshop
Adam E. Bourassa Limb Scanning Satellites
Solar Occultation
• A long term measurement standard (1970’s) for ozone and aerosol profiles
• Stability – inherent calibration and pointing information
• High vertical resolution (around 1 km)
• Relatively poor global coverage
• Two profiles per orbit: observed sunrise and sunset
• Solar Occultation Missions • SAM II, 1978 – 1993 • SAGE II, 1984 – 2005 • SAGE III, 2002 – 2006 • HALOE, 1991 – 2005 • POAM II/III, 1993 – 2005 • ACE, 2003 – current
• The future?
• SAGE III on ISS in 2014
• CASS (ACE-FTS2 + OSIRIS2) ?

October 2007 Atmospheric Limb Workshop
Adam E. Bourassa Limb Scanning Satellites
Solar Occultation
From Assessment of Stratospheric Aerosol Properties, SPARC Report, Ed. Thomason

SAGE III on ISS
Mission Implementation
Partners LaRC (Science; Project Management; System Engineering and Mission Design; SMA; I&T; Launch Support; Mission Operations; Science Data Processing and Delivery) JSC/ISSP (System Engineering Support, Hexapod Pointing System and ISS mounting adaptors, ISS Mounting Location, Launch Processing and Access to Space, Infrastructure and Telemetry Data)
Launch August 2014 (Space X)
Orbit ISS Mid-Inclination orbit
Life 3 years (nominal) / ISS manifest through 2020 for extended mission
Payload Sensor Assembly (LaRC), Hexapod (ESA), CMP (LaRC), ExPA (JSC/ISS), ICE (LaRC), HEU (ESA), IAM (LaRC), DMP (LaRC), Nadir Viewing Platform (LaRC)
Data
Solar Occultation: Multi-wavelength Aerosol Extinction, O3, NO2, H2O Lunar Occultation: O3, NO2, NO3 Limb Scatter: Multi-wavelength Radiance
Primary Science Objective: Monitor the vertical distribution of aerosol, ozone and other trace gases in Earth’s stratosphere and troposphere to enhance understanding of ozone recovery and climate change processes in the upper atmosphere
SAGE III on ISS directly supports NASA Strategic Goals to extend and
sustain human activities across the solar system; expand scientific
understanding of the Earth and the universe in which we live
www-sage3oniss.larc.nasa.gov
www-sage3oniss.larc.nasa.gov

The Inclined ISS Orbit is Ideal for
SAGE III measurements

• SAGE III has been maintained at NASA LaRC
• Hexapod has been maintained at Thales / Alenia in Turin Italy
Mission Foundation is Based on Existing Flight Hardware
October 2007 Atmospheric Limb Workshop
Adam E. Bourassa Limb Scanning Satellites
Limb Scattering
Earth Radius
(about 6370 km)
Low Earth Orbit
(about 600 km)
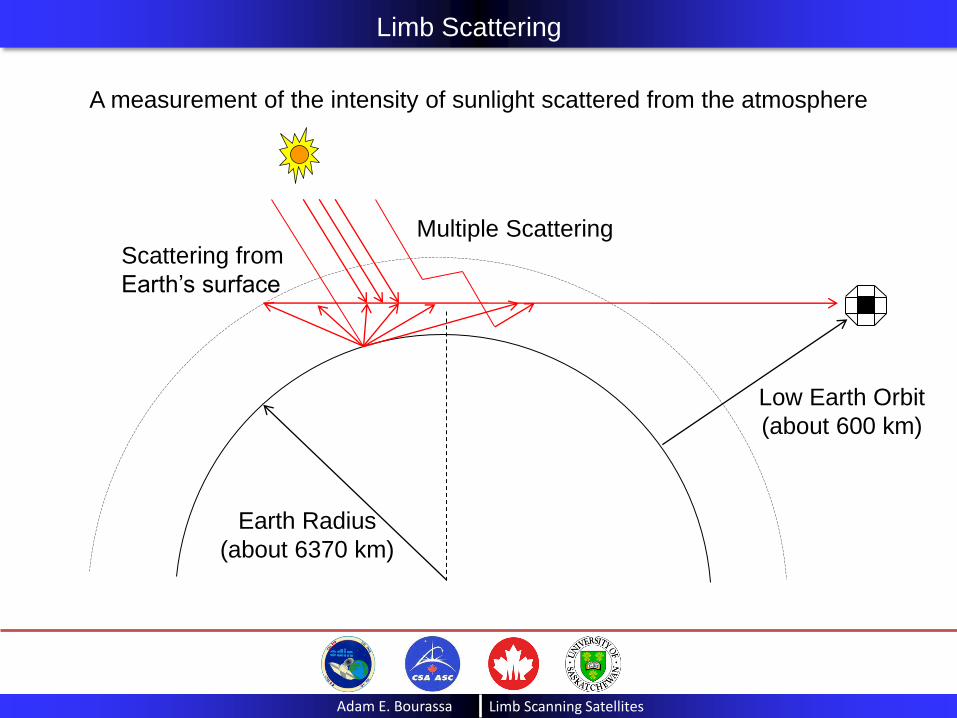
A measurement of the intensity of sunlight scattered from the atmosphere
Scattering from
Earth’s surface
Multiple Scattering

October 2007 Atmospheric Limb Workshop
Adam E. Bourassa Limb Scanning Satellites
• A non-linear inverse problem
The measured spectra
The physics of limb scattered sunlight
Our desired parameter (the aerosol state)
All other inputs
Measuring Aerosols with Limb Scatter
• What is the physics? The Radiative Transfer Equation

October 2007 Atmospheric Limb Workshop
Adam E. Bourassa Limb Scanning Satellites
The source term arises from the incident sunlight:
The source term results from scattering of incoming radiation into all directions.
At a scattering volume, the sun is incident from exactly one direction:
Single Scattering in the Atmosphere
The phase function, , defines the probability of scattering in a direction.

October 2007 Atmospheric Limb Workshop
Adam E. Bourassa Limb Scanning Satellites
The source term is radiation scattered from atmosphere and earth surface:
The total source term is the sum of the scattering of radiation from every incoming
direction into every outgoing direction.
At a scattering volume, radiation is coming from all directions.
Ray tracing computer model: discretize the parameters and the integrals.
Multiple Scattering in the Atmosphere
October 2007 Atmospheric Limb Workshop
Adam E. Bourassa Limb Scanning Satellites
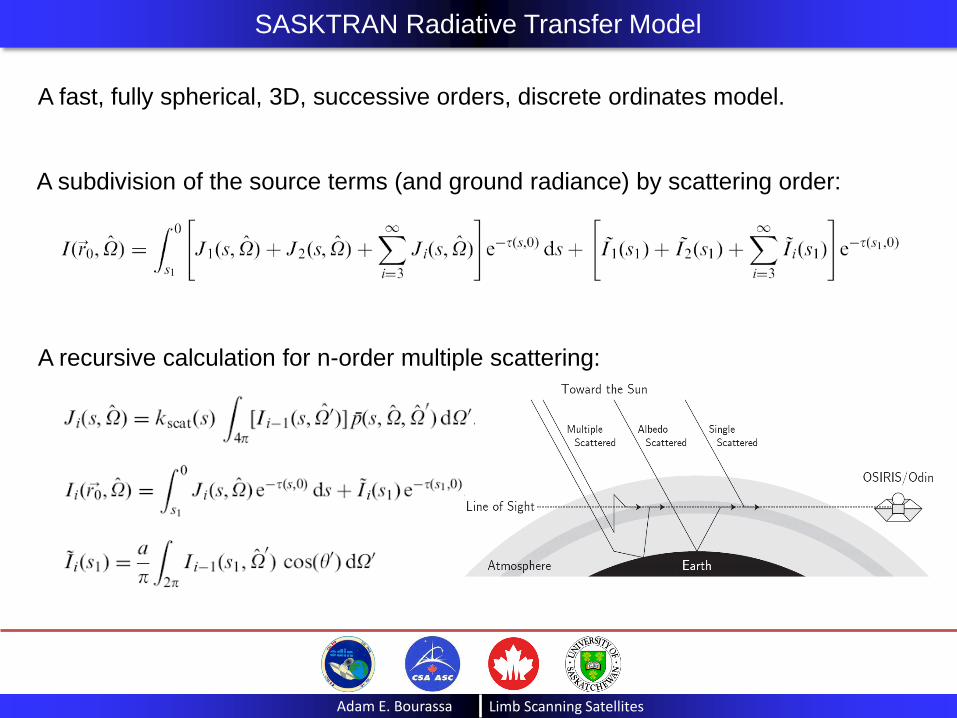
SASKTRAN Radiative Transfer Model
A subdivision of the source terms (and ground radiance) by scattering order:
A recursive calculation for n-order multiple scattering:
A fast, fully spherical, 3D, successive orders, discrete ordinates model.

October 2007 Atmospheric Limb Workshop
Adam E. Bourassa Limb Scanning Satellites
OSIRIS on Odin
Optical Spectrograph and Infrared Imager System (OSIRIS)
OSIRIS does limb scanning and limb imaging
1) Optical Spectrograph
•Single line of sight, narrow horizontal slit
•Grating spectrograph, 280-810 nm, 1 nm res
•Auto-exposed limb scan
2) Infrared Imager
•Three channel filtered vertical imager
•1.26 and 1.27 μm O2(1D) emission
•1.53 μm OH emission and scattered sunlight
Launch 2001 – 100% aeronomy measurements since 2007
MART Version 5.0 retrievals fully processed including
aerosol extinction coefficient at 750 nm

October 2007 Atmospheric Limb Workshop
Adam E. Bourassa Limb Scanning Satellites
The Limb Scatter Signature of Stratospheric Aerosol
Aerosol Weighting Functions (Jacobian)
•Visible/NIR stratospheric aerosol
signal is well characterized by Mie
scattering (liquid droplets around
0.1 to 0.3 micron radius)
•Cross section spectrum is a
relatively weak function of
wavelength
•Enhancement and attenuation
effects that depend on (aerosol)
optical depth

October 2007 Atmospheric Limb Workshop
Adam E. Bourassa Limb Scanning Satellites
300 400 500 600 700 8000
0.5
1
1.5
2
2.5
Lim
b R
ad
ian
ce
Wavelength (nm)
Modeled Limb Radiance (1013
photons/s/cm2/nm/sterad)
clean atmosphere
background aerosol
Typical limb spectrum at 22 km tangent altitude
calculated with the SASKTRAN Radiative Transfer Model
The OSIRIS Aerosol Retrieval: Methodology
)(
)(log
)(
)(log
1
2
1
2
R
R
I
I
I
Iy
)( 1I )( 2I
The Measurement Vector
)(RI Model with no aerosol
Effectively a measure of the residual
scattering (positive Jacobian required)

October 2007 Atmospheric Limb Workshop
Adam E. Bourassa Limb Scanning Satellites
OSIRIS Aerosol Retrieval: Error Analysis
• Newly developed precision analysis for MART V5.01 Processing
• Numerical estimate of the co-variance matrix
• Propagation of the Level 1 error bar (random error) to the state parameter
• Linearization of the inversion about the retrieved state
10 15 20 25 3010
15
20
25
30
Altitude (km)
Tangent
Altitude (
km
)
-1 -0.5 0 0.5 1 1.5 210
15
20
25
30
Co-variance
40027015
-1.5
-1
-0.5
0
0.5
1
1.5

October 2007 Atmospheric Limb Workshop
Adam E. Bourassa Limb Scanning Satellites
OSIRIS Aerosol Retrieval: Error Analysis
Statistics for 765 “Matched Pairs” in 2008 for latitudes 0 to 10 N
-0.15 -0.1 -0.05 0 0.05 0.1 0.1510
15
20
25
30
35
40T
angent
Altitude (
km
)
750 nm Aerosol Extinction (10-3
km-1
)
-0.4 -0.3 -0.2 -0.1 0 0.1 0.2 0.3 0.4
Relative Precision
Thermal Tropopause
Matching Pair Statistics
Numerical Estimate
Thermal Tropopause
Matching Pair Statistics
Numerical Estimate

October 2007 Atmospheric Limb Workshop
Adam E. Bourassa Limb Scanning Satellites
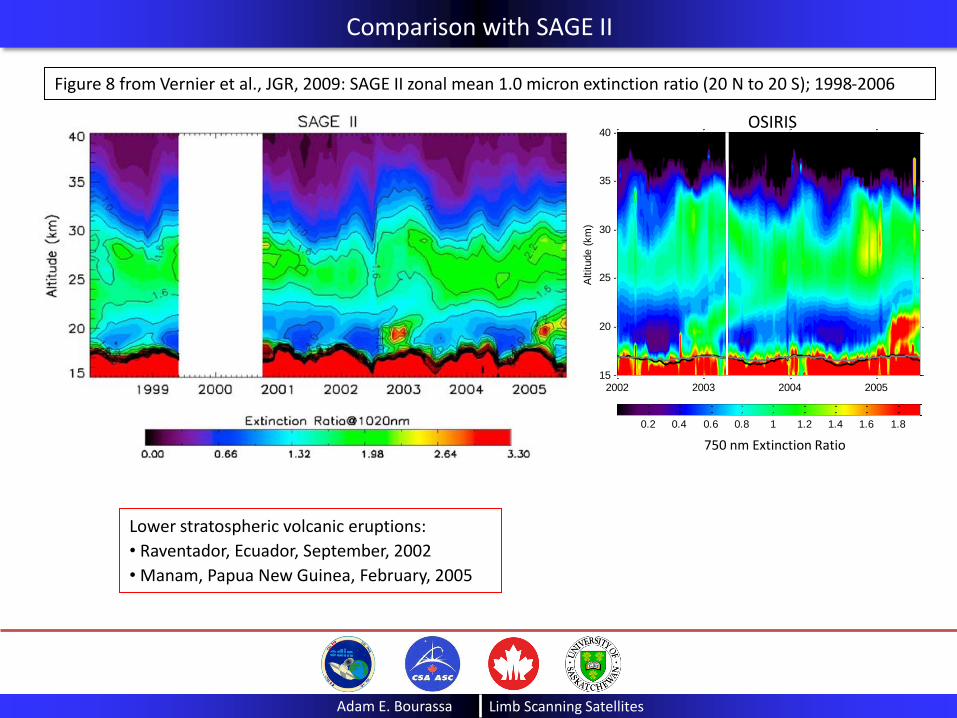
Comparison with SAGE II
Figure 8 from Vernier et al., JGR, 2009: SAGE II zonal mean 1.0 micron extinction ratio (20 N to 20 S); 1998-2006
Lower stratospheric volcanic eruptions:
• Raventador, Ecuador, September, 2002
• Manam, Papua New Guinea, February, 2005
October 2007 Atmospheric Limb Workshop
Adam E. Bourassa Limb Scanning Satellites
Comparison with SAGE II
Figure 8 from Vernier et al., JGR, 2009: SAGE II zonal mean 1.0 micron extinction ratio (20 N to 20 S); 1998-2006
Lower stratospheric volcanic eruptions:
• Raventador, Ecuador, September, 2002
• Manam, Papua New Guinea, February, 2005 A
ltitude (
km
)
2002 2003 2004 200515
20
25
30
35
40
0.2 0.4 0.6 0.8 1 1.2 1.4 1.6 1.8
OSIRIS
750 nm Extinction Ratio

October 2007 Atmospheric Limb Workshop
Adam E. Bourassa Limb Scanning Satellites
Comparison with CALIPSO
Figure 9 from Vernier et al., JGR, 2009: CALIOP zonal average scattering ratio for 16 day time periods throughout 2007
• Early 2007: Aerosol layer from
Montserrat 10 months post-eruption
confined in high altitude tropical
stratospheric reservoir with relatively
clean TTL
• Later 2007: Double horned vertical
propagation towards subtropics in
westerly phase of QBO
-50 0 50
20
30
40
-50 0 50
20
30
40
-50 0 50
20
30
40
-50 0 50
20
30
40
-50 0 50
20
30
40
-50 0 50
20
30
40
October 2007 Atmospheric Limb Workshop
Adam E. Bourassa Limb Scanning Satellites
0 1 2 3 4 5
x 10-4
10
15
20
25
30
35
750 nm Extinction (km-1)
Altitude (
km
)
0 1 2 3 4 5
x 10-4
750 nm Extinction (km-1)
10
15
20
25
30
35
Altitude (
km
)
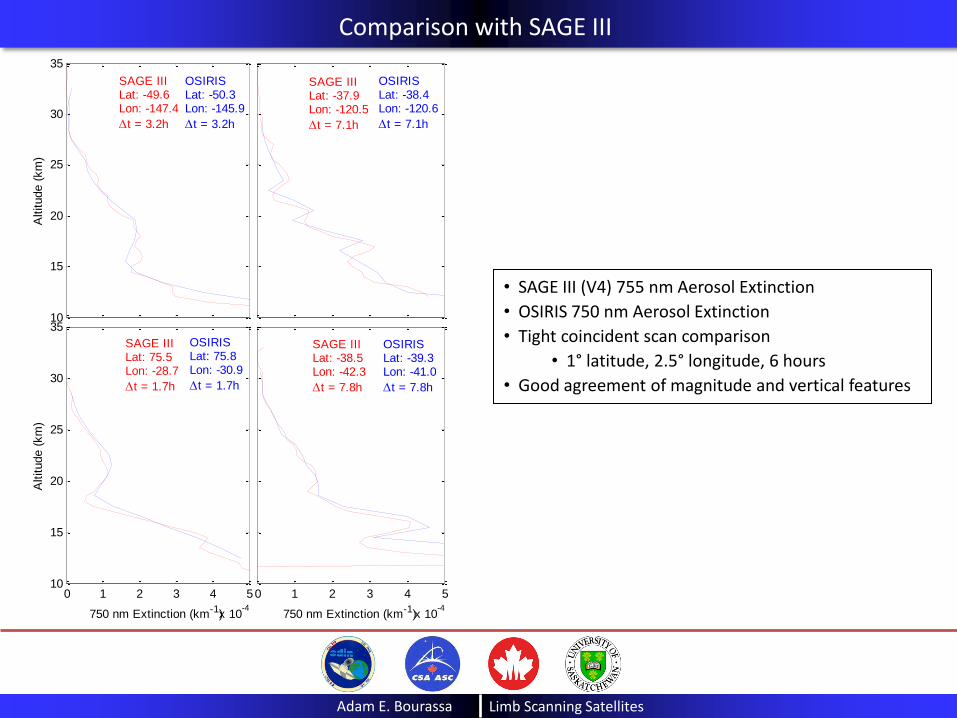
OSIRISLat: -38.4Lon: -120.6
t = 7.1h
OSIRISLat: -39.3Lon: -41.0
t = 7.8h
OSIRISLat: 75.8Lon: -30.9
t = 1.7h
SAGE IIILat: -37.9Lon: -120.5
t = 7.1h
SAGE IIILat: -38.5Lon: -42.3
t = 7.8h
SAGE IIILat: 75.5Lon: -28.7
t = 1.7h
SAGE IIILat: -49.6Lon: -147.4
t = 3.2h
OSIRISLat: -50.3Lon: -145.9
t = 3.2h
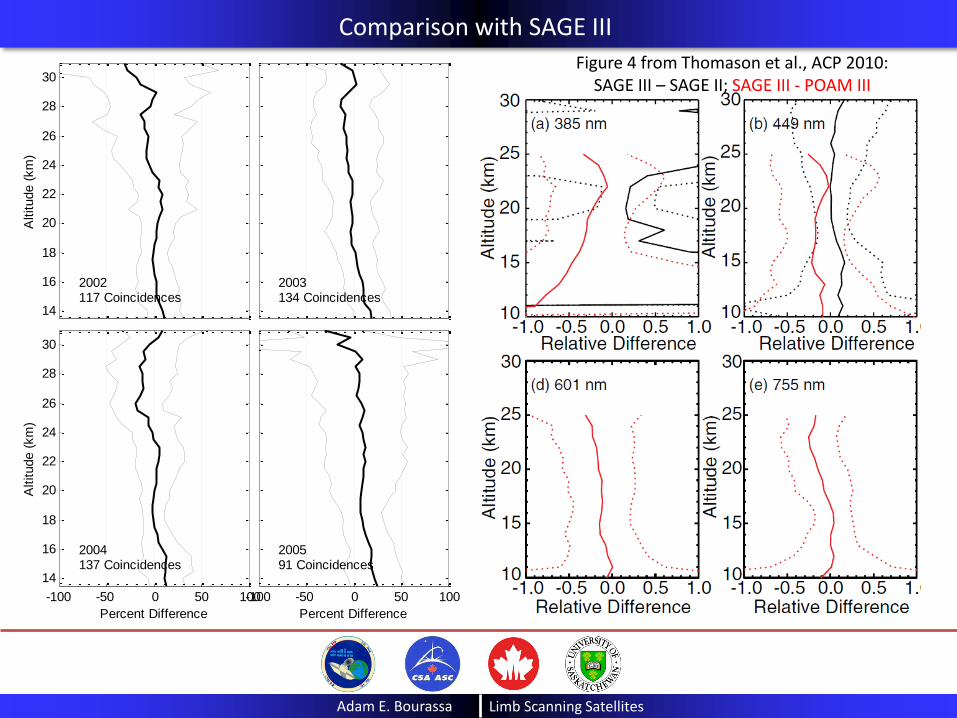
Comparison with SAGE III
• SAGE III (V4) 755 nm Aerosol Extinction
• OSIRIS 750 nm Aerosol Extinction
• Tight coincident scan comparison
• 1° latitude, 2.5° longitude, 6 hours
• Good agreement of magnitude and vertical features

October 2007 Atmospheric Limb Workshop
Adam E. Bourassa Limb Scanning Satellites
Comparison with SAGE III
14
16
18
20
22
24
26
28
30
2002117 Coincidences
Altitude (
km
)
2003134 Coincidences
-100 -50 0 50 100
14
16
18
20
22
24
26
28
30
2004137 Coincidences
Altitude (
km
)
Percent Difference
-100 -50 0 50 100
200591 Coincidences
Percent Difference
Figure 4 from Thomason et al., ACP 2010: SAGE III – SAGE II; SAGE III - POAM III

October 2007 Atmospheric Limb Workshop
Adam E. Bourassa Limb Scanning Satellites
10-6
10-5
10-4
10-3
SA
GE
III
755 n
m E
xtinction (
km
-1)
2002# of points: 2609Mean: 1.062Std Dev: 0.39544
2003# of points: 3622Mean: 1.0356Std Dev: 0.33764
10-6
10-5
10-4
10-3
10-6
10-5
10-4
10-3
OSIRIS 750 nm Extinction (km-1)
SA
GE
III
755 n
m E
xtinction (
km
-1)
2004# of points: 3236Mean: 1.044Std Dev: 0.27802
10-6
10-5
10-4
10-3
OSIRIS 750 nm Extinction (km-1)
2005# of points: 2302Mean: 1.2189Std Dev: 0.63488
10km
20km
30km
40km
Comparison with SAGE III
SAGE III vs OSIRIS for 2002-2005

October 2007 Atmospheric Limb Workshop
Adam E. Bourassa Limb Scanning Satellites
Comparison with SAGE III – Zonal Average Time Series
30
60
90
De
gre
es
10
20
30
Altitu
de
(km
)
SAGE III
10
20
30
Altitu
de
(km
)
OSIRIS
Jun02 Jun03 Jun04 Jun0510
20
30
Time
Altitu
de
(km
)
Rel Diff
Latitude (N)
OSIRIS SZA
0
0.2
0.4
0.6
0.8
0
0.2
0.4
0.6
0.8
0
0.05
0.1
0.15
0.2
0.25

October 2007 Atmospheric Limb Workshop
Adam E. Bourassa Limb Scanning Satellites
OSIRIS Measurements during the SAGE III Mission
10
20
30
Altitu
de
(km
)
55-65
N
10
20
30
Altitu
de
(km
)
15-25
N
10
20
30
Altitu
de
(km
)
15-25
S
2002.5 2003.5 2004.5 2005.510
20
30
Altitu
de
(km
)
55-65
S
0
0.2
0.4
0.6
0.8
0
0.2
0.4
0.6
0.8
0
0.2
0.4
0.6
0.8
0
0.2
0.4
0.6
0.8
October 2007 Atmospheric Limb Workshop
Adam E. Bourassa Limb Scanning Satellites
2002 2003 2004 2005 2006 2007 2008 2009 2010
10-4
10-3
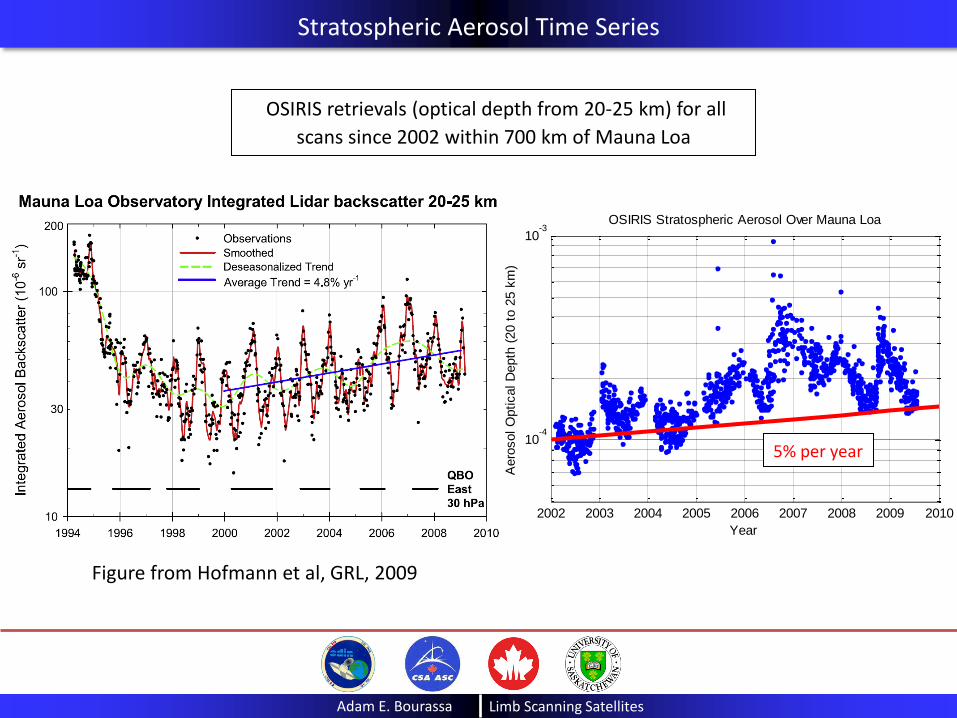
OSIRIS Stratospheric Aerosol Over Mauna Loa
Year
Aero
sol O
ptical D
epth
(20 t
o 2
5 k
m)
OSIRIS retrievals (optical depth from 20-25 km) for all
scans since 2002 within 700 km of Mauna Loa
5% per year
Stratospheric Aerosol Time Series
Figure from Hofmann et al, GRL, 2009

October 2007 Atmospheric Limb Workshop
Adam E. Bourassa Limb Scanning Satellites
OSIRIS Stratospheric Aerosol Time Series
Altitude (
km
)
2002 2003 2004 2005 2006 2007 2008 2009
15
20
25
30
35
40
0.5
1
1.5
2
2.5
3
OSIRIS Mission Time Series: 750 nm Aerosol Extinction Ratio (Zonal Average 20 N to 20 S)

October 2007 Atmospheric Limb Workshop
Adam E. Bourassa Limb Scanning Satellites
OSIRIS Stratospheric Aerosol Time Series
Altitude (
km
)
2002 2003 2004 2005 2006 2007 2008 2009
15
20
25
30
35
40
0.5
1
1.5
2
2.5
3
Altitude (
km
)
2002 2003 2004 2005 2006 2007 2008 2009
15
20
25
30
35
40
Altitude (
km
)
2002 2003 2004 2005 2006 2007 2008 2009
15
20
25
30
35
40

October 2007 Atmospheric Limb Workshop
Adam E. Bourassa Limb Scanning Satellites
OSIRIS Stratospheric Aerosol Time Series
Altitude (
km
)
2002 2003 2004 2005 2006 2007 2008 2009
15
20
25
30
35
40
0.5
1
1.5
2
2.5
3
Figure 2;
Vernier et al.
GRL, 2011

October 2007 Atmospheric Limb Workshop
Adam E. Bourassa Limb Scanning Satellites
The Eruption of Kasatochi Volcano
•Kasatochi volcano (52 N, 175 W) erupted August 8,2008 (almost
perfect timing for observation with OSIRIS)
•Injection of 1.2 -1.5 Tg SO2 to altitude up to 16 km
•The largest stratospheric volcano since 1991

October 2007 Atmospheric Limb Workshop
Adam E. Bourassa Limb Scanning Satellites
10
15
20
25
30
350 N to 10 N
Alti
tude (
km
)
10 N to 20 N
10
15
20
25
30
3520 N to 30 N
Alti
tude (
km
)
30 N to 40 N
10
15
20
25
30
3540 N to 50 N
Alti
tude (
km
)
50 N to 60 N
-50 -25 0 25 50 75 100
10
15
20
25
30
3560 N to 70 N
Alti
tude (
km
)
Days since Kasatochi Eruption
-50 -25 0 25 50 75 100
70 N to 80 N
Days since Kasatochi Eruption
750 nm Aerosol Extinction (km -1 10-3)
0 0.2 0.4 0.6 0.8 1 1.2
Retrieved Aerosol Extinction: Kasatochi Daily Time Series
•The 380 K level of potential temperature
delineates the tropical tropopause layer
and the lowermost stratosphere from the
deep stratosphere
• Focus analysis above 380 K
• Pre-eruption: typical background state
(no effect of Okmok eruption on July 12?)
• 10 to 30 days post eruption: clear
evidence of an enhanced layer with
significant variability (streamers?)
• 40 days post eruption: a stable
enhanced layer between 15 and 22 km at
mid to high latitudes (typical e-folding
conversion time of 30 days)
• No clear enhancement in the deep
tropics
• 80 days post eruption: decay of the
stable layer (high-latitude aerosol lifetime
is less than 1 year)

October 2007 Atmospheric Limb Workshop
Adam E. Bourassa Limb Scanning Satellites
10
15
20
25
Alti
tude (
km
)
July 01 - 31 August 01 - 15 August 15 - 31
10
15
20
25
Alti
tude (
km
)
September 01 - 15 September 15 - 30 October 01 - 15
0 20 40 60 80
10
15
20
25
Latitude (degrees)
Alti
tude (
km
)October 15 - 31
0 20 40 60 80
Latitude (degrees)
November 01 - 15
0 20 40 60 80
Latitude (degrees)
November 15 - 30
750 nm Aerosol Extinction (10-3 km-1)
0 0.2 0.4 0.6 0.8 1 1.2
OSIRIS Aerosol Extinction: Kasatochi Zonal Average Time Series
• Northern hemisphere zonal averages
•Again focus analysis above 380 K
• Pre-eruption: Junge layer
•Maximum enhancement in the lower
stratosphere (not lowermost) in early
October of up to 5 times background
values
• A remarkable delineation of the 380 K
level in the aerosol distributions
• Clear transport to the tropics (2 way
leaky tropical pipe)
• No mixing into the tropical stratospheric
reservoir
• Remarkable mixing barrier above the
subtropical jet
Bourassa et al., JGR, 2010

October 2007 Atmospheric Limb Workshop
Adam E. Bourassa Limb Scanning Satellites
Days since Kasatochi
Latitu
de (
degre
es)
-20 0 20 40 60 80 1000
10
20
30
40
50
60
70
80
90
750 nm Optical Depth (10-2)
0.2 0.25 0.3 0.35 0.4 0.45 0.5 0.55 0.6
Kasatochi Climate Effects: Model Simulations
• OSIRIS retrievals of zonal average vertical
stratospheric aerosol optical depth from 380 K
•Compared to simulations of a 1.5 Tg Kasatochi
eruption using NASA GISS ModelE (a coupled
atmosphere-ocean general circulation model)
performed by Kravitz and Robock
•The spatial and temporal distributions of the
volcanic aerosol enhancement agree very well
• The optical depth predicted by the model is an
order of magnitude larger
• total column, wavelength, particle size,
injection characteristics
Kravitz et al., JGR, 2010

October 2007 Atmospheric Limb Workshop
Adam E. Bourassa Limb Scanning Satellites
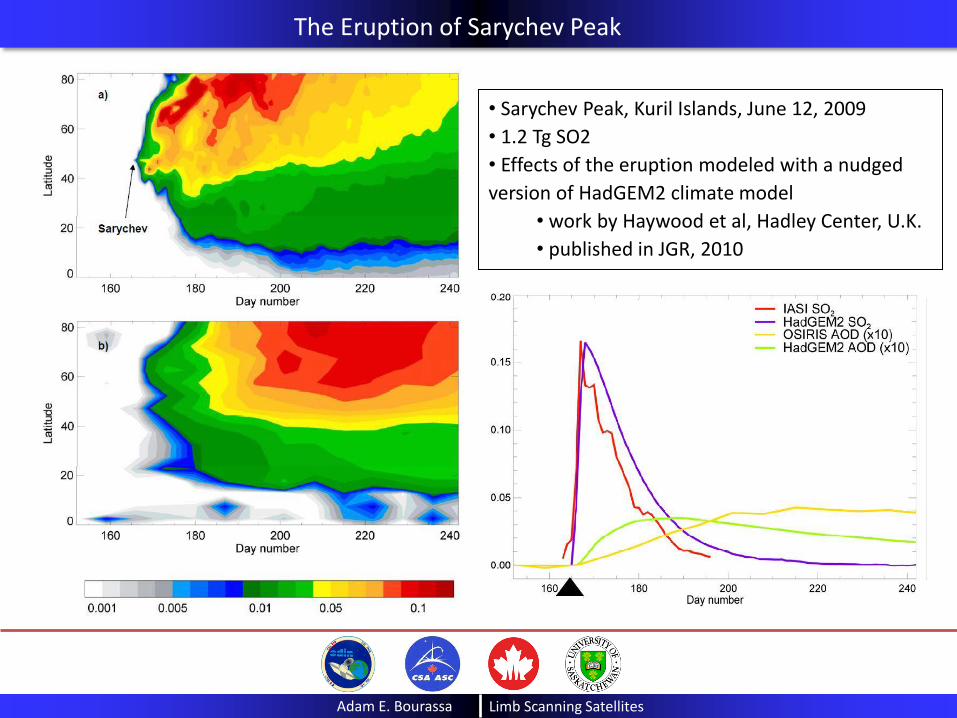
The Eruption of Sarychev Peak
• Sarychev Peak, Kuril Islands, June 12, 2009, 1.2 Tg SO2 up to 16 km

October 2007 Atmospheric Limb Workshop
Adam E. Bourassa Limb Scanning Satellites
The Eruption of Sarychev Peak
• Sarychev Peak, Kuril Islands
• June 12, 2009
• 1.2 Tg SO2
October 2007 Atmospheric Limb Workshop
Adam E. Bourassa Limb Scanning Satellites
The Eruption of Sarychev Peak
• Sarychev Peak, Kuril Islands, June 12, 2009
• 1.2 Tg SO2
• Effects of the eruption modeled with a nudged
version of HadGEM2 climate model
• work by Haywood et al, Hadley Center, U.K.
• published in JGR, 2010

October 2007 Atmospheric Limb Workshop
Adam E. Bourassa Limb Scanning Satellites
OSIRIS Aerosol Optical Depth Movie: 2008-2010