monitoring and oversight of general obligation bonds to ... · q42017 monitoring and oversight of...
TRANSCRIPT

Q42017
Monitoring and Oversight of General Obligation Bonds to Improve Broward County Schools: SMART Program Quarterly Report Review for the Quarter Ending June 30, 2017
Presented to the Broward County Bond Oversight Committee
August 28, 2017
Dear Fellow Taxpayer,
In November 2014, Broward County voters approved an $800 million bond referendum to renovate
and repair Broward’s aging school facilities, upgrade school safety and security systems and purchase new
computers and educational technology. A citizen bond oversight committee (“Committee”) was appointed
to encourage greater accountability, transparency, public support and confidence in the use of the general
obligation bond funds. The Committee is charged with ensuring that bond proceeds are used in compliance
with the purposes set forth in the bond programs, as approved by the School Board of Broward County.
Broward County taxpayers must hold the School Board accountable for making smart business decisions and
doing the high-level planning and project management necessary to minimize the risk to the County and to
make sure every dollar of bond proceeds is spent consistent with the purposes set forth in the bond programs,
as approved by the School Board of Broward County.
Superintendent Robert W. Runcie has expressed a commitment to an open and transparent process to guide
the oversight of the general obligation bond program and has asked Florida TaxWatch to provide high quality,
independent research and analyses to help the bond oversight Committee to effectively carry out its oversight
duties and obligations. To that end, Florida TaxWatch has agreed to: (1) provide a research report on industry
or national “best practices” to aid the Committee in its oversight of the bond-funded capital outlay program;
and (2) review quarterly reports submitted to the Committee and present our findings to the public during
the regular (quarterly) Committee meetings. This effort is funded by the Broward community, and does not
use taxpayer dollars.
I am pleased to present the following report, which includes the TaxWatch review of the SMART Program
quarterly report for the quarter ending June 30, 2017. TaxWatch staff will be available to present our findings
and recommendations at the Committee’s August 28, 2017 meeting.
Sincerely,
Dominic M. Calabro
President & CEO

3
EXECUTIVE SUMMARYThe District continues to make progress in implementing the $987 million SMART Program. During the
quarter ending June 30, 2017, SMART Program expenditures increased from $106.5 million to $123.1
million, and the number of financially active projects increased from 931 to 1,423.
The District continues acquiring computers and wireless access points, upgrading technology infrastructure,
upgrading wireless networks, and updating CAT 6 data ports. Planned technology deployments have been
completed at more than 170 schools. With the purchase of more than 83,000 computers, all SBBC schools
now comply with the District’s standard of 1 computer for every 3.5 students. All technology projects planned
for charter schools have been completed. Florida TaxWatch estimates that, for the technology upgrade projects
that have been completed, more than $10.38 million has been saved.
The replacement of music and arts equipment continues, with all planned projects accelerated and underway.
Of the $19.2 million allocated for these projects, more than $17.2 million has been spent or committed.
More than 33,000 new instruments and pieces of musical equipment have been received and another 23,794
have been ordered and are awaiting delivery. Music and art equipment replacement projects have been
completed at more than 70 schools.
The SMART Program allocates $3.81 million for new tracks at three middle schools and 12 high schools,
and $3.63 million for new weight rooms at each of the 30 high schools. Track resurfacing projects have been
completed at the three middle schools and at five of the 12 high schools. Vendors have been selected and
weight room equipment ordered for 15 of the 30 high schools.
The District’s outreach efforts have produced more than 700 active M/WBE firms. Through June 30, 2017,
the District has issued purchase orders to M/WBEs totaling $30.6 million, which represents a total M/WBE
commitment of about 20 percent. No M/WBEs have received any of the bond money for technology
upgrades or music and art equipment.
The District has stepped up its efforts to provide principals more information about SMART Program
milestones that occur at their schools. Other outreach efforts include developing materials regarding
the progress of the SMART Program for presentation to business and community organizations, and to
municipalities within Broward County. The role of the Bond Oversight Committee in the District’s outreach
and public education efforts regarding SMART Program implementation remains unclear.
In response to previous Florida TaxWatch recommendations, the District’s facility construction reports have
become more transparent, and now include more project-specific information on construction activities at
SBBC schools. A schedule is now in place for implementing planned facility renovations. Already, the District

4
reports that more than 100 schools have been “flagged” for experiencing scheduling issues, mostly associated
with the School Choice Enhancement Program projects. The District has outlined measures to mitigate these
delays. By flagging projects that are projected to be behind schedule or over-budget, the District will help to
ensure the public’s right-to-know how the SMART Program moneys are being managed.

5
INTRODUCTIONOn August 14, 2017, Florida TaxWatch received the Bond Oversight Committee Quarterly Report for
the Quarter Ended June 30, 2017 (“Quarterly Report”). This single 694-page report provides updated
information on the implementation of the District’s SMART Program and the use of general obligation
bond funds to purchase and install technology upgrades, purchase music and arts equipment, improve safety,
upgrade athletic facilities, and renovate educational facilities.
• Section 1—Technology School Board Broward County Schools;
• Section 2—Technology Charter Schools;
• Section 3—Music & Art Equipment;
• Section 4—Athletics;
• Section 5—Facilities & Construction;
• Section 6—Budget Activity;
• Section 7—Supplier Diversity Outreach Program; and
• Section 8—Communications.
The School Board of Broward County has provided guidance to the Bond Oversight Committee in Section 4
of Resolution 15-106 (as amended). In reviewing quarterly reports prepared by District staff, the Committee
is charged with:
• Verifying the effective use of bond proceeds and compliance with the purposes set forth in the bond
programs as approved by the Board;
• Ensuring that bond revenues are expended for the purpose set forth in the bond programs as
approved by the Board;
• Ensuring that any deferred proposals or changes of plans are executed after appropriate approval of
the Board;
• Validating that no bond funds are used for any teacher or administrative salaries or other school
operating expense; and
• Reviewing efforts by District staff to maximize bond revenues by balancing best value, quality, and
efficiency in meeting the bond programs as approved by the Board.
To encourage greater accountability, transparency, public support and confidence in the use of the general
obligation bond funds, and to hold the district accountable for spending decisions, Florida TaxWatch has
reviewed this report against the SMART Program budget, which was most recently amended in September
2016. Florida TaxWatch is pleased to present the following findings and recommendations.
6
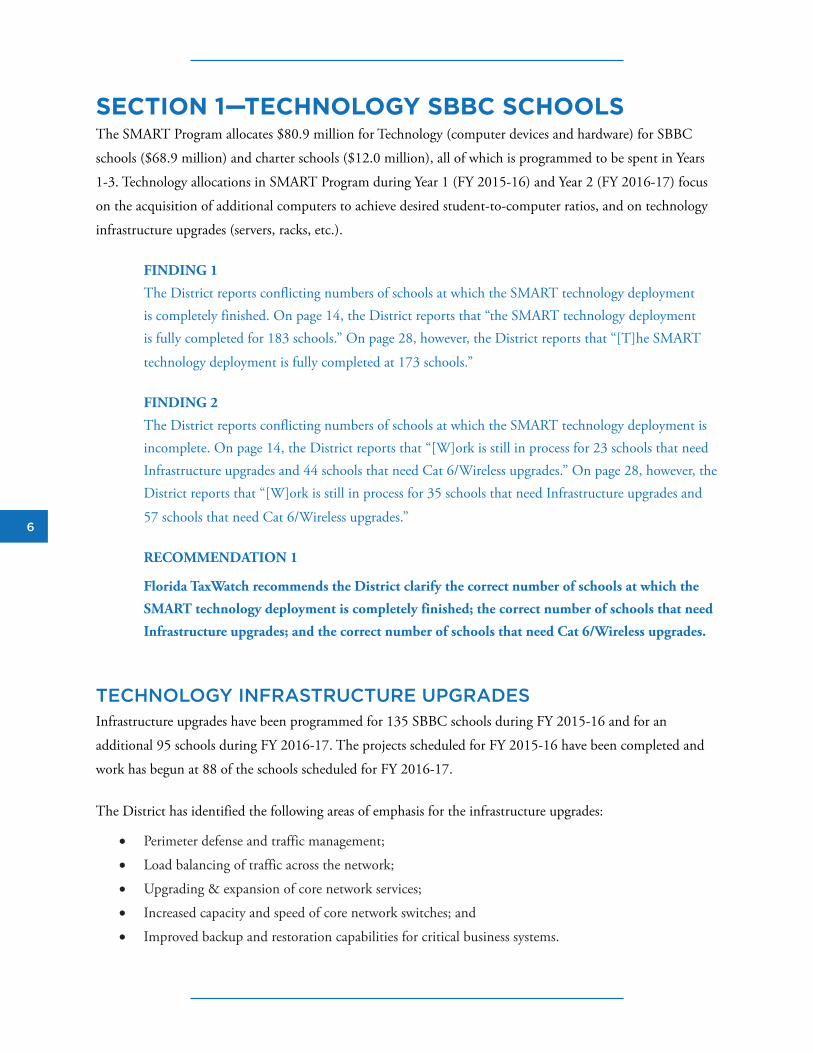
SECTION 1—TECHNOLOGY SBBC SCHOOLSThe SMART Program allocates $80.9 million for Technology (computer devices and hardware) for SBBC
schools ($68.9 million) and charter schools ($12.0 million), all of which is programmed to be spent in Years
1-3. Technology allocations in SMART Program during Year 1 (FY 2015-16) and Year 2 (FY 2016-17) focus
on the acquisition of additional computers to achieve desired student-to-computer ratios, and on technology
infrastructure upgrades (servers, racks, etc.).
FINDING 1
The District reports conflicting numbers of schools at which the SMART technology deployment is completely finished. On page 14, the District reports that “the SMART technology deployment is fully completed for 183 schools.” On page 28, however, the District reports that “[T]he SMART
technology deployment is fully completed at 173 schools.”
FINDING 2
The District reports conflicting numbers of schools at which the SMART technology deployment is incomplete. On page 14, the District reports that “[W]ork is still in process for 23 schools that need Infrastructure upgrades and 44 schools that need Cat 6/Wireless upgrades.” On page 28, however, the District reports that “[W]ork is still in process for 35 schools that need Infrastructure upgrades and
57 schools that need Cat 6/Wireless upgrades.”
RECOMMENDATION 1
Florida TaxWatch recommends the District clarify the correct number of schools at which the
SMART technology deployment is completely finished; the correct number of schools that need
Infrastructure upgrades; and the correct number of schools that need Cat 6/Wireless upgrades.
TECHNOLOGY INFRASTRUCTURE UPGRADESInfrastructure upgrades have been programmed for 135 SBBC schools during FY 2015-16 and for an
additional 95 schools during FY 2016-17. The projects scheduled for FY 2015-16 have been completed and
work has begun at 88 of the schools scheduled for FY 2016-17.
The District has identified the following areas of emphasis for the infrastructure upgrades:
• Perimeter defense and traffic management;
• Load balancing of traffic across the network;
• Upgrading & expansion of core network services;
• Increased capacity and speed of core network switches; and
• Improved backup and restoration capabilities for critical business systems.

7
Florida TaxWatch looked at the combined status of the 230 schools at which technology infrastructure
upgrades are planned for FY 2015-16 and for 2016-17. The status of these projects is shown in Table 1.
TABLE 1 – INFRASTRUCTURE UPGRADE STATUS (Q4 2016-17)STATUS NUMBER PERCENTAGE
Meets Standard 86 37.4%
Not Started 2 0.9%
In Process 21 9.1%
Complete 121 52.6%
Total 230 100.0%
FINDING 3
Technology infrastructure upgrades have yet to start at Lauderhill 6-12 and at Margate Middle School. The Technology SBBC Schools Report provides no explanation as to why the upgrades have not started at these two schools.
RECOMMENDATION 2
Florida TaxWatch recommends that the District provide an explanation for the delays in starting
the technology infrastructure projects at Lauderhill 6-12 and at Margate Middle School.
FINDING 4
The District continues to make progress implementing the infrastructure upgrades, with 52.6 percent of the upgrades complete. With 37 percent of the schools already meeting the District standards, this leaves only 10 percent of the planned technology upgrades not completed.
COMPUTER DEVICESThe District has planned to purchase additional computer devices to meet the District’s standard of 1
computer for every 3.5 students. Computer upgrades have been programmed for 135 SBBC schools during
FY 2015-16 and for an additional 95 schools during FY 2016-17. The District reports that all computer
devices have been ordered and installed.
Florida TaxWatch looked at the combined status of the 230 schools at which computer upgrades are planned
for FY 2015-16 and for 2016-17. The status of the planned computer purchases is shown in Table 2.

8
TABLE 2 – COMPUTER DEVICE STATUS (Q4 2016-17)
ITEM ORDERED INSTALLED % COMPLETE
Student Laptops 64,455 64,455 100%
Teacher Laptops 13,333 13,333 100%
Desktops 5,051 5,051 100%
Tablets 523 523 100%
Total 83,362 83,362 100%
FINDING 5
Of the 83,362 computer devices that have been ordered, 100 percent have been received and installed.
Based upon information provided by the District, all 230 schools now comply with the District’s standard of
1 computer for every 3.5 students. The final computer-to-student ratios are provided in Table 3. As shown in
Table 3, 70 percent of SBBC schools now have 1 computer for every 2 or fewer students.
TABLE 3 – FINAL COMPUTER-TO-STUDENT RATIOS (Q4 2016-17)RANGE NUMBER PERCENTAGE
0.0 - 1.0 10 4.3%
1.1 - 2.0 150 65.7%
2.1 - 3.0 46 19.6%
3.1 - 3.5 4 1.7%
Meets Standard 20 8.7%
Total 230 100%
FINDING 6
As of June 30, 2017, all 230 schools (100 percent) at which computer upgrades are planned for FY 2015-16 and for 2016-17 comply with the district’s computer standard of one computer for every 3.5 students. The schools with the lowest computer-to-student ratio (0.9-to-1) are Hollywood Central Elementary School, Larkdale Elementary School, and Palmview Elementary School. Nova Eisenhower Elementary School has the highest computer-to-student ratio (3.3-to-1).

9
WIRELESS ACCESS POINTSThe District has planned to purchase additional wireless access points to meet the District’s standard of 1
wireless access point per classroom. Wireless access points have been programmed for 135 SBBC schools
during FY 2015-16 and for an additional 95 schools during FY 2016-17.
Florida TaxWatch looked at the combined status of the 230 schools at which wireless access points are planned
for FY 2015-16 and for 2016-17. The status of these projects is shown in Table 4.
TABLE 4 – WIRELESS ACCESS POINT STATUS (Q4 2016-17)
NUMBER PERCENTAGE
Meets Standard 8 3.5%
Not Started 1 0.4%
In Process 43 18.7%
Complete 178 77.4%
Total 230 100.0%
FINDING 7
The District continues to make progress purchasing additional wireless access points, with 80.9 percent of the SBBC schools in compliance with the District standard.
FINDING 8
Of the 13,135 wireless access points ordered, 11,582 (88.2 percent) have been received and installed (completed). Cat 6 wireless upgrades have been completed for 12,706 (96.7 percent) of the wireless access points.
As shown in Table 5, the District has reported the successful delivery of the following technology upgrades
across 230 SBBC schools as of March 31, 2017.
TABLE 5 – TECHNOLOGY UPGRADE SUMMARY (Q4 2016-17)ORDERED INSTALLED %
Student Laptops 64,455 64,455 100.0%
Teacher Laptops 13,333 13,333 100.0%
Desktops 5,051 5,051 100.0%
Tablets 523 523 100.0%
Computer Carts 1,066 1066 100.0%
Wireless Access Points 11,592 10,548 91.0%
Category 6 Cable Drops 11,215 11,110 99.1%
10
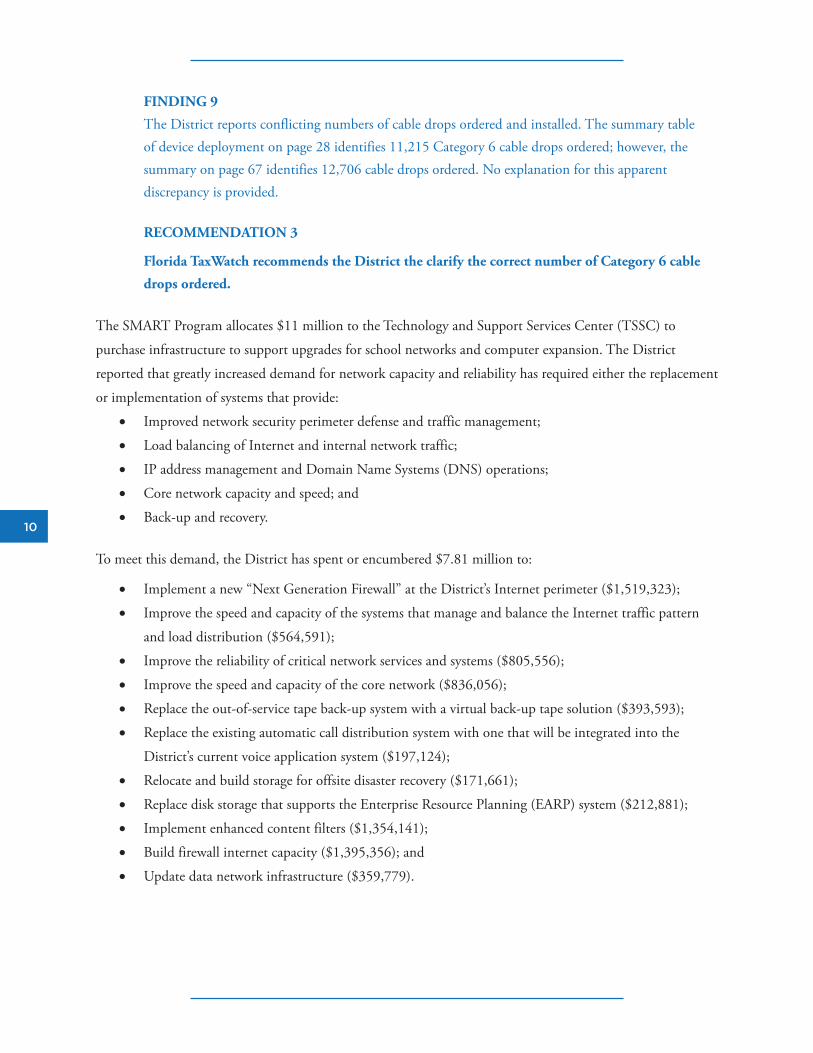
FINDING 9
The District reports conflicting numbers of cable drops ordered and installed. The summary table of device deployment on page 28 identifies 11,215 Category 6 cable drops ordered; however, the summary on page 67 identifies 12,706 cable drops ordered. No explanation for this apparent discrepancy is provided.
RECOMMENDATION 3
Florida TaxWatch recommends the District the clarify the correct number of Category 6 cable
drops ordered.
The SMART Program allocates $11 million to the Technology and Support Services Center (TSSC) to
purchase infrastructure to support upgrades for school networks and computer expansion. The District
reported that greatly increased demand for network capacity and reliability has required either the replacement
or implementation of systems that provide:
• Improved network security perimeter defense and traffic management;
• Load balancing of Internet and internal network traffic;
• IP address management and Domain Name Systems (DNS) operations;
• Core network capacity and speed; and
• Back-up and recovery.
To meet this demand, the District has spent or encumbered $7.81 million to:
• Implement a new “Next Generation Firewall” at the District’s Internet perimeter ($1,519,323);
• Improve the speed and capacity of the systems that manage and balance the Internet traffic pattern
and load distribution ($564,591);
• Improve the reliability of critical network services and systems ($805,556);
• Improve the speed and capacity of the core network ($836,056);
• Replace the out-of-service tape back-up system with a virtual back-up tape solution ($393,593);
• Replace the existing automatic call distribution system with one that will be integrated into the
District’s current voice application system ($197,124);
• Relocate and build storage for offsite disaster recovery ($171,661);
• Replace disk storage that supports the Enterprise Resource Planning (EARP) system ($212,881);
• Implement enhanced content filters ($1,354,141);
• Build firewall internet capacity ($1,395,356); and
• Update data network infrastructure ($359,779).

11
SECTION 2—TECHNOLOGY CHARTER SCHOOLSThe SMART Program includes a $12.0 million allocation for “SMART Charter School Technology from
General Obligation Bonds” which is to be allocated based on charter school enrollment. The SMART
Program Technology Charter Schools Quarterly Report reflects the following summary activity:
TABLE 6 – TECHNOLOGY UPGRADE SUMMARY (Q4 2016-17)ORDERED INSTALLED %
Student Laptops 5,086 5,086 100.0%
Teacher Laptops 1,417 1,417 100.0%
Desktops 1,712 1,712 100.0%
Tablets 3,099 3,099 100.0%
Computer Carts/Trays 316 316 100.0%
Digital Classrooms 1,347 1,347 100.0%
Accessories & Peripherals 3,394 3,394 100.0%
FINDING 10
The District is making considerable progress implementing the charter school technology upgrades, with 100 percent of the ordered upgrades having been received.
In its review of the District’s report for the quarter ending June 30, 2017, TaxWatch found nothing that
identified specifically how general obligation bond funds appropriated for “Charter School Technology” are
to be spent. Without this additional specificity, TaxWatch could not say that the bond revenues are being
expended for the purpose set forth in the bond programs as approved by the School Board.
District staff has previously explained that the following criteria were used to guide technology purchases by
the charter schools:
• Technology devices that a charter school might need that were on established bids that the
information technology (IT) department has done;
• Technology that teachers could use within the classroom (e.g., laptops, desktops, etc.) based on the
appropriate approved bids that the IT department has done;
• Anything in the classroom that could be recoverable; and
• Technology must be used for instructional purposes, and not bought for administrative purposes.
District staff has further explained that the IT team developed an online ordering system for the charter
schools. A catalogue identifying all of the devices allowed to be purchased was sent to the charter schools, and
each charter school was given an access code to enter the system. As each item is ordered, it is placed into a
“shopping cart” and a running total cost was calculated after each item was entered. This suggests that, at a
high level, the bond revenues are being expended for the purpose set forth in the bond programs as approved
by the School Board.
12
FINDING 11
Although there is no “planned spend” against which to compare the “actual spend,” the use of the catalogue and online ordering system provides a measurable level of comfort that the use of bond revenues to purchase technology upgrades for charter schools is consistent with the purpose set forth in the bond programs as approved by the SBBC.
13
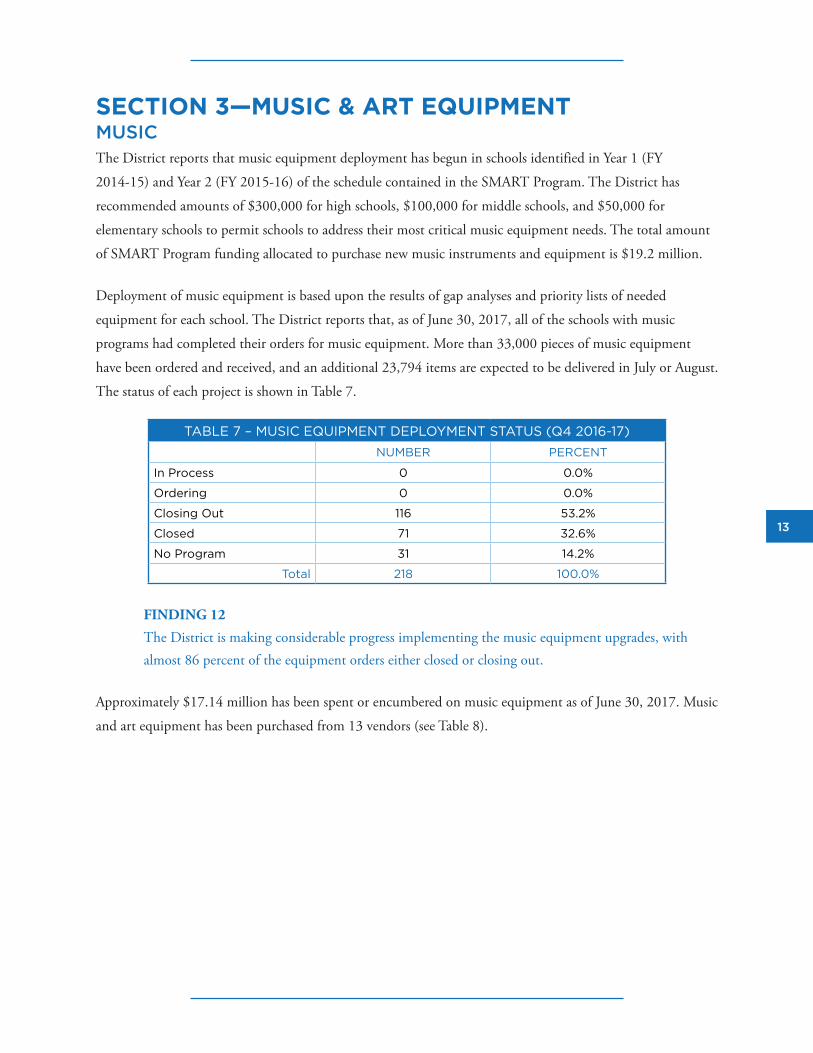
SECTION 3—MUSIC & ART EQUIPMENTMUSICThe District reports that music equipment deployment has begun in schools identified in Year 1 (FY
2014-15) and Year 2 (FY 2015-16) of the schedule contained in the SMART Program. The District has
recommended amounts of $300,000 for high schools, $100,000 for middle schools, and $50,000 for
elementary schools to permit schools to address their most critical music equipment needs. The total amount
of SMART Program funding allocated to purchase new music instruments and equipment is $19.2 million.
Deployment of music equipment is based upon the results of gap analyses and priority lists of needed
equipment for each school. The District reports that, as of June 30, 2017, all of the schools with music
programs had completed their orders for music equipment. More than 33,000 pieces of music equipment
have been ordered and received, and an additional 23,794 items are expected to be delivered in July or August.
The status of each project is shown in Table 7.
TABLE 7 – MUSIC EQUIPMENT DEPLOYMENT STATUS (Q4 2016-17)NUMBER PERCENT
In Process 0 0.0%
Ordering 0 0.0%
Closing Out 116 53.2%
Closed 71 32.6%
No Program 31 14.2%
Total 218 100.0%
FINDING 12
The District is making considerable progress implementing the music equipment upgrades, with almost 86 percent of the equipment orders either closed or closing out.
Approximately $17.14 million has been spent or encumbered on music equipment as of June 30, 2017. Music
and art equipment has been purchased from 13 vendors (see Table 8).

14
TABLE 8 – MUSIC & ART VENDOR PAYMENTS (CUMULATIVE)VENDOR AMOUNT PERCENTAGE
All County Music $10,661 62.0%
Cascio Interstate Music $3,228 0%
Enabling Devices $8,877 0.1%
JW Pepper $3,383 0%
Malmark $5,898 0%
Music Arts Enterprises $3,650,142 21.2%
Music Man $1,254,258 7.3%
Romeo Music $387,549 2.3%
School Specialty $63,888 0.4%
Summer Arts Sessions $9,600 0.0%
Summer Hays Music $8,233 0.0%
Vista Pan Steel Instruments $5,036 0.1%
Wenger $1,136,505 6.6%
Total $17,197,505 100.0%
FINDING 13
Of the approximately $17.2 million spent on replacement music and art equipment, approximately $10.7 million (62.0 percent) has been spent with one vendor, All County Music.
FINDING 14
The District reports conflicting dollar amounts spent on new musical instruments and equipment. On page 74, the District reports that $17,140,384 has been spent or encumbered for new musical equipment; however, on page 75, the District identifies $17,197,344 in music order payments to vendors, a difference of $56,960.
RECOMMENDATION 4
Florida TaxWatch recommends the District provide an explanation for the $56,960 difference
identified in Finding 14 above.

15
ART EQUIPMENTThe SMART Program allocates $78,400 each year through FY 2018-19 ($392,000 total) for replacement
kilns. Kilns are ordered on an “as needed” basis subject to the process for kiln evaluation/repair/order outlined
on page 101.
FINDING 15
The District reports (reference page 101) that 18 kilns have been delivered; however, only 17 kilns are shown as having been delivered in the table on page 102. Responses to a kiln survey suggest the need to order as many as 40 additional kilns.
RECOMMENDATION 5
Florida TaxWatch recommends the District confirm the number of kilns ordered and delivered.

16
SECTION 4—ATHLETICSTRACK PROJECTSThe SMART Program allocates $3.81 million for new tracks at three middle schools and 12 high schools. The
track resurfacing projects at the three middle schools and five of the 12 high schools have been completed.
This is unchanged since the last quarterly report. The remaining seven high schools are scheduled for
completion by December 31, 2017.
As previously recommended by Florida TaxWatch, the District has included (reference page 105) a status
report that shows projected start and completion dates for the 15 track resurfacing projects.
FINDING 16
The schedule for the track resurfacing project at Pompano Beach High School shows a projected completion date of January 31, 2017; however, the project is not shown as having been completed. The District offers no explanation for this apparent delay.
RECOMMENDATION 6
Florida TaxWatch recommends the District brief the Committee on the apparent delay in completing the track resurfacing project at Pompano Beach High School. Further, the Committee should make clear its expectation that future Athletics Reports include explanations for any project that is delayed.
WEIGHT ROOMSThe SMART Program allocates $3.63 million for new weight rooms at each of the 30 high schools. The
District reports that 15 of the high schools have selected vendors and begun to order equipment. The District
reports that 21 of the 30 projects are scheduled to be completed by June 30, 2018, with the remaining projects
scheduled to be completed by December 31, 2018. As previously recommended by Florida TaxWatch, the
District has provided project schedules and projected completion dates for the 15 high schools that have
selected vendors and begun to order weight room equipment.
FINDING 17
The Q4 2016-17 Athletics Report includes a status report for only 15 of the 30 high schools. The status and projected completion dates for the remaining 15 high schools are unclear.
RECOMMENDATION 7
Florida TaxWatch recommends the District include in the next quarterly report project schedules
or projected completion dates for every high school weight room project.

17
SECTION 5—FACILITIES CONSTRUCTIONRENOVATIONSThe District’s Q4 2016-17 Facilities Construction Report is a 367-page report that includes project-specific
information on 1,366 construction projects at 232 schools. The District reports that 78 percent of the scheduled
construction activities are underway and 89 percent of the schools have at least one project that is currently
underway.
During Q4 2016-17, the SBBC:
• Authorized 7 schools to advertise Requests for Qualification (RFQs) for Construction Manager At Risk
(CMAR) services;
• Approved Design Professional Services Agreements (PSAs) at 17 schools;
• Authorized 6 schools to advertise for bids; and
• Approved CMAR agreements at 3 schools.
An additional 23 schools advertised for RFQs for professional design services. No SBBC approval for these,
since these projects only require a single trade specialty which can be provided from pre-approved qualified trade
specialists.
The status of facility construction projects is shown in Table 9 (which allows readers to view progress from the
quarter ending March 31, 2017 to the quarter ending June 30, 2017).
TABLE 9 – FACILITIES CONSTRUCTION PROJECT STATUS (Q4 2016-17)(AS OF JUNE 30, 2017) (AS OF MARCH 31, 2017)
PHASE NUMBER PERCENTAGE NUMBER PERCENTAGE
Not Started 297 21.7% 420 30.7%
Planning 128 9.4% 121 8.9%
Hire Design Team 167 12.2% 296 21.7%
Design Project 533 39.0% 352 25.8%
Hire Contractor/Vendor 52 3.8% 13 0.9%
Implement Improvements 108 8.0% 89 6.5%
Complete 81 5.9% 75 5.5%
Total 1,366 100.0% 1,366 100.0%
FINDING 18
The District is making considerable progress implementing the SMART Program facility construction projects. Since the end of the last quarter:• The number of projects not yet started has decreased from 420 to 297;• More projects are moving from the planning phase into the design and implementation phases; and• The number of completed projects has increased from 75 to 81.

18
At the May 22, 2017 BOC meeting, the District presented a proposal to adjust the timeframes for
procurement-related construction activities for FY 2014-15, FY 2015-16, and FY 2016-17 projects to establish
more realistic milestone dates. For FY 2014-15 and FY 2015-16 projects, implementation (construction)
procurement that was originally scheduled to begin in the second and third quarter of calendar year 2017 has
been pushed back to the first quarter of calendar year 2018, a delay of 3-6 months. For FY 2016-17 projects,
implementation (construction) procurement that was originally scheduled to begin in the first and second
quarter of calendar year 2018 has been pushed back to the fourth quarter of calendar year 2018, a delay of 6-9
months. This “re-baselining” was an important step because it provided a more-definitive schedule upon which
progress in implementing the planned facilities improvements can be measured.
The District identified 98 schools (reference pages 145-46) at which “unexpected complications” have created
budget and/or scheduling issues. In its review of individual “School Spotlights” TaxWatch identified four
schools that had identified budget or scheduling issues that were not on this list.
FINDING 19
The following schools have experienced scheduling issues and are not included on the list of “flagged schools” (pages 145-46):• Sea Castle Elementary School;• Seagull Alternative High School;• Sheridan Hills Elementary School; and• Silver Lakes Elementary School.
RECOMMENDATION 8
Florida TaxWatch recommends the District amend the list of flagged schools to include Sea
Castle Elementary School, Seagull Alternative High School, Sheridan Hills Elementary School,
and Silver Lakes Elementary School.
Florida TaxWatch reviewed each of the 102 flagged schools and the 111 projects that were flagged.
FINDING 20
Of the 102 flagged schools, 2 were flagged for budget issues on primary renovations: the budget for building envelope improvements at Attucks Middle School has increased from $316,000 to $498,125, and the budget for fire alarms at Crystal Lake Middle School has increased from $442,525 to $472,525.

19
FINDING 21
Of the 109 projects that are experiencing scheduling issues, 89 were School Choice Enhancement Program projects. The most frequent reason for these delays is due to “re-evaluation with input from the school community.”
The District has identified alternative delivery methods designed to mitigate scheduling delays and improve
the delivery process (reference pages 9-10), including:
• Hiring contractors earlier to provide pre-construction services during the Design phase. This helps to
ensure a more efficient transition from Design to Implementation;
• Using continuing service contracts that establish a pool of qualified contractors from which to quickly
implement select projects;
• Revising the SBBC approval process to get the Authorization to Advertise before getting a project
building permit;
• Revising the Authorization to Proceed (ATP) and Notice to Proceed (NTP) processes to improve
efficiency and reduce the time required;
• Eliminating the need for SBBC approval prior to advertising for Design services;
• Revising policy to permit multiple schools to be included in a single procurement; and
• Establishing a “small projects team” to handle less-complex projects.
SCHOOL CHOICE ENHANCEMENT PROGRAM (SCEP) The District reports that, because of the early mobilization of 30 Year 3 schools, there are now 140 School
Choice Enhancement Program (SCEP) projects. SCEP projects are budgeted at $100,000; the scope of the
capital project (e.g., electronic marquees, shade structures, playgrounds, etc.) is determined by a vote of the
teachers, staff, and parents of students at the school.
A new three-phased SCEP process was introduced during Q4 2016-17. The first phase begins with Planning
& Design, which includes scope and budget evaluation and voting authorization. The second phase,
Implementation, includes selection and procurement. The third phase, Completion, occurs when all items
have been delivered and installed. The status of these projects is shown in Table 10.

20
TABLE 10 – SCHOOL CHOICE ENHANCEMENTS PROJECT STATUS(AS OF JUNE 30, 2017) (AS OF MARCH 31, 2017)
PROJECT PHASE NUMBER PERCENTAGE NUMBER PERCENTAGE
Planning/Design 37 26.4% 48 34.3%
Implement Improvements 88 62.9% 83 59.3%
Improvements Complete 15 10.7% 9 6.4%
On Hold 1 0.7% 0 0.0%
Total 140 100% 140 100%
FINDING 22
The District is making considerable progress implementing the SCEP Program projects. Since the end of the last quarter, fewer SCEP projects are in the Planning and Design phase and more have moved into the Implement Improvements and Improvements Completed phases.
The SCEP Breakdown (reference pages 474 through 479) identifies how SCEP funding is to be spent at
56 schools in the Implementation phase. Laptops, printers, and other computer technology equipment are
included in the SCEP projects for the following schools:
Lauderdale Manor EL&RC Manatee Bay Elementary School
Margate Elementary School Miramar Elementary School
Mirror Lake Elementary School North Lauderdale K-7
Northside Elementary School Nova Middle School
Oakridge Elementary School Orange Brook Elementary School
Pasadena Lakes Elementary SchoolPine Ridge Education Center
Pinewood Elementary School Ramblewood Middle School
Sawgrass Springs Middle School Seagull Education Center
Silver Ridge Elementary School Silver Shores Elementary School
Silver Trail Middle School Stirling Elementary School
Stranahan High School Sunland Park Academy
McFatter Technical College

21
FINDING 23
It is unclear why SCEP project funding would be used to purchase computers and related equipment. More than $32 million in SMART Program Technology funds has been spent to upgrade technology to ensure every school meets or exceeds the District’s standard of one computer for every 3.5 students.
The SCEP Breakdown also identifies the use of SCEP funds to purchase sound systems, music instruments,
and broadcasting equipment at the following schools:
Liberty Elementary Schools Maplewood Elementary School
McNicol Middle School Miramar Elementary School
Mirror Lake Elementary School Morrow Elementary School
North Lauderdale K-7 Northside Elementary School
Nova Middle School Oakridge Elementary School
Orange Brook Elementary School Pasadena Lakes Elementary School
Pinewood Elementary School Piper High School
Ramblewood Middle School Sandpiper Elementary School
Sheridan Hills Elementary School Silver Shores Elementary School
Village Elementary School West Broward High School
FINDING 24
It is unclear why SCEP project funding would be used to purchase computers and related equipment. More than $17 million in SMART Program Music & Arts funding has been used to purchase music instruments and equipment.
RECOMMENDATION 9
Florida TaxWatch recommends the District explain the use of SCEP funds to purchase items
that are also being purchased with other SMART Program funds, as identified in Findings 22
and 23 above.

22
SECTION 6—BUDGET ACTIVITYThe SMART Program Budget Activity Quarterly Report provides expenditure information for financially
active projects. The SMART Program total budget is $987 million. This includes the $800 million in general
obligation bond (GOB) funding and $187 million in non-GOB capital project funding (capital millage and
impact fees). The current SMART Program budget combines years 1 (FY 2014-15), 2 (FY 2015-16), and 3
(FY 2016-17) now totaling $672.9 million.
FINANCIALLY ACTIVE PROJECTSThe District reports that, during Q4 2016-17, the SBBC approved accelerating funding for SMART construction projects at several schools, which moved $1.2 million from years 4 and 5 into year 3. This increased the total funding in years 1 through 3 from $671.7 million to $672.9 million.
Budget activity increased dramatically during the quarter ending June 30, 2017. The District reports that the number of financially active projects increased from 931 at the end of Q3 2016-17 to 1,423 at the end of Q4 2016-17, an increase of 52 percent. SMART Program expenditures increased from $ $106,480,601 to $123,094,714 (a 16 percent increase) during the same period.
FINDING 25
The current budgets for both the SMART Program and the 1,423 financially active projects reflect an increase of $212,125 over the original budgets, with increases in the Safety and Renovation SMART categories. The budget for building envelope improvements at Attucks Middle School has increased from $316,000 to $498,125, and the budget for fire alarms at Crystal Lake Middle School has increased from $442,525 to $472,525.
Florida TaxWatch reviewed each project identified in the Technology SBBC Schools Report and Technology Charter Schools Report as “completed” against the Budget Activity Report to identify cost savings.
FINDING 26
The District’s technology staff has been able to procure technology improvements that meet or exceed established standards at considerable savings. Florida TaxWatch estimates that, for the technology projects identified in the Technology SBBC Schools Report and Technology Charter Schools Report as “completed,” more than $10.38 million has been saved. These savings are broken down as follows:
• Technology infrastructure upgrade savings --- $3,929,200;
• Computer device savings --- $16,544;
• Wireless network upgrade savings --- $4,781,480; and
• Charter school savings --- $1,655,111.1
1 Includes $1,653,920 in District-Wide Non-Facility Funding / Charter School Technology (reference page 586).
23
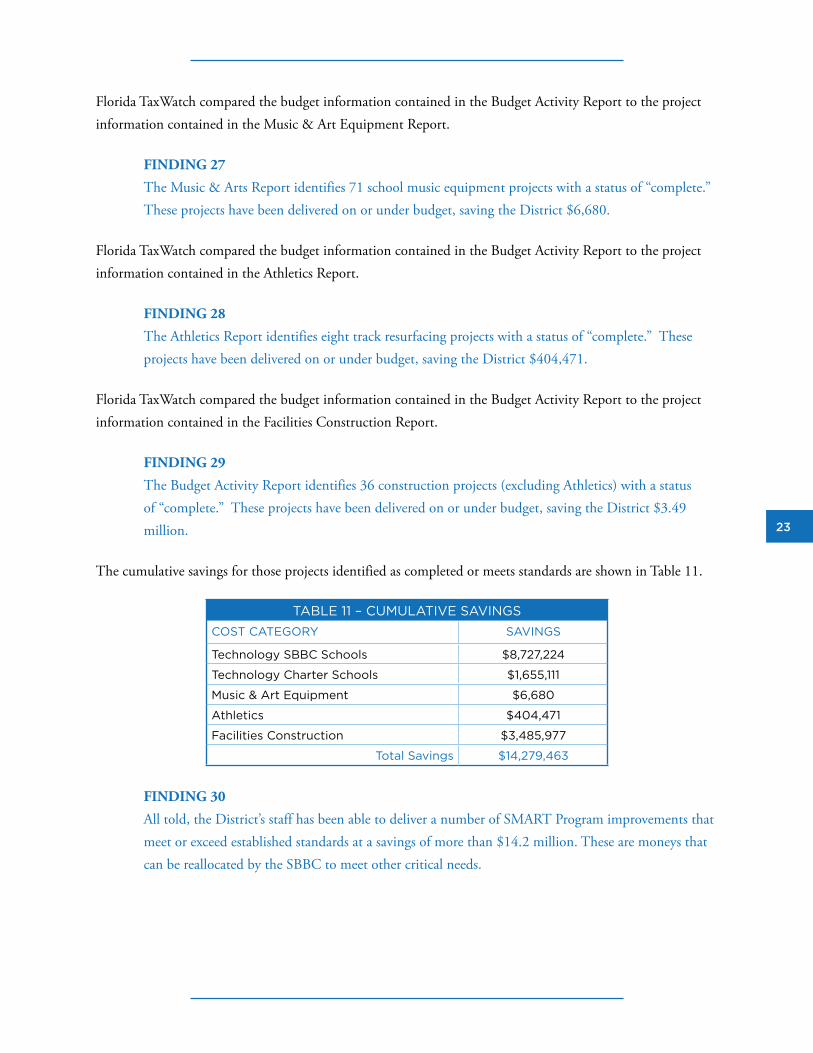
Florida TaxWatch compared the budget information contained in the Budget Activity Report to the project information contained in the Music & Art Equipment Report.
FINDING 27
The Music & Arts Report identifies 71 school music equipment projects with a status of “complete.” These projects have been delivered on or under budget, saving the District $6,680.
Florida TaxWatch compared the budget information contained in the Budget Activity Report to the project information contained in the Athletics Report.
FINDING 28
The Athletics Report identifies eight track resurfacing projects with a status of “complete.” These projects have been delivered on or under budget, saving the District $404,471.
Florida TaxWatch compared the budget information contained in the Budget Activity Report to the project information contained in the Facilities Construction Report.
FINDING 29
The Budget Activity Report identifies 36 construction projects (excluding Athletics) with a status of “complete.” These projects have been delivered on or under budget, saving the District $3.49 million.
The cumulative savings for those projects identified as completed or meets standards are shown in Table 11.
TABLE 11 – CUMULATIVE SAVINGSCOST CATEGORY SAVINGS
Technology SBBC Schools $8,727,224
Technology Charter Schools $1,655,111
Music & Art Equipment $6,680
Athletics $404,471
Facilities Construction $3,485,977
Total Savings $14,279,463
FINDING 30
All told, the District’s staff has been able to deliver a number of SMART Program improvements that meet or exceed established standards at a savings of more than $14.2 million. These are moneys that can be reallocated by the SBBC to meet other critical needs.
24
FINDING 31
The Budget Activity Report (reference page 599) suggests that the HVAC improvements at the Dr. Martin Luther King, Jr., Montessori Academy cost almost $24,000 more than what was budgeted for this project. There is no budget flag or discussion of this in the Facilities Construction Report.
RECOMMENDATION 10
Florida TaxWatch recommends the District provide an explanation for the apparent cost overrun
on the HVAC improvements at the Dr. Martin Luther King, Jr., Montessori Academy. The
Facilities Construction Report should be amended as necessary (e.g., budget flag) to reflect this
apparent overrun.

25
SECTION 7—SUPPLIER DIVERSITY OUTREACHThe Supplier Diversity Outreach Program Report includes data specific to Minority/Women Business
Enterprise (M/WBE) participation and committed funding in the SMART Program. The District reports
that, as of June 30, 2017, there were 730 active certified M/WBE firms that provide commodities (supplies),
construction, professional services, and business services to District schools. Of this total:
• 387 (53 percent) are women-owned businesses;
• 573 (78 percent) are minority-owned businesses; and
• 230 (32 percent) are businesses owned by female minorities.
FINDING 32
Despite the District’s outreach efforts, the 730 active certified M/WBE firm represents a decrease of 29 active certified M/WBE firms from the number reported at the end of the last quarter (759).
RECOMMENDATION 11
Florida TaxWatch recommends the District explain the apparent loss of 29 active certified M/
WBE firms since the end of the last quarter.
FINDING 33
The District reports as part of its Contract Compliance Metrics an M/WBE commitment of $5.93 million during the quarter ending June 30, 2017. Through June 30, 2017, the District has issued purchase orders to M/WBEs totaling $30.59 million. This represents a cumulative M/WBE commitment of 19.76 percent.
FINDING 34
In terms of minority (ethnic) spending, 58 percent of the purchase orders issued to M/WBEs were issued to Hispanic-owned firms. In terms of minority (gender) spending, less than one percent of the purchase orders issued to M/WBEs were issued to women-owned firms.
FINDING 35
The District reports 387 certified women-owned firms that provide commodities (supplies), construction, professional services, and business services to District schools; however, SMART Program purchase orders have been issued to less than one percent of these firms.
RECOMMENDATION 12
Florida TaxWatch recommends the District step up its efforts to award purchase orders to
women-owned firms.

26
As previously recommended by Florida TaxWatch, the Q4 2016-17 Supplier Diversity Outreach Program
Report includes information on contracts awarded to or purchases made from M/WBEs and historically
underutilized businesses for safety projects, music and arts equipment, athletics projects, and technology
upgrades. This permits the extent to which the District is utilizing M/WBEs and historically underutilized
businesses for technology upgrades, replacement musical equipment, and replacement kilns to be determined.
FINDING 36
No M/WBEs have received any of the bond money for music and art equipment.
FINDING 37
The Q4 2016-17 Supplier Diversity Outreach Program Report identifies a M/WBE cumulative spend of $10,700 for Athletics projects; however, the Q3 2016-17 Supplier Diversity Outreach Program Report identifies a M/WBE cumulative spend of $15,300 for Athletics projects, a difference of ($4,600).
RECOMMENDATION 13
Florida TaxWatch recommends the District provide an explanation for the apparent $4,600
decrease in M/WBE cumulative spend for Athletics projects from Q3 2016-17 to Q4 2016-17.
The Q4 2016-17 Supplier Diversity Outreach Program Report identifies a M/WBE cumulative spend of
$925,425 for Technology projects. This is the first reported M/WBE expenditure for Technology projects
since inception.
RECOMMENDATION 14
Florida TaxWatch recommends the District provide an explanation for the issuance of $925,425
in purchase orders to M/WBE firms for Technology projects during Q4 2016-17.
RECOMMENDATION 15
As part of its ongoing outreach efforts, the District should continue to step up its efforts to
recruit and retain qualified M/WBEs for all SMART Program categories.

27
SECTION 8—COMMUNICATIONSThe Q4 2016-17 Communications Report outlines the District’s efforts to develop and implement a
comprehensive communications strategy to inform constituents of progress made in implementing the
SMART Program. The Communications Report includes a “tool kit” of techniques designed to ensure
consistency of message.
The report for the quarter ending June 30, 2017 highlights the District’s efforts to provide principals news
about SMART Program milestones that occur at their schools. This is designed to help school administrators
speak more knowledgeably about ongoing improvements that affect their facilities. Other outreach efforts
include:
• Creation of a Project Charter Meeting pamphlet to better inform the community of the importance
of project charter meetings;
• Upgrade the District website to keep the public up-to-date of SMART Program updates;
• Letters sent to school principals advising them of changes in the status of school projects; and
• Use of Twitter to “spotlight” SMART Program accomplishments.
The District reports 6 outreach events at Broward municipalities, 5 outreach events at schools and other
community forums, and 6 outreach events involving the business community
FINDING 38
None of the identified outreach and public education efforts identified in the Q4 2016-17 Communications Report appears to include or involve members of the Bond Oversight Committee. It is unclear what, if any, role the District wants the Bond Oversight Committee to play in the District’s outreach and public education efforts regarding SMART Program implementation.
RECOMMENDATION 16
Florida TaxWatch recommends the Committee request clarification from the District regarding
the Committee’s expected role in the District’s outreach and public education efforts regarding
SMART Program implementation.

28
LOOKING AHEAD The District continues to make progress in implementing the $987 million SMART Program. SMART
Program expenditures now exceed $123 million, and there are more than 1,400 financially active projects.
All of the planned computer devices have been ordered and received, all SBBC schools now comply with
the District’s standard of 1 computer for every 3.5 students, and all technology projects planned for charter
schools have been completed.
The replacement of music and arts equipment continues, with all planned projects accelerated and underway.
Track resurfacing projects are underway and weight room equipment is being ordered. Facility renovation and
construction activities have begun, and in some cases completed, at numerous SBBC schools.
Most importantly, a schedule for implementing planned facility renovations is in place. Already, the District
reports that more than 100 schools are experiencing scheduling issues, mostly associated with the School
Choice Enhancement Program projects. The District has outlined measures to mitigate these delays.
Florida TaxWatch acknowledges and appreciates the District’s continued efforts to increase transparency
in SMART Program reporting. In response to previous Florida TaxWatch recommendations, the District’s
quarterly SMART Program reports:
• Include a revised School Spotlight template now includes more project-specific information on
construction activities at SBBC schools;
• Include summary information that makes it much easier to monitor the District’s progress in
upgrading music and art equipment;
• Include summary information that makes it much easier to monitor the District’s progress in
upgrading athletic facilities;
• Identify construction projects that are experiencing budget and scheduling issues; and
• Include information on contracts awarded to and purchase orders issued to M/WBE firms for all
SMART Program categories.
In addition, the District now includes a new section in the Budget Activity Report that identifies projects that
have been completed and that meet standards.
29
In this report, Florida TaxWatch has offered 38 Findings and 16 Recommendations to help guide the Bond
Oversight Committee in its oversight of the implementation of the SMART Program, and to ensure that
public’s right-to-know how the taxpayer-approved General Obligation Bond funds are being spent is well-
served. Florida TaxWatch looks forward to presenting the results of its review to the Committee and the
public, and to providing continued support and guidance as the Bond Oversight Committee continues its
effective oversight of SMART Program implementation.

this page left blank for formatting purposes

The findings in this Report are based on the data and sources referenced. Florida TaxWatch research is conducted with every reasonable attempt to verify the accuracy and reliability of the data, and the calculations and assumptions made herein. Please feel free to contact us if you feel that this paper is factually inaccurate.
The research findings and recommendations of Florida TaxWatch do not necessarily reflect the view of its members, staff, Executive Committee, or Board of Trustees; and are not influenced by the individuals or organizations who may have sponsored the research.
Copyright © August 2017, Florida TaxWatch Research Institute, Inc. All Rights Reserved.
As an independent, nonpartisan, nonprofit taxpayer research institute and government watchdog, it is the mission of Florida TaxWatch to provide the citizens of Florida and public officials with high quality, independent research and analysis of issues related to state and local government taxation, expenditures, policies, and programs. Florida TaxWatch works to improve the productivity and accountability of Florida government. Its research recommends productivity enhancements and explains the statewide impact of fiscal and economic policies and practices on citizens and businesses.
Florida TaxWatch is supported by voluntary, tax-deductible donations and private grants, and does not accept government funding. Donations provide a solid, lasting foundation that has enabled Florida TaxWatch to bring about a more effective, responsive government that is accountable to the citizens it serves since 1979.
ABOUT FLORIDA TAXWATCH
FLORIDA TAXWATCH RESEARCH LEADERSHIPDominic M. Calabro President & CEORobert Weissert, Esq. Exec. VP & Counsel to the PresidentRobert G. Nave VP of ResearchKurt Wenner VP of Research
FLORIDA TAXWATCH VOLUNTEER LEADERSHIPDavid Mann ChairmanSenator Pat Neal Chairman-ElectSenator George LeMieux TreasurerPiyush Patel SecretarySteve Evans Senior Advisor
RESEARCH PROJECT TEAMRobert E. Weissert Exec. VP & Counsel to the PresidentRobert G. Nave VP of Research Lead Researcher & Author Chris Barry Director of Publications Design, Layout, PublicationAll Florida TaxWatch research done under the direction of Dominic M. Calabro, President, CEO, Publisher & Editor. FOR MORE INFORMATION: WWW.FLORIDATAXWATCH.ORG

106 N. BRONOUGH ST., TALLAHASSEE, FL 32301 O: 850.222.5052 F: 850.222.7476
COPYRIGHT © AUGUST 2017, FLORIDA TAXWATCH RESEARCH INSTITUTE, INC. ALL RIGHTS RESERVED.