monitoring and evaluation of the global action plan on … · vph veterinary public health vre...
TRANSCRIPT

1 Draft AMR M&E Approach Paper
Monitoring and evaluation of the Global Action Plan on Antimicrobial Resistance: Proposed approach DRAFT FOR CONSULTATION, August 2017
Draft: 11 August 2017
The Global Action Plan (GAP) on Antimicrobial Resistance (AMR) has been endorsed by all countries as a
cross-sectoral approach to address the threat of AMR. Political leaders in the United Nations General
Assembly (UNGA) special session further endorsed it in their Political Declaration on AMR in September
2016.
The GAP sets out responsibilities for national governments, for the World Health Organization (WHO),
the Food and Agriculture Organization of the United Nations (FAO), the World Organisation for Animal
Health (OIE) and for other national and international partners involved in the global response to AMR. To
ensure action is being taken, and to assess whether those actions are having the intended results,
monitoring and evaluation (M&E) is required. Therefore, the “One Health” tripartite organisations -
WHO, FAO and OIE - have come together to develop the joint M&E approach documented here.
The aim is to develop a manageable system that will generate useful data to inform operational and
strategic decision making on AMR for the next five to ten years. The approach and framework described
in this paper are based on experience in tackling AMR in the human and animal health sectors. As action
in other sectors (such as the environment and plant health) develops, the monitoring approach and
framework can be further elucidated. The M&E approach recognises that countries are at very different
stages of planning and delivering their responses to AMR; M&E capacity and systems need to be built
and strengthened alongside implementation of the response.
This draft paper outlines current thinking of the tripartite on the approach to M&E of the GAP on AMR
and the resulting global response to AMR. To date, this M&E approach has benefitted from consultation
with external experts. This version is being circulated more widely through an open online consultation
which solicits feedback from countries and institutions with an interest in AMR control and GAP
implementation at national and international levels. Please respond through
http://www.who.int/antimicrobial-resistance/en/

2 Draft AMR M&E Approach Paper

3 Draft AMR M&E Approach Paper
Contents Acronyms .................................................................................................................................................. 3
Executive Summary ................................................................................................................................... 4
1. Purpose of this paper ............................................................................................................................ 8
2. Overall framework for M&E of the GAP on AMR ................................................................................. 9
3. Monitoring and evaluating the process of GAP implementation: activities and outputs .................. 12
4. Monitoring and evaluation of outcomes and goals ............................................................................ 14
5. Next steps ........................................................................................................................................... 17
Annex 1: Summary of results chain for GAP and the response to AMR ................................................. 19
Annex 2: Global level monitoring of outputs ......................................................................................... 20
Annex 3: Proposed Indicators for Specific Outcomes of the Global Action Plan on AMR ...................... 26
Annex 4: Proposed General Outcome and Goal Indicators .................................................................... 27
Acronyms AM Antimicrobial AMR Antimicrobial resistance AST Antimicrobial susceptibility test ATLASS Assessment Tool for Laboratory and AMR Surveillance System (FAO) CIA Critically Important Antimicrobials ESBL Extended-spectrum beta-lactamase FAO Food and Agriculture Organization of the United Nations GAP Global Action Plan GLASS Global AMR Surveillance System HAI Health-care associated infections ICD International Classification of Diseases IHR International Health Regulations IPC Infection prevention and control JEE Joint External Evaluation M&E Monitoring and Evaluation MRSA Methicillin-resistant Staphylococcus aureus NAP National Action Plan on AMR OIE World Organisation for Animal Health (original name Office International des Epizooties) PVS Performance of Veterinary Services R&D Research and Development UNEG United Nations Evaluation Group UNGA United Nations General Assembly VPH Veterinary Public Health VRE Vancomycin-resistant enterococci WASH Water, sanitation and hygiene WHA World Health Assembly WHO World Health Organization

4 Draft AMR M&E Approach Paper
Executive Summary
The Global Action Plan (GAP) on Antimicrobial Resistance (AMR) was adopted by the World Health
Assembly (WHA) in May 2015. It was also supported through decisions of the governing bodies of the
Food and Agriculture Organization of the United Nations (FAO) and the World Organisation for Animal
Health (OIE) in 2015. In 2016, the United Nations General Assembly (UNGA) reaffirmed the GAP as the
blueprint for tackling AMR and heads of state committed to work at global, regional and national levels
in line with the GAP. The GAP sets out five strategic objectives to address AMR, with the goal of
ensuring, for as long as possible, continued ability to treat and prevent infectious diseases with effective
and safe medicines that are quality-assured, used in a responsible way, and accessible to all who need
them. This should result in fewer deaths and a reduction in morbidity resulting from infections affected
by AMR.
This paper summarises the approach proposed for monitoring and evaluation (M&E) of both the
implementation of the GAP and the resulting effects on AMR and on health. M&E is required at both
national and global levels; for management, to identify and respond to barriers to progress, and to
inform course correction, in order to increase impact and value for money. M&E is also needed for
accountability, within countries and at regional and global levels. This includes reporting back to the
global health community, including the governing bodies of WHO, FAO and OIE, and the Interagency
Coordination Group on AMR that was established by the UN General Assembly.
AMR is an inter-sectoral issue that requires action across sectors, as described in the GAP. This paper is
written from a tripartite (WHO, FAO and OIE) perspective, reflecting the need to monitor activity within
human and animal health, plant production and the environment, and the role of the tripartite in
supporting and enabling progress on implementation of the GAP.
In developing the M&E plan for the GAP, the following principles are proposed:
In view of the multi-sectoral nature of AMR, it would be useful to establish standard measures
of goals and outcomes across humans, animals, plants and the environment, and coordinate
monitoring and reporting.
In developing national action plans on AMR (NAPs), countries set their own targets that suit the
country context. Global targets may be established at a later stage. The M&E approach
described in this paper therefore does not include national or global targets.
Whilst there will be some indicators that are relevant across countries, countries are starting
from very different points in their capacity to address AMR and monitor progress as well as in
their resources and capacity for doing so. Expectations and proposed indicators should take this
into account.
The M&E process should use existing systems where possible, and strive to minimize the burden
of additional data requirements.
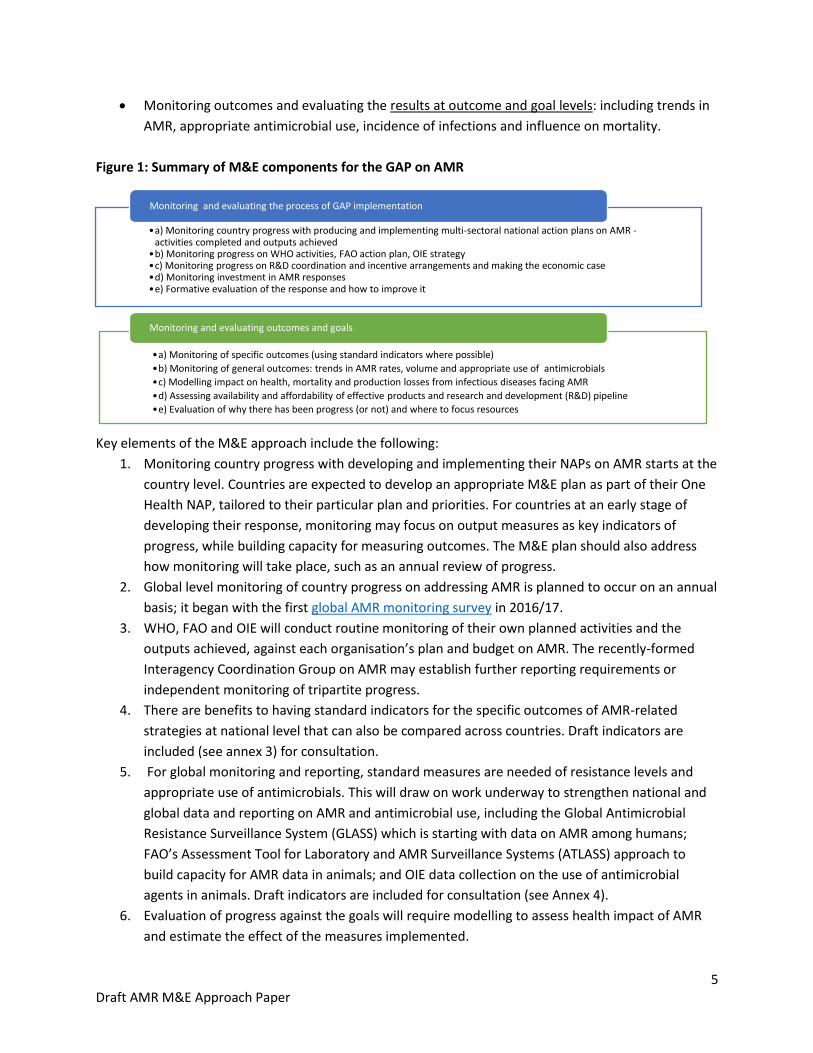
M&E requirements can be split into two broad elements. The approach is summarised in Figure 1:
Monitoring the process of GAP implementation and evaluating how to improve the response:
how far are AMR national action plans being developed and implemented, how are international
organisations playing their roles, are planned outputs being achieved?
5 Draft AMR M&E Approach Paper
Monitoring outcomes and evaluating the results at outcome and goal levels: including trends in
AMR, appropriate antimicrobial use, incidence of infections and influence on mortality.
Figure 1: Summary of M&E components for the GAP on AMR
Key elements of the M&E approach include the following:
1. Monitoring country progress with developing and implementing their NAPs on AMR starts at the
country level. Countries are expected to develop an appropriate M&E plan as part of their One
Health NAP, tailored to their particular plan and priorities. For countries at an early stage of
developing their response, monitoring may focus on output measures as key indicators of
progress, while building capacity for measuring outcomes. The M&E plan should also address
how monitoring will take place, such as an annual review of progress.
2. Global level monitoring of country progress on addressing AMR is planned to occur on an annual
basis; it began with the first global AMR monitoring survey in 2016/17.
3. WHO, FAO and OIE will conduct routine monitoring of their own planned activities and the
outputs achieved, against each organisation’s plan and budget on AMR. The recently-formed
Interagency Coordination Group on AMR may establish further reporting requirements or
independent monitoring of tripartite progress.
4. There are benefits to having standard indicators for the specific outcomes of AMR-related
strategies at national level that can also be compared across countries. Draft indicators are
included (see annex 3) for consultation.
5. For global monitoring and reporting, standard measures are needed of resistance levels and
appropriate use of antimicrobials. This will draw on work underway to strengthen national and
global data and reporting on AMR and antimicrobial use, including the Global Antimicrobial
Resistance Surveillance System (GLASS) which is starting with data on AMR among humans;
FAO’s Assessment Tool for Laboratory and AMR Surveillance Systems (ATLASS) approach to
build capacity for AMR data in animals; and OIE data collection on the use of antimicrobial
agents in animals. Draft indicators are included for consultation (see Annex 4).
6. Evaluation of progress against the goals will require modelling to assess health impact of AMR
and estimate the effect of the measures implemented.
•a) Monitoring country progress with producing and implementing multi-sectoral national action plans on AMR -activities completed and outputs achieved
•b) Monitoring progress on WHO activities, FAO action plan, OIE strategy •c) Monitoring progress on R&D coordination and incentive arrangements and making the economic case•d) Monitoring investment in AMR responses•e) Formative evaluation of the response and how to improve it
Monitoring and evaluating the process of GAP implementation
•a) Monitoring of specific outcomes (using standard indicators where possible)
•b) Monitoring of general outcomes: trends in AMR rates, volume and appropriate use of antimicrobials
•c) Modelling impact on health, mortality and production losses from infectious diseases facing AMR
•d) Assessing availability and affordability of effective products and research and development (R&D) pipeline
•e) Evaluation of why there has been progress (or not) and where to focus resources
Monitoring and evaluating outcomes and goals
6 Draft AMR M&E Approach Paper
7. An independent formative evaluation is proposed for 2018, focussing on lessons from
implementation of GAP at country, regional and global levels. This could provide the basis for
the report to UNGA in 2018/19. The evaluation could be commissioned jointly by a group of
interested partners or by the Interagency Coordination Group.
8. A more extensive evaluation is proposed after about 5 years, if funds allow, preferably jointly
commissioned and funded by several partners. This evaluation would identify why results have
been achieved (or why they have not) and assess how to increase impact.
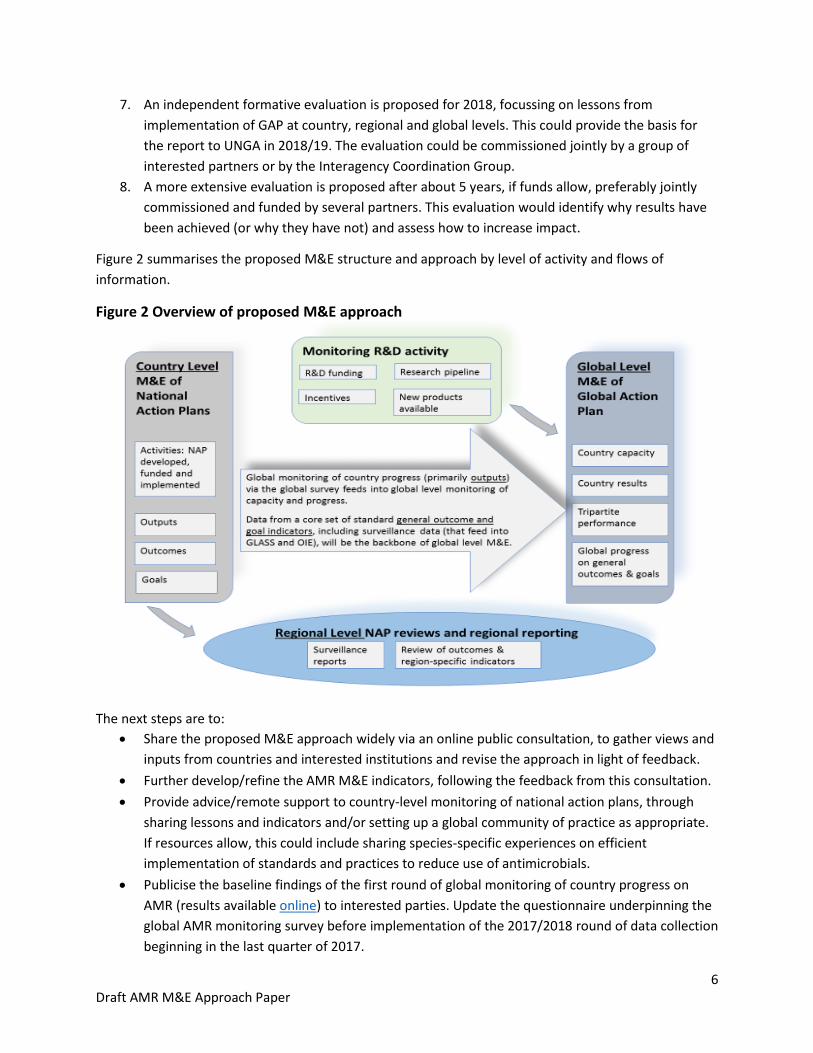
Figure 2 summarises the proposed M&E structure and approach by level of activity and flows of
information.
Figure 2 Overview of proposed M&E approach
The next steps are to:
Share the proposed M&E approach widely via an online public consultation, to gather views and
inputs from countries and interested institutions and revise the approach in light of feedback.
Further develop/refine the AMR M&E indicators, following the feedback from this consultation.
Provide advice/remote support to country-level monitoring of national action plans, through
sharing lessons and indicators and/or setting up a global community of practice as appropriate.
If resources allow, this could include sharing species-specific experiences on efficient
implementation of standards and practices to reduce use of antimicrobials.
Publicise the baseline findings of the first round of global monitoring of country progress on
AMR (results available online) to interested parties. Update the questionnaire underpinning the
global AMR monitoring survey before implementation of the 2017/2018 round of data collection
beginning in the last quarter of 2017.
7 Draft AMR M&E Approach Paper
Continue work with regional agencies to coordinate monitoring approaches and reporting on
indicators.
Define the scope of the formative evaluation proposed in 2018.
Make recommendations on M&E to the Interagency Coordination Group on AMR.
For further information, please contact Pravarsha Prakash in the WHO AMR secretariat
([email protected]). She will link with FAO and OIE as needed.

8 Draft AMR M&E Approach Paper
1. Purpose of this paper This paper sets out the approach and framework proposed for M&E of the GAP on AMR. It focuses on
the need to monitor the processes of development and implementation of global and national action
plans on AMR and to evaluate how far these are contributing to the outcomes and goals of controlling
AMR. It sets out suggestions on indicators with a view to selecting the most feasible and appropriate
after the consultation. The paper provides the basis for consultation with stakeholders interested in
progress of the GAP and the global response to AMR.
To reflect the inter-sectoral nature of AMR, the paper was developed jointly by the One Health tripartite
organisations (WHO, FAO and OIE) and identifies the approach to M&E across sectors. Some M&E1
activities and processes will be conducted jointly while others will be focused at sector level. What
matters is that data is collected coherently, is shared, and is compatible and comparable across sectors.
Reporting on implementation and results will be required at various levels and to the global community.
At country level, it is envisaged that there will be a review and reporting on progress against national
action plans (NAPs) on AMR. Global level reporting includes data submission to: the WHA; the FAO
governing bodies, (through reports to the Committee on Agriculture, agreed in FAO conference C
2015/28 Rev.1); the OIE General Assembly; and the United Nations General Assembly (UNGA)2.
The structure of this paper is as follows:
Section 2 lays out the overall M&E framework, which underlies the M&E approach and the
choice of indicators.
Section 3 looks at monitoring and evaluating the implementation process and outputs –
monitoring what progress has been made and whether planned outputs have been delivered,
and formative evaluation to identify where remedial action is required.
Section 4 addresses M&E of the outcomes and goals – monitoring whether the intended
outcomes are being achieved, and evaluating whether this is resulting in progress towards the
goals of conserving effective medicines and reducing the impact of infectious diseases on health.
Section 5 outlines the next steps in finalising the approach and implementation.
Annex 1 sets out the results framework and annexes 2 to 4 give potential standard indicators at
different levels.
1 This paper uses the definition of evaluation in the 2016 United Nations Evaluation Group (UNEG) Norms and Standards for
Evaluation that states: “An evaluation is an assessment, conducted as systematically and impartially as possible, of an activity,
project, programme, strategy, policy, topic, theme, sector, operational area or institutional performance. It analyses the level of
achievement of both expected and unexpected results …….. An evaluation should provide credible, useful evidence-based
information that enables the timely incorporation of its findings, recommendations and lessons into the decision-making
processes of organizations and stakeholders.” Monitoring is defined as “systematic collection of data on specified indicators to
provide management and stakeholders …. with indications of the extent of progress, achievement of objectives and progress in
use of allocated funds”. OECD DAC Glossary. 2 Political Declaration of the high-level meeting of the General Assembly on antimicrobial resistance, paragraph 15 requests a
report to the 73rd session, UNGA Resolution A/Res/71/3, adopted 5 October 2016.
9 Draft AMR M&E Approach Paper
2. Overall framework for M&E of the GAP on AMR
2a. The Results Chain:
The GAP expects that all countries will develop their own NAPs on AMR in line with the global plan, and
sets out 5 strategic objectives. The stated goal of the GAP is to ensure “continuity of the ability to treat
and prevent infectious diseases with effective and safe medicines ….”. This goal contributes to the
overarching goal of decreasing the impact of infectious diseases on human and animal health3. This
overarching goal is more readily communicated than the stated goal of preserving the efficacy and
safety of medicines, and links more directly to the Sustainable Development Goals.
Two general outcomes have been defined: to slow the development of resistance and to make more
appropriate use of antimicrobials (including access when needed).
Slowing development of resistance is intended to encompass delaying the emergence of
resistance, slowing the spread and where possible, reversing trends to achieve a decline in
resistance levels. Countries are at different stages and face different risks, and will need to
define for their own context what are realistic targets for various pathogens and resistance
mechanisms.
More appropriate use includes reducing inappropriate use – whether this means incorrect use in
terms of dosage or duration; use for the wrong purpose (e.g. antibiotics for viral diseases); use
of poor quality medicines; and use of medicines important for human health to promote animal
growth. It should take into account access to medicines when needed (for animal or human
health).
The five specific outcomes in the framework relate directly to the five GAP strategic objectives. These
are expected to contribute to the general outcomes and ultimately the goals.
On the human health side, monitoring and reporting related to drug resistance for HIV, TB and malaria
already exists as part of the disease programmes in relevant countries. In view of this, for monitoring of
GAP and AMR, the output monitoring survey and proposed outcome measures focus on antibiotics and
resistance to them, and not on progress in addressing resistance in these three diseases4. For evaluating
progress towards the goals, resistance in the three diseases should be included - as they contribute a
significant share of the burden of resistance.
AMR in animal health currently focusses mainly on antibiotics; other antimicrobials will be progressively
included. For plants and the environment, all types of antimicrobials are included.
Figure 3 sets out a results framework for M&E of the GAP and the resulting global response to AMR as a
diagrammatic results chain, with the results statements outlined in more detail in annex 1. The figure
proposes a set of summary outputs, specific and general outcomes, and goals related to the GAP.
3 Of course, action on AMR is only one component towards achievement of this overarching goal. 4 This focus on antibiotics relates to the monitoring approach – countries may identify synergies and opportunities for
implementation of measures to address AMR that work with disease programmes as well as the broader health system.

10 Draft AMR M&E Approach Paper
This framework is not exhaustive, and there are other components that may be helpful to monitor for
some purposes, such as the drivers of antibiotic consumption (burden of infectious disease, requirement
for food production etc); unintended consequences and changes in legislative process.
2b. Roles and responsibilities for M&E Multisectoral NAPs on AMR should be line with the global action plan. In order to gauge success and
gather data that will inform programming decisions, countries will need to monitor implementation and
assess the results of their NAPs. Therefore, countries are advised to develop an M&E plan for their NAPs,
which will include country-appropriate indicators and – where possible – targets for output, outcome
and goal levels. Each country should develop a set of indicators that is most appropriate to its particular
setting and circumstances.
The NAP M&E will feed into the GAP M&E framework (see figure 2 above for the structure of M&E). The
aim is to define a minimal set of indicators that are common to all countries, to provide an aggregated
view of the AMR situation around the world and to enable comparisons over time and across geographic
locations. Country-level data collection may be integrated with other systems5.
Given that AMR-related M&E systems are not generally very advanced and therefore data availability is
limited in countries at an early stage of the response to AMR, it may be most realistic to focus on
monitoring outputs in the short term or using output-level proxies for the outcome level monitoring,
whilst systems to measure outcomes and impact are developed.
Tripartite partners will regularly review country demand for experience-sharing and guidance around
NAP monitoring indicators in their respective disciplines, and work with partners to respond to needs.
5 For example, use general health service availability surveys to monitor availability of antimicrobial medicines, water,
sanitation and IPC measures in health facilities; and monitor adoption of Good Agricultural Practices and standards on
responsible and prudent antimicrobial use in animals, including good husbandry and hygiene practices.

11 Draft AMR M&E Approach Paper
Figure 3: Overall framework for monitoring and evaluation of the AMR Global Action Plan
August 2017 Acronyms: AM – antimicrobial. IPC – Infection prevention and control. R&D – Research and development. WASH – Water, sanitation and hygiene.
12 Draft AMR M&E Approach Paper
3. Monitoring and evaluating the process of GAP implementation: activities and outputs
The proposed approach to monitoring the process of GAP implementation and evaluating how to
improve the response has 5 main elements:
3a. Monitoring country progress and outputs
3b. Monitoring progress of the tripartite organisations, WHO, FAO and OIE
3c. Monitoring progress on R&D coordination, incentive arrangements and making the economic case
3d. Monitoring investment in AMR responses
3e. Formative evaluation of the AMR response and how to improve it
3a. Monitoring country progress and outputs:
As indicated above, countries will need to monitor progress on the activities and outputs in their
NAPs, to support implementation of the NAP and report to national governance mechanisms.
It is proposed to develop a “menu” of indicators from which the countries may choose, aligned
with the global AMR monitoring survey. It is hoped that this menu will in the shorter term
provide a foundation for effective country level M&E systems related to AMR, and in the longer
term facilitate the collection of critical data on AMR globally.
Monitoring at the global level of AMR-related outputs has started through the global AMR
monitoring survey that summarises country capacity, coverage and performance on key aspects
of the GAP. For this survey, a self-assessment questionnaire was developed jointly between
WHO, FAO and OIE and circulated in the last quarter of 2016 to all countries, to collect baseline
data6 for the set of indicators in Annex 2. The survey responses were made available online in
May 2017 and used to report on country progress to the WHA, FAO, OIE and other partners7.
The plan is to repeat the questionnaire annually to show trends over time. The questionnaire is
being reviewed and updated before it is circulated again in the last quarter of 2017.
The format for the global AMR monitoring questionnaire (rating on a five-point scale) is
consistent with the IHR joint external evaluation (JEE) tool. The JEE tool is being revised in 2017,
with the intention that it should align with the AMR questionnaire, so that the JEE can
contribute to validation of the global AMR monitoring survey responses. The JEE is a voluntary
exercise and only envisaged on a five-yearly basis, so this will provide limited validation.
Another option for validating country responses to the global AMR monitoring survey is to
include an independent/external element in national AMR progress reviews. These reviews
could be conducted annually, with independent input every two years, and form the basis for
monitoring national progress and completing the self-assessment. They could be similar to the
regular TB and malaria programme reviews and joint annual health sector reviews conducted by
many countries. For AMR, this would need to be a multi-sector exercise that engages key
stakeholders. Other forms of independent reviews could also be considered.
6 For questionnaire see http://www.who.int/antimicrobial-resistance/national-action-plans/AMR-self-assessment-2016/en/ 7 For results see: https://extranet.who.int/sree/Reports?op=vs&path=%2FWHO_HQ_Reports/G45/PROD/EXT/amrcsat_Menu
13 Draft AMR M&E Approach Paper
Regarding animal health, the OIE evaluation of performance of veterinary services (OIE PVS
pathway) tool will be reviewed with the support of a think tank, which will consider how AMR-
related needs can be further addressed.
The OIE sent a questionnaire on “Global action to alleviate the threat of AMR: progress and
opportunities for future activities under the ‘One Health’ initiative” to Member Countries and
reported to the OIE General Assembly in May 20178.
3b. Monitoring progress of the tripartite: WHO, FAO and OIE:
WHO will monitor its own activities and performance through the WHO GAP deliverables set out
in its programme budget. Six monthly reviews of progress by regional offices and work streams
are planned. WHO monitoring will give particular attention to its performance and progress in
countries that are most significant for the global spread of AMR.
OIE will monitor in line with the organisation’s practices, including follow up by the AMR ad hoc
Group (that meets twice a year) and relevant Commissions, to inform Member Countries on a
regular basis. Also, yearly reports will be provided during each General Session.
FAO will monitor implementation and provide feedback to Member Countries according to the
organisation’s rules.
The tripartite will report to their respective governing bodies and provide information to the
Interagency Coordination Group established by the UNGA Declaration.
3c. Monitoring progress on research and development (R&D) coordination, incentive arrangements
and making the economic case:
AMR M&E should include progress on the following elements of GAP objective 5:
Global progress on establishing new mechanisms and incentives for R&D for new products
Existence and use of mechanisms that enable appropriate access to and uptake of new products
The degree to which R&D relates to priority pathogens; and
Progress on making the economic case for investing to address AMR.
3d. Monitoring investment in AMR responses:
Objective 5 of the GAP includes building sustainable investment in capacity to counter AMR. This
will require monitoring of funding from domestic and international sources, for country action
and for R&D. Monitoring country investment is challenging because so many of the activities to
prevent and control AMR are integrated with other programs and funded as part of those
programs – few are additional activities that will be funded and budgeted separately. A standard
approach to identifying costs of national plans, expenditures and sources of funding is proposed.
Measurement of investment in relevant R&D should aim to assess how much is additional,
stimulated by GAP and the collective response.
3e. Formative evaluation of the AMR response and how to improve it:
8 For the report see: http://www.oie.int/fileadmin/home/eng/Media_Center/docs/pdf/85SG/TT1_AMR/A_85SG_9.pdf

14 Draft AMR M&E Approach Paper
A formative process evaluation (or mid-term review) is proposed as part of the M&E approach. Ideally
this would involve multiple partners; it could perhaps be commissioned by the Interagency Coordination
Group on AMR. Timing suggested is in 2018, once implementation of NAPs can be expected to have
started. The evaluation would be designed to:
Review progress in implementing the GAP, including through multi-sectoral working at country
level;
Learn from country experience; and
Identify how to strengthen implementation, including how to improve allocation of resources.
4. Monitoring and evaluation of outcomes and goals
Within the context of this AMR framework, monitoring of outcomes and evaluation of results and goals
includes
4a. Monitoring the GAP specific outcomes in countries and in R&D
4b. Assessing general outcomes: trends in AMR rates, levels and appropriateness of antimicrobial use
4c. Modelling impact on human health and mortality and on animal health, welfare and production from
infectious diseases facing AMR
4d. Assessing the availability and affordability of effective products
4e. Evaluation of why there has been progress and where to focus resources.
4a. Monitoring the five GAP specific outcomes – progress of countries and R&D:
Countries will need to monitor progress on the specific outcomes. Annex 3 suggests possible
indicators, both proxy and/or shorter term measures that could already be available in all or
most countries, and outcome measures for which data may not yet be available but for which
capacity can be developed. Selection of a short list of specific outcome indicators is planned
following input from the consultation that will take into account what country-level data is likely
to be available or easily accessible.
Standard indicators and tools to facilitate measurement exist for some outcomes. For others, it
is proposed to define standard measures and develop tools that will allow comparison across
countries.
Regional and sub-regional institutions can support monitoring of specific outcomes and collect
results for regional analysis and review. Some core indicators will be reviewed at global level, by
the tripartite.
The Global AMR Surveillance System (GLASS) will monitor progress of surveillance systems
towards the outcome of delivering a stronger evidence base on AMR and antimicrobial use in
humans.
OIE will monitor progress with collecting data on use in animals.
R&D outcomes will be reflected in a growing pipeline with faster development of new products
(antimicrobials, vaccines, diagnostics and alternative treatments) and, ultimately, higher
numbers of approved medicines for priority infections.

15 Draft AMR M&E Approach Paper
4b. Assessing general outcomes: trends in AMR rates, levels and appropriateness of antimicrobial use:
To facilitate global reporting to a wide, non-specialist audience, it would be useful to agree a
limited number of standard indicators to measure trends in resistance rates and use of
antimicrobials. There needs to be a consensus on which indicators to use and metrics, based on
GLASS and OIE data collection for animals. Potential indicators are presented in Annex 4.
Countries are developing their surveillance systems to monitor AMR levels and trends. In human
health, the GLASS compiles global data from national systems, surveys and special studies to
produce global reports on AMR levels and trends in humans. These reports will include the
incidence of drug resistant infections in health facilities.
For animals, the ATLASS will foster standardised AMR surveillance systems, enabling comparable
and validated data on AMR to be collected and analysed.
As systems develop, the data on AMR in human health should become more representative of
the community alongside hospital and other health care settings, and thus include a wider range
of geographic and socio-economic groups. Animal health related AMR data should also become
more detailed and species-specific. To assess trends, there may need to be interpretation or
adjustment for how representative the data is.
Periodic point prevalence studies on AMR may be useful where surveillance systems are
inadequate and while they are being strengthened.
The OIE standard on harmonisation of national AMR surveillance and monitoring programmes
(chapter 6.7 of the Terrestrial Animal Health Code) is under revision to include priority
pathogens for monitoring for the major food producing animal species.
Measuring the volume of antimicrobial use in human health involves collecting data on total
antimicrobial sales, dispensing and/or prescribing (often referred to as consumption studies).
New survey tools are being piloted in 2017 to measure antimicrobial use in hospitals and other
health care settings.
Data on use in animals are collected and analysed by the OIE, by type of use, either for total
volume sold/consumption, or, where possible, by species, antimicrobial class and type of use
(therapeutic or growth promotion). OIE published a first report and the second round of
antimicrobial use data collection in animals is ongoing.
Assessing appropriateness of antimicrobial use is more complex, and is likely to require studies
of service quality in private and public sectors. Some countries are mainly concerned about
over-use of antimicrobials, while in many countries, it is also important to address access
(whether there is sufficient access to medicines when needed, which includes availability and
affordability of medicines). This also applies to animal health.
WHO will work with partners to share experience on how best to assess access and appropriate
use. Work is ongoing to develop standard surveys of availability and price of medicines.
Monitoring how prudently antimicrobials are used is also a challenge for animal health.
Data will need to be collected on AMR and antimicrobial use in plant production.
Countries can request support from WHO, FAO, OIE and other partners to strengthen their
national systems, including developing laboratory capacity, animal health services, legislation,
building systems for surveillance of resistance and systems to monitor antimicrobial use.
16 Draft AMR M&E Approach Paper
Whilst systems for AMR surveillance and monitoring of use are being developed and
implementation is getting underway, countries can review proxy and short-term indicators of
progress, as suggested in annex 49.
4c. Modelling impact on human health and mortality and on animal health, welfare and production
from infectious diseases facing AMR:
Measuring the impact on health (fewer infections and lower mortality) will require data for
standard tracer conditions and modelling at global level. Work is planned to estimate the
burden of disease from AMR and these estimates can be used in modelling health impacts of
AMR prevention and control efforts. If possible, modelling would allow for what would have
happened without the GAP.
Various organisations are supporting and working on modelling related to AMR; to maximise its
usefulness to the global community, global coordination and consistency in approaches is
proposed. Indicative measures are in annex 4.
On the animal side, further analysis is required to determine how feasible it would be to
measure or model effects of changes in antimicrobial use for treatment and prevention on
animal health, welfare and productivity. The impact of phasing out growth promotion use of
medically important antimicrobials on productivity in low- and middle-income countries, and
the economic impact of amending production practices, could also be part of the exercise.
More information on AMR from routine death and discharge data is being incorporated into the
revised international classification of diseases (ICD 11). This should allow AMR information to be
captured better.
4d. Assessing the availability and affordability of effective products:
The general outcome of new diagnostic, preventive and treatment products delivered and in the
pipeline, including vaccines, should be reviewed, with assessment of how far development and
uptake of new products has been influenced by the GAP and related collaboration, market
shaping and incentive mechanisms.
The goal of ensuring that there continue to be effective and safe medicines and preventive
products (including vaccines) available (both existing and new products) can be assessed by
mapped and identifying gaps in the products available, with updating in the light of emerging
resistance patterns.
4e. Evaluation of why there has been progress and where to focus resources:
An evaluation of impact and value for money (particularly efficient allocation and use of resources) after
about 5 years would be desirable, to feed into review and updating of GAP. An independent assessment,
jointly commissioned and funded by multiple partners is proposed, in line with United Nations
Evaluation Group (UNEG) guidance. It would evaluate how appropriate the GAP is and how well
implemented, including in a sample of countries.
9 In the short term, it is likely that many countries will not be able to measure some outcome indicators. In this situation,
countries should seek to measure a relevant “proxy indicator” which demonstrates progress towards the intended outcome.
The proxy may be an output indicator or even a process indicator.
17 Draft AMR M&E Approach Paper
5. Next steps
This draft M&E approach has benefitted from inputs from a range of partners and experts, including the
WHO Strategic and Technical Advisory Group on AMR and experts within FAO, OIE and WHO. A meeting
of experts from human and animal health and from all regions was held in June 2017. The experts
provided advice on indicators (incorporated in annexes 3 and 4) and stressed the importance of being
realistic about practical indicators to show progress for countries at different stages of their response to
AMR. The public consultation on the M&E approach aims to gather input from the wider international
community, including member states.
Definition of indicators for outcomes and goals is challenging and requires further work and
consultation. Based on the results framework in Figure 3 and Annex 1, Annex 3 sets out suggestions for
indicators (or types of indicators) for monitoring specific outcomes and Annex 4 addresses indicators for
the general outcomes and goals. Some of these require further refinement to specify the indicator more
clearly and some require studies and consultation to develop the most appropriate indicators. Data
collection tools for some of the indicators are under development. The number of indicators needs to be
reduced for some outcomes and the consultation will assist in selecting those that are most feasible and
useful. Once the broad approach to M&E and standard indicators are defined, further work is planned
on definitions and sources of indicators.
Standard measures of trends in resistance and their impact on health are probably the most challenging
to agree. The intention is to have a small number of indicators that can be used to communicate trends
and impact including to a non-specialist audience. However, there are multiple pathogen and drug
combinations10 and the relevance of different pathogens varies geographically, while the transmission of
resistance across pathogens suggests that the focus should not only be on specific pathogens. Following
the expert meeting in June, it is proposed to select resistant pathogens/commensals as sentinel or
tracer measures for global reporting (see Annex 4). It was also agreed to consider further the potential
use of an aggregate measure such as a Drug Resistance Index relevant for human health11.
Modelling approaches for mortality also need to be agreed, recognising limited availability of data in
some cases and that not all deaths of people who have a resistant infection are caused by the
resistance. The analysis needs to consider the interaction between prevention of infection and AMR – if
infections are prevented, there should be less use of antimicrobials, which would slow down the
emergence and spread of AMR; while lower prevalence may mask the effect of AMR on mortality rates.
Increasing the evidence on the impact of resistance on clinical outcomes is important as the basis for
modelling health impacts. WHO is starting a review of approaches to modelling the health burden of
AMR and can take a role in establishing coherent approaches across different modelling exercises.
10For example, the international community has agreed that GLASS should gather data on 8 pathogens with multiple
antibacterial classes for 7 of them to monitor resistance in humans. For animals, there are multiple species as well as
combinations to monitor (OIE’s report on use identifies more than 13 food-producing species and production settings. 11 Laxminarayan and Klugman, Communicating trends in resistance using a Drug Resistance Index, BMJ Open 2011.

18 Draft AMR M&E Approach Paper
Some countries may seek support with developing their M&E plans. This can include establishing a
community of practice to share experience with implementing M&E of national AMR plans. As noted
above, there is also work planned to develop a ‘menu’ of output indicators that can be used for NAPs.
The High Level Meeting at UNGA defined a new Interagency Coordination Group on AMR. The Group has
been established, and held a first meeting in May 2017. The tripartite is proceeding with technical work
on defining indicators and will present this monitoring framework and indicators to the Group for
consideration.

19 Draft AMR M&E Approach Paper
Annex 1: Summary of results chain for GAP and the response to AMR
Links to Figure 3.
Result chain level
Results statement
Goals Overarching goal: Lower impact from infectious diseases on human and animal health.
GAP goal: Continued ability to treat and prevent infectious diseases with effective and safe medicines.
General outcomes
A: Slower development of resistance (reduce emergence and spread of resistance or reduce levels).
B: More appropriate use of antimicrobials, with increased access when needed and less inappropriate use.
C: New medicines, diagnostics, vaccines and other interventions related to priority infections are available and affordable.
Specific outcomes
1: Improved awareness of AMR & behaviour change among policy makers, farmers, veterinary and human health workers, food industry and the general public.
2: Strengthened knowledge and evidence base is used for policy and practice decisions.
3: Effective prevention reduces infection incidence in health facilities, farms & communities, and reduces environmental contamination.
4: Optimized use of antimicrobials in human and animal health; animal use for growth promotion phased out.
5: Increased R&D on new medicines, diagnostics, vaccines & other interventions related to priority pathogens.
Outputs 1.1 Awareness and understanding increased of AMR risks and response in human health.
1.2 Awareness and understanding of AMR risks and response in animal health, plants and food production.
1.3 Training and professional education on AMR in the human health sector.
1.4 Training and professional education on AMR in the veterinary sector.
1.5. Strengthened veterinary services.
2.1 Monitoring system for consumption & appropriate use of antimicrobials in human health.
2.2 Monitoring system for antimicrobial use in animals and plant production.
2.3 Surveillance system for AMR in humans.
2.4 Surveillance system for AMR in animals and foods.
2.5 Research on resistance and how to improve antimicrobial use conducted and published.
3.1 Infection Prevention and Control in human health care.
3.2 Good animal health and management practices and good hygiene to prevent infections and reduce the use of antimicrobials in animals and AMR transmission in food production.
3.3 Scaled up water supplies, sanitation, hygiene and immunisation to reduce spread of infections in communities.
4.1 Optimising antimicrobial use & regulation in human health.
4.2 Optimising antimicrobial use & regulation in animal and plant production.
4.3 Legislation and/or regulations to prevent contamination of the environment with antimicrobials.
5.1 Estimates of funding needs and economic case for investment in AMR responses.
5.2 Coordinated efforts, with priorities defined and mechanisms established to incentivize relevant R&D.
5.3. Increased investment in R&D to address AMR and prevent infection.

20 Draft AMR M&E Approach Paper
Annex 2: Global level monitoring of outputs This table sets out the measures of country progress with implementation of strategies to address AMR, based on the global AMR monitoring
survey in 2016/17 with some updating. This survey is under review before the next round of data collection late in 2017 so the indicators may be
updated further. The survey asks countries to self-assess against key aspects of the GAP. In order to keep the length of the survey manageable,
some elements are not included.
Specific outcome Outputs defined in
results framework
Output indicators for global-level tripartite monitoring (based on country questionnaire)
1. Improved
awareness of AMR & behaviour change among policy makers, farmers, veterinary and human health workers, food industry and the general public.
1.1 Awareness and
understanding increased of AMR risks and response in human health.
Distribution of countries across the scale from A to E (for all countries/by region/high population countries etc.): A. % of countries with no significant awareness-raising activities on AMR.
B. % of countries with some activities in parts of the country to raise awareness about antibiotic resistance and actions to
address it.
C. % of countries with nationwide antibiotic awareness campaign targeting the general public, with government
involvement.
D. % of countries with nationwide, government-supported antibiotic awareness campaign targeting specific groups (e.g.
doctors, pharmacists, nurses, drug sellers).
E. % of countries with focused, national scale activities to change behaviour in target groups in human health, both public
and private sectors; and monitoring of awareness and behaviour change in last 5 years.
1.2 Awareness and
understanding of AMR risks and response in animal health, plants and food production.
Distribution of countries across the scale from A to E, (for all countries/by region/high animal producing countries etc.) i.e.:
A. % of countries with no significant awareness-raising activities on risks of antibiotic resistance for animal health and
risks of transmission of resistant pathogens through the food chain.
B. % of countries with some activities in parts of the country to raise awareness about antimicrobial resistance and actions
to address it.
C. % of countries with nationwide, antimicrobial awareness campaign targeting food producers and farmers, with
government involvement.
D. % of countries with nationwide, government-supported antimicrobial awareness campaign targeting specific groups
(e.g. veterinarians, veterinary para-professionals, farmers, pharmaceutical agents).
E. % of countries with focused, national scale activities to change behaviour in target groups in animal health, animal
husbandry and in the food chain, in both public and private sectors; and monitoring of awareness and behaviour change
in last 5 years.
1.3 Training and
professional
education on AMR
Distribution of countries across the scale from A to E, i.e.:
A. % of countries with no training for health workers on AMR.
B. % of countries with ad hoc training courses in some health-related disciplines.
C. % of countries where AMR is covered in some pre-service training and/or some special courses for health workers.

21 Draft AMR M&E Approach Paper
Specific outcome Outputs defined in
results framework
Output indicators for global-level tripartite monitoring (based on country questionnaire)
in the human
health sector.
D. % of countries where continuing professional development (CPD) opportunities are available nationwide for health
workers on AMR and implications for antimicrobial use & infection prevention.
E. % of countries where AMR is systematically incorporated in pre-service training curricula for all relevant health cadres.
Regular continuing professional development on AMR reaches relevant groups for human health nationwide, in public
and private sectors.
1.4 Training and
professional
education on AMR
in the veterinary
sector.
Distribution of countries across the scale from A to E, i.e.:
A. % of countries with no training of veterinary workforce on AMR.
B. % of countries with ad hoc training courses on AMR available.
C. % of countries with regular participation in training opportunities on AMR.
D. % of countries where training opportunities are available nationwide for public and private sector veterinarians,
veterinary para-professionals and animal health workforce on mechanisms leading to AMR, regulations and best
practices for antimicrobial use.
E. % of countries with AMR incorporated in core veterinary education and continuing professional development for
veterinarians, veterinary para-professionals and others involved in animal health and agriculture.
1.5 Strengthened
veterinary
services.
Distribution of countries across the scale from A to E, i.e.:
A. % of countries with no systematic approach at national level to strengthening Veterinary Services.
B. % of countries where veterinary services assessed and plans developed to improve capacity, through a structured
approach such as OIE Performance of Veterinary Services (PVS) Evaluation and PVS Gap Analysis missions.
C. % of countries with implementation of plan to strengthen capacity gaps in Veterinary Services underway.
D. % of countries with monitoring of Veterinary Services performance carried out regularly, e.g. through PVS Evaluation
Follow Up missions.
E. % of countries with documented evidence of strong capacity in compliance with OIE standards on the quality of
Veterinary Services.
2. Strengthened
knowledge
and evidence
base is used
for policy and
practice
decisions
2.1 Monitoring
system for
consumption &
appropriate use of
antimicrobials in
human health.
Distribution of countries across the scale from A to E, i.e.:
A. % of countries with no national plan or system for monitoring use of antimicrobials.
B. % of countries with a system designed for surveillance of antimicrobial use, that includes monitoring national level sales
or consumption of antibiotics and rational use of antibiotics in health services.
C. % of countries where total sales of antimicrobials are monitored at national level and/or some monitoring of antibiotic
use at sub-national level.
D. % of countries where prescribing practices and antibiotic use are monitored in a national sample of healthcare settings.
E. % of countries where, on a regular basis (every year/two years), data is collected and reported on:
a) Antimicrobial sales or consumption at national level for human use; and
b) Antibiotic prescribing and appropriate use, in a representative sample of health facilities, public and private.
22 Draft AMR M&E Approach Paper
Specific outcome Outputs defined in
results framework
Output indicators for global-level tripartite monitoring (based on country questionnaire)
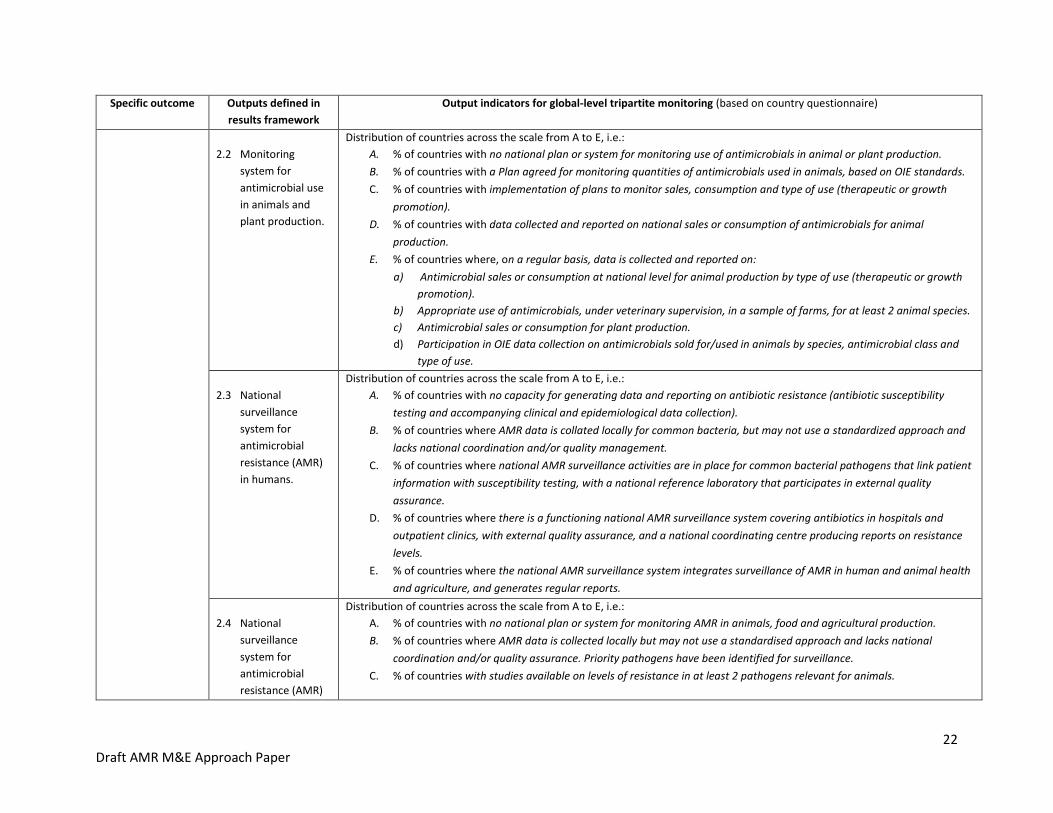
2.2 Monitoring
system for
antimicrobial use
in animals and
plant production.
Distribution of countries across the scale from A to E, i.e.:
A. % of countries with no national plan or system for monitoring use of antimicrobials in animal or plant production.
B. % of countries with a Plan agreed for monitoring quantities of antimicrobials used in animals, based on OIE standards.
C. % of countries with implementation of plans to monitor sales, consumption and type of use (therapeutic or growth
promotion).
D. % of countries with data collected and reported on national sales or consumption of antimicrobials for animal
production.
E. % of countries where, on a regular basis, data is collected and reported on:
a) Antimicrobial sales or consumption at national level for animal production by type of use (therapeutic or growth
promotion).
b) Appropriate use of antimicrobials, under veterinary supervision, in a sample of farms, for at least 2 animal species.
c) Antimicrobial sales or consumption for plant production.
d) Participation in OIE data collection on antimicrobials sold for/used in animals by species, antimicrobial class and
type of use.
2.3 National
surveillance
system for
antimicrobial
resistance (AMR)
in humans.
Distribution of countries across the scale from A to E, i.e.:
A. % of countries with no capacity for generating data and reporting on antibiotic resistance (antibiotic susceptibility
testing and accompanying clinical and epidemiological data collection).
B. % of countries where AMR data is collated locally for common bacteria, but may not use a standardized approach and
lacks national coordination and/or quality management.
C. % of countries where national AMR surveillance activities are in place for common bacterial pathogens that link patient
information with susceptibility testing, with a national reference laboratory that participates in external quality
assurance.
D. % of countries where there is a functioning national AMR surveillance system covering antibiotics in hospitals and
outpatient clinics, with external quality assurance, and a national coordinating centre producing reports on resistance
levels.
E. % of countries where the national AMR surveillance system integrates surveillance of AMR in human and animal health
and agriculture, and generates regular reports.
2.4 National
surveillance
system for
antimicrobial
resistance (AMR)
Distribution of countries across the scale from A to E, i.e.:
A. % of countries with no national plan or system for monitoring AMR in animals, food and agricultural production.
B. % of countries where AMR data is collected locally but may not use a standardised approach and lacks national
coordination and/or quality assurance. Priority pathogens have been identified for surveillance.
C. % of countries with studies available on levels of resistance in at least 2 pathogens relevant for animals.
23 Draft AMR M&E Approach Paper
Specific outcome Outputs defined in
results framework
Output indicators for global-level tripartite monitoring (based on country questionnaire)
in animals and
foods.
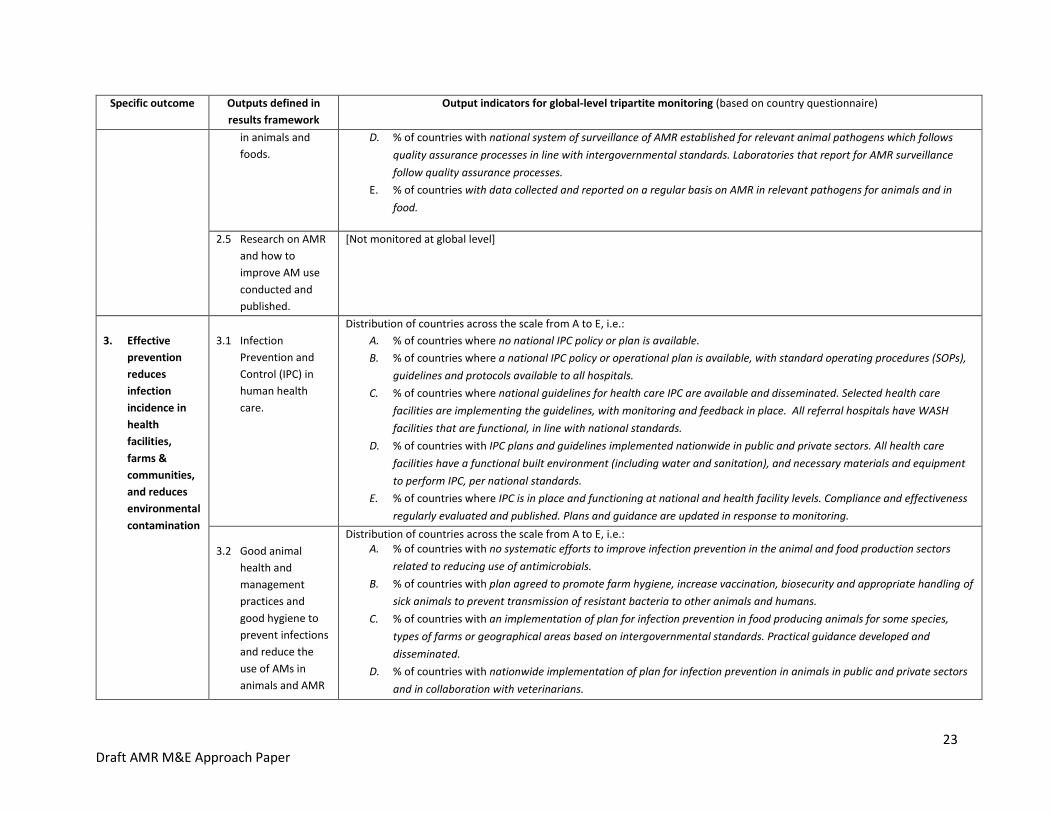
D. % of countries with national system of surveillance of AMR established for relevant animal pathogens which follows
quality assurance processes in line with intergovernmental standards. Laboratories that report for AMR surveillance
follow quality assurance processes.
E. % of countries with data collected and reported on a regular basis on AMR in relevant pathogens for animals and in
food.
2.5 Research on AMR
and how to
improve AM use
conducted and
published.
[Not monitored at global level]
3. Effective
prevention
reduces
infection
incidence in
health
facilities,
farms &
communities,
and reduces
environmental
contamination
3.1 Infection
Prevention and
Control (IPC) in
human health
care.
Distribution of countries across the scale from A to E, i.e.:
A. % of countries where no national IPC policy or plan is available.
B. % of countries where a national IPC policy or operational plan is available, with standard operating procedures (SOPs),
guidelines and protocols available to all hospitals.
C. % of countries where national guidelines for health care IPC are available and disseminated. Selected health care
facilities are implementing the guidelines, with monitoring and feedback in place. All referral hospitals have WASH
facilities that are functional, in line with national standards.
D. % of countries with IPC plans and guidelines implemented nationwide in public and private sectors. All health care
facilities have a functional built environment (including water and sanitation), and necessary materials and equipment
to perform IPC, per national standards.
E. % of countries where IPC is in place and functioning at national and health facility levels. Compliance and effectiveness
regularly evaluated and published. Plans and guidance are updated in response to monitoring.
3.2 Good animal
health and
management
practices and
good hygiene to
prevent infections
and reduce the
use of AMs in
animals and AMR
Distribution of countries across the scale from A to E, i.e.: A. % of countries with no systematic efforts to improve infection prevention in the animal and food production sectors
related to reducing use of antimicrobials.
B. % of countries with plan agreed to promote farm hygiene, increase vaccination, biosecurity and appropriate handling of
sick animals to prevent transmission of resistant bacteria to other animals and humans.
C. % of countries with an implementation of plan for infection prevention in food producing animals for some species,
types of farms or geographical areas based on intergovernmental standards. Practical guidance developed and
disseminated.
D. % of countries with nationwide implementation of plan for infection prevention in animals in public and private sectors
and in collaboration with veterinarians.

24 Draft AMR M&E Approach Paper
Specific outcome Outputs defined in
results framework
Output indicators for global-level tripartite monitoring (based on country questionnaire)
transmission in
food production.
E. % of countries with monitoring of progress on infection prevention relevant to reducing use of antimicrobials in animals,
veterinary practices and food chains, with updating of plans and guidance in response to findings.
3.3 Scaled up water
supplies,
sanitation,
hygiene and
immunisation to
reduce spread of
infections in
communities.
i. Average immunization coverage rates in most recent year for which data is:
a) Average immunisation coverage rate (in %) of pneumococcus vaccine.
b) Average immunisation coverage rate (in %) of Haemophilus influenza type b (Hib) vaccine.
ii. Distribution of countries by proportion (%) of health care facilities with:
a) Basic water supplies.
b) Basic hand hygiene facilities.
4. Optimized use
of
antimicrobials
in human and
animal health.
4.1 Optimising
antimicrobial use & regulation in human health.
Distribution of countries across the scale from A to E, i.e.:
A. % of countries with no/weak national policy & regulations for appropriate use, availability and quality of antimicrobials.
B. % of countries with a national policy for antimicrobial governance and regulation developed, that addresses
appropriate use, availability and quality of antibiotics in the community and in health care settings.
C. % of countries with practices to assure appropriate antimicrobial use being implemented in some healthcare facilities
and guidelines for appropriate use of antimicrobials available. Legislation and regulations approved on import,
marketing authorisation, production, and use of antimicrobials.
D. % of countries where practices to enable appropriate use are implemented in most health facilities nationwide, for all
antibiotics. Relevant legislation has been reviewed for coherence; gaps/overlaps/ inconsistencies have been identified.
E. % of countries where relevant legislation has been revised and a coherent framework is in place and fully functional, so
that only licensed and quality proved drugs are in use. Monitoring and surveillance results are used to inform action and
to update treatment guidelines and essential medicines lists.
4.2 Optimising
antimicrobial use & regulation in animal and plant production.
Distribution of countries across the scale from A to E: i.e.: A. % of countries with no national policy or legislation regarding the quality and efficacy of antimicrobials and their use in
animals and plants.
B. % of countries with a national policy for antimicrobial governance and regulation developed, that addresses responsible
and prudent use, availability and quality of antimicrobials for animal use.
C. % of countries with legislation and regulations approved on import, marketing authorisation, production, distribution
and prudent use of high-quality veterinary medicinal products including antimicrobials, based on international
standards. Guidelines for appropriate use of antimicrobials are available.
D. % of countries with practices widely implemented on responsible and prudent use in animals and plants in line with
Codex and OIE standards. Use of antimicrobials for animal growth promotion has been phased out.

25 Draft AMR M&E Approach Paper
Specific outcome Outputs defined in
results framework
Output indicators for global-level tripartite monitoring (based on country questionnaire)
E. % of countries where relevant legislation has been revised and a coherent framework is in place and fully functional, so
that only licensed and quality proved drugs are in use, Antimicrobials given to animals are only used to control or treat
infectious diseases, under veterinary supervision.
4.3 Legislation and/or
regulations to prevent contamination of the environment with antimicrobials.
Distribution of countries across the scale from A to E, i.e.:
A. % of countries with no legislation regarding control of wastewater discharges to the environment.
B. % of countries with legislation and/or regulations are in place to control wastewater discharges from sewage to the
environment.
C. % of countries where legislation and/or regulations include discharge of wastewater from health facilities, manure from
animals, and industrial effluent to the environment. There is a regulatory compliance system for wastewater discharges
to the environment for some types of waste (sewage, health facilities, agriculture, manure and/or industrial effluent).
D. % of countries where there is a functioning regulatory compliance system nationwide for all types of waste/wastewater
(sewage, health facilities, agriculture, manure and industrial effluent) to the environment.
E. % of countries where regulations are in place that limit discharge of antimicrobial residues into the environment,
including in municipal and pharmaceutical industry waste and wastewater. A regulatory compliance system is
functioning that includes compliance with regulations on antimicrobial residues.
5. Increased R&D
on new
medicines,
diagnostics,
vaccines &
other
interventions
related to
priority
pathogens.
5.1 Estimates of funding needs and economic case for investment in AMR responses.
[Not included in country questionnaire.]
Global estimates of funding gaps.
5.2 Coordinated efforts, with priorities defined and mechanisms established to incentivize relevant R&D.
[Data collection for these indicators will come from various R&D monitoring sources, collated at global level].
Priority pathogens identified.
New mechanisms in place to incentivise R&D and increase access.
5.3 Increased investment in R&D to address AMR and prevent infection.
[Data collection for these indicators will come from various R&D monitoring sources, collated at global level].
Commitments and expenditure on R&D for priority pathogens.
26 Draft AMR M&E Approach Paper
Annex 3: Proposed Indicators for Specific Outcomes of the Global Action Plan on AMR Proposed indicators suggested here for specific outcomes 1 to 5 (corresponding to GAP strategic objectives 1 to 5) are linked to the results
framework and recommendations of the expert meeting. The indicators can be used at national level and could also be collated at global level.
The list is longer than desirable, and the tripartite intends to reduce the number of indicators under each specific outcome. The consultation is
seeking inputs on the relevance, usefulness and feasibility of the indicators as a basis to select the most useful indicators.
Short term or proxy indicators have been proposed recognising that many countries will not be able to measure progress on outcomes in the
short term, either because there are not yet systems for data collection and/or because there will be little progress to measure in that timeline.
The short term or proxy indicators are intended to show whether there is progress towards measuring and achieving the outcomes. The
intention is that the majority of countries should be able to report their progress on these within the next five years, including to regional and
global levels.
Outcome indicators should be collected and reported when possible and available. Those countries that have the capacity to do so are expected
to monitor outcomes. It is recognised that some countries will take years to build up systems for collecting and analysing representative data
and to make progress on achieving the outcomes; however, it is envisaged that the majority of countries will be able to collect and report
outcome data within the next 10 years.
Blue shading denotes indicators specific to animal, plant production and environment sectors. No shading (white background) includes
indicators for human health and in some cases, indicators that are relevant across sectors.

27 Draft AMR M&E Approach Paper
Specific outcome Short term/proxy indicators for outcomes (most countries should be able to report within 5 years)
Outcome indicators (some are already collected; expect most countries to be able to report within 10 years.
1. Improved
awareness of AMR & behaviour change among policy makers, farmers, veterinary and human health workers, food industry and the general public.
1.1: Government-supported antimicrobial awareness campaign(s) undertaken, by target group.
1.2: Country has a One Health AMR communications strategy in place.
Awareness levels on AMR, understanding/ attitudes and behaviours by target group. Suggested: 1.9: % of public who know use of antibiotics causes resistance.
1.10: % who know inappropriate to use antibiotics for common cold or viruses.
1.11: % of actors (e.g. policy-makers, veterinarians, animal health workers, farmers, food processing workers) that have knowledge (TBD) about AMR.
1.12: Knowledge and attitudes of health workers on AMR and implications for antimicrobial use and infection prevention (detailed questions TBD).
Trends in behaviour for target groups: General population 1.13: % of antibiotic use in community based on a prescription.
1.14: Use of left over antibiotics (in community).
1.15: Use of antibiotics for a cold or flu.
Behaviour of farmers, veterinarians, other animal health workers: 1.16: % of veterinary/plant antimicrobial sales that are critically important antimicrobials 12. 1.17: % of veterinary AMs authorised/used13 for non-therapeutic purposes (e.g. for growth promotion). 1.18: AMs sold/used in plant production.
Behaviour of health workers 1.19: Hand hygiene performed by health professional during last encounter.
1.20: Prescribing– average number of antibiotic prescriptions per 1000 inhabitants per year; proportion prescribed a restricted antibiotic.
1.21: Use of diagnostics.
1.22: Use of antimicrobial susceptibility tests.
Education and training outcomes - metrics to be refined, such as:
1.3: Tailored national communications materials aimed at farmers / veterinarians / agricultural workers easily available in official language.
1.4: % of health education institutions that have incorporated AMR educational modules in their core curricula /in Day 1 competencies.
1.5: Number of conferences and/or education sessions (trainings) on AMR/year given to target actors (farmers / veterinarians / agricultural workers and/or number of target actors trained/year.
1.6: Veterinary and/or animal health worker governing body exists within country.
1.7: Specific training on AMR included in veterinary and animal health/veterinary paraprofessional training.
1.8: Whether country has in the last 5 years had a) Performance of Veterinary Services (PVS) evaluation b) PVS gap analysis c) PVS follow up d) another systematic process to evaluate and strengthen vet services.
12 Critically Important antimicrobials refers to the antimicrobials included in the list of critically important antimicrobials for human medicine issued by WHO (for 2017 list, see
http://www.who.int/foodsafety/publications/antimicrobials-fifth/en/) and the list of veterinary critically important antimicrobial agents for animal health by OIE for veterinary
health (see http://www.oie.int/fileadmin/Home/eng/Our_scientific_expertise/docs/pdf/Eng_OIE_List_antimicrobials_May2015.pdf) 13 These would measure changes in behaviour for different groups: the regulators (what is authorised), professionals (prescription practices), and farmers (actual use).

28 Draft AMR M&E Approach Paper
Specific outcome Short term/proxy indicators for outcomes (most countries should be able to report within 5 years)
Outcome indicators (some are already collected; expect most countries to be able to report within 10 years.
1.23: % of health workers demonstrating at least 75% of core AMR competencies (under development).
1.24: Evidence of compliance with OIE standards on veterinary education and knowledge of veterinary professionals.
2. Strengthened
knowledge and evidence base is used for policy and practice decisions.
2.1: Country collects national data on total sales or consumption of antibiotics for human use.
2.2: Country has a system for active feedback to prescribers on their prescribing.
2.15: Country regularly reports AM use data in animals (sales or supply or actual use), broken down by species, sector and administration route, to OIE database.
2.16: Country regularly reports use data in non-human/animal health sectors, e.g. plant production.
2.17: Number of sectors that have amended food production management practices to minimize development or transmission of AMR.
2.18: Evidence that relevant body has reviewed surveillance data and adjusted recommendations (e.g. essential medicines list, treatment guidelines and/or prevention guidelines), in light of AMR data.
2.19: % of hospitals where AMR data is provided on regular basis to local prescribing hospital based physicians on regional or local level.
2.20: National body in charge of national strategy to contain AMR receives information on AMR rates and progress of implementation of surveillance systems at least once per year and discusses implications for national strategy.
2.21: Country has reviewed existing legislation and developed a framework for revision of legislation to achieve effective system of regulation of manufacture, distribution, supply and administration of medical and non-medical AMs.
2.22: Animal health, plant health and human health have integrated surveillance systems.
2.23: Integrated analysis and reporting of AMR within country.
2.3: Number/proportion of production sectors collecting data on veterinary/plant AM sales/use.
2.4: Country makes data on antimicrobial sales or use in animals available to national stakeholders.
2.5: Country reports data on antimicrobial sales or use in animals to OIE database.
2.6: National reference laboratory for AMR surveillance in human health designated and participating in an external quality assurance scheme [GLASS indicator].
2.7: National AMR surveillance programme organizes and runs external quality assurance for all laboratories participating in GLASS, for bacterial identification and antimicrobial susceptibility testing [GLASS indicator].
2.8: Country has veterinary public health lab network with capacity to conduct standardized, repeatable, antimicrobial susceptibility testing for key isolates (veterinary/food borne pathogens and commensals) based on recognised international standards.
2.9: Country has national (or access to regional) reference laboratory for veterinary public health.
2.10: Country has implemented a national system of surveillance for one or more key isolates from animals/plants/ environment.
2.11: Country collects non-human health AMR surveillance data including prevalence of ESBL commensal E.coli in healthy animals in 2 key food producing species.

29 Draft AMR M&E Approach Paper
Specific outcome Short term/proxy indicators for outcomes (most countries should be able to report within 5 years)
Outcome indicators (some are already collected; expect most countries to be able to report within 10 years.
2.12: Country has published and reported AMR surveillance data.
2.13: Country has database for collection and reporting of resistance data on non-human-health isolates.
2.14: Availability of antimicrobial susceptibility tests in plant and animal health, e.g. tests available for specified pathogen and animal species for specific presentation and class of antimicrobial.
3. Effective
prevention reduces infection incidence in health facilities, farms & communities, and reduces environmental contamination.
3.1: National Infection prevention and control (IPC) program is in place.
3.2: % of acute health care facilities with IPC program in place.
3.3: % of health facilities with at least basic water supply*.
3.4: % of health facilities with at least basic sanitation*.
3.5: % of health facilities with at least basic hand hygiene*.
(*basic as defined in WASH in health care facility standards or national standards)
3.6: % of health facilities with a functional built environment (including water and sanitation), and necessary materials and equipment to perform IPC, as per national standards.
3.16: % of health facilities monitoring hand hygiene compliance of health workers according to the WHO direct observation method or similar method.
3.17: Surgical site infection incidence rate1 including % resistant (in accordance with GLASS) when feasible.
3.18: Rate of readmissions due to surgical site infection.
3.19: Bloodstream Infections per 1000 patient days (inpatients, admitted >48 hrs).
3.20: Rate of neonatal sepsis including % of those caused by resistant bacteria (in accordance with GLASS) or new-borns with suspected severe bacterial infection who receive appropriate antibiotic therapy.
3.21: Clostridium difficile incidence in hospitals and community.
3.22: % of commercial farms that have implemented a biosecurity programme.
3.23: % of farms surveyed compliant with standards of responsible and prudent antimicrobial use in animals, including good husbandry and hygiene practices.
3.24: % of population using safely managed drinking water services (SDG6 indicator).
3.25: % of population using safely managed sanitation services, including a hand-washing facility with soap and water (SDG6 indicator).
3.26: Coverage with pneumococcal conjugate vaccine (3 doses), rotavirus, measles and Hib vaccines.
3.27: % of children with full immunisation coverage according to national immunization guidelines.
3.28: Level of vaccine coverage within animal populations nationally for priority diseases.
3.7: Number of infection control programmes OR % of diseases (in key food producing animal species) that are covered by an infection control programme.
3.8: Number of sectors within country with guidance available on good agricultural practices in official or local language.
3.9: Level of access to veterinary advice and care within country (e.g. number of qualified vets to animal population).
3.10: Country legislates minimum standards of husbandry/ housing/ biosecurity for food animal production, e.g. in accordance with OIE and Codex standards and guidelines.
3.11 Country legislates regulation of production/access to medicated feed.
3.12: Country has adopted and is compliant with OIE and Codex standards and guidelines on infection prevention/food safety.
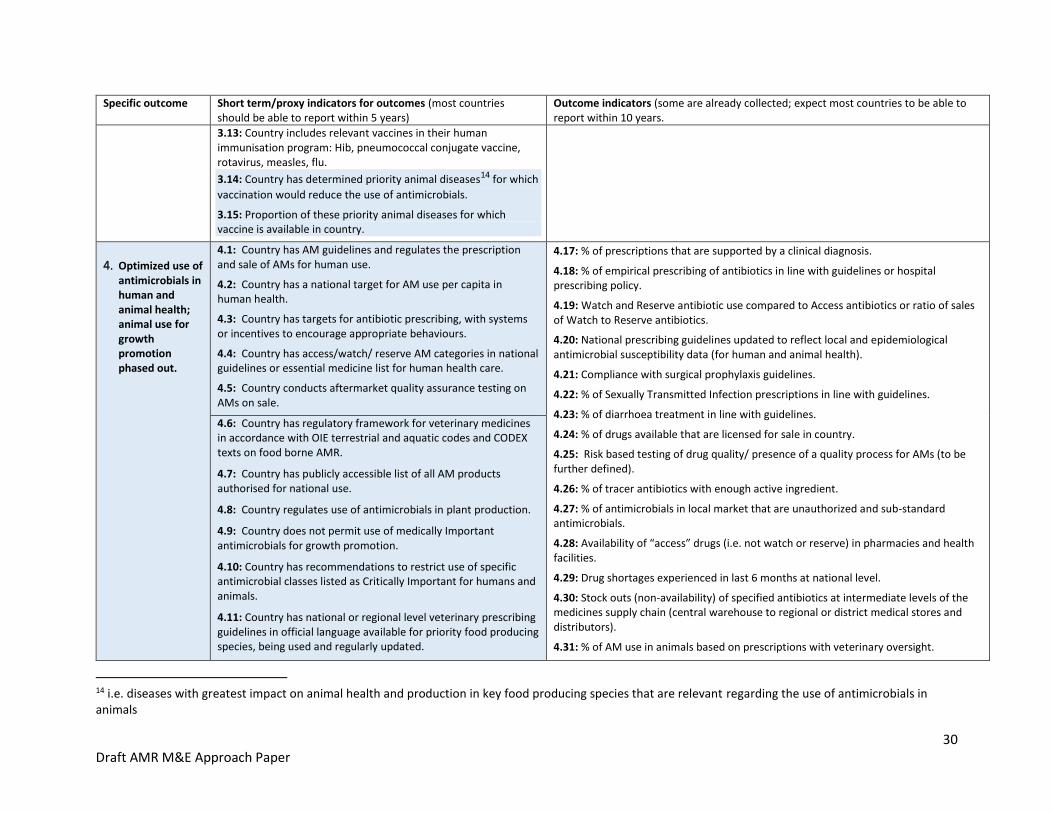
30 Draft AMR M&E Approach Paper
Specific outcome Short term/proxy indicators for outcomes (most countries should be able to report within 5 years)
Outcome indicators (some are already collected; expect most countries to be able to report within 10 years.
3.13: Country includes relevant vaccines in their human immunisation program: Hib, pneumococcal conjugate vaccine, rotavirus, measles, flu.
3.14: Country has determined priority animal diseases14 for which
vaccination would reduce the use of antimicrobials.
3.15: Proportion of these priority animal diseases for which vaccine is available in country.
4. Optimized use of antimicrobials in human and animal health; animal use for growth promotion phased out.
4.1: Country has AM guidelines and regulates the prescription and sale of AMs for human use.
4.2: Country has a national target for AM use per capita in human health.
4.3: Country has targets for antibiotic prescribing, with systems or incentives to encourage appropriate behaviours.
4.4: Country has access/watch/ reserve AM categories in national guidelines or essential medicine list for human health care.
4.5: Country conducts aftermarket quality assurance testing on AMs on sale.
4.17: % of prescriptions that are supported by a clinical diagnosis.
4.18: % of empirical prescribing of antibiotics in line with guidelines or hospital prescribing policy.
4.19: Watch and Reserve antibiotic use compared to Access antibiotics or ratio of sales of Watch to Reserve antibiotics.
4.20: National prescribing guidelines updated to reflect local and epidemiological antimicrobial susceptibility data (for human and animal health).
4.21: Compliance with surgical prophylaxis guidelines.
4.22: % of Sexually Transmitted Infection prescriptions in line with guidelines.
4.23: % of diarrhoea treatment in line with guidelines.
4.24: % of drugs available that are licensed for sale in country.
4.25: Risk based testing of drug quality/ presence of a quality process for AMs (to be further defined).
4.26: % of tracer antibiotics with enough active ingredient.
4.27: % of antimicrobials in local market that are unauthorized and sub-standard antimicrobials.
4.28: Availability of “access” drugs (i.e. not watch or reserve) in pharmacies and health facilities.
4.29: Drug shortages experienced in last 6 months at national level.
4.30: Stock outs (non-availability) of specified antibiotics at intermediate levels of the medicines supply chain (central warehouse to regional or district medical stores and distributors).
4.31: % of AM use in animals based on prescriptions with veterinary oversight.
4.6: Country has regulatory framework for veterinary medicines in accordance with OIE terrestrial and aquatic codes and CODEX texts on food borne AMR.
4.7: Country has publicly accessible list of all AM products authorised for national use.
4.8: Country regulates use of antimicrobials in plant production.
4.9: Country does not permit use of medically Important antimicrobials for growth promotion.
4.10: Country has recommendations to restrict use of specific antimicrobial classes listed as Critically Important for humans and animals.
4.11: Country has national or regional level veterinary prescribing guidelines in official language available for priority food producing species, being used and regularly updated.
14 i.e. diseases with greatest impact on animal health and production in key food producing species that are relevant regarding the use of antimicrobials in animals

31 Draft AMR M&E Approach Paper
Specific outcome Short term/proxy indicators for outcomes (most countries should be able to report within 5 years)
Outcome indicators (some are already collected; expect most countries to be able to report within 10 years.
4.12: Country instigates programme of AM residue testing in animal and non-animal origin foodstuffs.
4.13: Country implements regulatory measures on residues based on Codex standards and guidelines.
4.14: Maximum residue levels (MRLs) are recognized; withdrawal periods are required to be based on these MRLs.
4.15: Authorised Withdrawal Periods are legally required to be displayed on antimicrobial packaging.
4.32: Antimicrobial susceptibility testing is being done appropriately/when needed.
4.33: Proportion of wastewater safely treated (SDG6 indicator).
4.34: Availability of antibiotics in veterinary outlets in public and private sectors, compared with treatment guidelines.
4.16: Country has regulations for discharge of antimicrobials into the environment.
5. Increased R&D on new medicines, diagnostics, vaccines & other interventions related to priority pathogens.
5.1: National estimates available of investment needs and funding gaps.
5.2: Proportion of NAP activities and budget implemented.
5.8: Global R&D pipeline: Numbers and targeted infections of antimicrobial medicines,
alternative treatments, vaccines and diagnostics in the R&D pipeline (assessed against
baseline and research priorities).
5.3: New mechanisms in place to incentivise R&D (e.g. prizes, advance market commitments, pilots for delinking costs of product development from sales income).
5.4: Mechanisms in place to facilitate equitable access to existing and new products.
5.5: Global Framework for Development and Stewardship to combat AMR agreed15.
5.6: Commitments and expenditure on R&D for priority pathogens (new products, new drug combinations, diagnostics, vaccines, etc.).
5.7: Level of funding raised for the Global Antibiotic Research and Development Facility.
15 See http://www.who.int/phi/implementation/research/WHA_BackgroundPaper-AGlobalFrameworkDevelopmentStewardship-Version2.pdf

32 Draft AMR M&E Approach Paper
Annex 4: Proposed General Outcome and Goal Indicators This table identifies proposed standard (core) indicators related to the general outcomes and goals defined in the results framework. The
indicators are shown for the global level; most will rely on reporting from countries to compile the results. In the short term, some countries will
not have data available for all the indicators, therefore proxy measures will be used (see short term/proxy measures below and in annex 3). As
country monitoring and surveillance systems develop, the number of countries able to provide data on outcomes will increase.
Blue shading denotes indicators specific to the animal, plant production and environment sectors.
Result level Proposed indicators: Global level
General outcome A:
slower development
of resistance.
Patterns and trends in resistance in human health in the following, analysed by region; for large population countries; for countries which have data available: A.1: Carbapenem resistant enterobacteriaceae A.2: Methicillin-resistant Staphylococcus aureus (MRSA) A.3: Extended spectrum beta lactamase (ESBL) in E. coli A.4: Gonococcal resistance A.5: Quinolone resistant enterobacteriaceae in community A.6: Salmonella and Shigella A.7: Pneumococcus Metrics - eventually as defined by GLASS: rates, syndrome based approach, potentially aggregated in an index. Separate for community and hospital.
A.8: % of E.coli susceptible to a panel of antimicrobials.
A.9: Rate of ESBL producing E coli in people, animals and environment.
Patterns and trends in resistance in animal production sectors
Short term (available in most countries within 5 years)
A.10: Proportion of countries collecting/monitoring ESBL producing commensal E. coli (in healthy animals16 at slaughter) in priority food producing species.
A.11: Actual prevalence levels of ESBL in commensal E. coli from food producing animal species, as determined from national data.
A.12: Number of countries collecting antimicrobial sensitivity test data on at least one bacterial species for aquaculture.
Longer term (available in most countries within 10 years)
A.13: Change in resistance rates for ESBL/multidrug-resistant commensal E. coli (to a defined list of AMs) from priority food producing species.
A.14: Number of countries monitoring ESBL commensal E. coli in major food commodities of non-animal origin.
16 Countries provide relevant data for their priority food producing species (e.g. prioritization based on production levels)

33 Draft AMR M&E Approach Paper
Result level Proposed indicators: Global level
General outcome B: more appropriate use of antimicrobials (with access when needed) and less inappropriate use
B.1: Level and trends in human consumption of access, watch and reserve antimicrobials, and the ratio between these, analysed by region and for countries with highly inequitable access.
B.2: Number of countries achieving national targets for antimicrobial consumption/use (and number above global target if one is set).
B.3: Equity index of access by country (like a Gini coefficient, to be defined).
B.4: Access to AMs when needed: Proportion of health facilities that have a core set of relevant essential medicines available and affordable on a sustainable basis. (SDG indicator 3.b.3, with Access antibiotics disaggregated).
B.5: Affordability of key products – e.g. number of countries with price of a course of a specific, generic second line antibiotic is more than 7 days’ wages.
B.6: Global shortages of specific classes of antimicrobials as shown by UNICEF inability to procure.
Short term (within 5 years)
B.7: % or number of countries with specific legislation on use of medically important antimicrobials for growth promotion in food producing animals.
B.8: % or number of countries that measure sales/use of medically important antimicrobials for growth promotion in food producing animals.
B.9: Trends in use of medically important antimicrobials used for growth promotion in food producing species, weighted by biomass of species (mg/kg).
Longer term (available in most countries within 10 years)
B.10: Reduction in volume of sales/use of medically important antimicrobials in food producing species weighted by biomass of species (mg/kg), focusing on a reduction in the proportion classified as the highest priority Critically Important Antimicrobials17.
B.11: Number of countries that have systems to collect information on antimicrobial use in plant production.
B.12: Number of countries that regulate which antimicrobials can be used in plant production.
17 See footnote Error! Bookmark not defined.

34 Draft AMR M&E Approach Paper
Result level Proposed indicators: Global level
Overarching Goal: lower impact from infectious diseases on human and animal health.
OG.1: Incidence of selected infections including resistant infections using same list as for General Outcome A, analysed by region; trends for large
population countries; trends for all countries for which data is available. Denominators: Per 100,000 population, per inpatient day, or per hospital
admission (or per device day for device associated infections).
OG.2: Morbidity due to AMR: Prevalence of hospitalizations due to overall AMR infections or selected AMR infections (e.g. ESBL-producing E.coli &
K.pneumoniae bacteremia) according to ICD-codes per 1,000 hospitalizations.
OG.3: Modelled burden of disease linked to AMR.
OG.4: Modelled estimates of mortality attributed to resistant infections e.g. for bloodstream and/or cerebrospinal fluid infections caused by carbapenem-resistant Enterobacteriaceae (CRE), vancomycin resistant enterococci (VRE), Clostridium difficile and MRSA, per 100,000 per year.
OG.5: Estimated number of deaths attributable to failure of antibiotic therapy due to overall antibiotic resistance or selected AMR infections (e.g. ESBL-producing E.coli & K.pneumoniae bacteremia) according to ICD-codes per 1,000 hospitalizations, for countries with data available.
OG.6: Modelled estimate of neonatal deaths attributable to resistance.
OG.7: Estimated change in mortality burden related to GAP implementation, e.g. modelled estimates of reductions in infections and related mortality due to use of new products, by disease.
OG.8: Modelled impact of resistance on key animal diseases that are treated with antimicrobials.
OG. 9: Modelled impact on animal health, welfare and production of changes made to production practices (e.g. husbandry, biosecurity etc.) to minimise AM use.
GAP Goal: continued ability to treat and prevent infectious diseases with effective and safe medicines
GG.1: Critical gaps: resistant infections that lack easy diagnostics, effective preventive and/or treatment options (available or in the R&D pipeline).
GG.2: Pathogens with low drug resistance, e.g. status of resistance for selected classes of antibiotics.
GG.3: Vaccines available to control animal diseases that reduce the use of antimicrobials.
GG.4: Vaccine coverage for key animal diseases for which vaccines would reduce antimicrobial use.

© FAO/OIE/WHO, 2017
I7711EN/1/08.17