monitoring and control of the drg coding quality tryliktas... · drg in lithuania in lithuania the...
TRANSCRIPT

MONITORING AND CONTROL OF THE DRG CODING QUALITY
NATIONAL HEALTH INSURANCE FUND UNDER THE MINISTRY OF HEALTH
VILNIUS
2016-09-16

DRG in Lithuania
In Lithuania the Case mix grouping for acute careepisodes was started in 2012. We started withAustralian Refined Diagnosis Related Groups (AR-DRG)version 6.0 released in 2008.
The main components of AR-DRG are:
1. Australian coding Classifications → diseases and interventions coding (primary classifications):
– Diseases and Related Health Problems (ICD-10-AM)
– Health Interventions (ACHI)
– Australian Coding Standards
2. DRGs Classification → grouping of episodes (secondary classification)
We are currently preparing for migration to AR-DRG 8.0version (2015). We are planning to launch the newversion on the 1st of January 2017.
2

Why is Coding Quality Important?
• Good documentation supports better care of patient– Present or future episodes of hospitalisation have access to the records they need
– The records are accurate, complete and understandable
• Quality clinical documentation also ensures the information reliable for many other purposes– Research
– Planning
– Activities improvement
• Quality documentation quantifies hospital activity– Activity based funding is focusing attention on the reliability and validity of coded health
data
3

Who are responsible for data quality in Lithuania?
1. HEALTHCARE PROVIDERS
In Lithuania clinical coding is mostly performed by doctors. Only some hospitals have appointed the clinical coders.
2. TERRITORIAL HEALTH INSURANCE FUNDS (5)
Means to control data quality: surveillance and control of healthcare providers, harm recovery and penalties
3. NATIONAL HEALTH INSURANCE FUND UNDER THE MINISTRY OF HEALTH
4

Steps to Data Quality
• Training:– Courses– Materials (courses,
newsletters and other recommendations)
– Direct communication with coders
• Routine checks on data in IT System
• Checks on all data for certain episodes (documentations, IS)
opportunity to ask
5

Evolution of clinical coding quality control in NHIF
• When we started using DRG in 2012, in a short time we started noticing possibly incorrectly coded episodes in our IT system. We found such incorrect cases: – Conflicting with medical logic– Conflicting with Australian coding standards – Conflicting with rules defined in classifications– Opposing legislation
• During 2013-2015 incorrect episodes were identified by NHIF specialists who manually checked the data from statistical forms. Possibly incorrectly coded episodes were reported to the THIFs and healthcare providers for additional recheck.
• Since 2015 we started to create automated filters which help us identify possibly incorrectly coded episodes by some patterns;
• In 2016 we have upgraded IT system to better support monitoring and control of the coding process. Now we have special user interfaces to review, mark and comment episodes directly in the IT system, and users of THIFs and healthcare providers can instantly see our remarks.
6
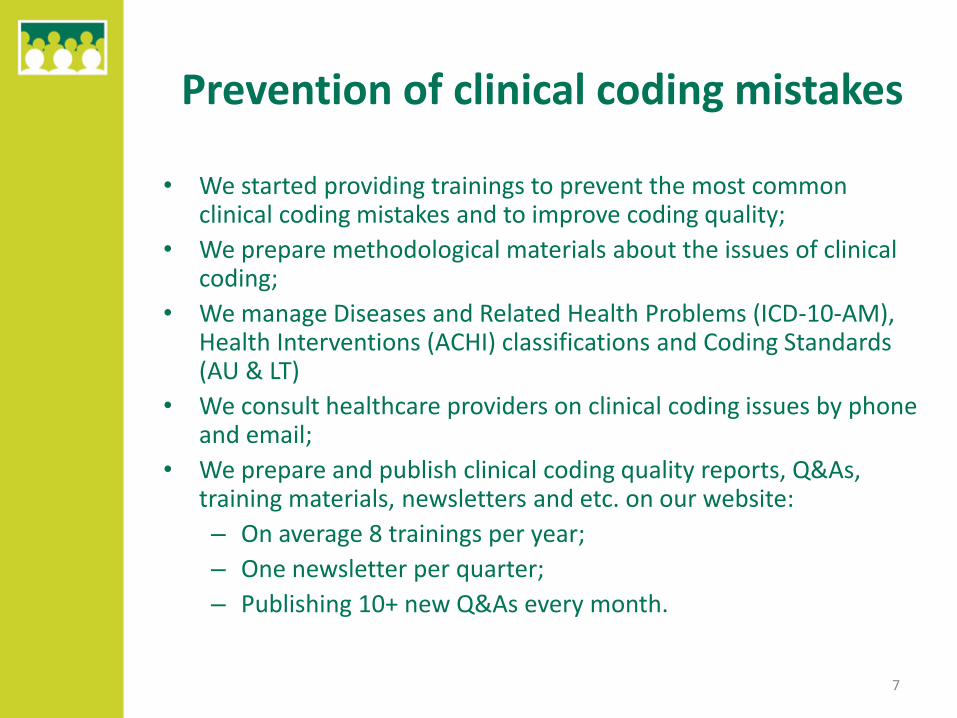
Prevention of clinical coding mistakes
• We started providing trainings to prevent the most common clinical coding mistakes and to improve coding quality;
• We prepare methodological materials about the issues of clinical coding;
• We manage Diseases and Related Health Problems (ICD-10-AM), Health Interventions (ACHI) classifications and Coding Standards (AU & LT)
• We consult healthcare providers on clinical coding issues by phone and email;
• We prepare and publish clinical coding quality reports, Q&As, training materials, newsletters and etc. on our website:
– On average 8 trainings per year;
– One newsletter per quarter;
– Publishing 10+ new Q&As every month.
7

Legal regulation
We have the legal act which regulates acute care episode monitoring and coding quality control. Regulation defines:
• Duties and responsibilities of healthcare providers, THIFs and NHIF;
• Documents to follow when checking quality:
― Diseases and Related Health Problems (ICD-10-AM) classification
― Health Interventions (ACHI) classification
― Australian and Lithuanian Coding Standards
― Other legal acts (e.g. day surgery legal regulation)
• Monitoring indicators used to form the Clinical Coding Report which is published on the our website once a year.
8

Entries which are most important to check in episode
• Diagnoses (principal & additional)(ICD-10-AM)
• Health Interventions (ACHI)
• DRG
• Sex, age, admission weight (less than 1 year old)
• Mode of separation, length of stay
• Other entries for national requirement
9

Methods of checking episodes
Inpatient of acute care (419,157 episodes)Include: day surgery
Exclude: transplantation and long term care
Manual way checked 15 % episodes, 30 % of
them selected as the potential false
Automatic filters4 % selected as the potential false
episodes
Note: data of the first 7 months of 2016 10

Comparison of checking methods
Manual wayBenefits• All episode data is checked, not
fragments;
• Matching between diagnoses and interventions is assessed;
• New fault patterns are found;
Limitations• Requires many working hours of
the qualified experts (timeconsuming);
• Subjective, depends on qualification of an expert;
• Difficult to compare health providers objectively;
Automatic filters
Benefits
• Clarity, objectivity;
• All data can be rechecked when new fault patterns are found;
• Saving expert working hours;
• Enables the comparative analysis;
Limitations
• A versatile set of indicators is needed to assess overall checking quality;
• It is difficult to check medical logic of the episode;
• Unable to find new fault patterns;
11

Monitoring Indicators
We monitor general and specificinpatient acute care clinical codingindicators annually. We currently have atotal number of 71 indicators:
– 4 GENERAL
– 67 SPECIFIC
65 specific indicators are based on theresults of automatic filtering
12
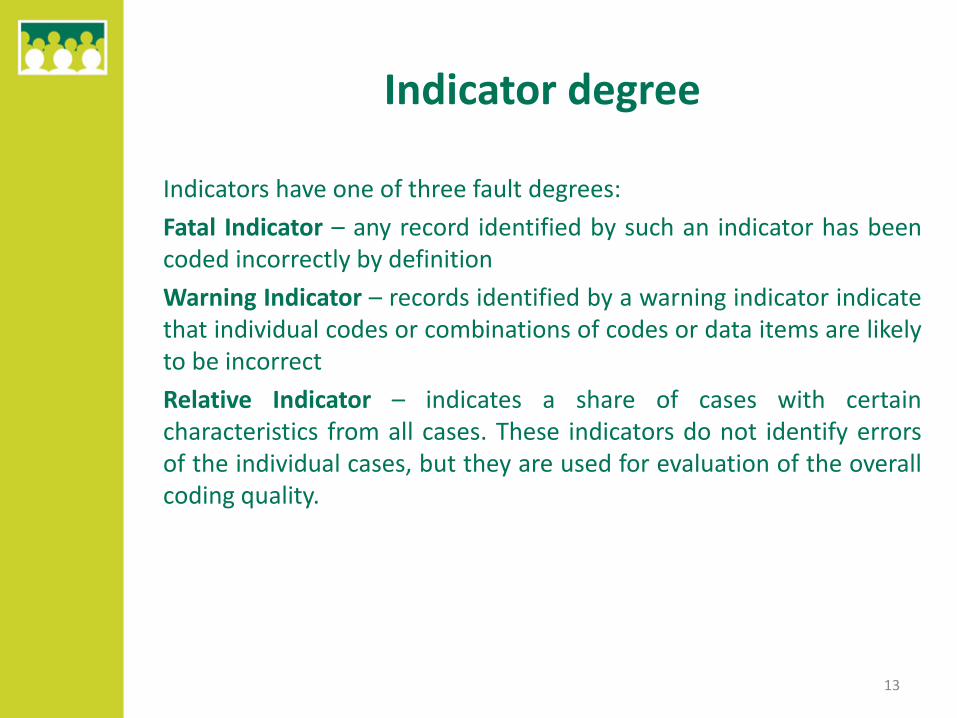
Indicator degree
Indicators have one of three fault degrees:
Fatal Indicator – any record identified by such an indicator has beencoded incorrectly by definition
Warning Indicator – records identified by a warning indicator indicatethat individual codes or combinations of codes or data items are likelyto be incorrect
Relative Indicator – indicates a share of cases with certaincharacteristics from all cases. These indicators do not identify errorsof the individual cases, but they are used for evaluation of the overallcoding quality.
13
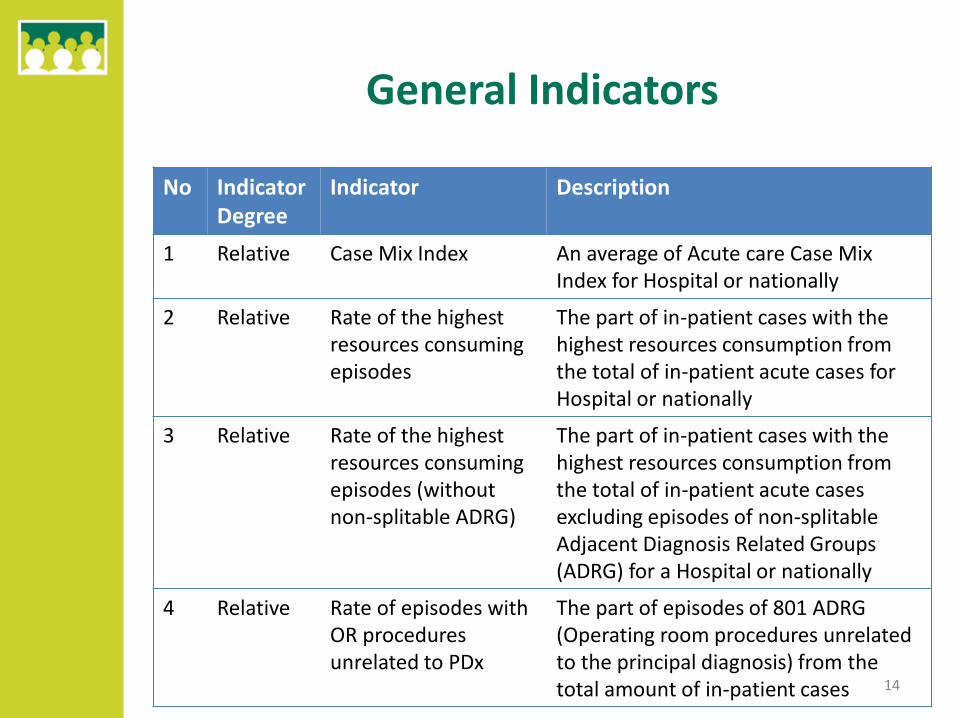
General Indicators
No IndicatorDegree
Indicator Description
1 Relative Case Mix Index An average of Acute care Case Mix Index for Hospital or nationally
2 Relative Rate of the highestresources consuming episodes
The part of in-patient cases with the highest resources consumption from the total of in-patient acute cases for Hospital or nationally
3 Relative Rate of the highestresources consuming episodes (withoutnon-splitable ADRG)
The part of in-patient cases with the highest resources consumption from the total of in-patient acute casesexcluding episodes of non-splitableAdjacent Diagnosis Related Groups (ADRG) for a Hospital or nationally
4 Relative Rate of episodes with OR procedures unrelated to PDx
The part of episodes of 801 ADRG (Operating room procedures unrelated to the principal diagnosis) from the total amount of in-patient cases 14

Rate of the highest resources consuming episodes
16%
17%
20%
21%
2015
2014
2013
2012
From money perspective:
5 % rate decrease allowed us to save 24.4 M EUR in 2015 which is 5 % from total budget
15

Some examples of specific Indicators
No IndicatorDegree
Indicator description
1 Fatal Malignant neoplasms, started or presumed to be primary without malignant (primary site) morphology
2 Warning Code Hypertensive kidney disease with kidney failure with code Chronic kidney disease, stage 1-4
3 Fatal Sequelae of cerebrovascular disease as a principal diagnose
4 Fatal Missing code Outcome of delivery;
5 Relative Part of cases when the principal diagnose is Symptom from the total in-patient cases
6 Warning Acute appendicitis without appendectomy
7 Fatal Administration of blood or blood product code assigned more than once
8 Fatal Secondary neoplasm site code without primary site code
9 Fatal Type 1 or 2 diabetes code with impaired glucose regulation code or another form of diabetes code 16

Coding Quality Ratio
It is derived Indicator, calculated using specific indicators. Coding quality ratio isused to compare hospitals.
• Numerator records are the cases the indicator is seeking to identify (problem records); these records are selected from the denominator records
• Denominator records are the cases in the data set under analysis in which the numerator records (problem records) could occur
• The result is expressed as a ratio of numerator and denominator
Data Set
Denominator Records
Numerator
Records
17

Coding Quality Ratio for Hospitals in 2015
Republican Regional
Municipal
0%
5%
10%
15%
20%
25%
30%
35%C
od
ing
qu
alit
y R
atio
, %
Hospitals
18

Future of coding quality control
We are planning to acquire new IT system which would help us:
To create more automatic filters in an easier way;
To prevent incorrect data being submitted to the system;
To identify episodes having the highest risk ratio of being faulty. That would be an indication for us to check them manually;
To rank hospitals and coders by the risk ratio.
19

Thanks for your attention!
20