monitor for detecting and assessing exposure to airborne
TRANSCRIPT

SPECIAL FOCUS: SAFETY OF NANOPARTICLES
Monitor for detecting and assessing exposureto airborne nanoparticles
Johan Marra Æ Matthias Voetz ÆHeinz-Jurgen Kiesling
Received: 10 June 2009 / Accepted: 24 June 2009
� Springer Science+Business Media B.V. 2009
Abstract An important safety aspect of the work-
place environment concerns the severity of its air
pollution with nanoparticles (NP; \100 nm) and
ultrafine particles (UFP; \300 nm). Depending on
their size and chemical nature, exposure to these
particles through inhalation can be hazardous because
of their intrinsic ability to deposit in the deep lung
regions and the possibility to subsequently pass into
the blood stream. Recommended safety measures in
the nanomaterials industry are pragmatic, aiming at
exposure minimization in general, and advocating
continuous control by monitoring both the workplace
air pollution level and the personal exposure to
airborne NPs. This article describes the design and
operation of the Aerasense NP monitor that enables
intelligence gathering in particular with respect to
airborne particles in the 10–300 nm size range. The NP
monitor provides real time information about their
number concentration, average size, and surface areas
per unit volume of inhaled air that deposit in the
various compartments of the respiratory tract. The
monitor’s functionality relies on electrical charging of
airborne particles and subsequent measurements of the
total particle charge concentration under various
conditions. Information obtained with the NP monitor
in a typical workplace environment has been compared
with simultaneously recorded data from a Scanning
Mobility Particle Sizer (SMPS) capable of measuring
the particle size distribution in the 11–1086 nm size
range. When the toxicological properties of the
engineered and/or released particles in the workplace
are known, personal exposure monitoring allows a risk
assessment to be made for a worker during each
workday, when the workplace-produced particles can
be distinguished from other (ambient) particles.
Keywords Nanoparticles � Ultrafine particles �Workplace monitoring � Nanoparticle monitor �Ultrafine particle monitor � Occupational health �Instrumentation � EHS
List of symbols
A0 A parameter defined in Eq. 13
C1 A proportionality factor defined in Eq. 7
C2, C3 Proportionality factors defined in Eq. 19
CAL A proportionality factor defined in Eq. 26
Cc(dp) The Cunningham slip factor defined
by CcðdpÞ ¼ 1þ kdp
�2:284þ 1:116 exp
�0:5dp
k
� ��wherein k = 0.066 9 10-6 m,
the mean free path of air molecules at
atmospheric pressure (1 atm) and 20 �C
J. Marra (&)
Philips Research Laboratories, HTC 4,
5656 AE Eindhoven, The Netherlands
e-mail: [email protected]
M. Voetz � H.-J. Kiesling
Bayer Technology Services, Leverkusen, Germany
123
J Nanopart Res
DOI 10.1007/s11051-009-9695-x

dp The particle diameter (m)
dp,av The number-averaged particle diameter (m)
d�p;av The assumed (default) number-averaged
particle diameter (m)
d0 The particle diameter at which nq(dp,Epl) =
1 for dp B d0 and q C 1 at the chosen
electrical field strength Epl (m)
dpl The spacing between the electrode
surfaces in the precipitation section (m)
DAL(dp) The fractional deposition efficiency of an
inhaled particle of diameter dp in the
alveolar region
DHA(dp) The fractional deposition efficiency of an
inhaled particle of diameter dp in the
head airways
DTB(dp) The fractional deposition efficiency of an
inhaled particle of diameter dp in the
tracheo-bronchial region
e The elementary charge (e = 1.6 9 10-19 C)
Epl The applied electrical field strength
between the electrode surfaces in the
precipitation section (V/m)
fq(dp) The fraction of all particles of diameter
dp charged with ‘‘q’’ elementary charges
Isensor The electrical current signal measured by
the NP monitor (A)
I1 The measured electrical current signal
when Vpl = 0 in the monitor’s precipita-
tion section (A)
I2 The measured electrical current signal
when Vpl = V1 in the monitor’s precipi-
tation section (A)
L The particle length concentration defined
by L = Ndp,av (m/m3)
Lpl The traveling length of the electrode
surfaces in the precipitation section
N The total particle number concentration
(particles/m3)
Napp The inferred apparent particle number
concentration when a default average
particle diameter d�p;av is assumed to exist
(see Eq. 8) (particles/m3)
N(dp) The number concentration of particles of
diameter dp (particles/m3)
Nion The number concentration of airborne ions
in the particle charging section (ions/m3)
(Ndp,av)0 The safe threshold particle length
concentration (particles m-3 m)
P The air pollution index number defined
in Eq. 29
q The number of elementary charges on a
particle
Q(dp) The average number of elementary
charges on a particle of diameter dp
Sdp A proportionality factor defined in Eq. 17
SN A proportionality factor defined in Eq. 15
SNapp A proportionality factor defined in Eq. 9
SAL The deposited particle surface area per
unit volume of inhaled air in the alveolar
region (m2/m3)
SHA The deposited particle surface area per
unit volume of inhaled air in the head
airway region (m2/m3)
STB The deposited particle surface area per
unit volume of inhaled air in the tracheo-
bronchial region (m2/m3)
tr The exposure time of airborne particles
to airborne ions in the particle charging
section (s)
vair The average air speed between the
electrode surfaces in the precipitation
section (m/s)
Vpl, V1 The applied voltage difference between
the electrode surfaces in the precipitation
section (V)
r The size distribution parameter
/ The airflow through the NP monitor (m3/s)
/* The reference airflow through the NP
monitor (m3/s)
nq(dp,Epl) The fractional degree of precipitation of
particles of diameter dp charged with ‘‘q’’
elementary charges under the influence of
an applied electrical field strength Epl
gair The viscosity of air (gair = 1.8 9 10-5
Pa.s)
Introduction
The potential benefits of nanotechnology for society are
well-recognized by now, but there is also increasing
awareness about uncertainties concerning the risk of
released nanoparticles to the environment and human
health. Questions in this regard have been posed by
stakeholders in the nanotech industry and by several
societal organizations, notably workers unions,
J Nanopart Res
123

insurers, investment firms, NGO’s, and governmental
agencies (Balbus et al. 2007). Of particular importance
is the potential hazard to the health of workers
employed by the nanomaterials industry where prod-
ucts are made comprising engineered nanoparticles
(NP). Depending on their size and chemical nature,
exposure to NPs through inhalation can be hazardous
because of their ability to reach and deposit in the deep
alveolar region of the lung from where they may
subsequently enter the systemic circulation (Kreyling
et al. 2002; Oberdorster et al. 1995). NPs deposited in
the nose may create additional hazard through their
potential ability to transfer to the brain via the olfactory
nerve (Elder et al. 2006). Studies with engineered NPs
demonstrated their ability to cross the blood-brain and
blood-testis barriers and the nuclear membrane inside
cells, although it remains unknown to which extent this
can eventually affect human health (Oberdorster 2004;
Shosaku 2006; Kim et al. 2006; Geiser et al. 2005). Far
more knowledge about adverse health effects is avail-
able from numerous studies with inhaled combustion-
related fine particles (B10 lm or B2.5 lm) and ultra-
fine particles (UFPs,\300 nm), which are in the same
size range as engineered NPs (Balbus et al. 2007). This
knowledge is useful to guide risk studies with regard to
engineered NPs but cannot replace them.
Shape, size, and chemical composition of a specific
NP determine its intrinsic toxicity (hazard) and this
may be quite different for different kinds of NPs. The
health risk of NP intake is determined by both hazard
and exposure. It has been recognized in comparative
experiments that the airborne particle mass concentra-
tion is not a suitable metric for correlating NP exposure
to health risks because this metric does not explicitly
account for the finding that the toxicity of NPs and
UFPs can be higher than the toxicity of fine particles
per unit particle mass. For TiO2 particles, particle
toxicity was found to correlate much better with the
inhaled particle surface area than with the inhaled
particle mass (Oberdorster et al. 2005). Particle number
concentration, particle surface area concentration and,
more specifically, the particle surface area concentra-
tion in the inhaled air that deposits in the respiratory
tract are believed to be more appropriate metrics for
quantifying exposure to NPs and UFPs (Oberdorster
1996; Donaldson et al. 1998; Fissan et al. 2007).
The present article deals primarily with exposure
assessment. A discussion is given about the techno-
logy comprised in the Aerasense NP monitor with
which the particle number concentration N and the
number-averaged particle size dp,av of airborne UFPs
in the 10–300 nm size range can be determined. It
will be explained how from a knowledge of N and
dp,av or of the product Ndp,av, it is possible to estimate
the particle surface area concentrations in inhaled air
that deposit in various regions of the respiratory tract.
The Aerasense NP monitor can be embodied as
either a portable or a wall-mounted device for
assessing the momentary and accumulated exposure
of a worker to airborne NPs during a workday.
Alternatively, the monitor can be used to assess the
indoor or outdoor UFP pollution level, to guard the
workplace environment, to trace particle sources, to
trigger ventilation on demand via a feedback loop,
and to assess the effectiveness of installed air filters
or other measures intended to reduce exposure.
The Aerasense NP monitor
Principle of operation
A schematic picture of the Aerasense NP monitor is
shown in Fig. 1. A controlled airflow / is drawn via
the inlet through the monitor by means of a fan
situated atop the sensor. After entry, airborne particles
are electrically charged inside the charging section via
diffusion charging (Hinds 1999). Diffusion charging
is enabled by a corona discharge from a needle-tip
electrode that is set at a sufficiently high voltage Vcor
to locally ionize the air. The needle-tip electrode is
surrounded by a screen electrode, whereupon a screen
voltage Vscr � Vcor is imposed. Particle charging
occurs in the air conduit between the screen electrode
and the outer wall by contacting the particles with ions
that move from the screen electrode across the conduit
toward the opposite wall. The space-averaged ion
concentration Nion and the residence time tr of the
particles in this conduit determine the charging
parameter, Niontr used in the Fuchs theory for quan-
tifying particle diffusion charging (Adachi et al.
1985). Vscr is set at a voltage sufficiently high to
prohibit ion escape from the charging section, yet low
enough to avoid field charging and particle precipi-
tation during particle charging.
After charging, the particles enter the precipitation
section, wherein a block-shaped voltage pulse vary-
ing between Vpl = V1, and Vpl = 0 is imposed
J Nanopart Res
123

between two parallel electrode plates separated by a
distance dpl. At Vpl = 0, charged particles traverse
the precipitation section unhindered. They are subse-
quently captured in a filter disposed inside an
electrically isolated Faraday cage that is connected
via a sensitive current meter to a reference potential.
The current meter, having a sensitivity of about 1 fA,
records the total particle charge that deposits per unit
time inside the Faraday cage as an electrical current
Isensor = I1.. The current Isensor constitutes the sensor
signal. I1 accounts for the charge of all airborne
particles entering the Faraday cage according to
Isensor ¼ I1 ¼Z1
dp¼0
X1q¼0
qe/fqðNiontr; dpÞ
� dNðdpÞd lnðdpÞ
d lnðdpÞ
ð1Þ
where, dp represents the particle mobility diameter,
‘‘q’’ is the number of elementary charges on a particle,
‘‘e’’ is the elementary electron charge, fq(Niontr, dp) the
fraction of all particles of diameter dp that are charged
with q elementary charges at the pertaining Niontr, and
N(dp) denotes the number concentration of particles
with a diameter dp. The total particle number concen-
tration N relates to N(dp) according to
N ¼Z1
dp¼0
dNðdpÞd lnðdpÞ
d lnðdpÞ: ð2Þ
The integrals in Eqs. 1 and 2 extend across all
particle sizes; however, it is well known that the
overwhelming majority of airborne particles in
ambient air are smaller than 300 nm and mostly
even smaller than 100 nm. Larger particles will
therefore in most cases not noticeably contribute to
Isensor and/or N.
At Vpl = V1, at least some charged particles
precipitate inside the plate section due to the field
strength Epl = V1/dpl between the plates. All remain-
ing particles are captured in the Faraday cage, giving
rise to a second sensor signal
Isensor ¼ I2 ¼Z1
dp¼0
X1q¼0
qe/fqðNiontr; dpÞ
� 1� nqðdp;EplÞ� �dNðdpÞ
d lnðdpÞd lnðdpÞ ð3Þ
wherein, nq(dp, Epl) denotes the fractional precipita-
tion of particles of diameter dp charged with ‘‘q’’
elementary charges. Figure 1 shows that I1 and I2 are
recorded sequentially. Laminar flow conditions are
ensured to exist in the precipitation section, allowing
nq(dp, Epl) to be described according to
nqðdp;EplÞ ¼ 1; when
qeCcðdpÞEplLpl
3pgairdpvairdpl
� 1 full precipitationð Þ;
nqðdp;EplÞ ¼qeCcðdpÞEplLpl
3pgairdpvairdpl
; otherwise
ð4Þ
Cc(dp) denotes the Cunningham slip factor, Lpl the
traveling length of the parallel electrode plates, gair
the viscosity of air, and vair the average air speed
between the plates.
Fig. 1 Schematics of the
Aerasense NP monitor
J Nanopart Res
123

Inferring the particle length concentration L
The Fuchs theory is well-recognized to reliably predict
particle diffusion charging behavior (Adachi et al.
1985) and can be used to obtain upfront quantitative
insight in the fractional values fp(Niontr, dp). This
enables the average number of elementary charges
Q(dp) on a particle of diameter dp to be inferred from
QðdpÞ ¼X1q¼0
qfqðNiontr; dpÞ: ð5Þ
Following the procedure described by Buscher
et al. (1994), a value Niontr & 1 9 1013 ions s m-3
was inferred from measurements of / and the ion
current passing across the flow conduit around the
screen electrode inside a prototype monitor. At
Niontr = 1 9 1013 ions s m-3, the Fuchs theory pre-
dicts the substantially linear relationship
QðdpÞ ¼ 0:038dp ð6Þ
(dp in units ‘‘nm’’) with a correlation coefficient
R2 = 0.9998. Deviations from linearity are predicted
only for dp B 10 nm for reasons that then just a
fraction of the particles can still become charged with
only a single ion. Leaving the latter complication
aside, a substitution of Eq. 5 in Eq. 1 with
Q(dp) � dp yields
I1 ¼ C1
Z1
dp ¼ 0
dp
dNðdpÞd lnðdpÞ
d lnðdpÞ
¼ C1Ndp;av ¼ C1L ð7Þ
wherein, dp,av is the number-averaged particle dia-
meter defined according to
dp;av ¼R1
dp¼ 0dp
dNðdpÞd lnðdpÞd lnðdpÞR1
dp¼ 0
dNðdpÞd lnðdpÞ
d lnðdpÞ¼ L
N:
C1 denotes a parameter whose magnitude depends on
the process variables / and Niontr. These are normally
held constant for a given monitor, thus making C1 a
constant proportionality factor. L = Ndp,av denotes
the particle length concentration.
The outcome of Eq. 7 was verified by measuring I1
as a function of Ndp,av for various aerosol size
distributions and concentrations. For this purpose,
aerosols were generated by atomizing dilute aqueous
KNO3 or NaCl salt solutions in a Condensation
Aerosol Generator SLG 250 (Topas, Dresden, Ger-
many) capable of emitting the salt nuclei either as
produced or after size enlargement by contacting
them with condensing DEHS vapor. The final size of
the produced particles was adapted via controlled
heating of the DEHS liquid in the SLG 250 which
determined the DEHS vapor pressure in the conden-
sation chamber. Values of dp,av could be obtained
throughout the 20–130 nm size range (accounting for
particles with diameters up to about 300 nm).
Changes in N were realized by altering the airflow
with which the aerosol particles were carried away
from the aerosol generator toward the measuring
chamber. Resulting values for N fell within the
10000–800000 part/cm3 concentration range. A
Scanning Mobility Particle Sizer (SMPS) instrument
(Grimm Aerosol Technik, Germany) comprising a
Differential Mobility Analyzer (DMA, Model #55–
340) and a Condensation Particle Counter (CPC,
Model #5403) was used as a reference instrument to
independently measure the particle size distribution
in the 6–340 nm size range. Values for both N and
dp,av were independently obtained from the recorded
particle size distribution for computing L = Ndp,av.
Results for I1 as a function of L = Ndp,av are shown
in Fig. 2. They entirely confirm the prediction of Eq. 7
that I1 � L. The average particle charge was found to be
Q(dp,av) & 0.035dp,av, in close agreement with Eq. 6.
Inferring the particle number concentration N
From the particle length concentration L, it is possible
to infer an approximate ‘‘apparent’’ number concen-
tration Napp according to
Napp ¼N � dp;av
d�p;av
ð8Þ
Fig. 2 The particle length concentration L = Ndp,av as a
function of I1
J Nanopart Res
123

with d�p;av denoting a default average particle dia-
meter. As an example, measurements on combustion-
related UFPs in outdoor air showed that dp,av
typically falls within the 25–100 nm size range.
Taking a default d�p;av ¼ 50 nm, a measurement of I1
becomes sufficient to infer a value for Napp that
differs at most by a factor of 2 from N. As such
Napp ¼ SNappI1 ð9Þ
with SNapp, a calibration factor. In the air of a given
workplace environment, it is plausible that the
encountered particle size distribution remains rela-
tively constant over time. A reference instrument can
then determine d�p;av � dp;av for that workplace to
minimize the difference between N and Napp. Note
that for inferring Napp from I1 according to Eq. 9, it is
sufficient to use the monitor depicted in Fig. 1
without the precipitation section.
It will now be shown how a more accurate value
for N can be extracted from a measurement of the
signal difference (I1–I2) under the condition that
process conditions are chosen such that
nqðdp;EplÞ ¼qeCcðdpÞEplLpl
3pgairdpvairdpl
\1 ð10Þ
for all charged particles of diameter dp that contribute
to a non-negligible extent to N. From Eqs. 1, 3, and 4
I1 � I2 ¼Z1
dp¼0
X1q¼0
qe/fqðNiontr; dpÞnqðdpÞ
� dNðdpÞd lnðdpÞ
d lnðdpÞ
¼Z1
dp¼0
X1q¼0
qe/fqðNiontr; dpÞqeCcðdpÞEplLpl
3pgairdpvairdpl
� dNðdpÞd lnðdpÞ
d lnðdpÞ
/Z1
dp¼0
X1q¼0
q2fqðNiontr; dpÞCcðdpÞ
dp
� dNðdpÞd lnðdpÞ
d lnðdpÞ
/Z1
dp¼0
Q2ðdpÞCcðdpÞ
dp
� dNðdpÞd lnðdpÞ
d lnðdpÞ:
ð11Þ
Using the result obtained from Eq. 6, wherein
Q(dp) � dp while Cc(dp) � 1/dp for dp \ 100 nm, one
arrives at
I1 � I2 /Z1
dp¼0
dNðdpÞd lnðdpÞ
d lnðdpÞ / N ð12Þ
Thus predicting a linear relationship between
(I1 - I2) and N. More detailed information about
the validity domain of the latter outcome at a given
set of process conditions was theoretically obtained
by investigating the constancy of the parameter
A0 in
A0 ¼I1 � I2
Nð13Þ
as a function of dp,av, Epl and r at/Lpl
vairdpl¼ 6:9�
10�4 m2 with Niontr = 1 9 1013 ions s m-3 and /= 0.53 L/min. In practice, most UFP size distribu-
tions can be described in terms of a single or linear
combination of several log-normal size distributions.
A log-normal size distribution expressed in terms of
N, dp,av and the size distribution parameter r has the
form
dNðdpÞ ¼Nffiffiffiffiffiffi
2pp
lnr
� exp �ln dp� ln dp;avþ ln2 r
2
� �2
2 lnrð Þ2
264
375d ln dp
� :
ð14ÞExamples of a few log-normal size distributions at
a constant dp,av but different values for r are shown in
Fig. 3. A narrow size distribution is obtained at
r = 1.2; a wide size distribution exists at r = 2.5.
Fig. 3 Mono-modal log-normal particle size distributions at
different values r
J Nanopart Res
123
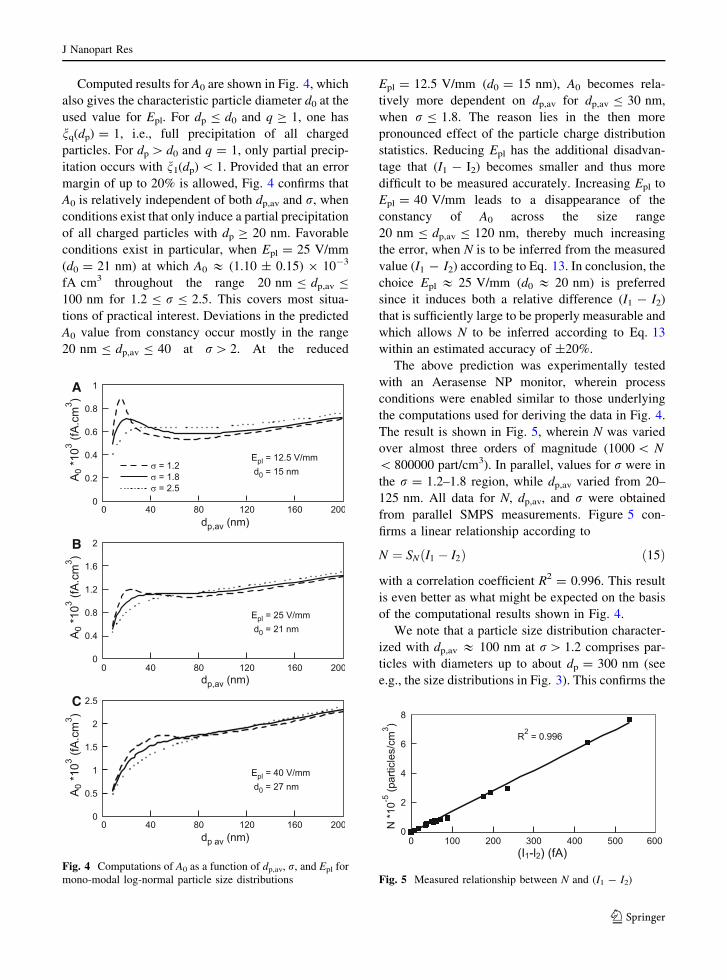
Computed results for A0 are shown in Fig. 4, which
also gives the characteristic particle diameter d0 at the
used value for Epl. For dp B d0 and q C 1, one has
nq(dp) = 1, i.e., full precipitation of all charged
particles. For dp [ d0 and q = 1, only partial precip-
itation occurs with n1(dp) \ 1. Provided that an error
margin of up to 20% is allowed, Fig. 4 confirms that
A0 is relatively independent of both dp,av and r, when
conditions exist that only induce a partial precipitation
of all charged particles with dp C 20 nm. Favorable
conditions exist in particular, when Epl = 25 V/mm
(d0 = 21 nm) at which A0 & (1.10 ± 0.15) 9 10-3
fA cm3 throughout the range 20 nm B dp,av B
100 nm for 1.2 B r B 2.5. This covers most situa-
tions of practical interest. Deviations in the predicted
A0 value from constancy occur mostly in the range
20 nm B dp,av B 40 at r[ 2. At the reduced
Epl = 12.5 V/mm (d0 = 15 nm), A0 becomes rela-
tively more dependent on dp,av for dp,av B 30 nm,
when r B 1.8. The reason lies in the then more
pronounced effect of the particle charge distribution
statistics. Reducing Epl has the additional disadvan-
tage that (I1 - I2) becomes smaller and thus more
difficult to be measured accurately. Increasing Epl to
Epl = 40 V/mm leads to a disappearance of the
constancy of A0 across the size range
20 nm B dp,av B 120 nm, thereby much increasing
the error, when N is to be inferred from the measured
value (I1 - I2) according to Eq. 13. In conclusion, the
choice Epl & 25 V/mm (d0 & 20 nm) is preferred
since it induces both a relative difference (I1 - I2)
that is sufficiently large to be properly measurable and
which allows N to be inferred according to Eq. 13
within an estimated accuracy of ±20%.
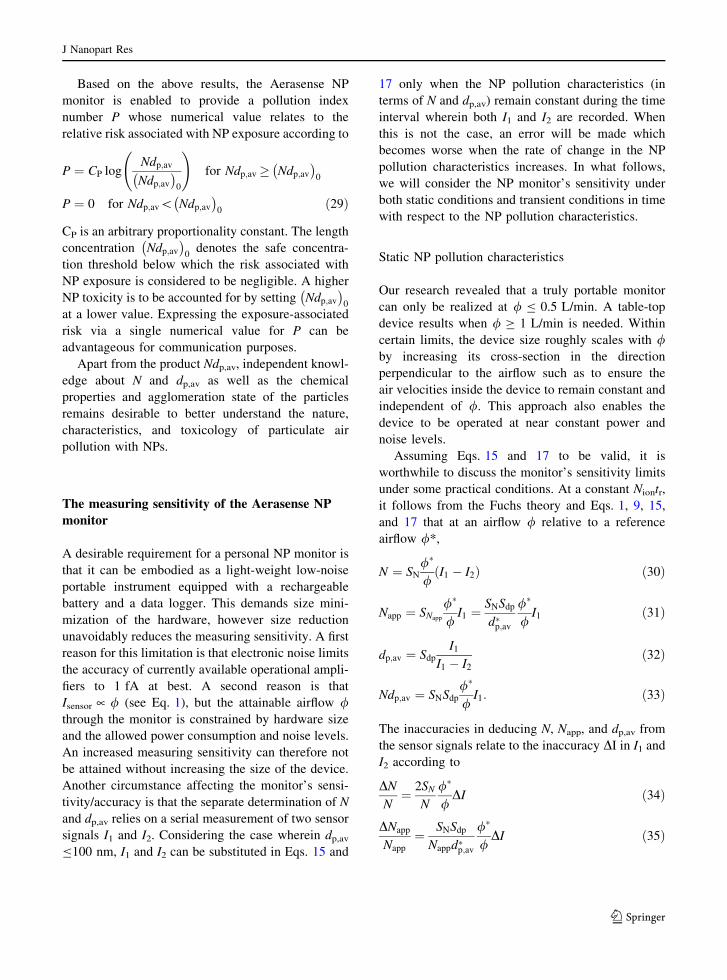
The above prediction was experimentally tested
with an Aerasense NP monitor, wherein process
conditions were enabled similar to those underlying
the computations used for deriving the data in Fig. 4.
The result is shown in Fig. 5, wherein N was varied
over almost three orders of magnitude (1000 \ N
\ 800000 part/cm3). In parallel, values for r were in
the r = 1.2–1.8 region, while dp,av varied from 20–
125 nm. All data for N, dp,av, and r were obtained
from parallel SMPS measurements. Figure 5 con-
firms a linear relationship according to
N ¼ SNðI1 � I2Þ ð15Þ
with a correlation coefficient R2 = 0.996. This result
is even better as what might be expected on the basis
of the computational results shown in Fig. 4.
We note that a particle size distribution character-
ized with dp,av & 100 nm at r[ 1.2 comprises par-
ticles with diameters up to about dp = 300 nm (see
e.g., the size distributions in Fig. 3). This confirms the
A
B
C
Fig. 4 Computations of A0 as a function of dp,av, r, and Epl for
mono-modal log-normal particle size distributions Fig. 5 Measured relationship between N and (I1 - I2)
J Nanopart Res
123

suitability of the Aerasense NP monitor for detecting
airborne particles in the 10–300 nm size range.
Inferring the average particle diameter dp,av
when dp,av B 100 nm
With the aforementioned results, it is possible to infer
dp,av from L and N according to
dp;av ¼L
N/ I1
I1 � I2
ð16Þ
under the constraint that dp,av B 100 nm. This is
confirmed in Fig. 6, wherein I1/(I1 - I2) is plotted
against dp,av at various N and r values, as inferred
from independent SMPS measurements. A linear
relationship is apparent with a correlation coefficient
R2 = 0.975 according to
dp;av ¼ Sdp
I1
I1 � I2
ð17Þ
up to dp,av & 100 nm. Note that the scaling factor
SNappintroduced in Eq. 9 relates to SN and Sdp
according to
SNapp¼ SNSdp
d�p;av
ð18Þ
Separate knowledge of dp,av and N gives better insight
in the NP and/or UFP air pollution characteristics and
its likely origin. Furthermore, as will be discussed
below, it can be used to get information about the
particle surface area that deposits inside the respira-
tory tract following particle inhalation.
Inferring N and dp,av when dp,av [100 nm
In most situations of practical interest, particles with
dp \ 100–150 nm account for over 95% of the total
particle number concentration. This is normally
consistent with a dp,av \ 100 nm. It is nevertheless
worthwhile to briefly explore the situation, wherein
dp,av [ 100–120 nm. The computed results depicted
in Fig. 4 show that then the approximately linear
relationship
A0 ¼ C2 þ C3dp;av ð19Þ
holds, wherein C2 and C3 are constants. In Fig. 4b
and c, A0 hardly depends on the particle size
distribution at dp,av C 100 nm, so the same is true
for C2 and C3. According to Eq. 13, this leads to
I1 � I2 ¼ N C2 þ C3dp;av
� : ð20Þ
Combining Eq. 20 with Eq. 7 yields
I1
I1 � I2
¼ C1dp;av
C2 þ C3dp;av
for dp;av [ 100� 120 nm:
ð21Þ
Equation 21 allows dp,av to be inferred from the
signals I1 and I2, when C1, C2, and C3 are known
either from a theoretical calculation or from a
calibration with a reference instrument. Subse-
quently, N is obtained from either Eq. 7 or Eq. 20.
Since the use of the Aerasense NP monitor is
mainly intended for detecting particles with
dp \ 300 nm, we did not pursue the experimental
confirmation of the validity and applicability of
Eqs. 19–21. Importantly, Eq. 17 is valid when
dp,av B 100 nm, whereas Eq 21 applies to the less
common situations wherein dp,av [ 100 nm. Whether
or not dp,av B 100 nm becomes immediately evident
from a substitution of I1 and I2 in Eq. 17, thereby
making clear whether either Eq. 17 or Eq. 21 should
be used for obtaining dp,av. From Fig. 4c and b, it is
furthermore evident that for dp,av [ 100 nm, a rela-
tively more accurate determination of dp,av becomes
possible when the precipitation section is operated at
a field strength Epl C 25 V/mm such that the factors
C2 and C3dp,av in Eq. 21 remain comparable in
magnitude.
Inferring the inhalation-induced particle surface
area deposition S
As mentioned before, inhaled non-soluble solid NPs
may induce adverse health effects at the point of
deposition in the respiratory tract or after transmis-
sion to other body organs. Toxicologists consider theFig. 6 Measured relationship between dp,av and I1/(I1 - I2)
J Nanopart Res
123

particle surface area as one relevant exposure mea-
sure because many processes in the body environ-
ment take place via the particle surface. The surface
area strongly increases per unit particle mass when
the particle size decreases (Oberdorster 1996; Don-
aldson et al. 1998). NP deposition in the tracheo-
bronchial lung region (TB) as well as the alveolar
lung region (AL) is potentially hazardous because of
slow particle clearing mechanisms and the possible
transfer of NPs into the blood with resulting distri-
bution in several body organs. NP transfer into the
blood is most likely to occur from the alveolar region.
In the head airways (HA), NP transfer may occur
from the nose via the olfactory nerve to the brain.
Figure 7 shows the fractional deposition efficiency
curves of particles in various respiratory tract regions
as a function of dp. The data are obtained from ICRP
Publication 66 (ICRP 1994) which relates to a nose-
breathing reference worker under a set of specified
breathing conditions (3,301 cm3 functional residual
lung capacity, 20 breaths per minute, 1.5 m3/h
ventilation rate, light exercise). The precise shape
of the deposition efficiency curves is known to differ
from person to person depending on gender, activity
level, age, and the possible presence of respiratory
ailments. The following discussion applies to the
reference worker only, but can analogously be carried
out for others when the particle deposition efficien-
cies in their respective lung compartments are known.
Analytical equations for the fractional deposition
efficiencies DHA(dp), DTB(dp) and DAL(dp) in the
head airways, the tracheo-bronchial lung region and
the alveolar lung region, respectively, have been
reported in the literature (Hinds 1999) and will not be
repeated here. At dp \ 300 nm, particle deposition in
the lung is predominantly governed by diffusion. The
diameter dp in DHA(dp), DTB(dp), and DAL(dp) is
therefore the geometric diameter governing particle
diffusion behavior. According to Sinclair et al.
(1976), the mobility diameter governing the particle
charging behavior is virtually identical to the geo-
metric diameter and can therefore also be used for
estimating the deposition efficiencies of these UFPs.
The deposited particle surfaces areas SHA, STB, and
SAL per unit volume of inhaled air comprising
spherical particles follow from
SHA ¼Z1
dp¼0
pd2pDHAðdpÞ
dN
d lnðdpÞd lnðdpÞ; ð22Þ
STB ¼Z1
dp¼0
pd2pDTBðdpÞ
dN
d lnðdpÞd lnðdpÞ; ð23Þ
SAL ¼Z1
dp¼0
pd2pDALðdpÞ
dN
d lnðdpÞd lnðdpÞ: ð24Þ
The log-normal size distribution in Eq. 14 is an
example of a possible particle size distribution dNd lnðdpÞ.
Most size distributions encountered in practice can be
represented by a linear combination of 2 or 3 log-
normal particle size distributions.
Examples of computations of S as a function of
dp,av and r according to Eqs. 22–24 are shown in
Fig. 8 with an arbitrary-chosen N = 100,000 part/
cm3. Remarkably, the results for STB and SAL are
rather independent of r across the broad range
1.2 B r B 2.4 up to dp,av = 100 nm, covering many
practical situations of interest. Within an error of
10–20%, both STB and SAL can be expressed as a
function of dp,av and N only, provided that
dp,av \ 80–100 nm. With N and dp,av obtained from
I1 and I2, this result also allows STB and SAL to be
directly inferred, at least for the reference worker
under consideration.
A quick computation of STB(N, dp,av) and SAL(N,
dp,av) can be done by making use of the following
expressions for the fitted solid curves in Fig. 8
STBðN; dp;avÞ ¼ 10�6N�4d1:33
p;av � 1:05� 10�2d2:6p;av
þ6:4� 10�5d3:52p;av � 5:2� 10�10d5:4
p;av
SALðN; dp;avÞ ¼ 10�5N
�5:4dp;av � 38
ð25Þ
Fig. 7 Fractional deposition efficiency of inhaled particles in
various lung compartments for a reference worker according to
the ICRP model (ICRP 1994)
J Nanopart Res
123

wherein N must be substituted in part/cm3, and dp,av
in ‘‘nm’’, yielding STB and SAL in lm2/cm3. The
validity of Eq. 25 is limited to spherical particles with
dp,av \ 80–100 nm when also a wide particle size
distribution with r & 2.4 is to be properly accounted
for. However, this size range is sufficiently wide to
account for NP exposure and accounts for airborne
particles with sizes up to dp = 300–400 nm. It is
furthermore assumed that the dp,av of inhaled particles
does not change through moisture uptake during
inhalation. This limits the applicability of the present
discussion to solid non-hygroscopic particles. Irreg-
ular-shaped particle agglomerates cannot be
accounted for.
Computed results for SHA shown in Fig. 8c
markedly depend on r. Without upfront knowledge
about the characteristics of the particle size distribu-
tion, it appears at first sight not possible to infer SHA
from N and dp,av only. However, inspection of the HA
deposition efficiency curve in Fig. 7 reveals that the
upswing in the curves for SHA in Fig. 8 can be
ascribed to the deposition of larger particles with
dp [ 100 nm. These larger particles are less likely to
be transferable from the nose to the brain. Consid-
ering only the deposited surface area SHA of inhaled
NPs with dp \ 100 nm, the solid straight line drawn
in the SHA diagram of Fig. 8c can be used to account
for their deposition.
Without losing much accuracy, the solid lines
drawn in Fig. 8 for SAL and STB can also be
approximated as linear functions of the product
Ndp,av for 25 B dp,av B 80 nm according to
SALðN; dp;avÞ � 4:7� 10�5Ndp;av � CALI1 ð26Þ
STBðN; dp;avÞ � 0:95� 10�5Ndp;av � 0:20CALI1
ð27Þ
SHAðN; dp;avÞ � 0:6� 10�5Ndp;av � 0:13CALI1
ð28Þ
with N expressed in part/cm3 and dp,av in ‘‘nm’’,
yielding S in lm2/cm3. These functions are re-drawn
in Fig. 9. The constant CAL follows from the
relationship between I1 and Ndp,av (see Fig. 2).
Equations 26–28 predict I1 to represent a key signal
that is proportional to the NP exposure concerning the
deposited surface area concentrations of inhaled NPs
inside the respiratory tract. Use of the NP monitor
shown in Fig. 1 without the precipitation section is
sufficient for this measurement and it is not necessary
to independently obtain values for N and dp,av.
A
B
C
Fig. 8 Predicted surface area concentrations S that deposit in
the AL, TB and HA regions of the lung, respectively, as a
function of dp,av and r at N = 100,000 part/cm3 for a reference
worker inhaling these particles. Solid lines represent the
analytical approximations according to Eq. 25
Fig. 9 SAL, STB, and SHA as a function of dp,av at N = 100,000
part/cm3 for a reference worker inhaling these particles
according to Eqs. 26–28
J Nanopart Res
123
Based on the above results, the Aerasense NP
monitor is enabled to provide a pollution index
number P whose numerical value relates to the
relative risk associated with NP exposure according to
P ¼ CP logNdp;av
Ndp;av
� 0
!for Ndp;av� Ndp;av
� 0
P ¼ 0 for Ndp;av\ Ndp;av
� 0
ð29Þ
CP is an arbitrary proportionality constant. The length
concentration Ndp;av
� 0
denotes the safe concentra-
tion threshold below which the risk associated with
NP exposure is considered to be negligible. A higher
NP toxicity is to be accounted for by setting Ndp;av
� 0
at a lower value. Expressing the exposure-associated
risk via a single numerical value for P can be
advantageous for communication purposes.
Apart from the product Ndp,av, independent knowl-
edge about N and dp,av as well as the chemical
properties and agglomeration state of the particles
remains desirable to better understand the nature,
characteristics, and toxicology of particulate air
pollution with NPs.
The measuring sensitivity of the Aerasense NP
monitor
A desirable requirement for a personal NP monitor is
that it can be embodied as a light-weight low-noise
portable instrument equipped with a rechargeable
battery and a data logger. This demands size mini-
mization of the hardware, however size reduction
unavoidably reduces the measuring sensitivity. A first
reason for this limitation is that electronic noise limits
the accuracy of currently available operational ampli-
fiers to 1 fA at best. A second reason is that
Isensor � / (see Eq. 1), but the attainable airflow /through the monitor is constrained by hardware size
and the allowed power consumption and noise levels.
An increased measuring sensitivity can therefore not
be attained without increasing the size of the device.
Another circumstance affecting the monitor’s sensi-
tivity/accuracy is that the separate determination of N
and dp,av relies on a serial measurement of two sensor
signals I1 and I2. Considering the case wherein dp,av
B100 nm, I1 and I2 can be substituted in Eqs. 15 and
17 only when the NP pollution characteristics (in
terms of N and dp,av) remain constant during the time
interval wherein both I1 and I2 are recorded. When
this is not the case, an error will be made which
becomes worse when the rate of change in the NP
pollution characteristics increases. In what follows,
we will consider the NP monitor’s sensitivity under
both static conditions and transient conditions in time
with respect to the NP pollution characteristics.
Static NP pollution characteristics
Our research revealed that a truly portable monitor
can only be realized at / B 0.5 L/min. A table-top
device results when / C 1 L/min is needed. Within
certain limits, the device size roughly scales with /by increasing its cross-section in the direction
perpendicular to the airflow such as to ensure the
air velocities inside the device to remain constant and
independent of /. This approach also enables the
device to be operated at near constant power and
noise levels.
Assuming Eqs. 15 and 17 to be valid, it is
worthwhile to discuss the monitor’s sensitivity limits
under some practical conditions. At a constant Niontr,
it follows from the Fuchs theory and Eqs. 1, 9, 15,
and 17 that at an airflow / relative to a reference
airflow /*,
N ¼ SN
/�
/ðI1 � I2Þ ð30Þ
Napp ¼ SNapp
/�
/I1 ¼
SNSdp
d�p;av
/�
/I1 ð31Þ
dp;av ¼ Sdp
I1
I1 � I2
ð32Þ
Ndp;av ¼ SNSdp
/�
/I1: ð33Þ
The inaccuracies in deducing N, Napp, and dp,av from
the sensor signals relate to the inaccuracy DI in I1 and
I2 according to
DN
N¼ 2SN
N
/�
/DI ð34Þ
DNapp
Napp
¼ SNSdp
Nappd�p;av
/�
/DI ð35Þ
J Nanopart Res
123
Ddp;av
dp;av
¼ DI
I1
þ 2DI
I1 � I2
ð36Þ
¼ /�
/DI
N
SNSdp
dp;av
þ 2SN
� �: ð37Þ
Equations 34–37 confirm the improving accuracy of
the inferred N and dp,av at increasing / and/or N.
Specifically, at constant parameters Niontr = 1 9 1013
ions s m-3, /� ¼ 0:53 L=min (about the limit of
portability), d�p;av ¼ 50 nm, Epl = 25 V/mm, and
/�EplLpl
vairdpl¼ 17:25 Vm, one has Sdp = 20.2 nm and
SN = 900 part cm-3 fA-1. This results in
DN
N� 1800
N
/�
/DI ð38Þ
DNapp
Napp
� 360
Napp
/�
/DI ð39Þ
Ddp;av
dp;av
�/�
/DI
N
18200
dp;av
þ 1800
� �: ð40Þ
According to Eq. 38, DN & 1800 part/cm3 at
DI = 1 fA for a single measurement at / = /�:The latter DN value may be compared with ambient
NP concentration values in ‘‘clean’’ outdoor air,
wherein N B 10.000 part/cm3, and in ‘‘slightly pol-
luted’’ outdoor air wherein 10.000 B N B 30.000
part/cm3. Averaging successively obtained values for
N over a period of time can much reduce DN, but
only so when the air pollution characteristics remain
substantially constant over this period. At
N = 10,000 part/cm3 and dp,av = 50 nm, Eq. 40
predicts Ddp,av & 11 nm when DI = 1 fA.
An improved measuring accuracy is attained by
reducing DI to below 1 fA. This is accomplished in
the Aerasense NP monitor by incorporating an
advanced signal filtering procedure for the sensor
signal Isensor together with an averaging procedure of
sampled filtered signals Isensor for a finite period of
time, leading to DI & 0.2–0.4 fA. The latter reduc-
tion of DI reduces the inaccuracy in N down to
DN & 500–700 part/cm3.
Comparing Eq. 38 with 39 shows that DNapp \DN,
obviously because Napp is directly inferred from only a
single sensor signal. Assuming the health risk associ-
ated with NP exposure to be proportional to the
deposited surface areas S according to Eqs. 26–28, the
relative uncertainty DSS with respect to this risk follows
from
DS
S¼ DI
I1
¼ DNapp
Napp
� 360
Napp
/�
/DI: ð41Þ
From Eqs. 38 and 41, DSS ¼ 0:2 DN
N i.e., S is measured
more accurately than N.
Thus, a characterization of the NP air pollution
characteristics in terms of N and dp,av under static
conditions is possible with a portable NP monitor at
/ = /* & 0.5 L/min with DN & 500–700 part/cm3
and Ddp,av & 3–4 nm. This result is to be compared
with the outcome of the earlier discussion on the
results in Fig. 4, which led to the conclusion that the
validity of Eq. 15 is subject to a ±20% uncertainty
range. The latter percentage remains therefore the
dominating contribution to the overall uncertainty in
the inferred value for N and this intrinsic uncertainty
cannot be diminished via changes in / and/or Epl.
The same applies to the inferred value for dp,av.
Clearly, the relative exposure risk obtained from the
measured Ndp,av � I1 can always be inferred more
accurately than the individual values for N and dp,av.
Transient NP pollution characteristics
In case the NP pollution characteristics change during
the time period wherein I1 and I2 are serially
measured, additional inaccuracy is incurred in the
inferred NP pollution parameters because the validity
of Eqs. 15 and 17 are compromised. Fast changes
may even lead to recordings wherein I1 \ I2, yielding
non-physical negative values for N and dp,av. Parallel
measurements of I1 and I2 rigorously solve this
problem, but was not implemented in order to avoid
the increasing system complexity. Note that the
presence of pollution transients does not in any way
affect the accuracy of the inferred risk-relevant
values of S or P, because these only depend on the
product Ndp,av = Nd�p;av which follows directly from
I1 according to Eq. 9 without a need to invoke I2.
The Aerasense NP monitor incorporates an algo-
rithm wherein serially measured signals I1 and I2 are
used as input parameters to infer values for N and
dp,av that make physical sense also under highly
transient conditions. One characteristic of this algo-
rithm is that under transient conditions, change of the
inferred dp,av within the time period between two
J Nanopart Res
123

successive measurements is allowed for but the extent
of change is bounded by a set maximum value. No
limitations are imposed with respect to changes in N.
This approach makes physical sense because the
relative change in dp,av within a brief period of time is
normally much less than the relative change in N. This
can still be checked afterwards when all inferred data
for N and dp,av over the duration of the experiment are
visualized on a computer screen. Another character-
istic of this algorithm is that N and dp,av are inferred at
each moment in time when either a new measurement
of I1 or of I2 is recorded. The determinations of N and
dp,av only involve the two most recently measured I1
and I2 values and the previously inferred value for
dp,av. In case I1 B I2 or when I1 B Imin, with Imin, a
predefined minimum signal value, dp,av is left
unchanged. In case the apparent relative change in
dp,av remains within the predefined range, use is again
made of Eq. 17 for the static situation. This procedure
removes much scatter from the series of inferred data
for dp,av over time without imposing restrictions on
the rate of change in N. The product Ndp,av, and
therewith the inferred values for S and P according to
Eqs. 26–29, still correspond with only the most
recently measured value for I1 just as under static
NP pollution conditions.
Maintenance of the Aerasense NP monitor
Maintenance of the NP monitor involves periodic
cleanings of the monitor’s interior to ensure a
constant airflow / through the monitor and an
undisturbed internal corona discharge for particle
charging. Indeed, all airborne particulates entering
the monitor will remain trapped therein, most of them
in the filter disposed inside the Faraday cage. Because
a virtually maintenance-free NP monitor is desirable,
the following measures were taken for this purpose
– The inlet and sampling tube of the monitor are
designed such that all airborne particles with
dp C10 lm will have settled from the airflow
before being able to reach the charging section of
the monitor. These coarse settled particles can
occasionally be easily removed from the tubing.
– The airflow / through the monitor is limited at /\ 0.5 L/min. Even at a fairly high constant
airborne particle mass concentration of 50 lg/m3,
this will lead to a particle deposition of only
10 mg inside the monitor after 1 year of contin-
uous operation. Initial experiments revealed that
this small amount does not noticeably impede the
monitor’s functionality.
– Long-term exposure of the NP monitor to high
particulate pollution levels is avoided by pro-
gramming the NP monitor to operate only inter-
mittently according to a duty cycle when the
measured NP pollution level exceeds a set
maximum concentration level. This significantly
reduces the internal soiling of the monitor.
Monitor operation according to a duty cycle can
also be applied at more moderate pollution levels.
– The used ventilator atop the monitor in Fig. 1 has
a rated lifetime of 4–5 years non-stop operation.
Based on the above implemented measures, it is
foreseen that NP monitor servicing should be neces-
sary only once in about 4 years. This servicing
involves an internal cleaning of the monitor, a
replacement of the filter inside the Faraday cage, a
replacement of the ventilator, and a recalibration of
the monitor’s performance with respect to a bench-
mark NP monitor. It remains to be proven whether
this predicted servicing frequency is sufficient for
guaranteeing reliable monitor operation in the wide
variety of practically encountered environments.
Benchmarking the Aerasense NP monitor
Several other types of NP monitors are commercially
available that enable exposure measurements with
respect to airborne NPs and UFPs. A widely used
analytical instrument is the Scanning Mobility Parti-
cle Sizer (SMPS) which comprises a Differential
Mobility Analyzer (DMA) and a Condensation Par-
ticle Counter (CPC). The SMPS is capable of
measuring the UFP particle size distributiondNðdpÞd lnðdpÞ
for particle sizes below dp = 1000 nm, the most
advanced ones down to dp = 2.5 nm. Exposure-
relevant information can be directly inferred from
the measured particle size distribution. A SMPS is the
instrument of choice for measuring particle size
distribution details and for calibrating the Aerasense
NP monitor. On the other hand, the SMPS is complex,
bulky, and expensive, must be operated by a skilled
person, and requires periodic maintenance.
J Nanopart Res
123

Single (portable) CPC monitors are becoming
popular for NP and UFP (source) detection. The
CPC functionality is limited to measuring N with
respect to all airborne particles larger than 3–10 nm.
They cannot provide information about particle size
or about inhalation-induced particle surface area
deposition in the respiratory tract. A CPC is most
accurate when N \ 10,000 part/cm3 because this
allows the CPC to operate in the counting mode. For
N [ 20,000 part/cm3, which is normal in many
workplace environments, the CPC operates in photo-
metric mode wherein individual particles cannot
anymore be distinguished. Conversion of photometric
signals into particle number concentrations relies on
the use of calibration factors, however these appear to
be rather sensitive to various instrumental and process
parameters including the internal temperature settings.
The authors found that at N C 100.000 part/cm3,
values for N determined with the CPC and with the
SMPS, respectively, can differ by up to a factor a 2
whereas they substantially coincide when N \ 10.000
part/cm3. The CPC is less suited for uninterrupted
continuous use and requires periodic refilling of its
liquid reservoir. The handling of all types of CPCs
requires due care because spillage of the liquid from
its reservoir disables the instrument operation.
Based on an existing Electrical Aerosol Detector
(EAD, TSI Model 3070), TSI recently introduced the
Nanoparticle Surface Area Monitor (NSAM) capable
of inferring the particle surface areas per unit volume
of inhaled air that deposit in the AL and TB lung
regions (Shin et al. 2007). The NSAM incorporates
diffusion charging (albeit with a different charging
process than in the Aerasense NP monitor) resulting in
a particle charge Q(dp) = 0.021 9 dp1.13 on monodis-
perse particles smaller than 100 nm. This is similar to
the value Q(dp) & 0.035 9 dp,av achieved in the
Aerasense monitor. By varying the voltage on an
internal ion trap, the NSAM output signals are made
to correspond with the surface area concentrations of
inhaled particles with dp \ 100 nm that deposit in the
AL and TB lung regions. This procedure is different
than described above for the Aerasense monitor, but
the final results are comparable. In this regard, the
functionality of the NSAM parallels that of the
Aerasense monitor, however the NSAM does not
provide information about N and/or dp,av.
Another monitor incorporating diffusion charging
is the LQ1-DC monitor (Matter Engineering) which
reportedly charges particles according to Q(dp) =
0.0028 9 dp1.36 (Jung and Kittelson 2005). The latter
charge level is well below the Q(dp) & 0.035 9 dp
encountered in the Aerasense monitor and makes the
LQ1-DC a relatively less sensitive device. The larger
exponent of dp is used to relate the LQ1-DC output
signal to the active surface area (or Fuchs’ surface
area) of particles available for interaction with
airborne ions. However, because of incomplete NP
deposition in the respiratory system, only part of this
‘‘active surface area’’ relates to the health effects of
inhaled NPs. The LQ1-DC cannot provide informa-
tion about N and/or dp,av.
The DC2000CE (Ecochem Analytics) diffusion
charger appears similar to the LQ1-DC monitor,
yielding a signal from which the active surface area
can be inferred. The instrument specifications men-
tion that the correlation between the active surface
area and the output signal is site specific and must be
re-calibrated with the help of a SMPS instrument
when the site of measurement is changed.
The Aerasense NP monitor in a workplace
environment
An Aerasense NP monitor was used for uninterrupted
periods of at least several hours in two different
workplaces that were both ventilated with filtered
outdoor air.
In the first workplace, an extrusion process was
carried out that involved the compounding of NPs in
an organic matrix. Chemical analysis of sampled
airborne particles indicated that virtually no engi-
neered NPs contributed to the encountered NP
pollution and that the measured NP pollution com-
prised only ambient particles derived from other
sources. Values for Napp were continuously recorded
with an Aerasense NP monitor that did not have a
precipitation section. Results were compared with
values for N and dp,av measured with a SMPS
instrument (Type #5403; Grimm, Germany) capable
of measuring the particle size distribution in 44 size
channels in the 11 nm B dp B 1083 nm particle size
interval. Figure 10 presents data for Napp and N.
Observed values for N are about 25% less than those
for Napp, however this can be partly explained by the
circumstance that the actual dp,av was in the 54–
58 nm range, as obtained from the SMPS results,
J Nanopart Res
123

whereas the NP monitor used a default
dp,av* = 50 nm, resulting in a value for Napp that is
10–15% too high (see Eq. 8). In addition, a small part
of the NP monitor signal comes from particles with
dp B 10 nm, while the SMPS only counts particles
with dp C 11 nm. Apart from that, the agreement is
satisfactory. A noteworthy feature is that the NP
monitor measures at a rate of 0.1 Hz whereas the
SMPS requires almost 7 min for each full scan. The
extra time-resolved power of the NP monitor, which
can be further increased up to 0.3 Hz, is advanta-
geous for detecting rapidly passing transient peaks in
the air pollution level that may accompany certain
events.
In the second workplace, a NP manufacturing
process was carried out in a closed chemical reactor
vessel. It was discovered during process operation
that the presence of several red-hot heated surfaces
exposed to air acted as a major NP source creating a
relatively high NP pollution level comprising NPs of
unknown toxicity. Incidental welding activities in the
workplace further contributed to the NP pollution
creating transient high pollution peaks. Manufactured
NPs could not be detected on the surfaces of any of
the used air sampling filters. Figure 11 presents a
series of data for N measured with the NP monitor
and the SMPS between 19.45 p.m. until the next
morning at 8.45 a.m. During this period, NP concen-
tration differences of almost two orders of magnitude
were encountered. Figure 12 presents simultaneously
measured values for dp,av during the same time
interval. Agreement between the NP monitor data and
the SMPS data is very good. Again, it is clear from
the presented data that transient peaks in the air
pollution level can be easily detected by the NP
monitor whereas they can remain invisible for the
SMPS. Conclusions
The Aerasense NP monitor is a low-maintenance
device for characterizing the NP air pollution in terms
of N and dp,av. Further to that, it can assess the relative
health risk of inhaled NPs through the direct deter-
mination of the particle length concentration
L = Ndp,av as a single concentration metric. L is
linearly proportional to I1 and comprises information
about both particle number concentration and particle
size. For the reference worker considered by the ICRP
(1994), knowledge of L is sufficient to approximately
determine the NP surface areas per unit volume ofFig. 10 Napp and N measured with the Aerasense NP monitor
and with the SMPS, respectively
A
B
Fig. 11 N measured with the Aerasense NP monitor and with
the SMPS
Fig. 12 dp,av measured with the Aerasense NP monitor and
with the SMPS
J Nanopart Res
123

inhaled air that deposit in the AL, TB and HA sections
of the respiratory tract, respectively. A measurement
of L can be done up to a frequency of 0.3 Hz. Inferring
separate values for N and dp,av from the sensor signals
is possible up to a frequency of 0.1 Hz. These
frequencies allow relatively fast measurements to be
carried out in workplace environments, whereby
transient peaks in the NP pollution level can be
detected at a much higher resolving power than what
is possible with a SMPS.
Up to a certain measuring sensitivity, the NP
monitor can be embodied as a portable battery-
powered instrument that allows a direct sampling of
the air during a work shift from the immediate
breathing zone of a worker. This enables personal NP
exposure assessments to be carried out at any moment.
A determination of the integrated exposure during a
period of time is obtained by integrating the mea-
surement signals over time. At a given constant NP
pollution level, the measuring sensitivity of the
Aerasense NP monitor can be improved by increasing
the sampled airflow / through the sensor. This must
preferably be done in parallel with a proportional
increase in the sensor size such as to maintain constant
airflow speeds inside the sensor independent of /.
Complete risk assessment involves not only expo-
sure assessment but also knowledge about the toxicity
of the NPs. Furthermore, when the (suspected)
toxicity of the NPs released in air at the workplace
differs from that of the ambient NPs produced by
other sources (e.g., from outdoor air pollution), it is
necessary to first remove the ambient NPs from the
ventilation air before an assessment of exposure and
risk concerning the workplace-generated NPs can be
carried out.
Other than for personal exposure assessment, the
Aerasense NP monitor can be used for a wide range
of other purposes such as:
– checking the efficiency of installed air filtration
units,
– enabling automatic feedback to air handling and
air cleaning units,
– realizing early warning systems,
– monitoring the ambient NP and UFP air pollution
level, both indoor and outdoor.
Last but not least, use of the Aerasense monitor
can help to create a better awareness about air
pollution with NPs and its potential health risk.
References
Adachi M, Kousaka Y, Okuyama K (1985) Unipolar and
bipolar diffusion charging of ultrafine aerosol particles. J
Aerosol Sci 16(2):109–123
Buscher P, Schmidt-Ott A, Wiedensohler A (1994). Perfor-
mance of a unipolar ‘‘square wave’’ diffusion charger with
variable nt-product. J Aerosol Sci 25(4):651–663
Balbus JM, Florini K, Denison RA, Walsh SA (2007) Pro-
tecting workers and the environment: an environmental
NGO’s perspective on nanotechnology. J Nanopart Res
9(1):11–22
ICRP (1994) International Commission on Radiological Pro-
tection, Publication 66, Human Respiratory Tract Model
for Radiological Protection. Elsevier Science Ltd, Oxford,
Pergamon
Donaldson K, Li XY, MacNee W (1998) Ultrafine (nanometer)
particle mediated lung injury. J Aerosol Sci 29(5–6):553–
560
Elder A, Gelein R, Silva V, Feikert T, Opanashuk L, Carter J,
Potter R, Maynard A, Ito Y, Finkelstein J, Oberdorster G
(2006). Translocation of inhaled ultrafine manganese
oxide particles to the central nervous system. Environ
Health Perspect 114(8):1172–1178
Fissan H, Neumann S, Trampe A, Pui DYH, Shin WG (2007)
Rationale and principle of an instrument measuring lung
deposited nanoparticle surface area. J Nanopart Res
9(1):53–59
Geiser M, Rothen-Rutishauser B, Kapp N, Schurch S, Kreyling
W, Schultz H, Semmler M, Hof VI, Heyder J, Gehr P
(2005) Ultrafine particles cross cellular membranes by
non-phagocytic mechanisms in lungs and in cultured cells.
Environ Health Perspect 113:1555–1560
Hinds WC (1999) Aerosol technology: properties, behavior,
and measurement of airborne particles, 2nd edn. Wiley,
New York
Jung H, Kittelson DB (2005) Characterization of aerosol sur-
face instruments in the transition regime. Aerosol Sci
Technol 39:902–911
Kim JS, Yoon TJ, Yu KN, Kim BG, Park SJ, Kim HW, Lee
KH, Park SB, Lee JK, Cho MH (2006) Toxicity and tissue
distribution of magnetic nanoparticles in mice. Toxicol
Sci 89(1):338–347
Kreyling WG, Semmler M, Erbe F, Mayer P, Takenaka S,
Schultz H, Oberdorster G, Ziesenis A (2002) Transloca-
tion of ultrafine insoluble iridium particles from lung
epithelium to extra-pulmonary organs is size dependent
but very low. J Toxicol Environ Health A 65(20):1513–
1530
Oberdorster G (1996) Significance of particle parameters in the
evaluation of exposure dose-response relationships of
inhaled particles. Part Sci Technol 14(2):135–151
Oberdorster E (2004) Manufactured nanomaterials (fullerenes,
C60) induce oxidative stress in the brain of juvenile
largemouth bass. Environ Health Perspect 112:1058–1062
Oberdorster G, Gelein RM, Ferin J, Weiss B (1995) Association
of particulate air pollution and acute mortality: involve-
ment of ultrafine particles. Inhal Toxicol 7:111–124
Oberdorster G, Oberdorster E, Oberdorster J (2005) Nano-
toxicity: an emerging discipline evolving from studies
J Nanopart Res
123

of ultrafine particles. Environ Health Perspect 113:823–
839
Shin WG, Pui DYH, Fissan H, Neumann S, Trampe A (2007)
Calibration and numerical simulation of Nanoparticle
Surface Area Monitor (TSI Model 3550 NSAM). J
Nanopart Res 9(1):61–69
Shosaku K (2006) Distribution of nanoparticles in the see-
through medaka. Environ Health Perspect 114(11):1697–
1702
Sinclair D, Countes RJ, Liu BYH, Pui DYH (1976) Experi-
mental verification of the theory of the diffusion battery.
J Air Pollut Control Assoc 26:661–663
J Nanopart Res
123