mongolia: 2015 article iv consultation staff report; press ... · 2015 article iv consultation...
TRANSCRIPT

© 2015 International Monetary Fund
IMF Country Report No. 15/109
MONGOLIA 2015 ARTICLE IV CONSULTATION STAFF REPORT; PRESS RELEASE; AND STATEMENT BY THE EXECUTIVE DIRECTOR FOR MONGOLIA
Under Article IV of the IMF’s Articles of Agreement, the IMF holds bilateral discussions with members, usually every year. In the context of the 2015 Article IV consultation with Mongolia, the following documents have been released and are included in this package: The Staff Report prepared by a staff team of the IMF for the Executive Board’s
consideration on April 3, 2015, following discussions that ended on February 18, 2015, with the officials of Mongolia on economic developments and policies. Based on information available at the time of these discussions, the staff report was completed on March 19, 2015.
An Informational Annex prepared by the IMF.
A Debt Sustainability Analysis prepared by the IMF and the World Bank.
A Staff Statement of April 3, 2015, updating information on recent developments.
A Press Release summarizing the views of the Executive Board as expressed during its April 3, 2015 consideration of the staff report that concluded the Article IV consultation with Mongolia.
A Statement by the Executive Director for Mongolia.
The policy of publication of staff reports and other documents allows for the deletion of market-sensitive information.
Copies of this report are available to the public from
International Monetary Fund Publication Services PO Box 92780 Washington, D.C. 20090
Telephone: (202) 623-7430 Fax: (202) 623-7201 E-mail: [email protected] Web: http://www.imf.org
Price: $18.00 per printed copy
International Monetary Fund Washington, D.C.
April 2015

MONGOLIA STAFF REPORT FOR THE 2015 ARTICLE IV CONSULTATION
KEY ISSUES Context. Medium- to long-term prospects are promising given Mongolia’s large natural resources. Nonetheless, the country currently faces serious balance-of-payments (BOP) pressures on account of low FDI and weak commodity prices, as well as overly loose macro policies.
Current Outlook. Imports have started to taper off, and, with the first phase of the Oyu Tolgoi copper and gold mine now in operation, exports have picked up. The trade balance has thus improved, but with FDI and other financial-account flows still depressed, the overall BOP remains in substantial deficit. In addition, public debt has risen sharply, and bank vulnerabilities are growing. Barring a change in policies and/or major new developments in the real economy, these trends are likely to continue.
Policies. Recognizing these challenges, the new government has already taken some action, but further policy adjustment is required to stabilize the economy, and structural measures are needed to promote investment and ensure sustained growth. In particular:
Credible fiscal consolidation, covering both the traditional budget and the Development Bank of Mongolia (DBM), is needed to reduce projected deficits, bring public debt under control, and moderate BOP pressure;
All fiscal or quasifiscal activity currently undertaken by the DBM, the Bank of Mongolia (BOM), or other agencies should be conducted on-budget by the government;
Some monetary tightening would be desirable, to moderate credit growth further and strengthen the BOP, while ensuring that banks remain adequately liquid;
Exchange rate flexibility should be preserved, as a shock absorber for the economy;
Banks’ provisions and capital buffers should be bolstered, and supervisory and crisis preparedness frameworks strengthened;
Governance reforms at the DBM and BOM would help strengthen these institutions;
Steps should be taken to move ahead with major mining projects, improve the investment climate, boost FDI, and support growth; and
Social safety nets should be strengthened and better targeted to the poor.
March 19, 2015

MONGOLIA
2 INTERNATIONAL MONETARY FUND
Approved By Markus Rodlauer and Masato Miyazaki
Discussions were held in Ulaanbaatar during September 4–17, 2014, December 11–18, 2014, and February 9–18, 2015. The staff team included K. Mathai (head), F. Mochtar, N. Saker (incoming resident representative), and J. Yu (all APD), Y. Kinoshita (non-resident representative, OAP), B. Shang (FAD), O. Croitoru Nedelescu (MCM), P. Gupta (RES), and K. Svirydzenka (SPR). Mr. Rodlauer (APD) attended some of the meetings, as did Messrs. Togmid and Yoon (OED). The team was assisted by Mmes. Ardak, Khulan, and Selenge in the local IMF office. Mmes. Choi, Meng, and Tolentino (all APD) assisted in the preparation of this report.
CONTENTS
CONTEXT _________________________________________________________________________________________ 4
RECENT DEVELOPMENTS AND OUTLOOK ______________________________________________________ 6
POLICY DISCUSSIONS ___________________________________________________________________________ 9
A. Macroeconomic Policies _________________________________________________________________________9
B. Structural Reforms and Social Policies _________________________________________________________ 12
C. Financial Sector ________________________________________________________________________________ 13
D. Other Issues ___________________________________________________________________________________ 14
STAFF APPRAISAL ______________________________________________________________________________ 14 FIGURES 1. Real Sector Developments _____________________________________________________________________ 17 2. Fiscal and Monetary Sector Developments ____________________________________________________ 18 3. External Sector Developments _________________________________________________________________ 19 4. Inclusive Growth Indicators ____________________________________________________________________ 20 5. Key Indicators in Baseline and Policy Adjustment Scenarios ___________________________________ 30 TABLES 1. Selected Economic and Financial Indicators, 2011–20 (Baseline) ______________________________ 21 2. Summary Operations of the General Government, 2011–16 (Baseline) ________________________ 22 3. Monetary Aggregates, 2011–17 (Baseline) _____________________________________________________ 23 4. Balance of Payments, 2011–20 (Baseline) ______________________________________________________ 24 5. Selected Economic and Financial Indicators, 2011–20 (Adjustment Scenario) _________________ 25 6. Summary Operations of the General Government, 2011–16 (Adjustment Scenario) ___________ 26 7. Monetary Aggregates, 2011–17 (Adjustment Scenario) _______________________________________ 27 8. Balance of Payments, 2011–20 (Adjustment Scenario) _________________________________________ 28 9. Baseline and Policy Adjustment Scenarios, 2013–20 ___________________________________________ 29

MONGOLIA
INTERNATIONAL MONETARY FUND 3
ANNEXES I. Economic Impact of Mongolia’s Natural Resource Endowments _______________________________ 31 II. External Sector and Exchange Rate Assessment _______________________________________________ 33 III. Development Bank of Mongolia ______________________________________________________________ 34 IV. Risk Assessment Matrix _______________________________________________________________________ 35 V. Implementation of Past IMF Recommendations _______________________________________________ 36 VI. Summaries of Background Analytical Work ___________________________________________________ 37 VII. Policy Agenda for Strengthening the Banking Sector _________________________________________________ 48

MONGOLIA
4 INTERNATIONAL MONETARY FUND
CONTEXT 1. Mongolia has been one of the world’s fastest growing economies as a result of large FDI in the mining sector. In 2011–12, FDI averaged 40 percent of GDP and annual growth exceeded 15 percent, and over the past decade, growth averaged 9 percent. One project alone—the Oyu Tolgoi (OT) copper and gold mine—brought more than $6 billion (50 percent of GDP) in investment during its first phase of development, with another $5 billion planned for the second phase, and ongoing negotiations over the Tavan Tolgoi (TT) coal mine could potentially yield $4 billion in investment over the next five years (see Annex I). Per capita income has reached $4,000, and with mineral wealth estimated at $1 to $3 trillion for a population of just 3 million, the future looks bright. Within 5 years, when OT-2 comes into production, Mongolia should be in a position to start running large fiscal surpluses and accumulating savings for future generations. 2. Mongolia’s narrow economic base has, however, left the country highly vulnerable to shocks. Minerals account for 90 percent of all exports, and 90 percent of these are bound for China. This lack of diversification has made the economy prone to repeated boom-bust cycles, with the balance of payments falling under intense pressure twice in the past five years, and public finances remaining vulnerable despite a fiscal framework intended to reduce procyclicality. Meanwhile, there have been symptoms of Dutch disease—the REER appreciated by nearly 30 percent from mid-2009 to mid-2013 (though this has now been reversed), and non-commodity exports have performed anemically. 3. Over the past two years, the economy has faced sharp declines in FDI and coal exports. FDI related to OT slowed as the first phase was completed and the second phase was caught up in a contentious dispute between the two main partners, Rio Tinto and the government. The dispute on the country’s premier project also cast a pall on the general investment climate, which had already suffered a blow when a moratorium on new mining exploration licenses—since reversed—was introduced in 2010. As a result, FDI fell by half in 2013, and again in 2014. Compounding this situation were China’s slowdown and weakness in the coal sector—prices are down almost two-thirds from their 2012 peak, and volumes are down 8 percent—and more recently copper prices have also fallen sharply. (These declines have been offset only partially by the decline in oil prices). 4. In response to these shocks, the authorities resorted to expansionary policies to tide the economy over until FDI and exports could recover. The fiscal expansion had already started in 2012 when the government implemented universal transfers to the population and the new Development Bank of Mongolia started to promote infrastructure development. When FDI inflows tumbled and coal prices fell in 2013, the authorities maintained expansionary fiscal policy in an effort to sustain growth as well as boost infrastructure spending to realize the country’s potential. During 2012-14, combined on- and off-budget public capital expenditure averaged nearly 15 percent of GDP, the consolidated deficit averaged nearly 10 percent, and debt surged to more than 75 percent of GDP, most of it external and

MONGOLIA
INTERNATIONAL MONETARY FUND 5
nonconcessional.1 Monetary policy was loosened substantially: the policy rate was cut by 275 basis points and easing programs amounting to 20 percent of GDP were introduced (at an average cost to banks of 4 percent while the policy rate was 10½ percent). Credit growth surged to 54 percent y/y by end-2013, keeping GDP growth above 11 percent and the current account deficit at around 25 percent of GDP, and sowing the seeds for banking asset-quality deterioration. 5. The authorities’ approach soon proved unsustainable. With FDI falling, a growing share of the current account deficit has been financed by a drawdown of reserves. From more than $4 billion (almost 6½ months of imports) in early-2013, reserves are now down to $1¼ billion (two months) even after substantial drawing from a swap line provided by the People’s Bank of China (PBOC). The currency has weakened against the U.S. dollar by almost 15 percent over the past year—and by more than 40 percent since 2013—and as a result, inflation was well into double digits during most of 2014. The credit boom has strained the financial system, with reported gross NPLs rising substantially and liquidity pressures emerging. These developments have been noted by global markets—Mongolia has suffered sovereign rating downgrades, and its spreads have widened sharply. Although growth has now slowed and the current account deficit has narrowed, the overall balance of payments remains under pressure. 6. A durable solution to Mongolia’s economic challenges requires significant macro policy adjustment. The economy is still relatively small, and one or two developments—such as new FDI or portfolio inflows sparked by agreements on OT-2 or TT, offers of substantial, new financing from donors, and/or a sharp rise in commodity prices—could materially change the outlook, at least temporarily. But such developments cannot be counted upon, and the economy would, at any rate, remain vulnerable to future shocks. Instead, the centerpiece of any strategy to close financing gaps should be macro policies that keep the current account deficit at a sustainably financeable level, and that strengthen the fiscal position. Such policies would still promise prosperity, though perhaps at a somewhat slower pace, and with reduced risks of a crisis along the way. 7. Political conditions are now more conducive to decisive economic policymaking, but they are still far from easy. Following a long period of uncertainty, a new government took office in November 2014, vowing to fix the economy, and backed by a grand coalition of the major political parties. The authorities have already taken important steps to strengthen fiscal, monetary, and other policies, but further adjustment will be needed. The new Prime Minister’s SMS-based referendum revealed public support for moving ahead with negotiations on large investment projects including OT and TT, but achieving the necessary political consensus, both for these deals and for further macro policy reforms, will remain challenging, with general elections scheduled for mid-2016. 8. Against this backdrop, the Article IV discussions focused on policies needed to stabilize the economy and achieve sustained growth over the medium- to long-term. Policy discussions centered
1 The Fiscal Stability Law, which went into effect in 2013, required that the structural on-budget fiscal deficit be kept below 2 percent of GDP, but the government created the Development Bank of Mongolia (DBM), run by a new Ministry of Economic Development, and channeled an extra 8 percent of GDP in capital spending through it.

MONGOLIA
6 INTERNATIONAL MONETARY FUND
on an adjustment scenario, with a package of economic and financial-sector measures to eliminate financing gaps and stabilize the economy and banking sector. They also covered the medium-term fiscal policy framework, policies to boost FDI and support growth, and efforts to ensure that the most vulnerable in society are protected.
RECENT DEVELOPMENTS AND OUTLOOK 9. A sharp investment slowdown has dampened economic growth. Declining FDI, continued uncertainty about OT-2, problems in the coal sector, and the contractionary impact of depreciation (see below) have weighed on growth, which slowed from 11½ percent in 2013 to 7¾ percent last year. While investment has fallen, consumption has remained robust, growing at nearly 9 percent, reflecting continued loose policies. Growth is expected to slow further, to around 4 percent during 2015-17 as OT-1 enters a relatively mineral-poor layer of earth, and then pick up sharply, particularly from 2020, when OT-2 enters production. Inflation rose substantially in 2014, given currency depreciation and policy stimulus, peaking at over 15 percent in July, and while it has since eased, it remains substantially above the target of 7 percent. 10. While the current account deficit has narrowed, the overall BOP remains weak. Exports are up, largely on account of OT-1, which began production in mid-2013. At the same time, equipment imports have decreased sharply, tracking the continued decline of FDI. Other imports, however, have been robust despite currency depreciation—mirroring the strength of consumption—and building materials are up significantly, reflecting policy stimulus to the construction sector. Although a trade surplus was registered in 2014, the overall BOP stayed in substantial deficit on account of service account outflows related to OT and weak FDI. At end-2014, gross reserves at the BOM amounted to 3¼ months of imports, equivalent to 75 percent of short-term debt, 29 percent of broad money, and 62 percent of the IMF’s risk-based metric. 11. On existing policies, Mongolia’s external finances are expected to stay under pressure (see baseline scenario in Tables 1–4). Exports will likely weaken for a few years as the OT project faces unfavorable geological conditions, and imports are expected to rise on the start of OT-2 construction. There may also be difficulties in rolling over maturing public- and private-sector debts (around $2 billion in 2017 alone, excluding the PBOC swap line which also matures that year). Given continued easy macroeconomic policies, the current account deficit should average 15 percent of GDP over the medium term, and staff analysis suggests the currency is overvalued by 10 to 15 percent (see Annex II). The overall BOP is expected to remain in substantial deficit through 2017, implying continued pressure on reserves and the exchange rate. 12. Fiscal deficits remain large. With revenues falling short of target, the on-budget structural deficit registered 4¼ percent of GDP in 2014, exceeding the 2 percent limit laid out in the Fiscal Stability Law (FSL). In addition, the DBM undertook significant spending—much of it on fiscal activities such as public infrastructure projects— outside the budget, pushing the consolidated deficit to 11 percent of GDP (see Annex III). In 2015, a supplementary budget has brought much of the DBM’s spending on budget and

MONGOLIA
INTERNATIONAL MONETARY FUND 7
targets a combined deficit of 5 percent. This, however, depends on several unrealistic assumptions, and it also excludes 2½ percent of GDP in so-called “commercial” DBM spending which should also be considered fiscal.2 All told, the overall deficit is expected to approach 10 percent of GDP, only slightly down from 2014. The authorities are considering additional expenditure cuts on the order of 5 percent of GDP, and, if successful, these would move the fiscal accounts toward staff’s “adjustment scenario” (see below). 13. Public debt has risen sharply and is now extremely high. On the authorities’ definition—i.e., in NPV terms, and excluding the PBOC swap drawings—debt amounted to 55 percent of GDP at end-2014, in excess of the FSL’s 40 percent limit. Subsequent FSL amendments laid out a path to return to the 40 percent debt limit by 2018 (and to the 2 percent deficit limit as well), while the recent Debt Management Law departed from international best practice by redefining debt to exclude state enterprise debt and certain government guarantees. On staff’s definition—in nominal terms, and including the PBOC swap—public debt reached 76½ percent of GDP last year (for the entire public sector, including state enterprises) and, given ongoing deficits, is expected to peak at 92½ percent of GDP in 2017, before declining rapidly as mining growth picks up.3 As detailed in the accompanying DSA, the key debt indicators exceed the relevant thresholds for a few years, and Mongolia is thus assessed to be at high risk of debt distress. At the same time, debt is not on an ever-increasing path, and it is relatively small compared to the country’s resource wealth, if the latter can be realized.4 14. Monetary conditions have tightened but are still too loose. Over the past year, the BOM has hiked the policy rate by 250 basis points, to 13 percent, which is within the range suggested by a Taylor-rule analysis and substantially positive in real terms.5 Reserve money growth has been close to zero, reflecting the decline in NFA. Structural liquidity in the banking system—excess reserves on MNT deposits plus amounts mopped up on a short-term basis—is tight. Credit growth, including securitized mortgages, has slowed substantially (though it was still high at 23 percent y/y at end-2014). And the exchange rate has continued to weaken, which is likely to be contractionary in an economy so dependent on imported inputs, and where the export sector is largely dollarized. Still, growth of NDA on the BOM’s balance sheet has been substantial, on account of increasing net credit to government as well as unconventional easing programs, and with inflation and the BOP both remaining under pressure, further tightening is needed.
2 Project and borrower selection criteria are difficult for staff to evaluate, and given the DBM’s track record, a cautious approach is desirable. Moreover, standard statistical principles do not allow for a portion of an agency’s spending to be carved out and treated differently. 3 Even without OT-2—and thus with lower growth—debt would be on a declining path from 2018, as shown in an alternate scenario in the accompanying DSA. 4 Mineral wealth—most of which, of course, has not been converted to financial wealth—has been estimated at up to $3 trillion, which would be nearly 150 times Mongolia’s total external debt and more than 300 times its gross public debt. 5 Because of the weakness of monetary transmission through the interest-rate channel, care should be taken in interpreting a Taylor rule for Mongolia.

MONGOLIA
8 INTERNATIONAL MONETARY FUND
15. As the economy has cooled, banking-system vulnerabilities have become apparent. Banks’ balance sheets have doubled in just two years, driven by the BOM’s large stimulus programs,6 while foreign currency lending was substantial (a quarter of the banks’ loans). On the back of weak underwriting standards, credit risks increased significantly. In 2014 nonperforming loans (NPLs) as well as loans past-due by less than 90 days were up by 48 percent and 131 percent y/y, respectively. Although the reported NPL ratio remains low at 3.1 percent, asset quality problems seem to be understated especially given the inadequate classification of loan restructurings at some banks. The real estate market is cooling, further increasing credit risk, and, as noted above, liquidity is becoming tight. Stress tests suggest that some banks are vulnerable to economic shocks and that capital buffers should be strengthened in recognition of the balance-sheet deterioration that has already occurred as well as possible future deterioration given the risky environment. 16. Risks are to the downside. Elevated BOP pressure constitutes a major threat to economic stability. Prolonged delay of OT-2 could further undermine business confidence, slow growth, and worsen both external and fiscal indicators. Banking-sector conditions could worsen. Externally, a further slowdown in China could reduce Mongolia’s export demand, and surges in global volatility could also affect Mongolia’s ability to borrow externally (see Annex IV). Authorities’ Views
17. The authorities agreed that the economy had gone through a difficult period because of severe BOP shocks and argued that the policy response had stabilized the situation. Some interlocutors argued that Mongolia had faced massive external shocks that could have led to a BOP crisis, a credit crunch, and economic contraction. These dire outcomes, however, were avoided on account of the countercyclical policy response, which helped the economy to achieve a “soft landing.” 18. As for the outlook, the authorities had a more benign view than staff. While the baseline scenario was developed jointly by the IMF team and the technical staff of the MOF and BOM, the authorities expected that their policy responses (see below) would be sufficient to turn the situation around, combined with other options for managing BOP pressure, including additional borrowing from the international market as well as donors. Finally, they noted that about 50 percent of DBM spending, which includes the projects with government guarantees, was included in the budget and opined that DBM commercial spending should not be included.
6 The loans under the BOM easing programs were exempted from capital charges (zero-risk weighted) and from limits on large exposures and industry concentrations.

MONGOLIA
INTERNATIONAL MONETARY FUND 9
POLICY DISCUSSIONS A. Macroeconomic Policies
19. Comprehensive policy adjustment is urgently required to address external and fiscal imbalances and stabilize the economy. Public debt is too high and inflation above target, but the most pressing concern is the severe BOP pressure that the country continues to face. Fiscal and monetary tightening, along with exchange-rate flexibility, is needed. Much the same advice was offered during the 2013 Article IV consultation, with limited takeup (see Annex V). Policies on investment, social protection, and banking also need to be strengthened.
Summary of Key Policy Recommendations
Budget / DBM Cut consolidated deficit to 4½ percent of GDP in 2015 and to around 2 percent by 2017. Consolidate all DBM spending into budget and strengthen DBM governance.
Monetary Slow credit growth. Transfer unconventional easing programs to budget. Limit deficit monetization. Strengthen BOM governance.
Exchange Rate Keep XR flexible. Limit intervention to combating excessive volatility.
Investment Implement structural measures to boost investment. Improve investment climate. Move ahead with major mining projects.
Social Protection
Ensure protection of most vulnerable in society, including through enhanced income-targeting of subsidies.
Banking Enhance provisions and capital. Strengthen supervisory framework. Phase out forbearance.
20. The authorities have taken policy steps in the right direction, but further measures are needed:
2015 Supplementary Budget. Facing likely revenue shortfalls, the authorities revised down the revenue target and correspondingly cut expenditure in a 2015 supplementary budget, passed in January. Non-commercial spending of DBM was brought on budget, and the consolidated deficit targeted at 5 percent of GDP. This target, however, will be difficult to reach as revenues are still over-estimated.
Amendments to Fiscal Stability Law. Recognizing that public debt had exceeded the ceiling enshrined in the Fiscal Stability Law (FSL), the authorities in February 2015 amended the FSL and enacted a new Debt Management Law (DML) that narrowed the coverage of debt as previously defined in the FSL. The new legal framework also raised the debt ceiling and set a path to bring debt (albeit more narrowly defined) and the fiscal deficit down to the previous limits by 2018 (which will be hard to achieve on current policies).7
7 To be precise, the FSL amendments and new DML implement the following: (1) non-commercial DBM spending is brought onto the budget and thus included in the calculation of the structural fiscal deficit; (2) structural fiscal deficit limits are temporarily raised (5 percent of GDP in 2015, 4 percent of GDP in 2016, and 3 percent of GDP in 2017) but kept at 2 percent of GDP for 2018 and beyond; (3) the definition of debt is narrowed from public to general government debt (with the new definition, SOE debt and government guarantees that are fully secured by government securities are excluded); and (4) debt limits are temporarily raised (58.3 percent in 2015, 55 percent in 2016 and 50 percent in 2017) but remain at 40 percent for 2018 and beyond.

MONGOLIA
10 INTERNATIONAL MONETARY FUND
CMAP. Parliament on February 18, 2015 approved a “Comprehensive Macro Adjustment Plan” (CMAP), which comprises macro-financial adjustment and structural policies. CMAP retains the target fiscal path in the supplementary budget. It envisages phasing out the BOM’s Price Stabilization Program (PSP) and transferring remaining PSP loans to the government. The CMAP does not, however, comprehensively transfer all of the BOM’s easing programs—including funding for new mortgages and financial support at the request of commercial banks for their corporate clients—to the budget. On the structural front, CMAP calls for steps to strengthen social welfare, enhance the investment climate, facilitate FDI inflows, promote exports, and encourage import substitution.
21. Staff recommended a stronger package of macro policy measures, as follows:8
Fiscal policy:
A new budget amendment for 2015 would be needed to bring the consolidated deficit (including all DBM spending) down to around 4½ percent of GDP this year. The deficit would continue to fall until reaching around 2 percent in 2017, and it would be possible to move toward fiscal surpluses a few years after that. (Staff analysis does not find grounds for loosening the long-term deficit target specified in the FSL (see Annex VI), nor do staff support the redefinition of debt in the DML.)
Within the overall budget envelope, total spending by the DBM (commercial and non-commercial) would be limited to around 2½ percent of GDP in 2015 and would decline thereafter. Furthermore, authority over the budget and the DBM—including its “commercial” spending—would be unified in the Ministry of Finance, and reporting would be consolidated. Reforms to strengthen governance of the DBM could also be enacted.
Capital expenditures are very high in international comparison, and while part of this is explained by existing infrastructure deficiencies and the country’s low population density, substantial cuts nonetheless appear to be possible; moreover, given the openness of the economy, the associated fiscal multipliers are likely to be small.
At the same time, there is scope to cut current expenditure and raise revenue: large, untargeted subsidies should be phased out in favor of programs (like food stamps) that more directly reach the poor. Moreover, recent growth in the public wage bill could be addressed and procurement inefficiencies reduced. Some social benefits could be made taxable and customs duties increased.
Going forward, a new budget law amendment could be considered to restrain Parliament’s ability to increase the aggregate budget envelope.
Monetary policy. The stance should be tightened without delay, including by restricting deficit monetization, and credit growth should be further slowed, following the harmful credit boom in recent years (see Annex VI). The BOM’s unconventional programs (PSP,
8 The scenario also assumes that banking, structural, and social protection reforms are also undertaken—see below.
MONGOLIA
INTERNATIONAL MONETARY FUND 11
mortgages, and financial support at the request of commercial banks for their corporate clients) should be transferred to the budget, where—in a transparent manner and with Parliamentary oversight—they can compete with other spending priorities for limited resources. The nature of BOM operations should change—unconventional easing programs targeting particular industries or providing financial support at the request of commercial banks for their corporate clients should be ruled out, while open market operations may need to be enhanced to ensure sufficient liquidity in the banking system. Further BOM governance reforms should also be considered, such as giving Monetary Policy Committee members a vote on BOM decisions.
Exchange rate flexibility. The BOM would limit its involvement in FX markets to preventing excessive market volatility, and as a result, the exchange rate would move more flexibly. The strategy is to contain further sharp depreciation through adequate macro policies, and to limit intervention to addressing excessive volatility.
22. These policy efforts would help stabilize the economy, but reserve buffers would remain thin, suggesting the need for additional financing. As shown in Tables 5-9 and Figure 5, growth in this adjustment scenario would slow somewhat in 2015 given the policy tightening, and inflation would rise by a moderate amount for several years, given exchange-rate pass-through. The fiscal adjustment would also put public debt on a more sustainable path. Imports would moderate, and strengthened policies would support market confidence and facilitate rollovers of several large bonds maturing in 2015 and 2017 (a total exceeding $2 billion).9 As a result, foreign-exchange reserves would stabilize at around 1¾ months of imports for several years (before rising in 2019–20). This is substantially stronger than in the baseline but still lower than desirable, suggesting the need for additional financing in support of the adjustment effort.
23. Looking ahead, prudent macroeconomic management must be maintained to ensure that resource wealth can be harnessed effectively. Many resource-rich countries have failed to realize the promise of prosperity. Avoiding procyclical fiscal policy, saving resource revenues and investing them wisely, ensuring cautious monetary policy, and maintaining a competitive exchange rate to avoid the effects of Dutch Disease, are all essential components.10 Mongolia has a relatively large resource endowment compared to some other resource-rich economies, and managing that wealth wisely is of critical importance.
Authorities’ Views
24. The authorities saw the benefits of additional fiscal adjustment. They agreed that the fiscal path in the supplementary budget and CMAP faced risks and that further measures were thus needed. They expressed their intention to cut budget spending further via a government resolution, supported by another supplementary budget later in the year, and to reduce DBM spending as well, with total cuts amounting to around 5 percent of GDP. They also saw an important role for additional financing to bridge short-term BOP difficulties. 9 The current account deficit narrows in dollar terms relative to the baseline scenario; but since the adjustment lowers GDP, the CAD in percent of GDP rises. Also, the CAD still worsens for a few years within the adjustment scenario, on account of OT’s geological conditions and the start of OT-2 construction. 10 For further background, see IMF Departmental Paper No. 13/2 (August 28, 2013), “Boom, Bust, or Prosperity? Managing Sub-Saharan Africa’s Natural Resources Wealth.”
MONGOLIA
12 INTERNATIONAL MONETARY FUND
25. The authorities broadly shared staff’s views on monetary policy going forward. The BOM noted that they had intentionally been phasing out their unconventional programs, and the government also expressed its agreement with this objective. The BOM envisaged transferring the outstanding program loans to the government by end-June. They noted that the Price Stabilization Program had basically achieved its goals, as supply-driven inflation had continuously been low and stable over the past 26 months, and the economy had achieved a soft landing. They continued to see the mortgage program as highly beneficial, noting that it aimed to make households’ expenditures more efficient and to boost middle-class savings. They believed that this program should be continued as part of the government’s long-term saving policy, in conjunction with ongoing structural reforms of the pension fund. Finally, they suggested that it would be more appropriate to consider changes to the central bank law only after economic conditions had improved. On exchange rate policy, they noted that they are fully committed to the flexible exchange rate regime.
B. Structural Reforms and Social Policies
26. Structural measures are needed to boost investment and growth, and an enhanced effort is needed to protect the poor. To return the economy to a sustainable, rapid growth path, a focused effort is needed to improve the investment climate, which was harmed by previous policy changes, boost FDI, and move ahead with large mining projects. Many of these are included in the authorities’ CMAP. Given resource constraints, subsidy programs should be targeted better to protect the poorest and most vulnerable in society. 27. The authorities are redoubling efforts to boost investment. The CMAP, now approved by Parliament, includes reaching agreement on OT and TT as key goals, and a former prime minister has been appointed minister in charge of “mega projects,” charged with moving those negotiations forward. The government has also proposed a host of measures—under the CMAP and through other initiatives—to increase investment, boost exports, and support appropriate import substitution. Finally, the tax law is being amended to improve clarity and avoid conflicts in the judicial system with foreign investors. 28. Special efforts must be made to ensure that the most vulnerable in society are adequately protected. Compared to other similarly placed countries, Mongolia has a large budget for subsidies and transfers, amounting to some 8 percent of GDP. Most of these are targeted to different categories of the population—mothers, children, the elderly, the disabled, et al.—without regard to income. Economic adjustment policies, while necessary for medium-term growth and stability, will create short-term dislocations, and it is vital that policies be designed to protect the poor. In the short-term, the income-targeted food stamp program could be expanded, and looking forward, the proxy means-tested subsidy programs currently under design should be implemented expeditiously. The World Bank has done significant work in this area (see Informational Annex), and there exists sufficient technical capacity to improve targeting.

MONGOLIA
INTERNATIONAL MONETARY FUND 13
Authorities’ Views
29. The authorities noted that, as a policy matter, income targeting of subsidies is controversial in Mongolia. They had proposed this in the first supplementary budget for 2015, but Parliament rejected many of the relevant measures. Cultural values prioritize children and the elderly, regardless of income level. That said, they firmly agreed on the need to protect the poorest, which may require difficult choices given hard budget constraints.
C. Financial Sector
30. A comprehensive approach to addressing problems in the banking system is needed to contain systemic risks. The BOM has taken some good steps, but more needs to be done (and the IMF stands ready to support the authorities with further TA, as needed). Risk weights for unhedged FX loans were increased in August 2014, and the 1-percent general provision for performing loans was restored, though only for new loans. Nevertheless, loan classification is heavily reliant on days overdue rather than on more qualitative assessments of borrowers’ creditworthiness and future cash flows, while the prudential treatment of restructured loans is weak. The banking system has already seen balance-sheet deterioration, and it remains vulnerable to a further deterioration of economic conditions and the crystallization of hidden losses.
31. As a priority, provisioning and capital buffers need to be reinforced (see Annex VII for a detailed list of banking-sector recommendations). The level of provisions (70 percent of NPLs) appears to be low given the likely understatement of NPLs, the inadequate treatment of loan restructuring, the uncertain value of recoveries (certain Civil Code provisions make foreclosures difficult, and there is significant uncertainty regarding the valuation of collateral, and the cooling of the real estate market. Thus, current capital levels (e.g., a system-wide Tier 1 ratio of 12.5 percent) are likely overstated. The BOM should take immediate measures to increase provisions and capital across the banking system, and particularly for the most vulnerable banks. This could usefully be informed by an independent asset quality review of the major banks.
32. The BOM should eliminate forbearance and strengthen risk recognition. Asset-classification and provisioning regulations should be enhanced by introducing a stricter treatment and regular reporting of restructured loans. The rules should also be changed to embed more qualitative and forward-looking assessments of the borrower’s condition, including hedging capacity against foreign-exchange risk. The 1-percent general provision should apply to the entire stock of performing loans, and the BOM should discontinue forbearance vis-à-vis loans made under the Price Stabilization Program (PSP). Capital requirements for systemically important banks should be raised—the Tier 1 ratio should be increased to 10.5 percent—and targeted additional capital requirements should be imposed on banks that have large concentrations (loan, deposit, and foreign exchange). The BOM should move quickly to resolve non-viable banks, if needed.

MONGOLIA
14 INTERNATIONAL MONETARY FUND
33. The supervisory and the crisis preparedness frameworks need to be strengthened. Legislative changes are needed to secure for the BOM flexible powers for early intervention. Current supervisory assessments (CAMELS) should be turned into robust and forward-looking tools for early identification of risks and prompt corrective action. Finally, the Supervisory Committee should be empowered as the key decision maker. Cooperation on financial stability and crisis preparedness matters should be strengthened via the Financial Stability Council, which should be expanded to include the Deposit Insurance Corporation. The legal framework should prevent the reversal of resolution actions and provide early and flexible intervention triggers as well as better safeguards against misuse of public funding. Emergency liquidity assistance should be provided only to solvent and viable banks, and should be priced at penalty rates. 34. AML/CFT. In 2011, the Financial Action Task Force (FATF) designated Mongolia as a jurisdiction not making sufficient progress in implementing the agreed action plan to enhance its Anti-Money-Laundering / Countering the Financing of Terrorism (AML/CFT) framework. Since then, with the support of ongoing IMF TA, Mongolia has strengthened its framework considerably, and it is no longer subject to the FATF’s on-going global AML/CFT compliance process. Authorities’ Views
35. The authorities welcomed staff’s suggestions on strengthening the banking system. They considered that the recent tightening of policies, including in the area of prudential regulations, would help contain the risks in the banking system. Looking ahead, the BOM agreed that further policy attention should be devoted to monitoring and pre-emptively responding to potential risks in the banking sector, and welcomed the recommendations of the recent Fund TA mission, which could be integrated into the Medium Term Supervisory Strategy.
D. Other Issues
36. Article VIII. There are two previously identified multiple currency practices, relating to the BOM’s calculation and use of reference exchange rates. No action is planned.
STAFF APPRAISAL 37. Mongolia has a bright future, but the next few years will be challenging. If managed prudently, the country’s massive resource wealth could spell prosperity for all Mongolians, nearly one-third of whom still live below the poverty line. These are not just fond hopes for a distant future; it could be as early as 2020 that OT-2’s exports begin, boosting GDP dramatically and generating fiscal revenues to transform the economy, improve living standards, and build up an endowment for future generations. In light of its resource wealth, and assuming this can continue gradually to be realized, Mongolia is projected to be solvent given the strong projected revenues from mining over the long term. The country does, however, face serious liquidity pressures and

MONGOLIA
INTERNATIONAL MONETARY FUND 15
risks in the short run, before mining inflows ramp up. Until then, financing outsized prospective fiscal and BOP deficits will be difficult. 38. Loose macro policies have helped create the difficulties the economy faces today. Mongolia’s present problems were driven in large part by major external shocks, to FDI and to coal exports. But policy errors also contributed. Policies were loosened first to share the benefits of prospective mineral wealth broadly, and then to buffer the economy from shocks. This succeeded—for a while—in maintaining high growth, but at the cost of exacerbating economic and financial vulnerabilities. Fiscal discipline was undermined by large off-budget spending, and monetary policy was eased dramatically. This stimulus fueled inflation, compounded BOP pressure, laid the seeds for asset-quality problems in the banking system, and generally undermined confidence at home and abroad. 39. Policy adjustment is needed to provide a sustainable solution to Mongolia’s economic challenges. Macro policies need to be tightened to keep current account deficits at more manageable levels and to improve the fiscal position. If additional external financing can be marshaled in support of such policies, the adjustment will be less disruptive. At the same time, measures are needed to strengthen the banking system, and it is vital that steps be taken to improve the targeting of subsidies and thus ensure protection of the most vulnerable in society. 40. The authorities have already taken a number of steps to strengthen the economy. Part of DBM’s spending has been brought on budget, and the consolidated fiscal deficit is expected to decline this year. A government resolution to cut spending administratively is envisaged, to be backed up by a second supplementary budget later in the year. The BOM has hiked the policy rate twice, slowed the pace of PSP and mortgage lending, and proposed transferring the existing stock of program loans to the government’s balance sheet. The authorities have redoubled efforts to reach agreement with investors on large projects and introduced other structural measures to boost exports and reduce imports. Steps have been taken to strengthen the banks and to improve bank supervision and crisis preparedness. 41. More, however, is needed:
The fiscal path needs to be secured with Parliamentary approval for measures to control
spending, both on-budget and off, as part of a coherent, medium-term macro framework.
The BOM should cease unconventional easing programs targeting particular industries or providing financial support at the request of commercial banks for their corporate clients, and should instead return to traditional central-banking functions; these programs should, if desired, by conducted by the government, competing with other spending priorities for funds within the budget.
The monetary stance should be tightened further, to control credit growth and support the BOP.

MONGOLIA
16 INTERNATIONAL MONETARY FUND
Foreign-exchange intervention should be limited to dealing with episodes of excessive volatility, and the exchange rate should be allowed to move flexibly.
Banks’ provisions and capital buffers should be bolstered, informed by an independent asset-quality review, and supervisory and crisis-preparedness frameworks enhanced.
DBM and BOM governance should be strengthened.
The investment climate should be enhanced, and progress made on mega-mining projects, so as to boost FDI.
Especially important, social safety nets should be strengthened and better targeted.
42. With a comprehensive adjustment strategy in place, Mongolia will be well placed to realize its economic potential. Today’s challenges are serious but surmountable, and the country’s medium-term prospects remain strong. With prudent management, Mongolia should be able to raise adequate external financing in support of its adjustment policies and build reserve buffers, while safeguarding external and public debt sustainability.
43. It is recommended that the next Article IV consultation take place on the standard 12-month cycle.

MONGOLIA
INTERNATIONAL MONETARY FUND 17
0
5
10
15
20
25
30
35
Jan-
12
Mar
-12
May
-12
Jul-
12
Sep-
12
Nov
-12
Jan-
13
Mar
-13
May
-13
Jul-
13
Sep-
13
Nov
-13
Jan-
14
Mar
-14
May
-14
Jul-
14
Sep-
14
Nov
-14
Jan-
15
Non-food items (contribution to headline CPI)Food items (contribution to headline CPI)Headline CPI (y/y)Non-food CPI (y/y)Food CPI (y/y)
Sources: Mongolian authorities; and IMF staff estimates.
Consumer Price Inflation (In percent, Jan. 2012-Jan. 2015)
0
100
200
300
400
500
600
700
800
Jan-
12
Apr
-12
Jul-
12
Oct
-12
Jan-
13
Apr
-13
Jul-
13
Oct
-13
Jan-
14
Apr
-14
Jul-
14
Oct
-14
Jan-
15
Mongolia Sri Lanka Vietnam Emerging mkts. (EMEs)
Source: Bloomberg LP.
JP Morgan EMBI Global Sovereign Spreads(in basis points, January 1, 2012-March 13, 2015)
0
20
40
60
80
100
120
140
160
Jan-
12
Apr
-12
Jul-1
2
Oct
-12
Jan-
13
Apr
-13
Jul-1
3
Oct
-13
Jan-
14
Apr
-14
Jul-1
4
Oct
-14
Jan-
15
Mong. Mining Corp. (MMC, in HK) South Gobi (in HK)Turquoise Hill (TRQ, in Toronto)MSE top 20 indexRio Tinto (London)
Sources: Bloomberg LP.; and IMF staff estimates.
Stock Prices for Mining Companies(Index, January 1, 2012=100, Jan. 1, 2012- Mar 13, 2015)
Figure 1. Real Sector Developments
Dragged by weak investment, growth has dipped to single
digits.
Current-account narrowing has, until very recently, been
more than offset by financial account deterioration…
...leading to a sharp drop of foreign exchange reserves and
depreciation…
…which in turn has kept inflation at double digits until
recently.
Market sentiment has deteriorated, with sovereign spreads
rising…
…and the stock prices of three mining companies listed
abroad have slumped.
-30-25-20-15-10-505
10152025303540
2012
Q1
2012
Q2
2012
Q3
2012
Q4
2013
Q1
2013
Q2
2013
Q3
2013
Q4
2014
Q1
2014
Q2
2014
Q3
2014
Q4
Consumption Investment Net Exports GDP
Source: Mongolian authorities.
Real GDP Growth(Contribution and year-on-year percentage change, 2012Q1-2014Q4)
-1500
-1000
-500
0
500
1000
1500
2000
2500
2012
Q1
2012
Q2
2012
Q3
2012
Q4
2013
Q1
2013
Q2
2013
Q3
2013
Q4
2014
Q1
2014
Q2
2014
Q3
2014
Q4
Current Account Balance
Capital and Financial Account Balance
Overall Balance
Current and Capital Accounts(In million US$)
Source: Mongolian authorities.
1,300
1,400
1,500
1,600
1,700
1,800
1,900
2,000
2,100
2,200
2,3000
1000
2000
3000
4000
5000
6000
Jan-
12M
ar-1
2
May
-12
Jul-
12
Sep-
12
Nov
-12
Jan-
13M
ar-1
3
May
-13
Jul-
13
Sep-
13
Nov
-13
Jan-
14M
ar-1
4
May
-14
Jul-
14
Sep-
14
Nov
-14
Jan-
15
Total Intervention Sales (in US$m)
MNT/US$ - exchange rate (RHS, inverted scale)
Source: Mongolian authorities.
BOM FX Intervention and Exchange Rate(Janaury 2, 2012-February 26, 2015)

MONGOLIA
18 INTERNATIONAL MONETARY FUND
Figure 2. Fiscal and Monetary Sector Developments
The consolidated deficit has remained large… …and debt levels have reached a record high.
Reserve money growth has slowed owing to FX reserve loss. The BOM has unwound some of its monetary easing, and
credit growth has slowed.
The policy rate is now in line with the range suggested by a
Taylor-rule analysis. Nonperforming loans have risen significantly.
-60
-40
-20
0
20
40
60
80
100
-160
-110
-60
-10
40
90
140
190
240
Jan-
12
Apr-
12
Jul-1
2
Oct
-12
Jan-
13
Apr-
13
Jul-1
3
Oct
-13
Jan-
14
Apr-
14
Jul-1
4
Oct
-14
NFA Contribution to Reserve Money GrowthNDA Contribution to Reserve Money GrowthReserve Money Growth (y/y, RHS)
Reserve Money Growth and Contribution(Jan. 2012- Dec. 2014)
Sources: Mongolian authorities; and IMF staff estimates.
0
10
20
30
40
50
60
70
80
90
2010 2011 2012 2013 2014
External Debt Domestic Debt
External and Domestic Debt 1/ (In percent of GDP)
Sources: Mongolian authorities; and IMF staff estimates.1/ Debt coverage expanded from 2013 onward.
1.8
2.2
2.6
3.0
3.4
3.8
10
15
20
25
30
35
Jan-
12
Mar
-12
May
-12
Jul-1
2
Sep-
12
Nov
-12
Jan-
13
Mar
-13
Ma y
-13
Jul-1
3
Sep-
13
Nov
-13
Jan-
14
Mar
-14
Ma y
-14
Jul-1
4
Sep-
14
Nov
-14
Jan-
15
Bank capital to risk-weighted assetsTotal liquid assets to total assetNonperforming loans to total loans (New Definition-RHS)
Bank Capitalization, Asset Quality and Liquidity (In percent, Jan. 2012-Jan. 2015)
Sources: Mongolian authorities; and IMF staff estimates. Caution is needed in interpreting FSI indicators given pervasive forbearance and rapid credit growth.
0
2
4
6
8
10
12
14
16
2012
Q1
2012
Q2
2012
Q3
2012
Q4
2013
Q1
2013
Q2
2013
Q3
2013
Q4
2014
Q1
2014
Q2
2014
Q3
2014
Q4
2015
Q1
Actual Policy Rate (average) Implied Policy Rate PSP, BOM Deposit and Mortgage (weighted average)
Actual and Implied Policy Rate(In percent)
Sources: Mongolian authorities; and IMF staff estimates.
0
10
20
30
40
50
60
70
0
500
1000
1500
2000
2500
3000
3500
4000
2012
M11
2013
M1
2013
M3
2013
M5
2013
M7
2013
M9
2013
M11
2014
M1
2014
M3
2014
M5
2014
M7
2014
M9
2014
M11
Total PSP Deposit placed at banks
Mortgage loan Credit growth (in percent) (RHS)
Credit Growth, PSP, Mortgage, and Deposit(Billion togrogs; in percent)
Source: Mongolian authorities.
-15
-10
-5
0
5
10
2010 2011 2012 2013 2014
On budget balance Off budget balance (DBM)
Mongolia: Fiscal Balance(in percent of GDP)
Sources: Mongolian authorities; and IMF staff estimates.

MONGOLIA
INTERNATIONAL MONETARY FUND 19
-400
-200
0
200
400
600
800
1000
1200
140020
12Q
1
2012
Q2
2012
Q3
2012
Q4
2013
Q1
2013
Q2
2013
Q3
2013
Q4
2014
Q1
2014
Q2
2014
Q3
2014
Q4
Foreign Direct Investment(In millions of U.S. dollars, 2012Q1 -2014Q4)
Source: Mongolian authorities.
Figure 3. External Sector Developments
The current account balance has improved on an improved
trade balance.
Copper exports have more than doubled thanks to OT-1’s
production…
….while imports have declined on slowing investment. FDI has dropped sharply…
…and there have been large financial outflows. The REER appreciated strongly in the past few months, and
EBA-lite analysis suggests the currency remains overvalued.
-1000
-800
-600
-400
-200
0
200
2012
Q1
2012
Q2
2012
Q3
2012
Q4
2013
Q1
2013
Q2
2013
Q3
2013
Q4
2014
Q1
2014
Q2
2014
Q3
2014
Q4
Trade credits Loans Currency and deposits
Financial Outflows (In millions of USD)
Source: Mongolian authorities.
0
1,000
2,000
3,000
4,000
5,000
6,000
7,000
2010
2011
2012
2013
2014
Copper concentrate Coal Iron ore
Non-monetary gold Crude petroleum oils Cashmere, washedExports, f.o.b.
Proj
Exports(USD million)
Sources: Mongolian authorities; and IMF staff estimates.
-1500
-1000
-500
0
500
1000
2012
Q1
2012
Q2
2012
Q3
2012
Q4
2013
Q1
2013
Q2
2013
Q3
2013
Q4
2014
Q1
2014
Q2
2014
Q3
2014
Q4
Trade Services Income Transfer
Current Account Balance (In millions of USD)
Source: Mongolian autorities.
60
70
80
90
100
110
120
130
140
Jan-
12
Apr
-12
Jul-
12
Oct
-12
Jan-
13
Apr
-13
Jul-
13
Oct
-13
Jan-
14
Apr
-14
Jul-
14
Oct
-14
NEERREERREER (10 year average)Bilateral exchange rate against USD
Sources: Mongolian authorities; and IMF staff estimates.
Exchange Rates of the Togrog(Index, 2010=100, Jan. 2012-Jan. 2015; an increase is an appreciation)
0
1,000
2,000
3,000
4,000
5,000
6,000
7,000
8,000
2010
2011
2012
2013
2014
Consumer goods Intermediate goods Capital goodsFuel Other imports
Imports(cif, USD million)
Sources: Mongolian authorities; and IMF staff estimates.

MONGOLIA
20 INTERNATIONAL MONETARY FUND
-12 -10 -8 -6 -4 -2 0 2 4 6
-12 -10 -8 -6 -4 -2 0 2 4 6
Lao P.D.R. (2002-2008)Mongolia (2002-2008)
India (2005-2010)Pakistan (2002-2008)
Bangladesh (2000-2010)Vietnam (2002-2008)
Chile (2003-2009)Sri Lanka (2002-2010)
Cambodia (2004-2009)Kazachstan (2002-2009)
Peru (2002-2010)Nepal (2003-2010)
Source: World Development Indicators.
Change in Gini Index(in Gini points)
-8 -6 -4 -2 0 2
Pakistan
China
Chile
Mongolia
Colombia
Peru
Thailand
Sri Lanka
Vietnam
Source: IMF, WEO database
Change in Unemployment Rate, Average of 2007‒14 (In percent)
-10
0
10
20
30
40
50
60
70
Mya
nmar
Mon
golia
Sri L
anka
Paki
stan
Viet
nam
Indi
a
Bang
lade
sh
Cam
bodi
a
Peru
Chile
Change in Inflation, Average 1995-2014(In percent)
Source: IMF, WEO database.
Highest
0.00.10.20.30.40.50.60.70.80.9
Chile
Kaza
khst
an
Peru
Sri L
anka
Mon
golia
Indi
a
Lao
P.D.R
.
Cam
bodi
a
Paki
stan
Bang
lade
sh
Mya
nmar
Nep
al
HDI, 2011 Average HDI (1990-2014)
Source: Human Development Report 2014 (UNDP).
Human Development Index (HDI)
173
148
111
102
99
90
78
77
72
41
0 50 100 150
Bangladesh
Lao PDR
Zambia
Kyrgyz Republic
Sri Lanka
China
Vietnam
Kazakhstan
Mongolia
Chile
Doing Business Index (Ranking in 189 countries, higher rank = better environemnt)
Source: World Bank/IFC Doing Business Database, 2015 Report.
Figure 4. Inclusive Growth Indicators
Poverty remains widespread but has continued to decline… …as has unemployment.
Inequality, however, has been on the rise… …and inflation volatility is high, hurting the poor.
Mongolia scores relatively well in terms of human
development…
…and it has a reasonably attractive business environment.
MONGOLIA
INTERNATIONAL MONETARY FUND 21
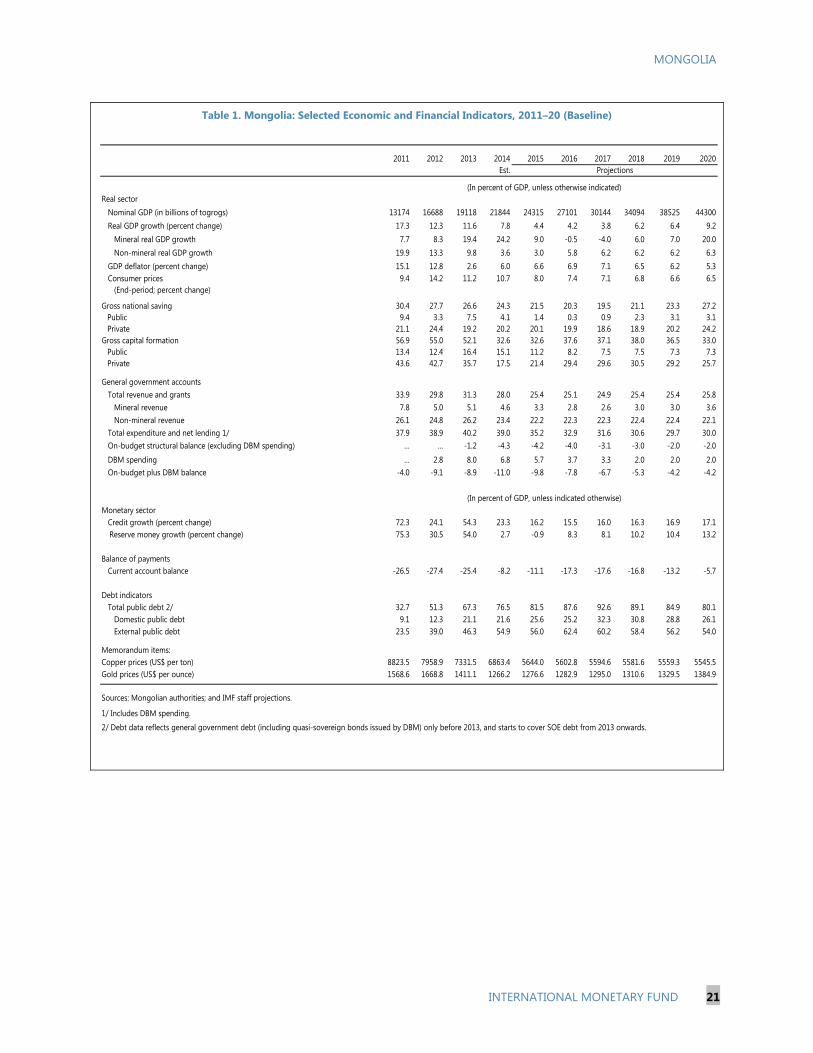
Table 1. Mongolia: Selected Economic and Financial Indicators, 2011–20 (Baseline)
2011 2012 2013 2014 2015 2016 2017 2018 2019 2020Est.
Real sector Nominal GDP (in billions of togrogs) 13174 16688 19118 21844 24315 27101 30144 34094 38525 44300 Real GDP growth (percent change) 17.3 12.3 11.6 7.8 4.4 4.2 3.8 6.2 6.4 9.2 Mineral real GDP growth 7.7 8.3 19.4 24.2 9.0 -0.5 -4.0 6.0 7.0 20.0 Non-mineral real GDP growth 19.9 13.3 9.8 3.6 3.0 5.8 6.2 6.2 6.2 6.3 GDP deflator (percent change) 15.1 12.8 2.6 6.0 6.6 6.9 7.1 6.5 6.2 5.3
Consumer prices 9.4 14.2 11.2 10.7 8.0 7.4 7.1 6.8 6.6 6.5 (End-period; percent change)
Gross national saving 30.4 27.7 26.6 24.3 21.5 20.3 19.5 21.1 23.3 27.2Public 9.4 3.3 7.5 4.1 1.4 0.3 0.9 2.3 3.1 3.1Private 21.1 24.4 19.2 20.2 20.1 19.9 18.6 18.9 20.2 24.2
Gross capital formation 56.9 55.0 52.1 32.6 32.6 37.6 37.1 38.0 36.5 33.0Public 13.4 12.4 16.4 15.1 11.2 8.2 7.5 7.5 7.3 7.3Private 43.6 42.7 35.7 17.5 21.4 29.4 29.6 30.5 29.2 25.7
General government accounts Total revenue and grants 33.9 29.8 31.3 28.0 25.4 25.1 24.9 25.4 25.4 25.8 Mineral revenue 7.8 5.0 5.1 4.6 3.3 2.8 2.6 3.0 3.0 3.6 Non-mineral revenue 26.1 24.8 26.2 23.4 22.2 22.3 22.3 22.4 22.4 22.1 Total expenditure and net lending 1/ 37.9 38.9 40.2 39.0 35.2 32.9 31.6 30.6 29.7 30.0 On-budget structural balance (excluding DBM spending) … … -1.2 -4.3 -4.2 -4.0 -3.1 -3.0 -2.0 -2.0
DBM spending … 2.8 8.0 6.8 5.7 3.7 3.3 2.0 2.0 2.0 On-budget plus DBM balance -4.0 -9.1 -8.9 -11.0 -9.8 -7.8 -6.7 -5.3 -4.2 -4.2
Monetary sector Credit growth (percent change) 72.3 24.1 54.3 23.3 16.2 15.5 16.0 16.3 16.9 17.1
Reserve money growth (percent change) 75.3 30.5 54.0 2.7 -0.9 8.3 8.1 10.2 10.4 13.2
Balance of payments Current account balance -26.5 -27.4 -25.4 -8.2 -11.1 -17.3 -17.6 -16.8 -13.2 -5.7
Debt indicators Total public debt 2/ 32.7 51.3 67.3 76.5 81.5 87.6 92.6 89.1 84.9 80.1 Domestic public debt 9.1 12.3 21.1 21.6 25.6 25.2 32.3 30.8 28.8 26.1 External public debt 23.5 39.0 46.3 54.9 56.0 62.4 60.2 58.4 56.2 54.0
Memorandum items:Copper prices (US$ per ton) 8823.5 7958.9 7331.5 6863.4 5644.0 5602.8 5594.6 5581.6 5559.3 5545.5Gold prices (US$ per ounce) 1568.6 1668.8 1411.1 1266.2 1276.6 1282.9 1295.0 1310.6 1329.5 1384.9
Sources: Mongolian authorities; and IMF staff projections.
2/ Debt data reflects general government debt (including quasi-sovereign bonds issued by DBM) only before 2013, and starts to cover SOE debt from 2013 onwards.
1/ Includes DBM spending.
Projections
(In percent of GDP, unless otherwise indicated)
(In percent of GDP, unless indicated otherwise)

MONGOLIA
22 INTERNATIONAL MONETARY FUND
20162011 2012 2013 Budget Est. Budget 1/ Proj. Proj.
Total revenue and grants 4,468 4,976 5,984 6,888 6,122 6,481 6,186 6,805 Current revenue 4,455 4,941 5,980 6,887 6,120 6,417 6,122 6,748 Tax revenue and social security contributions 3,909 4,291 5,120 6,257 5,248 5,430 5,309 5,830 Income taxes 919 895 1,117 1,284 1,098 1,151 1,080 1,211 Social security contributions 473 674 874 1,086 971 1,236 1,182 1,335 Sales tax and VAT 1,114 1,297 1,435 1,702 1,371 1,254 1,304 1,467 Excise taxes 294 312 449 598 454 666 621 673 Customs duties and export taxes 337 327 381 426 355 377 377 418 Other taxes 772 786 863 1,161 998 747 746 726 Non-tax revenue 545 650 861 630 872 987 813 918Capital revenue and grants 14 35 3 0 2 64 64 56
Total expenditure and net lending 4,997 6,493 7,689 7,294 8,518 7,837 8,562 8,925 Current expenditure 3,236 4,428 4,553 5,326 5,227 5,823 5,848 6,711 Wages and salaries 802 1,197 1,402 1,583 1,567 1,806 1,831 2,236 Purchase of goods and services 702 855 990 1,068 1,031 1,094 1,094 1,149 Subsidies to public enterprises 123 127 176 201 178 100 100 100 Transfers 1,572 2,123 1,715 2,011 1,951 2,126 2,126 2,276 Interest payments 37 126 270 463 500 697 697 950
Capital expenditure and net lending 2/ 1,761 2,065 3,136 1,968 3,292 2,015 2,715 2,214 Capital expenditure 1,281 1,783 2,517 2,006 2,382 2,015 2,115 1,764 Domestically-financed 1,229 1,428 1,237 1,808 1,506 1,014 594 Foreign-financed 51 355 1,280 198 875 1,101 1,170
o/w DBM/Chinggis bond social benefit projects 258 1,026 642 795 550 Net lending 480 282 619 -39 910 0 600 450
o/w DBM/Chinggis on-lending 217 498 845 600 450
On-budget balance (incl. grants) -529 -1,042 -181 -406 -910 … -982 -1,120On budget structural balance (excluding DBM spending) … … -228 -436 -950 … -1,011 -1,084DBM spending … 475 1,524 … 1,487 … 1,395 1,000On-budget plus DBM balance 3/ -529 -1,517 -1,705 … -2,397 -1,356 -2,376 -2,120
Financing 529 1,517 1,705 … 2,397 … 2,376 2,120 Foreign (net) 199 3,062 226 … 1,539 … 790 1,461 Domestic (net) 329 -1,545 1,479 … 858 … 1,586 660 Privatization receipts (valuation adj.) 14 1 3 … 23 … 114 9 Domestic bank financing (net) 95 -1,835 1,599 … 1,226 … 1,816 614 Domestic non-bank financing (net) 461 376 -77 … -470 … -314 0 Stabilization fund accumulation -241 -87 -47 -30 78 -30 -30 36
Total revenue and grants 33.9 29.8 31.3 31.5 28.0 26.7 25.4 25.1 Current revenue 33.8 29.6 31.3 31.5 28.0 26.4 25.2 24.9 Tax revenue and social security contributions 29.7 25.7 26.8 28.6 24.0 22.3 21.8 21.5 Non-tax revenue 4.1 3.9 4.5 2.9 4.0 4.1 3.3 3.4 Capital revenue and grants 0.1 0.2 0.0 0.0 0.0 0.3 0.3 0.2
Total expenditure and net lending 37.9 38.9 40.2 33.4 39.0 32.2 35.2 32.9 Current expenditure 24.6 26.5 23.8 24.4 23.9 23.9 24.0 24.8 Of which: Wages and salaries 6.1 7.2 7.3 7.2 7.2 7.4 7.5 8.3 Capital expenditure and net lending 2/ 13.4 12.4 16.4 9.0 15.1 8.3 11.2 8.2
On-budget balance (incl. grants) -4.0 -6.2 -0.9 -1.9 -4.2 … -4.0 -4.1On-budget structural balance (excluding DBM spending) … … -1.2 -2.0 -4.3 … -4.2 -4.0DBM spending … 2.8 8.0 … 6.8 … 5.7 3.7On-budget plus DBM balance -4.0 -9.1 -8.9 … -11.0 -5.6 -9.8 -7.8
Financing 4.0 9.1 8.9 … 11.0 … 9.8 7.8 Foreign (net) 1.5 18.3 1.2 … 7.0 … 3.2 5.4 Domestic (net) 2.5 -9.3 7.7 … 3.9 … 6.5 2.4 Banking system (net) 0.7 -11.0 8.4 … 5.6 … 7.5 2.3 Non-bank 3.6 2.3 -0.4 … -2.0 … -0.8 0.0 Stabilization fund accumulation -1.8 -0.5 -0.2 -0.1 0.4 -0.1 -0.1 0.1
Memorandum items (in percent of GDP unless defined otherwise): Mineral revenue 7.8 5.0 5.1 … 4.6 … 3.3 2.8 Non-mineral revenue (in percent of non-mineral GDP) 32.4 29.7 31.0 … 28.4 … 26.6 26.4 Total expenditure (in percent of non-mineral GDP) 47.0 46.6 47.6 … 47.3 … 42.3 39.1 Non-mineral overall balance (in percent of non-mineral GDP) -14.6 -16.9 -16.6 … -18.9 … -15.7 -12.7 Nominal GDP (in billions of togrogs) 13,174 16,688 19,118 21,844 21,844 24,315 24,315 27,101 Copper price (Market, US$ per ton) 8,823 7,959 7,331 … 6,863 … 5,644 5,603 (Structural, US$ per ton) 5,727 5,888 5,793 … 5,754 … 5,777 5,837 Primary spending (change in percent) 63.2 28.4 16.5 -7.9 8.1 -10.9 -1.9 1.4
Sources: Mongolian authorities; and IMF staff projections.
3/ Only part of DBM spending is included in the 2015 supplementary budget
2014 2015
(In billions of togrogs)
(In percent of GDP)
1/ Reflects 2015 supplementary budget passed in January 2015, with privatization receipts reclassified below the line.2/ Includes DBM spending.
Table 2. Mongolia: Summary Operations of the General Government, 2011–16 (Baseline)
MONGOLIA
INTERNATIONAL MONETARY FUND 23
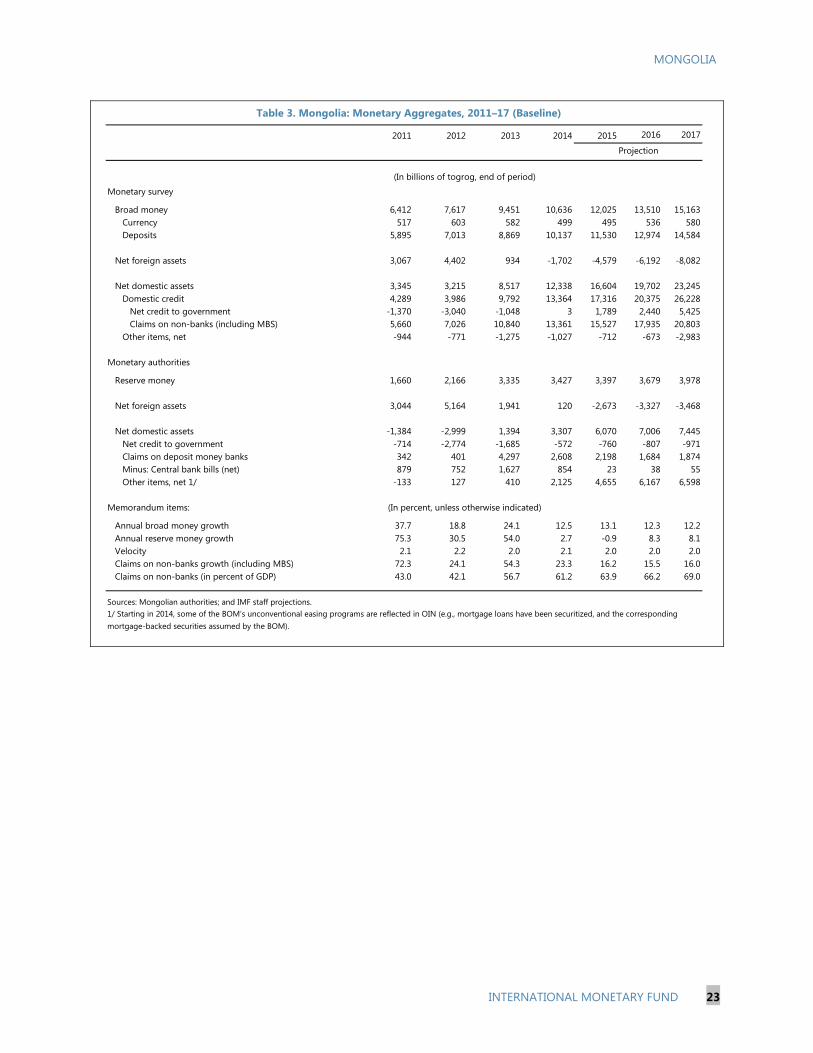
2011 2012 2013 2014 2015 2016 2017
Monetary survey
Broad money 6,412 7,617 9,451 10,636 12,025 13,510 15,163 Currency 517 603 582 499 495 536 580 Deposits 5,895 7,013 8,869 10,137 11,530 12,974 14,584
Net foreign assets 3,067 4,402 934 -1,702 -4,579 -6,192 -8,082
Net domestic assets 3,345 3,215 8,517 12,338 16,604 19,702 23,245 Domestic credit 4,289 3,986 9,792 13,364 17,316 20,375 26,228 Net credit to government -1,370 -3,040 -1,048 3 1,789 2,440 5,425 Claims on non-banks (including MBS) 5,660 7,026 10,840 13,361 15,527 17,935 20,803 Other items, net -944 -771 -1,275 -1,027 -712 -673 -2,983
Monetary authorities
Reserve money 1,660 2,166 3,335 3,427 3,397 3,679 3,978
Net foreign assets 3,044 5,164 1,941 120 -2,673 -3,327 -3,468
Net domestic assets -1,384 -2,999 1,394 3,307 6,070 7,006 7,445 Net credit to government -714 -2,774 -1,685 -572 -760 -807 -971 Claims on deposit money banks 342 401 4,297 2,608 2,198 1,684 1,874 Minus: Central bank bills (net) 879 752 1,627 854 23 38 55 Other items, net 1/ -133 127 410 2,125 4,655 6,167 6,598
Memorandum items:
Annual broad money growth 37.7 18.8 24.1 12.5 13.1 12.3 12.2 Annual reserve money growth 75.3 30.5 54.0 2.7 -0.9 8.3 8.1 Velocity 2.1 2.2 2.0 2.1 2.0 2.0 2.0 Claims on non-banks growth (including MBS) 72.3 24.1 54.3 23.3 16.2 15.5 16.0 Claims on non-banks (in percent of GDP) 43.0 42.1 56.7 61.2 63.9 66.2 69.0
Sources: Mongolian authorities; and IMF staff projections.
(In billions of togrog, end of period)
(In percent, unless otherwise indicated)
Projection
1/ Starting in 2014, some of the BOM’s unconventional easing programs are reflected in OIN (e.g., mortgage loans have been securitized, and the corresponding mortgage-backed securities assumed by the BOM).
Table 3. Mongolia: Monetary Aggregates, 2011–17 (Baseline)

MONGOLIA
24 INTERNATIONAL MONETARY FUND
Table 4. Mongolia: Balance of Payments, 2011–20 (Baseline)
2011 2012 2013 2014 2015 2016 2017 2018 2019 2020
(In millions of U.S. dollars, unless otherwise indicated)
Current account balance (including official grants) -2,759 -3,362 -3,192 -985 -1,379 -2,268 -2,447 -2,539 -2,164 -1,036Trade balance -993 -1,553 -1,321 1,002 844 -9 -406 -372 117 1,338
Exports 4,817 4,385 4,269 5,775 5,155 4,916 4,491 4,795 5,569 6,751Mineral export 4,302 4,032 4,050 5,196 4,615 4,385 3,984 4,313 5,087 6,258Non-mineral export 515 353 219 579 540 530 508 482 482 493
Imports -5,810 -5,938 -5,590 -4,773 -4,310 -4,924 -4,898 -5,167 -5,452 -5,413of which : mining-related imports -3,649 -3,484 -3,076 -2,388 -2,485 -2,743 -2,750 -2,804 -2,921 -2,807
Services, net -1,161 -1,100 -1,314 -1,323 -1,312 -1,366 -1,211 -1,293 -1,381 -1,448Income, net -843 -948 -699 -829 -1,080 -1,066 -1,005 -1,054 -1,090 -1,128
Current transfers 244 237 129 162 168 171 175 180 190 202General government 24 34 22 27 31 32 34 37 41 45Other sectors 220 203 107 135 137 139 141 143 149 157
Of which: Workers remittances 58 41 22 50 50 50 50 51 55 61
Capital and financial account 2,864 4,929 1,438 813 -23 2,008 597 2,760 2,601 2,100Capital account 114 120 126 126 131 138 146 158 172 190Financial account 2,750 4,809 1,312 687 -154 1,871 451 2,602 2,429 1,910
Direct investment 4,620 4,408 2,098 542 1,069 2,326 1,901 2,580 2,525 2,184Portfolio investment 77 2,325 -156 192 -238 -32 -1,230 158 138 142Trade credits, net -406 53 9 -180 -129 -90 -102 -57 -97 -226Currency and deposits, net -2,012 -2,473 -1,376 -663 -1,150 -834 -777 -743 -736 -731Loans, net 469 496 737 743 294 501 658 664 599 540Other, net 2 0 0 53 0 0 0 0 0 0
Errors and omissions 258 -71 -131 -422 0 0 0 0 0 0
Overall balance 364 1,497 -1,885 -594 -1,403 -260 -1,851 221 437 1,063
Memorandum items:
Current account balance (in percent of GDP) -26.5 -27.4 -25.4 -8.2 -11.1 -17.3 -17.6 -16.9 -13.2 -5.7Copper price (in U.S. dollars per ton) 8,823 7,959 7,331 6,863 5,644 5,603 5,595 5,582 5,559 5,546
Oil price (in U.S. dollars per barrel) 104 105 104 96 51 59 64 67 68 68
Gold price (in U.S. dollars per troy oz.) 1,569 1,669 1,411 1,266 1,277 1,283 1,295 1,311 1,329 1,385
Sources: Mongolian authorities; and IMF staff projections.
Projections

MONGOLIA
INTERNATIONAL MONETARY FUND 25
Table 5. Selected Economic and Financial Indicators, 2011–20 (Adjustment Scenario)
2011 2012 2013 2014 2015 2016 2017 2018 2019 2020Est.
Real sector Nominal GDP (in billions of togrogs) 13174 16688 19118 21844 23660 26201 28988 32755 36732 42166 Real GDP growth (percent change) 17.3 12.3 11.6 7.8 2.9 4.2 3.9 6.5 6.6 9.3 Mineral real GDP growth 7.7 8.3 19.4 24.2 9.0 -0.5 -4.0 6.0 7.0 20.0 Non-mineral real GDP growth 19.9 13.3 9.8 3.6 1.0 5.8 6.4 6.6 6.5 6.3 GDP deflator (percent change) 15.1 12.8 2.6 6.0 5.3 6.3 6.5 6.1 5.2 5.0
Consumer prices 9.4 14.2 11.2 10.7 9.6 8.6 8.2 7.2 6.9 6.5 (End-period; percent change)
Gross national saving 30.4 27.7 26.6 24.3 21.8 20.4 18.5 20.2 22.4 29.3Public 9.4 3.3 7.5 4.1 3.8 5.3 5.8 5.9 6.1 6.3Private 21.1 24.4 19.2 20.2 18.0 15.1 12.7 14.3 16.3 23.0
Gross capital formation 56.9 55.0 52.1 32.6 30.6 37.2 38.5 39.4 37.5 35.4Public 13.4 12.4 16.4 15.1 8.4 8.0 8.1 8.2 8.4 8.5Private 43.6 42.7 35.7 17.5 22.2 29.2 30.4 31.2 29.0 26.9
General government accounts Total revenue and grants 33.9 29.8 31.3 28.0 26.5 26.1 26.1 26.9 27.0 27.5 Mineral revenue 7.8 5.0 5.1 4.6 3.5 3.0 2.8 3.4 3.4 4.3 Non-mineral revenue 26.1 24.8 26.2 23.4 23.0 23.1 23.3 23.5 23.6 23.2 Total expenditure and net lending 1/ 37.9 38.9 40.2 39.0 31.0 28.8 28.4 29.2 29.3 29.8 On-budget structural balance (excluding DBM spending) … … -1.2 -4.3 -1.9 -2.0 -2.0 -2.0 -2.0 -2.0
DBM spending … 2.8 8.0 6.8 2.8 0.5 0.0 0.0 0.0 0.0 On-budget plus DBM balance -4.0 -9.1 -8.9 -11.0 -4.6 -2.7 -2.3 -2.3 -2.3 -2.3
Monetary sector Credit growth (percent change) 72.3 24.1 54.3 23.3 12.6 12.9 13.7 13.8 14.4 15.1
Reserve money growth (percent change) 75.3 30.5 54.0 2.7 -3.3 6.4 7.4 11.4 12.0 14.6
Balance of payments Current account balance -26.5 -27.4 -25.4 -8.2 -8.8 -16.8 -20.0 -19.3 -15.0 -6.1
Debt indicators Total public debt 2/ 32.7 51.3 67.3 76.5 81.3 81.8 81.4 76.5 72.5 67.4 Domestic public debt 9.1 12.3 21.1 21.6 23.5 21.8 19.7 17.7 16.0 14.5 External public debt 23.5 39.0 46.3 54.9 57.9 60.0 61.7 58.9 56.5 52.9
Memorandum items:Copper prices (US$ per ton) 8823.5 7958.9 7331.5 6863.4 5644.0 5602.8 5594.6 5581.6 5559.3 5545.5Gold prices (US$ per ounce) 1568.6 1668.8 1411.1 1266.2 1276.6 1282.9 1295.0 1310.6 1329.5 1384.9
Sources: Mongolian authorities; and IMF staff projections.
2/ Debt data reflects general government debt (including quasi-sovereign bonds issued by DBM) only before 2013, and starts to cover SOE debt from 2013 onwards.
1/ Includes DBM spending.
Projections
(In percent of GDP, unless otherwise indicated)
(In percent of GDP, unless indicated otherwise)

MONGOLIA
26 INTERNATIONAL MONETARY FUND
20162011 2012 2013 Budget Est. Budget 1/ Proj. Proj.
Total revenue and grants 4,468 4,976 5,984 6,888 6,122 6,481 6,260 6,840 Current revenue 4,455 4,941 5,980 6,887 6,120 6,417 6,196 6,784 Tax revenue and social security contributions 3,909 4,291 5,120 6,257 5,248 5,430 5,411 5,904 Income taxes 919 895 1,117 1,284 1,098 1,151 1,111 1,241 Social security contributions 473 674 874 1,086 971 1,236 1,173 1,317 Sales tax and VAT 1,114 1,297 1,435 1,702 1,371 1,254 1,317 1,418 Excise taxes 294 312 449 598 454 666 603 647 Customs duties and export taxes 337 327 381 426 355 377 457 560 Other taxes 772 786 863 1,161 998 747 750 723 Non-tax revenue 545 650 861 630 872 987 785 880Capital revenue and grants 14 35 3 0 2 64 64 56
Total expenditure and net lending 4,997 6,493 7,689 7,294 8,518 7,837 7,338 7,537 Current expenditure 3,236 4,428 4,553 5,326 5,227 5,823 5,356 5,441 Wages and salaries 802 1,197 1,402 1,583 1,567 1,806 1,711 1,671 Purchase of goods and services 702 855 990 1,068 1,031 1,094 1,047 1,084 Subsidies to public enterprises 123 127 176 201 178 100 100 70 Transfers 1,572 2,123 1,715 2,011 1,951 2,126 1,801 1,666 Interest payments 37 126 270 463 500 697 697 950
Capital expenditure and net lending 2/ 1,761 2,065 3,136 1,968 3,292 2,015 1,983 2,096 Capital expenditure 1,281 1,783 2,517 2,006 2,382 2,015 1,652 2,030 Domestically-financed 1,229 1,428 1,237 1,808 1,506 1,005 1,290 Foreign-financed 51 355 1,280 198 875 646 740
o/w DBM/Chinggis bond social benefit projects 258 1,026 642 331 66 Net lending 480 282 619 -39 910 0 331 66
o/w DBM/Chinggis on-lending 217 498 845 331 66
On-budget balance (incl. grants) -529 -1,042 -181 -406 -910 … -416 -565On budget structural balance (excluding DBM spending) … … -228 -436 -950 … -446 -525DBM spending … 475 1,524 … 1,487 … 662 133On-budget plus DBM balance 3/ -529 -1,517 -1,705 … -2,397 -1,356 -1,078 -697
Financing 529 1,517 1,705 … 2,397 … 1,078 697 Foreign (net) 199 3,062 226 … 1,539 … 158 500 Domestic (net) 329 -1,545 1,479 … 858 … 920 197 Privatization receipts (valuation adj.) 14 1 3 … 23 … 114 9 Domestic bank financing (net) 95 -1,835 1,599 … 1,226 … 1,149 148 Domestic non-bank financing (net) 461 376 -77 … -470 … -314 0 Stabilization fund accumulation -241 -87 -47 -30 78 -30 -30 40
Total revenue and grants 33.9 29.8 31.3 31.5 28.0 27.4 26.5 26.1 Current revenue 33.8 29.6 31.3 31.5 28.0 27.1 26.2 25.9 Tax revenue and social security contributions 29.7 25.7 26.8 28.6 24.0 22.9 22.9 22.5 Non-tax revenue 4.1 3.9 4.5 2.9 4.0 4.2 3.3 3.4 Capital revenue and grants 0.1 0.2 0.0 0.0 0.0 0.3 0.3 0.2
Total expenditure and net lending 37.9 38.9 40.2 33.4 39.0 33.1 31.0 28.8 Current expenditure 24.6 26.5 23.8 24.4 23.9 24.6 22.6 20.8 Of which: Wages and salaries 6.1 7.2 7.3 7.2 7.2 7.6 7.2 6.4 Capital expenditure and net lending 2/ 13.4 12.4 16.4 9.0 15.1 8.5 8.4 8.0
On-budget balance (incl. grants) -4.0 -6.2 -0.9 -1.9 -4.2 … -1.8 -2.2On-budget structural balance (excluding DBM spending) … … -1.2 -2.0 -4.3 … -1.9 -2.0DBM spending … 2.8 8.0 … 6.8 … 2.8 0.5On-budget plus DBM balance -4.0 -9.1 -8.9 … -11.0 -5.7 -4.6 -2.7
Financing 4.0 9.1 8.9 … 11.0 … 4.6 2.7 Foreign (net) 1.5 18.3 1.2 … 7.0 … 0.7 1.9 Domestic (net) 2.5 -9.3 7.7 … 3.9 … 3.9 0.8 Banking system (net) 0.7 -11.0 8.4 … 5.6 … 4.9 0.6 Non-bank 3.6 2.3 -0.4 … -2.0 … -0.8 0.0 Stabilization fund accumulation -1.8 -0.5 -0.2 -0.1 0.4 -0.1 -0.1 0.2
Memorandum items (in percent of GDP unless defined otherwise): Mineral revenue 7.8 5.0 5.1 … 4.6 … 3.5 3.0 Non-mineral revenue (in percent of non-mineral GDP) 32.4 29.7 31.0 … 28.4 … 27.9 27.7 Total expenditure (in percent of non-mineral GDP) 47.0 46.6 47.6 … 47.3 … 37.7 34.6 Non-mineral overall balance (in percent of non-mineral GDP) -14.6 -16.9 -16.6 … -18.9 … -9.8 -6.9 Nominal GDP (in billions of togrogs) 13,174 16,688 19,118 21,844 21,844 23,660 23,660 26,201 Copper price (Market, US$ per ton) 8,823 7,959 7,331 … 6,863 … 5,644 5,603 (Structural, US$ per ton) 5,727 5,888 5,793 … 5,754 … 5,777 5,837 Primary spending (change in percent) 63.2 28.4 16.5 -7.9 8.1 -10.9 -17.2 -0.8
Sources: Mongolian authorities; and IMF staff projections.
3/ Only part of DBM spending is included in the 2015 supplementary budget
(In billions of togrogs)
(In percent of GDP)
1/ Reflects 2015 supplementary budget passed in January 2015, with privatization receipts reclassified below the line.2/ Includes DBM spending.
2014 2015
Table 6. Mongolia: Summary Operations of the General Government, 2011–16 (Adjustment Scenario)
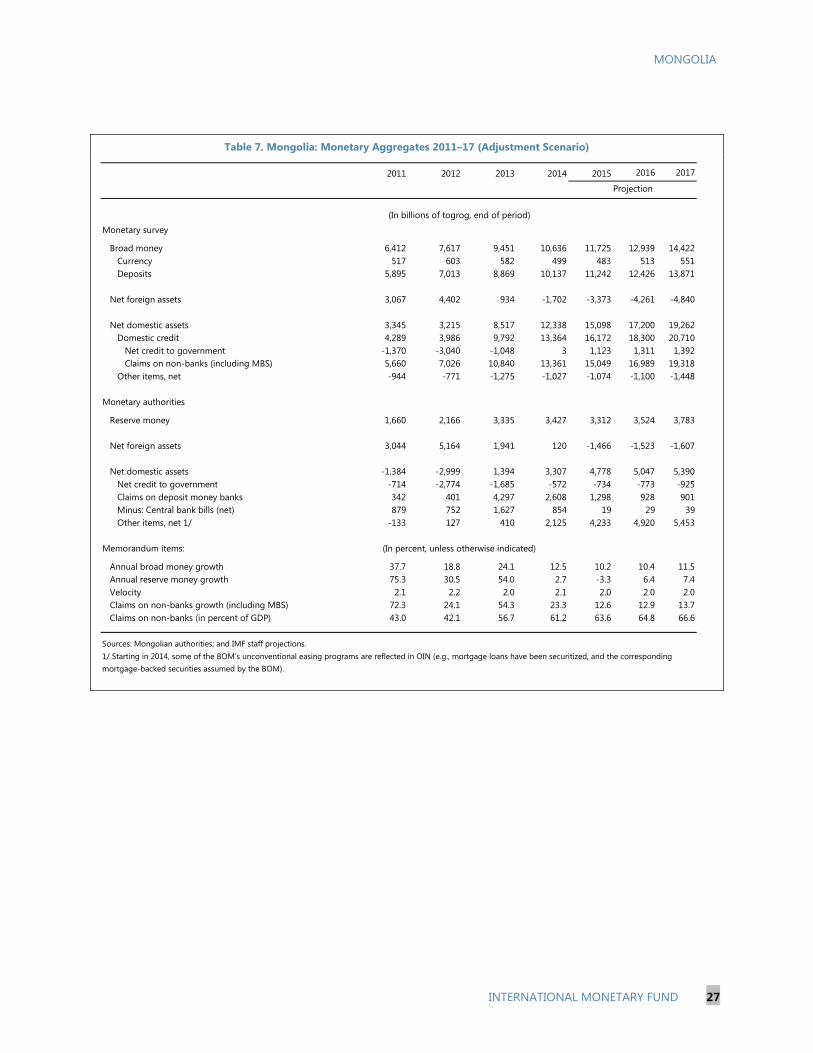
MONGOLIA
INTERNATIONAL MONETARY FUND 27
2011 2012 2013 2014 2015 2016 2017
Monetary survey
Broad money 6,412 7,617 9,451 10,636 11,725 12,939 14,422 Currency 517 603 582 499 483 513 551 Deposits 5,895 7,013 8,869 10,137 11,242 12,426 13,871
Net foreign assets 3,067 4,402 934 -1,702 -3,373 -4,261 -4,840
Net domestic assets 3,345 3,215 8,517 12,338 15,098 17,200 19,262 Domestic credit 4,289 3,986 9,792 13,364 16,172 18,300 20,710 Net credit to government -1,370 -3,040 -1,048 3 1,123 1,311 1,392 Claims on non-banks (including MBS) 5,660 7,026 10,840 13,361 15,049 16,989 19,318 Other items, net -944 -771 -1,275 -1,027 -1,074 -1,100 -1,448
Monetary authorities
Reserve money 1,660 2,166 3,335 3,427 3,312 3,524 3,783
Net foreign assets 3,044 5,164 1,941 120 -1,466 -1,523 -1,607
Net domestic assets -1,384 -2,999 1,394 3,307 4,778 5,047 5,390 Net credit to government -714 -2,774 -1,685 -572 -734 -773 -925 Claims on deposit money banks 342 401 4,297 2,608 1,298 928 901 Minus: Central bank bills (net) 879 752 1,627 854 19 29 39 Other items, net 1/ -133 127 410 2,125 4,233 4,920 5,453
Memorandum items:
Annual broad money growth 37.7 18.8 24.1 12.5 10.2 10.4 11.5 Annual reserve money growth 75.3 30.5 54.0 2.7 -3.3 6.4 7.4 Velocity 2.1 2.2 2.0 2.1 2.0 2.0 2.0 Claims on non-banks growth (including MBS) 72.3 24.1 54.3 23.3 12.6 12.9 13.7 Claims on non-banks (in percent of GDP) 43.0 42.1 56.7 61.2 63.6 64.8 66.6
Sources: Mongolian authorities; and IMF staff projections.
(In billions of togrog, end of period)
(In percent, unless otherwise indicated)
Projection
1/ Starting in 2014, some of the BOM’s unconventional easing programs are reflected in OIN (e.g., mortgage loans have been securitized, and the corresponding mortgage-backed securities assumed by the BOM).
Table 7. Mongolia: Monetary Aggregates 2011–17 (Adjustment Scenario)

MONGOLIA
28 INTERNATIONAL MONETARY FUND
Table 8. Mongolia: Balance of Payments, 2011–20 (Adjustment Scenario)
2011 2012 2013 2014 2015 2016 2017 2018 2019 2020
(In millions of U.S. dollars, unless otherwise indicated)
Current account balance (including official grants) -2,759 -3,362 -3,192 -985 -1,034 -1,955 -2,333 -2,375 -1,990 -895Trade balance -993 -1,553 -1,321 1,002 1,147 268 -303 -225 267 1,454
Exports 4,817 4,385 4,269 5,775 5,155 4,916 4,491 4,795 5,569 6,751Mineral export 4,302 4,032 4,050 5,196 4,615 4,385 3,984 4,313 5,087 6,258Non-mineral export 515 353 219 579 540 530 508 482 482 493
Imports -5,810 -5,938 -5,590 -4,773 -4,008 -4,648 -4,794 -5,021 -5,302 -5,297of which : mining-related imports -3,649 -3,484 -3,076 -2,388 -2,485 -2,743 -2,750 -2,804 -2,921 -2,807
Services, net -1,161 -1,100 -1,314 -1,323 -1,269 -1,326 -1,196 -1,274 -1,364 -1,437Income, net -843 -948 -699 -829 -1,078 -1,064 -1,004 -1,048 -1,075 -1,104
Current transfers 244 237 129 162 166 168 170 174 182 192General government 24 34 22 27 29 29 29 31 33 36Other sectors 220 203 107 135 137 139 141 143 149 156
Of which: Workers remittances 58 41 22 50 50 50 50 51 54 60
Capital and financial account 2,864 4,929 1,438 813 266 1,993 2,354 2,466 2,286 1,757Capital account 114 120 126 126 124 123 123 129 139 153Financial account 2,750 4,809 1,312 687 143 1,870 2,231 2,336 2,147 1,604
Direct investment 4,620 4,408 2,098 542 1,069 2,326 2,487 2,315 2,245 1,881Portfolio investment 77 2,325 -156 192 58 -32 -36 158 138 142Trade credits, net -406 53 9 -180 -129 -90 -102 -57 -97 -226Currency and deposits, net -2,012 -2,473 -1,376 -663 -1,150 -834 -777 -743 -736 -731Loans, net 469 496 737 743 294 501 659 663 597 537Other, net 2 0 0 53 0 0 0 0 0 0
Errors and omissions 258 -71 -131 -422 0 0 0 0 0 0
Overall balance 364 1,497 -1,885 -594 -768 38 21 91 295 861
Memorandum items:
Current account balance (in percent of GDP) -26.5 -27.4 -25.4 -8.2 -8.8 -16.8 -20.0 -19.3 -15.0 -6.1Copper price (in U.S. dollars per ton) 8,823 7,959 7,331 6,863 5,644 5,603 5,595 5,582 5,559 5,546
Oil price (in U.S. dollars per barrel) 104 105 104 96 51 59 64 67 68 68
Gold price (in U.S. dollars per troy oz.) 1,569 1,669 1,411 1,266 1,277 1,283 1,295 1,311 1,329 1,385
Sources: Mongolian authorities; and IMF staff projections.
Projections

Table 9. Mongolia: Baseline and Policy Adjustment Scenarios, 2013-20
MO
NG
OLIA
INTERN
ATION
AL MO
NETARY FU
ND
29
2013 2014 2015 2016 2017 2018 2019 2020 2013 2014 2015 2016 2017 2018 2019 2020
Real sector (change in percent)Real GDP growth 11.6 7.8 4.4 4.2 3.8 6.2 6.4 9.2 11.6 7.8 2.9 4.2 3.9 6.5 6.6 9.3
Mineral growth 19.4 24.2 9.0 -0.5 -4.0 6.0 7.0 20.0 19.4 24.2 9.0 -0.5 -4.0 6.0 7.0 20.0Nonmineral growth 9.8 3.6 3.0 5.8 6.2 6.2 6.2 6.3 9.8 3.6 1.0 5.8 6.4 6.6 6.5 6.3
Consumer prices (end-period) 11.2 10.7 8.0 7.4 7.1 6.8 6.6 6.5 11.2 10.7 9.6 8.6 8.2 7.2 6.9 6.5
Fiscal accounts (in percent of GDP, unless otherwise indicated)Revenue and grants 31.3 28.0 25.4 25.1 24.9 25.4 25.4 25.8 31.3 28.0 26.5 26.1 26.1 26.9 27.0 27.5Expenditure and net lending 1/ 32.2 32.2 29.5 29.2 28.2 28.6 27.7 28.0 32.2 32.2 28.2 28.3 28.4 29.2 29.3 29.8
Current expenditure 23.8 23.9 24.0 24.8 24.0 23.1 22.3 22.7 23.8 23.9 22.6 20.8 20.2 21.0 20.9 21.3Capital expenditure and net lending 1/ 8.4 8.3 5.4 4.5 4.2 5.5 5.3 5.3 8.4 8.3 5.6 7.5 8.1 8.2 8.4 8.5
On-budget structural balance (excluding DBM spending) -1.2 -4.3 -4.2 -4.0 -3.1 -3.0 -2.0 -2.0 -1.2 -4.3 -1.9 -2.0 -2.0 -2.0 -2.0 -2.0DBM spending 8.0 6.8 5.7 3.7 3.3 2.0 2.0 2.0 8.0 6.8 2.8 0.5 0.0 0.0 0.0 0.0On-budget plus DBM balance -8.9 -11.0 -9.8 -7.8 -6.7 -5.3 -4.2 -4.2 -8.9 -11.0 -4.6 -2.7 -2.3 -2.3 -2.3 -2.3
Total public debt (in percent of GDP) 67.3 76.5 81.5 87.6 92.6 89.1 84.9 80.1 67.3 76.5 81.3 81.8 81.4 76.5 72.5 67.4Domestic debt 21.1 21.6 25.6 25.2 32.3 30.8 28.8 26.1 21.1 21.6 23.5 21.8 19.7 17.7 16.0 14.5External debt 46.3 54.9 56.0 62.4 60.2 58.4 56.2 54.0 46.3 54.9 57.9 60.0 61.7 58.9 56.5 52.9
Monetary accounts (change in percent)Broad money 24.1 12.5 24.1 12.5Reserve money 54.0 2.7 54.0 2.7Credit to the private sector (including MBS) 54.3 23.3 16.2 15.5 16.0 16.3 16.9 17.1 54.3 23.3 12.6 12.9 13.7 13.8 14.4 15.1
External accounts 2/Current account balance (million USD) -3192 -985 -1379 -2268 -2447 -2539 -2164 -1036 -3192 -985 -1034 -1955 -2333 -2375 -1990 -895Current account balance (percent of GDP) -25.4 -8.2 -11.1 -17.3 -17.6 -16.8 -13.2 -5.7 -25.4 -8.2 -8.8 -16.8 -20.0 -19.3 -15.0 -6.1Overall balance (million USD) -1885 -594 -1403 -260 -1851 221 437 1063 -1885 -594 -768 38 21 91 295 861
Memorandum items:Nominal GDP (billions of togrogs) 19,118 21,844 24,315 27,101 30,144 34,094 38,525 44,300 19,118 21,844 23,660 26,201 28,988 32,755 36,732 42,166
Sources: Mongolian authorities; and IMF staff calculations.
1/ Excludes DBM spending.2/ The baseline scenario assumes no rollover of maturing bonds. The policy adjustment scenario assumes bond rollover of maturing sovereign debt ($500 million), DBM debt ($580 million) and MMC bonds ($600 million),as well as TDB bonds ($414 million).
Baseline Policy Adjustment

MONGOLIA
30 INTERNATIONAL MONETARY FUND
Figure 5. Key Indicators in Baseline and Policy Adjustment Scenarios
0
2
4
6
8
10
12
14
2013 2014 2015 2016 2017 2018 2019 2020
Real GDP Growth (In percent)
BASELINE ADJUSTMENT
6
7
8
9
10
11
12
2013 2014 2015 2016 2017 2018 2019 2020
CPI Inflation (In percent)
BASELINE ADJUSTMENT
-12
-10
-8
-6
-4
-2
0
2013 2014 2015 2016 2017 2018 2019 2020
Fiscal Balance: On-budget plus DBM (In percent of GDP)
BASELINE
ADJUSTMENT
-3500
-3000
-2500
-2000
-1500
-1000
-500
0
2013 2014 2015 2016 2017 2018 2019 2020
Current Account Balance (Milion USD)
BASELINE ADJUSTMENT
10
15
20
25
30
35
40
45
50
55
60
2013 2014 2015 2016 2017 2018 2019 2020
Credit Growth (Percent change)
BASELINE ADJUSTMENT
30
40
50
60
70
80
90
100
2013 2014 2015 2016 2017 2018 2019 2020
Public Debt (In percent of GDP)
BASELINE ADJUSTMENT

MONGOLIA
INTERNATIONAL MONETARY FUND 31
Annex I. Economic Impact of Mongolia’s Natural Resource Endowments
Mongolia is unusually rich in mineral resources. The population of 3 million inhabits a country with an estimated $1 to $3 trillion worth of copper, gold, coal, oil, and other resources, close to growing markets in China and elsewhere in Asia. To exploit these reserves, Mongolia has in the last several years attracted very large FDI inflows into the sector that now accounts for around 20 percent of GDP and close to 90 percent of exports. Joint ventures between Mongolian companies (both public and private) and multinationals account for a significant proportion of mining production. Currently almost all production is for export, and transport links—especially with China—are being substantially improved, which will allow unit costs to be reduced. A number of mega projects are underway that will significantly boost the mining sector and catalyze other investments. These include:
A. The Oyu Tolgoi copper and gold mine Mongolia is on track to become a globally significant copper and gold producer, with the
Oyu Tolgoi (OT) mine one of the largest in the world. The project is jointly owned by the Government of Mongolia (34 percent stake) and Turquoise Hill Resources (THR). Rio Tinto has a 50 percent stake in THR and is the project manager. The first-phase open-pit mine began construction in 2010 with investment exceeding $6 billion, and production commenced in 2013. The second phase (OT-2) will be underground, and output will markedly increase once production comes on stream toward the end of this decade (associated FDI inflows are estimated at over $5 billion).
The commencement of the OT-2 project has been delayed by ongoing negotiations between Rio Tinto and the authorities over a number of issues. These include the appropriate treatment of significant cost overruns in OT-1, resolution of outstanding tax issues, the exact specification of activities, government permits, and a number of social and environment issues. However, both sides have stated that they remain committed to the project, with the intention for the project to commence in 2015.
B. Tavan Tolgoi (TT) coal mine Coal reserves are estimated at well over 6 billion tons. Mongolia is already a major exporter
of coal to China for both power generation and for use in the heavy industrial sector; South Gobi Resources (in which THR has a 47.9 per cent interest) and Energy Resources (a subsidiary of the Mongolian Mining Corporation (MMC)) are major producers currently. Production is set to increase sharply with the commencement of the TT coal mine. The tender has been won by a consortium that includes leading Mongolian, Chinese and Japanese companies (MMC, Shenhua Energy, and Sumitomo Corporation, respectively). Negotiations on the production modalities are reported to be at an advanced stage.
The total investment in TT is expected to be $4 billion. The business model is based on the export of coal to China and third countries, with the value added increased through more domestic processing including washing and power generation. Related investments also

MONGOLIA
32 INTERNATIONAL MONETARY FUND
include a new railway that will substantially improve export potential and a new power station that will supply power to OT and also to China.
The continued development of the mining sector will have a number of important macroeconomic implications.
Growth and development. Mongolian extraction costs are among the lowest in the world, meaning that the sector should be relatively unscathed from current price falls and may benefit as marginal producers exit. And while logistics have traditionally been a challenge in this landlocked nation, transport links—especially with China—are being substantially improved, notably through the construction of a new railway. Mining exports to third countries will also benefit from recent agreement on duty-free access to Chinese ports. Over time, the intention is for more value-added processing to take place in Mongolia, creating potential for local employment growth and supporting the outlook for GDP.
Supporting the external position. Resource wealth promises prosperity in the long run, but also substantial dividends in the next five years. OT-1 brought $6 billion of investment into a $10 billion economy over just a few years, during which time Mongolia was one of the world’s fastest growing economies. That first phase went into production last year and led to a 30 percent y/y increase in mining exports. OT-2 would bring in another $5 billion in FDI over the next few years. It would start production within a few years, and even on conservative projections, mineral exports would increase by another 25 percent.
Strong mining prospects imply a fairly rapid improvement in fiscal and external imbalances. From 2017 to 2020, rapid growth would bring the public debt ratio down sharply, from 92½ percent of GDP to 80 percent. While loans to Rio Tinto would have to be repaid, the fiscal balance could possibly move toward surplus and facilitate the accumulation of wealth for future generations in a planned sovereign wealth fund. The current account deficit is projected to narrow to just 6 percent of GDP in 2020, and pressure on reserves would steadily disappear. While this outlook would be less favorable if OT-2 remains undeveloped, macroeconomic imbalances would still be reduced substantially.
An important implication is that the national balance sheet will be strengthened as these resources are extracted. While Mongolia presently faces an acute liquidity problem, accompanied by sovereign stress, it is solvent given the strong projected revenues from mining over the long term. Assuming the commencement of the large projects in 2015, the impact on GDP growth and external accounts will allow debt to start to decline sharply after 2017. (And even without OT-2, debt would still decline from 2018, albeit more slowly.)

MONGOLIA
INTERNATIONAL MONETARY FUND 33
Annex II. External Sector and Exchange Rate Assessment Mongolia’s external position is weaker than desirable, and the togrog overvalued by 10 - 15 percent.
Balance of Payments, Exchange Rate Movements, and Reserve Adequacy
The balance of payments has continued to face pressure. Despite substantial borrowing from abroad, GIR fell from 4 months of imports at end-2013 to around 2 months at end-February 2015.
The nominal exchange rate depreciated by 14 percent in 2014, and while the REER initially depreciated somewhat, it later appreciated strongly, reflecting still high inflation and the BOM’s FX intervention.
By almost all indicators, gross reserves are too low—below the traditional 3-months-of-imports benchmark, below the “Greenspan-Guidotti” rule suggesting 100 percent coverage of short-term debt, and only just above 20 percent of broad money. And according to the IMF’s risk-based metric, the optimal range of reserves is 4½ to 7 months of import cover.1
Estimate of Current Account Gap and Exchange Rate Misalignment
Methodology. This assessment adopts the External Balance Assessment-lite (EBA-lite) approach for frontier economies in addition to the External Sustainability (ES) and Equilibrium Real Exchange Rate (ERER) approaches in the CGER framework. The EBA-lite methodology has been developed as a successor to the macro balance approach used under CGER. One key difference is that EBA-lite makes a sharper distinction between a positive (descriptive) understanding of current accounts and real exchange rates and normative evaluations. Another is that EBA-lite takes into account a much broader set of factors—including policies, cyclical conditions, and global capital market conditions—that may influence the current account and real exchange rate. As before, the ES approach measures the exchange rate adjustment needed to sustain a certain level of net foreign assets of the economy; the ERER approach is based on empirical studies of the exchange rate that would be consistent with the economy’s productivity, fiscal soundness, external position, and other factors.
Result. According to the EBA-lite approach, Mongolia’s current account deficit is 4 percent of GDP above the level consistent with desirable policies. This implies overvaluation of 11 percent. The External Sustainability approach points to a current account gap of 6 percent, indicating real overvaluation of 13 percent. The ERER approach implies an overvaluation of 14 percent.
1 For Mongolia, one should arguably focus only on non-mining imports (half the total), as mining imports come with their own FDI financing. From this perspective, the optimal range would be 2¼ to 3½ months of total imports, but being high in that range is advisable given the volatility of the mining sector, the extent of deposit dollarization, and the need to boost market confidence to facilitate debt rollovers in 2017/18
ApproachCurrent account gap
(percent of GDP) Overvaluation (in percent) Real exchange rate elasticities
EBA-Lite 4% 11% 0.4
External Sustainability 6% 13% 0.4
Equilibrium Real Exchange Rate -- 14% --
Source: IMF estimates
Estimates of Togrog Overvaluation
0.0
1.0
2.0
3.0
4.0
5.0
6.0
7.0
8.0
3 month of imports 20% of Broad money 100% of Short-term debt 100-150% of Risk Metric
Reserves Adequacy Under Different Approaches (In months of imports)
Risk Metric-based Optimal Range
Implied GIR
Actual GIR

MONGOLIA
34 INTERNATIONAL MONETARY FUND
Annex III. Development Bank of Mongolia
The Development Bank of Mongolia (DBM) was established in 2011 as a state-owned, for-profit legal entity with the specific functions of conducting activities aimed at financing major projects and programs for the long-term development of Mongolia. One of the stated rationales is that domestic commercial banks have relatively high financing cost and their small sizes impose limits on the maximum amount of loans that can be granted to any single project. Financing. Nearly all DBM financing is either directly provided by the government or obtained through external borrowings that are fully guaranteed by the government. In addition to its equity contribution, the government has also transferred the proceeds of the 2012 sovereign “Chinggis bond” to finance DBM operations. Though DBM hopes to borrow in the future on the strength of its own balance sheet, so far all of its bond issuances and loans have been government guaranteed. This includes the $580 million DBM bond in 2012, the JPY 30 billion samurai bond in 2013, a $162 million loan from China Development Bank, and a $300 million syndicated loan from Credit Suisse in 2014. Spending. DBM broadly classifies its projects into two groups: those that are repayable from the state budget (i.e., non-commercial projects), and those that are self-financing, or commercial. The non-commercial projects include roads and other infrastructure and are implemented through line ministries, while the commercial projects include power plants, railway, aviation, housing finance, mining, housing construction, agriculture, light industry, and construction materials. The relative share of these two types of projects varies by year: in 2013, commercial projects accounted for around one-third of the total DBM spending; the share increased to nearly 60 percent in 2014; and it is expected to decline again, to less than half, in 2015. The projects DBM undertakes typically require parliament and government approval, and there is no clear link between the sources of financing and the types of projects. Statistical treatment. International statistical manuals (GFSM 2014, SNA 2008 and BPM6), suggest an “institutional unit” approach under which all activities of an institutional unit should be allocated to one and only one institutional sector. In this case, all activities of DBM should be included in the (general) government sector since the majority of its activities are non-commercial/government in nature. In limited circumstances, international statistical manuals allow for commercial or market activities of general government units to be split out, but such “quasi-corporations” should be well defined units themselves, with separate accounts, separate management, and full autonomy of operation. The current commercial activities of DBM clearly do not satisfy these conditions.

MONGOLIA
INTERNATIONAL MONETARY FUND 35
Annex IV. Risk Assessment Matrix1
Sources of Risks Likelihood Potential Impact Recommendation
External
A surge in financial volatility
H H: If markets reassess Mongolia’s sovereign risk, filling the large external financing gap will be more challenging, and banking-sector funding and liquidity pressure could increase.
Maintain exchange rate flexibility and tighten macro policies; improve investment climate to attract FDI.
Sharp growth slowdown and financial risks in China
L-M H: Exports could decline further, intensifying BOP pressure and fiscal revenue shortfalls.
Medium term: maintain exchange rate flexibility to preserve FX reserves; tighten macro policies. Long term: build resilience against external shocks; realize inclusive growth via diversification of the economy.
Domestic Further delay in OT-2 H H: A delay in OT-2 would weaken
growth prospects and worsen external and fiscal balances.
Run prudent macroeconomic policies; redouble efforts to improve investment climate and move ahead with other projects.
Accommodative fiscal policy
H H: Loose fiscal policy could further intensify BOP pressure and add to debt burdens.
Undertake fiscal consolidation in line with goals of the FSL.
Loose monetary policy M-H H: Loose monetary policy could worsen BOP pressure and raise banking-sector risks.
Monetary policy should be tightened further and the BOM’s unconventional easing programs discontinued.
Elevated banking fragilities H H: The buildup of credit and liquidity risks undermines financial stability, which in turn threatens macroeconomic stability.
Enhance provisions and capital; strengthen supervisory framework; phase out forbearance.
Uncertain business climate M-H H: The uncertain environment could impede FDI inflows and further weigh on investors’ confidence.
Improve business climate, clarify tax issues, and enhance transparency.
1 The Risk Assessment Matrix (RAM) shows events that could materially alter the baseline path (the scenario most likely to materialize, in the view of IMF staff). The relative likelihood of risks listed is the staff’s subjective assessment of the risks surrounding the baseline (“low” is meant to indicate a probability below 10 percent, “medium” a probability between 10 and 30 percent, and “high” a probability of 30 percent or more). The RAM reflects staff views on the source of risks and overall level of concern as of the time of discussions with the authorities. Non-mutually-exclusive risks may interact and materialize jointly.

MONGOLIA
36 INTERNATIONAL MONETARY FUND
Annex V. Implementation of Past IMF Recommendations
The authorities have agreed on the need for policy adjustment and responded to some of the recommendations made in past Article IV consultations.
Key recommendation Implementation Fiscal Policy Tighten fiscal policy so as to bring deficit gradually down to FSL limit.
The authorities targeted to keep the on-budget deficit below the FSL limit, but off-budget spending by DBM has been large. They recently brought DBM’s noncommercial spending onto the budget, and aim to reduce the deficit to 2 percent of GDP by 2018.
Maintain the long-term debt limit of 40 percent of GDP and gradually bring debt ratio down to this level.
The authorities amended FSL and passed a new Debt Management Law (DML), loosening the definition of debt, temporarily raising debt limit, and setting a downward debt trajectory towards the original limit.
Monetary Policy Phase out unconventional easing programs at the BOM.
The BOM phased out its deposits at commercial banks and scaled back PSP lending. It plans to continue implementing the mortgage program, though at a slower rate. Meanwhile, the BOM introduced a program to provide financial support at the request of commercial banks for their corporate clients in late 2014.
Tighten monetary policy BOM raised the policy rate twice in the past six months and, as noted above, committed to slowing its easing programs.
Maintain exchange rate flexibility The nominal exchange rate depreciated by 14 percent in 2014, though the REER appreciated strongly in late 2014, reflecting still high inflation and the BOM’s FX intervention.
Financial Policy
Strengthen bank supervision, restrict FX loans to unhedged borrowers, and increase loan provisions.
Fund TA on bank supervision provided specific recommendations on bank supervision, which the BOM welcomed. The BOM raised risk weights for FX loans in 2014 and introduced a definition of “hedged” borrowers for prudential purposes. BOM also introduced a 1 percent general provision for newly issued performing loans.

MONGOLIA
INTERNATIONAL MONETARY FUND 37
Annex VI. Summaries of Background Analytical Work A. Analyzing Alternative Fiscal Paths for Mongolia1
This paper uses a simple spreadsheet-based approach to analyze different long-term fiscal paths for Mongolia and shed light on the country’s appropriate deficit and debt targets. It concludes that the country should be running small surpluses and that there is no justification to adjust the FSL’s targets on a permanent basis.
1. There has been considerable public debate about the right fiscal targets for Mongolia. Short-term balance of payment pressures clearly suggests the need for consolidation, and good budgetary practice suggests that DBM spending should be brought on budget. But should the consolidated deficit be brought down to the FSL’s target of 2 percent of GDP, or is this too tight to permit needed infrastructure investment? Also under debate is the appropriate debt limit—is the FSL’s threshold of 40 percent of GDP too restrictive?
2. This paper applies some basic fiscal concepts for resource-rich economies. The permanent-income hypothesis (PIH) would suggest that revenues from exhaustible resources be shared equally with future generations, either in terms of constant dollars per capita, or in terms of a share of nonmineral GDP. But with current generations poorer than future ones, and thus likely to have a higher marginal utility of consumption, a modified PIH (MPIH) framework, which allows some frontloading of consumption and then a payback period of larger fiscal surpluses later, may be more attractive. It is also possible to take a broader perspective, and instead of focusing solely on the consumption-savings decision, to also consider the possibility of investment. Under the so-called “Fiscal Stability Framework” (FSF), spending can be frontloaded to develop infrastructure, and depending on the rate-of-return, the extent to which future fiscal surpluses are needed can be reduced or eliminated, without compromising future generations’ welfare. The paper simulates fiscal paths for Mongolia under these three different frameworks using a spreadsheet template developed in conjunction with the 2012 Board papers on resource-rich developing countries.2
3. Under reasonable parameter values, the PIH prescribes that Mongolia should currently be running a small fiscal surplus. Table A1 summarizes a sensitivity analysis showing the appropriate fiscal balance for different assumptions about the value of Mongolia’s mineral wealth, the rate at which minerals prices rise, and the government’s tax take from the sector. As shown in the highlighted row, if mineral wealth is $1½ trillion, prices grow at 3 percent (broadly in line with historical averages), and the government earns 20 percent of exports in taxes, then delivering an equal share of nonmineral GDP to all generations would require a primary surplus this year of nearly 5 percent of GDP. This translates to an overall surplus of 2 percent of GDP. Even if the most optimistic parameters are chosen (wealth of $3 trillion, price growth of 5 percent, and a revenue take of 25 percent), the overall deficit should be no more than 3 percent of GDP. According to this analysis,
1 Summarizes a paper under preparation by Baoping Shang (FAD) and Koshy Mathai (APD). 2 “Macroeconomic Policy Frameworks in Resource-Rich Developing Countries,” IMF Policy Paper, Aug 24, 2012. Also, “Fiscal Regimes for Extractive Industries: Design and Implementation,” IMF Policy Paper, Aug 15, 2012.

MONGOLIA
38 INTERNATIONAL MONETARY FUND
Mongolia’s current consolidated deficit of 10 percent of GDP is far out of line, and, most likely, even the 2 percent of GDP deficit allowed by the FSL is too large.
4. An appeal to the MPIH framework does not change the conclusion that Mongolia’s fiscal stance is currently too loose. The top-right chart in Figure A1 presents alternative paths for the overall fiscal balance over time. While the PIH requires a surplus for the next fifty years or so (when resource revenues are strong) and a deficit only thereafter, it is possible to construct an MPIH path that features the 10 percent deficits that are currently observed; however, as shown in Figure A1, to allow such frontloaded consumption, the next generation would need to run substantially tighter fiscal policy to compensate—an unrealistic intergenerational social contract.
5. Neither does the conclusion change under the FSF framework. Observed deficits stem largely from heavy infrastructure spending, rather than from handouts/consumption. If spending is indeed devoted to investment, then no future payback period is needed under the FSF paths, and indeed, lifetime wealth is higher. However, even if it is assumed that the return on investment for infrastructure projects that are properly selected and managed could reach 25 percent in Mongolia, reflecting its pressing infrastructure needs, constraints on both absorptive capacity and capacity to borrow would substantially lower this return when spending is as high as observed in the past few years. As a result, an FSF path with more moderate frontloading is shown to deliver similar consumption (primary, current expenditure) but higher wealth for every generation.
6. Finally, even if there were a justification for temporarily running large deficits, permanent FSL limits should not be adjusted. As shown in Figure A1, while certain constellations of parameters may support a path of heavy upfront investment, it would soon be expected that the fiscal balance would turn to substantial surplus, permitting the buildup of a large sovereign wealth fund. In other words, the fiscal deficit will naturally evolve over the lifecycle of the mines. The FSL, however, sets a single deficit limit for every year. This should not be loosened for all years just to permit a (hopefully) short-lived increase in deficits. Similarly, there appears to be little justification for raising the gross debt limit of 40 percent of GDP. As wealth is accumulated, there may still be a need for some gross debt, in order to allow fiscal maneuverability, but this would presumably be a small amount.

MONGOLIA
INTERNATIONAL MONETARY FUND 39
Table A1. Fiscal Balances Under PIH
Total
resources at
current
prices
Mineral price
growth rate
(percent)
Government
revenue share
(percent)
Implied non-mineral
primary balance
(percent of non-
mineral GDP)
Implied 2015
primary balance
(percent of GDP)
Implied 2015 non-
mineral primary
balance (percent of
non-mineral GDP)
Implied 2015
primary balance
(percent of GDP)
$ 3 tri l l ion 5 25 -12.0 0.0 -38.0 -21.0
$ 3 tri l l ion 5 20 -9.6 0.0 -30.4 -16.8
$ 3 tri l l ion 5 15 -7.2 0.0 -22.8 -12.6
$ 3 tri l l ion 3 25 -6.3 4.4 -20.1 -6.8
$ 3 tri l l ion 3 20 -5.1 3.5 -16.1 -5.4
$ 3 tri l l ion 3 15 -3.8 2.6 -12.1 -4.1
$ 3 tri l l ion 1 25 -3.8 6.3 -12.3 -0.5
$ 3 tri l l ion 1 20 -3.1 5.0 -9.7 -0.4
$ 3 tri l l ion 1 15 -2.3 3.8 -7.3 -0.3
$1.5 tri l l ion 5 25 -6.7 4.0 -21.4 -7.9
$1.5 tri l l ion 5 20 -5.4 3.2 -17.1 -6.3
$1.5 tri l l ion 5 15 -4.1 2.4 -12.8 -4.7
$1.5 tri l l ion 3 25 -3.9 6.2 -12.3 -0.7
$1.5 tri l l ion 3 20 -3.2 4.9 -9.8 -0.6
$1.5 tri l l ion 3 15 -2.3 3.7 -7.4 -0.4
$1.5 tri l l ion 1 25 -2.5 7.1 -8.0 2.6
$1.5 tri l l ion 1 20 -2.0 5.7 -6.4 2.1
$1.5 tri l l ion 1 15 -1.5 4.3 -4.8 1.6
$1.0 tri l l ion 5 25 -4.9 5.3 -15.5 -3.3
$1.0 tri l l ion 5 20 -3.9 4.3 -12.4 -2.7
$1.0 tri l l ion 5 15 -2.9 3.2 -9.3 -2.0
$1.0 tri l l ion 3 25 -3.0 6.8 -9.4 1.5
$1.0 tri l l ion 3 20 -2.4 5.4 -7.5 1.2
$1.0 tri l l ion 3 15 -1.8 4.1 -5.6 0.9
$1.0 tri l l ion 1 25 -2.0 7.4 -6.4 3.8
$1.0 tri l l ion 1 20 -1.6 5.9 -5.1 3.0
$1.0 tri l l ion 1 15 -1.2 4.4 -3.8 2.3
Source: IMF staff calculations.
Equal share of non-mineral GDP Equal amount per capita in real terms

MONGOLIA
40 INTERNATIONAL MONETARY FUND
-15
-10
-5
0
5
10
15
PIH perpetuity
Modified PIH perpetuity
FSF-aggressive investment path
FSF-moderate investment path
Overall balance(Percent of GDP)
Sources: IMF staff calculations.
-14
-12
-10
-8
-6
-4
-2
0
2
4
PIH perpetuityModified PIH perpetuityFSF-aggressive investment pathFSF-moderate investment path
Non-mineral primary balance(Percent non-resource GDP)
Sources: IMF staff calculations.
1012141618202224262830
PIH perpetuityModified PHI perpetuityFSF-aggressive investment pathFSF-moderate investment path
Primary current expenditure(Percent of GDP under PIH)
Sources: IMF staff calculations.
02468
101214161820
PIH perpetuityModified PHI perpetuityFSF-aggressive investment pathFSF-moderate investment path
Interest payment from new borrowing(Percent of GDP under PIH)
Sources: IMF staff calculations.
-150-100-50
050
100150200250300350
PIH perpetuityMPIH PerpetuityFSF-aggressive investment pathFSF-moderate investment path
Cumulative financial savings/debt (Percent of GDP under PIH)
Sources: IMF staff calculations.
-200
-100
0
100
200
300
400
500 PIH perpetuityMPIH PerpetuityFSF-aggressive investment pathFSF-moderate investment path
Cumulative financial savings/debt (holding FSF primary expenditure the same beyond the scaling up period (Percent of GDP under PIH)
Sources: IMF staff calculations.
Figure A1. Mongolia: Sustainability Assessment Indicators

MONGOLIA
INTERNATIONAL MONETARY FUND 41
B. A Sustainable Public Investment Path for Mongolia: A Model-Based Analysis3
This paper complements the first by looking at optimal fiscal paths, but using an entirely different methodology. Rather than a spreadsheet-based analysis focused on fiscal variables alone, this paper offers results from a DSGE model tailored to resource-rich economies. This permits an investigation of the implications of different fiscal policies for key fiscal and non-fiscal variables such as debt, consumption, investment, and the real exchange rate. This paper also finds that fiscal consolidation is needed and that the FSL limits should not be adjusted. 7. This paper adopts a structural model-based analysis to help assess policy decisions regarding the management of natural resources in Mongolia. The study uses a dynamic stochastic general equilibrium (DSGE) model with natural resource wealth in a small open economy. The model combines elements of frameworks developed in Araujo et al. (2013), Buffie et al. (2012), Berg et al. (2013), and Melina et al. (2013), in analyzing natural resource management for developing countries. The DIGNAR toolkit is used to analyze various public investment plans in Mongolia. The model captures the investment-growth nexus as well as investment efficiencies and absorptive capacity constraints.4 It thus helps to inform the authorities about the tradeoffs involved in investing resource revenues to boost growth while maintaining fiscal sustainability and macroeconomic stability.
8. The model captures the key features of resource-rich developing countries and is carefully tailored to Mongolia’s particular circumstances. It features two types of households, including poor households with no access to financial markets, and includes traded and non-traded sectors as well as a natural-resource sector. Public capital, subject to inefficiencies and absorptive capacity constraints, enters production functions in both the traded and non-traded sectors. The government has access to different types of debt (concessional, domestic, and external commercial) and a resource fund, which can be used to finance public investment plans. The resource fund can also serve as a buffer to absorb fluctuations of fiscal balances for given projections of resource revenues and public investment plans. Fiscal adjustments through tax rates and government non-capital expenditures—which may be constrained by ceilings and floors, respectively—may be triggered to maintain debt sustainability. The model is calibrated using historical data for Mongolia and parameters widely accepted in the literature.
9. The model is estimated under two different public investment paths. Under a fiscal consolidation path, the government restrains public investment so as to manage the debt. The aggressive investment path, by contrast, maintains currently observed investment levels to develop infrastructure and boost growth.
10. Since uncertainty and volatility are intrinsic to resource economies, the public investment paths are each analyzed under a baseline scenario and an adverse scenario.
3 Summarizes “From Natural Resource Boom to Sustainable Economic Growth: Lessons for Mongolia,” forthcoming IMF working paper, prepared by Pranav Gupta, Grace Bin Li (both RES), and Jiangyan Yu (APD). 4 The model includes only real variables and cannot be used to analyze monetary policy or inflation.

MONGOLIA
42 INTERNATIONAL MONETARY FUND
Baseline scenario: Copper mining production is estimated to increase from 0.2 million tons in 2013 to around 1 million tons by 2020, when the second phase of OT goes into production. It is also assumed that political constraints make it impossible to increase consumption or labor taxes, and the government thus relies on external commercial borrowing.
Adverse scenario: Resource revenues are hit by a negative shock—e.g., a further delay in OT-2, or a drop in copper prices similar to that observed in 2009.
11. As shown in Figure A2, the aggressive investment path substantially increases fiscal risk. While it yields faster growth than under fiscal consolidation, it also implies that public debt—and external, commercial debt in particular—rises substantially. And the situation is even worse if the adverse scenario obtains. Finally, rapid investment will quickly lead to investment inefficiencies (poor planning, higher-than-expected costs, bad governance, supply bottlenecks, lack of complementary infrastructure, etc.), further underscoring the need for fiscal restraint.
12. The aggressive investment path would also put pressure on the external sector. As shown in Figure A3, the togrog is currently overvalued and should be allowed to depreciate. Aggressive government investment would lead to overheating, bid up the relative price of nontradables, widen the current account deficit, and impede the pace of the required real depreciation.
13. In sum, a DSGE-model-based analysis confirms earlier findings that frontloaded fiscal consolidation is needed. The analysis in this paper stresses the benefits of adopting a comprehensive approach to enhancing absorptive capacity, managing natural resource wealth in a way that avoids Dutch disease, and sustaining the longer-term diversification of growth. In Mongolia, given the nontrivial role of the natural resources sector, it is particularly important to look beyond traditional metrics of investment pace. While the ambitious scaling up of public investment can generate higher non-mineral growth, it can also pose substantial challenges to debt sustainability and macroeconomic stability.

MONGOLIA
INTERNATIONAL MONETARY FUND 43
Figure A2: Resource Output, Revenues, and Fiscal Variables Left column: Baseline Scenario; Right column: Adverse Scenario)
14 16 18 20 22 245
10
15
20Pub. inv. (% of GDP)
14 16 18 20 22 245
10
15
20Pub. inv. (% of GDP)
14 16 18 20 22 2440
60
80
100Total public debt (% of GDP)
14 16 18 20 22 2450
60
70
80
90
100Total public debt (% of GDP)
14 16 18 20 22 2420
40
60
80External commercial debt (% of GDP)
14 16 18 20 22 2420
40
60
80External commercial debt (% of GDP)
14 16 18 20 22 240
5
10
15
20
25Stabilization fund (% of GDP)
14 16 18 20 22 240
5
10
15
20
25Stabilization fund (% of GDP)
Fiscal Consolidation High Investment Level

MONGOLIA
44 INTERNATIONAL MONETARY FUND
Figure A3: Fiscal and External Variables, and Growth
(Left column: Baseline Scenario; Right column: Adverse Scenario)
14 16 18 20 22 2460
65
70Pub invest. efficiency (%)
14 16 18 20 22 2460
65
70Pub invest. eff iciency (%)
14 16 18 20 22 24
20
40
60
80
100Public capital (% from SS)
14 16 18 20 22 24
20
40
60
80
100Public capital (% from SS)
Fiscal Consolidation High Investment Level
14 16 18 20 22 24-15
-10
-5
0
5Real exchange rate (% from SS)
14 16 18 20 22 24-15
-10
-5
0
5Real exchange rate (% from SS)
14 16 18 20 22 240
2
4
6Additional Current Account Deficit (% of GDP
14 16 18 20 22 240
2
4
6Additional Current Account Deficit (% of GDP

MONGOLIA
INTERNATIONAL MONETARY FUND 45
C. Mongolia—Risks of Rapid Credit Growth5
This paper uses techniques from the literature to conclude that Mongolia experienced a potentially harmful credit boom in 2013.
14. Mongolia has seen strong credit growth in 2011-2013. Credit grew by an average of 50 percent per year during 2011–13. In 2013, the strong growth was driven mostly by construction and real-estate loans, largely as a result of the central bank’s easing programs. This led the banking sector’s loan-to-deposit ratio to rise to 123 percent and the credit-to-GDP ratio to 57 percent in 2013. In 2014, credit growth decelerated, but the credit-GDP ratio rose further to 61 percent.
15. This paper analyzes whether the strong credit growth constitutes “a bad credit boom” and discusses the risks of such a boom.6 The paper takes a three-step approach. It first assesses the medium-term trend of credit, using various filtering techniques.7 The second step is to calculate the “credit gap” obtaining from the difference between the actual credit and the medium term trend. Finally, it looks at whether the credit could represent a “bad” credit boom by estimating credit gap with respect to certain threshold.8 The paper also uses the direct approach found in Dell’Ariccia and others (2012), where a 20 percent annual increase in the credit-to-GDP ratio is taken as the threshold of natural credit increase.
16. The estimation concludes that Mongolia experienced harmful credit booms in 2011 and 2013. In 2013, credit exceeded its threshold in all methodologies, with equilibrium credit in 2013 estimated at around 50 to 55 percent of GDP. Similarly, Mongolia experienced a credit boom in 2011 of about 3 to 5 percent of GDP higher than the appropriate levels. In 2014, credit (including mortgage-backed securities) remained above the threshold level.
5 Prepared by Firman Mochtar (APD). 6 Given cross country data availability, the panel estimation employs the 2000–13 data series. 7 One method is to use a rolling Hodrick-Prescott (HP) filter to find the potential and long-term credit-GDP trend (as applied by BIS (2010), Borio and Lowe (2002), Borio and Drehman (2009) as well as Hilbers and others (2006)). A second method follows Mendoza and Terrones (2008), who also applied the HP filter, but using the whole sample period rather than a rolling sample period. The third method (backward-looking, rolling, and cubic trend) is taken from Dell’Ariccia and others (2012). Finally, Gersl and Seidler (2011) use economic fundamentals to estimate the equilibrium credit-GDP ratio. 8 Gersl and Seidler (2001) and BIS (2010) use the absolute credit gap about 2 percent of GDP as threshold, while Borio and Lowe (2002) use 4 percent of GDP. Others use relative credit gap to its long term trend and set 5 percent as the threshold credit gap (see Gourinchas and others, 2001 and Hilbers and others, 2005).
-50
0
50
100
150
200
0
10
20
30
40
50
60
70
1992
1994
1996
1998
2000
2002
2004
2006
2008
2010
2012
2014
Growth Credit to GDP (RHS)
Sources: Mongolian Authority
Mongolia: Credit to Private Sector(In percent)

MONGOLIA
46 INTERNATIONAL MONETARY FUND
Table A2: Mongolia's Credit Gap and the Sign of Bad Boom across Method (% to GDP)
17. The Mongolian credit boom in 2013 was higher than in other peer countries in the region. Cross country data show that the Mongolian credit gap in 2013 was bigger than those of other countries in the region. The finding remains relevant when the credit gap is compared to historical levels of peer income countries in the region, except Indonesia and Lao PDR (Figure 3).
2000 2001 2002 2003 2004 2005 2006 2007 2008 2009 2010 2011 2012 2013
Ad hoc threshold 1/ -6.8 46.1 48.8 60.3 7.3 7.8 9.1 38.5 -3.4 0.6 -4.9 30.8 -1.3 22.6
Backward-looking, rolling, cubic trend 2/ - Absolute threshold 2 percent 4/ 0.0 0.9 1.2 1.8 -1.3 -2.4 -2.4 1.5 -2.8 -3.6 -4.2 2.9 0.0 4.8
- Absolute threshold 4 percent 5/ 0.0 0.9 1.2 1.8 -1.3 -2.4 -2.4 1.5 -2.8 -3.6 -4.2 2.9 0.0 4.8
- Relative treshold 5 percent 6/ -0.1 10.3 8.9 8.0 -4.9 -7.9 -7.2 3.6 -6.5 -8.0 -9.7 6.0 0.0 8.4
Hodrick Prescott Filter over entire series 3/ - Absolute threshold 2 percent 4/ -5.5 -4.6 -2.4 3.7 2.1 0.6 -0.4 7.6 2.5 -0.9 -6.6 1.6 -2.9 4.5
- Absolute threshold 4 percent 5/ -5.5 -4.6 -2.4 3.7 2.1 0.6 -0.4 7.6 2.5 -0.9 -6.6 1.6 -2.9 4.5
- Relative treshold 5 percent 6/ -44.4 -31.2 -13.5 17.8 8.8 2.2 -1.4 22.1 6.7 -2.1 -14.5 3.2 -5.5 7.9
Hodrick Prescott Filter Rolling/Recursive 7/ - Absolute threshold 2 percent 4/ -0.6 2.7 5.0 8.6 5.6 3.4 2.1 7.0 1.1 -1.7 -4.7 2.6 -1.0 4.5
- Absolute threshold 4 percent 5/ -0.6 2.7 5.0 8.6 5.6 3.4 2.1 7.0 1.1 -1.7 -4.7 2.6 -1.0 4.5
- Relative treshold 5 percent 6/ -8.2 37.2 48.9 55.4 27.6 14.0 7.4 19.7 2.7 -3.9 -10.8 5.4 -1.9 7.9
Structural Panel 8/ - Absolute threshold 2 percent 4/ -10.1 -8.9 -5.3 -0.2 0.4 -0.5 -2.6 4.6 -0.7 2.6 -2.0 4.9 4.5 13.2
- Absolute threshold 4 percent 5/ -10.1 -8.9 -5.3 -0.2 0.4 -0.5 -2.6 4.6 -0.7 2.6 -2.0 4.9 4.5 13.2
- Relative treshold 5 percent 6/ -59.2 -46.7 -26.0 -0.7 1.8 -1.7 -8.0 12.1 -1.7 6.9 -4.8 10.7 9.8 27.2
Notes:
Credit boom by definition = Good = Bad
1/ Boom if credit to GDP ratio increase by more than 20 percent, in Dell'Aricia and others (2012).2/ The deviation from trend is greater than 1.5 time standard deviation and annual growth credit exceeds 10% in Dell'Aricia and others (2012) 3/ Mendoza and Terrones (2008)4/ Gourinchas and others (2001) and BIS (2010)5/ Borio and Lowe (2002)6/ Relative to its trend, in Gourinchas and others (2001) and Hilbers and others (2005)7/ Borio and Lowe (2002), Borio and Drehman (2009), Hilbers and others (2006), and BIS (2010)8/ Gersl and Seidler (2001)
Source: IMF Staff estimate
Lao
MyanmarMongolia
Cambodia
Srilanka
Vietnam
Nepal
Bangladesh
Phillipines
Indonesia
India
-15
-10
-5
0
5
10
0 20 40 60 80 100 120Credit
Cre
dit
Gap
International Comparison: 2013 Credit Gap vs Credit (In percent to GDP-Gap using HP Filter Rolling method)
Source: IMF staff estimates
Laos PDR (2009-2013)
Myanmar (2009-2013)
Srilanka (2005-2010)
Cambodia (2009-2013)
Phillipines (2007-2013)
Indonesia (2007-2013)
China (2004-2007)
Malaysia (1987-1990)
India (2011-2013)
Korea (1982-1986)
Mongolia 2013
-8
-6
-4
-2
0
2
4
6
8
0 20 40 60 80 100 120 140
Credit to GDP
Cre
dit G
ap
Historical Comparison : Credit Gap vs Credit(In percent to GDP-Gap using HP Filter Rolling method)
Sources: IMF Staff estimate

MONGOLIA
INTERNATIONAL MONETARY FUND 47
18. Many empirical papers conclude that excessive credit is harmful. Credit booms can propagate excessive demand, generate economic overheating, and trigger asset price bubbles. Such unfavorable developments would reduce domestic competiveness, widen external imbalances, and foster depreciation. Rapid credit growth also raises banking and broader financial-sector vulnerabilities, given the typical deterioration of asset quality. This early warning seems relevant to the FSI data – Mongolia’s credit quality has started to deteriorate since mid of 2013; and liquidity has tightened as reflected in the decreasing liquid asset ratio.
19. Various country experiences also show that prolonged credit booms can lead to banking crises and substantial output losses. Laeven and Valencia (2013) documented the impact of banking crises on output, debt, and asset quality. Hilbers and others (2005) pointed out that the cost of a credit boom to the economy will depend on the nature of credit, the rate of credit growth, the main providers of credit, the main borrowers, the sectoral loan composition, the currency composition of loans, and the maturity of loans.
Table A3: Banking Crises’ Outcomes, 1970–2011
Country Output Loss
(% GDP)
Increase in Public
Debt (% GDP)
Fiscal Cost
(% GDP)
Peak NPLs
(% of total loans)
All 23.2 12.1 6.8 25.0
Advance 32.4 23.6 4.2 5.0
Emerging 33.6 9.1 8.3 29.5
Developing 0.7 10.9 10.0 35.0
Source: Hilbers, Otker-Robe, Pazarbabosioglu, and Johnsen (2005)
20. The policy implications are clear: credit should be managed properly to sustain the economy without risking a crisis. Among others, Dell’Ariccia and others (2012) summarize the major policy recommendations to deal with credit booms. These include fiscal, monetary, and macroprudential tools. Policy coordination across different authorities and across borders may also need to be strengthened.
10
15
20
25
30
35
1.5
1.7
1.9
2.1
2.3
2.5
2.7
2.9
3.1
3.3
NPL Ratio Liquid Asset to Total Asset (RHS)
Mongolia: NPL and Liquid Asset to Total Asset Ratio(In percent)
Sources: Mongolian Authority
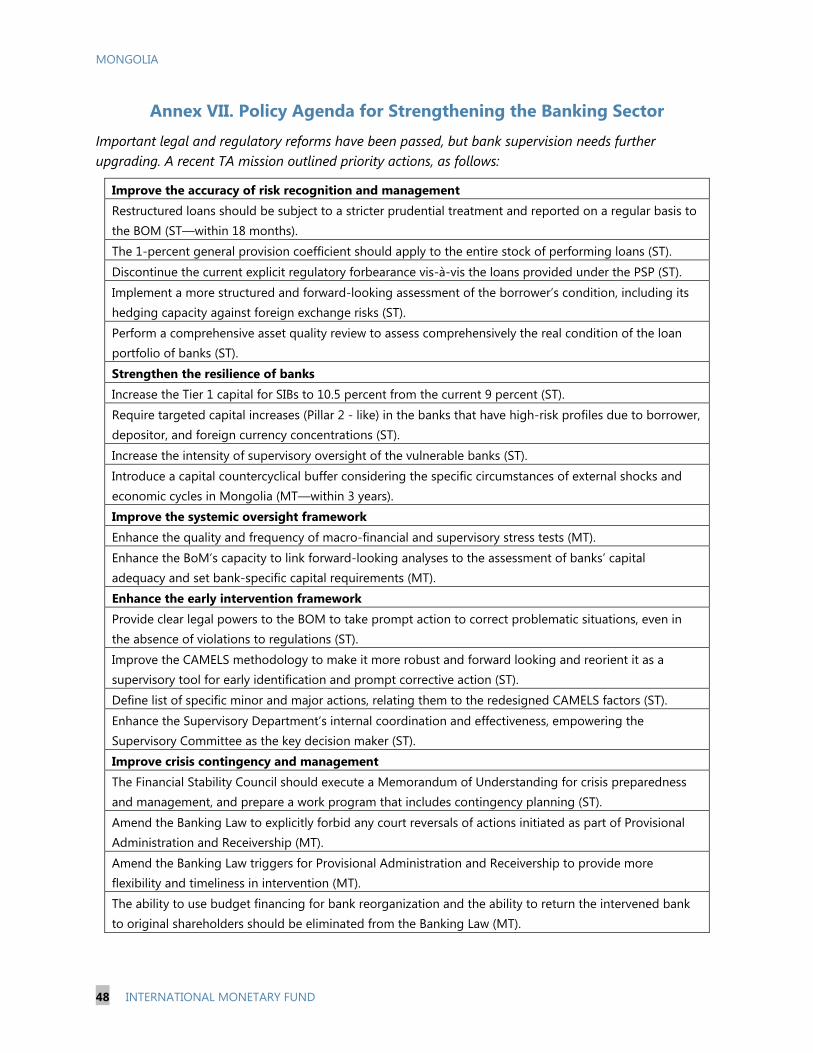
MONGOLIA
48 INTERNATIONAL MONETARY FUND
Annex VII. Policy Agenda for Strengthening the Banking Sector Important legal and regulatory reforms have been passed, but bank supervision needs further upgrading. A recent TA mission outlined priority actions, as follows:
Improve the accuracy of risk recognition and management Restructured loans should be subject to a stricter prudential treatment and reported on a regular basis to the BOM (ST—within 18 months).
The 1-percent general provision coefficient should apply to the entire stock of performing loans (ST).
Discontinue the current explicit regulatory forbearance vis-à-vis the loans provided under the PSP (ST).
Implement a more structured and forward-looking assessment of the borrower’s condition, including its hedging capacity against foreign exchange risks (ST).
Perform a comprehensive asset quality review to assess comprehensively the real condition of the loan portfolio of banks (ST).
Strengthen the resilience of banks Increase the Tier 1 capital for SIBs to 10.5 percent from the current 9 percent (ST).
Require targeted capital increases (Pillar 2 - like) in the banks that have high-risk profiles due to borrower, depositor, and foreign currency concentrations (ST).
Increase the intensity of supervisory oversight of the vulnerable banks (ST).
Introduce a capital countercyclical buffer considering the specific circumstances of external shocks and economic cycles in Mongolia (MT—within 3 years).
Improve the systemic oversight framework Enhance the quality and frequency of macro-financial and supervisory stress tests (MT).
Enhance the BoM’s capacity to link forward-looking analyses to the assessment of banks’ capital adequacy and set bank-specific capital requirements (MT). Enhance the early intervention framework Provide clear legal powers to the BOM to take prompt action to correct problematic situations, even in the absence of violations to regulations (ST).
Improve the CAMELS methodology to make it more robust and forward looking and reorient it as a supervisory tool for early identification and prompt corrective action (ST).
Define list of specific minor and major actions, relating them to the redesigned CAMELS factors (ST).
Enhance the Supervisory Department’s internal coordination and effectiveness, empowering the Supervisory Committee as the key decision maker (ST).
Improve crisis contingency and management The Financial Stability Council should execute a Memorandum of Understanding for crisis preparedness and management, and prepare a work program that includes contingency planning (ST).
Amend the Banking Law to explicitly forbid any court reversals of actions initiated as part of Provisional Administration and Receivership (MT).
Amend the Banking Law triggers for Provisional Administration and Receivership to provide more flexibility and timeliness in intervention (MT).
The ability to use budget financing for bank reorganization and the ability to return the intervened bank to original shareholders should be eliminated from the Banking Law (MT).

MONGOLIA STAFF REPORT FOR THE 2015 ARTICLE IV CONSULTATION—INFORMATIONAL ANNEX Prepared By
Asia and Pacific Department (in collaboration with other Departments)
FUND RELATIONS ________________________________________________________________________ 2
WORLD BANK-IMF COLLABORATION ___________________________________________________ 5
RELATIONS WITH THE ASIAN DEVELOPMENT BANK __________________________________ 8
STATISTICAL ISSUES ____________________________________________________________________ 11
MILLENNIUM DEVELOPMENT GOALS _________________________________________________ 14
MAIN DATA WEBSITES _________________________________________________________________ 15
CONTENTS
March 19, 2015

MONGOLIA
2 INTERNATIONAL MONETARY FUND
FUND RELATIONS (As of January 31, 2015)
Membership Status: Joined: February 14, 1991; Article VIII General Resources Account: SDR Million Percent Quota Quota 51.10 100.00
Fund Holdings of Currency 52.88 103.49 Reserve Position in Fund 0.14 0.27
SDR Department: SDR Million Percent Allocation Net cumulative allocation 48.76 100.00 Holdings 42.93 88.05 Outstanding Purchases and Loans: SDR Million Percent Quota Stand-by Arrangements 1.92 3.75
Latest Financial Arrangements: Approval Expiration Amount Approved Amount Drawn Type Date Date (SDR Million) (SDR Million) Stand-by 04/01/2009 10/01/2010 153.30 122.64 ECF 1 09/28/2001 07/31/2005 28.49 12.21 ECF 1 07/30/1997 07/29/2000 33.39 17.44 Projected Obligations to Fund (SDR Million; based on existing use of resources and present
holdings of SDRs): Forthcoming 2015 2016 2017 2018 2019 Principal 1.92 Charges/interest 0.02 0.00 0.00 0.00 0.00 Total 1.93 0.00 0.00 0.00 0.00 Safeguards Assessments:
An update safeguards assessment of the Bank of Mongolia (BOM) finalized in June 2009 found that the BOM has continued to improve its safeguards framework since the previous assessment. The BOM’s financial reporting and audit practices generally comply with international standards. The assessment made recommendations to (i) strengthen certain aspects of the BOM’s oversight mechanism, (ii) remove external audit qualifications caused by lack of access to central bank’s vaults, and (iii) improve the timeliness of audit completion and publication of the bank’s financial statements. The authorities have since confirmed that the auditors were granted access to its vaults since end-2009, and the timing of audit completion has improved.
1/ Formerly PRGF.

MONGOLIA
INTERNATIONAL MONETARY FUND 3
Exchange Arrangement:
On March 24, 2009, the BOM instituted a foreign exchange auction allowing the determination of the exchange rate mainly by market forces. The de facto and de jure exchange rate arrangements are currently both classified as floating, though the de facto exchange rate arrangement could potentially by reclassified to “crawl-like,” pending further observation. (through end-May 2015). Mongolia accepted the obligations of Article VIII, Sections 2, 3, and 4 on February 1, 1996. Mongolia maintains two multiple currency practices (MCPs) subject to Fund jurisdiction. First, the modalities of the multi-price auction system give rise to an MCP since there is no mechanism in place that ensures that exchange rates of accepted bids at the multi-price auction do not deviate by more than 2 percent. The Executive Board approved the multi-price auction MCP until June 22, 2010 (Decision No. 14365 of June 23, 2009), and it’s further extension until March 15, 2012 or the next Article IV consultation whichever is earlier (Decision No. 14669 of June 23, 2010 and Decision No. 14365 of March 16, 2011). The MCP, however, could not be resolved by March 15, 2012, and would be continued as long as the multiple price foreign exchange auction mechanism remains in place. Therefore the MCP is unapproved, and since the criteria for approval of this MCP are not in place, staff does not recommend Executive Board approval of said measure. In addition, Mongolia has an official exchange rate (reference rate) that is mandatorily used for government transactions (as opposed to the commercial market rate). Therefore, by way of official action, the authorities have created a market segmentation. While Order #699 of the BOM issued on December 3, 2010, sets forth that the reference rate is determined based on the weighted average of market rates used from 4 PM of the previous day to 4 PM of the current day, staff is of the view that this Order does not eliminate the market segmentation and the multiplicity of effective rates arising from it. Accordingly, in the absence of a mechanism to ensure that the commercial rates and the reference rate do not deviate by more than 2 percent, the way the reference rate is used in government transactions gives rise to an MCP subject to Fund approval. Since the criteria for approval of this MCP are not in place, it remains unapproved. Mongolia imposes exchange restrictions for security reasons in accordance with United Nations Security Council Resolution No. 92/757 concerning certain transactions with the Federal Republic of Yugoslavia (Serbia and Montenegro) that have been notified to the Fund under Decision 144 (11/4/94). The BOM notes that hitherto there have been no cases where exchange rates of accepted bids at the multi-price auction deviate by more than 2 percent, and plans to introduce a mechanism to ensure the deviation would never exceed 2 percent. The BOM is also working on the development of an indicative spot exchange rate.
Article IV Consultation:
The 2013 Article IV consultation (IMF Country Report No. 14/64) was concluded by the Executive Board on November 15, 2013. Mongolia is on a 12–month cycle.

MONGOLIA
4 INTERNATIONAL MONETARY FUND
ROSC Assessments:
The following ROSC assessments have been undertaken: Data Dissemination (May 2001), Fiscal Transparency Module (November 2001), Fiscal update (May 2005), Data Dissemination (April 2008), Monetary and Fiscal Policy Transparency (September 2008), Banking Supervision (September 2008).
Recent Financial Arrangements:
An 18-month Stand-by Arrangement in an amount of equivalent to SDR 153.3 million (300 percent of quota) was approved on April 1, 2009. The Executive Board successfully completed the final review on September 8, 2010.
FSAP Participation:
Mongolia participates in the Financial Sector Assessment Program (FSAP). The first, second, and third FSAP missions took place in May 2007, September 2007 and November 2010 respectively. The latest report (IMF Country Report No. 11/107) was published in May 2011.
Technical Assistance in 2014-2015:
Missions:
Medium Term Budget Framework (FAD), March 2014 and January 2015 Banking supervision (MCM), January - February 2015 External sector statistics (STA), May, June and October 2014 and February 2015 Strengthening LTO (FAD), May, June, August and September 2014 and January 2015 Treasury operations (FAD), March and October 2014 Cash management (FAD), April 2014 AML/CTF (LEG), October 2014 SDDS assessment (STA), October 2014 Price statistics (STA), October 2014
Resident Representative:
The resident representative position was discontinued in September 2011, though the office remained open, staffed by local economists, and managed remotely by a non-resident representative—most recently, Ms. Yuko Kinoshita—who was based in the IMF’s Regional Office for Asia and the Pacific in Tokyo. As of April 2014, Mr. Neil Saker will take up his assignment as resident representative based in Ulaanbaatar.

MONGOLIA
INTERNATIONAL MONETARY FUND 5
WORLD BANK-IMF COLLABORATION 1. World Bank and IMF country teams maintain a close working relationship. The teams, led by Ms. Chorching Goh (Lead Economist, GMFDR) and Mr. Koshy Mathai (Mission Chief) collaborate on a range of macroeconomic and structural issues.
2. Cooperation and coordination is exemplary. It pertains to the following:
IMF surveillance. World Bank staff participates in Policy Consultation Meetings ahead of Article IV consultation missions and comments on staff reports. World Bank staff also participates in selected meetings of the Article IV mission team with the authorities. This facilitates the discussions, especially as regards policies in areas of mutual interest such as bank restructuring, social welfare reform, and fiscal policy.
Development Policy Credits (DPC) and Country Partnership Strategy (CPS). In turn, Fund staff participated in the design and review of the Bank’s DPCs and was kept informed about the development of the Bank’s new CPS for FY13−17.
Banking system issues. Both country teams have been active in this area, including by fielding technical assistance missions. The teams coordinate closely to provide the authorities with consistent advice while avoiding unnecessary duplication of efforts. The two teams also continue to educate the public and parliamentarians on banking sector issues in an effort to build support for reforms.
Structural reforms. Staff of the IMF and the World Bank have worked together successfully to provide technical assistance in expenditure management, the Fiscal Stability Law, the Integrated Budget Law, the Social Welfare Law, the Investment Law , and taxation of the mineral sector and on-going work on the Sovereign Wealth Fund Law. Staff also actively collaborated in the first assessment of Mongolia’s PFM system using the Public Expenditure and Financial Accountability (PEFA) framework.
Policy Outreach. Both country teams jointly hosted a high-level conference on macro-economic outlook as a forum for discussing economic developments and key challenges with key policy makers.
3. Based on the close collaboration, the World Bank and the IMF share a common view about Mongolia’s macroeconomic and structural reform priorities. These include:
Promoting long-term growth. Managing the mineral wealth to ensure strong, sustainable, and equitable growth with low inflation. This includes the importance of avoiding the “resource curse” and the productive use of mineral wealth management.
Macro-economic stability. This includes ensuring that the boom-bust policies of the past are not repeated. The Fiscal Stability Law adopted in 2010 with the support of the IMF and

MONGOLIA
6 INTERNATIONAL MONETARY FUND
the World Bank is a key step, and it is critical that it be strictly adhered to from 2013, the first year the law is effective. At the same time, fiscal policy also has to be mindful of the macroeconomic policy mix and medium and long-term fiscal sustainability.
Monetary policy. The Bank of Mongolia (BOM)’s large monetary stimulus, through its so-called “price stabilization program,” mortgage program, and liquidity injection, distorts markets and is bound to ratchet up inflation. The stimulus program should be phased out and the BOM should focus on further strengthening the monetary policy framework. The flexible exchange rate regime should be maintained.
Protecting the poor. The 2012 Social Welfare Law envisages replacing existing costly universal cash transfers with means-tested benefits that would reach the poorest households. Full implementation of the law would represent a big step forward in strengthening the social safety net and increasing fiscal flexibility. Concrete action following the adoption of the law is important from a socio-economic perspective as well as a fiscal perspective.
Strengthening the banking system. Key steps include continued improvement in bank regulation and supervision, ramping up risk disclosure and management—especially given elevated systemic risks in the sector illustrated by the recent failure of Saving Bank—and strengthening the newly established Mongolian Deposit Insurance Corporation.
4. The teams agreed to continue the close cooperation going forward. Table 1 details the specific activities planned by the two country teams along with their expected deliveries. It was also agreed that further details on collaboration, as necessary, would be agreed at the technical level as work progresses.
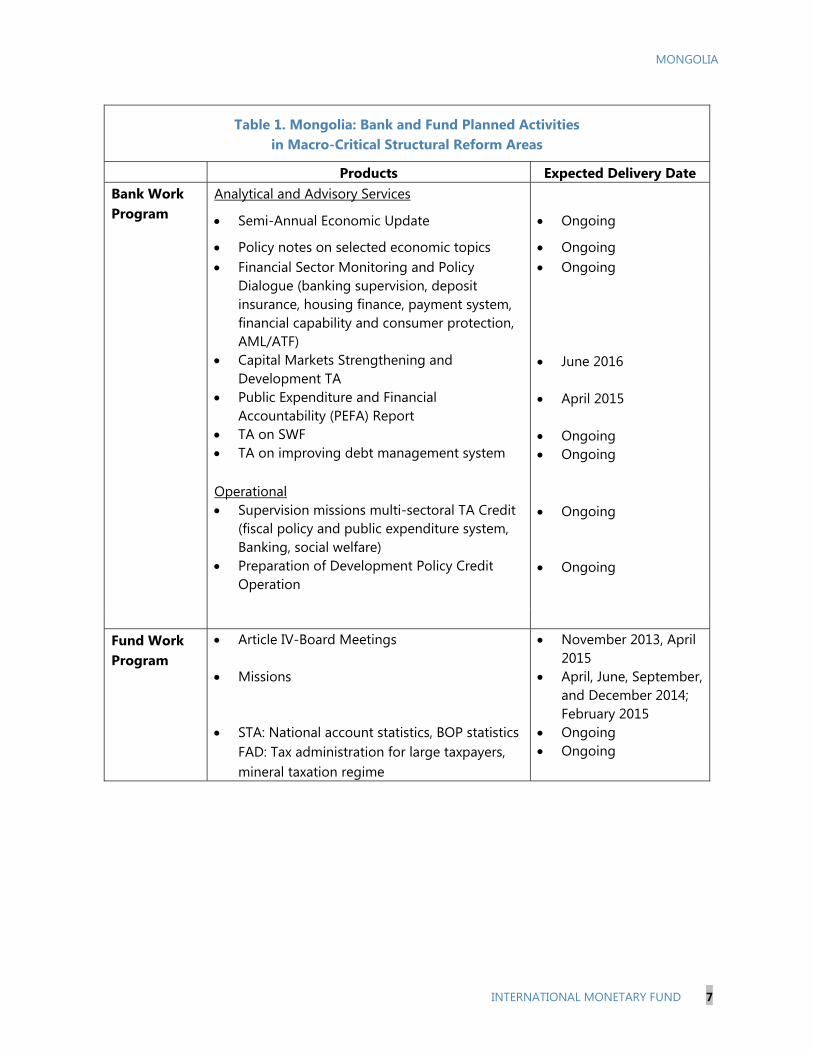
MONGOLIA
INTERNATIONAL MONETARY FUND 7
Table 1. Mongolia: Bank and Fund Planned Activities in Macro-Critical Structural Reform Areas
Products Expected Delivery Date Bank Work Program
Analytical and Advisory Services
Semi-Annual Economic Update Ongoing
Policy notes on selected economic topics Ongoing Financial Sector Monitoring and Policy
Dialogue (banking supervision, deposit insurance, housing finance, payment system, financial capability and consumer protection, AML/ATF)
Capital Markets Strengthening and Development TA
Public Expenditure and Financial Accountability (PEFA) Report
TA on SWF TA on improving debt management system
Ongoing
June 2016
April 2015
Ongoing Ongoing
Operational
Supervision missions multi-sectoral TA Credit (fiscal policy and public expenditure system, Banking, social welfare)
Preparation of Development Policy Credit Operation
Ongoing
Ongoing
Fund Work Program
Article IV-Board Meetings
Missions
STA: National account statistics, BOP statistics FAD: Tax administration for large taxpayers, mineral taxation regime
November 2013, April 2015
April, June, September, and December 2014; February 2015
Ongoing Ongoing

MONGOLIA
8 INTERNATIONAL MONETARY FUND
RELATIONS WITH THE ASIAN DEVELOPMENT BANK2 Mongolia became a member of the Asian Development Bank (AsDB) in February 1991. The AsDB has been Mongolia’s largest source of multilateral development finance for more than two decades and since Mongolia joined AsDB, the country has received 60 loans totaling US$1.3 billion, 12 Asian Development Fund grants and 2 Japan Fund for Poverty Reduction (JFPR) grants for US$218 million. In addition, 184 TA and JFPR TA grant projects with total value of $110.9 million have been implemented and AsDB has supported trade through its Trade Finance Program, with a total value of $106 million. AsDB has also approved 2 ongoing financing facilities for urban development and urban transport, with up to $377 million currently available for drawdown.
In 2011, Mongolia gained access to AsDB’s ordinary capital resources (OCR), alongside AsDB’s concessional lending from ADF; however Mongolia no longer has access to ADF grant financing. Given its AAA credit rating, AsDB makes funding available for development projects on highly favorable terms. This change was welcomed by the Government of Mongolia as large amounts of capital are needed to finance infrastructure investments and, improvement of social services, and to address urgent environmental problems.
AsDB has provided financial, technical and policy support in areas ranging from urban infrastructure, agriculture, energy, finance, education, health, to social protection and transport. AsDB has also provided over $100m private sector financing for commercial banks.
The Mongolia Country Partnership Strategy (CPS) 2012−16 was approved by AsDB’s board in April 2012. The CPS is prioritizing (i) transport, energy, and water supply infrastructure; (ii) access to education and health; and (iii) regional economic cooperation in order to support sustainable and inclusive growth of economy. In August 2014, reflecting changed government priorities and to meet AsDB’s focus on employment creation and economic diversification, two strategic adjustments was made to the Interim CPS 2014–2016: (i) the inclusion of two additional sectors (agriculture, natural resources and rural development; and finance); and (ii) scaling up OCR resource allocations to meet pressing development needs, from $50m annually to $200m.
For 2015, AsDB has offered to provide loans for US$200 million and US$72 million from OCR and ADF funding sources, respectively. In addition, technical assistance worth US$11 million and JFPR grant worth US$10 will be provided.
AsDB’s operations will concentrate on the following sectors in the following years:
Transport. Transport is the largest sector of AsDB operations in Mongolia. Under the Central Asia Regional Economic Cooperation (CAREC) program, for which AsDB acts as Secretariat, AsDB is financing construction of the country’s two main international road corridors, connecting Mongolia
2 Data provided by Asian Development Bank staff.
MONGOLIA
INTERNATIONAL MONETARY FUND 9
to the People’s Republic of China and the Russian Federation. As a result, travel times from Ulaanbaatar (UB) to the PRC border have recently come down from 20 hours to 7 hours. With a view to boosting Mongolian exports, AsDB is also supporting Mongolia to harmonize cross-border transport procedures, under the CAREC program, and developing logistics infrastructure and systems in Zamyn-Uud on the border with the People’s Republic of China. AsDB also plans to support a public transport system for UB, based on bus rapid transit.
Urban Development. AsDB is helping to improve living conditions and greater access to basic services, including water, sanitation, and heating, to poor people in urban areas across the country, including UB, provincial capitals and smaller towns in the mineral-rich Gobi area, where communities are coping with a large population influx in response to new mining operations. AsDB plans to extend basic urban infrastructure and construct socio-economic facilities in peri-urban areas of UB city, home of nearly half of the population, to upgrade existing sub-centers for improved economic, housing, and employment opportunities, and reduced environmental pollution. AsDB recently approved the $320 million Ger Area Development Programme, with $160m financing from AsDB, Euro 50m from the European Investment Bank and the remainder financed by the Government.
Energy. Insufficient and unreliable power and heating are becoming bottlenecks to growth and threaten livelihoods. AsDB aims improve energy efficiency and capacity in UB, through upgrading electrical transmission and distribution networks, by increasing efficiency of existing energy sources, and preparing to finance the country’s first major $1.3 billion public–private partnership to construct a new energy efficient combined heating and power plant in UB with proper emission reduction equipment. AsDB will pilot the application of different renewable energy sources, including solar thermal heating in remote districts.
Education. AsDB has supported the government’s efforts to reform and develop the education system in all subsectors (pre-primary, primary, secondary, tertiary, technical and vocational education and training). To meet pressing labor market demands, AsDB currently supports reform of higher education has recently approved substantial financial support modernize vocational training, as well as promoting PPPs in pre-primary and primary education
Health and Social Protection. AsDB has made major investments to improve primary health services and supports policy reforms and investments in the hospital sector, drug and blood safety and hospitals hygiene. AsDB assisted the government in introducing proxy means testing to target the poor, reformation of several universal benefits, introduction of the food stamp program as the first poverty-targeted benefit in the country, and passage of the amended Social Welfare Law in January 2012 that legalized the reforms. AsDB will continue to support the efficiency and transparency of the delivery of social welfare and insurance services. Another planned area of support is the improvement of access to education, employment and health care for disabled persons, who tend to be left aside from the basic services.
Agriculture, Natural Resources and Rural Development. Recognizing the significant potential of agriculture for employment creation, Mongolia needs to diversify the economy by developing value chains for high-quality, locally made agricultural products. Establishing genuine Mongolian brands,

MONGOLIA
10 INTERNATIONAL MONETARY FUND
and developing rigorous quality control and standardization of products would help Mongolian companies to penetrate overseas markets. AsDB has been and will continue supporting this potential through the development of agro-processing companies, and establishing brands. Sanitary and phytosanitary measures are essential for Mongolia to boost its trade of agriculture products and AsDB supports the country to upgrade these to international standards. Mongolia faces severe development challenges in terms of sustainable growth, such as, grasslands desertification, water scarcity, and a growing number of climate change-related disasters. AsDB will support the sustainable management of natural resources (i.e., water, land, forests, and peatlands); water security and information management; protected area management; climate change adaptation; institutional strengthening; and rural renewable energy and livelihood improvement. AsDB aims to strengthen natural disaster risk management. Working with private sector banks, AsDB has made over $80m available for the development of micro, small and medium enterprises, especially in agribusiness.
Finance. While almost 90% of registered businesses in Mongolia are SMEs, most of them have limited access to finance and are unable to contribute sufficiently to diversification of the economy, employment creation, and economic growth. The expected outcome of AsDB’s interventions in the financial sector is the increased use of more efficient financial intermediation by private sector enterprises and individuals to support diversification of the economy and employment creation, in particular in the agriculture sector. AsDB will help safeguard financial sector stability, improve access to finance for SMEs through the support of financial infrastructure, and support long-term financing for investments in infrastructure and green development.

MONGOLIA
INTERNATIONAL MONETARY FUND 11
STATISTICAL ISSUES (As of March 3, 2015)
I. Assessment of Data Adequacy for Surveillance
General: Data provision to the Fund is broadly adequate for surveillance, but some shortcomings exist in the estimation of GDP and treatment of missing observations in price indices. The priority areas for improvement are national accounts and price statistics, and also the migration of government finance statistics to a new methodology. National Accounts: The National Statistics Office (NSO) currently compiles and publishes annual and quarterly GDP by production and expenditure approaches. Estimates are broadly in line with the 1993 SNA and are based on various census/surveys and administrative data sources. Annual GDP data are available for 1990–2013. The constant price estimates use the base year 2005. The NSO has recently improved the quality of national accounts data, but weaknesses remain, including in the estimation of capital formation, imputed rent estimates, estimation of GDP in constant prices, and coverage of the informal sector and small-scale activity (especially in the services sector). The NSO is currently finalizing a supply-use table (SUT) for 2010 at current prices based on the 2008 SNA methodology and has plans for implementing SUT as an integral part of the annual compilation process, in current and constant prices. The SUT represents an important tool for the improvement of national accounts estimates in Mongolia. Price Statistics: The consumer price index (CPI) was rebased in January 2008 with expenditure-derived weights from the 2005 Household Income and Expenditure Survey. The NSO has published a national CPI for Ulaanbaatar and 21 aimags (provinces) since January 2008, and a housing price index since October 2008. CPI compilation can further be improved by expanding the sample to include more varieties and financial services and appropriate treatment of missing observations. The NSO also publishes a producer price index (PPI). The major shortcoming with the currently compiled PPI for industry continues to be the lack of imputation for missing prices—both temporarily and permanently missing prices. Government Finance Statistics: Currently, the concepts, classifications, and definitions used to compile sub-annual and annual fiscal statistics for the consolidated general government operations series used in APD generally follow the guidelines of the GFSM 1986. The authorities have indicated an intention to adopt a migration path to the GFSM 2001 methodology. STA assists the authorities compile and disseminate monthly and annual (cash-based) general government series in the GFSM 2001-based Statement of Sources and Uses of cash (Revenue, Expenditure, Transaction in Assets and Liabilities). A 2015 GFS TA mission will seek to compile a complete an annual (and quarterly) balance sheet and integrated presentation of stock and flows for the consolidated general government sector using the accrual (IPSAS-based) accounts maintained by the Ministry of Finance. The mission will also seek to encourage the reporting of public sector debt statistics (PSDS), as these are not reported systematically to the World Bank for dissemination on the PSDS Website. Monetary and Financial Statistics: BOM’s monetary and financial statistics conform to the concepts and definitions of the Monetary and Financial Statistics Manual (MFSM) methodology as the authorities implemented recommendations of the latest monetary and financial statistics (MFS) missions. In particular, the monetary data were improved by the proper classification of repurchase agreements, accrued interest, and financial derivatives. The coverage of monetary statistics was expanded beginning in February 2010 to include data of Savings and Credit Cooperatives (SCCs) that collect deposits; and since May 2010 data for some other financial corporations (OFIs) have been disseminated in the BOM’s Monthly Statistical Bulletin. The September 2009 mission provided recommendations to reconcile the BOM and the Ministry of Finance data on government financing,

MONGOLIA
12 INTERNATIONAL MONETARY FUND
and finalized the standardized report forms for the data of the BOM and other depository corporations for publication in International Financial Statistics beginning in November 2009. The July/August 2011 mission discussed the quality of data of the nonbank financial institutions (NBFIs), insurance companies, and securities companies that are reported to the Financial Regulatory Commission (FRC) and recommended their use in the compilation of monetary statistics. However, due to insufficient coordination among various agencies, this recommendation has not been implemented. Financial sector surveillance: With regard to financial soundness indicators (FSIs), Mongolia currently does not report data to the Fund for dissemination on the Fund website.
External Sector Statistics: For compilation of external sector statistics (ESS), the Bank of Mongolia (BOM) follows the statistical framework of the fifth edition of the Balance of Payment Manual (BPM5) and expects to begin compiling and reporting ESS using the sixth edition of the Balance of Payments and International Investment Position Manual (BPM6) during the first half of 2015. The coverage of the balance of payments statistics has been broadened by extending the International Transaction Reporting System (ITRS) to nonbank financial institutions and by increasing the number of direct reporting private enterprises. Since May 2014, BOM has produced 2012-annual international investment position data for submission to STA. Priorities for improvement are to (1) submit quarterly external debt statistics to the World Bank’s Quarterly External Debt Statistics (QEDS) database in collaboration with the Ministry of Finance; (2) release the first quarter data for 2014 using the BPM6 statistical framework; and (3) assess the State Registry Office’s database on all enterprises registered in Mongolia to determine whether all relevant enterprises with direct investment are included in the BOM’s ESS surveys.
II. Data Standards and Quality
Mongolia participates in the General Data Dissemination System (GDDS).
A data ROSC mission visited Mongolia in September 2007 to update the May 2000 assessment of the macroeconomic statistics. The report was published in April 2008.

MONGOLIA
INTERNATIONAL MONETARY FUND 13
Mongolia—Table 2. Common Indicators Required for Surveillance (As of February 25, 2014)
Date of
Latest Observation
Date Received
Frequency of Data6
Frequency of
Reporting6
Frequency of
Publication6
Memo Items::
Data Quality- Methodological
soundness7
Data Quality – Accuracy and Reliability8
Exchange rates 02/25/15 02/25/15 D D D
International reserve assets and reserve liabilities of the Monetary Authorities1
02/25/15 02/25/15 D D M
Reserve/base money 01/31/15 02/23/15 M M M O, LO, LO, LO O, O, O, O, LNO
Broad money 01/31/15 02/23/15 M M M
Central bank balance sheet 01/31/15 02/23/15 M M M
Consolidated balance sheet of the banking system
01/31/15 02/23/15 M M M
Interest rates2 12/31/14 01/16/15 M M M
Consumer price index 01/31/15 02/18/15 M M M O, LO, O, O LO,LO,LO,O,O
Revenue, expenditure, balance and composition of financing3 – general government4
12/31/14 01/16/15 M M M LO, LNO, LO, O LO, O, LO, LO, LNO
Revenue, expenditure, balance and composition of financing3– central government
12/31/14 01/16/15 M M M
Stocks of central government and central government-guaranteed debt5
12/31/14 02/08/15 A A A
External current account balance
12/31/14 02/03/15 M M M O, O, O, LO LO, O, LO, LO, LO
Exports and imports of goods 12/31/14 02/03/15 M M M
GDP/GNI 2014Q4 02/2015 Q Q Q O, LNO, O, LO O, LO, LO, LO, LNO
Gross external debt 2014Q3 01/16/15 Q Q Q 1Includes reserve assets pledged or otherwise encumbered as well as net derivative positions.2 Both market-based and officially determined, including discount rates, money market rates, and rates on treasury bills, notes and bonds. 3 Foreign, domestic bank, and domestic nonbank financing. 4 The general government consists of the central government (budgetary funds, extra budgetary funds, and social security funds) and state and local governments. 5 Including currency and maturity composition. 6 Daily (D), Weekly (W), Monthly (M), Quarterly (Q), Annually (A), Irregular (I), Not Available (NA). 7 Reflects the assessment provided in the data ROSC or the Substantive Update (published in April 2008, and based on the findings of the mission that took place during September 1–28) for the dataset corresponding to the variable in each row. The assessment indicates whether international standards concerning concepts and definitions, scope, classification/sectorization, and basis for recording are fully observed (O); largely observed (LO); largely not observed (LNO); not observed (NO); and not available (NA). 8 Same as footnote 7, except referring to international standards concerning (respectively) source data, assessment of source data, statistical techniques, assessment and validation of intermediate data and statistical outputs, and revision studies.

MONGOLIA
14 INTERNATIONAL MONETARY FUND
MILLENNIUM DEVELOPMENT GOALS 1995 2000 2010 2012/13Goal 1: Eradicate extreme poverty and hunger Employment to population ratio, 15+, total (%) 56 57 57 60Employment to population ratio, ages 15−24, total (%) 38 38 30 33GDP per person employed (constant 1990 PPP $) .. .. .. ..Income share held by lowest 20% 7 7 .. ..Malnutrition prevalence, weight for age (% of children under 5) 8 12 5 ..Poverty gap at $1.25 a day (PPP) (%) .. .. .. ..Poverty headcount ratio at $1.25 a day (PPP) (% of population) .. .. .. ..Vulnerable employment, total (% of total employment) .. 57 56 ..Goal 2: Achieve universal primary education Literacy rate, youth female (% of females ages 15−24) .. 98 99 ..Literacy rate, youth male (% of males ages 15−24) .. 97 98 ..Persistence to last grade of primary, total (% of cohort) 68 89 93 ..Primary completion rate, total (% of relevant age group) 75 87 114 130Adjusted net enrollment rate, primary (% of primary school age children) 81 93 99 98Goal 3: Promote gender equality and empower women Proportion of seats held by women in national parliaments (%) 8 11 4 15Ratio of female to male primary enrollment (%) 103 101 98 97Ratio of female to male secondary enrollment (%) 133 124 107 103Ratio of female to male tertiary enrollment (%) 227 179 154 145Share of women employed in the nonagricultural sector (% of total nonagricultural employment) 46 49 52 50Goal 4: Reduce child mortality Immunization, measles (% of children ages 12−23 months) 85 92 97 97Mortality rate, infant (per 1,000 live births) 63 49 29 26Mortality rate, under-5 (per 1,000 live births) 85 65 36 32Goal 5: Improve maternal health Adolescent fertility rate (births per 1,000 women ages 15−19) 34 26 19 19Births attended by skilled health staff (% of total) .. 97 99 ..Contraceptive prevalence (% of women ages 15−49) 57 67 55 ..Maternal mortality ratio (modeled estimate, per 100,000 live births) 120 120 74 68Pregnant women receiving prenatal care (%) .. 97 99 ..Unmet need for contraception (% of married women ages 15−49) .. .. 14 ..Goal 6: Combat HIV/AIDS, malaria, and other diseases Children with fever receiving antimalarial drugs (% of children under age 5 with fever) .. .. .. ..Condom use, population ages 15−24, female (% of females ages 15−24) .. .. .. ..Condom use, population ages 15−24, male (% of males ages 15−24) .. .. .. ..Incidence of tuberculosis (per 100,000 people) 314 253 214 181Prevalence of HIV, female (% ages 15−24) 0.1 0.1 0.1 0.1Prevalence of HIV, male (% ages 15−24) 0.1 0.1 0.1 0.1Prevalence of HIV, total (% of population ages 15−49) 0.1 0.1 0.1 0.1Tuberculosis case detection rate (%, all forms) 39 51 77 84Goal 7: Ensure environmental sustainability CO2 emissions (kg per PPP $ of GDP) 1.3 1.0 0.7 ..CO2 emissions (metric tons per capita) 3.4 3.1 4.2 ..Forest area (% of land area) 7.8 7.5 7.0 6.9Improved sanitation facilities (% of population with access) 47 49 55 56Improved water source (% of population with access) 63 68 82 85Marine protected areas (% of territorial waters) .. .. .. ..Net ODA received per capita (current US$) 91 91 112 160Goal 8: Develop a global partnership for development Debt service (PPG and IMF only, % of exports of goods, services and primary income) 10 7 4 3Internet users (per 100 people) 0 1 10 18Mobile cellular subscriptions (per 100 people) 0 6 93 124Telephone lines (per 100 people) 3 5 7 6Fertility rate, total (births per woman) 3 2 2 2Other GNI per capita, Atlas method (current US$) 460 470 1900 3770GNI, Atlas method (current US$) (billions) 1.1 1.1 5.2 10.7Gross capital formation (% of GDP) 26.8 29.0 40.8 61.4Life expectancy at birth, total (years) 61.2 62.9 66.9 67.3Literacy rate, adult total (% of people ages 15 and above) .. 97.8 98.3 ..Population, total (millions) 2.29 2.39 2.71 2.84Trade (% of GDP) 82.1 121.9 117.1 112.2Source: World Bank, World Development Indicators database.

MONGOLIA
INTERNATIONAL MONETARY FUND 15
MAIN DATA WEBSITES National Statistics Office (www.nso.mn) National Accounts Consumer Price Inflation Agricultural and Industrial Production Petroleum Imports Electricity Production and Consumption Coal Production Retail Prices Employment Exports and Imports Bank of Mongolia (www.mongolbank.mn) Monetary Survey Consolidated Balance Sheet of Commercial Banks Distribution of Bank Credit to the Nongovernment Sector Net Credit to Government Interest Rates Balance of Payments Services and Income Accounts Official Reserves of the Bank of Mongolia Selected Indicators of Commercial Bank Foreign Exchange Operations Nominal and Real Exchange Rates Securities Market Data Government Budget Accounts Ministry of Finance (www.mof.gov.mn) Government Budgetary Operations National Development and Innovation Committee (www.ndic.gov.mn) Long- and medium-term development strategy Economic and social policies Investment policy coordination Development Bank of Mongolia Financial Regulatory Commission (www.frc.mn) FRC decisions Total assets of regulated entities (insurance companies, securities and broker firms, non-bank
financial institutions, savings and credit unions) Consolidated income statements of regulated entities (insurance companies, securities and
broker firms, non-bank financial institutions, savings and credit unions)

MONGOLIA STAFF REPORT FOR THE 2015 ARTICLE IV CONSULTATION—DEBT SUSTAINABILITY ANALYSIS
Approved By Markus Rodlauer and Masato Miyazaki (IMF) and Satu Kähkönen and Mathew Verghis (IDA)
The Debt Sustainability Analysis (DSA) has been prepared jointly by IMF and World Bank staff, in consultation with the authorities, using the debt sustainability framework for low-income countries approved by the Boards of both institutions.
Based on the LIC-DSA analytical framework and a broader coverage of public debt than previously used, this debt sustainability analysis (DSA) concludes that Mongolia is at high risk of public debt distress under the baseline scenario. 1 This is not because debt is on an ever-increasing path over the medium-term, but rather because key debt indicators are currently elevated and, while expected to decline over time, would still remain above the relevant thresholds for a number of years. This assessment shows a significant deterioration of debt dynamics since the 2013 Article IV, which suggested a moderate risk under a “strong policy scenario.” In 2014, the fiscal deficit ceiling set forth under the Fiscal Stability Law (FSL) was breached, DBM borrowed large amounts at commercial terms, and the BOM continued to draw down its swap line established with the People’s Bank of China (PBC). Public debt could rise further in the near term as the newly passed Debt Management Law allows more room for the government to contract debt and guarantees.2
1 The low-income country debt sustainability framework (LIC DSF) recognizes that better policies and institutions allow countries to manage higher levels of debt, and thus the threshold levels are policy-dependent. Mongolia’s policies and institutions, as measured by the World Bank’s Country Policy and Institutional Assessment (CPIA), place it as a “medium performer”, with an average rating of 3.43 during 2011-13. The relevant indicative thresholds for this category are: 40 percent for the NPV of debt-to-GDP ratio, 150 percent for the NPV of debt-to-exports ratio, 250 percent for the NPV of debt-to-revenue ratio, 20 percent for the debt service-to-exports ratio, and 20 percent for the debt service-to-revenue ratio. These thresholds are applicable to public and publicly guaranteed external debt. 2 This DSA is based on end-2014 debt data. The fiscal year for Mongolia is January–December. The 2013 DSA (see IMF Country Report No. 14/64) was based on end-2013 debt data.
March 19, 2015

MONGOLIA
2 INTERNATIONAL MONETARY FUND
A. Background
1. Based on the LIC-DSA framework and a broad coverage of public debt, this DSA concludes that Mongolia faces a high risk of debt distress under the baseline scenario. This DSA assesses public debt, including general government debt, Euro bonds issued by the Development Bank of Mongolia, the drawing of the PBOC swap line by the Bank of Mongolia (BOM), and also borrowing by, and government guarantees for SOEs, which were not included in the previous DSA as such data were not reliably available at the time.3 External public and publicly guaranteed (PPG) debt reached more than 56 percent of GDP by end-2014, and key external debt indicators have breached, or are projected to breach, the relevant indicative thresholds; debt-service ratios spike in various years when external bonds mature, and some of these breaches are significant in magnitude and persist for extended periods under both baseline and stress tests. Public debt stood at 77 percent of GDP, and will stay above the benchmark for almost the entire projection period (2015-2035).4 Total external debt rose to 170 percent of GDP—reflecting, in large part, intercompany lending in the mining sector—undermining the economy’s resilience to external shocks. The elevated debt ratios have also raised market concern—credit rating agencies have downgraded Mongolia’s sovereign rating several times since the issuance of Eurobonds in late 2012 and have maintained a negative outlook, and Mongolia’s sovereign spreads are among the highest of all frontier economies.
2. Debt dynamics have worsened since the 2013 DSA, mainly reflecting a substantial increase in domestic public debt and external PPG debt. The “strong policy scenario” of the 2013 DSA, which envisaged significant fiscal restraint and monetary tightening, did not take place. Instead, the 2014 on-budget deficit reached 4¼ percent of GDP compared to the FSL limit of 2 percent, and off-budget spending by the Development Bank of Mongolia (DBM) amounted to 6¾ percent of GDP, keeping the consolidated fiscal deficit at 11 percent of GDP, similar to 2013. Debt dynamics have deteriorated substantially, reflecting extensive borrowing by the DBM, further drawing of the swap line by BOM, and large amounts of domestic bonds issued close to end-2014 (see table 1). Moreover, exchange rate depreciation caused external debt to increase further relative to GDP. The expansion of public debt coverage to include borrowings by, and government guarantees for, SOEs, raises the reported debt ratio by 8¾ percent of GDP in 2013.5 But the elevated debt risk is mainly attributable to aggressive borrowing rather than this expansion of coverage. On the authorities’ definition—i.e., in NPV terms, and excluding the PBOC swap drawings—public debt amounted to 55 percent of GDP at end-2014, in excess of the FSL’s 40 percent limit.
3. The institutional framework of debt management has also been altered. Even the authorities’ estimate—i.e., considering their calculation of debt NPV with the Bank of Mongolia’s 3 The authorities’ definition of public debt excludes the BOM swap line. And debt as defined under the FSL and DML has recently been changed to exclude SOE debt and secured government guarantees. Moreover, the authorities consider debt in NPV, not nominal, terms. 4 The public debt benchmark is derived on an empirical basis, and varies among countries with their respective CPIA score. 5 This broad coverage is in line with the DSA Guidance Note (2013).

MONGOLIA
INTERNATIONAL MONETARY FUND 3
swap line excluded—shows public debt amounted to 54.7 percent of GDP at end-2014 and thus far exceeded the 40 percent threshold enshrined in the FSL. Recent amendments to the FSL and a new Debt Management Law narrowed the definition of debt to government debt only by excluding SOE borrowing and government guarantees secured by government securities. This legal framework also laid out a path for bringing the deficit and government debt back to the original limits within a few years. The new laws will thus provide additional room for the government to contract debt and provide guarantees in the near term. Staff does not support the narrowing of public debt coverage, nor the temporary increase of debt ceiling. Staff also explained the need to include all DBM spending and BOM swap line drawing in public debt for the following reasons:
DBM spending. All DBM activities should be included in the statistics (revenue, expenditure, deficit, and financing) of general government for Mongolia. This practice reflects the institutional unit approach as stated by international statistical manuals (GFSM 2014, SNA 2008 and BPM6). Although in limited circumstances international statistical manuals allow for commercial or market activities of general government units to be split out, but the current activities undertaken by DBM clearly do not satisfy the requirements.
BOM swap. Since this DSA covers the entire public sector, BOM’s liability relating to the swap should be included.
Composition of Public Debt (percent of GDP)
2013 2014
Government External Debt 32 31
Government Domestic Debt 12 14
Government Guarantees (incl. DBM Debt) 6 12
Non-Guaranteed SOE Debt 9 7
BOM Foreign Liability 9 13
Total Public Debt (% of GDP) 67 77 4. Mongolia’s long-term prospects remain bright, but liquidity risks are high in the near term. The country’s resource wealth is estimated at $1 trillion to $3 trillion, and this is assumed to continue being realized gradually. Mongolia is thus projected to be solvent given the strong projected revenues from mining over the long term. It does, however, face serious liquidity pressures and risks in the short run, before mining exports ramp up. Until then, financing outsized prospective fiscal and BOP deficits will be difficult, and thus policies should be focused to avoid building up excessive debt and manage BOP pressure.
5. The authorities have embarked on policy tightening, but more needs to be done. Part of DBM’s spending has been brought on budget, and the consolidated fiscal deficit is expected to decline this year. The authorities target ambitious deficit reduction (to 5 percent of GDP this year, and 2 percent by 2018, excluding “commercial” DBM spending) but this is not likely to materialize on current policies. (Responding to these concerns, the authorities envisage a government resolution to cut spending administratively, to be backed up by a second supplementary budget later in the year). The BOM has hiked the policy rate twice, slowed the pace of PSP and mortgage

MONGOLIA
4 INTERNATIONAL MONETARY FUND
lending, and proposed transferring the existing stock of PSP loans to the government’s balance sheet; nonetheless, credit growth is higher than desirable. The authorities have redoubled efforts to reach agreement with investors on large projects and introduced other structural measures to boost exports and reduce imports. Steps have been taken to strengthen the banks and to improve bank supervision and crisis preparedness. Nevertheless, these policy adjustments may not be sufficient to ensure macro-stability. Under the baseline, the consolidated fiscal deficit (including all DBM spending) would decline but remain above the FSL limit (2 percent of GDP). A large BOP financing gap, estimated at about $2 billion over the next three years (discussed below), will be financed at least partly by public borrowing or debt contracted with government guarantees.6
6. Baseline assumptions differ significantly from those in the “strong policy scenario” used in the previous DSA:
The previous DSA projected the fiscal deficit to fall below 2 percent of GDP in 2016, while here it drops to 4 percent from 2019.
The previous DSA projected a complete phaseout of unconventional monetary easing programs, which helped to bring credit growth down to around 13½ percent, while here some of these programs continue, albeit on a smaller scale, and credit growth is around 16 percent.
Reflecting updated information on OT-1 output, mining growth is revised down from an average of 5½ percent to 3½ percent, while nonmineral growth is revised down from 6½ percent to 5½ percent, on account of weakened near-term investor confidence. Given weaker activity, this DSA also revises CPI inflation down from a medium-term average of 7½ percent to 7 percent. The real exchange rate is assumed to remain constant.
Finally, while there was no BOP financing gap in the previous DSA, the current BOP envisages a financing gap (relative to zero reserves) of $2 billion mainly because of weaker capital and financial inflows.7 It is assumed that 62 percent of the financing gap will be filled by government borrowing or debt with government guarantees—this ratio is consistent with the share of public external debt in total external debt (excluding intercompany lending). This borrowing also reflects additional borrowing space created by the revised legal framework (the revised FSL and the new DML).
B. Debt Sustainability under Baseline Scenario
7. Debt is not on an ever-increasing path under the baseline scenario. Both external and public debt scaled by GDP would fall after an initial period.8 This reflects promising prospects of the mining sector in outer years and fiscal adjustment measures enshrined in the legal system. Nevertheless, the debt path is sensitive to external shocks. Meanwhile, disputes surrounding OT-2, 6 The financing gap is defined as the shortfall of BOP financing after FX reserves fall to zero. Considering the need to build up FX reserves, the financing needs could be even larger. 7 An important difference is that the current DSA baseline assumes no rollover of the maturing sovereign and quasi-sovereign bonds in 2017, while the previous DSA assumes a full rollover of these debts. 8 Residuals reflect large capital outflows under “currency and deposits” and change of FX reserves.
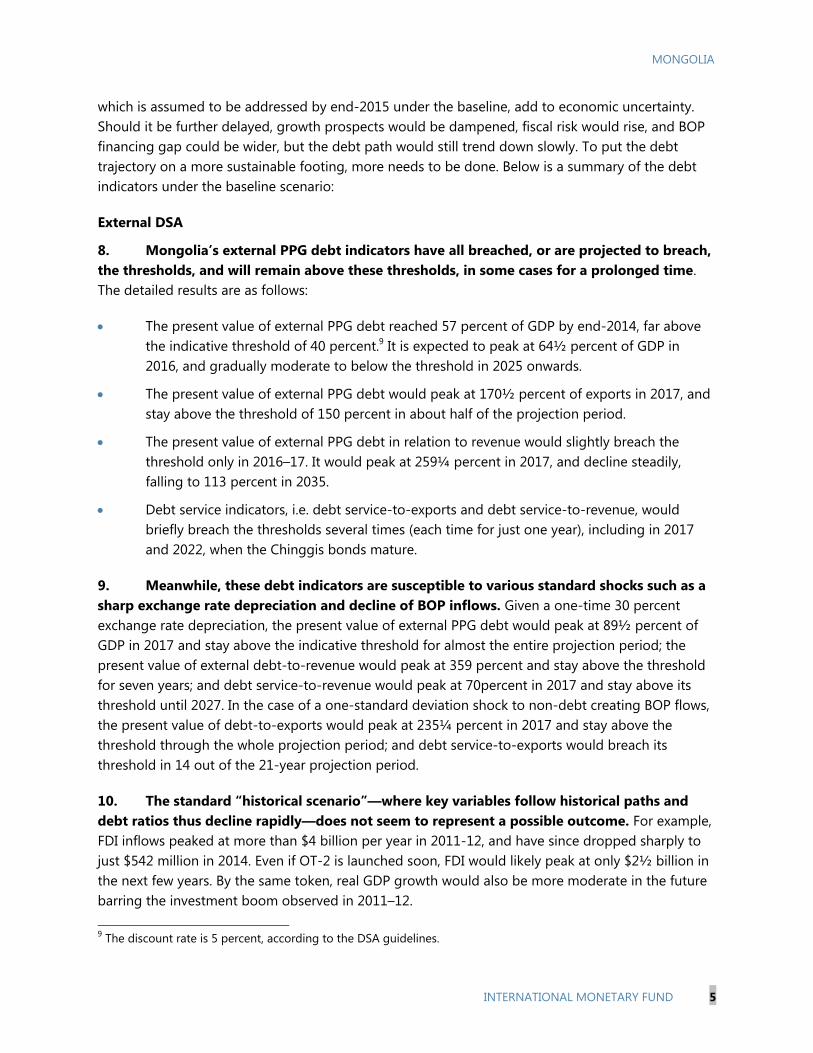
MONGOLIA
INTERNATIONAL MONETARY FUND 5
which is assumed to be addressed by end-2015 under the baseline, add to economic uncertainty. Should it be further delayed, growth prospects would be dampened, fiscal risk would rise, and BOP financing gap could be wider, but the debt path would still trend down slowly. To put the debt trajectory on a more sustainable footing, more needs to be done. Below is a summary of the debt indicators under the baseline scenario:
External DSA
8. Mongolia’s external PPG debt indicators have all breached, or are projected to breach, the thresholds, and will remain above these thresholds, in some cases for a prolonged time. The detailed results are as follows:
The present value of external PPG debt reached 57 percent of GDP by end-2014, far above the indicative threshold of 40 percent.9 It is expected to peak at 64½ percent of GDP in 2016, and gradually moderate to below the threshold in 2025 onwards.
The present value of external PPG debt would peak at 170½ percent of exports in 2017, and stay above the threshold of 150 percent in about half of the projection period.
The present value of external PPG debt in relation to revenue would slightly breach the threshold only in 2016–17. It would peak at 259¼ percent in 2017, and decline steadily, falling to 113 percent in 2035.
Debt service indicators, i.e. debt service-to-exports and debt service-to-revenue, would briefly breach the thresholds several times (each time for just one year), including in 2017 and 2022, when the Chinggis bonds mature.
9. Meanwhile, these debt indicators are susceptible to various standard shocks such as a sharp exchange rate depreciation and decline of BOP inflows. Given a one-time 30 percent exchange rate depreciation, the present value of external PPG debt would peak at 89½ percent of GDP in 2017 and stay above the indicative threshold for almost the entire projection period; the present value of external debt-to-revenue would peak at 359 percent and stay above the threshold for seven years; and debt service-to-revenue would peak at 70percent in 2017 and stay above its threshold until 2027. In the case of a one-standard deviation shock to non-debt creating BOP flows, the present value of debt-to-exports would peak at 235¼ percent in 2017 and stay above the threshold through the whole projection period; and debt service-to-exports would breach its threshold in 14 out of the 21-year projection period.
10. The standard “historical scenario”—where key variables follow historical paths and debt ratios thus decline rapidly—does not seem to represent a possible outcome. For example, FDI inflows peaked at more than $4 billion per year in 2011-12, and have since dropped sharply to just $542 million in 2014. Even if OT-2 is launched soon, FDI would likely peak at only $2½ billion in the next few years. By the same token, real GDP growth would also be more moderate in the future barring the investment boom observed in 2011–12.
9 The discount rate is 5 percent, according to the DSA guidelines.
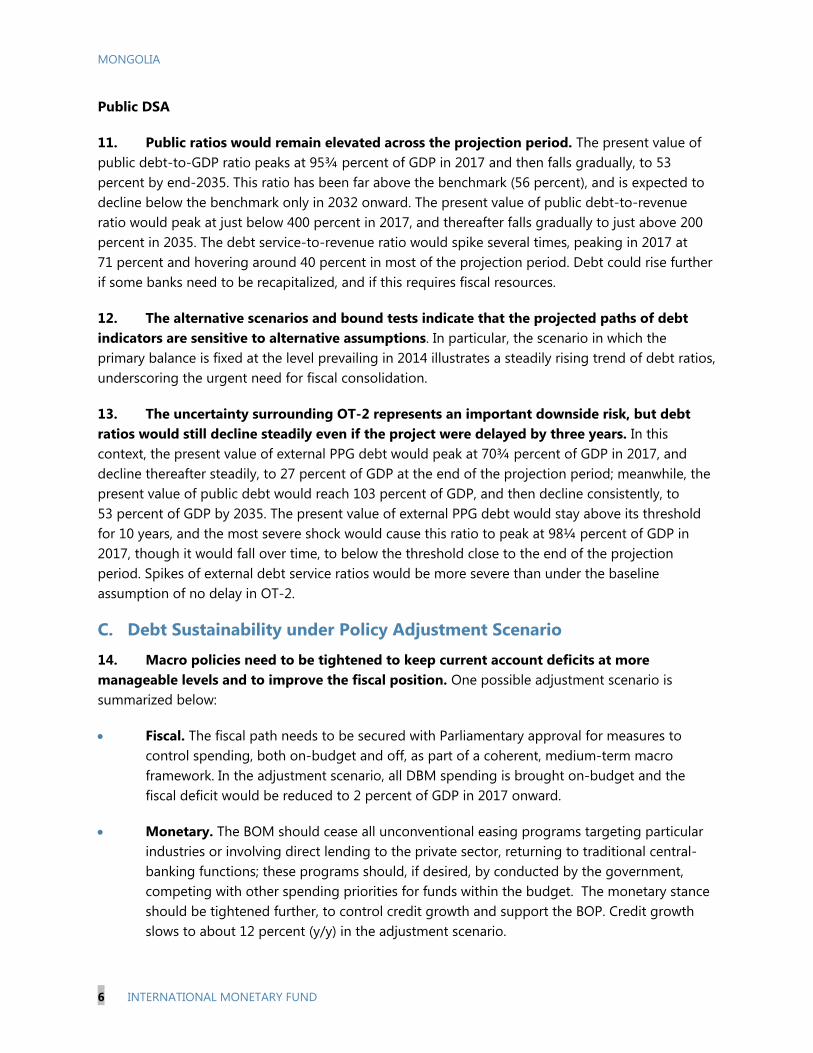
MONGOLIA
6 INTERNATIONAL MONETARY FUND
Public DSA
11. Public ratios would remain elevated across the projection period. The present value of public debt-to-GDP ratio peaks at 95¾ percent of GDP in 2017 and then falls gradually, to 53 percent by end-2035. This ratio has been far above the benchmark (56 percent), and is expected to decline below the benchmark only in 2032 onward. The present value of public debt-to-revenue ratio would peak at just below 400 percent in 2017, and thereafter falls gradually to just above 200 percent in 2035. The debt service-to-revenue ratio would spike several times, peaking in 2017 at 71 percent and hovering around 40 percent in most of the projection period. Debt could rise further if some banks need to be recapitalized, and if this requires fiscal resources.
12. The alternative scenarios and bound tests indicate that the projected paths of debt indicators are sensitive to alternative assumptions. In particular, the scenario in which the primary balance is fixed at the level prevailing in 2014 illustrates a steadily rising trend of debt ratios, underscoring the urgent need for fiscal consolidation.
13. The uncertainty surrounding OT-2 represents an important downside risk, but debt ratios would still decline steadily even if the project were delayed by three years. In this context, the present value of external PPG debt would peak at 70¾ percent of GDP in 2017, and decline thereafter steadily, to 27 percent of GDP at the end of the projection period; meanwhile, the present value of public debt would reach 103 percent of GDP, and then decline consistently, to 53 percent of GDP by 2035. The present value of external PPG debt would stay above its threshold for 10 years, and the most severe shock would cause this ratio to peak at 98¼ percent of GDP in 2017, though it would fall over time, to below the threshold close to the end of the projection period. Spikes of external debt service ratios would be more severe than under the baseline assumption of no delay in OT-2.
C. Debt Sustainability under Policy Adjustment Scenario
14. Macro policies need to be tightened to keep current account deficits at more manageable levels and to improve the fiscal position. One possible adjustment scenario is summarized below:
Fiscal. The fiscal path needs to be secured with Parliamentary approval for measures to control spending, both on-budget and off, as part of a coherent, medium-term macro framework. In the adjustment scenario, all DBM spending is brought on-budget and the fiscal deficit would be reduced to 2 percent of GDP in 2017 onward.
Monetary. The BOM should cease all unconventional easing programs targeting particular industries or involving direct lending to the private sector, returning to traditional central-banking functions; these programs should, if desired, by conducted by the government, competing with other spending priorities for funds within the budget. The monetary stance should be tightened further, to control credit growth and support the BOP. Credit growth slows to about 12 percent (y/y) in the adjustment scenario.

MONGOLIA
INTERNATIONAL MONETARY FUND 7
Exchange rate policy. Foreign-exchange intervention should be limited to dealing with episodes of excessive volatility, and the exchange rate should be allowed to move flexibly.
Growth and inflation. Given the policy tightening, non-mining growth would initially slow to 1 percent in 2015 and then gradually pick up to 6½ percent over the medium term. Real exchange rate is assumed to depreciate by 4 percent per year in 2015-17 barring BOM intervention. The exchange rate depreciation will have pass-through effects on inflation, which would stay high at 9½ percent in 2015 and gradually moderate to 6½ percent.
Balance of payments. Macro policy tightening, lower growth and real exchange rate depreciation will all help compress imports. Current account deficit will decline by about $800 million in the next three years, compared to the baseline. As a consequence, the balance of payments will have no financing gap and FX reserves will stand at 1¾ months of imports by end-2017.
15. Debt dynamics improve significantly under the policy adjustment scenario. The present value of external PPG debt would peak at 63¾ percent of GDP in 2017, and decline to below its threshold in 2023 (compared to 2025 in the baseline). Unlike in the baseline, the present value of debt-to-export and debt-to-revenue will not breach their relevant thresholds under the policy adjustment scenario. Debt service ratios would still breach their thresholds several times, but by a smaller margin than under the baseline. The present value of public debt would peak at 83½ percent of GDP in 2017 (compared to 95¾ percent in the baseline), and falls steadily thereafter, to below the benchmark in 2024 onward.
D. Authorities’ Views
16. The authorities generally concurred with this assessment, but highlighted a few observations. First, they doubted whether the BOM swap line should be included in the public debt, wondered if this practice is broadly applied, and noted that, as a swap, and not an outright loan, there is a counterpart asset in togrog. They noted that public debt as defined in the FSL does not include the central bank’s debt, and that public debt is calculated in NPV terms. Second, their calculation of public debt in NPV terms differs from staff’s estimate. Third, the budget only includes non-commercial activity of the DBM, while staff include all DBM lending. As a consequence, staff’s estimates of the fiscal deficit and of debt are larger than those presented by the authorities.
E. Conclusion
17. This DSA concludes that Mongolia suffers from high risk of debt distress. In recent years, the authorities have embarked on borrowing to finance rapidly growing budget and off-budget spending. External PPG debt has almost doubled from around 30 percent of GDP to just
0
20
40
60
80
100
120
2014 2019 2024 2029 2034
Mongolia: PV of Public Debt (Percent of GDP)
Baseline
Adjustment scenario
Baseline with OT-2 delayed

MONGOLIA
8 INTERNATIONAL MONETARY FUND
below 60 percent in the past four years. Public debt stood at below 80 percent of GDP by end-2014, and could further increase given the lax fiscal policy and loosening of borrowing limits offered by the DML. Although debt indicators, mainly external and public debt scaled by GDP, would decline steadily under the baseline, they would remain elevated for prolonged periods.
18. The debt dynamics exhibit a high vulnerability to shocks and bound tests. External PPG debt ratios would rise dramatically in the case of a sharp exchange rate depreciaiton or negative shocks to BOP inflows. Public debt would be on an ever-increasing trajectory should the primary deficit remain at the level prevailing in 2014. Moreover, total external debt, both public and private, has reached about 140 percent of GDP, and this has made the macro-financial stability highly susceptible to exchange rate movements and flucutation of BOP flows.
19. These risks call for immediate policy actions. Although some fiscal adjustment measures have been announced, they are not sufficient to safeguard macro-financial stability and to ensure debt sustainability in case of adverse shocks. Staff suggests more pronounced policy tighening instead. Under a policy adjustment scenario, debt indicators improve significantly—external debt indicators either do not breach their thresholds, or breach them with a smaller margin; public debt as a share of GDP would fall below the benchmark more quickly than under the baseline.
Macroeconomic Assumptions
The baseline scenario assumes the authorities’ current policies, including those proposed under the CMAP framework (but not the latest fiscal cuts that are under consideration). The details are summarized below:
Real sector. It is assumed that OT-2 will start construction from late 2015 and begin operation in 2020.
Fiscal. The authorities target the fiscal deficit at 5 percent of GDP for 2015, and aim to bring the deficit down to 2 percent of GDP by 2018. However, given certain unrealistic assumptions and the need to reflect all DBM spending in the budget, staff project the fiscal deficit to remain close to 10 percent of GDP in 2015, and gradually to decline to 4 percent of GDP from 2019 onward.
Monetary. While the BOM has raised the policy rate twice in recent months and scaled down some monetary easing programs, other unconventional programs have continued and expanded. Given these developments, staff project credit growth at about 16 percent over the medium term.
Balance of payments. The current account deficit is projected to average 13½ percent of GDP over the medium term, before OT-2 starts to export mining commodities in 2020. FDI would average about 2½ billion per year on account of OT-2 related investment. In 2017, maturing debt of more than $1½ billion would exert heavy pressure on the BOP. A large financing gap is expected to emerge, and it is assumed that about two-thirds of this gap will be filled by public borrowing.
Exchange rate. Staff project a constant real exchange rate, along with declining reserves. The adjustment scenario instead assumes that: (i) the fiscal deficit, with all DBM spending brought on budget, is brought down to 2 percent of GDP from 2017 onward; (ii) unconventional easing programs at the BOM are transferred to the budget or discontinued altogether, and credit growth drops to 12 percent; (iii) the exchange rate is allowed to move flexibly; and (iv) market rollovers are easier. With these assumptions, BOP financing gaps are closed.
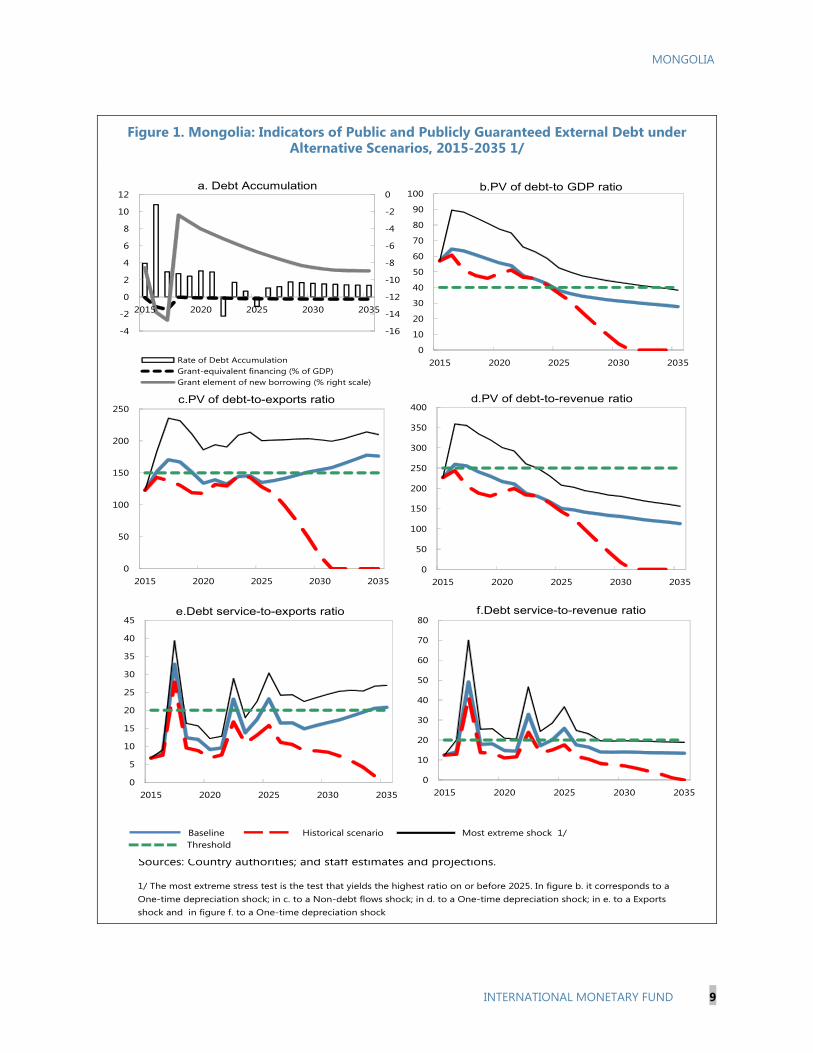
MONGOLIA
INTERNATIONAL MONETARY FUND 9
Figure 1. Mongolia: Indicators of Public and Publicly Guaranteed External Debt under Alternative Scenarios, 2015-2035 1/
Sources: Country authorities; and staff estimates and projections.
1/ The most extreme stress test is the test that yields the highest ratio on or before 2025. In figure b. it corresponds to a One-time depreciation shock; in c. to a Non-debt flows shock; in d. to a One-time depreciation shock; in e. to a Exports shock and in figure f. to a One-time depreciation shock
Baseline Historical scenario Most extreme shock 1/ Threshold
0
10
20
30
40
50
60
70
80
2015 2020 2025 2030 2035
f.Debt service-to-revenue ratio
-16
-14
-12
-10
-8
-6
-4
-2
0
-4
-2
0
2
4
6
8
10
12
2015 2020 2025 2030 2035
Rate of Debt AccumulationGrant-equivalent financing (% of GDP)Grant element of new borrowing (% right scale)
a. Debt Accumulation
0
50
100
150
200
250
2015 2020 2025 2030 2035
c.PV of debt-to-exports ratio
0
10
20
30
40
50
60
70
80
90
100
2015 2020 2025 2030 2035
b.PV of debt-to GDP ratio
0
50
100
150
200
250
300
350
400
2015 2020 2025 2030 2035
d.PV of debt-to-revenue ratio
0
5
10
15
20
25
30
35
40
45
2015 2020 2025 2030 2035
e.Debt service-to-exports ratio

MONGOLIA
10 INTERNATIONAL MONETARY FUND
Figure 2. Mongolia: Indicators of Public Debt under Alternative Scenarios, 2015-2035 1/
Sources: Country authorities; and staff estimates and projections.1/ The most extreme stress test is the test that yields the highest ratio on or before 2025. 2/ Revenues are defined inclusive of grants.
BaselinePublic debt benchmark
Most extreme shock 1/Historical scenario
Fix Primary Balance
0
100
200
300
400
500
600
700
2015 2017 2019 2021 2023 2025 2027 2029 2031 2033 2035
PV of Debt-to-Revenue Ratio 2/
0
20
40
60
80
100
120
140
160
180
2015 2017 2019 2021 2023 2025 2027 2029 2031 2033 2035
PV of Debt-to-GDP Ratio
0
10
20
30
40
50
60
70
80
90
100
2015 2017 2019 2021 2023 2025 2027 2029 2031 2033 2035
Debt Service-to-Revenue Ratio 2/

Historical 6/ Standard 6/
Average Deviation 2015-2020 2021-20352012 2013 2014 2015 2016 2017 2018 2019 2020 Average 2025 2035 Average
External debt (nominal) 1/ 99.3 148.4 187.8 185.5 187.8 181.7 173.3 164.3 153.8 97.8 58.5of which: public and publicly guaranteed (PPG) 39.0 46.3 54.9 56.0 62.4 60.2 58.4 56.2 54.0 37.9 28.9
Change in external debt 38.6 49.1 39.4 -2.3 2.3 -6.1 -8.4 -9.0 -10.5 -10.4 -2.5Identified net debt-creating flows -17.7 6.9 10.8 -5.5 -7.8 -2.8 -10.5 -12.3 -20.1 -12.0 -1.6
Non-interest current account deficit 25.7 22.4 2.7 13.0 11.6 4.8 10.5 10.2 9.6 6.3 -0.3 0.5 4.2 2.3Deficit in balance of goods and services 21.6 21.0 2.7 3.8 10.5 11.6 11.1 7.7 0.6 2.1 6.5
Exports 43.5 39.7 53.4 46.5 42.6 37.2 36.5 38.5 41.7 28.2 15.8Imports 65.1 60.7 56.0 50.3 53.0 48.9 47.6 46.3 42.4 30.4 22.2
Net current transfers (negative = inflow) -0.7 -0.6 -0.7 -1.4 1.1 -0.7 -0.7 -0.6 -0.6 -0.6 -0.5 -0.3 -0.3 -0.3of which: official -0.3 -0.2 -0.2 -0.2 -0.2 -0.2 -0.2 -0.2 -0.2 -0.1 -0.2
Other current account flows (negative = net inflow) 4.8 2.0 0.7 1.7 0.6 -0.8 -0.9 -0.9 -0.4 -1.3 -1.9Net FDI (negative = inflow) -35.9 -16.7 -4.5 -19.1 14.2 -8.6 -17.8 -13.7 -17.1 -15.4 -12.1 -8.7 -4.2 -6.8Endogenous debt dynamics 2/ -7.5 1.2 12.6 -1.7 -0.6 0.7 -3.0 -3.2 -7.6 -3.9 -1.5
Contribution from nominal interest rate 1.8 3.2 5.7 6.3 6.9 7.5 7.3 7.0 6.1 3.0 1.8Contribution from real GDP growth -6.3 -11.3 -12.2 -8.0 -7.5 -6.8 -10.3 -10.2 -13.8 -6.9 -3.3Contribution from price and exchange rate changes -3.0 9.3 19.1 … … … … … … … …
Residual (3-4) 3/ 56.4 42.2 28.6 3.2 10.1 -3.3 2.1 3.3 9.6 1.6 -0.9of which: exceptional financing 0.0 0.0 0.0 0.0 0.0 0.0 0.0 0.0 0.0 0.0 0.0
PV of external debt 4/ ... ... 188.4 186.7 190.0 184.9 175.9 166.5 155.6 98.0 57.4In percent of exports ... ... 353.1 401.3 446.4 496.9 481.8 431.9 372.7 346.9 364.5
PV of PPG external debt ... ... 55.6 57.1 64.6 63.4 61.0 58.3 55.8 38.1 27.8In percent of exports ... ... 104.1 122.8 151.8 170.5 167.0 151.3 133.6 134.8 176.4In percent of government revenues ... ... 198.3 226.8 259.3 255.6 240.9 230.0 216.9 150.2 113.1
Debt service-to-exports ratio (in percent) 8.5 16.3 19.2 26.1 28.9 54.1 33.8 31.6 25.5 34.6 25.2PPG debt service-to-exports ratio (in percent) 2.2 5.9 4.6 6.7 8.2 32.8 12.4 11.9 9.1 23.2 20.8PPG debt service-to-revenue ratio (in percent) 3.2 7.5 8.8 12.5 14.1 49.1 17.8 18.1 14.7 25.8 13.3Total gross financing need (Millions of U.S. dollars) -433.3 2107.9 1617.8 1850.0 1398.0 2998.9 1376.9 1163.5 316.7 1638.6 5469.7Non-interest current account deficit that stabilizes debt ratio -13.0 -26.7 -36.7 7.1 8.2 16.3 18.0 15.3 10.1 10.9 6.7
Key macroeconomic assumptions
Real GDP growth (in percent) 12.3 11.6 7.8 10.8 7.4 4.4 4.2 3.8 6.2 6.4 9.2 5.7 6.9 5.8 6.5GDP deflator in US dollar terms (change in percent) 5.1 -8.6 -11.4 3.9 16.4 -0.5 0.9 2.1 2.2 2.1 1.0 1.3 1.5 1.8 1.5Effective interest rate (percent) 5/ 3.4 3.2 3.6 2.1 1.4 3.5 3.9 4.2 4.4 4.4 4.1 4.1 3.0 3.1 3.0Growth of exports of G&S (US dollar terms, in percent) -1.7 -6.9 28.4 17.7 30.5 -9.4 -3.8 -7.3 6.5 14.7 19.5 3.4 4.9 5.5 1.4Growth of imports of G&S (US dollar terms, in percent) 5.4 -4.8 -11.8 22.5 44.4 -6.8 11.0 -2.4 5.6 5.7 1.0 2.4 5.2 5.5 3.6Grant element of new public sector borrowing (in percent) ... ... ... ... ... -8.6 -13.8 -14.7 -2.4 -3.2 -4.0 -7.8 -6.7 -9.0 -7.5
Government revenues (excluding grants, in percent of GDP) 29.7 31.3 28.0 25.2 24.9 24.8 25.3 25.4 25.7 25.3 24.6 24.7
Aid flows (in Millions of US dollars) 7/ 44.0 22.2 34.6 64.8 46.6 35.1 36.1 37.2 38.3 45.5 68.3of which: Grants 18.2 0.0 0.0 32.1 26.4 8.5 8.1 7.8 7.5 6.1 4.2of which: Concessional loans 25.9 22.2 34.6 32.8 20.2 26.7 28.0 29.4 30.9 39.4 64.2
Grant-equivalent financing (in percent of GDP) 8/ ... ... ... -0.1 -1.1 -1.5 0.0 -0.1 -0.1 -0.2 -0.3 -0.2Grant-equivalent financing (in percent of external financing) 8/ ... ... ... -1.8 -11.5 -14.1 -1.1 -2.0 -2.9 -6.0 -8.7 -6.9
Memorandum items:Nominal dollar GDP growth 18.1 2.1 -4.5 4.0 5.1 6.0 8.5 8.6 10.4 7.1 8.5 7.7 8.1PV of PPG external debt (in Millions of US dollars) 6422 6893 8239 8622 9000 9364 9861 10181 15899(PVt-PVt-1)/GDPt-1 (in percent) 3.9 10.8 2.9 2.7 2.4 3.0 4.3 -1.1 1.3 1.1Gross workers' remittances (Millions of US dollars) 41.0 21.7 49.5 49.8 50.0 50.3 50.5 54.9 60.6 91.5 175.6PV of PPG external debt (in percent of GDP + remittances) ... ... 55.3 56.9 64.3 63.2 60.8 58.1 55.6 37.9 27.7PV of PPG external debt (in percent of exports + remittances) ... ... 103.3 121.7 150.4 168.9 165.4 150.0 132.6 133.3 173.1Debt service of PPG external debt (in percent of exports + remittances) ... ... 4.6 6.7 8.2 32.5 12.2 11.8 9.0 22.9 20.4
Sources: Country authorities; and staff estimates and projections.
1/ Includes both public and private sector external debt.2/ Derived as [r - g - ρ(1+g)]/(1+g+ρ+gρ) times previous period debt ratio, with r = nominal interest rate; g = real GDP growth rate, and ρ = growth rate of GDP deflator in U.S. dollar terms. 3/ Includes exceptional financing (i.e., changes in arrears and debt relief); changes in gross foreign assets; and valuation adjustments. For projections also includes contribution from price and exchange rate changes.4/ Assumes that PV of private sector debt is equivalent to its face value.5/ Current-year interest payments divided by previous period debt stock. 6/ Historical averages and standard deviations are generally derived over the past 10 years, subject to data availability. 7/ Defined as grants, concessional loans, and debt relief.8/ Grant-equivalent financing includes grants provided directly to the government and through new borrowing (difference between the face value and the PV of new debt).
Actual Projections
Table 1. Mongolia: External Debt Sustainability Framework, Baseline Scenario, 2012-2035 1/(in percent of GDP, unless otherwise indicated)
MO
NG
OLIA
IN
TERNATIO
NAL M
ON
ETARY FUN
D 11
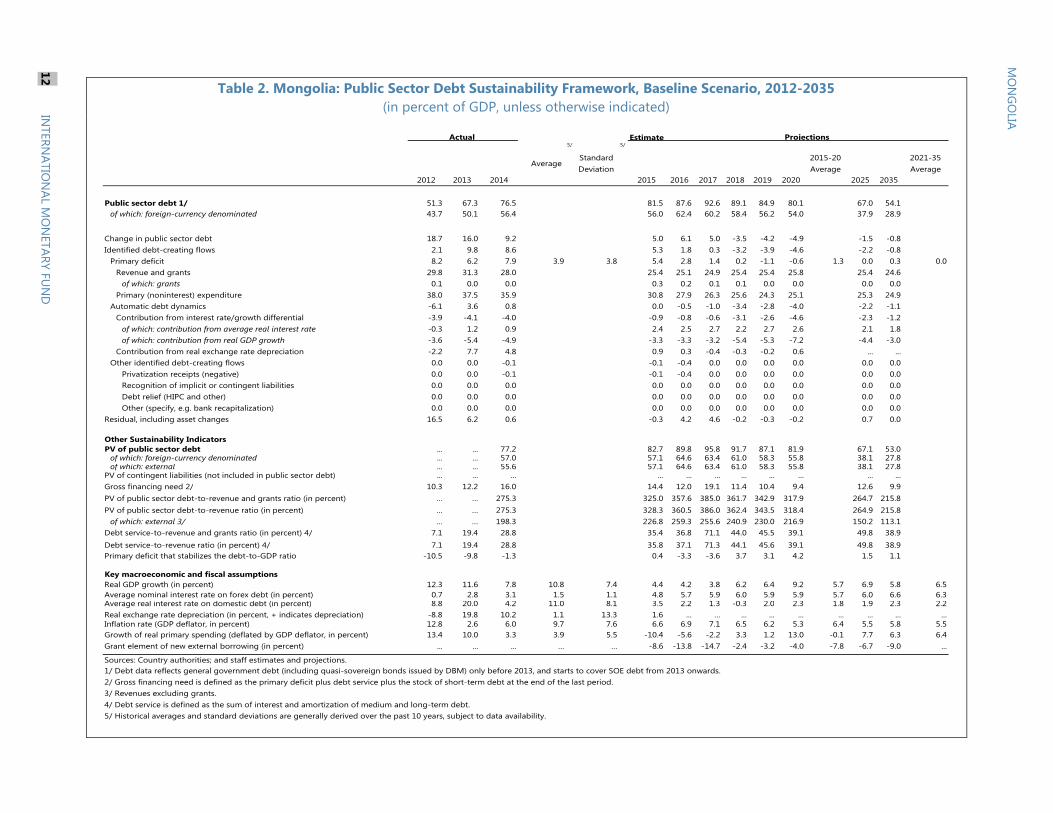
Estimate
2012 2013 2014
Average
5/
Standard Deviation
5/
2015 2016 2017 2018 2019 2020
2015-20 Average
2025 2035
2021-35 Average
Public sector debt 1/ 51.3 67.3 76.5 81.5 87.6 92.6 89.1 84.9 80.1 67.0 54.1of which: foreign-currency denominated 43.7 50.1 56.4 56.0 62.4 60.2 58.4 56.2 54.0 37.9 28.9
Change in public sector debt 18.7 16.0 9.2 5.0 6.1 5.0 -3.5 -4.2 -4.9 -1.5 -0.8Identified debt-creating flows 2.1 9.8 8.6 5.3 1.8 0.3 -3.2 -3.9 -4.6 -2.2 -0.8
Primary deficit 8.2 6.2 7.9 3.9 3.8 5.4 2.8 1.4 0.2 -1.1 -0.6 1.3 0.0 0.3 0.0Revenue and grants 29.8 31.3 28.0 25.4 25.1 24.9 25.4 25.4 25.8 25.4 24.6
of which: grants 0.1 0.0 0.0 0.3 0.2 0.1 0.1 0.0 0.0 0.0 0.0Primary (noninterest) expenditure 38.0 37.5 35.9 30.8 27.9 26.3 25.6 24.3 25.1 25.3 24.9
Automatic debt dynamics -6.1 3.6 0.8 0.0 -0.5 -1.0 -3.4 -2.8 -4.0 -2.2 -1.1Contribution from interest rate/growth differential -3.9 -4.1 -4.0 -0.9 -0.8 -0.6 -3.1 -2.6 -4.6 -2.3 -1.2
of which: contribution from average real interest rate -0.3 1.2 0.9 2.4 2.5 2.7 2.2 2.7 2.6 2.1 1.8of which: contribution from real GDP growth -3.6 -5.4 -4.9 -3.3 -3.3 -3.2 -5.4 -5.3 -7.2 -4.4 -3.0
Contribution from real exchange rate depreciation -2.2 7.7 4.8 0.9 0.3 -0.4 -0.3 -0.2 0.6 ... ...Other identified debt-creating flows 0.0 0.0 -0.1 -0.1 -0.4 0.0 0.0 0.0 0.0 0.0 0.0
Privatization receipts (negative) 0.0 0.0 -0.1 -0.1 -0.4 0.0 0.0 0.0 0.0 0.0 0.0Recognition of implicit or contingent liabilities 0.0 0.0 0.0 0.0 0.0 0.0 0.0 0.0 0.0 0.0 0.0Debt relief (HIPC and other) 0.0 0.0 0.0 0.0 0.0 0.0 0.0 0.0 0.0 0.0 0.0Other (specify, e.g. bank recapitalization) 0.0 0.0 0.0 0.0 0.0 0.0 0.0 0.0 0.0 0.0 0.0
Residual, including asset changes 16.5 6.2 0.6 -0.3 4.2 4.6 -0.2 -0.3 -0.2 0.7 0.0
Other Sustainability IndicatorsPV of public sector debt ... ... 77.2 82.7 89.8 95.8 91.7 87.1 81.9 67.1 53.0
of which: foreign-currency denominated ... ... 57.0 57.1 64.6 63.4 61.0 58.3 55.8 38.1 27.8of which: external ... ... 55.6 57.1 64.6 63.4 61.0 58.3 55.8 38.1 27.8
PV of contingent liabilities (not included in public sector debt) ... ... ... ... ... ... ... ... ... ... ...Gross financing need 2/ 10.3 12.2 16.0 14.4 12.0 19.1 11.4 10.4 9.4 12.6 9.9PV of public sector debt-to-revenue and grants ratio (in percent) … … 275.3 325.0 357.6 385.0 361.7 342.9 317.9 264.7 215.8PV of public sector debt-to-revenue ratio (in percent) … … 275.3 328.3 360.5 386.0 362.4 343.5 318.4 264.9 215.8
of which: external 3/ … … 198.3 226.8 259.3 255.6 240.9 230.0 216.9 150.2 113.1Debt service-to-revenue and grants ratio (in percent) 4/ 7.1 19.4 28.8 35.4 36.8 71.1 44.0 45.5 39.1 49.8 38.9Debt service-to-revenue ratio (in percent) 4/ 7.1 19.4 28.8 35.8 37.1 71.3 44.1 45.6 39.1 49.8 38.9Primary deficit that stabilizes the debt-to-GDP ratio -10.5 -9.8 -1.3 0.4 -3.3 -3.6 3.7 3.1 4.2 1.5 1.1
Key macroeconomic and fiscal assumptionsReal GDP growth (in percent) 12.3 11.6 7.8 10.8 7.4 4.4 4.2 3.8 6.2 6.4 9.2 5.7 6.9 5.8 6.5Average nominal interest rate on forex debt (in percent) 0.7 2.8 3.1 1.5 1.1 4.8 5.7 5.9 6.0 5.9 5.9 5.7 6.0 6.6 6.3Average real interest rate on domestic debt (in percent) 8.8 20.0 4.2 11.0 8.1 3.5 2.2 1.3 -0.3 2.0 2.3 1.8 1.9 2.3 2.2Real exchange rate depreciation (in percent, + indicates depreciation) -8.8 19.8 10.2 1.1 13.3 1.6 ... ... ... ... ... ... ... ... ...Inflation rate (GDP deflator, in percent) 12.8 2.6 6.0 9.7 7.6 6.6 6.9 7.1 6.5 6.2 5.3 6.4 5.5 5.8 5.5Growth of real primary spending (deflated by GDP deflator, in percent) 13.4 10.0 3.3 3.9 5.5 -10.4 -5.6 -2.2 3.3 1.2 13.0 -0.1 7.7 6.3 6.4Grant element of new external borrowing (in percent) ... ... ... … … -8.6 -13.8 -14.7 -2.4 -3.2 -4.0 -7.8 -6.7 -9.0 ...
Sources: Country authorities; and staff estimates and projections.1/ Debt data reflects general government debt (including quasi-sovereign bonds issued by DBM) only before 2013, and starts to cover SOE debt from 2013 onwards.2/ Gross financing need is defined as the primary deficit plus debt service plus the stock of short-term debt at the end of the last period. 3/ Revenues excluding grants.4/ Debt service is defined as the sum of interest and amortization of medium and long-term debt.5/ Historical averages and standard deviations are generally derived over the past 10 years, subject to data availability.
Actual Projections
Table 2. Mongolia: Public Sector Debt Sustainability Framework, Baseline Scenario, 2012-2035
(in percent of GDP, unless otherwise indicated)
12 IN
TERNATIO
NAL M
ON
ETARY FUN
D
MO
NG
OLIA

MONGOLIA
INTERNATIONAL MONETARY FUND 13
Table 3. Mongolia: Sensitivity Analysis for Key Indicators of Public Debt, 2015-2035
2015 2016 2017 2018 2019 2020 2025 2035
Baseline 83 90 96 92 87 82 67 53
A. Alternative scenarios
A1. Real GDP growth and primary balance are at historical averages 83 86 89 86 84 82 78 75A2. Primary balance is unchanged from 2015 83 93 103 105 107 108 120 153A3. Permanently lower GDP growth 1/ 83 92 100 99 97 95 103 171
B. Bound tests
B1. Real GDP growth is at historical average minus one standard deviations in 2016-2017 83 91 98 94 90 85 71 60B2. Primary balance is at historical average minus one standard deviations in 2016-2017 83 95 108 104 99 93 77 62B3. Combination of B1-B2 using one half standard deviation shocks 83 91 99 93 87 80 58 32B4. One-time 30 percent real depreciation in 2016 83 118 125 121 116 111 98 92B5. 10 percent of GDP increase in other debt-creating flows in 2016 83 101 107 103 98 92 76 61
Baseline 325 358 385 362 343 318 265 216
A. Alternative scenarios
A1. Real GDP growth and primary balance are at historical averages 325 342 357 337 329 320 308 304A2. Primary balance is unchanged from 2015 325 369 414 413 421 418 473 622A3. Permanently lower GDP growth 1/ 325 365 403 390 382 369 406 695
B. Bound tests
B1. Real GDP growth is at historical average minus one standard deviations in 2016-2017 325 361 392 370 352 328 280 243B2. Primary balance is at historical average minus one standard deviations in 2016-2017 325 379 435 409 389 362 305 252B3. Combination of B1-B2 using one half standard deviation shocks 325 362 397 367 342 312 230 128B4. One-time 30 percent real depreciation in 2016 325 469 503 477 458 431 388 375B5. 10 percent of GDP increase in other debt-creating flows in 2016 325 402 430 404 385 358 301 249
Baseline 35 37 71 44 45 39 50 39
A. Alternative scenarios
A1. Real GDP growth and primary balance are at historical averages 35 35 63 38 39 35 44 38A2. Primary balance is unchanged from 2015 35 37 72 46 49 45 67 82A3. Permanently lower GDP growth 1/ 35 37 74 47 49 44 65 90
B. Bound tests
B1. Real GDP growth is at historical average minus one standard deviations in 2016-2017 35 37 72 45 46 40 51 42B2. Primary balance is at historical average minus one standard deviations in 2016-2017 35 37 72 48 50 43 55 43B3. Combination of B1-B2 using one half standard deviation shocks 35 36 68 44 46 39 47 29B4. One-time 30 percent real depreciation in 2016 35 40 94 54 57 50 70 63B5. 10 percent of GDP increase in other debt-creating flows in 2016 35 37 74 48 49 43 54 43
Sources: Country authorities; and staff estimates and projections.1/ Assumes that real GDP growth is at baseline minus one standard deviation divided by the square root of the length of the projection period.2/ Revenues are defined inclusive of grants.
PV of Debt-to-GDP Ratio
Projections
PV of Debt-to-Revenue Ratio 2/
Debt Service-to-Revenue Ratio 2/

MONGOLIA
14 INTERNATIONAL MONETARY FUND
Table 4. Mongolia: Sensitivity Analysis for Key Indicators of Public and Publicly Guaranteed External Debt, 2015-2035
(in percent)
2015 2016 2017 2018 2019 2020 2025 2035
Baseline 57 65 63 61 58 56 38 28
A. Alternative Scenarios
A1. Key variables at their historical averages in 2015-2035 1/ 57 61 51 48 46 49 36 0A2. New public sector loans on less favorable terms in 2015-2035 2 57 65 66 64 62 60 46 42
B. Bound Tests
B1. Real GDP growth at historical average minus one standard deviation in 2016-2017 57 63 63 60 58 55 37 27B2. Export value growth at historical average minus one standard deviation in 2016-2017 3/ 57 67 73 70 67 64 45 30B3. US dollar GDP deflator at historical average minus one standard deviation in 2016-2017 57 72 83 80 77 73 50 36B4. Net non-debt creating flows at historical average minus one standard deviation in 2016-2017 4/ 57 78 88 85 81 78 57 33B5. Combination of B1-B4 using one-half standard deviation shocks 57 68 64 62 59 56 38 28B6. One-time 30 percent nominal depreciation relative to the baseline in 2016 5/ 57 89 88 85 81 77 53 38
Baseline 123 152 170 167 151 134 135 176
A. Alternative Scenarios
A1. Key variables at their historical averages in 2015-2035 1/ 123 143 138 131 119 117 128 0A2. New public sector loans on less favorable terms in 2015-2035 2 123 152 176 175 161 144 163 270
B. Bound Tests
B1. Real GDP growth at historical average minus one standard deviation in 2016-2017 123 148 167 163 148 130 131 171B2. Export value growth at historical average minus one standard deviation in 2016-2017 3/ 123 175 230 226 205 181 189 220B3. US dollar GDP deflator at historical average minus one standard deviation in 2016-2017 123 148 167 163 148 130 131 171B4. Net non-debt creating flows at historical average minus one standard deviation in 2016-2017 4/ 123 183 235 232 211 186 201 210B5. Combination of B1-B4 using one-half standard deviation shocks 123 147 139 136 123 108 108 143B6. One-time 30 percent nominal depreciation relative to the baseline in 2016 5/ 123 148 167 163 148 130 131 171
Baseline 227 259 256 241 230 217 150 113
A. Alternative Scenarios
A1. Key variables at their historical averages in 2015-2035 1/ 227 244 207 188 181 191 143 0A2. New public sector loans on less favorable terms in 2015-2035 2 227 260 264 253 245 234 181 173
B. Bound Tests
B1. Real GDP growth at historical average minus one standard deviation in 2016-2017 227 254 253 238 228 214 148 111B2. Export value growth at historical average minus one standard deviation in 2016-2017 3/ 227 271 293 277 265 250 179 120B3. US dollar GDP deflator at historical average minus one standard deviation in 2016-2017 227 291 336 317 302 284 196 147B4. Net non-debt creating flows at historical average minus one standard deviation in 2016-2017 4/ 227 313 353 334 321 302 223 135B5. Combination of B1-B4 using one-half standard deviation shocks 227 274 260 245 233 220 150 115B6. One-time 30 percent nominal depreciation relative to the baseline in 2016 5/ 227 359 355 335 320 301 208 156
PV of debt-to-exports ratio
PV of debt-to-revenue ratio
PV of debt-to GDP ratio
Projections

MONGOLIA
INTERNATIONAL MONETARY FUND 15
Table 4. Mongolia: Sensitivity for Key Indicators of Public and Publicly Guaranteed External Debt, 2015-2035 (continued)
(in percent)
Baseline 7 8 33 12 12 9 23 21
A. Alternative Scenarios
A1. Key variables at their historical averages in 2015-2035 1/ 7 8 28 10 9 7 16 0A2. New public sector loans on less favorable terms in 2015-2035 2 7 8 32 12 12 9 20 29
B. Bound Tests
B1. Real GDP growth at historical average minus one standard deviation in 2016-2017 7 8 33 12 12 9 23 21B2. Export value growth at historical average minus one standard deviation in 2016-2017 3/ 7 9 39 16 16 12 30 27B3. US dollar GDP deflator at historical average minus one standard deviation in 2016-2017 7 8 33 12 12 9 23 21B4. Net non-debt creating flows at historical average minus one standard deviation in 2016-2017 4/ 7 8 35 16 15 12 31 26B5. Combination of B1-B4 using one-half standard deviation shocks 7 8 28 10 10 8 20 17B6. One-time 30 percent nominal depreciation relative to the baseline in 2016 5/ 7 8 33 12 12 9 23 21
Baseline 12 14 49 18 18 15 26 13
A. Alternative Scenarios
A1. Key variables at their historical averages in 2015-2035 1/ 12 13 42 14 13 11 18 0A2. New public sector loans on less favorable terms in 2015-2035 2 12 14 47 18 18 15 22 19
B. Bound Tests
B1. Real GDP growth at historical average minus one standard deviation in 2016-2017 12 14 50 18 18 15 26 13B2. Export value growth at historical average minus one standard deviation in 2016-2017 3/ 12 14 50 20 20 17 29 15B3. US dollar GDP deflator at historical average minus one standard deviation in 2016-2017 12 16 66 24 24 20 35 18B4. Net non-debt creating flows at historical average minus one standard deviation in 2016-2017 4/ 12 14 52 23 23 20 34 17B5. Combination of B1-B4 using one-half standard deviation shocks 12 14 53 19 19 15 28 14B6. One-time 30 percent nominal depreciation relative to the baseline in 2016 5/ 12 20 70 25 26 21 37 19
Memorandum item:Grant element assumed on residual financing (i.e., financing required above baseline) 6/ -14 -14 -14 -14 -14 -14 -14 -14
Sources: Country authorities; and staff estimates and projections.
1/ Variables include real GDP growth, growth of GDP deflator (in U.S. dollar terms), non-interest current account in percent of GDP, and non-debt creating flows. 2/ Assumes that the interest rate on new borrowing is by 2 percentage points higher than in the baseline., while grace and maturity periods are the same as in the baseline.3/ Exports values are assumed to remain permanently at the lower level, but the current account as a share of GDP is assumed to return to its baseline level after the shock (implicitly assumingan offsetting adjustment in import levels). 4/ Includes official and private transfers and FDI.5/ Depreciation is defined as percentage decline in dollar/local currency rate, such that it never exceeds 100 percent.6/ Applies to all stress scenarios except for A2 (less favorable financing) in which the terms on all new financing are as specified in footnote 2.
Debt service-to-revenue ratio
Debt service-to-exports ratio

Statement by the Staff Representative on Mongolia April 3, 2015
This statement summarizes additional information on economic developments and policies that have become available since the staff report was issued. This information does not alter the thrust of the staff appraisal.
1. The most recent economic data have been broadly as envisaged. Inflation has continued to moderate, dropping to 9¼ percent in February. The economy registered a trade surplus in the first two months of the year, with exports up 27 percent over 2014, and imports down 25 percent, but the overall balance of payments remains in deficit. Fiscal revenue has stayed weak, with collections in the first two months of the year accounting for 11 percent of the annual budget.
2. The authorities have confirmed their agreement with many of the key Article IV recommendations and are in the process of implementing policy changes. In a letter shared with staff on March 26, 2015, they outlined their policy intentions, including their commitment to a medium-term fiscal consolidation path, and detailed their recent policy efforts. In particular:
The authorities are targeting a fiscal deficit of 5 percent of GDP in 2015, including the “non-commercial” spending of the Development Bank of Mongolia (DBM), and intend to reduce this gradually to 2 percent of GDP by 2018.
The authorities have linked the payment of civil-service wage increases—about ½ percent of GDP, and restricted to lower-income workers—to budget revenue performance and scheduled such payments for the end of the year. They are also considering the possibility of freezing DBM spending.
Remaining loans under the Price Stabilization Program (PSP) will be transferred to the government balance sheet by end-June. Working groups have been set up to analyze the appropriate future for PSP and mortgage lending.
A comprehensive set of measures is envisaged to strengthen DBM governance. In particular, an independent assessment—possibly with assistance from the World Bank—will be conducted to determine the bankability of the DBM’s “commercial projects,” and the DBM will be brought under supervision of the Bank of Mongolia (BOM).
The authorities consider measures to protect the most vulnerable as a high priority and are considering options to strengthen the effectiveness of existing social programs with high impact on the poor (such as child allowances and food stamps).
The authorities are committed to exchange-rate flexibility.

2
In order to strengthen the banking system, the BOM intends, over 2015–17, to: increase loan loss provisions; tighten requirements for recognition of nonperforming loans; increase the minimum paid-in capital of banks; raise the Tier-1 capital adequacy ratio (CAR) to 10½ percent for systemically important banks; incorporate PSP loans into banks’ CAR calculations; increase sectoral risk weights; and impose additional capital requirements on banks with higher risk profiles.
The authorities are working on a range of steps, including tax measures, to improve the investment climate.
3. The authorities’ efforts to strengthen policies are welcome, although additional steps will be needed, and full and early implementation will be critical.

Press Release No. 15/169
FOR IMMEDIATE RELEASE
IMF Executive Board Concludes 2015 Article IV Consultation with Mongolia
On April 3, 2015, the Executive Board of the International Monetary Fund (IMF) concluded the 2015 Article IV Consultation1 with Mongolia.
Medium- to long-term prospects are promising given Mongolia’s large natural resources. In the near term, however, the country continues to face balance-of-payments (BOP) pressures on account of low foreign direct investment (FDI) and weak commodity prices, as well as expansionary macro policies. Imports have now started to taper off, and, with the first phase of the Oyu Tolgoi copper and gold mine now in operation, exports have picked up. The trade balance has thus improved, but with FDI and other financial-account flows still depressed, the overall BOP remains weak. In addition, public debt has risen sharply, and the banking sector should be watched closely in the wake of the rapid credit expansion over the past two years. Barring a change in policies and/or major new developments in the real economy, these trends are likely to continue. Risks are to the downside, and relate to possible difficulties in securing agreement on major investment projects, as well as to the possibilities of a further slowdown in China or a surge in global financial market volatility. Recognizing these challenges, the new government has already taken some policy action. It has implemented a “Comprehensive Macro Adjustment Plan” which targets a substantial reduction in the fiscal deficit, phases out some of the Bank of Mongolia’s unconventional easing programs, and introduces a number of structural measures to boost exports and substitute for imports. However, additional measures—now under discussion—are needed to underpin the fiscal deficit targets, strengthen monetary and banking-sector policies, and ensure the most vulnerable are protected from the impact of the necessary macro adjustment. Executive Board Assessment
Executive Directors noted that Mongolia’s economic prospects remain promising over the medium to long term given its natural resource wealth, although the country faces substantial macroeconomic challenges in the near term. Directors welcomed the policy adjustment envisaged by the authorities and called for further adjustment to strengthen the balance of payments and public finances, safeguard financial stability, and strengthen social safety nets. 1 Under Article IV of the IMF's Articles of Agreement, the IMF holds bilateral discussions with members, usually every year. A staff team visits the country, collects economic and financial information, and discusses with officials the country's economic developments and policies. On return to headquarters, the staff prepares a report, which forms the basis for discussion by the Executive Board. At the conclusion of the discussion, the Managing Director, as Chairman of the Board, summarizes the views of Executive Directors, and this summary is transmitted to the country's authorities. An explanation of any qualifiers used in summings up can be found here: http://www.imf.org/external/np/sec/misc/qualifiers.htm.
International Monetary Fund Washington, D.C. 20431 USA

Directors agreed that an ambitious consolidation approach would be needed to strengthen the fiscal position. They welcomed the steps already taken and the authorities’ readiness to undertake additional fiscal reforms. Directors saw scope for further cuts in public spending, including that of the Development Bank of Mongolia (DBM), complemented with measures to raise revenue, protect the poor, and improve the effectiveness of subsidies and other social programs. They looked forward to the passage of a supplementary budget that includes these measures. Directors also supported the authorities’ intention to phase out unconventional easing programs by the central bank and encouraged them to bring all DBM spending onto the budget. Directors agreed on the need for some monetary tightening, while ensuring that banks remain adequately liquid, to help control credit growth and strengthen the balance of payments. They also encouraged the central bank to limit deficit financing. These steps should be complemented with continued efforts to enhance governance at the central bank and the DBM. Noting the role of exchange rate flexibility as a shock absorber for the economy, Directors agreed that foreign exchange intervention should be limited to smoothing excessive volatility. Directors recommended a comprehensive approach to addressing risks in the banking system. They considered it a priority to bolster banks’ provisions and capital buffers, eliminate forbearance, strengthen risk recognition, and enhance supervisory and crisis preparedness frameworks. Directors commended the authorities for the progress in strengthening the regime against money laundering and terrorism financing. Directors supported ongoing efforts to foster high, inclusive growth, by improving the investment climate, enhancing competitiveness, and promoting economic diversification. More broadly, they emphasized that prudent management of natural resources is critically important for lasting growth and inter-generational equity. It is expected that the next Article IV consultation with Mongolia will be held on the standard 12-month cycle.

Mongolia: Selected Economic and Financial Indicators, 2011–15 (Baseline Scenario)
2011 2012 2013 2014 2015
Proj.
Real sector (percent change)
Real GDP growth 17.3 12.3 11.6 7.8 4.4
Mineral 7.7 8.3 19.4 24.2 9.0
Non-mineral 19.9 13.3 9.8 3.6 3.0
Consumer prices (end-period) 9.4 14.2 11.2 10.7 8.0
GDP deflator 15.1 12.8 2.6 6.0 6.6
General government budget (in percent of GDP)
Revenue and grants 33.9 29.8 31.3 28.0 25.4
Expenditure and net lending 1/ 37.9 38.9 40.2 39.0 35.2
On-budget balance (incl. grants) -4.0 -6.2 -0.9 -4.2 -4.0
On-budget structural balance (excluding DBM spending) … … -1.2 -4.3 -4.2
DBM spending … 2.8 8.0 6.8 5.7
On-budget plus DBM balance -4.0 -9.1 -8.9 -11.0 -9.8
Money and credit (percent change)
Broad money 37.7 18.8 24.1 12.5 13.1
Private credit 2/ 72.3 24.1 54.3 23.3 16.2
Interest rate on 7-day central bank bills, end-period (percent) 12.3 13.3 10.5 12.0 …
Balance of payments (in millions of US$)
Current account balance (including official transfers) -2759 -3362 -3192 -985 -1379
(In percent of GDP) -26.5 -27.4 -25.4 -8.2 -11.1
Trade balance -993 -1553 -1321 1002 844
Exports 4817 4385 4269 5775 5155
Imports -5810 -5938 -5590 -4773 -4310
Foreign direct investment 4620 4408 2098 542 1069
Public and publicly guaranteed debt (in percent of GDP)
Total public debt 3/ 32.7 51.3 67.3 76.5 81.5
Domestic debt 9.1 12.3 21.1 21.6 25.6
External debt 23.5 39.0 46.3 54.9 56.0
Exchange rate
Togrogs per US$ (end-period) 1396.4 1392.1 1659.3 1888.4 …
Togrogs per US$ (period average) 1265.5 1357.6 1523.9 1817.9 …
Nominal effective exchange rate (end-period; percent change) -10.6 -2.0 -14.7 -4.9 …
Real effective exchange rate (end-period; percent change) -5.8 9.0 -7.5 3.4 …
Nominal GDP (in billions of togrogs) 13174 16688 19118 21844 24315
Sources: Mongolian authorities; and IMF staff estimates.
1/ Includes DBM spending.
2/ Includes securitized mortgage loans.
3/ Debt data reflects general government debt (including quasi-sovereign bonds issued by DBM) only before 2013, and starts to cover SOE debt from 2013 onwards. External debt includes drawing of central bank swap line.

Statement by Barry Sterland, Executive Director for Mongolia and Dorjkhand Togmid Advisor to Executive Director
April 3, 2015
On behalf of the Mongolian authorities, we would like to thank the mission team for their candid policy consultation and the effective engagement. The current Government was formed in November 2014 and has set about dealing with the macroeconomic challenges it inherited. Mongolian Authorities are in broad agreement with staff’s analysis and policy recommendations, especially on the strengthening fiscal position, maintaining prudent monetary policy, bolstering financial stability and improving the investment climate. The Authorities have commenced concrete actions to adjust macroeconomic and financial policies in response to all the broad areas of weakness identified by the staff. They express their willingness to address the macroeconomic and development challenges facing Mongolia through continued cooperation with the Fund. Economic Outlook Mongolia has made strong development progress in recent years, retains enormous long-run economic potential, but faces challenges in ensuring sustained and stable growth in the short to medium-term. Economic growth of Mongolia remained at 7.8 percent and per capita income reached $4,000 in 2014, but growth is expected to slow in the next few years. The economy remains vulnerable to boom-bust cycles and has faced sharp declines in FDI over the past few years. Mongolia faced a severe balance of payment shock in late 2012 throughout 2013 and 2014 though measures were taken to achieve a soft landing. Commodities super cycle turned down, capital flows toward emerging markets and developing economies reversed, and net foreign direct investment to GDP ratio substantially declined from 45 percent to only 5 percent over the last three years. The balance of payment shock was particularly intense in 2013 though authorities consider the impacts on trade, the current account, and economic activity were significantly lessened in 2014 as a result of policy adjustments. Real GDP growth gradually slowed down from 12.3 percent in 2012 to 11.6 percent in 2013 and 7.8 percent in 2014. Inflation has decreased gradually in past years and appears broadly under control, and actions have been taken to slow credit and money growth. Annual CPI inflation decreased from 14.0 percent in 2012 to 9.3 percent as of February 2015. Supply-driven inflationary pressure has been substantially decreased. The Bank of Mongolia (BOM) has gradually tightened its monetary policy stance by increasing the policy interest rate twice, 1.5 percentage points in July 2014 and 1.0 percentage point to 13 percent in January 2015. Real interest rates are now strongly positive and money and credit growth have slowed significantly. These decisions have reduced aggregate demand and the current account deficit, curbed inflationary pressure, and promoted macroeconomic and financial stability.

2
Uncertainty in the balance of payment outlook still remains a concern, and the authorities are pursuing a range of options to reduce risks on this front. The baseline forecast indicates that overall balance of payment could face a 1.4 billion dollars financing deterioration in 2015 due to mainly unfavorable external environment for the mineral exports and a sharp fall of the FDI inflows in the past two years. We note that recent import data has been weaker than the assumptions of this baseline which, if this weakness persists, may assist in ameliorating financing needs. However, authorities accept that a range of actions must be explored to deal with this challenge. They are working closely with a range of international financial organizations and bilateral partners on the possible options for external financing to fill this gap, including the extension of the local currency swap facility between the BOM and PBOC that has been playing a crucial role in mitigating the impacts of the shocks. The authorities have indicated that the PBOC has reaffirmed that it is fully committed to continuing the facility and willing to extend the swap line. Ongoing close consultation with the IMF and responsiveness to its recommendations will assist in this process of engagement with other financing partners. Furthermore, efforts are ongoing to advance negotiations on major projects with a significant potential impact on development and FDI flows. Finally, authorities stand ready to take additional corrective action, if required, to deal with unfolding risks, by adjusting import-intensive spending or fiscal policy. Fiscal Policy The authorities are committed to significant reductions in structural deficit targets, including limiting off-budget and reducing quasi-fiscal operations and integrating them into the Budget. In order to strengthen Mongolia’s fiscal position, the authorities have secured Parliamentary approval of the Amendment to the Fiscal Stability Law (FSL), Debt Management Law (DML), and the Comprehensive Macroeconomic Adjustment Program (CMAP). As a result, the authorities will achieve a 2015 fiscal deficit of 5 percent of GDP, including non-commercial Development Bank of Mongolia (DBM) investment, decreasing the deficit by 1 percentage point for each year to reach the deficit target of 2 percent of GDP by 2018 and implement a cost-saving regime in the budget through prioritizing spending. Concrete measures have been introduced to cut budget expenditures and increase the revenue in line with these fiscal objectives. Budget resources earmarked for civil servants’ wage increase have been decreased by 60 percent and targeted at maintaining real wages of low wage earners, equivalent to a reduction in spending by 0.6 percent of GDP. Authorities are considering ways of targeting non-social welfare related subsidies. On the revenue side, the authorities increased the customs duties and excise tax rates on imported oil, in response to the recent declines of oil prices. The Government of Mongolia has started implementing recommendations of international financial organizations to limit off-budget and quasi-fiscal operations and

3
integrate them to the budget. The parliament has agreed to the integration of off-budget ‘quasi fiscal’ spending into the central budget. This includes several programs currently operated by the Bank of Mongolia. A comprehensive set of actions are being undertaken to improve the legal environment and governance structure of the DBM to match international principles and standards and to ensure the successful operation of the bank in international financial markets. As a first step, the authorities are planning to transfer non-commercial lending activities in the pipeline of the DBM to the budget after conducting an independent assessment on the portfolio. While commercial DBM spending is not being fully integrated with central budget at this stage controls are being greatly enhanced to ensure these investments are driven by market considerations. The Minister of Finance will now approve financing of projects and activities included in the 2015 budget, to ensure consistency with the budget deficit and macroeconomic conditions (including BOP requirements). Furthermore, the DBM shall now obtain the Finance Minister’s opinion when taking on a direct or contingent liability or any other explicit or implicit financial obligations regarding the consistency of any such liabilities with the FSL. Controls are being put in place to prevent political intervention in decision making processes, and more generally, improve governance and oversight. Another key element regarding control is that the Finance Minister and the Governor of the Bank of Mongolia will jointly approve supervision rules on DBM operations, effectively putting the DBM under the BOM supervision. Amendments along these lines will be introduced to Parliament in the Spring Session. The authorities are also investigating the potential to transfer key social programs currently in the Future Heritage Fund to the central budget. The authorities will keep fiscal settings under review to ensure public debt is managed appropriately. The Medium-term Debt Management Strategy and the Comprehensive External Debt Servicing Plan have been revised in accordance with the newly adopted Debt Management Law and the CMAP was approved by the Financial Stability Committee on March 13 of this year. Under this approach, the authorities will initiate active debt and liability management operations to ensure further debt is serviced or rolled over in a way that is consistent with macroeconomic stability. The authorities are taking step to underpin Mongolia’s long time fiscal future through the establishment of a sovereign wealth fund. The draft Law on Future Heritage Fund is expected to be reviewed and passed during the 2015 Spring Session of the Parliament. The fund would be designed consistent with international best practices. The aim is to ‘ring fence’ a certain portion of mining revenues to support future development needs, while also supporting the realization of counter-cyclical policies. Monetary and Exchange Rate Policy Supply-driven inflationary pressure has been substantially decreased and inflation appears broadly under control. There has been a positive change in the composition of inflation since
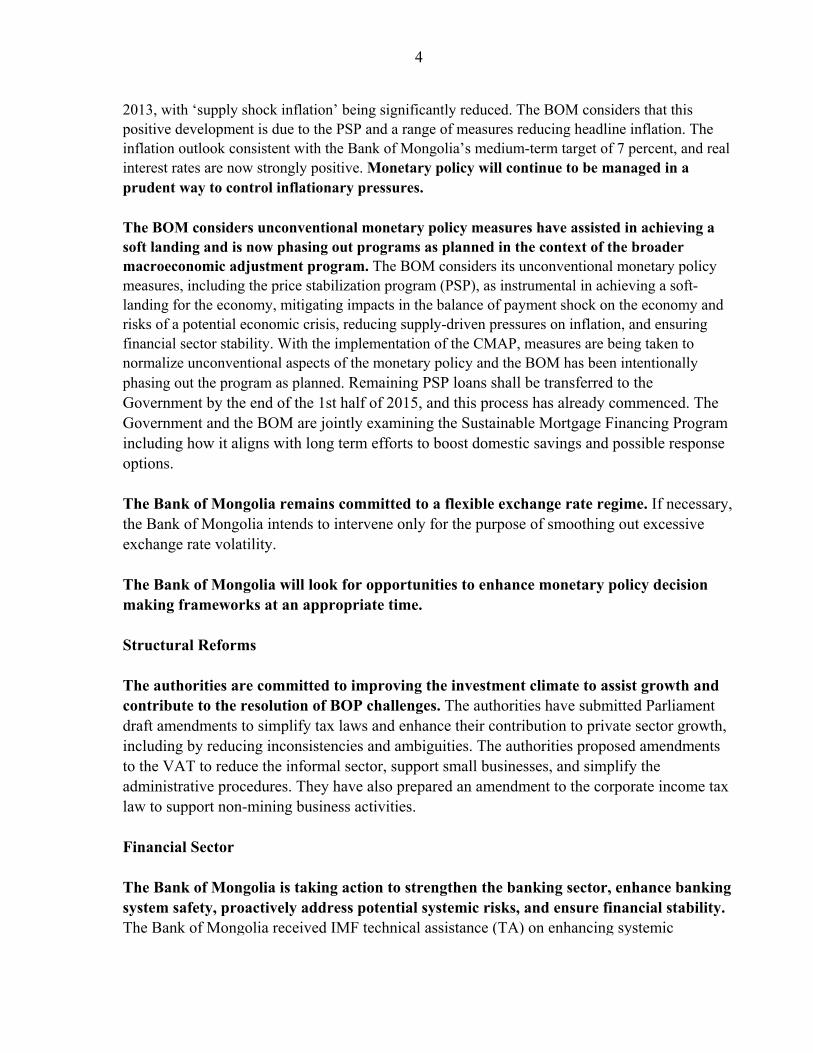
4
2013, with ‘supply shock inflation’ being significantly reduced. The BOM considers that this positive development is due to the PSP and a range of measures reducing headline inflation. The inflation outlook consistent with the Bank of Mongolia’s medium-term target of 7 percent, and real interest rates are now strongly positive. Monetary policy will continue to be managed in a prudent way to control inflationary pressures.
The BOM considers unconventional monetary policy measures have assisted in achieving a soft landing and is now phasing out programs as planned in the context of the broader macroeconomic adjustment program. The BOM considers its unconventional monetary policy measures, including the price stabilization program (PSP), as instrumental in achieving a soft-landing for the economy, mitigating impacts in the balance of payment shock on the economy and risks of a potential economic crisis, reducing supply-driven pressures on inflation, and ensuring financial sector stability. With the implementation of the CMAP, measures are being taken to normalize unconventional aspects of the monetary policy and the BOM has been intentionally phasing out the program as planned. Remaining PSP loans shall be transferred to the Government by the end of the 1st half of 2015, and this process has already commenced. The Government and the BOM are jointly examining the Sustainable Mortgage Financing Program including how it aligns with long term efforts to boost domestic savings and possible response options. The Bank of Mongolia remains committed to a flexible exchange rate regime. If necessary, the Bank of Mongolia intends to intervene only for the purpose of smoothing out excessive exchange rate volatility. The Bank of Mongolia will look for opportunities to enhance monetary policy decision making frameworks at an appropriate time. Structural Reforms The authorities are committed to improving the investment climate to assist growth and contribute to the resolution of BOP challenges. The authorities have submitted Parliament draft amendments to simplify tax laws and enhance their contribution to private sector growth, including by reducing inconsistencies and ambiguities. The authorities proposed amendments to the VAT to reduce the informal sector, support small businesses, and simplify the administrative procedures. They have also prepared an amendment to the corporate income tax law to support non-mining business activities. Financial Sector The Bank of Mongolia is taking action to strengthen the banking sector, enhance banking system safety, proactively address potential systemic risks, and ensure financial stability. The Bank of Mongolia received IMF technical assistance (TA) on enhancing systemic

5
oversight and crisis preparedness capabilities in February 2015. The Bank of Mongolia has already started implementing the recommended actions provided by the TA by reflecting them in its Medium term strategy on banking supervision, including phasing in measures to ensure better risky loan recognition, improve provisioning and capital buffers, and improve risk weights among other actions. These actions will be implemented progressively. Conclusion The Mongolian authorities are committed to taking decisive action to ensure macroeconomic stability, thus laying a sound basis for longer term development. They are implementing measures across a wide range of areas, including those identified by Fund staff, and understand the need to further transition policy if circumstances require. Authorities greatly value ongoing engagement with the Fund and will keep staff recommendations under close review.