monetary policy issues in the nordic countries after 1992 · monetary policy issues in the nordic...
TRANSCRIPT
Monetary policy issues in the Nordic countriesafter 1992
Stefan Gerlach*
Introduction
The turmoil in European foreign exchange markets in 1992–93 had alarge impact on monetary policy in the Nordic countries. Followingdouble-digit inflation in the early 1980s, monetary policy had, as else-where in Europe, increasingly been geared to reducing inflation tolevels similar to those experienced in Germany. A central element ofthis strategy was a gradual hardening of the exchange rate regime. Thishardening took two forms. First, policy-makers had sought to avoiddevaluations of the Nordic currencies. Thus, Sweden and Denmark hadmaintained their exchange rate parities since 1982, and Norway since1986. Before the devaluation in November 1991, which served as aprecursor to the events of 1992, the Finnish markka had also remainedstable for almost a decade, having last been devalued in 1982 (andrevalued in 1989).1 In Iceland, where inflation averaged 40% per year inthe 1980s, the authorities had maintained the exchange rate parity sinceDecember 1989, which was the longest period of exchange rate stabilityexperienced since the early 1970s. The second element was the shift frompegging to trade-weighted currency baskets to pegging to the ECU, whichimposed a tighter constraint on policy. While Denmark was a foundingmember of the ERM and thus had pegged to the ECU for more than 10years, Norway introduced unilateral pegs to the ECU in October 1991,followed by Sweden in May 1991 and Finland in June 1991. In Icelandpolicy-makers were also contemplating the introduction of a unilateralECU peg.2
The events of 1992 changed all this. The storm first reached Finland,
230
* The author is grateful to Palle Andersen, Pentti Pikkarainen and Lars Svensson for helpfulcomments.
1 In addition, the markka was also adjusted twice within the fluctuation margins in the1980s. See Lehmussaari et al. (1994).
2 See Gudmundsson (1994b), p. 137.
which abandoned its ECU peg and let the currency float in September1992, followed by Sweden in November and Norway in December. Inresponse to the worsening of the Icelandic competitiveness of these andother depreciations in Europe, the Icelandic króna was devalued inNovember 1992. A further devaluation was undertaken in June 1993 inresponse to the macroeconomic effects of an expected reduction in thefish catch. However, the central parity and the fluctuation band weremaintained. While Denmark maintained its ECU parity, the band widthwas increased in the generalised broadening of the fluctuation margins inthe ERM in August 1993.
While the Swedish krona, the Norwegian krone and the Finnishmarkka all were floated, the role of the exchange rate in the design ofmonetary policy soon came to differ sharply in the three countries. Aftera brief depreciation, the Norwegian krone stabilised in a narrow bandimmediately below its previous ECU parity, and policy was increasinglygeared towards maintaining it at this level. In Sweden and Finland, aftersharp depreciations of the krona and markka, the central banks adoptedinflation targets in early 1993. The subsequent appreciation of the Finnishmarkka enabled the currency to join the ERM in October 1996. Thus, bythe spring of 1997, the exchange rate once again played the role ofnominal anchor for policy in Denmark, Iceland, Norway, and in Finland,where ERM membership is combined with a quantitative inflation target.Only in Sweden is policy geared directly to the ultimate goal of pricestability through the use of a quantitative inflation target without the guid-ance of an intermediate objective.
This paper provides an overview of three factors that have had afundamental impact on monetary policy in the Nordic countries since1992: the state of macroeconomic conditions in the early 1990s, thechanges in overall framework of monetary policy after 1992, and the shiftsin credibility experienced since the exchange market turmoil. It is organ-ised as follows. Section 1 reviews the macroeconomic conditions in the areain the early 1990s. The section argues that the size of the macroeconomicimbalances differed quite substantially between the Nordic countries, andthat policy-makers’ ability to withstand the speculative pressures againstthe exchange rates was much more limited in those countries in whichthe imbalances were more severe. The section also argues that theoptions open to policy-makers following the floating of the currenciesdepended on macroeconomic conditions.
231
Section 2 reviews changes in the monetary policy framework in theNordic area after 1992. The section compares the inflation targetsadopted in Sweden and Finland in 1993, and then turns to Norway, Icelandand Denmark. The section also compares some structural aspects of theNordic countries with eleven other small and medium-sized economies.While there are some differences between them, the Nordic countriesare on average somewhat less open than the other countries, theirexports are less diversified, and they have experienced larger externalshocks. Furthermore, output fluctuations in the Nordic area tend tobe less correlated with cyclical fluctuations elsewhere. These factorsillustrate the problems experienced by the authorities in conductingmonetary and exchange rate policy in the early 1990s.
The central policy question in the Nordic countries following theexchange market turmoil in 1992–93 was how to conduct policy in anenvironment of large shifts in the public’s perception of the credibility of
monetary policy. Section 3 contains a brief review of the credibility of theexchange rate objectives in the Nordic countries in the 1992–93 period,and provides some evidence of changes in short-run inflation expecta-tions since 1990. These suggest that the Finnish and Swedish inflationtargets are both seen as credible in the near term. The section alsoreviews the behaviour of spreads between 10-year yields in the Nordiccountries and Germany, and provides some simple econometric estimatessuggesting that domestic inflation and growth of industrial production,which may be indicators of future inflation pressures, have influenced thespreads over German rates.
1. The Nordic countries and the exchange market eventsof 1992
A striking aspect of the foreign exchange markets events of 1992 and 1993is that the Nordic countries were affected to such varying degrees. WhileDenmark managed to endure the episode with no change of its monetarypolicy framework and with an unaltered central parity, Finland andSweden were quickly forced to let their currencies float, and policy-makers in both countries felt that the imbalances were too large topermit the adoption of new exchange rate commitments immediatelyafter the floating of the currencies. In Norway and Iceland, the authorities
232
233
– 8
– 4
0
4
8
– 8
– 4
0
4
8
– 8
– 4
0
4
8
– 8
– 4
0
4
8
85 87 89 91 93 95
– 8
– 4
0
4
8
12
16
20
24
28
32
36
85 87 89 91 93 95
Output gap1
Inflation2
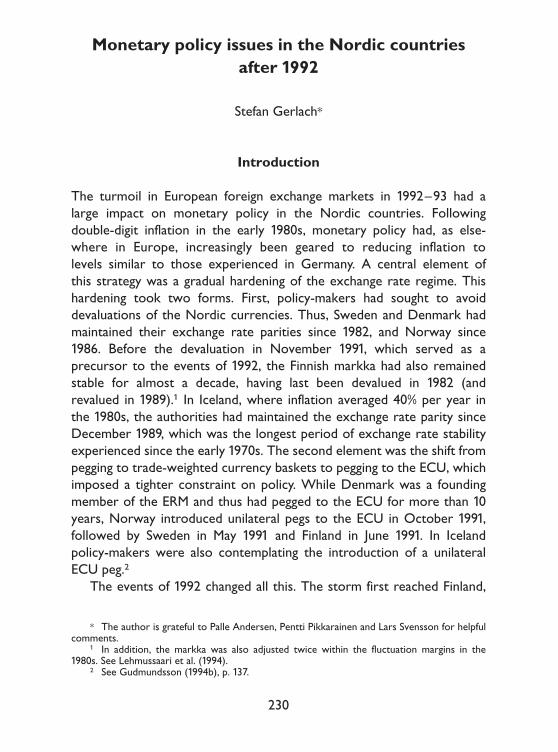
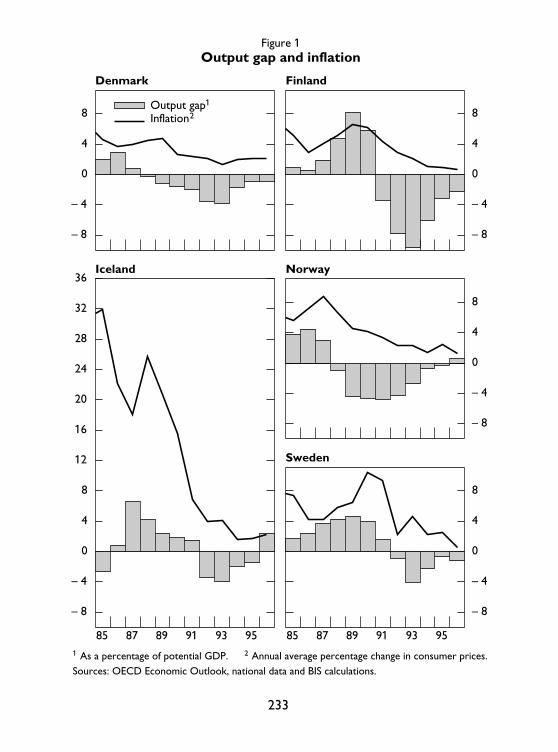
Figure 1
1 As a percentage of potential GDP. 2 Annual average percentage change in consumer prices.Sources: OECD Economic Outlook, national data and BIS calculations.
Output gap and inflation
Denmark Finland
Iceland Norway
Sweden
234
– 6
– 4
– 2
0
2
4
– 6
– 4
– 2
0
2
– 10
– 8
– 6
– 4
– 2
0
2
4
6
8
– 14
– 12
– 10
– 8
– 6
– 4
– 2
0
2
4
6
85 87 89 91 93 95– 8
– 6
– 4
– 2
0
2
4
6
8
10
85 87 89 91 93 95
Financial balance1
Structural balance2
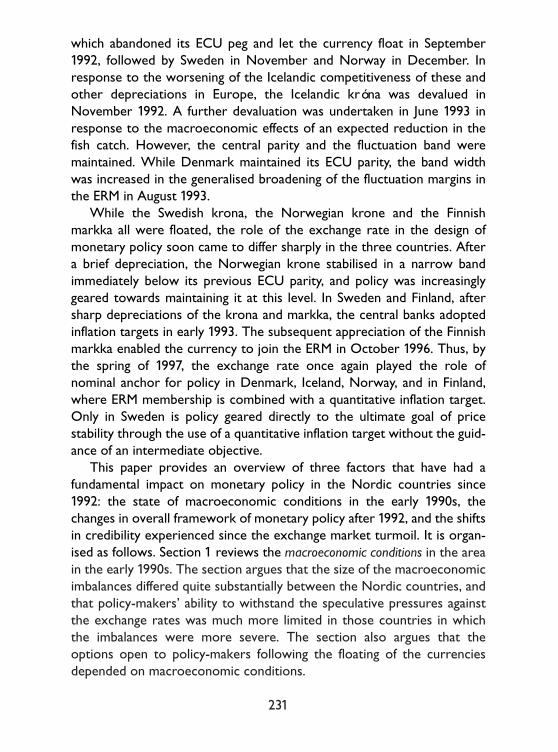
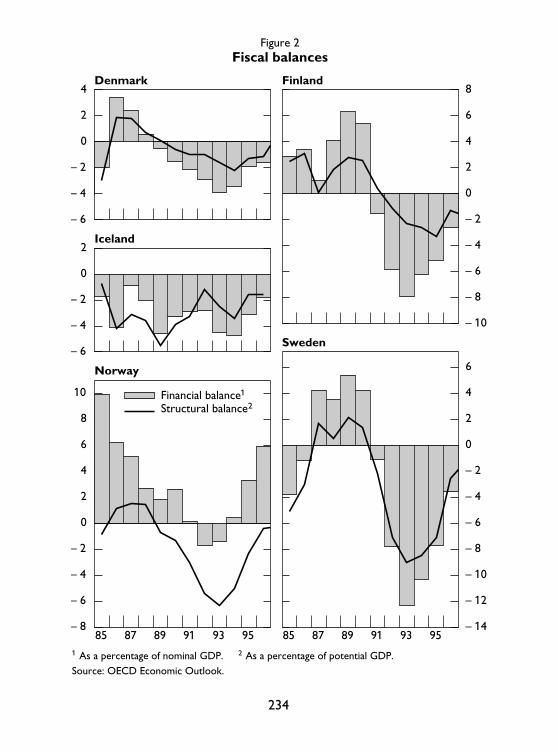
Figure 2
1 As a percentage of nominal GDP. 2 As a percentage of potential GDP.Source: OECD Economic Outlook.
Fiscal balances
Denmark Finland
Iceland
Norway
Sweden
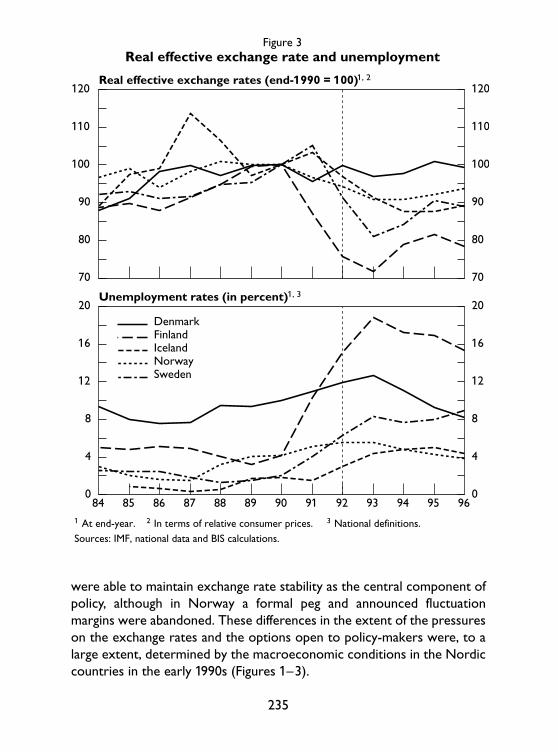
were able to maintain exchange rate stability as the central component ofpolicy, although in Norway a formal peg and announced fluctuationmargins were abandoned. These differences in the extent of the pressureson the exchange rates and the options open to policy-makers were, to alarge extent, determined by the macroeconomic conditions in the Nordiccountries in the early 1990s (Figures 1–3).
235
70
80
90
100
110
120
70
80
90
100
110
120
0
4
8
12
16
20
0
4
8
12
16
20
84 85 86 87 88 89 90 91 92 93 94 95 96
DenmarkFinlandIcelandNorway Sweden
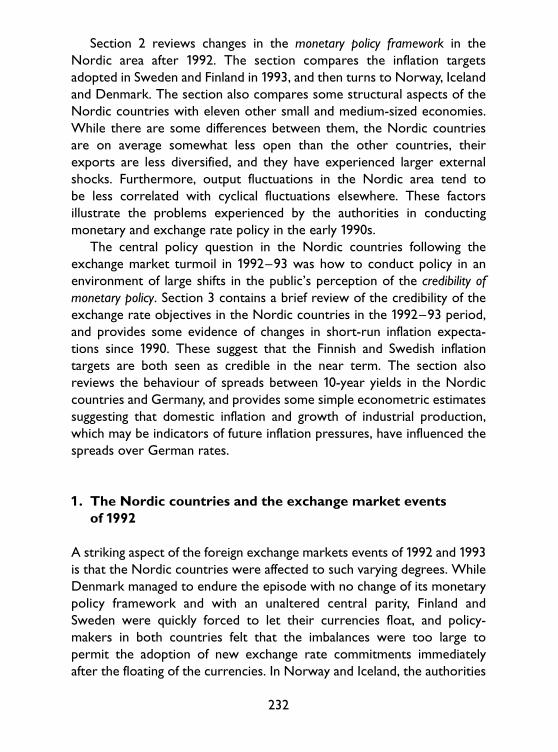
Figure 3
1 At end-year. 2 In terms of relative consumer prices. 3 National definitions.Sources: IMF, national data and BIS calculations.
Real effective exchange rate and unemployment
Real effective exchange rates (end-1990 = 100)1, 2
Unemployment rates (in percent)1, 3
1.1 Macroeconomic imbalances
As is also discussed in the companion piece, macroeconomic develop-ments in Finland and Sweden in the early 1990s were dramatic.3 Followingfinancial liberalisation and accommodative monetary and fiscal policiesduring the 1980s, both countries experienced rapid credit growth, a sharpupswing in asset prices and very rapid output growth in the late 1980s.The collapse of exports to the former Soviet Union and a terms-of-tradeshock stemming from weakness in world market for forestry productscaused a severe recession in Finland in 1991. External developments, rein-forced by weak domestic demand, also led to a recession in Sweden.4 Asa consequence, unemployment surged in both countries, rising between1990 and 1993 from 3.5 to 17.9% in Finland and from 1.6 to 8.2% inSweden.5 The sharp recession also led to large general governmentbudget deficits, which in 1993 reached 8.0% of GDP in Finland and 12.3%in Sweden. While these deficits reflected the weakness of activity, struc-tural budget deficits also rose, reaching 2.5% in Finland and 8.8% inSweden by 1993.
An important factor explaining the depth of the recession in Finlandand Sweden was the banking crises both countries underwent in the early1990s. The rapid increase in credit exposures of banks in the 1980s, whichwas caused by a combination of financial market liberalisation and fiscaland monetary policies that in retrospect were insufficiently restrictive,led to an increase in the vulnerability of the financial sector to macro-economic shocks. The combination of worldwide economic slowdown,coupled with increases in real after-tax interest rates – stemming fromhigher interest rates (which were necessary to maintain exchange stabilityfollowing the tightening of German monetary policy after unification),reductions in marginal tax rates and in the deductibility of interestpayments, and lower inflation – led to dramatic increases in corporatebankruptcies and heavy loan losses in the banking sector, and to sharp fallsin equity and real estate prices. This triggered reductions in consumption
236
3 Svensson (1994) reviews the causes of the exchange rate crises in 1992–93.4 Deputy Governor Heikensten has argued that the generalised realignment of economic
policy in Sweden in the early 1990s – the combination of disinflation, tax reform and measures toimprove government finances – played an important role in triggering the crisis in the Swedisheconomy. See Heikensten (1996).
5 These (and other) statistics refer to open unemployment. Total unemployment, whichincludes those participating in labour market programmes, would probably be a more usefulindicator.
and corporate investment and extraordinary drops in activity in bothcountries in the early 1990s.
In Finland, the recession was also exacerbated by the fact that firmsand households had large debts denominated in foreign currency. Thedevaluation of the Finnish markka in 1991 and the subsequent deprecia-tion in 1992 thus led to sharp increases in the real debt burden, whichdepressed activity.
Although Norway underwent the same process of financial liberalisa-tion, credit expansion, asset price boom, banking crisis and overheating,macroeconomic conditions in 1992 were clearly better than in Finland andSweden. One reason for this was that the deterioration in economicconditions in Norway occurred already in 1987, partially in response tothe sharp decline in oil prices in 1986 and the onset of weakness in thebanking sector. Thus, the Norwegian economy had already had some timeto adjust when external economic conditions worsened in the early1990s. By 1992, the output gap was large but closing, and the unemploy-ment rate had remained between 5 and 6% between 1990 and 1993, thatis, far below rates in Denmark, Finland and Sweden. Moreover, the realexchange of the krone had been depreciating somewhat since 1988.
Macroeconomic conditions in Denmark in 1992 were, relative to theother Nordic countries, quite good. While Finland, Norway and Swedenexperienced rapid credit growth and sharp increases in prices for resi-dential and commercial real estate in the 1980s, credit growth and theupswing in real estate prices were more modest in Denmark.6 Moreover,the supervision and regulation of financial institutions had arguably beencomparatively tighter and banks had a stronger capital cushion.7 As aconsequence, Danish banks were better able to withstand the creditlosses experienced, and weakness in the financial sector created muchless of an “overhang” for monetary policy in the early 1990s. The fiscalsituation was also stronger in Denmark. In particular, fiscal policy hadbeen tightened in the mid-1980s, and the structural budget deficit wascomparatively small in 1992. Thus, when the turmoil in the foreignexchange markets arose in 1992, macroeconomic conditions in Denmarkwere stronger than in the other Nordic countries.
237
6 For a discussion of the episode of financial deregulation, credit growth and asset pricefluctuations observed in many OECD countries in the 1980s and early 1990s, see Borio et al.(1994).
7 Koskenkylä (1994) and Drees and Pazarbasioglu (1995) discuss the Nordic banking crisis.

Iceland also experienced a recession in 1992. While several factorsplayed a role, the main causal factor was the poor fish catch in 1991 – fishbeing the by far most important export good of Iceland – combined witha second poor catch in 1992 and worsening terms of trade. The tightmonetary policy required to support the disinflation program and thehardening of the exchange rate objective which was undertaken in 1989may also have played a role, as did efforts to reduce the large structuralfiscal deficit. Thus, by 1992 Iceland experienced an output gap of almost4% and rising, albeit still low, unemployment. The fact that cod quotaswere being cut back also generated expectations that real output wouldremain weak in 1993.
1.2 Implications for speculative pressures and policy options
The macroeconomic conditions had an important influence on the coun-tries’ ability to cope with the foreign exchange turmoil that started in1992.8 With large output gaps, fragile banking system, and weak publicfinances, the monetary authorities had little scope to raise short-terminterest rate for any length of time to defend the exchange rate objectivesagainst speculative capital movements. These constraints were naturallytightest in countries where macroeconomic imbalances were mostpronounced, a fact that was not overlooked by financial markets. Whenspeculative pressures gathered across a broad range of Europeanexchange rates after the Danish rejection of the Maastricht treaty inJune of 1992 and in advance of the French referendum on the treatyin September, currencies with weaker fundamentals were particularlyexposed.9 Consequently, exchange rate arrangements were changed firstin countries with weaker fundamentals: Finland, which had devalued themarkka in late 1991, abandoned its unilateral ECU parity already in earlySeptember 1992, followed by Sweden and Norway some months later.The Icelandic króna was devalued in November 1992 and June 1993. Bycontrast, the Danish krone survived a number episodes of speculativeoutflows, before the broadening of the fluctuation margins in the ERM inAugust 1993.
238
8 See Gudmundsson (1994a).9 For instance, the average spread of 10-year yields against Germany during the first five
months of 1992 were 68 basis points (b.p.) for Denmark, 138 b.p. for Norway, 147 b.p. forSweden and 357 b.p. for Finland. By the end of August, the spreads had risen to 153 b.p. forDenmark, 179 b.p. for Norway, 305 b.p. for Sweden and 484 b.p. for Finland.
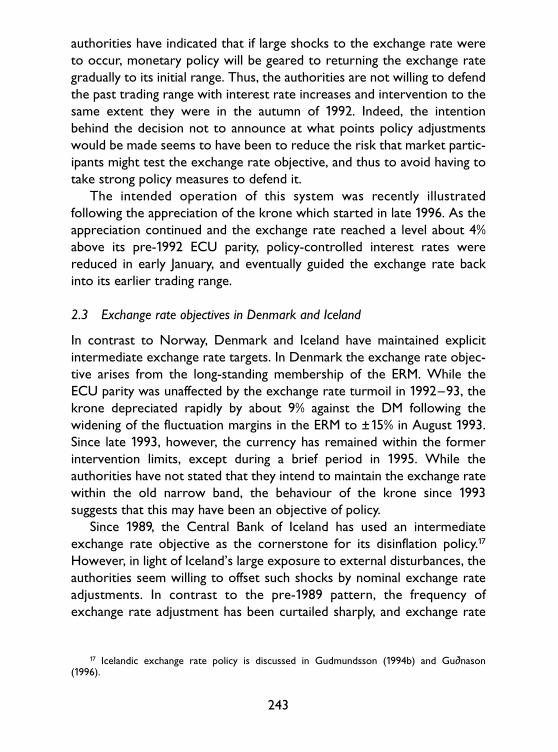
The macroeconomic imbalances also played a role in determiningwhat policy options were open to the authorities. Denmark and Iceland,where conditions were relatively good, were able to maintain explicitexchange rate objectives as keystones of the monetary policy framework.In Norway, where conditions were less favourable, the authorities initiallylet the currency float freely, but soon started to conduct policy to main-tain the exchange in trading range just below the old parity. By contrast,in Finland and Sweden where macroeconomic imbalances werepronounced, policy-makers probably had little choice but to let thecurrencies float freely.
2. The framework of monetary policy after 1992
Intermediate exchange rate objectives have historically played an impor-tant role in the conduct of monetary policy in the Nordic countries.10
Indeed, all five Nordic countries did employ such objectives beforethe events of 1992. However, by early 1993, Finland and Sweden hadabandoned the use of intermediate objectives, and instead geared policydirectly to the final objective of price stability, using numerical inflationtargets. Norway had also relinquished its intermediate exchange rateobjective but continued to gear policy to maintaining stability of theexchange rate. Only in Denmark and Iceland have quantitative interme-diate exchange rate targets remained the cornerstone of policy. InOctober 1996, however, Finland joined the wide-band ERM, and policy isnow conducted using an inflation targets, while the exchange rate is seenas an additional constraint on policy. This section discusses in greaterdetail the monetary policy frameworks in the Nordic countries since1992.
2.1 The design of inflation targets in Finland and Sweden
Following the abandonment of the unilateral ECU parities in Finland andSweden in the autumn of 1992, policy was initially conducted in an eclecticmanner, although both central banks noted that price stability would
239
10 Gylfason (1990) discusses exchange rate policy in the Nordic countries in the 1970s and1980s.
remain the main focus of policy. Subsequently in January 1993 theRiksbank, and in February 1993 the Bank of Finland, adopted numericalinflation targets as guides to monetary policy. While the two central banksadopted the inflation targets on their own accord, both governmentssoon announced their support for the new policy framework.
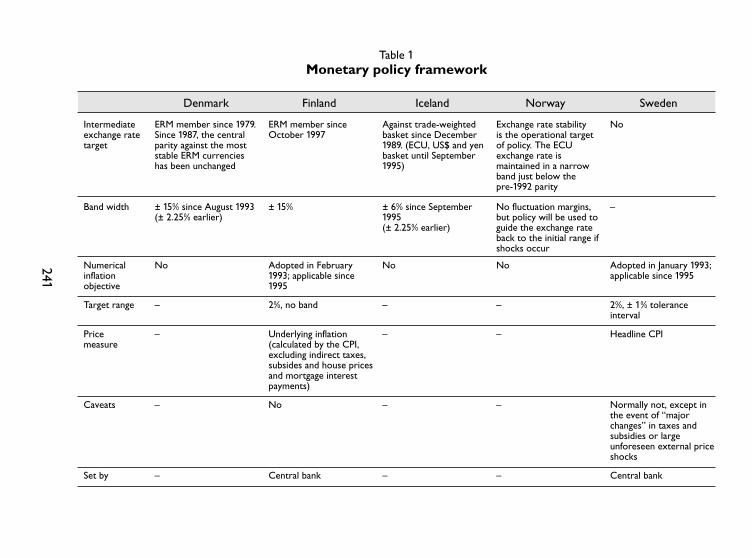
The inflation targeting strategies in the two countries are similar inseveral regards (Table 1). Both central banks target two percent inflation,which is the target adopted in Canada in 1991, but less restrictive than the0–2% band adopted in New Zealand in 1990.11 It is also similar to whatmany observers believe is the operational definition of price stability inGermany, which has served as a reference country for monetary co-oper-ation in Europe. Furthermore, in Sweden and Finland the targets appliedfrom 1995 onwards. The reason for this delay was that since monetarypolicy only affects prices with a lag of a year or two, it would be unable toprevent the substantial depreciation of the krona and markka that tookplace before the targets were announced in 1993 from increasing near-term inflation.
Despite these similarities, interesting differences remain. First, theRiksbank adopted a tolerance band of ±1% on the grounds that it isdifficult to control inflation precisely by monetary policy; in contrast, theBank of Finland did not announce such a band based on the concern thatthe public could incorrectly come to perceive the upper limit of any rangeas the effective target.12 However, under the current arrangement with apoint target, it is clear that the inflation rate will virtually always deviatefrom the target, which potentially could have credibility effects.
Secondly, the two central banks made different choices regardingwhether to target headline or underlying inflation, and whether to pre-announce the conditions under which deviations from the targets wouldbe acceptable. In Sweden, the target applies to headline CPI inflation, butthe authorities have indicated that if major changes in taxes and subsidiesare introduced, or if large unforeseen external price shocks occur theinflation rate may deviate from the target.13 By contrast, in Finland the
240
11 The band in New Zealand was changed to 0–3% in 1996 in order to reduce the risk ofexcessive activism that can arise if the targeted range is too narrow.
12 An additional reason for why a band was not announced was that the optimal choice ofband width depends on the nature of the economic disturbances affecting the economy. Sincethese are not known in advance, it was difficult to determine an appropriate band width.
13 See Bäckström (1994).
241
Table 1Monetary policy framework
Denmark Finland Iceland Norway Sweden
Intermediateexchange ratetarget
Band width
ERM member since 1979.Since 1987, the centralparity against the moststable ERM currencieshas been unchanged
ERM member sinceOctober 1997
Against trade-weightedbasket since December1989. (ECU, US$ and yenbasket until September1995)
Exchange rate stabilityis the operational targetof policy. The ECUexchange rate ismaintained in a narrowband just below the pre-1992 parity
No
± 15% since August 1993(± 2.25% earlier)
± 15% ± 6% since September1995(± 2.25% earlier)
No fluctuation margins,but policy will be used toguide the exchange rateback to the initial range ifshocks occur
–
Price measure
– Underlying inflation(calculated by the CPI,excluding indirect taxes,subsides and house pricesand mortgage interestpayments)
– – Headline CPI
Caveats – No – – Normally not, except inthe event of “majorchanges” in taxes andsubsidies or largeunforeseen external priceshocks
Numerical inflation objective
No Adopted in February1993; applicable since1995
No No Adopted in January 1993;applicable since 1995
Target range – 2%, no band – – 2%, ± 1% toleranceinterval
Set by – Central bank – – Central bank

inflation target pertains to underlying inflation, which is calculated byexcluding indirect taxes, subsides, house prices and mortgage interestpayments from the CPI, and no caveats have been announced.14
Thus, the Riksbank has adopted the same approach as the Bank ofCanada, that is, to target headline inflation, which may be more difficult tocontrol than underlying inflation, but to announce in advance the condi-tions under which a breach of the inflation target would be justifiable. InFinland, the approach is similar to that of adopted in New Zealand in thatunderlying inflation rate is targeted which is less sensitive to shocks andtherefore more controllable, but with no, or fewer, caveats.15
A third difference between the policy frameworks in the two coun-tries arises from the fact that Finland joined the ERM in October 1996,and thus combines the inflation target with membership in the ERM.16
This raises the possibility that the external and internal policy objectivescould come into conflict. However, in light of the ±15% fluctuationmargins in the ERM and as long as the narrow fluctuation margins are notreintroduced, this is unlikely.
2.2 Exchange rate policy in Norway
Following the abandonment of the unilateral peg in December 1992 andthe initial depreciation of the krone by some 6% against the ECU, mone-tary policy in Norway continued to be geared towards maintaining astable exchange rate against European currencies. In early 1993, the kroneappreciated to a level about 3% below the former parity and has since,with the exception of the period in late 1996–early 1997, remained 2–5%below the previous parity. Thus, the Bank of Norway has effectively oper-ated with an intermediate exchange rate objective. Even so, there are twodifferences against the earlier unilateral ECU parity.
First, while the Bank of Norway has declared that exchange ratestability is a central element in the monetary policy framework, it has notdefined precisely what that implies. In particular, no new parity or fluctua-tion margins have been declared. Second, although there is no band, the
242
14 The Finnish inflation target is discussed in Pikkarainen and Tyrväinen (1993) and inPikkarainen (1996).
15 The absence of a band in Finland is in this regard notable in that it would provide theauthorities with some leeway if unexpected price changes occurred.
16 In this regard, the Finnish system resembles that of Spain.
authorities have indicated that if large shocks to the exchange rate wereto occur, monetary policy will be geared to returning the exchange rategradually to its initial range. Thus, the authorities are not willing to defendthe past trading range with interest rate increases and intervention to thesame extent they were in the autumn of 1992. Indeed, the intentionbehind the decision not to announce at what points policy adjustmentswould be made seems to have been to reduce the risk that market partic-ipants might test the exchange rate objective, and thus to avoid having totake strong policy measures to defend it.
The intended operation of this system was recently illustratedfollowing the appreciation of the krone which started in late 1996. As theappreciation continued and the exchange rate reached a level about 4%above its pre-1992 ECU parity, policy-controlled interest rates werereduced in early January, and eventually guided the exchange rate backinto its earlier trading range.
2.3 Exchange rate objectives in Denmark and Iceland
In contrast to Norway, Denmark and Iceland have maintained explicitintermediate exchange rate targets. In Denmark the exchange rate objec-tive arises from the long-standing membership of the ERM. While theECU parity was unaffected by the exchange rate turmoil in 1992–93, thekrone depreciated rapidly by about 9% against the DM following thewidening of the fluctuation margins in the ERM to ±15% in August 1993.Since late 1993, however, the currency has remained within the formerintervention limits, except during a brief period in 1995. While theauthorities have not stated that they intend to maintain the exchange ratewithin the old narrow band, the behaviour of the krone since 1993suggests that this may have been an objective of policy.
Since 1989, the Central Bank of Iceland has used an intermediateexchange rate objective as the cornerstone for its disinflation policy.17
However, in light of Iceland’s large exposure to external disturbances, theauthorities seem willing to offset such shocks by nominal exchange rateadjustments. In contrast to the pre-1989 pattern, the frequency ofexchange rate adjustment has been curtailed sharply, and exchange rate
243
17 Icelandic exchange rate policy is discussed in Gudmundsson (1994b) and Gu∂́nason(1996).
policy is no longer used to accommodate internal disturbances. Thus,before the 6% devaluation in November 1992, which was undertakenlargely in response to the competitive effects of the exchange rate depre-ciations in Europe, the Icelandic króna experienced almost three years ofstability, after having been devalued thirteen times in 1988–89.
A second exchange rate adjustment took place in June 1993, when thekróna was devalued by 7.5%. The driving factor in this case was the reduc-tion in the allowable fish catches for the year 1993/94, which wasexpected to lead to a fall in the real value of the fish catches which in turnwould exert a dampening effect on the real economy and justify a realdepreciation.
Another major development for Icelandic exchange rate policy wasthe establishment in May 1993 of an interbank market for foreignexchange, which was rendered necessary by the liberalisation of financialmarkets and the deregulation of international capital flows. Whereas thecentral bank earlier had quoted an exchange rate based on the desiredlevel of the exchange rate basket, which was used by the four commercialbanks in their transactions with customers, the exchange rate is nowdetermined by the central bank together with the commercial banks at afixing session every morning on the basis of interbank transactions. Thissystem permits market forces to have a direct impact on the exchangerate and allows it to deviate from the central rate; the authorities there-fore announced the establishment of an exchange band of ±2.25%, that is,the same width as in the ERM at that time.
In September 1995, the exchange rate band was broadened to ±6%. Bydoing so, the central bank increased its ability to respond to externaldisturbances of a temporary nature, without being forced to adjust thecentral rate which increasingly is seen as the anchor for monetary policy.Furthermore, the liberalisation and growth of Icelandic financial marketsincreased the potential pressure that could be brought to bear on theexchange rate parity. By widening the band, an element of two-way riskwas also introduced which enhanced the authorities’ ability to deal withspeculative pressures. The exchange rate has remained stable within theold narrow band.
2.4 International comparisons
In considering the challenges faced by monetary policy-makers, it is infor-mative to compare the structures of the Nordic economies with those of
244
other countries. Such a comparison can also be useful in considering thestrength and weaknesses of possible alternative monetary policy frame-works. This subsection uses data for a group of eleven countries –Australia, Austria, Belgium, Canada, Ireland, Luxembourg, the Nether-lands, New Zealand, Portugal, Spain and Switzerland – to explore theseissues.18 It should be emphasised that the economies in this group areheterogeneous. However, the considerations faced by the authorities inthese countries in designing an appropriate policy framework, in partic-ular determining the appropriate degree of exchange rate flexibility, aresimilar to those faced by the Nordic central banks.19
Openness
An important factor influencing the choice of policy framework andthe degree of exchange rate flexibility is the exposure to foreign trade. Invery open economies, prices and wages tend to be more directly influ-enced by the exchange rate, implying that exchange rate changes haverelatively little impact on relative prices. Since the benefits of nominalexchange rate flexibility thus is lower in highly open economies andpolicy-makers in such countries frequently conduct monetary policy usingintermediate exchange rate targets, it is of relevance to consider howopen the Nordic countries are.
Figure 4 shows the ratio of exports to GDP, which is commonly usedto gauge the extent to which an economy is exposed to trade, in 1993 forthe Nordic countries. For comparison purposes, the figure also showsaverages for the Nordic and non-Nordic countries. Since the non-Nordiccountries use different policy frameworks, averages are also shown forcountries that target inflation (Australia, Canada, New Zealand and Spain)and countries that are members of the ERM (Austria, Belgium, Ireland,Luxembourg, the Netherlands, Portugal and Spain).20 The figure illustratesthat the export/GDP ratio is quite similar among the Nordic countriesand that on average the Nordic countries are about as open as the
245
18 The reason for including Luxembourg in the sample is that it is the only economy withapproximately the same size as Iceland.
19 While other medium-sized economies, e.g. Italy and the United Kingdom, could beincluded in the control group, they are much larger than the Nordic countries (and, as measuredby real GDP, are about twice as large as Canada and Spain), and were therefore not considered.This, of course, is an arbitrary choice.
20 Since monetary policy in Spain is conducted using both inflation and intermediateexchange rate targets, Spain is in both subgroups.
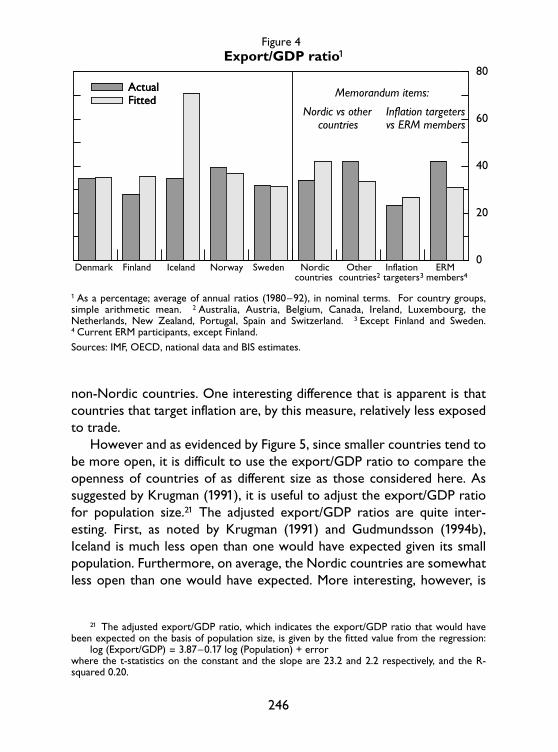
non-Nordic countries. One interesting difference that is apparent is thatcountries that target inflation are, by this measure, relatively less exposedto trade.
However and as evidenced by Figure 5, since smaller countries tend tobe more open, it is difficult to use the export/GDP ratio to compare theopenness of countries of as different size as those considered here. Assuggested by Krugman (1991), it is useful to adjust the export/GDP ratiofor population size.21 The adjusted export/GDP ratios are quite inter-esting. First, as noted by Krugman (1991) and Gudmundsson (1994b),Iceland is much less open than one would have expected given its smallpopulation. Furthermore, on average, the Nordic countries are somewhatless open than one would have expected. More interesting, however, is
246
21 The adjusted export/GDP ratio, which indicates the export/GDP ratio that would havebeen expected on the basis of population size, is given by the fitted value from the regression:
log (Export/GDP) = 3.87–0.17 log (Population) + errorwhere the t-statistics on the constant and the slope are 23.2 and 2.2 respectively, and the R-squared 0.20.
0
20
40
60
80ActualFitted
Denmark Finland Iceland Norway Sweden Nordiccountries
Othercountries2
Inflationtargeters3
ERMmembers4
ActualFitted
Figure 4
Memorandum items:
Nordic vs othercountries
Inflation targetersvs ERM members
Export/GDP ratio1
1 As a percentage; average of annual ratios (1980–92), in nominal terms. For country groups,simple arithmetic mean. 2 Australia, Austria, Belgium, Canada, Ireland, Luxembourg, theNetherlands, New Zealand, Portugal, Spain and Switzerland. 3 Except Finland and Sweden.4 Current ERM participants, except Finland.Sources: IMF, OECD, national data and BIS estimates.
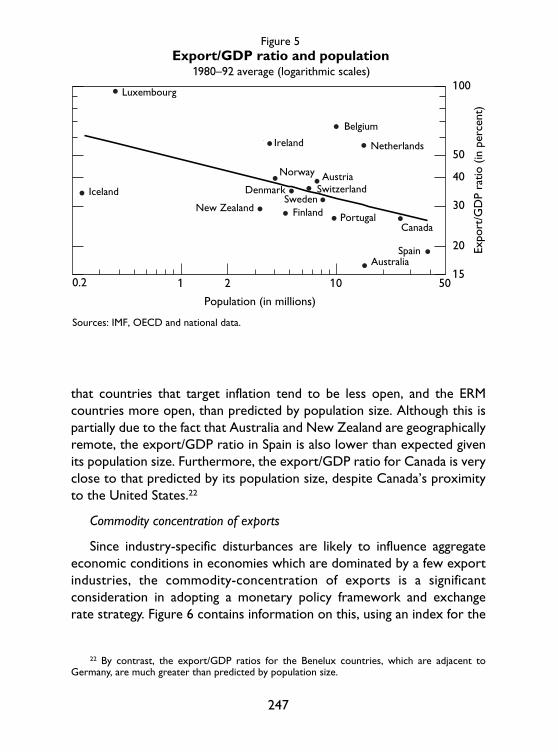
that countries that target inflation tend to be less open, and the ERMcountries more open, than predicted by population size. Although this ispartially due to the fact that Australia and New Zealand are geographicallyremote, the export/GDP ratio in Spain is also lower than expected givenits population size. Furthermore, the export/GDP ratio for Canada is veryclose to that predicted by its population size, despite Canada’s proximityto the United States.22
Commodity concentration of exports
Since industry-specific disturbances are likely to influence aggregateeconomic conditions in economies which are dominated by a few exportindustries, the commodity-concentration of exports is a significantconsideration in adopting a monetary policy framework and exchangerate strategy. Figure 6 contains information on this, using an index for the
247
22 By contrast, the export/GDP ratios for the Benelux countries, which are adjacent toGermany, are much greater than predicted by population size.
15
20
30
40
50
100
1 2 10 50
l
l
l
l
ll
l
l
l l
l
ll
l
l
l
Austria
Australia
Belgium
Canada
SwitzerlandDenmark
Spain
Finland
Ireland Netherlands
Norway
New ZealandPortugal
Sweden
Luxembourg
Iceland
0.2
Figure 5
1980–92 average (logarithmic scales)
Population (in millions)
Expo
rt/G
DP
ratio
(in
per
cent
)
Sources: IMF, OECD and national data.
Export/GDP ratio and population
1
1
11
1
1
1
1
11
1
1
1
1
1
1
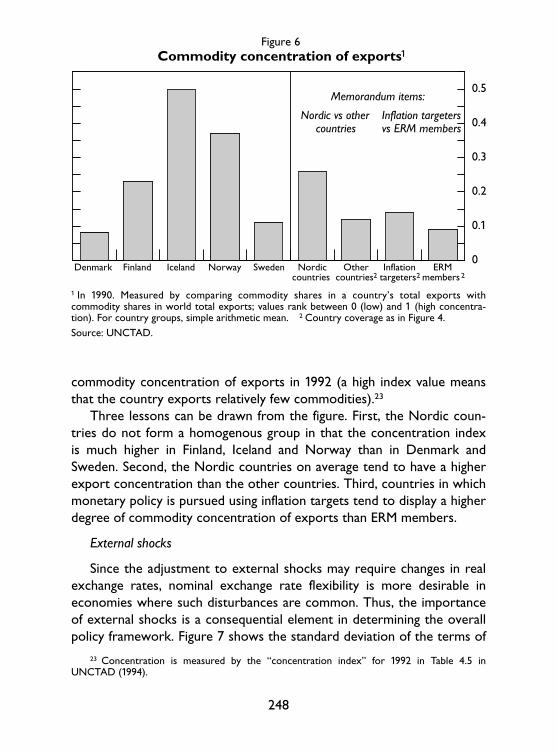
commodity concentration of exports in 1992 (a high index value meansthat the country exports relatively few commodities).23
Three lessons can be drawn from the figure. First, the Nordic coun-tries do not form a homogenous group in that the concentration indexis much higher in Finland, Iceland and Norway than in Denmark andSweden. Second, the Nordic countries on average tend to have a higherexport concentration than the other countries. Third, countries in whichmonetary policy is pursued using inflation targets tend to display a higherdegree of commodity concentration of exports than ERM members.
External shocks
Since the adjustment to external shocks may require changes in realexchange rates, nominal exchange rate flexibility is more desirable ineconomies where such disturbances are common. Thus, the importanceof external shocks is a consequential element in determining the overallpolicy framework. Figure 7 shows the standard deviation of the terms of
248
23 Concentration is measured by the “concentration index” for 1992 in Table 4.5 inUNCTAD (1994).
0
0.1
0.2
0.3
0.4
0.5
Denmark Finland Iceland Norway Sweden Nordiccountries
Othercountries2
Inflationtargeters2
ERMmembers2
Figure 6
Memorandum items:
Nordic vs othercountries
Inflation targetersvs ERM members
Commodity concentration of exports1
1 In 1990. Measured by comparing commodity shares in a country’s total exports withcommodity shares in world total exports; values rank between 0 (low) and 1 (high concentra-tion). For country groups, simple arithmetic mean. 2 Country coverage as in Figure 4.Source: UNCTAD.
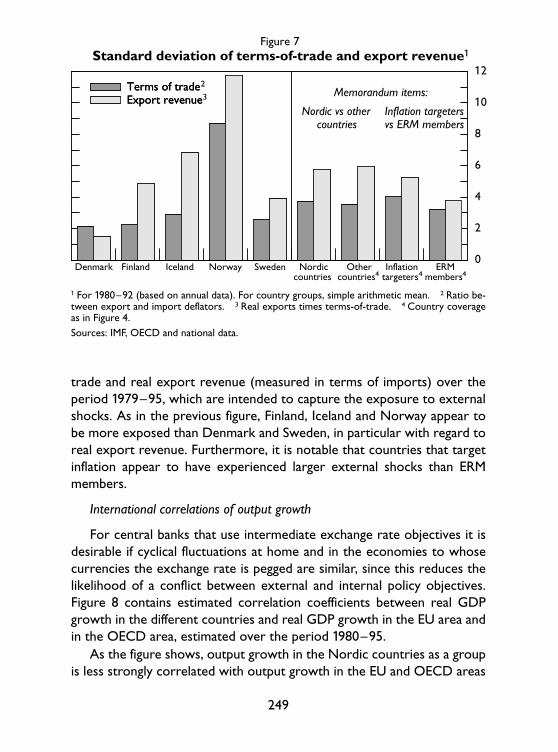
trade and real export revenue (measured in terms of imports) over theperiod 1979–95, which are intended to capture the exposure to externalshocks. As in the previous figure, Finland, Iceland and Norway appear tobe more exposed than Denmark and Sweden, in particular with regard toreal export revenue. Furthermore, it is notable that countries that targetinflation appear to have experienced larger external shocks than ERMmembers.
International correlations of output growth
For central banks that use intermediate exchange rate objectives it isdesirable if cyclical fluctuations at home and in the economies to whosecurrencies the exchange rate is pegged are similar, since this reduces thelikelihood of a conflict between external and internal policy objectives.Figure 8 contains estimated correlation coefficients between real GDPgrowth in the different countries and real GDP growth in the EU area andin the OECD area, estimated over the period 1980–95.
As the figure shows, output growth in the Nordic countries as a groupis less strongly correlated with output growth in the EU and OECD areas
249
0
2
4
6
8
10
12Terms of tradeExport revenue
Denmark Finland Iceland Norway Sweden Nordiccountries
Othercountries4
Inflationtargeters4
ERMmembers4
Terms of trade2
Export revenue3
Figure 7
Memorandum items:
Nordic vs othercountries
Inflation targetersvs ERM members
Standard deviation of terms-of-trade and export revenue1
1 For 1980–92 (based on annual data). For country groups, simple arithmetic mean. 2 Ratio be-tween export and import deflators. 3 Real exports times terms-of-trade. 4 Country coverageas in Figure 4.Sources: IMF, OECD and national data.
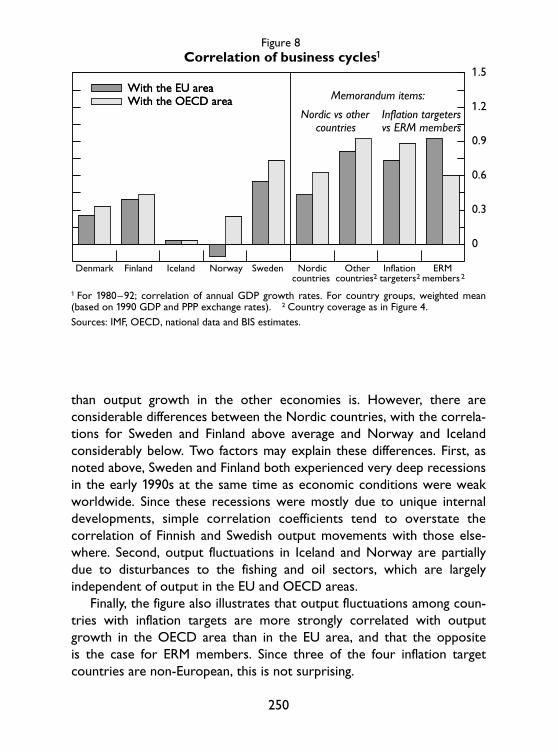
than output growth in the other economies is. However, there areconsiderable differences between the Nordic countries, with the correla-tions for Sweden and Finland above average and Norway and Icelandconsiderably below. Two factors may explain these differences. First, asnoted above, Sweden and Finland both experienced very deep recessionsin the early 1990s at the same time as economic conditions were weakworldwide. Since these recessions were mostly due to unique internaldevelopments, simple correlation coefficients tend to overstate thecorrelation of Finnish and Swedish output movements with those else-where. Second, output fluctuations in Iceland and Norway are partiallydue to disturbances to the fishing and oil sectors, which are largelyindependent of output in the EU and OECD areas.
Finally, the figure also illustrates that output fluctuations among coun-tries with inflation targets are more strongly correlated with outputgrowth in the OECD area than in the EU area, and that the oppositeis the case for ERM members. Since three of the four inflation targetcountries are non-European, this is not surprising.
250
0
0.3
0.6
0.9
1.2
1.5With the EU area With the OECD area
Denmark Finland Iceland Norway Sweden Nordiccountries
Othercountries2
Inflationtargeters2
ERMmembers2
With the EU area With the OECD area
Figure 8
1 For 1980-92; correlation of annual GDP growth rates. For country groups, weighted mean(based on 1990 GDP and PPP exchange rates). 2 Country coverage as in Figure 4.
Memorandum items:
Nordic vs othercountries
Inflation targetersvs ERM members
Correlation of business cycles1
1 For 1980–92; correlation of annual GDP growth rates. For country groups, weighted mean(based on 1990 GDP and PPP exchange rates). 2 Country coverage as in Figure 4.Sources: IMF, OECD, national data and BIS estimates.

Some caveats
The comparisons presented above have suggested that although thereare differences among the Nordic economies, they tend as a group to beless open than other economies considered, especially after adjusting forpopulation size; their exports also tend to be more concentrated on afew goods; they are relatively more exposed to external shocks; andoutput fluctuations in the Nordic area are less correlated with outputfluctuations in the EU or OECD area. However, it is important not tooverinterpret these findings as giving indications of the appropriate policyframework for the Nordic countries. Many factors, such as the extent oflabour and product market flexibility and whether financial markets areinternationally integrated, are not considered in this analysis. Moreover,the weight attached to exchange rate stability in the framework of policymay also affect estimates of the importance of external shocks.24 Similarly,the correlation of business cycles are naturally higher among countriesthat are members of an adjustable peg regime, where policy-determinedinterest rates have tended to converge. However, the comparisons dopoint to some of the factors that have tended to complicate the conductof monetary policy in the Nordic area.
2.5 Implementation of monetary policy
The implementation of monetary policy in the Nordic countries has alsoundergone important changes since the early 1990s. These developmentshave been in line with a broader international trend towards a greaterfocus on interest rates as operating objectives of policy, lower reserverequirements, increased reliance on market operations at the expense ofstanding facilities in guidance of money-market rates, and enhancedtransparency.25 These changes have been driven by the development andinternationalisation of financial markets in the late 1980s and early 1990s,in particular the development of liquid money markets and the deregula-tion of capital flows. With short-term interest rates more sensitive to
251
24 This could be the case if export and import prices react with different speeds to nominalexchange rate changes.
25 Borio (1997) provides an comparison of monetary operating procedures in a number ofcountries. Monetary operating procedures in the Nordic area are discussed by DanmarksNationalbank (1992), Gu∂́nason (1996), Hasko (1996), Hasko and Kuisma (1995), Holmberg(1996), Hörngren (1994), Kuosmanen (1996), and Mehlbye and Topp (1996).
market forces and expectations, the need for clearer policy signals hasincreased. A greater need for clarity has also arisen from the shift inmonetary policy strategy from narrow to broad exchange rate bands andthe adoption of inflation targets, which have also heightened the impor-tance of longer-term interest rates, which central banks influence to theextent they can affect interest rate expectations. Moreover, with marketinterest rates increasingly responsive to rates of return in foreigncurrency, central banks need to be able to adjust short-term rates morefinely.
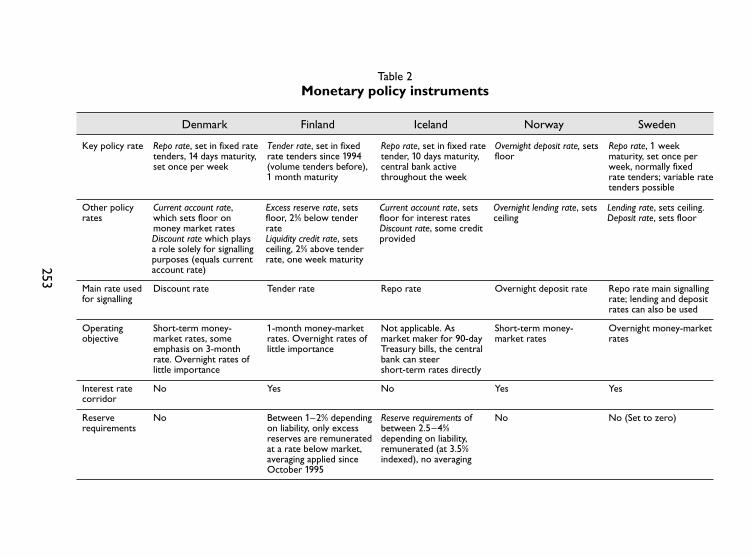
Table 2 provides an overview of the monetary policy instruments inthe Nordic countries. It is evident that there is a great deal of similarityacross the Nordic central banks. Except in Norway, the key policy rate inall countries is the repo rate, which is typically set by fixed rate tender inorder to clarify the authorities’ view of the appropriate level of short-term rates.26 Furthermore, except in Denmark, short-term rates aresteered within an interest rate corridor determined by standing facilities,which permits the central bank to control interest rates in times ofmarket pressures. In Denmark, Norway and Sweden, reserve require-ments are no longer used.
One possible distinction between the different Nordic central banksconcerns the maturity of the short-term interest rates that are used asoperating objectives of policy. While overnight interest rates play littlerole in the implementation of policy in Denmark, Finland, and Norway,the Riksbank attaches considerable emphasis on controlling this rate. It isnot clear whether these differences reflect central banks’ views regardingthe importance of overnight rates, or the institutional set-up of moneymarkets.
In Iceland, the central bank is a market maker for three-month Trea-sury bills. It has thus an additional lever on short-term interest rates, andinterbank rates play no role as operational targets for policy. However,while the central bank in the past played a focal role in Icelandic financialmarkets, following the establishment of a money market in 1992 and aforeign exchange market in 1993, the bank has taken the view that its roleas a market maker should be reduced in line with the growth and deep-ening of financial markets. Thus, in early 1996 the central bank ceased to
252
26 Variable rate tenders were used in Finland until the end of 1994. While fixed rate tendersare typically used in Sweden, variable rate tenders may be employed when market rates fluctuatearound levels in line with policy intentions.
253
Table 2Monetary policy instruments
Denmark Finland Iceland Norway Sweden
Key policy rate
Other policyrates
Main rate usedfor signalling
Repo rate, set in fixed ratetenders, 14 days maturity,set once per week
Tender rate, set in fixedrate tenders since 1994(volume tenders before),1 month maturity
Repo rate, set in fixed ratetender, 10 days maturity,central bank activethroughout the week
Overnight deposit rate, setsfloor
Repo rate, 1 weekmaturity, set once perweek, normally fixedrate tenders; variable ratetenders possible
Current account rate,which sets floor onmoney market ratesDiscount rate which playsa role solely for signallingpurposes (equals currentaccount rate)
Excess reserve rate, setsfloor, 2% below tenderrateLiquidity credit rate, setsceiling, 2% above tenderrate, one week maturity
Current account rate, setsfloor for interest ratesDiscount rate, some creditprovided
Overnight lending rate, setsceiling
Lending rate, sets ceiling.Deposit rate, sets floor
Discount rate Tender rate Repo rate Overnight deposit rate Repo rate main signallingrate; lending and depositrates can also be used
Operatingobjective
Interest ratecorridor
Short-term money-market rates, someemphasis on 3-monthrate. Overnight rates oflittle importance
1-month money-marketrates. Overnight rates oflittle importance
Not applicable. Asmarket maker for 90-dayTreasury bills, the centralbank can steer short-term rates directly
Short-term money-market rates
Overnight money-marketrates
No Between 1–2% dependingon liability, only excessreserves are remuneratedat a rate below market,averaging applied sinceOctober 1995
Reserve requirements ofbetween 2.5–4%depending on liability,remunerated (at 3.5%indexed), no averaging
No No (Set to zero)Reserverequirements
No Yes No Yes Yes
make markets in long-term government bonds. If this process continuesand the bank relinquishes its role as a market maker for Treasury bills, itwill need to specify an operating objective in terms of some interbankrate.
3. Credibility and monetary policy experiences since 1992
The conduct of monetary policy in the Nordic countries in the 1990s hasbeen complicated by large shifts in the public’s perception of the credi-bility of monetary policy. For what follows, it is useful to make a distinc-tion between short- and long-run credibility. The first of these conceptsrefers to whether the public believes that the authorities will be able toreach or maintain announced exchange rate or inflation objectives in thenear future; the second refers to whether the central bank is seen aslikely to deliver low and stable inflation in the longer run. This sectionpresents some evidence on the near-term credibility of the exchange ratebands and inflation targets adopted by the Nordic countries, and thenassesses shifts in credibility more generally.
3.1 Credibility of exchange rate bands
Figure 9 contains plots of the spot and 12-month forward exchange rate,together with the central parity and fluctuations margins for the relevantperiods.27 For Denmark, Finland, Norway and Sweden, the exchangerates are vis-à-vis the ECU; for Iceland it is vis-à-vis the currency basket.
As argued by Svensson (1991), plotting the forward exchange rateagainst the band can be interpreted as a test of whether the exchange rateobjective is seen as credible: disregarding the possibility of a largeexchange risk premium, if the forward exchange rate is outside the fluctu-ation band, the band cannot be fully credible.28 However, the converse isnot true: if the forward exchange rate is in the band, investors may still
254
27 For Iceland the maturity of the forward rate is three months. The forward rates are calcu-lated using Euro-interest rates.
28 To see this, suppose that the forward exchange rate is above the fluctuation margin. Aninvestor who believes that the exchange rate would be remain in the band would then sellforeign exchange forward and buy it in the spot market at the time the forward contractmatures. This would be a profitable transaction if the spot rate remained inside the band.
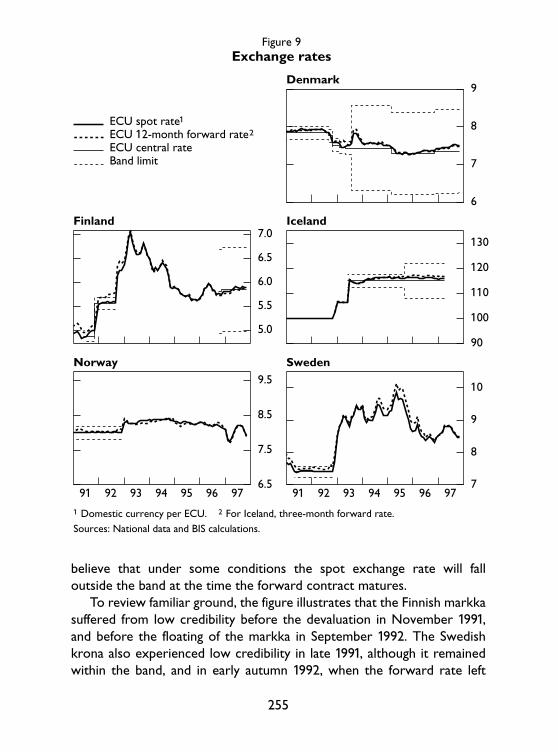
believe that under some conditions the spot exchange rate will falloutside the band at the time the forward contract matures.
To review familiar ground, the figure illustrates that the Finnish markkasuffered from low credibility before the devaluation in November 1991,and before the floating of the markka in September 1992. The Swedishkrona also experienced low credibility in late 1991, although it remainedwithin the band, and in early autumn 1992, when the forward rate left
255
6
7
8
9
5.0
5.5
6.0
6.5
7.0
90
100
110
120
130
6.5
7.5
8.5
9.5
91 92 93 94 95 96 977
8
9
10
91 92 93 94 95 96 97
ECU spot rate1
ECU 12-month forward rate2
ECU central rate Band limit
Figure 9
1 Domestic currency per ECU. 2 For Iceland, three-month forward rate.Sources: National data and BIS calculations.
Exchange rates
Denmark
Finland Iceland
Norway Sweden
the band. The Danish krone and Norwegian krone, however, were notsubject to the same deep lack of credibility as the markka and the krona.For the period since 1993, there is little firm evidence of weak credibilityof the remaining exchange rate bands, although, admittedly, the bands inDenmark, Finland and Iceland are so broad as to make this test of littlevalue.
3.2 Near-term inflation expectations
Turning to the near-term credibility of the Swedish and Finnish inflationtargets, Figure 10 contains plots for the four Nordic countries for whichthe data was available, of the expected average inflation for the 12 monthsahead, constructed from surveys of expectations of average inflation forthe current and the next year, together with the actual average inflationover the past 12 months.29 To interpret the figure, consider the behaviourof inflation and expected inflation in Finland. Before the floating of themarkka in 1992, actual and expected inflation declined roughly together,indicating that the survey respondents expected the rate of inflation toremain at its current level, and that they only revised their expectations asinflation fell over time. In Sweden expected inflation was below actualinflation before the floating of the krona in 1992, that is, further disinfla-tion was expected. In Norway and Denmark, by contrast, expectedinflation was marginally above actual inflation, suggesting that a smallincrease in inflation was expected.
The most striking aspect of the figure is that the floating of the Finnishmarkka, the Swedish krona and, although less so, the Norwegian krone,and the broadening of the fluctuation margins for the Danish krone led toanticipation of increasing inflation pressures. In all countries, except in
256
29 Let pt denote the rate of inflation over the 12-month period ending at time t. The averageinflation rate at time t is then given by:
11p– t = S pt–i / 12.
i = 0Let Ekp
–T denote the expectation, formed in month k, of the average inflation rate at the end
of year T. The expected average inflation rate for the coming 12 months at month k is thencomputed as the weighted average of the expected rate of inflation for the current year, Ekp
–T,
and for the next year, Ekp–
T+1:12–k k
Ekp–
k+12 = Ekp–
T + Ekp–
T+1.12 12
The data on Ekp–
T and Ekp–
T+1 are from Consensus Economics.
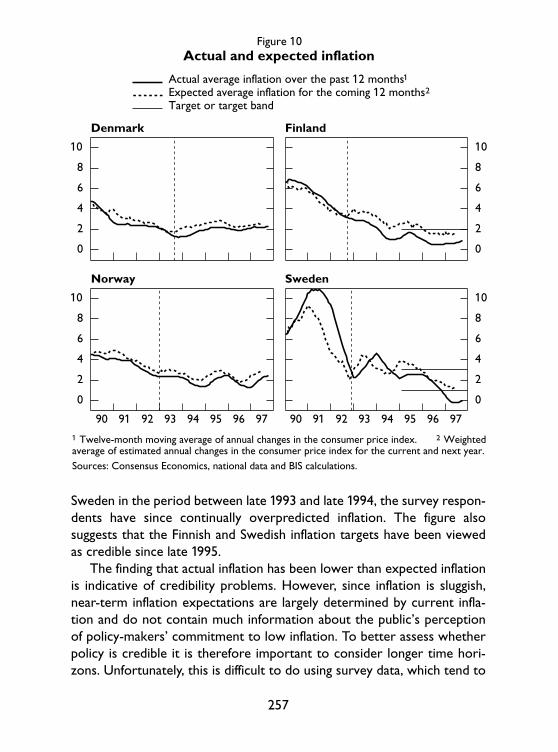
Sweden in the period between late 1993 and late 1994, the survey respon-dents have since continually overpredicted inflation. The figure alsosuggests that the Finnish and Swedish inflation targets have been viewedas credible since late 1995.
The finding that actual inflation has been lower than expected inflationis indicative of credibility problems. However, since inflation is sluggish,near-term inflation expectations are largely determined by current infla-tion and do not contain much information about the public’s perceptionof policy-makers’ commitment to low inflation. To better assess whetherpolicy is credible it is therefore important to consider longer time hori-zons. Unfortunately, this is difficult to do using survey data, which tend to
257
0
2
4
6
8
10
0
2
4
6
8
10
0
2
4
6
8
10
90 91 92 93 94 95 96 97
0
2
4
6
8
10
90 91 92 93 94 95 96 97
Actual average inflation over the past 12 months1
Expected average inflation for the coming 12 months2
Target or target band
Figure 10
1 Twelve-month moving average of annual changes in the consumer price index. 2 Weightedaverage of estimated annual changes in the consumer price index for the current and next year.Sources: Consensus Economics, national data and BIS calculations.
Actual and expected inflation
Denmark Finland
Norway Sweden
focus on short-run expectations. Instead, long bond yields are typicallyused for this purpose.
3.3 Long-run credibility
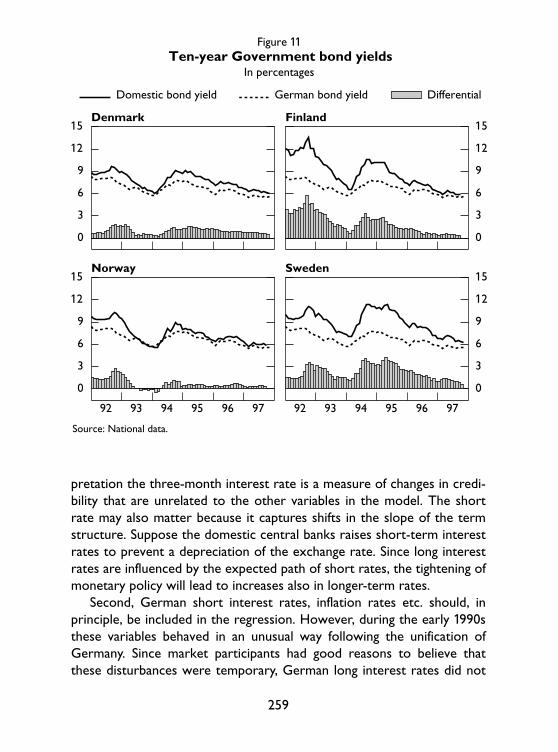
Figure 11 contains plots of 10-year bond yields in the Nordic countries(except Iceland, for data reasons) and Germany. It is readily apparent thatmovements in German interest rates are reflected in the Nordic bondyields. Furthermore, the spreads against German yields seem to dependon the level of Germany rates: any move in German bond yields appear toinduce proportionally larger shifts in yield in the Nordic area. The factorof proportionality also seems to differ between the individual countriesand to vary over time. Thus, until early 1994, spreads against Germanyields were largest for Finland, followed by Sweden, Norway andDenmark. Since 1994, however, the spreads have tended to be largest forSweden, followed by Finland, Denmark and Norway. Most recently,however, Finnish yields have fallen below Danish yields, probably drivenby expectations that Finland is more likely than Denmark to become amember of the single currency in the near future.
The figure raises the question of the causes of the fluctuations of thespreads against German rates. One interesting possibility is that shifts ininflationary expectations have played a role in triggering these move-ments. In order to explore this possibility, the change in the domestic longrate was regressed on the change in the rate of inflation over the past12 months; the change in the growth rate of industrial production relativeto trend; the change in the German long rate; the change in the domesticshort rate; and dummy variables for November and December 1991 (themonth of, and the month after, the Finnish devaluation), and August toDecember 1992.30
Before reviewing the results, two comments are in order. First, thedomestic short-term interest rate were included for several reasons. Anadverse shift in credibility may lead to pressures on the exchange rate,which, in turn, may increase short-term interest rates. Under this inter-
258
30 Let Rt, R*t , rt, pt and gt denote the domestic and German 10-year yields, the domestic 3-month rate, the domestic inflation rate (over 12 months) and the growth rate of domesticindustrial production (over 12 months) relative to trend (computed using the Hodrick-Prescottfilter) respectively. The following regression was fitted:
DRt = a1 + a2Drt + a3Dpt + a4Dgt + a5(Rt–1 – R*t–1) + time dummies + error.
pretation the three-month interest rate is a measure of changes in credi-bility that are unrelated to the other variables in the model. The shortrate may also matter because it captures shifts in the slope of the termstructure. Suppose the domestic central banks raises short-term interestrates to prevent a depreciation of the exchange rate. Since long interestrates are influenced by the expected path of short rates, the tightening ofmonetary policy will lead to increases also in longer-term rates.
Second, German short interest rates, inflation rates etc. should, inprinciple, be included in the regression. However, during the early 1990sthese variables behaved in an unusual way following the unification ofGermany. Since market participants had good reasons to believe thatthese disturbances were temporary, German long interest rates did not
259
0
3
6
9
12
15
0
3
6
9
12
15
0
3
6
9
12
15
92 93 94 95 96 97
0
3
6
9
12
15
92 93 94 95 96 97
Domestic bond yield German bond yield Differential
Figure 11
In percentages
Source: National data.
Ten-year Government bond yields
Denmark Finland
Norway Sweden

move much in response. Since preliminary work indicated that includingGerman variables did not improve the fit of the equations, they areexcluded in the models presented below.
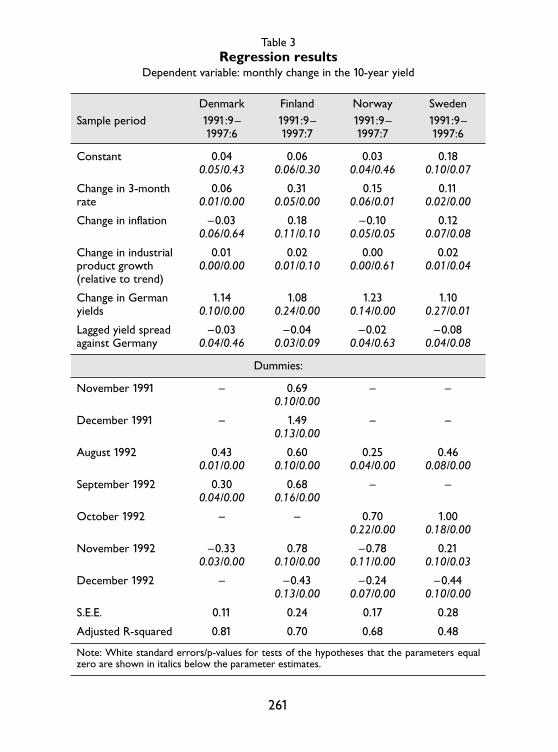
Table 3 contains the regression results. It should be noted that thesignificance of the parameters are somewhat sensitive to the exactspecification used, in particular the number of dummies, and whether the(insignificant) lagged yield spreads, are included. Several findings are ofinterest. First, the change in the short rate is significant in all countries.Thus, rising short rates imply widening spreads of long interest rates vis-à-vis Germany. Second, the change in inflation has a significant and positivecoefficient in Finland (at the 10% level) and Sweden.31 Since both countriesexperienced large exchange rate movements, the significance of inflationmay indicate that financial market believed that the exchange rate changeswould affect future inflation rates. Third, the growth of industrial produc-tion is significant except in Norway, where the exchange rate stimuluswas limited and where industrial production grew at a comparably steadyrate in the estimation period. One interpretation of this finding is thatrising industrial production signalled closing output gaps and rising infla-tionary pressures. Fourth, the parameter on the change in long Germaninterest rates is highly significant and close to unity. Thus, there is littleevidence that the Nordic interest rates overreacted to German ratesonce domestic economic conditions are controlled for. Fifth and finally,the lagged spread between domestic and German interest rates are onlysignificant for Finland and Sweden (at the 10% level) and not very largenumerically, suggesting that there was little tendency for domestic yieldsto tend to German levels. However, this may be due to the short sampleperiod.
In sum, the estimates suggest that the domestic economic conditions,in particular fears of rising inflation, played an important role in deter-mining movements in long interest rates in the Nordic countries relativeto in Germany.
260
31 In Norway, however, the coefficient is negative and significant. The reasons for this resultare not clear.
261
Table 3Regression results
Dependent variable: monthly change in the 10-year yield
Sample periodDenmark Finland Norway Sweden1991:9– 1991:9– 1991:9– 1991:9–1997:6 1997:7 1997:7 1997:6
Constant 0.04 0.06 0.03 0.180.05/0.43 0.06/0.30 0.04/0.46 0.10/0.07
Change in 3-month 0.06 0.31 0.15 0.11rate 0.01/0.00 0.05/0.00 0.06/0.01 0.02/0.00
Change in inflation –0.03 0.18 –0.10 0.120.06/0.64 0.11/0.10 0.05/0.05 0.07/0.08
Change in industrial 0.01 0.02 0.00 0.02product growth 0.00/0.00 0.01/0.10 0.00/0.61 0.01/0.04(relative to trend)
Change in German 1.14 1.08 1.23 1.10yields 0.10/0.00 0.24/0.00 0.14/0.00 0.27/0.01
Lagged yield spread –0.03 –0.04 –0.02 –0.08against Germany 0.04/0.46 0.03/0.09 0.04/0.63 0.04/0.08
Dummies:
November 1991 – 0.69 – –0.10/0.00
December 1991 – 1.49 – –0.13/0.00
August 1992 0.43 0.60 0.25 0.460.01/0.00 0.10/0.00 0.04/0.00 0.08/0.00
September 1992 0.30 0.68 – –0.04/0.00 0.16/0.00
October 1992 – – 0.70 1.000.22/0.00 0.18/0.00
November 1992 –0.33 0.78 –0.78 0.210.03/0.00 0.10/0.00 0.11/0.00 0.10/0.03
December 1992 – –0.43 –0.24 –0.440.13/0.00 0.07/0.00 0.10/0.00
S.E.E. 0.11 0.24 0.17 0.28
Adjusted R-squared 0.81 0.70 0.68 0.48
Note: White standard errors/p-values for tests of the hypotheses that the parameters equalzero are shown in italics below the parameter estimates.
References
Bäckström, Urban (1994): Address given at the Stockholm Stock Exchange, 9thDecember, reprinted in BIS Review, no. 229, 14th December.
Borio, Claudio E. V., Neale Kennedy and Stephen D. Prowse (1994): “Exploringaggregate asset price fluctuations across countries: measurement, determinants andmonetary policy implications”. BIS Economic Papers, no. 40.
Borio, Claudio E. V. (1997): “Monetary policy operating procedures in industrialcountries”. BIS Working Papers, no. 40.
Danmarks Nationalbank (1992): “New monetary and liquidity-policy instruments”.Monetary Review, May, pp. 8–9.
Drees, Burkhard and Ceyla Pazarbasioglu (1995): “The Nordic banking crises:pitfalls in financial liberalization?” IMF Working Paper, no. 61.
Gudmundsson, Már (1994a): “Macroeconomic developments and exchange ratepolicies of the Nordic countries in the nineties”. Economic and Financial Review, no. 1,pp. 79–94.
Gudmundsson, Már (1994b): “In search of stability: Iceland’s exchange rate andmonetary policies”. Economic and Financial Review, no. 1, pp. 123–52.
Gu∂́nason, Eirikur (1996): “The Icelandic financial system”, in Changing financial
systems in small open economies, BIS Policy Papers, no. 1.Gylfason, Thorvaldur (1990): “Exchange rate policy, inflation and unemployment:
the Nordic EFTA countries”. Chapter 4 in V. Argy and P. De Grauwe (eds.) Choosing
an exchange rate regime: the challenge for smaller industrial countries, International Mone-tary Fund, Washington.
Hasko, Harri (1996): “Instruments of monetary policy”. Bank of Finland Bulletin,Special issue, pp. 49–53.
Hasko, Harri and Mikko Kuisma (1995): “Recent changes in monetary policyinstruments”. Bank of Finland Bulletin, 3rd–6th October.
Heikensten, Lars (1996): Address at SE-Banken, New York, 7th November,reprinted in BIS Review, no. 127, 18th November.
Holmberg, Karolina (1996): “Riksbankens styrning av de korta räntorna”. Penning
och Valutapolitik, pp. 22–29.Hörngren, Lars (1994): “The Riksbank’s new interest rates management system”.
Sveriges Riksbank Quarterly Review, no. 2, pp. 40–45.Koskenkyla, Heikki, (1994): “The Nordic banking crises”. Bank of Finland Bulletin,
August, pp. 15–22.Krugman, Paul (1991): “Iceland’s exchange rate regime: policy options”. Mimeo.Kuosmanen, Hannele (1996): “Experiences with reserves averaging”. Bank of
Finland Bulletin, 9th–13th December.Lehmussaari, Olli-Pekka, Antti Suvanto and Laura Vajanne (1994): “The currency
band and credibility: the Finnish Experience”, in J. Åkerholm and A. Giovannini (eds.)Exchange rate policies in the Nordic countries, CEPR, London.
Mehlbye, Palle Duvier and Jacob Topp (1996): “Money market development”.Danmarks Nationalbank Monetary Review, August, pp. 37–53.
262
Pikkarainen, Pentti (1996): “Some perspectives on the principles of monetarypolicy with a floating markka”. Bank of Finland Bulletin, August, pp. 3–6.
Pikkarainen, Pentti and Timo Tyrväinen (1993): “The Bank of Finland’s inflationtarget and the outlook for inflation over the next few years”. Bank of Finland Bulletin,June–July, pp. 8–12.
Svensson, Lars E. O. (1991): “The simplest test of target zone credibility”. IMF Staff
Papers, no. 38, pp. 655–65.Svensson, Lars E. O. (1994): “Fixed exchange rates as a means to price stability:
what have we learned?” European Economic Review, no. 38, April, pp. 447–68.UNCTAD (1994): “Handbook of international trade and development statistics
(1993)”. Geneva.
263