monetary policy, asset prices and consumption in china · working paper series no 1240 / september...
TRANSCRIPT

Work ing PaPer Ser i e Sno 1240 / S ePtember 2010
monetary Policy,
aSSet PriceS and
conSumPtion in
china
by Tuuli Koivu

WORKING PAPER SER IESNO 1240 / SEPTEMBER 2010
In 2010 all ECB publications
feature a motif taken from the
€500 banknote.
MONETARY POLICY, ASSET PRICES
AND CONSUMPTION IN CHINA 1
by Tuuli Koivu 2
1 The views expressed represent those of the author and not necessarily those of the Bank of Finland. The author is grateful to the participants
in the ECB IPA seminar and the Hong Kong Monetary Authority Conference “ Financial Reforms, Macro Policies and Currency
Internationalization: The Case of China”, and in particular to Alexander Chudik, Kari Heimonen, Cao Honghui,
Aaron Mehrotra, Jukka Pirttilä, Gabor Pula and an anonymous referee for their useful comments.
2 Bank of Finland, European Central Bank and University of Jyväskylä;
e-mail: [email protected]
This paper can be downloaded without charge from http://www.ecb.europa.eu or from the Social Science Research Network electronic library at http://ssrn.com/abstract_id=1666727.
NOTE: This Working Paper should not be reported as representing the views of the European Central Bank (ECB).
The views expressed are those of the author and do not necessarily reflect those of the ECB.

© European Central Bank, 2010
AddressKaiserstrasse 2960311 Frankfurt am Main, Germany
Postal addressPostfach 16 03 1960066 Frankfurt am Main, Germany
Telephone+49 69 1344 0
Internethttp://www.ecb.europa.eu
Fax+49 69 1344 6000
All rights reserved.
Any reproduction, publication and reprint in the form of a different publication, whether printed or produced electronically, in whole or in part, is permitted only with the explicit written authorisation of the ECB or the author.
Information on all of the papers published in the ECB Working Paper Series can be found on the ECB’s website, http://www.ecb.europa.eu/pub/scientific/wps/date/html/index.en.html
ISSN 1725-2806 (online)
3ECB
Working Paper Series No 1240September 2010
Abstract 4
Non-technical summary 5
Introduction 6
1 Short overview of the earlier literature 8
2 Data and methodology 10
3 SVAR estimation 12
4 Conclusions 16
References 17
Appendix 20
CONTENTS
4ECBWorking Paper Series No 1240September 2010
Abstract
This paper studies the wealth channel in China. Using the structural vector autoregression method, we find that a loosening of China’s monetary policy indeed leads to higher asset prices, which in turn are linked to household consumption. However, the
importance of the wealth channel as a part of the monetary policy transmission mechanism in China is still limited.
JEL classification: E52, P24 Keywords: China, monetary policy, asset prices

5ECB
Working Paper Series No 1240September 2010
Non-technical Summary
China responded to the global financial and economic crisis by launching a stimulus package in November 2008. The monetary policy stance was eased, and a large share of investment projects included in the package was financed by bank credit. The large size of the stimulus package – 13% of GDP in 2008 – has raised questions about possible unwanted side effects on the economy. In particular, the role of a loose monetary policy in hastening the return of stock and housing prices to their rising trends has been discussed. However, there are no earlier academic studies on the links between monetary policy, asset prices and the real economy in China. In this study, we aim to fill this gap and contribute to the current discussion of optimal stimulus policies. Using quarterly data for 1998-2008 we study the impacts of monetary policy on urban household consumption via both stock and housing prices. According to our results, monetary policy indeed has an impact on stock and residential prices in China. As expected, a monetary policy loosening leads to an increase in both types of asset prices. Furthermore, the link from asset prices to household consumption is found to be positive. However, this result is not highly robust, which is not surprising in light of the high volatility of the Chinese stock markets. Earlier studies on the US economy have found that if an increase in asset prices and thus in household wealth is temporary in nature, its impact on household consumption will be modest (Lettau, Steindal and Ludvigson, 2002). Furthermore, a very small share of the Chinese population own more than one apartment, so that an increase in housing prices may actually encourage some families to save more and thus improve their possibilities to buy an apartment. It may be the case that very few households will actually benefit from higher housing prices by being in a position to be able to sell an apartment. Our results also reveal that the link from monetary policy to household consumption – either directly or via asset prices – is weak in China. This means that the possibilities of influencing household behaviour in China via monetary policy are limited, probably due to the fact that Chinese households have limited access to external finance. For example, because rather few households are able to finance their housing by mortgage loans, the majority of households are not greatly affected by monetary policy decisions. It seems that in order to improve the monetary policy transmission mechanism the financial sector will need further reform. Our finding that monetary policy does impact asset prices in China needs to be scrutinized. Even though asset price increases induced by monetary policy measures do not encourage households to increase their consumption, it is possible that asset prices play a more important role in other segments of the economy. Therefore, the link from monetary policy, via asset prices, to e.g. fixed asset investments, which account for nearly 50% of China’s GDP, should be carefully investigated.
6ECBWorking Paper Series No 1240September 2010
Introduction
China’s response to the outbreak of the global financial crisis and subsequent downturn was quick in autumn 2008. The announced stimulus package - even though amounted to about 13% of annual GDP - was only one part of a policy package that was put in place to keep the economy on a stable growth path. The majority of the stimulus policies and related investment projects were financed by bank credit, which led to a situation in which Chinese banks’ credit stock at the end of 2009 was 30% larger than a year earlier. Naturally, such a pronounced economic stimulus has raised questions about negative side effects. The rapid recovery of the Chinese stock markets in the summer 2009 was connected with rapid credit growth, and more recently the Chinese authorities have become concerned about price increases in the real estate market.2 This paper contributes to the discussion by studying the monetary policy transmission mechanism in China. In particular, we explore whether monetary policy can have an impact on asset prices, namely residential property prices and stock prices, and if so whether these price developments are capable of influencing household consumption. To our knowledge, there are no earlier studies that estimate links between monetary policy, asset prices and household consumption based on Chinese data. According to our results from a structural VAR model, a loosening of monetary policy indeed leads to higher asset prices in China. Although these positive asset price developments are linked to higher household consumption, our findings on the wealth channel remain weak. Overall, the effects of monetary policy on Chinese households’ behaviour are limited. In addition to the current economic fluctuations, study of the stock and residential property markets is motivated by their increasing importance in the Chinese economy. Interestingly, developments in the two asset markets have been uneven over the last decade. In particular, the stock markets have had a bumpy ride, as share prices experienced several booms and busts right after the opening of the Shanghai Stock Exchange in 1990 (Figure 1). Subsequently, market performance has been weak – especially compared to the strong performance of the economy. The weakness of the stock market was thought to be due mainly to institutional problems such as lack of transparency, low quality of listed companies, weak minority shareholder rights, limited role of institutional investors, and the unclear plan to sell state-owned shares.3 Efforts were made to revive investors’ interest in the stock markets through institutional reforms touching on some of these problems, which in part led to another stock market bubble in 2006-2007, as share prices rose fivefold in less than two years, before the market crashed again. The sharpest monthly drop in the Shanghai A-Index amounted to almost 25% in October 2008. As mentioned above, the performance of the stock exchanges has been upbeat since the start of 2009, thanks to stimulus measures and robust economic growth in China. Compared to the high volatility of stock markets, developments in Chinese housing prices have been consistently positive, even though extensive reforms have also targeted this sector (Figure 1). Liang and Cao (2007) divide the reforms into three subperiods. The last of the three began in 1998, after which most of the apartments were privatised and the market mechanism was allowed to
2 For example, China raised the minimum down payment on a second house to 40% and tightened land-sale regulations for developers, by e.g. introducing the first nationwide minimum down payment on land purchases in December 2009. At the same time, tax regulations on capital gains on house sales were tightened. Since then a number of other regulatory changes have been implemented in order to cool off price increases in the housing market. 3 An overview of stock market developments in China can be found in e.g. Chen and Shih (2002).

7ECB
Working Paper Series No 1240September 2010
function. Nowadays 80% of urban residents own their apartment in China.4 However, the public sector has maintained its role as a moderator in the real estate market, not least because of its monopoly in supplying land. Moreover, minor regulatory changes, e.g. in respect of minimum down payments and land usage, are still common. Housing prices have performed favourably for many years since the start of the data series in 1998. The strong uptrend ended only in 2008 and even then the period of declining prices was short-lived; since the spring of 2009, prices have been on the rise again. Figure 1. Shanghai A-Index and residential prices in China.
00
1 000
2 000
3 000
4 000
5 000
6 000
7 000
1.1992 1.1994 1.1996 1.1998 1.2000 1.2002 1.2004 1.2006 1.2008 1.2010
Residential market selling prices, RMB/Sq meter
Shanghai A-index
Source: CEIC
In the past, asset prices had virtually no impact on the Chinese economy. The size of the stock markets compared to the economy was small, and until the second half of the 1990s, apartments were owned by the public sector. Profound economic reforms have gradually increased the importance of asset markets in the economy. During the stock market boom in 2007, the number of stock accounts rose to 139 million (Leung and Yim, 2008).5 In addition, more and more companies are obtaining external finance by listing on stock markets. The total capitalisation of Shanghai and Shenzhen Stock Exchanges, which amounted to just 5% of GDP in the mid-1990s, peaked at more than 100% of GDP at the end of 2007. The real estate sector is a key segment of the Chinese economy. The volume of investment in the sector amounts to 10% of GDP on average. However, the relevance of asset market development for household behaviour is questionable, as only 2.3% of total household income was classified as property income in 2008 (Figure A1 in the Appendix). The paper is organised as follows. We first present a short overview of the earlier vast theoretical and empirical literature on the wealth channel. As mentioned earlier, we are not aware of any papers that examine whether monetary policy affects household consumption in China via its impacts on asset prices. After the literature review, we describe the data and methodology for estimating the links between monetary policy, asset prices and household consumption in China. The third section
4 Financial Times, 22nd September 2009: http://blogs.ft.com/dragonbeat//2009/09/22/whats-behind-chinas-skyrocketing-residential-property-market-subsidies-subsidies-subsidies/?catid=152&SID=google 5 Obviously, a single person or legal entity can hold more than one account. Unfortunately, data on share of population holding a stock account in China is not available.

8ECBWorking Paper Series No 1240September 2010
contains a summary of the results, and in the fourth section we conclude and draw some policy implications.
1. Short overview of the earlier literature Besides the other monetary policy transmission channels, monetary policy can affect the real economy also via the ‘wealth channel’, which can be divided into two parts. For the wealth channel to function, monetary policy must first be capable of affecting the value of wealth, and secondly, changes in wealth must influence consumption. The existing literature on the wealth channel is vast and has a long history. Already in 1933, in the aftermath of the economic crisis, Fisher (1933) noted that a fall in security prices could be a phase of an economic depression. Later on, a theoretical framework was set out for the channel (de Leeuw and Gramlich, 1969). In the theoretical literature on the first part of the wealth channel, monetary policy can impact stock prices in many ways. Monetary policy, which is assumed to have an impact on long-term interest rates and on the level of economic activity, can influence stock prices by affecting companies’ future earnings and dividend payments. Interest rates also affect the discounted stream of dividends, and monetary policy has thus been linked to expected stock returns. Furthermore, lower interest rates are assumed to render shares more attractive than bonds as an outlet for savings and thus to boost share demand and prices. Expansionary monetary policy should also encourage households to reduce their money balances, not merely in order to increase their consumption but also to increase their equity holdings (Mishkin, 1996). The recent empirical papers confirm these theoretical considerations and find a negative link from a monetary tightening to stock prices. For example, Bernanke and Kuttner (2005) and Rigobon and Sack (2004) find that a 25 basis point rise in a short-run interest rate decreases stock prices 1.0-2.4% in the US market. Bernanke and Kuttner (2005) find that most of the decline in stock prices is due to the negative impact of tight monetary policy on expected future dividends and expected future excess returns. In this respect, the role of risk becomes important, as a tightening of monetary policy can increase either the riskiness of stocks or investors’ risk adversity, thus raising the expected equity premium. More evidence on the link from monetary policy to stock prices has been found by Bordo and Wheelock (2004) and Alessi and Detken (2009) who conclude that an increase in liquidity boosts asset prices in developed economies. The link from monetary policy to residential prices can be described using the concept of user cost of capital (Mishkin, 2007). An interest rate hike raises the user cost of capital, causing a decline in housing demand and prices. As a result, housing construction and thus aggregate demand in the economy decrease. Expectations of a rise in interest rates may quickly push up the user cost of capital by lowering the expected real rate of appreciation of residential prices. There is empirical evidence also on the link from monetary policy to residential prices. Using the structural VAR methodology, Iacoviello (2000) finds that monetary policy has an impact on housing prices in Europe. Ahearne, Ammer, Doyle, Kole and Martin (2005) study housing prices in 18 advanced economies and also get results that confirm the link from monetary policy to housing prices. In particular, booms in housing prices are often preceded by a period of monetary policy loosening. Recently, monetary policy credibility has been linked to the wealth channel (Bordo and Wheelock, 2004). Successful monetary policy, that keeps inflation low, can increase the probability of an asset price bubble.
9ECB
Working Paper Series No 1240September 2010
The theoretical models dealing with the second part of the wealth channel - the link between asset prices and consumption - normally rely on the life cycle model by Ando and Modigliani (1963), which gives aggregate consumption as a function of aggregate expected income and net worth. 6 Modigliani (1971) provides the framework for a large macro model in which monetary policy can affect asset prices and hence also consumption. Consumers maximise utility subject to a lifetime resource constraint, and consumption is defined as
[ ])(YHAmpcC W += (1) where C is consumption, mpc is the marginal propensity to consume, A is real non-human wealth and H(Y) is the present value of the expected income stream. As one can see from (1), the importance of the wealth effect on consumption depends largely on the marginal propensity to consume. Furthermore, the shorter the household’s planning horizon, the stronger the effect from wealth to consumption (Poterba, 2000). In the wide selection of empirical papers, the majority conclude that asset prices do influence consumption.7 However, estimates of the size of the effect vary considerably. While Modigliani (1971) suggested that a one dollar increase in wealth boosted consumption by 5 cents, more recent studies estimate the impact to be smaller (Lettau and Ludvigson, 2004). There are many reasons for the variation in estimates of the size of the impact (Poterba, 2000, Altissimo et al., 2005). The wealth effect depends on the liquidity of the asset market and the predictability of prices. In addition, stock and residential prices influence consumption differently, due to the difference in ownership distributions. While households’ equity wealth is highly concentrated, real estate wealth has been more equally distributed among households. As a result, stock prices probably affect a fairly small share of households while real estate prices are relevant for most households’ behaviour. In addition, if shareholdings are concentrated in pension funds, the marginal propensity to consume is probably lower than if the equities are owned directly by households. Interestingly, the nature of the price increases or decreases is also relevant: Lettau and Ludvigson (2004) found that, while permanent shocks to wealth seem to have a statistically significant effects on household consumption, most shocks in asset prices are only temporary and do not affect consumption. Each of the above mentioned papers studies only a single part of the wealth channel. Either they look at the link from monetary policy to asset prices or they estimate the impact from asset prices to consumption. They do not explore whether changes in asset prices due to monetary policy have any impact on consumption. There are few studies that deal with both parts of the wealth channel. Ludvigson, Steindal and Lettau (2002) summarise the results for the wealth channel from the large macro models of the US economy. Although the link from monetary policy to the real economy via asset prices is found to be significant, the importance of the wealth channel in the economy seems to be moderate. The authors apply a structural VAR to US data and conclude that an increase in household wealth due to a loosening of monetary policy has a positive, but small and hardly significant, impact on household consumption. From the viewpoint of this paper, studies on the wealth channel in emerging economies – and China in particular – are of course the most relevant ones. However, this literature is very limited. Liang and Cao (2007) study the impacts of monetary policy on residential prices in China. According to their long-run results, output growth is the dominating force behind property prices while the
6 Literature surveys on theoretical and empirical work on the impacts of asset prices on the real economy can be found in e.g. Altissimo et al. (2005) and Poterba (2000). 7 In the empirical literature, household wealth is often measured by asset prices due to data availability.
10ECBWorking Paper Series No 1240September 2010
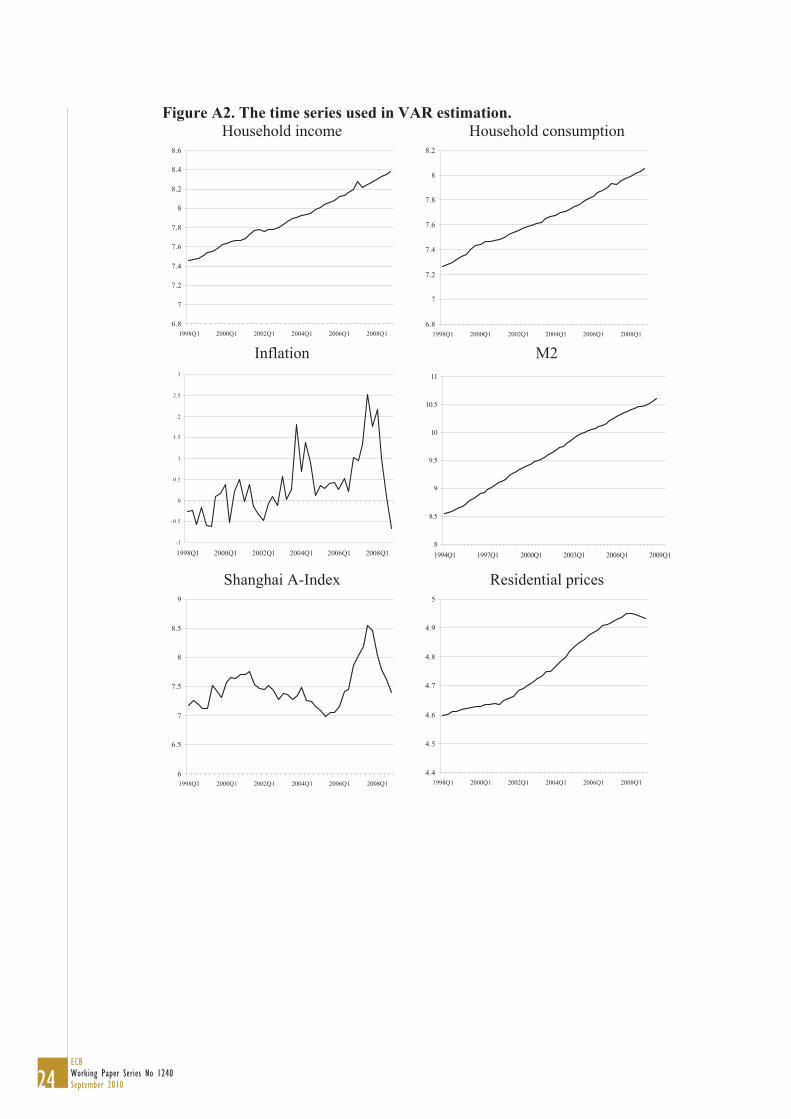
influence of bank credit on asset prices is not statistically significant. Funke (2004) studied the wealth effects from stock prices to private consumption with a panel of 16 emerging countries. According to his results, a 10% decline in stock prices could cause a 0.2-0.4% decline in private consumption. The panel data used by Peltonen, Sousa and Vansteenkiste (2008) included 14 emerging economies, including China. Confirming the results by Funke, they found a significant link from stock prices to consumption. They also found that higher housing prices tend to increase consumption. In China’s case, stock prices were found to boost consumption although the wealth effect was the smallest among the countries: a 10% rise in stock prices increased consumption by 0.12%. Residential prices did not have a significant impact on consumption in China. 2. Data and methodology As mentioned above this study is the first attempt to highlight the dynamics of the relationship between monetary policy, asset prices and consumption in China. We employ a structural VAR model with five variables: household income, household consumption, consumer price inflation, an indicator for monetary policy, and asset prices. The research period runs to the end of 2008 but is restrictive in starting as late as1998 due to the availability of data. Our data source is the CEIC database (data details in appendix Table A1). All variables except consumer price inflation are in real terms and in logs. Furthermore, all the time series except stock prices are seasonally adjusted using Tramo Seats. The time series are graphed in Figure A2. Household income and consumption are measured as disposable income and living expenditure per capita, respectively.8 The household data are based on urban household surveys. Although we are restricted to studying the urban areas because of data availability, we assume that the importance of the wealth channel is very limited in the rural areas, due to the presumably very modest shareholdings. Furthermore, the residential market in the countryside is still fairly inactive. Inflation is measured by quarterly changes in the consumer price index. The selection of a monetary policy indicator is complicated by a fact that there is no consensus on how to measure China’s monetary policy stance, mainly because of a plethora of policy tools (see e.g. Geiger 2008). While the studies on the advanced economies typically use a policy interest rate as the monetary policy indicator, the role of interest rates in the Chinese economy is known to be very modest (see e.g. Koivu 2008; Laurens and Maino 2007; Mehrotra 2007). Even if we decide on a quantitative measure for China’s monetary policy we are left with a number of different monetary aggregates. Using base money, which in China’s case includes currency in circulation and commercial bank reserves held at the central bank, could obviously be defended by a fact that it is under authorities’ direct control. However, the frequent changes in commercial banks’ reserve requirement have made it difficult to interpret changes in base money. While an increase in base money would otherwise be interpreted as monetary easing, in China’s case a rise may simply reflect a hike in the reserve requirement and thus a tightening in the monetary policy stance. M2 seems to capture much of decision makers’ attention. They set annual growth targets for M2 and the People’s Bank of China (PBC) closely monitors movements in M2 for its quarterly reports. Furthermore, banks’ reserves, for which the movements are difficult to interpret, as mentioned
8 A number of earlier studies on the wealth channel concentrate on the consumption of nondurable goods and services. Unfortunately, we are not able to follow this course since quarterly data on the different consumption categories in China starts from 2002.
11ECB
Working Paper Series No 1240September 2010
above, are excluded from M2.9 It is of course somewhat questionable to use such a broad monetary aggregate as a monetary policy indicator in light of the possible problems related to the controllability of the aggregate. However, contrary to many advanced economies, we argue that the Chinese officials actually do control M2 because the public sector still holds a majority ownership in all the major banks in China.10 Moreover, even though the credit quotas were abolished in 1998, the authorities still actively issue direct guidelines regarding banks’ operations under the so-called window guidance. The use of a broad monetary aggregate can be defended also by a fact that it may comprehensively capture the impacts of the various policy tools on the economy. We study the behaviour of two different asset markets – housing and stocks. Like many earlier studies, we do not have time series data on household wealth in China and so must use asset prices as a proxy for household wealth. As a first proxy, we use the Shanghai A-share Stock Index.11 Another proxy that we use for household wealth is the residential property price index. To study the impacts of monetary policy on asset prices and finally on consumption, we estimate a structural vector autoregression (VAR) model. The VAR model is preferable in our case, where the variables endogenously influence each other. A basic reduced form VAR process is presented as:
tptptt uyAyAy +++= −− ...11 , (2) where yt = (y1t, … , yKt) contains K endogenous variables. The Ai are K x K coefficient matrices and ut = (u1t, … , uKt) is a K-dimensional process. Errors (ut) are assumed to be serially uncorrelated. The basic VAR model explains the endogenous variables solely by their history. If we want to model possible contemporaneous relations between the variables, we need a structural form of the VAR:
.... *1
*1 tptptt ByAyAAy ε+++= −− (3)
The structural errors, t, are assumed to be serially and cross-sectionally uncorrelated. The A*i (i=1, …p) are K x K coefficient matrices. The relationship between error terms in the reduced and structural forms is the following: tt BAu ε1−= . (4) If we write Aut = B t we essentially decompose the structural errors ( t) into components caused by the unexplained contemporary reduced-form shocks (ut). Since we want to highlight contemporary relations, we must impose 2K2 – K(K+1)/2 restrictions on the A and B matrices, to be able to exactly identify the system. In our case, where K=5, the number of necessary restrictions is 35. We impose the following restrictions (y indicating household income, c household consumption, inflation, m monetary policy and ap asset prices): 9 According to China’s national data definition, M0 comprises currency issued by the PBC less the amount held by banking institutions. M1 comprises of M0 and demand deposits. M2 comprises M1 and time and savings deposits. 10 The most important exceptions being the foreign-owned banks and the Minsheng Bank. 11 In Mainland China, there are two stock markets. The Shanghai Stock Exchange commenced operations at the end of 1990 and the Shenzhen Stock exchange in the following year. The use of data from the Shanghai A-Index is defended by a fact that the Shanghai Stock Exchange has always been the leading market by size. As of end-2008, the capitalisation of the Shanghai Stock Exchange corresponded to 32% and that of Shenzhen 8% of GDP. Furthermore, the A-shares cover 99% of the capitalisation in the Shanghai Stock Exchange while the B-shares, originally directed at foreign investors, play only a minor role in the market.

12ECBWorking Paper Series No 1240September 2010
=
apt
mt
t
ct
yt
apt
mt
t
ct
yt
bb
bb
b
uuuuu
εεεεε
ππ
55
44
33
22
11
00000000000000000000
1**0**1***0010000*1*00*01
where * indicates a parameter that is freely estimated in the system. Following the earlier literature (see e.g. Ludvigson et al. 2002), household income is presumed to be slow to adjust and is allowed to react to shocks to consumption, money supply and asset prices only with a lag. However, as nominal wages take some time to adjust, real income is allowed to react immediately to shocks to inflation. Consumption is allowed to react immediately to shocks to real income and inflation. We assume that asset prices, measured at the end of period, can influence consumption, measured as a flow over the following period. Along with the general literature on monetary policy transmission mechanism (see e.g. Bagliano and Favero, 1998), it is assumed that monetary policy can affect consumption (and all the other variables in the model except asset prices) only after a lag of one period. We also introduce sticky prices, as is customary in the literature. It is challenging to construct a monetary policy reaction function for China – in particular because our monetary policy indicator M2 may in the short run deviate from the authorities’ target. In the monetary policy literature, it is customary to allow monetary policy to react immediately to shocks in all other variables and we follow suit (see for example, Bernanke and Mihov, 1998). Although the PBC has argued that it does not target asset prices in its monetary policy, the Chinese authorities, as mentioned above, seem to be keen on guiding developments in the real estate and stock markets, so that it is realistic to allow monetary policy to react to shocks in asset prices immediately. Finally, asset prices are allowed to react to all shocks in the economy without delay, except for shocks to consumption. This assumption is necessary in order to implement a sufficient number of restrictions in the model. As the theoretical background behind this restriction is admittedly weak we tested the obtained results by optional models where asset prices were allowed to react immediately to shocks in consumption. The results remained very much the same. 3. SVAR estimation
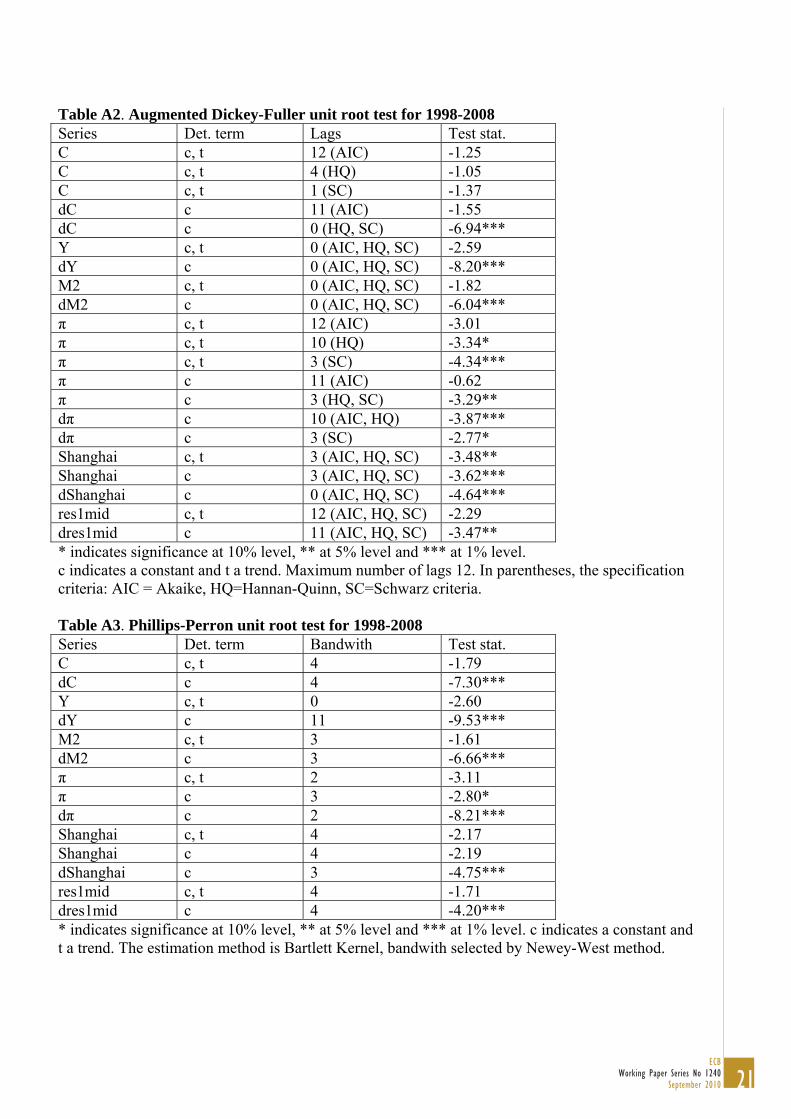
We test first test the order of integration of our time series. The results from the Augmented Dickey-Fuller (ADF) and Phillips-Perron unit root tests can be found in Tables A2 and A3 in the Appendix. The number of lags included in the tests was defined by the three information criteria. We included a trend and a constant in each test in levels and a constant in the tests in differences.12 According to the ADF test, all the series except the Shanghai A-Index seem to be integrated of order one.13 However, the Phillips-Perron test shows all our time series (incl. the stock index) to definitely be I(1) variables.
12 The test in levels of the Shanghai A-index and consumer price inflation were run with and without a trend. 13 When consumption is tested in differences with 11 lags, as suggested by the Akaike information criteria, the null hypothesis of a unit root cannot be rejected. However, the high number of lags may be the reason for the result, as the

13ECB
Working Paper Series No 1240September 2010
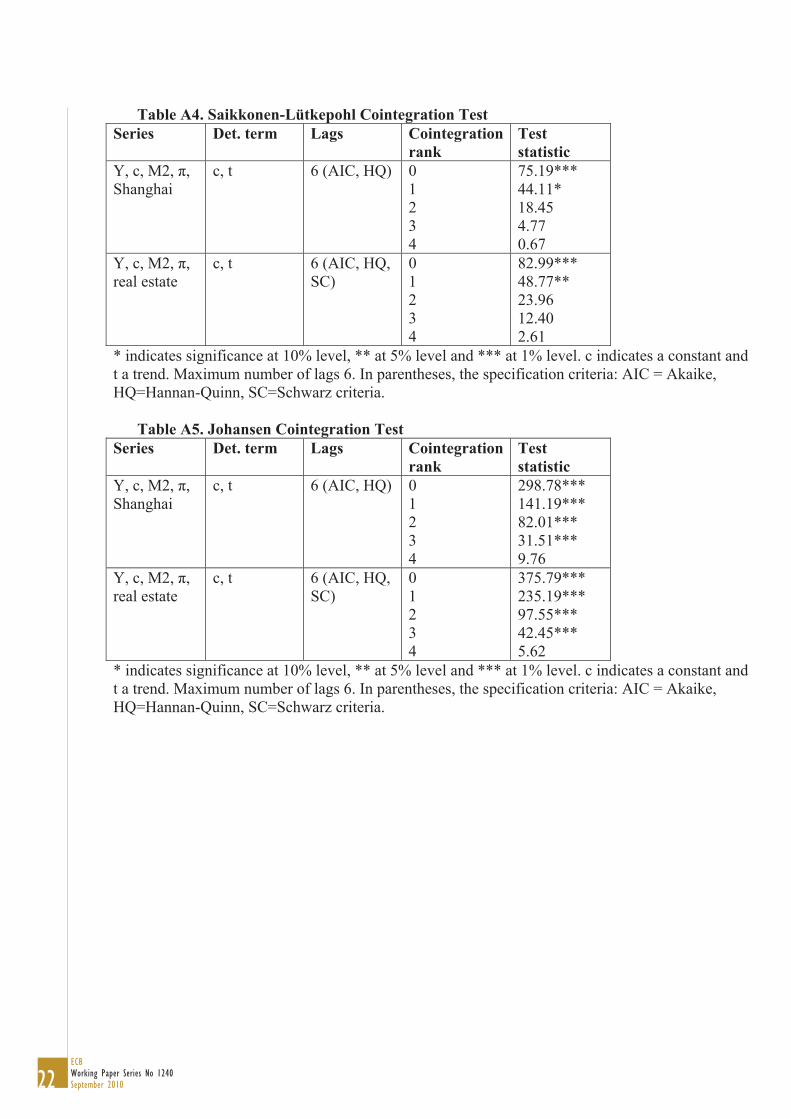
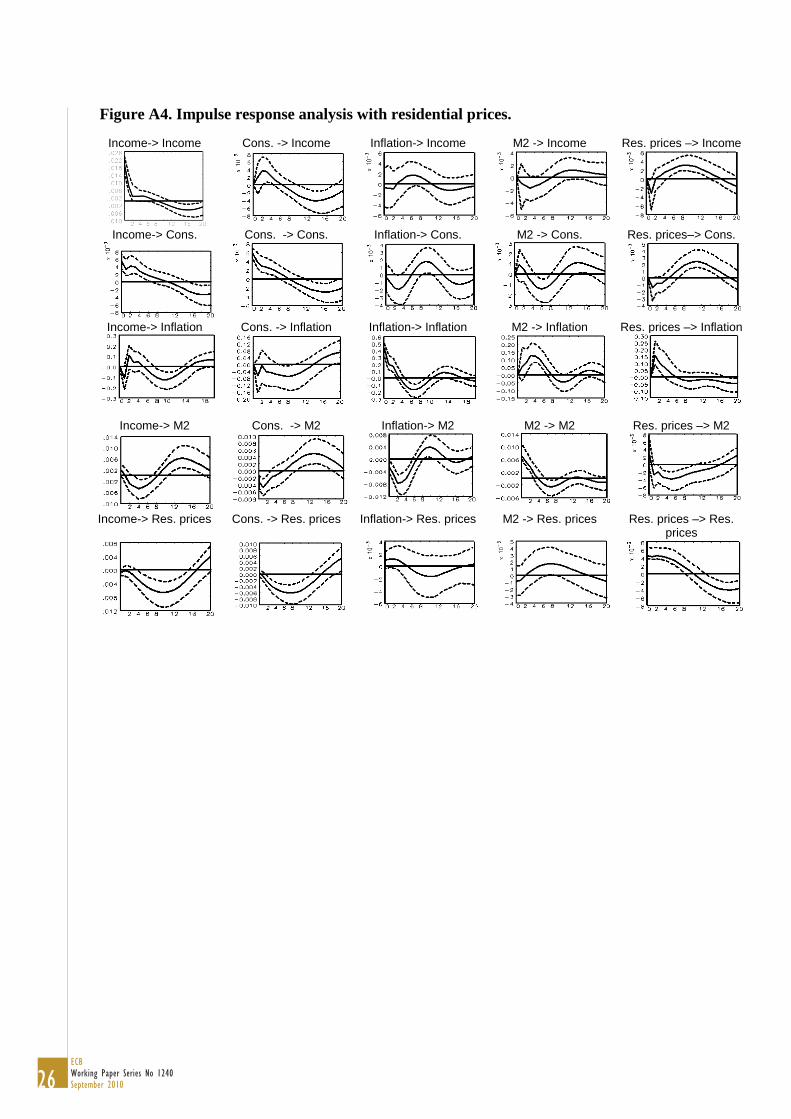
Next we run cointegration tests to find out whether there are any long-run relationships between the variables. The results from the Saikkonen-Lütkepohl and Johansen Cointegration tests can be found in Tables A4 and A5 in the Appendix. As above, the number of lags is decided on the basis of information criteria, and we introduced a trend and a constant in all our tests. We clearly found signs of cointegration vectors. However, the number of vectors is highly dependent on the cointegration test. The reliability of the cointegration test results can be weak due to the shortness of the time series. It is thus difficult to determine the exact number of cointegrating vectors in our model. Furthermore, based on theory, we have no strong preference for a specific number of long run vectors in the system. We thus continue to run VARs in levels without restricting the number of cointegrating vectors. According to Lütkepohl (2004), this practise does not lead to a misinterpretation of asymptotic properties of results as long as one allows at least two lags. This procedure has been followed also by e.g. Bagliano and Favero (2002). We run the model separately with the stock market index and with residential prices, and include a constant and a trend in both estimations. The chosen number of lags is two in both systems, based on the misspecification tests. Also based on the results from the misspecification tests, we include an impulse dummy in our estimations.14 We test the models via the Portmanteau and LM tests for autocorrelation of residuals, the Jarque-Bera tests for non-normality, and ARCH-LM tests, to find possible ARCH effects in the residuals. Neither of the models seems to have any major problems in passing most of the misspecification tests (Tables A6 and A7 in the Appendix). In the model with stock prices, there is some indication of autocorrelation of residuals according to the Portmanteau test, but the result is significant only at the 10% level. In addition, the results from the LM test, on the existence of residual autocorrelation in shorter lags, does not signal any problems in the system. In the model with residential prices, there are no signs of autocorrelation. However, the residuals from the income equation strongly indicate nonnormality. A closer look at the test results reveals that the failure of the normality test is due to kurtosis rather than excess skewness. According to Juselius (2006), VAR estimates are more sensitive to deviations from normality due to skewness than to kurtosis, and so we continue to report the results. As China is a transition economy in which monetary policy and asset markets have been in a process of continuous reform during the research period, it is important to test also the stability of the model. According to our results from Chow break point and sample split tests, using bootstrapped p-values, there does not seem to be a problem in this respect. Neither the break point nor the sample split test find convincing evidence (at least at 5% level) of breaks in the research period. We also run Cusum tests but do not find any signs of instability.15 However, the test results have to be treated cautiously, as the short sample period obviously limits the possibilities for conducting break tests and reduces their efficiency. Because the matrix coefficients of the VAR analysis are difficult to interpret as such, we take a closer look at the dynamics of the system and report the impulse response functions. The resulting impulse responses of each variable to a shock of one standard deviation in each of the other variables are reported in Figures A3 and A4 in the Appendix. The responses are reported for 20
null hypothesis can be rejected even at the 1% level when no lags are introduced, as suggested by both Hannan-Quinn and Schwartz criteria. 14 The impulse dummy for 2003Q4 is introduced because of a pick-up in the CPI due mainly to food prices and can be considered exogenous to our model. 15 The test results are available from the author.
14ECBWorking Paper Series No 1240September 2010
quarters using 1,000 bootstrapping replications. The significance of the results can be interpreted based on the reported 95% Hall bootstrapped percentile confidence intervals. Most of our results from both specifications are as expected. For example, a positive shock in income increases consumption, the result being strongly significant. The monetary policy reaction function also seems to be reasonable. The central bank reduces the money supply in response to a positive shock in either consumer price inflation or asset prices. Both results remain statistically significant for more than one year. The link in the opposite direction, from money supply to consumer price inflation, is also confirmed to accord with results found in the earlier papers on China’s monetary policy (see, for example, Koivu et al., 2009; Laurens and Maino, 2007). As expected, a positive shock to income increases stock prices in China. Interestingly, the impact of an increase in income on residential prices turns negative after less than a year. We assume that this is related to the supply of new apartments in the market. Fast economic growth leading to a positive shock in household income is often related to a construction boom in China which, after a lag, leads to an increase in housing supply and hence lower prices. Overall, the impact is rather small. A 5% shock to household income translates into a 1% decline in housing prices. The immediate impact of a consumption shock is negative for both stock and residential prices, reflecting households choosing to increase consumption instead of investing in stock markets or buying an apartment. As expected, stock markets benefit faster than the housing sector from an increase in consumption. Turning now to the wealth channel in China, the impulse response analysis indeed finds a link from monetary policy to asset prices. As expected, Chinese share prices react quickly and positively to an increase in liquidity. The size of the impact is economically meaningful. A 1% shock to M2 supply would imply close to a 10% rise in the Shanghai A-Index. This reaction is statistically significant for about one year. Later on, the impact of M2 on stock prices turns negative. The positive reaction of residential prices to a monetary policy shock is slower than the reaction of stock prices, as expected. Although only borderline significant, the positive impact lasts longer than the reaction of stock prices to a shock to the money supply. The results for the second part of the wealth channel – the link from asset price developments to household consumption –are somewhat less clear. A positive shock in stock prices indeed leads to an increase in household consumption, but the result is not statistically highly significant. The positive reaction of consumption to a shock to residential prices takes longer to realise. Actually, the initial reaction of consumption to a rise in housing prices is negative. Only after a lag of almost two years does the reaction turn positive and statistically significant. These results reflect the relatively small role that asset markets still play in households’ income and consumption in China at the aggregate level. Although the popularity of investing in stocks has increased over the years, the volume of investment in stocks is probably still very small compared to bank deposits. Another reason for the rather weak link from stock prices to consumption may be the high volatility of China’s stock market. As Lettau and Ludvigson (2004) showed, a temporary increase in wealth may only have a minor impact on consumption. The result that residential prices first have a negative impact on household consumption is probably related to a fact that higher prices force some households to save even larger shares of their income in order to be able to buy an apartment. Probably only a few households are in a position to sell an apartment and thus benefit from higher prices.
15ECB
Working Paper Series No 1240September 2010
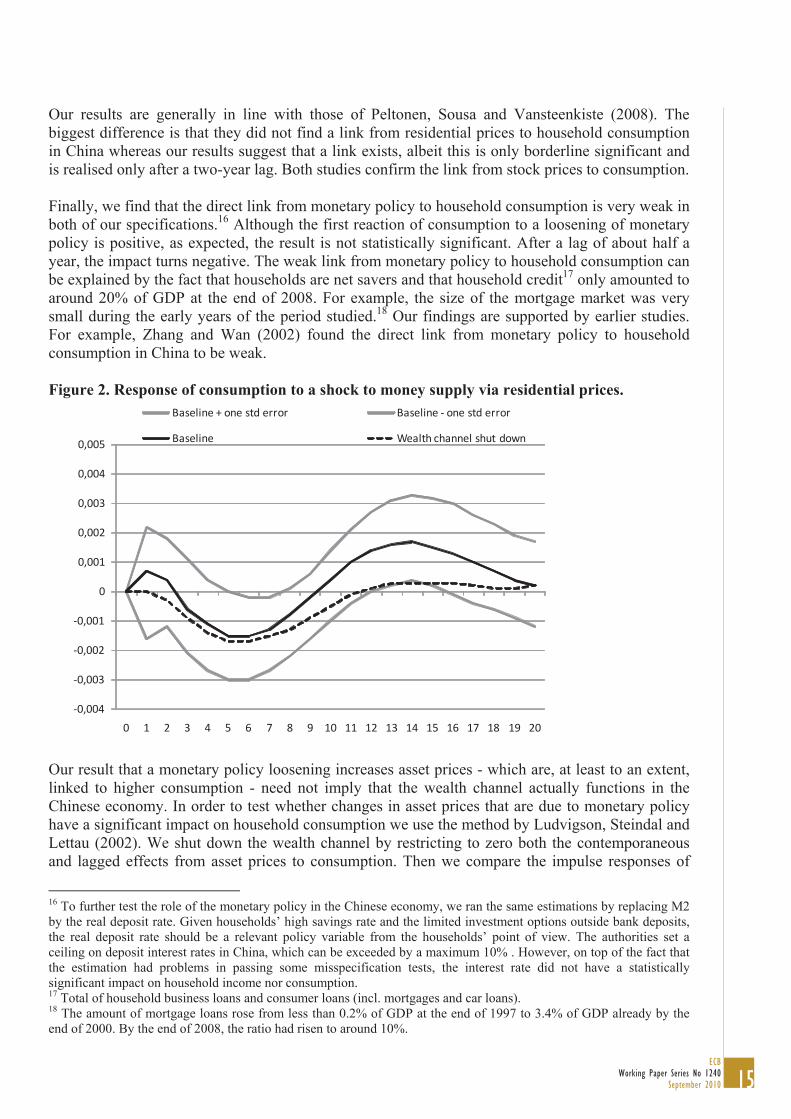
Our results are generally in line with those of Peltonen, Sousa and Vansteenkiste (2008). The biggest difference is that they did not find a link from residential prices to household consumption in China whereas our results suggest that a link exists, albeit this is only borderline significant and is realised only after a two-year lag. Both studies confirm the link from stock prices to consumption. Finally, we find that the direct link from monetary policy to household consumption is very weak in both of our specifications.16 Although the first reaction of consumption to a loosening of monetary policy is positive, as expected, the result is not statistically significant. After a lag of about half a year, the impact turns negative. The weak link from monetary policy to household consumption can be explained by the fact that households are net savers and that household credit17 only amounted to around 20% of GDP at the end of 2008. For example, the size of the mortgage market was very small during the early years of the period studied.18 Our findings are supported by earlier studies. For example, Zhang and Wan (2002) found the direct link from monetary policy to household consumption in China to be weak. Figure 2. Response of consumption to a shock to money supply via residential prices.
-0,004
-0,003
-0,002
-0,001
0
0,001
0,002
0,003
0,004
0,005
0 1 2 3 4 5 6 7 8 9 10 11 12 13 14 15 16 17 18 19 20
Baseline + one std error Baseline - one std error
Baseline Wealth channel shut down
Our result that a monetary policy loosening increases asset prices - which are, at least to an extent, linked to higher consumption - need not imply that the wealth channel actually functions in the Chinese economy. In order to test whether changes in asset prices that are due to monetary policy have a significant impact on household consumption we use the method by Ludvigson, Steindal and Lettau (2002). We shut down the wealth channel by restricting to zero both the contemporaneous and lagged effects from asset prices to consumption. Then we compare the impulse responses of
16 To further test the role of the monetary policy in the Chinese economy, we ran the same estimations by replacing M2 by the real deposit rate. Given households’ high savings rate and the limited investment options outside bank deposits, the real deposit rate should be a relevant policy variable from the households’ point of view. The authorities set a ceiling on deposit interest rates in China, which can be exceeded by a maximum 10% . However, on top of the fact that the estimation had problems in passing some misspecification tests, the interest rate did not have a statistically significant impact on household income nor consumption. 17 Total of household business loans and consumer loans (incl. mortgages and car loans). 18 The amount of mortgage loans rose from less than 0.2% of GDP at the end of 1997 to 3.4% of GDP already by the end of 2000. By the end of 2008, the ratio had risen to around 10%.
16ECBWorking Paper Series No 1240September 2010
consumption to a monetary policy loosening as between the two cases where the wealth channel is allowed or not allowed to function. If the wealth channel were functioning, there would be a clear difference between the two impulse responses. In China’s case, however, we see only a slight difference between the two responses (Figure 2). It seems that when the wealth channel is not allowed to operate the positive impact of monetary policy on household consumption is nil in the specification with residential prices. It thus seems that the wealth channel does work in the right direction in the Chinese economy but only to a very limited extent. Furthermore, when we test for the existence of a wealth channel via the stock market, we notice that opening up the possible wealth channel in China does not induce any significant change in the reaction of household consumption to monetary policy. We thus conclude that the wealth channel does not function via the stock markets and is very weak via residential prices in China.
4. Conclusions
This paper aims to increase our understanding of the monetary policy transmission channels in China. In particular, we have tried to answer the question whether monetary policy influences household consumption via an impact on household wealth. Links through both the housing market and stock prices are explored. This is the first attempt to study the wealth channel in China although the question is highly relevant from the current policy perspective. Active discussions have taken place on the possible negative side effects of the loose monetary policy that has been implemented, along with the vast stimulus package, since the outbreak of the global financial and economic crisis in the autumn of 2008. In particular, questions have been raised as to the role of loose monetary policy in causing the rise in asset prices in China. This study analyses the wealth channel via stock and housing markets using a structural VAR model and data for 1998-2008. According to the results, a loosening of monetary policy indeed leads to higher asset prices in China. Furthermore, urban households’ consumption reacts positively to a rise in either residential or stock prices, although the effects are fairly weak. After studying explicitly the existence of the wealth channel, we conclude that changes in asset prices due to monetary policy do not affect household consumption in a robust manner. This outcome is not surprising taking into account that even in the advanced economies the importance of the wealth channel has been estimated to be small. Furthermore, the volatility and unpredictability of the Chinese stock markets probably reduces the impact of stock prices on household behaviour (Lettau and Ludvigson, 2004, Ludvigson et al. 2002). Higher housing prices may even encourage some households to increase their saving in order to be able to afford an apartment, and only a small proportion of households may be in position to sell an apartment and thus benefit from higher residential property prices. Our results can be interpreted as indicating that the possible side effects from loose monetary policy to the household sector are small and thus not a cause for worry. But, on the other hand, the results also reveal that the possibilities of affecting households’ decision-making via monetary policy are very limited in China, as even the direct link from monetary policy to consumption is weak. Although this outcome is not surprising, taking into account the limited access of households to the financial sector, it may raise concern among policy makers. In order to make Chinese monetary policy more effective for the economy, further liberalisation and reform is needed in the financial sector.

17ECB
Working Paper Series No 1240September 2010
Furthermore, the link from monetary policy to asset prices, found in this paper, is highly relevant for the current discussion on optimal stimulus policies. The result is supported by the most recent data (not in our sample): during the period of loose monetary policy asset prices have increased considerably. Although households seem reluctant to react to changes in asset prices, it may well be that asset prices play an important role in other parts of the Chinese economy. For example, developments in fixed asset investment – which covers nearly half of China’s GDP - may follow asset prices closely, which implies that asset price developments can cause considerable fluctuations in the real economy. As anecdotal evidence, it seems that price fluctuations in the real estate market were a key factor behind the slowdown in investment growth in China in the first half of 2008, albeit this was prior to the global economic downturn. The link between asset prices and investment would thus seem to warrant further careful investigation. References Ahearne, A. G., Ammer, J., Doyle, B. D., Kole, L. S., and Martin, R. F. H. (2005) House Prices and Monetary Policy: A Cross-Country Study. Board of Governors of the Federal Reserve System, International Finance Discussion Papers, No. 841. Alessi, L. and Detken, C. (2009) ‘Real Time’ Early Warning Indicators for Costly Asset Price Boom/Bust Cycles – A Role for Global Liquidity. European Central Bank Working Paper Series, No. 1039 /March 2009. Altissimo, F., Georgiou, E., Sastre, T., Valderrama, M. T., Sterne, G., Stocker, M., Weth, M., Whelan, K. and Willman, A. (2005) Wealth and Asset Price Effects on Economic Activity. European Central Bank Occasional Paper Series, No. 29 / June 2005. Ando and Modigliani (1963) The Life Cycle Hypothesis of Saving: Aggregate Implications and Tests.” American Economic Review 53, 55-84. Bagliano, F. C. and Favero, C. A. (1998) Measuring monetary policy with VAR models: An evaluation. European Economic Review 42, 1069-1112. Bernanke, B. and Mihov, I. (1998) Measuring Monetary Policy. The Quarterly Journal of Economics 113, 869-902. Bernanke, S. B. and Kuttner. K. N. (2005) What Explains the Stock Market’s Reaction to Federal Reserve Policy? Journal of Finance LX, 1221-1257. Bordo, M. D. and Wheelock, D. C. (2004) Monetary policy and asset prices: A look at past U.S. stock market booms. NBER Working Paper 10704. Chen, C-H. and Shih, H-T. (2002) The Evolution of the Stock Market in China’s Transitional Economy. Edward Elgar Publishing Lted., UK. de Leeuw, F. and Gramlich, E. M. (1969) The Channels of Monetary Policy: A Ruther Report on the Federal Reserve – M.I.T. Model. Journal of Finance 24, 265-290. Fisher, I. (1933) The Debt-Deflation Theory of Great Depressions. Econometrica 1, 337-357.

18ECBWorking Paper Series No 1240September 2010
Funke, N. (2004) Is there a stock market wealth effect in emerging markets? Economic Letters 83, 417-421. Geiger, M. (2008) Instruments of monetary policy in China and their effectiveness: 1994–2006, UNCTAD Discussion Paper 187. Iacoviello, M. (2000) House prices and the macroeconomy in Europe: Results from a structural VAR analysis. ECB Working Paper, No. 18. Juselius, K. (2006) The Cointegrated VAR Model Methodology and Applications. Oxford University Press, Oxford, U.K. Koivu, T. (2008) Has the Chinese economy become more sensitive to interest rates? Studying credit demand in China. China Economic Review 20, 455-470. Koivu, T., Mehrotra, A. and Nuutilainen, R. (2009) An analysis of Chinese money and prices using a McCallum –type rule. Journal of Chinese Economics and Business Studies 7, 219-235. Laurens, B. J. and Maino, R. (2007) China: Strengthening Monetary Policy Implementation. IMF Working Paper No. 07/14. Lettau, M. and Ludvigson (2004) Understanding Trend and Cycle in Asset Values: Reevaluating the Wealth Effect on Consumption. The American Economic Review 94, 276-299. Leung, B. and Yim, J. (2008) Mainland China’s Stock Market Revives, Could It Last? Economic Focus, Hang Seng Bank, 19 May 2008. Liang, Q. and Cao, H. (2007) The impact of monetary policy on property prices: Evidence from China. Journal of Asian Economics 18, 63-75. Ludvigson, S., Steindal, C. and Lettau, M. (2002) Monetary Policy Transmission through the Consumption –Wealth Channel. Federal Reserve Bank New York Economic Policy Review, May 2002, 117-133. Lütkepohl, H. (2004) Vector Autoregressive and Vector Error Correction Models in Lütkepohl, M. and Krätzig (Eds.) Applied Time Series Econometris. Cambridge University Press, U.K. Mehrotra, A. (2007) Exchange and Interest Rate Channels during a Deflationary Era – Evidence from Japan, Hong Kong and China. Journal of Comparative Economics 35, 188-210. Mishkin, F. S. (1996) The Channels of Monetary Transmission: Lessons for Monetary Policy. NBER Working Paper 5464. Mishkin, F. S. (2007) Housing and the Monetary Transmission Mechanism. Finance and Economics Discussion Series, Federal Reserve Board, 2007-40. Modigliani, F. (1971) Monetary Policy and Consumption: Linkages via Interest Rate and Wealth Effects in the FMP Model. Federal Reserve Bank of Boston Conference Series 5, 9-84.
19ECB
Working Paper Series No 1240September 2010
Peltonen, T. A., Sousa, R. M. and Vansteenkiste, I. S. (2008) Wealth Effects in Emerging Market Countries. European Central Bank Working Paper No. 1000. Poterba, J. M. (2000) Stock Market Wealth and Consumption. Journal of Economic Perspectives 14 (2), 99-118. Rigobon, R. and Sack, B. (2004) The impact of monetary policy on asset prices. Journal of Monetary Economics 51, 1553-1575. Zhang, Y. and Wan, G. H. (2002) Household consumption and monetary policy in China. China Economic Review 13, 27-52.
20ECBWorking Paper Series No 1240September 2010
The Appendix
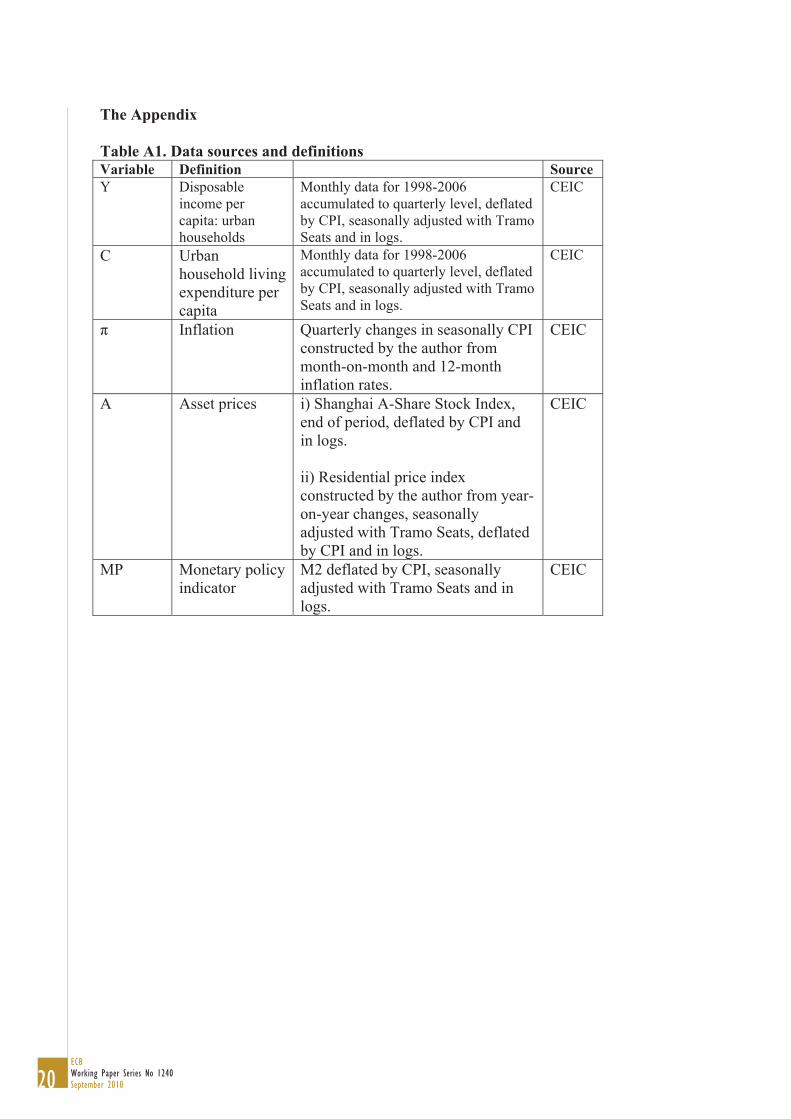
Table A1. Data sources and definitions Variable Definition Source Y Disposable
income per capita: urban households
Monthly data for 1998-2006 accumulated to quarterly level, deflated by CPI, seasonally adjusted with Tramo Seats and in logs.
CEIC
C Urban household living expenditure per capita
Monthly data for 1998-2006 accumulated to quarterly level, deflated by CPI, seasonally adjusted with Tramo Seats and in logs.
CEIC
Inflation Quarterly changes in seasonally CPI constructed by the author from month-on-month and 12-month inflation rates.
CEIC
A Asset prices i) Shanghai A-Share Stock Index, end of period, deflated by CPI and in logs. ii) Residential price index constructed by the author from year-on-year changes, seasonally adjusted with Tramo Seats, deflated by CPI and in logs.
CEIC
MP Monetary policy indicator
M2 deflated by CPI, seasonally adjusted with Tramo Seats and in logs.
CEIC
21ECB
Working Paper Series No 1240September 2010
Table A2. Augmented Dickey-Fuller unit root test for 1998-2008 Series Det. term Lags Test stat. C c, t 12 (AIC) -1.25 C c, t 4 (HQ) -1.05 C c, t 1 (SC) -1.37 dC c 11 (AIC) -1.55 dC c 0 (HQ, SC) -6.94*** Y c, t 0 (AIC, HQ, SC) -2.59 dY c 0 (AIC, HQ, SC) -8.20*** M2 c, t 0 (AIC, HQ, SC) -1.82 dM2 c 0 (AIC, HQ, SC) -6.04*** π c, t 12 (AIC) -3.01 π c, t 10 (HQ) -3.34* π c, t 3 (SC) -4.34*** π c 11 (AIC) -0.62 π c 3 (HQ, SC) -3.29** dπ c 10 (AIC, HQ) -3.87*** dπ c 3 (SC) -2.77* Shanghai c, t 3 (AIC, HQ, SC) -3.48** Shanghai c 3 (AIC, HQ, SC) -3.62*** dShanghai c 0 (AIC, HQ, SC) -4.64*** res1mid c, t 12 (AIC, HQ, SC) -2.29 dres1mid c 11 (AIC, HQ, SC) -3.47** * indicates significance at 10% level, ** at 5% level and *** at 1% level. c indicates a constant and t a trend. Maximum number of lags 12. In parentheses, the specification criteria: AIC = Akaike, HQ=Hannan-Quinn, SC=Schwarz criteria.
Table A3. Phillips-Perron unit root test for 1998-2008 Series Det. term Bandwith Test stat. C c, t 4 -1.79 dC c 4 -7.30*** Y c, t 0 -2.60 dY c 11 -9.53*** M2 c, t 3 -1.61 dM2 c 3 -6.66*** π c, t 2 -3.11 π c 3 -2.80* dπ c 2 -8.21*** Shanghai c, t 4 -2.17 Shanghai c 4 -2.19 dShanghai c 3 -4.75*** res1mid c, t 4 -1.71 dres1mid c 4 -4.20*** * indicates significance at 10% level, ** at 5% level and *** at 1% level. c indicates a constant and t a trend. The estimation method is Bartlett Kernel, bandwith selected by Newey-West method.
22ECBWorking Paper Series No 1240September 2010
Table A4. Saikkonen-Lütkepohl Cointegration Test Series Det. term Lags Cointegration
rankTeststatistic
Y, c, M2, , Shanghai
c, t 6 (AIC, HQ) 0 1 2 3 4
75.19*** 44.11* 18.45 4.77 0.67
Y, c, M2, , real estate
c, t 6 (AIC, HQ, SC)
0 1 2 3 4
82.99*** 48.77** 23.96 12.40 2.61
* indicates significance at 10% level, ** at 5% level and *** at 1% level. c indicates a constant and t a trend. Maximum number of lags 6. In parentheses, the specification criteria: AIC = Akaike, HQ=Hannan-Quinn, SC=Schwarz criteria.
Table A5. Johansen Cointegration Test
Series Det. term Lags Cointegration rank
Teststatistic
Y, c, M2, , Shanghai
c, t 6 (AIC, HQ) 0 1 2 3 4
298.78*** 141.19*** 82.01*** 31.51*** 9.76
Y, c, M2, , real estate
c, t 6 (AIC, HQ, SC)
0 1 2 3 4
375.79*** 235.19*** 97.55*** 42.45*** 5.62
* indicates significance at 10% level, ** at 5% level and *** at 1% level. c indicates a constant and t a trend. Maximum number of lags 6. In parentheses, the specification criteria: AIC = Akaike, HQ=Hannan-Quinn, SC=Schwarz criteria.

23ECB
Working Paper Series No 1240September 2010
Table A6. Misspecification tests on baseline model with Shanghai A-Index. Test Test
statisticsp-value
Portmanteau test for autocorrelation, 16 lags 388.21 .08* LMF test for autocorrelation 4 lags 1 lags
1.51 1.30
.10 .19
Jarque-Bera test for nonnormality for five system equations
4.00 0.73 2.47 1.75 4.78
.13
.69
.29
.42
.09* ARCH LM test for autoregressive conditional heteroskedasticity, 16 lags, for five system equations
17.46 18.10 17.74 14.22 7.42
.36
.32
.34
.58
.96 1 Adjusted test statistic 2 LMF Statistic * indicates significance at 10% level, ** at 5% level and *** at 1% level.
Table A7. Misspecification tests on baseline model with residential prices. Test Test
statisticsp-value
Portmanteau test for autocorrelation, 16 lags 371.39 .21 LMF test for autocorrelation 4 lags 1 lags
1.29 0.98
.22 .50
Jarque-Bera test for nonnormality for five system equations
13.87 0.36 3.92 0.56 0.22
.00***
.83
.14
.75
.90 ARCH LM test for autoregressive conditional heteroskedasticity, 16 lags, for five system equations
12.71 14.22 14.29 17.52 8.86
.69
.58
.58
.35
.92 1 Adjusted test statistic 2 LMF Statistic * indicates significance at 10% level, ** at 5% level and *** at 1% level. Figure A1. Urban household income by category in China, RMB.
0
3,000
6,000
9,000
12,000
15,000
18,000
2000 2001 2002 2003 2004 2005 2006 2007 2008
Property Transfer Household BusinessWage
Source: CEIC
24ECBWorking Paper Series No 1240September 2010
Figure A2. The time series used in VAR estimation. Household income Household consumption
6.8
7
7.2
7.4
7.6
7.8
8
8.2
8.4
8.6
1998Q1 2000Q1 2002Q1 2004Q1 2006Q1 2008Q1 6.8
7
7.2
7.4
7.6
7.8
8
8.2
1998Q1 2000Q1 2002Q1 2004Q1 2006Q1 2008Q1 Inflation M2
-1
-0.5
0
0.5
1
1.5
2
2.5
3
1998Q1 2000Q1 2002Q1 2004Q1 2006Q1 2008Q18
8.5
9
9.5
10
10.5
11
1994Q1 1997Q1 2000Q1 2003Q1 2006Q1 2009Q1
Shanghai A-Index Residential prices
6
6.5
7
7.5
8
8.5
9
1998Q1 2000Q1 2002Q1 2004Q1 2006Q1 2008Q14.4
4.5
4.6
4.7
4.8
4.9
5
1998Q1 2000Q1 2002Q1 2004Q1 2006Q1 2008Q1

25ECB
Working Paper Series No 1240September 2010
Figure A3. Impulse response analysis with Shanghai A-Index.
Income -> Income Cons. -> Income Inflation -> Income M2 -> Income Shanghai-> Income
Income -> Cons. Cons. -> Cons. Inflation -> Cons. M2 -> Cons. Shanghai-> Cons.
Income -> Inflation Cons. -> Inflation Inflation -> Inflation M2 -> Inflation Shanghai-> Inflation
Income -> M2 Cons. -> M2 Inflation -> M2 M2 -> M2 Shanghai-> M2
Income-> Shanghai Cons. -> Shanghai Inflation -> Shanghai M2 -> Shanghai Shanghai->Shanghai
26ECBWorking Paper Series No 1240September 2010
Figure A4. Impulse response analysis with residential prices.
Income-> Income Cons. -> Income Inflation-> Income M2 -> Income Res. prices –> Income
Income-> Cons. Cons. -> Cons. Inflation-> Cons. M2 -> Cons. Res. prices–> Cons.
Income-> Inflation Cons. -> Inflation Inflation-> Inflation M2 -> Inflation Res. prices –> Inflation
Income-> M2 Cons. -> M2 Inflation-> M2 M2 -> M2 Res. prices –> M2
Income-> Res. prices Cons. -> Res. prices Inflation-> Res. prices M2 -> Res. prices Res. prices –> Res. prices

Work ing PaPer Ser i e Sno 1118 / november 2009
DiScretionary FiScal PolicieS over the cycle
neW eviDence baSeD on the eScb DiSaggregateD aPProach
by Luca Agnello and Jacopo Cimadomo