monet at the savoy hotel and the london fogs 1899 …etheses.bham.ac.uk/1555/1/khan_11_phd.pdf ·...
TRANSCRIPT
1
Monet at the Savoy Hotel and the
London fogs 1899-1901
by
Soraya Farah Khan
A thesis submitted to the
University of Birmingham
for the degree of
DOCTOR OF PHILOSOPHY
School of Geography, Earth and Environmental Sciences
University of Birmingham
January 2011

University of Birmingham Research Archive
e-theses repository This unpublished thesis/dissertation is copyright of the author and/or third parties. The intellectual property rights of the author or third parties in respect of this work are as defined by The Copyright Designs and Patents Act 1988 or as modified by any successor legislation. Any use made of information contained in this thesis/dissertation must be in accordance with that legislation and must be properly acknowledged. Further distribution or reproduction in any format is prohibited without the permission of the copyright holder.

2
SYNOPSIS:
Monet painted his „London Series‟ of 95 images between 1899 and 1902 and this study
examines in detail the geometry, meteorology and the content of eight paintings of
Waterloo Bridge and one painting of Charing Cross Bridge. A method based on solar
geometry is used to estimate the exact date of these nine paintings. All nine paintings
either contain a clear representation of the sun within the scene, or the position of the sun
can be clearly inferred. This study shows that although Monet reworked the content of
these images on subsequent days when the sun was in a similar position, he did not
change the position of the sun. Monet resided at the Savoy Hotel during his stays in 1900
and 1901, painting his scenes from a suite located on the fifth floor - which this study
identifies for the first time. Letters to Monet's wife and contemporary weather data are
used to verify the probable dates. This analysis confirms that Monet painted what he saw
and that his London Series can be utilised as a pictorial 'weather diary' of typical
Victorian London fogs.
3
CONTENTS:
Synopsis p2
Table of Contents p3
List of Figures p8
List of Tables p12
Acknowledgements p16
Chapter 1
Introduction
1.1. Abstract p17
1.2. Brief introduction of the research area p17
1.3. General research outline p23
1.4. Outline of thesis p24
Chapter 2
Theoretical framework
2.1. Introduction p26
2.2. Geographical context p26
2.3. The perception of art p27
2.4. The evolution of skies in art p32
2.5. The deconstruction of Monet‟s London Series p34
2.6. Scientific context – Introduction to the London fogs p37
2.7. Meteorological optics p47

4
2.8. The colour of the fog p52
2.9. Visual Culture p55
2.10. Visual Studies p56
Chapter 3
Context of Monet and his work
3.1. The founding of Impressionism p59
3.2. Photographs of London c. 1900 p60
3.3. Paintings of London c. 1900 p64
3.4. Monet‟s life p73
3.5. Monet‟s series paintings p77
Chapter 4
Methods
4.1. Introduction p87
4.2. Research design p87
4.3. Quantitative approaches – solar geometry p89
4.4. Limitations of research p94
4.5. Summary and final comments p95
Chapter 5
The Savoy Hotel
5.1. Monet‟s residence at the Savoy Hotel p97

5
5.2. Quantitative approaches p101
5.3. Waterloo Bridge p107
5.4. Charing Cross Bridge and Westminster Bridge p110
5.5. Solar geometry analysis p116
5.6. Geometrical analysis of Waterloo Bridge paintings sun visible p117
5.7. Geometrical analysis of Waterloo Bridge paintings sun position p126
inferred
5.8. Geometrical analysis of Charing Cross Bridge paintings sun visible p135
5.9. Geometrical analysis of Charing Cross Bridge paintings p140
sun position inferred
Chapter 6
London’s climate 1899-1901
6.1. Introduction p151
6.2. Introduction to London‟s changing climate p151
6.3. Observed weather data for the periods Monet was in London p161
1899-1901
6.4. A comparison of the observed weather data and the calculated p163
dates of Monet‟t paintings
6.5. Weather data from Monet‟s letters p181
6.6. A comparison of Monet‟s letters, the observed weather data and p186
the calculated dates of Monet‟s paintings
6.7. Discussion p188
6
Chapter 7
Conclusions
7.1. Introduction p195
7.2. Key findings p197
7.3. Future work p203
7.4. Final words p203
References p205
Bibliography p219
Appendix
1 Board of Trade plan of Charing Cross Bridge for 1884 p222
2 Geometrical analysis of the Waterloo Bridge paintings p223
3 Royal Horticultural Society‟s weather diaries and weather reports p226
for Westminster, Brixton and Kew
4 Climate of London for 1971-2000 p288
5 Fog observations from Brixton weather station, Kew weather station p289
and The Times newspaper
6 Relative humidity calculations p291
7 Analysis of Monet‟s paintings with respect to the Royal Horticultural p303
Society‟s weather diaries and weather reports for Westminster, Brixton
and Kew
7
8 Monet‟s letters p323
9 Diary of fog/mist/haze events in London from sources used in this p327
thesis
10 Comparative analysis of Monet‟s paintings p336
11 Dates for Waterloo Bridge and Charing Cross Bridge paintings p338
12 Monet at the Savoy p340

8
LIST OF FIGURES:
1.1 „London, Houses of Parliament, Effects of Sun in the Fog‟ Claude Monet p20
2.1 „Girls on the Pier‟ Edvard Munch p36
2.2 Built-up area of London in 1880 and 1914 p38
2.3 Monthly smoke concentrations for London in 1863 p50
3.1 „Westminster Abbey‟ Alvin Langdon Coburn p61
3.2 „Waterloo Bridge‟ Alvin Langdon Coburn p62
3.3 „From Westminster Bridge‟ Alvin Langdon Coburn p63
3.4 „On the Embankment‟ Alvin Langdon Coburn p63
3.5 „Houses of Parliament‟ Alvin Langdon Coburn p64
3.6 „London‟ (1809) Joseph Mallord William Turner p66
3.7 „The Burning of the Houses of Lords and Commons‟ (1834) Joseph p66
Mallord William Turner
3.8 „The Fighting Temeraire tugged to her last Berth to be broken up‟ p67
(1838) Joseph Mallord William Turner
3.9 „Nocturne in Blue and Silver; Chelsea‟ (1871) James Abbott McNeill p68
Whistler
3.10 „Symphony in Gray: Early Morning Thames‟ (c. 1871) James Abbott p69
McNeill Whistler
3.11 „Nocturne: Grey and Gold – Westminster Bridge‟ (1871-74) James p70
Abbott McNeill Whistler
3.12 „Nocturne: Blue and Silver – Cremorne Lights‟ (1872) James Abbott p70
McNeill Whistler

9
3.13 „Nocturne in Blue and Gold – Old Battersea Bridge‟ (1872-75) p71
James Abbott McNeill Whistler
3.14 „London Bridge‟ (1885) James Abbott McNeill Whistler p72
3.15 „Grain Stacks, End of Summer, Morning Effect‟ (1891) Claude Monet p78
3.16 „Grain Stacks, Snow‟ (1891) Claude Monet p79
3.17 „Rouen Cathedral, the West Portal, Dull Weather‟ (dated 1894, p81
painted (1892)) Claude Monet
3.18 „Rouen Cathedral, Full Sunlight‟ (1894) Claude Monet p81
5.1 „Savoy Pigeons‟ (1896) James Abbott McNeill Whistler p98
5.2 „Evening, Little Waterloo Bridge‟ (1896) James Abbott Mc Neill Whistler p99
5.3 1897 map of London p102
5.4 The Savoy Hotel and rooms occupied by Monet in 1899 (6th
floor) and p104
in 1900 and 1901 (5th
floor)
5.5 Azimuthal angles of landmarks in Westminster p105
5.6 Angle of elevation and viewing distance from Waterloo Bridge to Monet p110
on the fifth floor of the Savoy Hotel
5.7 Angles of elevation and viewing distances from Charing Cross Bridge and p112
Westminster Bridge to Monet on the fifth floor of the Savoy Hotel
5.8 Distance between Charing Cross Bridge and Westminster Bridge as viewed p113
by Monet on the fifth floor of the Savoy Hotel
5.9 Angles of elevation and viewing distances from Charing Cross Bridge and p114
Westminster Bridge to Monet on the sixth floor of the Savoy Hotel
10
5.10 Distance between Charing Cross Bridge and Westminster Bridge as viewed p115
by Monet on the sixth floor of the Savoy Hotel
5.11 „Waterloo Bridge, le soleil dans le brouillard‟ (dated 1904) Claude Monet p117
5.12 Landmarks on the South Bank visible in the Waterloo Bridge paintings p118/
p127
5.13 Azimuthal and elevation angles of landmarks on the South Bank visible p118/
in the Waterloo Bridge paintings p128
5.14 „Waterloo Bridge, soleil dans le brouillard‟ (dated 1903) Claude Monet p121
5.15 „Waterloo Bridge‟ (undated) Claude Monet p123
5.16 „Waterloo Bridge, brouillard‟ (undated) Claude Monet p125
5.17 „Londres, Waterloo Bridge‟ (dated 1900) Claude Monet p127
5.18 „Waterloo Bridge, temps couvert‟ (dated 1904) Claude Monet p131
5.19 „Waterloo Bridge, effet de soleil‟ (dated 1903) Claude Monet p132
5.20 „Waterloo Bridge, effet de soleil‟ (dated 1903) Claude Monet p134
5.21 „Charing Cross Bridge, brouillard sur la Tamise‟ (dated 1903) Claude p136
Monet
5.22 Landmarks on the South Bank visible in the Charing Cross Bridge p137
paintings
5.23 Azimuthal and elevation angles of landmarks on the South Bank visible p137
in the Charing Cross Bridge paintings
5.24 „Charing Cross Bridge, reflets sur la Tamise‟ (undated) Claude Monet p140
5.25 Elevation of the sun p141
5.26 Revised elevation of the sun p142
11
5.27 „Charing Cross Bridge, la Tamise‟ (dated 1903) Claude Monet p144
5.28 Elevation of the sun p145
5.29 Revised elevation of the sun p146
5.30 „Charing Cross Bridge, la Tamise‟ (dated 1903) Claude Monet p147
6.1 Köppen-Geiger Climate classification p152
6.2 Air pollurion in London, 1700-1950 p154
6.3 Daily means of PM10 particulate s (µg/m3) at Westminster (Marylebone p155
Road), January 1st 2009- January 1
st 2010
6.4 Locations of Westminster, Brixton, Chiswick, Kew and Greenwich with p157
respect to the Savoy Hotel
6.5 Location of Chiswick with respect to the Savoy Hotel p164
6.6 Locations of Westminster, Brixton and Chiswick with respect to the Savoy p165
Hotel
6.7 Locations of Westminster, Brixton, Chiswick and Kew with respect to the p168
Savoy Hotel
6.8 Locations of Chiswick, Westminster and Brixton with respect to the p181
Savoy Hotel
6.9 Days fog was observed at Brixton and West Norwood, 1878-1903 p192

12
LIST OF TABLES:
2.1 Number of days experiencing fog in London 1871-1890 p41
2.2 Number of days experiencing fog and dense fog 1811-1890 p42
2.3 London‟s coal supply for 1830-1889 p43
3.1 Monet‟s series paintings p77
5.1 Ratios of the depths of the River Thames to the heights of Waterloo Bridge p100
5.2 Fifth floor elevation and viewing distance for Waterloo Bridge p110
5.3 Fifth floor elevations and viewing distances for Charing Cross Bridge and p112
Westminster Bridge
5.4 Fifth floor viewing distance between Charing Cross Bridge and p113
Westminster Bridge
5.5 Sixth floor elevations and viewing distances for Charing Cross Bridge and p114
Westminster Bridge
5.6 Sixth floor viewing distance between Charing Cross Bridge and p115
Westminster Bridge
5.7 Degree to millimetre ratios for the landmarks of the South Bank visible in p119
the Waterloo Bridge paintings
5.8 Distances and angles to the sun p119
5.9 Altitude and azimuth for February 16th
1901 p120
5.10 Altitude and azimuth for February 15th
1900 p122
5.11 Altitude and azimuth for February 21st 1901 p124
5.12 Altitude and azimuth for February 27th
1900 p126
5.13 Altitude and azimuth for February 27th
1901 p126

13
5.14 Degree to millimetre ratios for the landmarks of the South Bank visible in p129
the Waterloo Bridge paintings
5.15 Distances and angles to the sun p129
5.16 Altitude and azimuth for February 1st 1901 p130
5.17 Altitude and azimuth for March 6th
1901 p131
5.18 Altitude and azimuth for February 2nd
1901 p133
5.19 Altitude and azimuth for January 27th
1901 p135
5.20 Degree to millimetre ratios for the landmarks of the South Bank visible in p138
the Charing Cross Bridge paintings
5.21 Distances and angles to the sun p138
5.22 Altitude and azimuth for February 3rd
1901 p139
5.23 Altitude and azimuth for January 25th
1900 p141
5.24 Altitude and azimuth for January 25th
1900 p144
5.25 Strengths and weaknesses of the solar geometry method p150
6.1 Average smoke concentrations in Kew 1932-52 p153
6.2 Average smoke concentrations in Kew 1957-62 p153
6.3 Dates of fog occurrences in 1900 p163
6.4 Dates of fog occurrences in 1901 p163
6.5 Dates in September 1899 when mist, fog or a RH ≥ 90% were reported p169
at Chiswick, Westminster, Brixton or Kew
6.6 Dates in October 1899 when mist, fog or a RH ≥ 90% were reported p170/
at Chiswick, Westminster, Brixton or Kew p171

14
6.7 Dates in November 1899 when mist, fog or a RH ≥ 90% were reported p171
at Chiswick, Westminster, Brixton or Kew
6.8 Dates in February 1900 when mist, fog or a RH ≥ 90% were reported p172
at Chiswick, Westminster, Brixton or Kew
6.9 Dates in March 1900 when mist, fog or a RH ≥ 90% were reported p173
at Chiswick, Westminster, Brixton or Kew
6.10 Dates in April 1900 when mist, fog or a RH ≥ 90% were reported p173
at Chiswick, Westminster, Brixton or Kew
6.11 Dates in January 1901 when mist, fog or a RH ≥ 90% were reported p174
at Chiswick, Westminster, Brixton or Kew
6.12 Dates in February 1901 when mist, fog or a RH ≥ 90% were reported p174/
at Chiswick, Westminster, Brixton or Kew p175
6.13 Dates in March 1901 when mist, fog or a RH ≥ 90% were reported p176
at Chiswick, Westminster, Brixton or Kew
6.14 Dates in April 1901 when mist, fog or a RH ≥ 90% were reported p176
at Chiswick, Westminster, Brixton or Kew
6.15 Dates when mist/fog/haze was recorded by Chiswick and Westminster in p177
1899-1901
6.16 Dates when mist/fog/haze was recorded by Chiswick and Brixton in p178
1899-1901
6.17 Dates when mist/fog/haze was recorded by Kew and Westminster in p178
1899-1901

15
6.18 Dates when mist/fog/haze was recorded by Kew and Brixton in p179
1899-1901
6.19 Dates of fog occurrences recorded by Monet and a weather station in 1900 p186
6.20 Dates of fog occurrences recorded by Monet, RHS and a weather station p187
in 1900
6.21 Dates of fog occurrences recorded by Monet and a weather station in 1900 p187
6.22 Dates of fog occurrences recorded by Monet, RHS and a weather station p187
in 1901
6.23 Strengths and weaknesses of the Royal Horticultural Society‟s weather p187
diaries
6.24 Strengths and weaknesses of the weather reports for Westminster p188
6.25 Strengths and weaknesses of the weather reports for Brixton p188
6.26 Strengths and weaknesses of the weather reports for Kew p188
6.27 Strengths and weaknesses of the meteorological data p194
7.1 Fog/Mist/Haze events in London from sources used in this thesis for p199/
February 1900 p200
7.2 Fog/Mist/Haze events in London from sources used in this thesis for p200
March 1900
7.3 Fog/Mist/Haze events in London from sources used in this thesis for p200/
February 1901 p201/
p202

16
ACKNOWLEDGEMENTS:
I would like to take this opportunity to thank my family and friends for all of the support
they have given me over the last three years. Their help and understanding has got me to
where I am today.
I would like to extend my gratitude to my supervisors, Professor John Thornes and Dr
Jacob Baker, who have helped and encouraged me throughout my PhD. And I would also
like to thank Professor Andy Baker and Dr Lloyd Jenkins, who always managed to make
the undergraduate Geography fieldtrips fun and very memorable, and have always been
there whenever I needed their advice.
17
CHAPTER 1: Introduction
1.1. Abstract
Over the past decade, there has been an ever increasing interest in the relationship
between weather and climate and how they are portrayed artistically. The representations
of skies, atmosphere, weather, climate and climate change through a variety of artistic
media have been considered thus far (Eliasson 2003; Olson et al 2004; Thornes 1999,
2008, Khan et al 2009). Furthermore, there have been a number of studies that have
contemplated the use of environmental art as a form of proxy data for past weather, air
pollution and climate change (Lamb 1967; Neuberger 1970; Brimblecombe and Ogden
1977, Baker and Thornes 2006 and Zerefos et al 2007). Monet‟s series paintings can be
considered as another example of art representing aspects of the weather, for example,
when Monet painted his scenes of London, he would include the sun when it was visible
or a representation of the sun when it was obscured, trying to illustrate the atmosphere,
and thus the weather, in his paintings. Monet was also known to rework many of his
canvases with the intention of reflecting how the atmosphere appeared on specific days
from year to year.
For this reason, the opportunity to deconstruct Monet‟s representations of the skies in his
London Series (1899-1901) could not have come at a better time.
1.2. Brief introduction of the research area
Claude Monet, was one of the most prominent Impressionist painters of the nineteenth
century, painting numerous scenes of London at the turn of the twentieth century, his
18
main motifs were the Houses of Parliament, Waterloo Bridge and Charing Cross Bridge.
Monet wanted to capture the atmosphere, which he fondly referred to as „l‟enveloppe‟ in
all of his paintings. This is what made Monet‟s paintings an ideal series to analyse with
respect to his representations of the London fogs.
Between the years 1899 and 1901 Monet resided at the Savoy Hotel in London for
approximately six months in total. During his stays in 1900 and 1901, Monet wrote many
letters to his wife, Alice, who remained at the family home in Giverny, France, and also
to some of his other acquaintances. Within these letters, Monet included detailed
accounts of the weather, particularly observations of the fog. A source of information,
that will enable the analysis of Monet‟s paintings are the weather observations recorded
at Chiswick, in West London, and collated by the Royal Horticultural Society in the form
of weather diaries. Another source of data has been retrieved from the Meteorological
Office Archives in Exeter and consists of reports for weather stations at Westminster,
Brixton and Kew.
The contents of Monet‟s letters can be used in conjunction with the observations logged
in the Royal Horticultural Society‟s weather diaries as well as the weather reports for
Westminster, Brixton and Kew, to help determine the accuracy of Monet‟s portrayal of
the London fogs at the turn of the twentieth century.
According to convention the main user group that would study nineteenth century
paintings, such as Monet‟s London Series, would be art historians. Therefore, as this
study is being conducted from an environmental scientist‟s point of view, it will

19
hopefully broaden the existing knowledge base that is available with respect to the artistic
representations of skies.
If this study proves that Monet‟s London Series is an accurate representation of the
London skies for 1899-1901, then it could be suggested that there is a ready made
pictorial as well as numerical representation of the „London fogs‟ in the form of a
weather diary. The construction of which is one on the main objectives of this study.
The advent of the Industrial Revolution brought about a definite shift in the motifs being
studied by nineteenth century artists. Claude Monet, as a forerunner of the French
Impressionist movement, saw a variety of changes during the nineteenth century. Initially
he would paint in areas where he was living at that particular point in his life, yet during
the 1880s Monet chose to travel in an attempt to grasp foreign scenes of nature and their
consequential effects (House, 1986). Monet had always been entranced by the
atmosphere and the various effects of light, yet it was not until 1890 that this area of
interest came to the forefront and the physical objects became subordinate (House, 1986).
This change saw Monet become more captivated by the overall effect of a scene, with the
possibility of painting nature at its purest, as opposed to the individual aspects within the
scene.
Monet was not the only artist that tried to accurately depict the atmosphere in his
paintings. In 1967, Professor Hans Neuberger examined a total of 12,000 paintings each
portraying a representation of the climate from 1400 through to 1967. Just as Neuberger‟s

20
study attempted to prove that the various paintings were a record of the changing climate
of Europe, this study aims to prove that Monet‟s London Series will provide an accurate
depiction of London‟s weather at the turn of the twentieth century.
Prior to this study, the content of Monet‟s paintings of the Houses of Parliament were
analysed by Baker and Thornes (2006), where a selection of the paintings were dated
according to the position of the sun in each painting. Figure 1.1 shows an example of a
painting of the Houses of Parliament that Baker and Thornes superimposed solar tracks
over in order to determine a range of possible dates for the production of the painting.
Figure 1.1 London, Houses of Parliament, Effects
of Sun in the Fog
However, the solar positions for the remaining paintings in the London Series, those of
Waterloo Bridge and Charing Cross Bridge, still need to be derived, which is the main
drive for this particular study.
The previous work carried out by Baker and Thornes has been an inspirational factor in
the instigation of this report, but many of the paintings of Waterloo Bridge and Charing
Cross Bridge contain only what can be considered as inferred representations of the sun,
21
so the analysis of these paintings has required a slightly different approach to those of the
Houses of Parliament.
The research required for the purpose of this study falls into two very separate categories;
science and art. The scientific side of this study consists of the geometrical analysis of
Monet‟s Waterloo Bridge and Charing Cross Bridge paintings from his London Series;
all with respect to Monet‟s viewing position at the Savoy Hotel. This analysis will aid in
the use of the definitive solar geometry required to approximately date these paintings.
As aforementioned, analysis of synoptic meteorological data and the information
contained in nineteenth century weather diaries will also be considered, in order to draw a
comparison between „real‟ data and Monet‟s own representations. The artistic side of this
study will include understanding the traditional analysis of Monet‟s art and the
contribution of his work to Impressionism and nineteenth century art as a whole. By
developing a comprehensive understanding of nineteenth century art and the impact of
the visual, the relationship between art and science can be explored.
The value of this research can only be hypothesised at this stage. However, if successful
in proving that Monet‟s London Series is an accurate representation of the London fogs,
during 1899-1901, then this study may sit amongst the others previously mentioned that
work to bridge the gap between science and art.
There are many other forms of proxy data that can be retrieved from sources other than
paintings and works of art. Some examples of these data sources are pollen samples, tree
rings, ice cores and ships logs. A brief review of the work conducted using this last

22
example as proxy data will be explored in this section of the report, as originally the
information held in a selection of ships logs were being considered as another data source
for this study. However, after careful deliberation, it was concluded that the distance
between the ship ports and Monet at the Savoy Hotel was too great for any substantial
findings, thus this data set was removed from the final analysis. Nevertheless, this area of
research is vast, with experts within the UK, and internationally, managing to compile
huge amounts of data from the logs of ships sailing during 1750 to 1850 (Universidad
Complutense Madrid [UCM], 2003). The information collated from the logs makes up
the Climatological Database for the World‟s Oceans (CLIWOC). The data collection for
this project came to an end in 2003; yet work has continued to produce a database of
detailed observations for over 250,000 days which is readily available and updated
regularly. CLIWOC was the first attempt made by scientists to explore using logbooks as
a resource to understand the climatic changes over the world‟s oceans during the pre-
instrumental period. The ship‟s logs that were used for analysis were retrieved from the
National Maritime Museum, in London, and archives in the Netherlands, France and
Spain. The logbooks span a one hundred year period, from 1750 to 1850, so they can
provide significant information about the recovery from the Little Ice Age. It also marks
a time when changes in the climate cannot be viewed as a consequence of world-wide
industrialisation and the consequential release of greenhouse gases into the atmosphere
(National Maritime Museum [NMM], 2008).
This brief review of the proxy data that can be retrieved from sources, such as logbooks,
helps to highlight the main advantage and disadvantage of using visual data, such as
paintings. Whilst the entries of the logbooks are very technical and scientific, describing
23
the weather situation experienced at the time of recording, it could be concluded that the
information collated from a painting is only as reliable as the artist painting it. Artistic
license plays an enormous part in the majority of paintings, so using the content of for
example, landscape paintings, may be limited as a consequence of this. On the other hand,
tabulated data may be considered to be quite hard to visualise, especially when faced with
pages and pages of numbers and figures. Considering this form of data emphasises the
advantage of the visual information held within paintings, representing a pictorial history
ready for analysis.
1.3. General research outline
The aim of this study is to determine the accuracy of Monet‟s depiction of the London
fogs, in his London Series (1899-1901), at the turn of the twentieth century.
The program of work that will be undertaken, will take the form of three objectives.
To critically review the evolution of the symbolism of skies in landscape art as
well as the background to London's climate and fogs at the turn of the twentieth
century together with an analytical appraisal of the context of Monet's life and
artistic representations of „l‟enveloppe‟ in his London Series.
Definition of a solar geometry method that will enable the derivation of the dates
and times of production of Monet‟s paintings of Waterloo Bridge and Charing
Cross Bridge.
Investigation of information included in Monet‟s letters of correspondence as well
as data from the Royal Horticultural Society‟s weather diaries and weather reports
24
from three weather stations in London. This should help in the construction of a
weather diary that will describe the „London fogs‟.
1.4. Outline of thesis
The following chapters will endeavour to accurately examine Monet‟s London Series
using geometrical and content analysis of his paintings of Waterloo Bridge and Charing
Cross Bridge.
Chapter 2 will provide the theoretical framework for this thesis by discussing the
development of landscape art, environmental art and the artistic representation of skies
over time. This chapter will also introduce the scientific theory behind the fogs.
Chapter 3 should help to contextualise Monet‟s paintings in the huge array of work that
was produced during the nineteenth century. Therefore this chapter will cover important
developments in Impressionism and other genres of painting, as well as the ever-
increasing popularity of photography that existed at this time. Monet‟s series will also be
put into context with respect to his life, his previous work and his paintings.
The methodology of the thesis will be covered in Chapter 4. This chapter will offer the
quantitative approaches utilised in conducting this study. The geometry, meteorology and
the content of the paintings will be analysed. Another quantitative approach that will be
employed is solar geometry. This method will help in the derivation of approximate dates
and times of production for each painting. Though the work in this area is still very new

25
and highly theoretical, the analytical techniques being used will offer stable ground to
base conclusions on.
Chapter 5 will be dedicated to the analysis of Monet‟s paintings depicted from the Savoy
Hotel. This chapter will also include analyses of the Waterloo Bridge paintings and
Charing Cross Bridge paintings with respect to Monet‟s viewing positions at the Savoy
Hotel.
Chapter 6 will explore the climate of London towards the end of the nineteenth century
and into the beginning of the twentieth century. The records that will be utilised here will
be the Royal Horticultural Society‟s nineteenth century weather diaries, synoptic
meteorological data for several locations in urban London and letters of correspondence
that Monet wrote which include details of fog observations.
A comparison between Monet‟s paintings and the „real‟ data will then be considered. The
aim of this chapter is to develop a better understanding of the weather, particularly the
fogs, experienced in Victorian London.
Finally, Chapter 7 will present the key findings from the thesis as well as empirical and
theoretical evidence that Monet‟s London Series may be confidently used as proxy
meteorological data.
26
CHAPTER 2: Theoretical framework
2.1. Introduction
As discussed earlier, there has been a growing fascination, during recent years, in subject
areas of geography crossing the divide between art and science (Cosgrove and Daniels
1988; Wylie 2007; Thornes 2008). Such an interest has resulted in the development of
various factions associated with landscape and geography, some of which are explored in
this chapter.
The aim of this chapter is to investigate the links between nature and how aspects such as
the sky are represented in art. Since the London fogs are such an integral part to this
study, a brief analysis of the fogs from a scientific point of view will also been conducted
within this chapter.
2.2. Geographical context
Tayler (1964) maintains that the relationship between nature and art can be both
cooperative and antagonistic. Nature can be viewed as a raw wilderness, encompassing
the deformed and uncontrollably prolific face of the fallen world. Alternatively, nature
can also be seen as representing a form of perfection, the ideal order. Consequently,
Renaissance thinkers were steered towards one of two interpretations of the division;
either nature and art as complementary or nature and art as opposed. The notion of nature
incorporating the forces and energy that encourage growth and decay as well as
movement and change, seems to challenge the idea of landscape being a fixed and stable
arrangement of natural forms organised by the artist (Andrews, 1999). Perhaps this

27
concept was influential in Turner‟s method of landscape painting, choosing to experience
nature directly in order to capture his scenes with certain authenticity. Criticised for what
some called „bad painting‟, Turner defended his work by declaring that it was „nature‟
(Andrews, 1999) which evidently changes from day to day.
2.3. The perception of art
The classical way of viewing art, in particular landscape art, is to admire the „scenic
beauty‟ of the image, with an innate appreciation of the aesthetic qualities of the
landscape (Warnock and Brown, 1998). Paintings in the Renaissance period used
landscape merely as a backdrop to the central human or divine focus of the scene. Thus,
the landscape acquires a very low status in the scenic hierarchy dominated by the human
presence (Andrews, 1999).
Clark was of the opinion that until the sixteenth century, artists were primarily interested
in the landscape for its symbolic value; that is, for the picturesque view of nature and its
untouched state (Andrews, 1999). For some artists, landscape was held as a cultural
image, presenting a pictorial way to exhibit, structure and symbolise their surroundings
(Cosgrove and Daniels, 1988).
The subject of nature was to have its greatest vogue during the Romanticism era in the
early nineteenth century, when nature was ultimately viewed as pure, fine, good, and
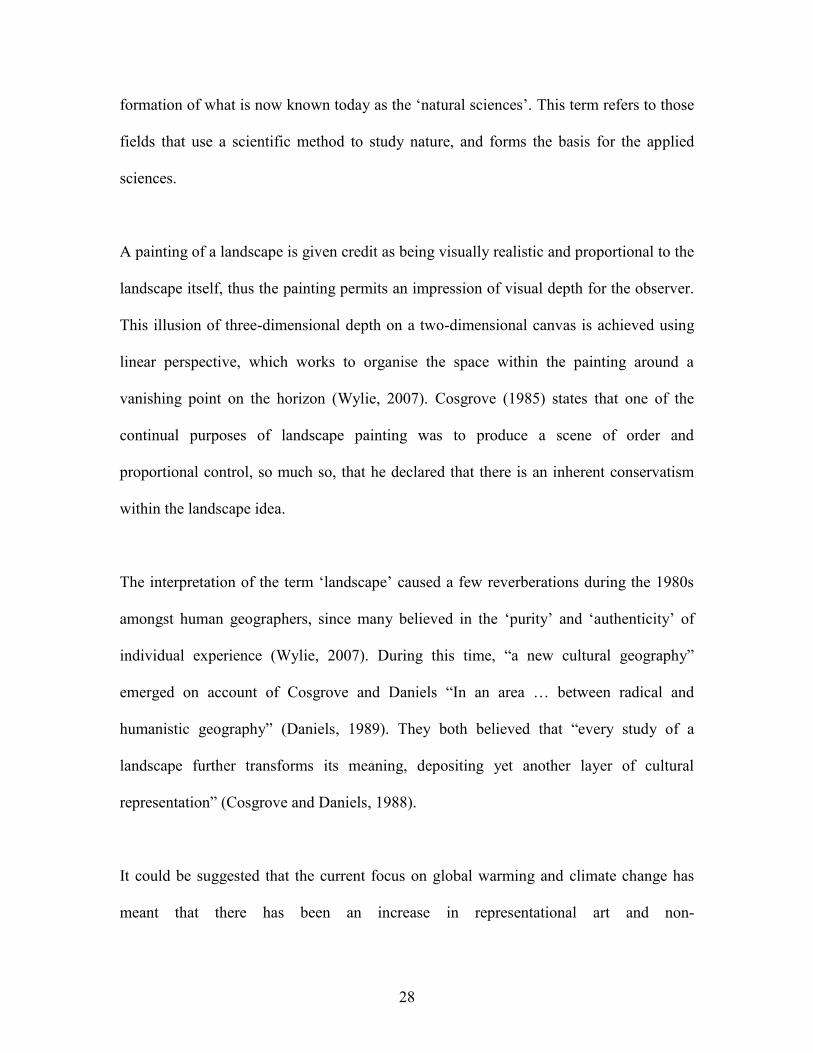
truly beautiful (Meinig, 1979). Conversely, just a century later, during the nineteenth
century, the subject of „nature‟ was to have a major impact on the sciences, leading to the
28
formation of what is now known today as the „natural sciences‟. This term refers to those
fields that use a scientific method to study nature, and forms the basis for the applied
sciences.
A painting of a landscape is given credit as being visually realistic and proportional to the
landscape itself, thus the painting permits an impression of visual depth for the observer.
This illusion of three-dimensional depth on a two-dimensional canvas is achieved using
linear perspective, which works to organise the space within the painting around a
vanishing point on the horizon (Wylie, 2007). Cosgrove (1985) states that one of the
continual purposes of landscape painting was to produce a scene of order and
proportional control, so much so, that he declared that there is an inherent conservatism
within the landscape idea.
The interpretation of the term „landscape‟ caused a few reverberations during the 1980s
amongst human geographers, since many believed in the „purity‟ and „authenticity‟ of
individual experience (Wylie, 2007). During this time, “a new cultural geography”
emerged on account of Cosgrove and Daniels “In an area … between radical and
humanistic geography” (Daniels, 1989). They both believed that “every study of a
landscape further transforms its meaning, depositing yet another layer of cultural
representation” (Cosgrove and Daniels, 1988).
It could be suggested that the current focus on global warming and climate change has
meant that there has been an increase in representational art and non-

29
representational/performative (in terms of audience participation) art encompassing the
sky, atmosphere, weather, climate and climate change (Thornes, 2008). In recent years,
the artist Olafur Eliasson pushed the boundaries with his work addressing the relationship
between society and nature, stating that “The weather is „nature‟ in the city” (Eliasson,
2003). Eliasson is a unique artist that brings modernism into his artistic representation of
the weather. Eliasson appears to be fascinated with the effect of the weather on an
environment and the effect of an environment on the weather; because of the fact that the
weather itself remains an aspect of nature that can be experienced anywhere regardless of
location. The motive behind his work is to encourage the viewer to experience “seeing
yourself sensing”, in order to explore the relationship between the spectator and the
object.
In 2008, Thornes concluded that representative environmental art began as early as the
nineteenth century with artists such as Constable and Turner painting the real
environment as opposed to an imagined landscape. Today, environmental artists seem to
cross the divide between representational and non-representational environmental art. For
this reason, it can be said that environmental artists have a host of differing approaches,
methods and beliefs. These are generally: raising awareness about the fragility of the
environment; using „green‟ methods and natural materials to create their works and
investigating how the environment works (Thornes, 2008).
At one time in the history of the visual arts, disciplines such as meteorology and botany,
to name but a few, were key to the successful creation of the desired aesthetic effects
30
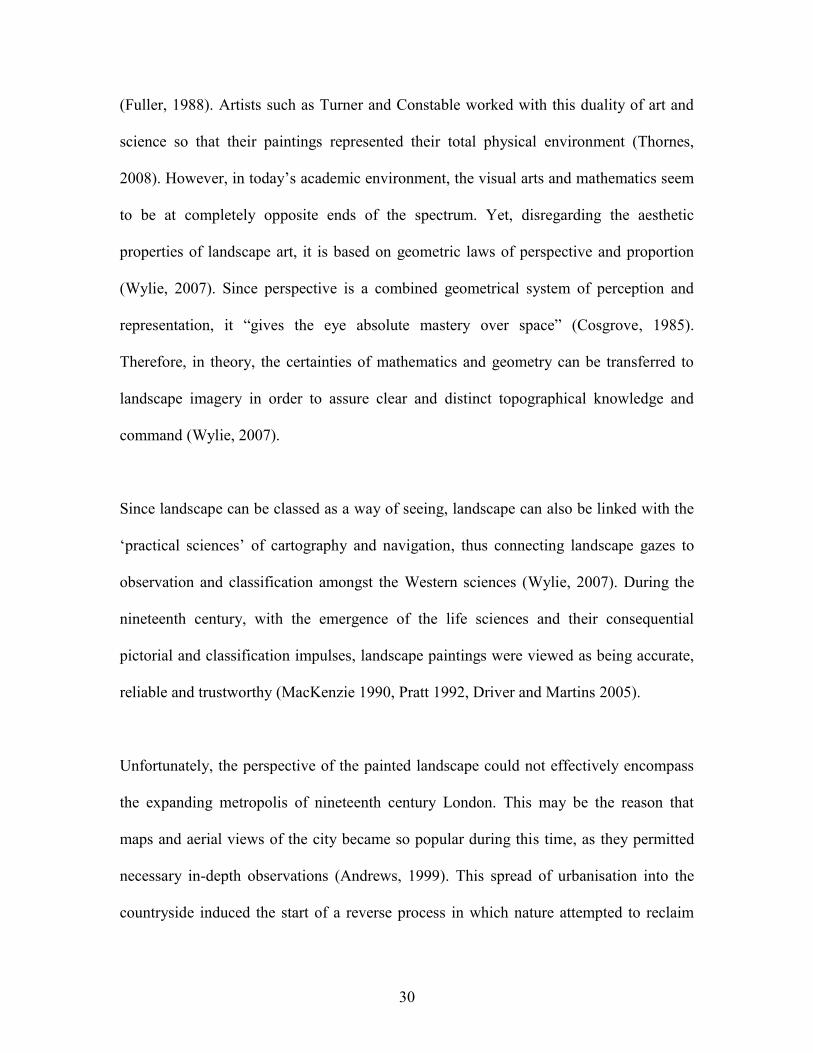
(Fuller, 1988). Artists such as Turner and Constable worked with this duality of art and
science so that their paintings represented their total physical environment (Thornes,
2008). However, in today‟s academic environment, the visual arts and mathematics seem
to be at completely opposite ends of the spectrum. Yet, disregarding the aesthetic
properties of landscape art, it is based on geometric laws of perspective and proportion
(Wylie, 2007). Since perspective is a combined geometrical system of perception and
representation, it “gives the eye absolute mastery over space” (Cosgrove, 1985).
Therefore, in theory, the certainties of mathematics and geometry can be transferred to
landscape imagery in order to assure clear and distinct topographical knowledge and
command (Wylie, 2007).
Since landscape can be classed as a way of seeing, landscape can also be linked with the
„practical sciences‟ of cartography and navigation, thus connecting landscape gazes to
observation and classification amongst the Western sciences (Wylie, 2007). During the
nineteenth century, with the emergence of the life sciences and their consequential
pictorial and classification impulses, landscape paintings were viewed as being accurate,
reliable and trustworthy (MacKenzie 1990, Pratt 1992, Driver and Martins 2005).
Unfortunately, the perspective of the painted landscape could not effectively encompass
the expanding metropolis of nineteenth century London. This may be the reason that
maps and aerial views of the city became so popular during this time, as they permitted
necessary in-depth observations (Andrews, 1999). This spread of urbanisation into the
countryside induced the start of a reverse process in which nature attempted to reclaim
31
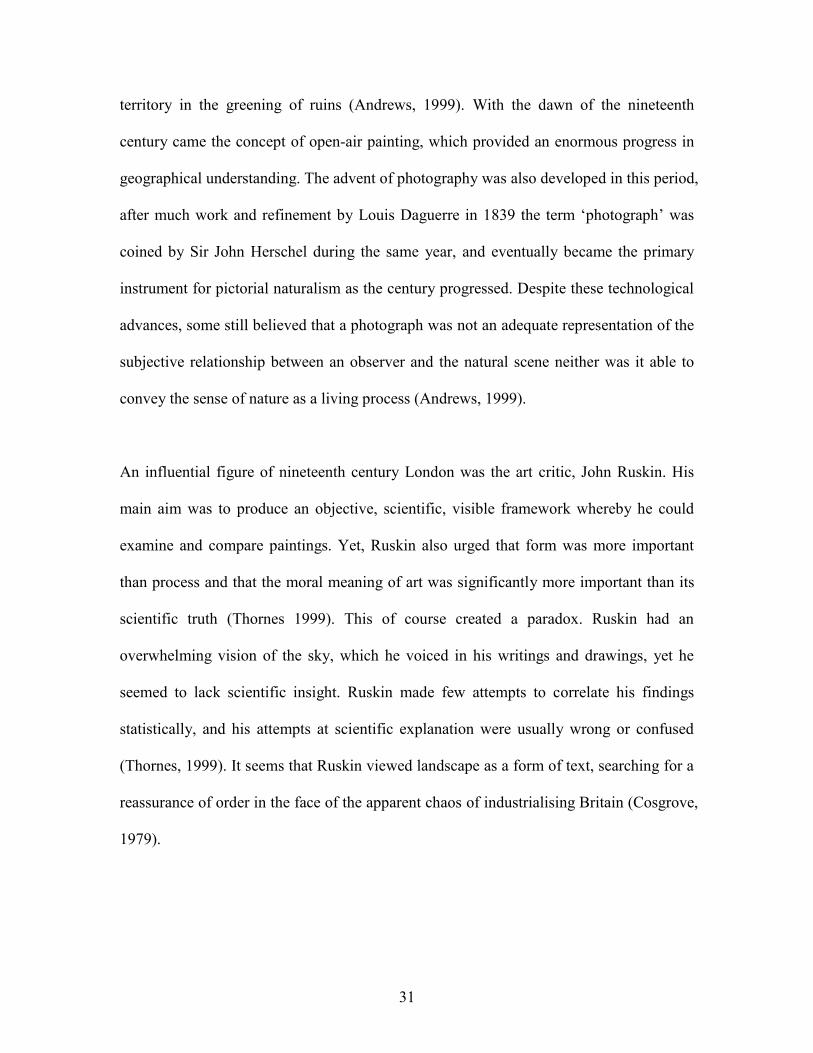
territory in the greening of ruins (Andrews, 1999). With the dawn of the nineteenth
century came the concept of open-air painting, which provided an enormous progress in
geographical understanding. The advent of photography was also developed in this period,
after much work and refinement by Louis Daguerre in 1839 the term „photograph‟ was
coined by Sir John Herschel during the same year, and eventually became the primary
instrument for pictorial naturalism as the century progressed. Despite these technological
advances, some still believed that a photograph was not an adequate representation of the
subjective relationship between an observer and the natural scene neither was it able to
convey the sense of nature as a living process (Andrews, 1999).
An influential figure of nineteenth century London was the art critic, John Ruskin. His
main aim was to produce an objective, scientific, visible framework whereby he could
examine and compare paintings. Yet, Ruskin also urged that form was more important
than process and that the moral meaning of art was significantly more important than its
scientific truth (Thornes 1999). This of course created a paradox. Ruskin had an
overwhelming vision of the sky, which he voiced in his writings and drawings, yet he
seemed to lack scientific insight. Ruskin made few attempts to correlate his findings
statistically, and his attempts at scientific explanation were usually wrong or confused
(Thornes, 1999). It seems that Ruskin viewed landscape as a form of text, searching for a
reassurance of order in the face of the apparent chaos of industrialising Britain (Cosgrove,
1979).

32
2.4. The evolution of skies in art
It is important to state at this point that throughout the many centuries of landscape
painting, replicating the sky directly from nature was often not the aim. Instead, the sky
was used as a backdrop for the subject of the paintings, the landscape. Nevertheless, there
were a handful of artists who were unconventional when they painted elements of the sky.
John Constable discussed what he thought were the earliest representations of skies, in
landscape paintings, during his lecture at Hampstead in June 1833. Constable credits
thirteenth century Italian artists Cenni di Pepo Cimabue and Giotto di Bondone as the
first landscape artists that portrayed changing skies in their scenes (Thornes, 1999).
The American meteorologist, Stanley Gedzelman, recognises that a variety of cloud types
have been used in landscape paintings between 1425 and 1675. Gedzelman identifies
„The Crucifixion‟ by Flemish painter Jan van Eyck that appears to show an accurate
representation of cumulus, altocumulus lenticularis, cirrus uncinus and cirrocumulus
lacunosis clouds (Thornes, 1999). Conversely, Kurt Badt believes that the seventeenth
century Dutch artists Aelbert Cuyp and Jacob van Ruisdael were the first to do this,
claiming that the work of their fifteenth and sixteenth century predecessors (Albrecht
Durer, Leonardo da Vinci and Sir Peter Paul Rubens, to name a few) painted clouds as
isolated formations (Badt, 1950). Cuyp painted many scenes that were dominated by
skies reflecting representations of real weather. Ruisdael would also paint landscapes
dedicated to the sky, atmosphere and diffuse light (Thornes, 1999). Ruisdael was a rarity,
as was Constable, in that the weather could be inferred from his paintings. Nevertheless,
33
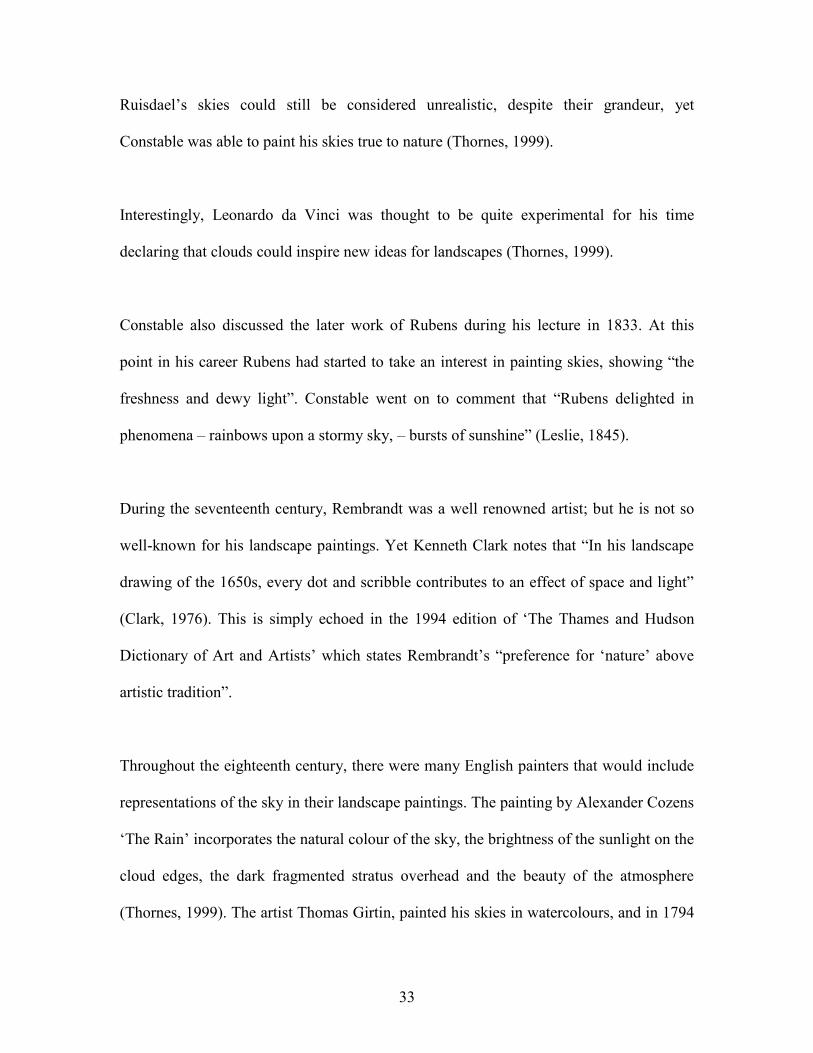
Ruisdael‟s skies could still be considered unrealistic, despite their grandeur, yet
Constable was able to paint his skies true to nature (Thornes, 1999).
Interestingly, Leonardo da Vinci was thought to be quite experimental for his time
declaring that clouds could inspire new ideas for landscapes (Thornes, 1999).
Constable also discussed the later work of Rubens during his lecture in 1833. At this
point in his career Rubens had started to take an interest in painting skies, showing “the
freshness and dewy light”. Constable went on to comment that “Rubens delighted in
phenomena – rainbows upon a stormy sky, – bursts of sunshine” (Leslie, 1845).
During the seventeenth century, Rembrandt was a well renowned artist; but he is not so
well-known for his landscape paintings. Yet Kenneth Clark notes that “In his landscape
drawing of the 1650s, every dot and scribble contributes to an effect of space and light”
(Clark, 1976). This is simply echoed in the 1994 edition of „The Thames and Hudson
Dictionary of Art and Artists‟ which states Rembrandt‟s “preference for „nature‟ above
artistic tradition”.
Throughout the eighteenth century, there were many English painters that would include
representations of the sky in their landscape paintings. The painting by Alexander Cozens
„The Rain‟ incorporates the natural colour of the sky, the brightness of the sunlight on the
cloud edges, the dark fragmented stratus overhead and the beauty of the atmosphere
(Thornes, 1999). The artist Thomas Girtin, painted his skies in watercolours, and in 1794
34
he conducted a study purely based on clouds. Joseph Mallord William Turner produced
many sketches and paintings of nature during his career in the nineteenth century. In fact,
Turner dedicated a sketchbook solely to skies in 1818/19. The skies that Turner would
paint were usually stormy which he seemed to use to reflect the power of nature. Turner
was infatuated with the relationship between the atmosphere and sunlight and how he
could utilise this to enhance the effects of his landscapes and seascapes (Thornes, 1999).
Turner painted his scenes of London during the first half of the nineteenth century, before
the London fogs had started to become progressively worse. However, Monet was
painting in London during 1899-1901, which was actually whilst the fogs were starting to
lessen over the city. Interestingly, Whistler also spent some time in London, between
these two periods, during what is now known to be the peak of the London fogs.
Therefore, for the purpose of this study, scenes of London painted by Turner and
Whistler will be analysed in order to determine the encroachment of the London fogs
during the nineteenth century.
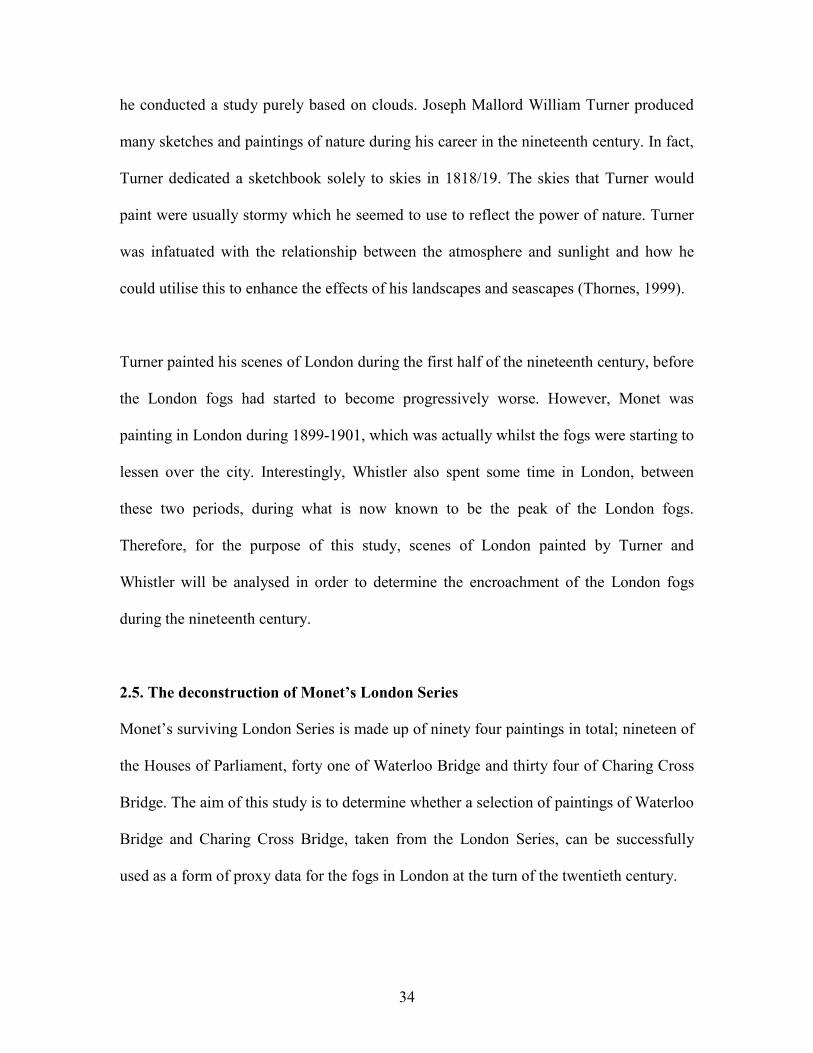
2.5. The deconstruction of Monet’s London Series
Monet‟s surviving London Series is made up of ninety four paintings in total; nineteen of
the Houses of Parliament, forty one of Waterloo Bridge and thirty four of Charing Cross
Bridge. The aim of this study is to determine whether a selection of paintings of Waterloo
Bridge and Charing Cross Bridge, taken from the London Series, can be successfully
used as a form of proxy data for the fogs in London at the turn of the twentieth century.

35
The analysis is comprised of different quantitative approaches, which will be applied to
this selection of paintings from Monet‟s London Series. The geometry, meteorology, and
the content of the paintings will be analysed.
The geometry of the paintings will be assessed with respect to a) the geometry of the
landscape portrayed within each painting; and b) the geometrical positioning of the sun in
each painting. The method utilised for deriving the solar geometry for the Waterloo
Bridge and Charing Cross Bridge paintings is based on the work conducted by Baker and
Thornes in 2006, and has been refined with respect to input and advice from Prof. Donald
W. Olson of Texas State University. This method will produce hypothetical dates and
times for the production of each painting.
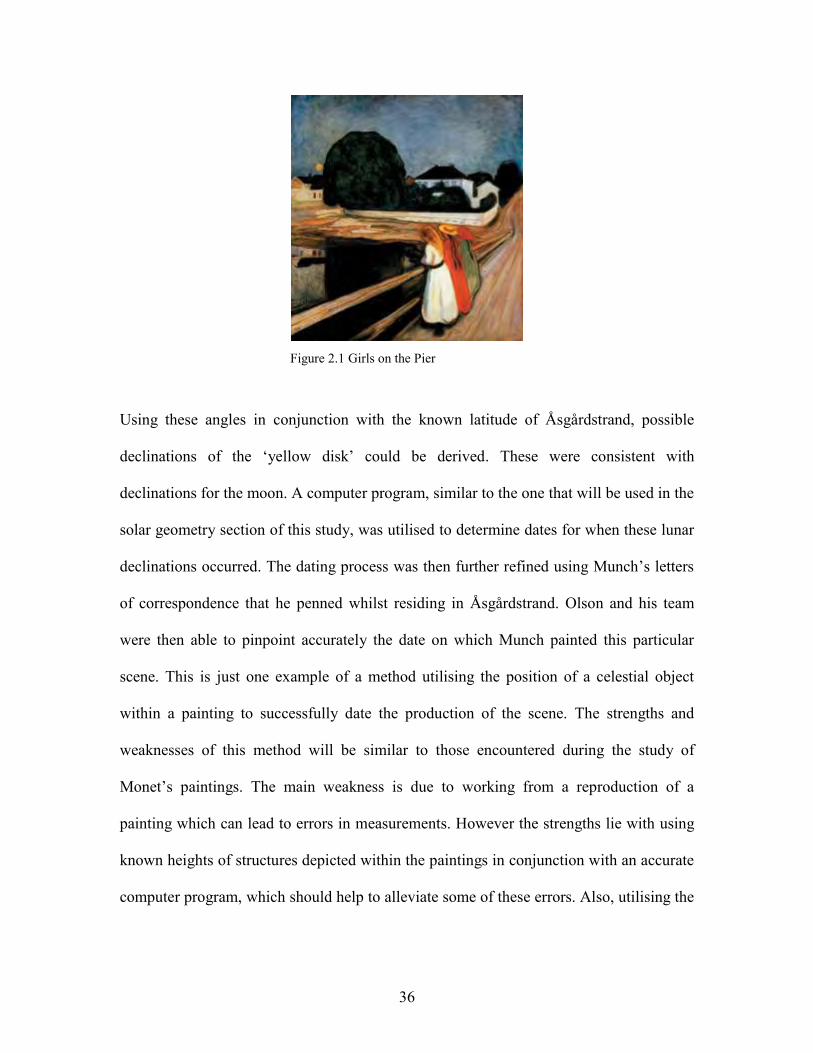
Prof. Donald W. Olson and his team have also worked on paintings by the artists Vincent
van Gogh and Edvard Munch. The first obstacle that they had to overcome was to
decipher whether the celestial object that was to be analysed within each scene was the
sun or the moon. In the papers „Dating van Gogh‟s Moonrise‟ and „Reflections on Edvard
Munch‟s Girls on the Pier‟, Olson et al (2003, 2006) were able to determine that the
celestial object in question was in fact the moon. During the analysis of both paintings,
Olson and his team used the altitude and azimuth of certain aspects within each scene, for
example the altitude and azimuth of the pier in the painting „Girls on the Pier‟ by Munch
was used to determine the altitude and azimuth of the „yellow disk‟ within the scene.
36
Figure 2.1 Girls on the Pier
Using these angles in conjunction with the known latitude of Åsgårdstrand, possible
declinations of the „yellow disk‟ could be derived. These were consistent with
declinations for the moon. A computer program, similar to the one that will be used in the
solar geometry section of this study, was utilised to determine dates for when these lunar
declinations occurred. The dating process was then further refined using Munch‟s letters
of correspondence that he penned whilst residing in Åsgårdstrand. Olson and his team
were then able to pinpoint accurately the date on which Munch painted this particular
scene. This is just one example of a method utilising the position of a celestial object
within a painting to successfully date the production of the scene. The strengths and
weaknesses of this method will be similar to those encountered during the study of
Monet‟s paintings. The main weakness is due to working from a reproduction of a
painting which can lead to errors in measurements. However the strengths lie with using
known heights of structures depicted within the paintings in conjunction with an accurate
computer program, which should help to alleviate some of these errors. Also, utilising the
37
letters of the artist in question, adds another dimension of analysis with respect to the
content of the paintings.
Once the possible dates and times of production for Monet‟s paintings of Waterloo
Bridge and Charing Cross Bridge have been determined, the next stage of the quantitative
approach is the analysis of the meteorology depicted in each painting as well as the
content of the said painting. Weather conditions recorded by various authorities will be
used in conjunction with the meteorological analysis of the paintings in order to refine the
dates and times produced in the solar geometry section of the analysis. Finally, the
content of the paintings will be assessed with respect to Monet‟s letters of
correspondence, in order to determine the accuracy of what Monet was trying to depict.
2.6. Scientific context – Introduction to the London fogs
During the nineteenth century the urbanisation of London began to increase so rapidly
that by the 1840s the population density had reached approximately 50,000 per square
mile (Mosley, 2003). Many authoritative figures spoke out regarding the ever decreasing
space for an ever growing population leading to an increasing threat to the health of the
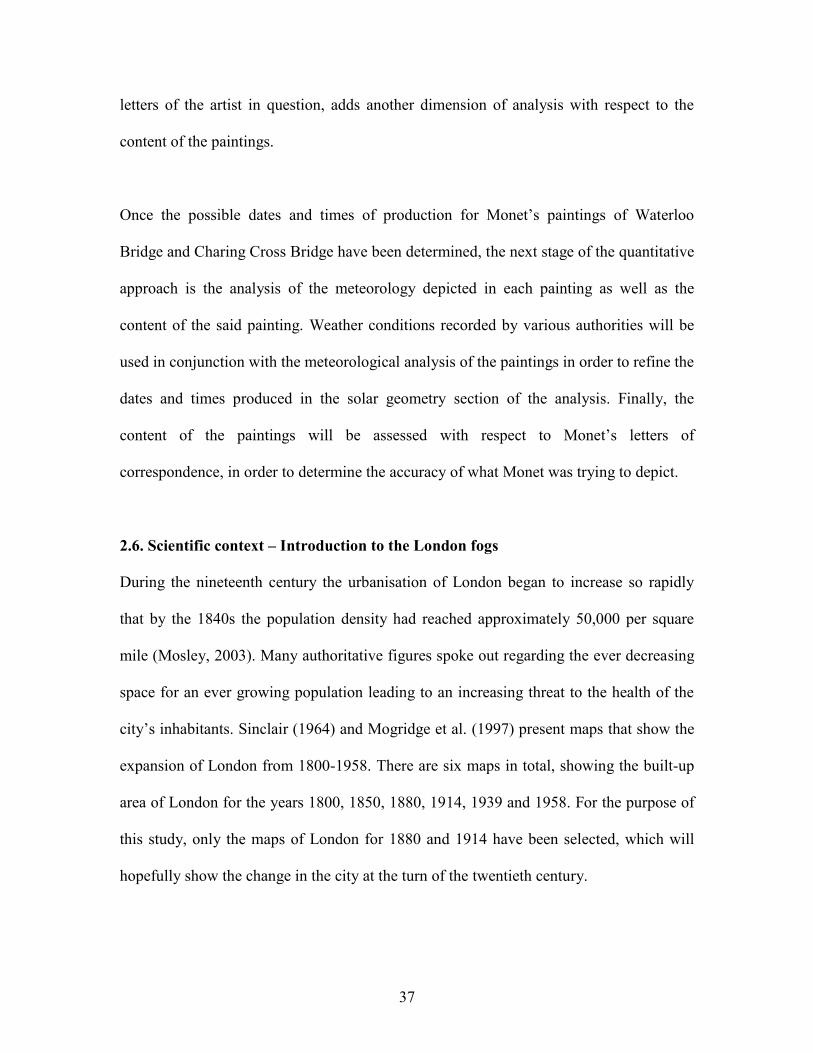
city‟s inhabitants. Sinclair (1964) and Mogridge et al. (1997) present maps that show the
expansion of London from 1800-1958. There are six maps in total, showing the built-up
area of London for the years 1800, 1850, 1880, 1914, 1939 and 1958. For the purpose of
this study, only the maps of London for 1880 and 1914 have been selected, which will
hopefully show the change in the city at the turn of the twentieth century.

38
Figure 2.2 Built-up area of London in 1880 (c) and 1914 (d) (Mogridge and Parr, 1997).
By 1880, the central built-up areas had begun to grow beyond the pre-existing boundaries.
The map also shows that a substantial suburban development already existed. During the
next three decades, by 1914, the metropolis had grown extensively along with the urban
areas located at various distances from the centre. The expansion of London can be
attributed to the development of the suburban transport networks during the nineteenth
century, which ultimately meant that the growing population of London along with the
coal-burning activities of the city‟s inhabitants were dispersed over a greater area.
The amount of smoke present in London during the nineteenth century meant that there
was subsequently a call for the introduction of an air pollution abatement act. After the
Smoke Nuisance Abatement Act was established in 1853, there were also smoke clauses

39
defined in the Sanitary Acts of 1858 and 1866, as well as in the Public Health Act of
1875 (Brimblecombe, 1987). Nevertheless, by the 1880s a lot of the previous interest in
smoke abatement had disappeared. The most likely reason for this decline in interest was
the lack of an air pollution monitoring network within London. Documents processed by
the early inspectors show that they assessed progress by counting the number of times
smoke was observed each year, instead of trying to determine the concentration of the air
pollutants (Brimblecombe, 2004). Since the inspectors were only relying on visual
observation, the inhabitants of London were unaware of the true amount of air pollution
present in the city air (Brimblecombe, 1987). The pollution problem in London was
closely related to the alkali industry owing to the production of sodium sulphate, which
was much needed in the manufacture of glass, along with the production of alkalis such
as sodium carbonate and sodium hydroxide (Brimblecombe, 1987). The method utilised
by the industry involved the reaction of common salt with sulphuric acid which can be
represented by the equation: 2NaCl + H2SO4 → 2HCl + Na2 SO4
The formula shows that the process produced hydrogen chloride as a by-product, yet as it
was regarded as having little significance it was released directly into the air. With the
growth of the alkali industry, the volumes of hydrogen chloride produced also increased,
with devastating environmental consequences (Brimblecombe, 1987). However, soon
pollution levels could no longer be ignored, as the fogs on the River Thames started to
become much more noticeable. It is now known that high levels of pollution aid in the
formation of fog, and since the levels of air pollution were particularly high during this
time the fogs naturally became thicker, more frequent, and different in colour than those
of the past.
40
Even towards the end of the nineteenth century, the inhabitants of London were still
unsure of the cause or the effects of the pollution that was being continuously pumped
into the atmosphere. An account written by John Ruskin in 1884 reflects this lack of
conviction when addressing the creation of the „plague-winds‟, “It looks partly as if it
were made of poisonous smoke;” (Ruskin 1884:46). Ironically, Ruskin was correct in his
diagnosis, since the fogs were predominantly as a consequence of the high levels of
smoke that industrial London was producing.
However, in mid-nineteenth century London, the government established the „Select
Committee on Smoke Prevention‟ (Whitehead, 2009). The purpose of creating such a
Committee in 1843 was to consider the atmospheric problems facing industrial Britain
during this time. Throughout this period many members of parliament and scientists
began to place great importance on the effect the fogs were having on parks and plants, in
spite of the uncertainty surrounding the effects they were having on human health
(Luckin, 2002). Nevertheless, the launch of this Committee in 1843 was seen as the first
attempt made by the government to try to build relations with British scientists in order to
work together against the air pollution problem (Whitehead, 2009). The advent of the
scientific analysis of air pollution in 1843 could be pinpointed as a turning point in the
history of the air pollution systems of nineteenth century Britain. Despite this, there was
still great concern about the contamination of rainfall and river water with respect to the
Alkali Act of 1863. Fortunately, the first Chief Alkali Inspector, Robert Angus Smith,
who was responsible for many of the early chemical analyses of rain and air, took his role
very seriously and would conduct work above and beyond the requirements of the act

41
(Brimblecombe, 2004). Nonetheless, there still remained a shortage of air pollution
measurements, and it was not until 1910 that air pollution monitoring networks were
established, which was entirely as a result of the development of deposit gauges inspired
by the work of „The Lancet‟ (Brimblecombe, 2004). Another possible method to estimate
the concentration of air pollutants would be modelling. The simple models that have been
used, in recent studies, suggest that the concentration of air pollutants was high at the end
of the nineteenth century, an idea supported by the strong correlation between London‟s
fog frequency and the modelled pollution load. As previously discussed, particulates
from activities such as coal burning have been linked to increased fog formation, so this
finding was to be expected.
Brimblecombe (1987) „The Big Smoke‟ contains figures regarding the number of days in
the second half of the nineteenth century that encountered fog.
Years Number of days with fog in London
1871-5 51 ± 15
1876-80 58 ± 15
1881-5 62 ± 7
1886-90 74 ± 11 Table 2.1 Number of days experiencing fog in London 1871-1890
Just by looking at Table 2.1 above, it can be concluded that the frequency of the fogs
seemed to reach a peak between the years 1886-1890. Mossman (1897) „The non-
instrumental meteorology of London 1713-1896‟ and Lamb (1982) „Climate, History,
and the Modern World‟ also contain figures regarding the average number of days with
fog and dense fog throughout the nineteenth century.

42
Years Average yearly number of days
with fog
Average yearly number of days
with dense fog
1811-20 19 2.4
1821-30 19 2.5
1831-40 26 5.2
1841-50 22 3.9
1851-60 33 7.6
1861-70 39 8.1
1871-80 49 9.0
1881-90 55 9.3 Table 2.2 Number of days experiencing fog and dense fog 1811-1890
Table 2.2 also shows that there was another peak in the fogs during 1831-40, after which
the frequency saw a brief downturn before the number of fogs and dense fogs rose to a
maximum in 1881-90. Nevertheless, the fogs did continue into the twentieth century
which prompted the London Fog Inquiry of 1901-1902. Coincidentally, just as the
inquiry got under way, the frequency of the fogs seemed to lessen. The rise and fall of the
fogs between 1871 and 1890 were observed and recorded by the meteorologist F. J.
Brodie (1892, 1905). He believed that the decrease in fogs was because of the founding
of the Coal Smoke Abatement Society in 1899, as they had pushed for the enforcement of
the laws that required factories to consume their own smoke (Brimblecombe, 1987).
However, private chimneys were not included in any of the legislations passed regarding
smoke emissions until the Clean Air Act of 1956. The reason that private chimneys were
not initially included in these laws was on account of the weariness of Victorian and
Edwardian governments to interfere with London‟s inhabitants‟ „right‟ to enjoy the
luxury of an open coal fire (Mosley, 2003). Many Victorians viewed their coal fires with
a certain amount of sentimentality and ironically believed that an open hearth would aid
in the ventilation of the home (Mosley, 2003). It is well-known that Londoners in the
nineteenth century would fill their open fires with bituminous coal without realising that

43
the smoke they produced would intensify the fog. For many centuries, London had been
covered by a canopy of smoke; but this was much enhanced during the nineteenth century
by the factories, railway engines, steam-powered machinery in the docks and steamers of
the River Thames (Bernstein, 1975). Table 2.3 displays London‟s coal supply for the
period 1830-89 (Making the Modern World, 2004).
Years Seabourne (1000’s of tons,
averages per year)
Railbourne (1000’s of
tons, averages per year)
1830-9 2288 -
1840-4 2664 -
1845-9 3279 19
1850-4 3379 451
1855-9 3167 1195
1860-4 3407 1750
1865-9 3001 3064
1870-4 2940 4609
1875-9 3257 5559
1880-4 3952 6701
1885-9 4768 7424 Table 2.3 London‟s coal supply for 1830-1889
Owing to this, improvements in London‟s air quality seem not to have come from the
adoption of legislation, but instead as a consequence of the persistent pressure applied to
industry. Prior to the implementation of the Clean Air Act, in 1956, the sale of coal in
London had dropped to 3,227 thousand tons and continued falling (United Kingdom,
Ministry of Fuel and Power, 1962).
The annual average of dense fogs, that is when fogs over a widespread area reduce the
visibility to ¼ of a mile or less, rose from 2.4 to 9.3 for the decades 1811-20 and 1881-90,
respectively. Sir Douglas Strutt Galton, a sanitary reformer of military barracks and
44
hospitals, claimed that the “great prevalence of fog-forming matter in our London air …
and the enormous amount of smoke” was the cause of the darkness hanging over London.
Luke Howard, the renowned meteorologist, conducted a study of the temperature in
urban and rural London during the early nineteenth century, to determine the „urban heat
island‟. He concluded that inner London had an „artificial excess of heat‟ causing an
overall heating effect which saw an increase in the city‟s temperature by two degrees
Fahrenheit during the winter months (Brimblecombe, 1987). Howard reported that he
thought the heating was a result of combined fuel consumption and increased absorption
of radiation by urban surfaces. He believed that all of the chimneys in London played a
major role in the production of the „fuliginous cloud‟ that frequently hung over the city.
By the end of the nineteenth century, the fogs had become so severe that in stagnant
atmospheric conditions, the city was barely habitable (Brimblecombe, 1987).
Much of the smoke reduction in London during the twentieth century was attributed to
the smoke control zones assigned to local areas of the city. However, before these had
been put into place, coal burning in London had diminished (Bernstein, 1975). Strutt
Galton advised the people of London that “We must cook by gas and we must sacrifice
open fireplaces” (Strutt Galton, 1888), and whether they took heed to this or not, it seems
that many Londoners started to use modern central heating systems which ran on fuels
such as gas, electricity or oil. These new systems replaced the more labour intensive coal
fires that required constant cleaning of dusty grates and refilling of heavy coal scuttles. In

45
addition to this, the „penny-in-the-slot gas-meter‟ was introduced to the working classes
in the 1890s, thus vastly reducing the amount of coal used in the home.
In 1901 Captain Carpenter collaborated with Captain Lionel de Latour Wells in order to
arrange for systematic fog observations to be recorded at thirty fire stations spread
throughout London. Other stations also contributed observations so that a widespread
network had been established within a couple of weeks, which not only covered London,
but adjacent heights and the Thames Estuary as well. This network of observational
stations operated for two winters, incurring a minimal cost (MPMC, 1901). This
investigation was called The London Fog Inquiry. “The contamination of the air by
smoke” was observed and recorded by Captain Carpenter when he ascended Victoria
Tower and St Paul‟s Cathedral on ten separate occasions between 20th
December 1901
and 17th
January 1902. None of these days were foggy, with several of the days having
“great visibility in the country”, yet the visibility from the towers ranged from half a mile
to one and a quarter miles. Despite the noted clarity of these days, Captain Carpenter
observed that “St Paul‟s has not yet been seen from Westminster nor Westminster from
St Paul‟s, although their distance apart is but 1½ miles” (MPMC, 1902). The London Fog
Inquiry established that the London fogs were produced in London, and had it not been
for the mixture of smoke particles, then they would not have assumed the density of the
thickest black or yellow fog (Bernstein, 1975).
The fogs within London did appear to have had some locality, as one could pass from
thick darkness into the clear light of day within a few yards, leaving many agreeing that

46
the best thing to do would be to abolish the fogs altogether (Bernstein, 1975). However,
just as the London Fog Inquiry was collating these results, the frequency of the fogs
appeared to be decreasing. Less than twenty fogs were recorded in 1900, which made it
the least foggy year since 1871, yet over forty fogs were recorded in 1901, forty fogs
were again reported in 1902, and less than thirty fogs were recorded in 1903 (Bernstein,
1975).
W. N. Shaw deduced from the results of the London Fog Inquiry that the Coal Smoke
Abatement Society dealt with approximately 20% of the London fogs, whilst the
remainder of the fogs depended on physical processes “which are not within our control”
(Shaw, 1906). Bernstein (1975) drew his own conclusion that the economic „progress‟ in
London had contributed roughly 70% to the smoke reduction and fog banishment, whilst
the Clean Air Act had contributed the remaining 30%.
In 1904, Brodie announced that the foggiest months in the twenty year period 1871-90
were December, October, January and March, in descending order; and in the thirty-three
year period 1871-1903 the foggiest months were December, November, January and
October (Bernstein 1975). The reduction in fog frequency continued into the twentieth
century, undoubtedly aided by the decreased emissions released in London, tighter
industrial laws, together with the fact that the use of coal became unfashionable as the use
of new fuels became more widespread. However, it was not until the „Great Smog‟ of
1952 had claimed the lives of 4,000 Londoners that people were truly willing to give up
the open coal fire (Mosley, 2003).
47
In 1954, London was the first local authority in the country to obtain parliamentary
powers to declare the whole city a smokeless zone. Between 1958 and 1969, the smoke
concentrations over London had declined by 80% (Scarrow, 1972), which seemed to
coincide with the less frequent appearance of fogs (Jenkins, 1971).
2.7. Meteorological optics
The effects of smoke are now quite extensively known because of their visibility to the
naked eye, for example vegetation damage as well as the reduction of visibility and solar
radiation. Visibility reduction is caused by the scattering and absorption of light by
molecules in the air. Scattered light works to decrease the contrast between an object and
the background sky, which results in a reduction of visibility (Pauly Hyslop, 2009). Over
urban areas, blankets of particles work to reduce the direct and scattered solar radiation,
thus decreasing the amount of sunlight that reaches the ground level. In Victorian London
these particles would have been present as a result of the increased levels of pollution at
the time. It was these polluted scenes that Monet wished to capture in his depiction of the
London „landscape‟.
As discussed earlier, during the nineteenth century, coal smoke characterised the urban
atmosphere and affected the lives of every city dweller regardless of their social status.
However the composition of the smoke surrounding them was never considered. The
majority of coal contains between 85-90 % carbon (Alloway and Ayres, 1993), with
smaller amounts of oxygen, hydrogen, nitrogen and sulphur. In fact, the complete
combustion of coal does not produce any smoke. It is only when the coal is not

48
completely burned that the small particles of carbonaceous matter – smoke and soot – are
produced (Mosley, 2001).
The seasons were thought to have had an effect on the fogs, and even though the fogs did
not disappear altogether during the summer months, they did seem to lessen somewhat.
Nevertheless, in January 1855, The Times newspaper published the following about
London‟s air quality during the summer;
Smoke we have always with us. If we look out on a fine summer‟s day … for
a view of the great metropolis, we naturally exclaim, “I see it; there is the
smoke;” … any picture of London without its dim canopy of soot would be as
unrecognizable as would a portrait of Pope, Hogarth, or Cowper without their
well-known headgear (The Times, 1855).
Conversely in 1894, Pall Mall Magazine had the following account from Ernest
Hamilton;
London in June is hardly recognisable as the same place where six months
before we were coughing and wheezing and groping our grimy way through
the gaslit streets. In June the trees are in the full zenith of their short-lived
verdure, the young grass fresh and green, the parks bright with flowers, and
the exhalations of domestic chimneys have ceased for a time to obscure the
heavens. In short, everything looks its best and brightest, and only the houses
stand as gloomy, silent witnesses that the truce with the powers of darkness is
only temporary … So it is year after year. We grumble in winter, and we
forget in summer (Hamilton, 1894).
49
It has been documented that smoke particles, resulting from activities such as coal
burning, alter the electrical properties of air. For example, an increase in smoke particle
concentration causes a decrease in the electrical conductivity of air but an increase in the
Potential Gradient (PG). A potential gradient is defined as the local space rate of change
of electric potential; that is, the amount of work that would be required to move a unit of
electrical charge from a reference point to a specific point against an electric field.
Early twentieth century smoke concentrations at monthly resolution have been found for
Kew Observatory, as well as calibrated PG data from 1898 and air conductivity
measurements for the years between 1909 and 1979 are available for Kew. Since there
are existing automated smoke observations for this site from 1921, an absolute calibration
to smoke concentration was possible, highlighting that late nineteenth century winter
smoke concentrations at Kew were roughly 100 times greater than current winter smoke
concentrations (Harrison, 2006). The previously discussed sensitivity of atmospheric
electrical parameters to smoke particles, along with the extensive availability of PG
measurements for locations all over Europe from the mid-nineteenth century onwards
(Harrison, 2004), enables the reconstruction of past urban smoke concentrations for Kew,
London in the 1860s (Harrison and Aplin, 2002).

50
Figure 2.3 Monthly smoke concentrations for London in 1863
The frequency of fog formation is higher in cities when compared to the countryside,
despite the fact that cities have higher temperatures and lower humidity than in the
country. Therefore it has been concluded that the explanation lies in the mechanism of
fog formation (Seinfeld, 1986). When fog forms over cities, where the air is usually
polluted, the fog is often thicker than any fog forming over an ocean. City air contains a
plethora of available condensation nuclei, such as dust, that water vapour can condense
on to produce lots of fog droplets which thus increases the possible thickness of the fog
layer resulting in reduced visibility. Since the air in most cities is polluted to some degree,
the fog can turn acidic as the tiny liquid droplets merge with gaseous impurities, posing a
threat to human health.

51
The official definitions of fog, as determined by the Met Office, is as follows. „Fog‟ is
when visibility is reduced to below one kilometre, which is thought to be an appropriate
limit for aviation purposes. As far as the general public and motorists are concerned, the
upper limit for visibility in fog is 200 metres, and is referred to as „thick fog‟. The third
situation is „dense fog‟ and this is when visibility falls below 50 metres, causing severe
disruption to transport (Met Office, 2007). Mist has also been defined by the Met Office.
This term is used for conditions when the atmosphere is obscured by suspended
microscopic water droplets or wet hygroscopic particles, resulting in a visibility of one
kilometre or more (Met Office, 2007).
It was reported that the visibility in London at the height of the fogs was extremely low
(MPMC, 1902), with many Londoners experiencing difficulty when simply trying to
navigate their way around the city. Since the fogs of nineteenth century London would
settle over the city for days at a time, they would have most certainly posed a threat to the
health of London‟s inhabitants and its visitors.
Once a fog layer has formed it is easily preserved by new fog droplets which
continuously form on the available nuclei as long as the air maintains its degree of
saturation. This is possible by either a continual cooling or by the evaporation and mixing
of water vapour into the air (Ahrens, 2000).
Even though the fogs of London peaked during the 1880s, Monet depicted the continually
occurring fog layer in his paintings of London during his stays in 1899, 1900 and 1901.

52
The variety of colours that he employed in order to portray each foggy scene could surely
be interpreted as evidence of the effects that the pollution levels had on the atmospheric
properties and thus the weather of London.
2.8. The colour of the fog
The colour of the London fogs was not frequently noted in early reports, but as the fogs
became more prevalent so too did the observations.
In 1908, Beale wrote in his book, „Recollections of a Spinster Aunt‟, that 1850s London
seldom experienced yellow fogs. However, the frequency of the fogs and the variety of
the colours seemed to increase greatly, which is evident from the following excerpt.
A sudden draught apparently had swept across the sky, and where before the
thick black curtain had been opaquely stretched, there came sudden rents and
illuminations. Swirls of orange-coloured vapour were momentarily mixed
with the black, as if the celestial artist was trying the effects of some mixing
of colours on his sky palate …. the commotion among the battling vapours
grew ever more intense: blackness returned to one quarter, but in another all
shades from the deepest orange to the pale gray of dawn succeeded on
another (Benson, 1905).
It was not only the „celestial artist‟ that was experimenting with colours, as landscape
artists began to change the colours they were using when depicting the skies they
observed. The blue skies that were initially dominant became secondary to skies of pink
and shades of yellow-brown (Lamb, 1982).
53
The colouration of the London fogs still requires further exploration. Novakov and
Novakov (2006) speculate what chromatic effects certain industrial processes had on the
atmosphere during the nineteenth century. They suggest that tars from low temperature
coal combustion would give morning fogs a yellow hue, on account of the relative
soluble properties. However as the working day progressed, industrial emissions as well
as exhaust from steam trains and ships would darken the fogs. This change in colour to
dark brown was attributable to tar being produced at higher temperatures. In addition to
this, one of the most important chemical activities during this time was manufacturing
„alkali‟, which was primarily made up of sodium carbonate and sodium hydroxide.
Industry of this kind would release huge volumes of hydrochloric acid into the
atmosphere.
The hypothesis of Novakov and Novakov is rooted in two kinds of evidence. Firstly, a
large percentage of the airborne particles consisted of low temperature tar; and secondly,
the chemical reactions consequently produced colourful dyes. Since coal tar is a complex
organic material it consists of many constituents such as aniline and phenols. When these
react with acids, which were provided in abundance by the „alkali‟ factories, salts are
produced. These salts are water-soluble, and thus may pass on various colours to their
aqueous solutions. The colouration of the atmosphere and thus fogs could also be a
consequence of the absorption of certain wavelengths of light by the air molecules and
fog droplets. Everything is dependent on the size of the droplets present in the air. Fog
will usually appear white since it is illuminated by the scattered and transmitted rays of
sunlight. The scattered light usually makes up approximately 99% of the incident light,
54
thus appearing white as a whole even though each element of light may show a
preference for scattering blue (Minnaert, 1974). Nevertheless, the fogs in London during
the nineteenth century appear to have formed because of a variety of consequences, thus
the colouration of those fogs are very likely to be the result of the complexities of the
compounds produced in the industrial processes as detailed by Novakov and Novakov.
Thus, an in-depth analysis of the content of Monet‟s London Series, with reference to his
letters and various meteorological records, may provide a better understanding of the
severity of London‟s pollution and its resulting effect on the production of fog.
If nothing else, the fogs caused a stir among many regarding their aesthetic qualities.
Early descriptions by the French writer James Morier in 1849 claimed that the fogs
“…covered all things with an eternal mourning”. However, as the century progressed,
visitors to London started to view the fogs as an “aesthetic effect” of the atmosphere
(House, 2005); and in 1867, the French novelist Edmond Duranty described the docks as
being “…astonishing … particularly in grey foggy weather”. Nonetheless, the majority of
England‟s natives were in agreement with Morier, that indeed London was hideous to
look at, but would be less hideous without its smoke (Russell, 1880). Monet was one of
the visitors to London who held the satmospheric changes in great esteem, commonly
referring to them as „l‟enveloppe‟. After completing his series, Monet told René Gimpel
“What I like most of all in London is the fog” (Gimpel 1963 sited House 1986). It was
during his fourth trip to London in 1901, whilst he was continuing with the work on his
London Series, that Monet commented on the diversity of colours that the fogs displayed:

55
There are black, brown, yellow, green, purple fogs and the interest in painting
is to get the objects as seen through all these fogs (Bullet, 1901).
Monet tried to depict all of the colours of the fogs in his many scenes of London. It was
in fact during the nineteenth century, in particular, that artists began to formulate colour
with increasing intensity using a combination of artistic and scientific theories (Kemp,
1990).
2.9. Visual Culture
In 2005, Thornes suggested that rather than a „visual turn‟ occurring there seemed to be a
„visual return‟ to geography taking place. This would require a visual literacy to be
established across the whole geographical field, using images as a tool of explanation
rather than words or equations, in order for human geographers and physical geographers
to share and revise their visual methodologies accordingly. Working together in this way
would help to teach geographers the importance of visual skills, so that they know how to
deconstruct images before they even start to create their own (Thornes, 2005). Until
recently, many geographers have been in a state of visual denial, as a result of the
fabricated reputation that geographers „colour in‟ maps. This obviously slowed down the
„visual return‟ to geography.
In England during the 1950s, a cultural turn occurred which introduced physical
geography to culture, thus producing „cultural physical geography‟ (Gregory, 2000). The
theory of visual culture reached the US in the 1970s, incorporating a plethora of
methodologies in its understanding. A few of these methodologies included; The Gaze,
56
semiotics, iconography, psycho analysis, discourse analysis and content analysis.
Expansion of this subject resulted in the new discipline of „visual studies‟ which was
fully developed in the 1990s.
The need for visual literacy within the social sciences requires an expansion of visual
culture and visual studies (Elkins, 2003). A visual „return‟ has already been experienced
by human geographers, resulting in a complete „theory of pictures‟ to aid in the
understanding and deconstruction of images (Rose, 2001). The physical sciences intend
to modernise techniques in visualisation, modelling, imaging and analysis (Thornes,
2005). The visual „return‟ to physical geography has been predominantly interested in
„picturing theory‟, relating to the visualisation of processes (Thornes, 2005).
2.10. Visual Studies
The title „visual studies‟ seems to encompass three fields within this subject area; cultural
studies, visual culture, and finally visual studies.
The field of „cultural studies‟ gained knowledge from a variety of disciplines such as art
history, anthropology, sociology, art criticism, and film studies, to name but a few (Elkins,
2003). However, it was not until the 1970s that this study area seemed to spread
throughout the „red-brick universities‟. A decade later, in the 1980s, „cultural studies‟
became international, reaching America, Australia, Canada and India.

57
Conversely, „visual culture‟ was an American study area which took hold in the 1990s
(Baxandall, 1972), but it was “a narrower area of cultural studies” (Crimp, 1999),
focusing primarily on the visual. Finally, „visual studies‟ was a term coined by Mitchell
in 1995, to join the fields of art history, cultural studies and literary theory. Mitchell
called this connection the „pictorial turn‟, a sequel to the „cultural turn‟ experienced some
35 years earlier that had then produced the field of „cultural studies‟ (Mitchell, 1995).
In 2002, Mitchell discussed vision as a cultural construction, that it is experienced and
nurtured, rather than being simply given by nature. He also specified that „visual culture‟
encompassed the field and its content, with the context to clarifying the meaning. The
example that Mitchell gave was of aesthetics and art history, as they work together in a
complementary fashion. Together, aesthetics and art history provide completeness, since
the theory of visual experience is dealt with by aesthetics, whilst the history of visual
images is dealt with in art history (Mitchell, 2002). Therefore it seems only natural that a
„sub discipline‟ halfway between aesthetics and art history would develop, concerning
visuality and addressing problems such as light, optics, visual apparatuses and experience,
the eye as a perceptual organ, and the scopic drive, amongst other things (Mitchell, 2002).
Hence, it is not just aesthetics and art history that fall into this arena, but scientific and
technical fields such as physical optics. Ancient optical theory treated vision as a
comprehensively tactile and material process (Mitchell, 2005). In his publication, „A New
Theory of Vision‟, Bishop Berkeley states that vision is not simply an optical process but
in fact requires a coordination of optical and tactile impressions that will work together to
create a coherent and stable visual field (Mitchell, 2005). This concept was echoed in

58
2002 when Jay professed that any new field cannot emerge in its entirety without being
indebted to the fields that preceded it. Therefore it follows that these new fields will
naturally borrow a selection of matters and methods from a variety of neighbouring or
antecedent disciplines. Ultimately, sometimes complementary and sometimes
contradictory approaches are required in order to develop a full understanding of the
„visual culture‟ (Jay, 2002).
59
CHAPTER 3: Context of Monet and his work
In order to be able to understand Monet‟s role in Impressionism and in nineteenth century
art, as a whole, this chapter will initially attempt to explore Monet‟s work with respect to
that of other contemporary artists. The chapter will finish with an analysis of the
catalogue of Monet‟s career, paying particular attention to his series paintings.
3.1. The founding of Impressionism
The Impressionist movement developed in France during the late nineteenth century and
into the early twentieth century, with Impressionist painting consisting of the work
produced between 1867 and 1886 (Pioch, 2006). Enthusiasts of the Impressionist
movement viewed this style of painting as a different way of seeing. They were
predominantly concerned with the general impression of a scene or object which was
conveyed with the use of unmixed primary colours and small strokes to simulate the
reflected light (Pioch, 2006).
Levinson (1997) suggested that the Impressionist movement was started as a reaction to
the introduction of photography. To begin with, paintings of both portraits and landscapes
were thought to be unrealistic whereas photography “produced life like images much
more efficiently and reliably” (Levinson, 1997). The aim of the Impressionists was to
portray their own experiences of nature and not merely to create direct reflections as
photographs would. In fact, it seems that photography encouraged the artists to exploit
certain aspects of the painting medium, like colour; so they were the “first to consciously
offer a subjective alternative to the photograph” (Levinson, 1997).
60
3.2. Photographs of London c. 1900
At the same time that Impressionism was becoming an established art movement,
photography was another artistic medium that was gaining significant recognition.
During this period photographs were also called „impressions‟ on account of the long
exposure cameras that were used. Since the photographs were taken using this
instrumentation, they captured the speed at that cities moved at as a blur, which was very
similar to how Monet and the Impressionists would paint figures on their canvases.
Art photographers working towards the end of the nineteenth century and into the
beginning of the twentieth century were renowned for including visual metaphors in their
photographs. These metaphors were based heavily in the pictorial, for example; patterns,
shapes, smoke, reflections on the surface of water, plus effects created by steam and
lighting.
Interestingly, there exists the perception that the content of photographs can be
considered to be true and believable since they have been captured using a machine. Yet
the accuracy of the content of a painting is deemed to be questionable as it is susceptible
to the artist painting the scene, that is, their artistic licence. However, Alvin Langdon
Coburn is a brilliant example of a photographer who would rework his photographs in
order to emphasis certain elements of a scene. Coburn‟s work was unique in that during
the photographic printing process, he would hand-work his images in order to minimise
detail in favour of how the atmosphere was portrayed. The end result was to give the
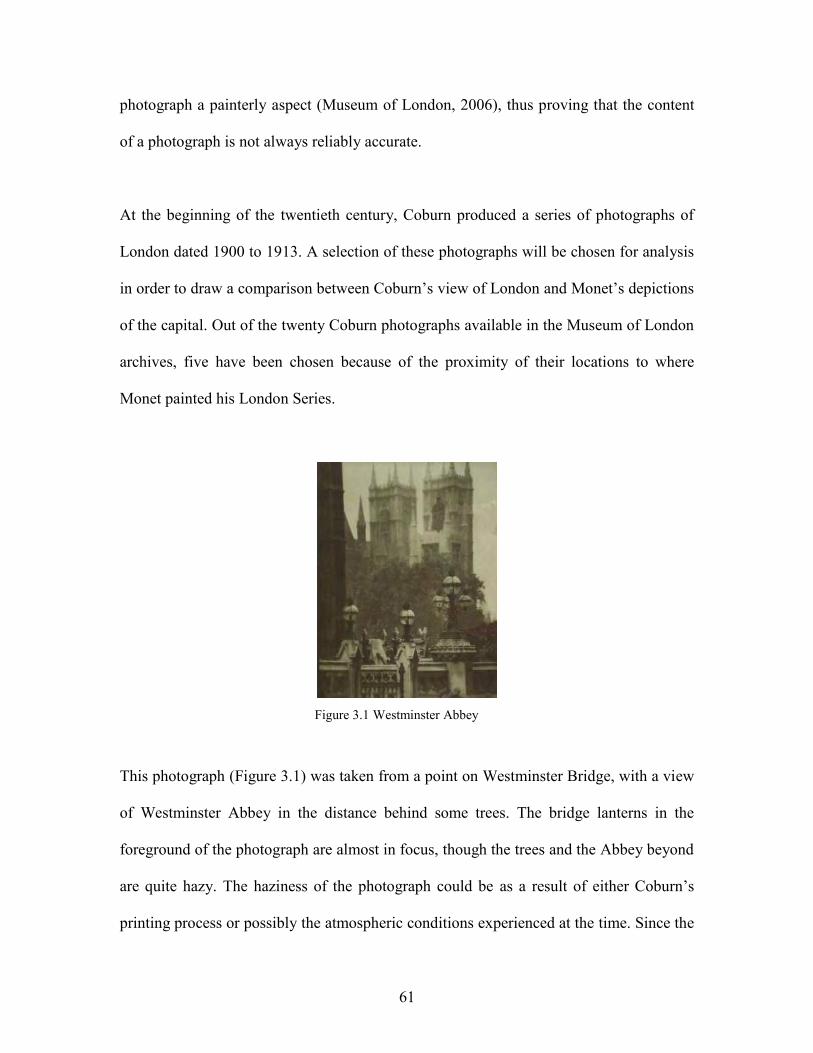
61
photograph a painterly aspect (Museum of London, 2006), thus proving that the content
of a photograph is not always reliably accurate.
At the beginning of the twentieth century, Coburn produced a series of photographs of
London dated 1900 to 1913. A selection of these photographs will be chosen for analysis
in order to draw a comparison between Coburn‟s view of London and Monet‟s depictions
of the capital. Out of the twenty Coburn photographs available in the Museum of London
archives, five have been chosen because of the proximity of their locations to where
Monet painted his London Series.
Figure 3.1 Westminster Abbey
This photograph (Figure 3.1) was taken from a point on Westminster Bridge, with a view
of Westminster Abbey in the distance behind some trees. The bridge lanterns in the
foreground of the photograph are almost in focus, though the trees and the Abbey beyond
are quite hazy. The haziness of the photograph could be as a result of either Coburn‟s
printing process or possibly the atmospheric conditions experienced at the time. Since the
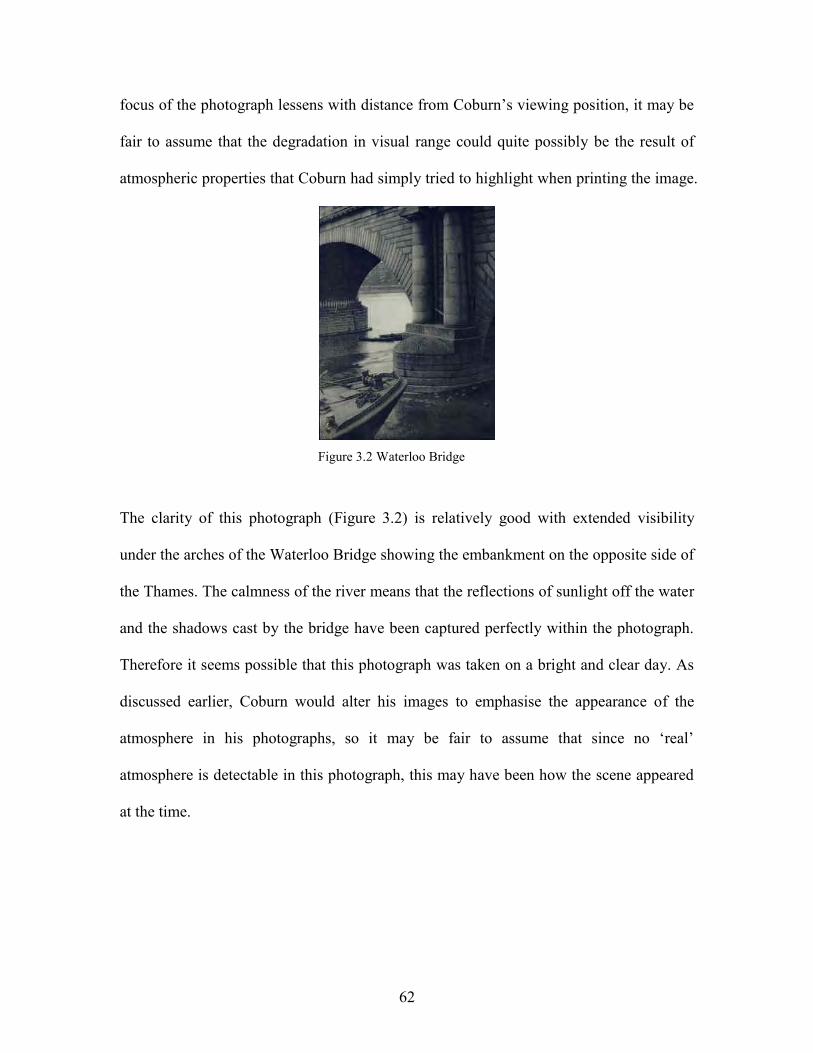
62
focus of the photograph lessens with distance from Coburn‟s viewing position, it may be
fair to assume that the degradation in visual range could quite possibly be the result of
atmospheric properties that Coburn had simply tried to highlight when printing the image.
Figure 3.2 Waterloo Bridge
The clarity of this photograph (Figure 3.2) is relatively good with extended visibility
under the arches of the Waterloo Bridge showing the embankment on the opposite side of
the Thames. The calmness of the river means that the reflections of sunlight off the water
and the shadows cast by the bridge have been captured perfectly within the photograph.
Therefore it seems possible that this photograph was taken on a bright and clear day. As
discussed earlier, Coburn would alter his images to emphasise the appearance of the
atmosphere in his photographs, so it may be fair to assume that since no „real‟
atmosphere is detectable in this photograph, this may have been how the scene appeared
at the time.

63
Figure 3.3 From Westminster
Bridge
This photograph (Figure 3.3) is very dark, but in spite of this; the clarity of the lantern in
the foreground of the image is surprisingly good. The recognisable outline of the
Parliament buildings is somewhat hazy in the background of the photograph, and the sky
beyond the buildings could be described as looking turbulent. Nevertheless, the windows
of the Parliament buildings are relatively clear, so it could be concluded that the overall
haziness of the photograph is the result of Coburn‟s printing process rather than any
atmospheric situation.
Figure 3.4 On the Embankment

64
The most important aspect of this photograph (Figure 3.4) is that Coburn seems to have
captured the Savoy Hotel in the background of the scene. The haziness of the Savoy
Hotel may be because of fog, though the sphinx in the foreground of the image is
relatively clear.
Figure 3.5 Houses of Parliament
Victoria Tower is clearly visible in the background of the photograph (Figure 3.5), and it
is reflected in the surface of the Thames. The rest of the Parliament buildings are
comparatively hazy as they are further away. The sky beyond the buildings seems clear,
yet towards the top of the photograph, the sky appears to darken significantly. This image
is very reminiscent of one of Monet‟s Houses of Parliament paintings from his London
Series; so it seems entirely plausible that Coburn could have styled this photograph on
one of these paintings.
3.3. Paintings of London c. 1900
An analysis of Monet‟s London Series will help to develop an understanding of how
Monet worked and what elements he felt were important to include in his scene of
London. However, ideally a comparison between Monet‟s London Series and the work of
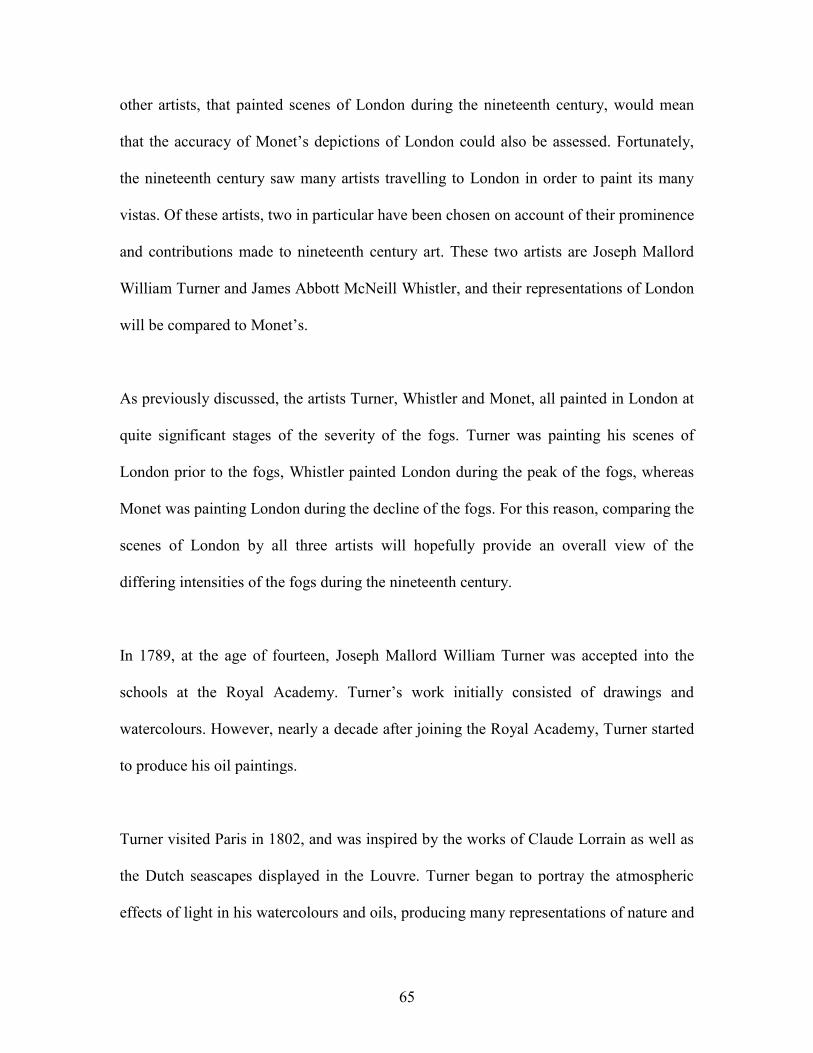
65
other artists, that painted scenes of London during the nineteenth century, would mean
that the accuracy of Monet‟s depictions of London could also be assessed. Fortunately,
the nineteenth century saw many artists travelling to London in order to paint its many
vistas. Of these artists, two in particular have been chosen on account of their prominence
and contributions made to nineteenth century art. These two artists are Joseph Mallord
William Turner and James Abbott McNeill Whistler, and their representations of London
will be compared to Monet‟s.
As previously discussed, the artists Turner, Whistler and Monet, all painted in London at
quite significant stages of the severity of the fogs. Turner was painting his scenes of
London prior to the fogs, Whistler painted London during the peak of the fogs, whereas
Monet was painting London during the decline of the fogs. For this reason, comparing the
scenes of London by all three artists will hopefully provide an overall view of the
differing intensities of the fogs during the nineteenth century.
In 1789, at the age of fourteen, Joseph Mallord William Turner was accepted into the
schools at the Royal Academy. Turner‟s work initially consisted of drawings and
watercolours. However, nearly a decade after joining the Royal Academy, Turner started
to produce his oil paintings.
Turner visited Paris in 1802, and was inspired by the works of Claude Lorrain as well as
the Dutch seascapes displayed in the Louvre. Turner began to portray the atmospheric
effects of light in his watercolours and oils, producing many representations of nature and
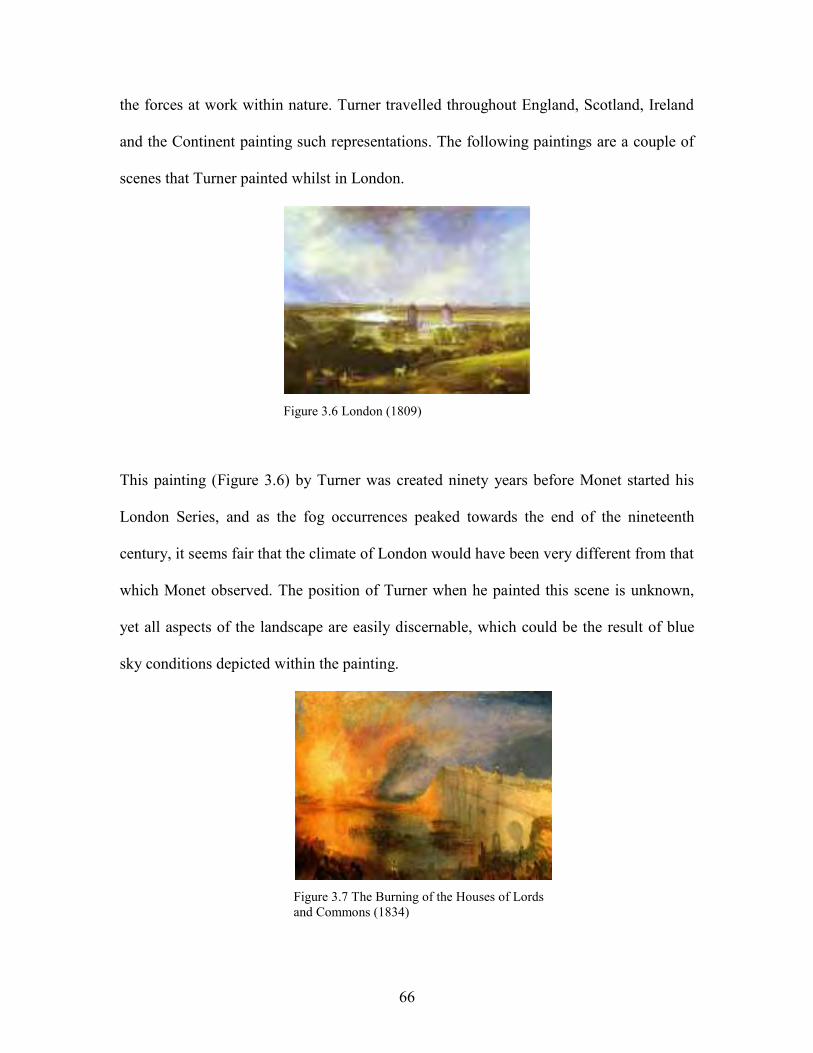
66
the forces at work within nature. Turner travelled throughout England, Scotland, Ireland
and the Continent painting such representations. The following paintings are a couple of
scenes that Turner painted whilst in London.
Figure 3.6 London (1809)
This painting (Figure 3.6) by Turner was created ninety years before Monet started his
London Series, and as the fog occurrences peaked towards the end of the nineteenth
century, it seems fair that the climate of London would have been very different from that
which Monet observed. The position of Turner when he painted this scene is unknown,
yet all aspects of the landscape are easily discernable, which could be the result of blue
sky conditions depicted within the painting.
Figure 3.7 The Burning of the Houses of Lords
and Commons (1834)
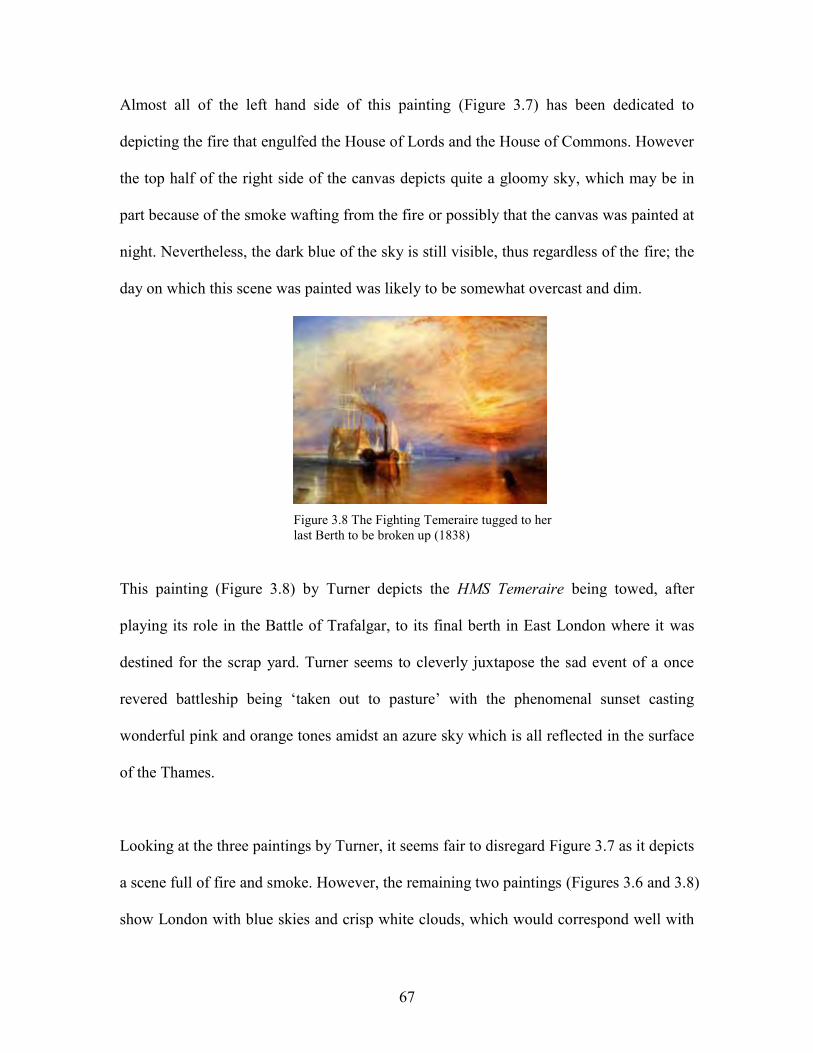
67
Almost all of the left hand side of this painting (Figure 3.7) has been dedicated to
depicting the fire that engulfed the House of Lords and the House of Commons. However
the top half of the right side of the canvas depicts quite a gloomy sky, which may be in
part because of the smoke wafting from the fire or possibly that the canvas was painted at
night. Nevertheless, the dark blue of the sky is still visible, thus regardless of the fire; the
day on which this scene was painted was likely to be somewhat overcast and dim.
Figure 3.8 The Fighting Temeraire tugged to her
last Berth to be broken up (1838)
This painting (Figure 3.8) by Turner depicts the HMS Temeraire being towed, after
playing its role in the Battle of Trafalgar, to its final berth in East London where it was
destined for the scrap yard. Turner seems to cleverly juxtapose the sad event of a once
revered battleship being „taken out to pasture‟ with the phenomenal sunset casting
wonderful pink and orange tones amidst an azure sky which is all reflected in the surface
of the Thames.
Looking at the three paintings by Turner, it seems fair to disregard Figure 3.7 as it depicts
a scene full of fire and smoke. However, the remaining two paintings (Figures 3.6 and 3.8)
show London with blue skies and crisp white clouds, which would correspond well with

68
the fact that they were painted during the first half of the nineteenth century, before the
London fogs had begun to set in. Therefore, it may be concluded that Turner‟s paintings
depict fair representations of London‟s weather during this time.
The second artist to be compared to Monet is James Abbott McNeill Whistler who was
born in Lowell, Massachusetts in the United States in 1834. After succeeding in drawing
during his time at the military academy, West Point, Whistler travelled to Paris in 1855 to
become an artist. Prior to enrolling at the studio of Charles-Gabriel Gleyre, Whistler had
studied for some time at the École Impériale et Spéciale de Dessin.
Whistler made a series of etchings before starting his first painting in 1859. And nearly
two decades later, in 1877, Whistler began to paint a series of views of the River Thames
at night. This series was entitled „Nocturnes‟.
Figure 3.9 Nocturne in Blue and Silver;
Chelsea (1871)
Chelsea is approximately three to four miles away from the Savoy Hotel, thus this scene
(Figure 3.9) of Chelsea painted by Whistler may be compared to Monet‟s own
representations of the River Thames. Unfortunately, Whistler‟s exact position in Chelsea

69
is unknown; but it is possible to deduce that Whistler would have been positioned on the
same side of the Thames that Monet was, looking towards either Battersea or South
Lambeth. The most obvious disparity between this painting and any of Monet‟s paintings
of London is the time of day that the scene was created. Monet‟s painting routine has
been well documented; he would paint Waterloo Bridge during the early morning, and
Charing Cross Bridge from midday into the early afternoon, hence trying to assess the
weather situation portrayed in each scene can be a relatively straightforward exercise.
Nevertheless, the lack of sunlight in the scene „Nocturne on Blue and Green; Chelsea‟
has been made up for by the moonlight which shows an evening so clear that the
embankment on the far side of the Thames is obviously discernable.
Figure 3.10 Symphony in Gray: Early Morning Thames
(c. 1871)
As this scene (Figure 3.10) was painted during the early morning, it can be compared
somewhat to Monet‟s paintings of the Waterloo Bridge. Unfortunately, the exact position
of Whistler when he painted this scene is unknown, so only the representations of the sky
within this painting can be compared to Monet‟s skies. The canvas has clearly been
divided into four parts, the nearside embankment, the River Thames, the far side
embankment, and the sky. The majority of the canvas has been dedicated to the Thames,

70
whilst the sky has the smallest share of the canvas. Nevertheless, it is possible to see that
as the title states the sky is slightly gray and hazy, which could also describe some of the
skies painted by Monet in his scenes of Waterloo Bridge.
Figure 3.11 Nocturne: Grey and Gold - Westminster
Bridge (1871-74)
If the location of the scene (Figure 3.11) had not been stated in the title of this painting,
only Whistler would have known the true answer. However, despite the darkness of the
scene, blue fragments of sky are visible on the horizon amid clouds that seem to exude a
pinkish hue. As a result of this apparent visibility, it seems fair to suggest that the weather
was fair, if a little cloudy, on this particular day.
Figure 3.12 Nocturne: Blue and Silver –
Cremorne Lights (1872)
From the relative brightness of this scene (Figure 3.12), one could easily think that this
painting was produced during the day; even the structures in the far distance seem to be

71
reflected in the surface of the Thames. However, as this painting is one of Whistler‟s
„Nocturnes‟, then it must have been painted on an extremely clear night when the
moonlight was intense enough to produce reflections on the river.
Figure 3.13 Nocturne in Blue and
Gold - Old Battersea Bridge (1872-75)
Just as with „Nocturne: Blue and Silver – Cremorne Lights‟, this painting (Figure 3.13)
by Whistler also seems to have been produced on a remarkably clear night when the
moon is shining brightly. Old Battersea Bridge in the forefront of the painting is clearly
discernable, as are the structures in the background which also appear to be reflected in
the surface of the Thames. The presence of the word „gold‟ in the title of the painting
may be referring to the gold hues of the light within the scene, specifically in the sky just
below the bridge as well as ascents of gold on the structures and in the reflections.

72
Figure 3.14 London Bridge (1885)
London Bridge is only approximately one to two miles from the Savoy Hotel, thus
comparing this scene (Figure 3.14) of the Thames to the scenes painted by Monet seems
to be fairly reasonable. The most striking aspect of this painting is the monochromatic
tones that Whistler has used in his depiction. The sky and the river can only be
distinguished as separate elements on account of the boats on the surface of the Thames.
As the greyness of the sky has been reflected in the surface of the water, it seems fair to
conclude that the air was either thick with fog or smoke, or a mixture of both. In addition,
it has been documented that the severity of the fog occurrences reached a peak during the
1880s, and as this painting was produced in 1885 it seems to reflect this situation entirely.
From the analysis of the six paintings of London by Whistler, four of the paintings
(Figures 3.9, 3.11, 3.12 and 3.13) are from his „Nocturnes‟ series which suggests that
they were actually painted after dark. For this reason, it may be advisable to disregard
them at this stage and concentrate on the remaining two paintings; Figures 3.10 and 3.14.
Both of these paintings are decidedly grey in their depiction, so it is only the structures
within each respective scene which enables the observer to differentiate between where

73
the sky finishes and the River Thames begins. Since Whistler was residing in London at a
time when the fogs had reached their peak, it seems reasonable to conclude that his
paintings of London reflect this situation.
3.4. Monet’s life
Claude Monet was born in Paris in 1840, but by the time that he was five years old, he
and his family had moved to Le Havre on the Seine estuary (House, 1986). Monet‟s
mother died in 1857, so he spent a lot of his time with his aunt, Marie-Jeanne Lecadre,
who, unlike his father, seemed to understand his artistic interests.
Monet served with the Chasseurs d‟Afrique in Algeria from 1861-2, which appears to
have helped to encourage him with his ambitions to become a landscapist (House, 1986).
After this military service, Monet moved to Paris to study painting with the renowned
academic teacher Charles-Gabriel Gleyre who had previously taught Whistler. During
this time, Monet was being supported financially by his father, an arrangement which
seems to be entirely thanks to his aunt‟s persuasion (House, 1986).
Monet met Camille Doncieux in 1865, and in 1867 they had their first child, Jean. Monet
and his new family battled with poverty for several years, but he was eventually able to
marry Camille in 1870. However, shortly after the beginning of their honeymoon, Monet
fled to London in order to avoid conscription for the Franco-Prussian War (House, 1986).
Despite this, Monet‟s financial situation appears to have picked up over the following
years, on account of the sales of his work to art dealer Paul Durand-Ruel.
74
In the mid 1870s, Monet developed a close relationship with business man, Ernest
Hoschedé, and his wife Alice. However in 1877, Hoschedé went bankrupt, which led to
both families pooling their resources (H.Adhémar, 1984). Camille Monet died a while
later in the September of 1879 because of a longstanding disease of the womb. Shortly
afterwards, Ernest Hoschedé left his family to pursue the life of a bachelor in Paris. This
left Monet and Alice Hoschedé to look after her six children and Monet‟s two (House,
1986). This living situation seems to have caused quite a stir and was the reason that
Monet was isolated by his colleagues in 1880 (Wildenstein, 1974). The two families
moved to Giverny in 1883, yet Monet and Alice still managed to live technically separate
lives (House, 1986). However, with Ernest Hoschedé‟s death is 1891 the couple were
permitted to marry a year later.
On account of Monet‟s increasing success, the family in Giverny eventually “acquired
the image of a prosperous bourgeois ménage” (House, 1986). Alice Monet passed away
in 1911, and Monet died much later in 1926 at the age of 86.
Throughout most of his life Monet primarily painted scenes in close proximity to where
he was living at that time. This was the case when he began to paint what was to become
his Grain Stacks Series. The stacks are believed to have been located in a field near to
where he lived in Giverny.
It was later on during the 1880s that Monet decided to travel to various locations in an
attempt to observe and understand differing scenes of nature and their resulting effects

75
(House, 1986). During this time, Monet became a more experienced artist and his style
and technique underwent a variety of changes. It is also possible to pinpoint moments in
Monet‟s career when he began to focus his time and efforts on different subjects.
At the beginning of Monet‟s career in 1870, he would tend to paint groups of related but
separate works (Seiberling, 1988). He initially focused his efforts on man-made
landscapes, being fascinated by the contemporary elements of the scenes themselves.
He started to concentrate primarily on the open air from around 1870, painting small
scale canvases which made up the majority of the work exhibited by the Impressionists
from 1874 onwards (House, 1986). Monet launched his studio boat in 1873 (Thiebault-
Sisson, 1927) which appears to be the clearest indication of Monet‟s commitment to his
outdoor work of the 1870s. It was during the 1880s, that the Impressionists gained infamy
as a group of artists whose methods were based primarily on outdoor painting (House,
1986). By 1880 there was a distinctive shift in Monet‟s focus, when he began to view raw
nature as a subject worth painting (House, 1986), trying to capture it in its entirety.
Mirbeau, a friend of Monet‟s, wrote an essay in 1889 to catalogue his accounts. Monet
was aware of the instantaneity of the atmospheric and lighting effects since each “effect
lasts for barely thirty minutes” so that “Every day at the same hour, for the same number
of minutes, in the same light…he would come back to his motif”. From observing
Monet‟s techniques, Mirbeau concluded that “The open air is his only studio” (Mirbeau,
1889).

76
Monet took great pleasure in relaying the hardships that he had endured in order to paint
his outdoor scenes. Geffroy observed Monet painting in oilskins with his easel fastened to
the rocks on Belle-Isle in 1886, and after watching him wrote “The painter goes to his
work as if going into battle” (Geffroy, 1897). Thus, whilst working outdoors, Monet was
at the mercy of the transitory effects of the elements (House, 1986). Monet would wait
for the disappearing effects to reappear, “halting his brush when the scene before him
changed, placing the uncompleted canvas at his feet” (Le Roux, 1889).
Reputation and pride meant a great deal to Monet, and so he profusely maintained that he
was an artist who began and finished his work in front of the subject (House, 1986).
However, the multitude of problems that he faced whilst trying to complete his paintings
left him no choice but to alter his methods from those which he professed (House, 1986).
During the 1880s, Monet would still try to finish his work outdoors, yet he increasingly
began to „look over‟ and even rework some of his canvases at home before exhibiting
them (House, 1986). However, this retouching was not a new development, as some may
think, as he wrote to de Bellio of a painting that he sold to him in the December of 1877;
I told you that I wanted to retouch it before giving it to you, and since
then I‟ve been bothered by so many things that I have not found a
moment‟s quiet to do this little task (Wildenstein, 1974).
Therefore, based on this, it seems fair to assume that Monet conducted reworkings in his
studio throughout the 1870s, primarily when outdoor conditions prevented him from
completing his work on the spot (House, 1986). In addition, there are paintings from the

77
1870s with surfaces that have been obviously reworked. This would imply that they had
been elaborated or revised in some way, which suggests that some alterations took place
in the studio (Le Roux, 1889).
The atmosphere and the effects of light had always fascinated Monet, but it was only in
1890 that this particular subject matter took precedence over physical objects (House,
1986). All of the physical objects that he chose were absorbed into and transformed by
the surrounding atmosphere (Taylor, 1995). At this point in his career Monet became
obsessed with trying to capture the effect that the whole scene created. It was around this
time that he also began to work increasingly on several versions of the same image,
which meant that he was working nearly exclusively on series of paintings by the 1890s.
3.5. Monet’s series paintings
Grain Stacks Series Rouen Cathedral Series London Series
Number of paintings 15 30 94
Years of production 1890-1891 1892-1894 1899-1905 Table 3.1 Monet‟s series paintings
The series of the Grain Stacks as well as Rouen Cathedral present a sequence from
sunrise to sunset, showing the variations of light and its effects on the forms of the stacks
and the cathedral.
During the 1890s, Monet began to regularly date his paintings with the year of
completion. The fifteen scenes that constitute the Grain Stacks Series were all dated 1891
(House, 1986), even though the summer effects among them were all begun during the
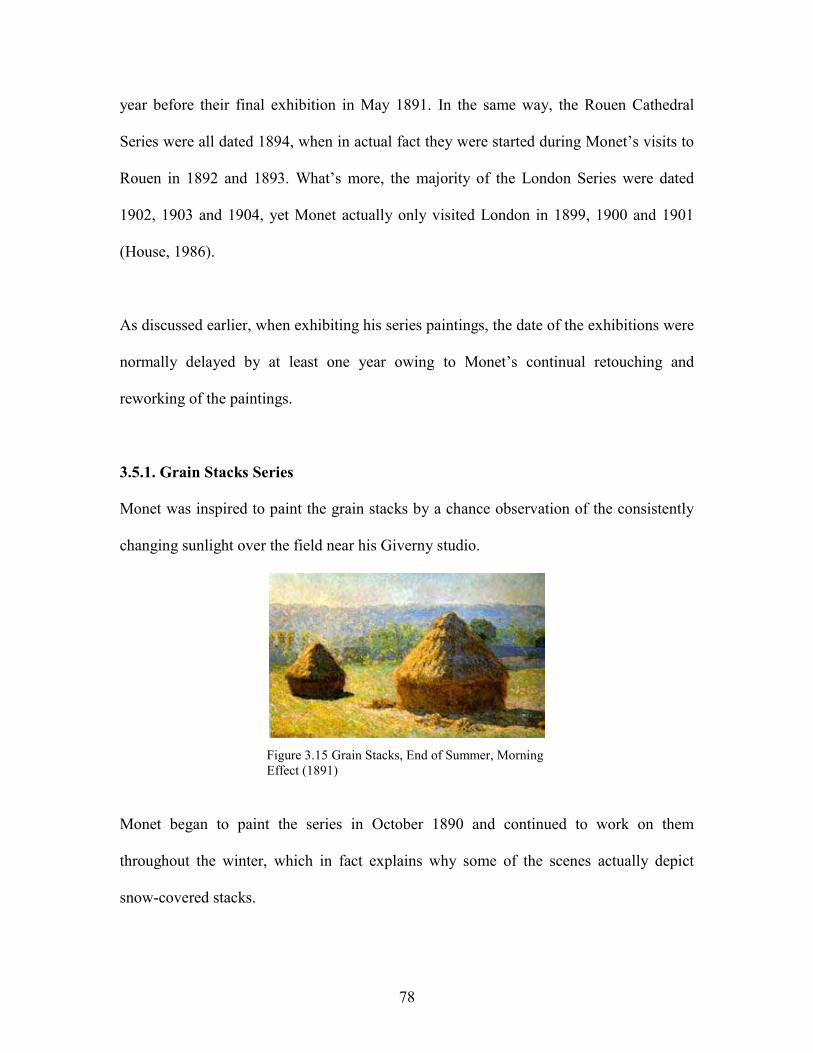
78
year before their final exhibition in May 1891. In the same way, the Rouen Cathedral
Series were all dated 1894, when in actual fact they were started during Monet‟s visits to
Rouen in 1892 and 1893. What‟s more, the majority of the London Series were dated
1902, 1903 and 1904, yet Monet actually only visited London in 1899, 1900 and 1901
(House, 1986).
As discussed earlier, when exhibiting his series paintings, the date of the exhibitions were
normally delayed by at least one year owing to Monet‟s continual retouching and
reworking of the paintings.
3.5.1. Grain Stacks Series
Monet was inspired to paint the grain stacks by a chance observation of the consistently
changing sunlight over the field near his Giverny studio.
Figure 3.15 Grain Stacks, End of Summer, Morning
Effect (1891)
Monet began to paint the series in October 1890 and continued to work on them
throughout the winter, which in fact explains why some of the scenes actually depict
snow-covered stacks.
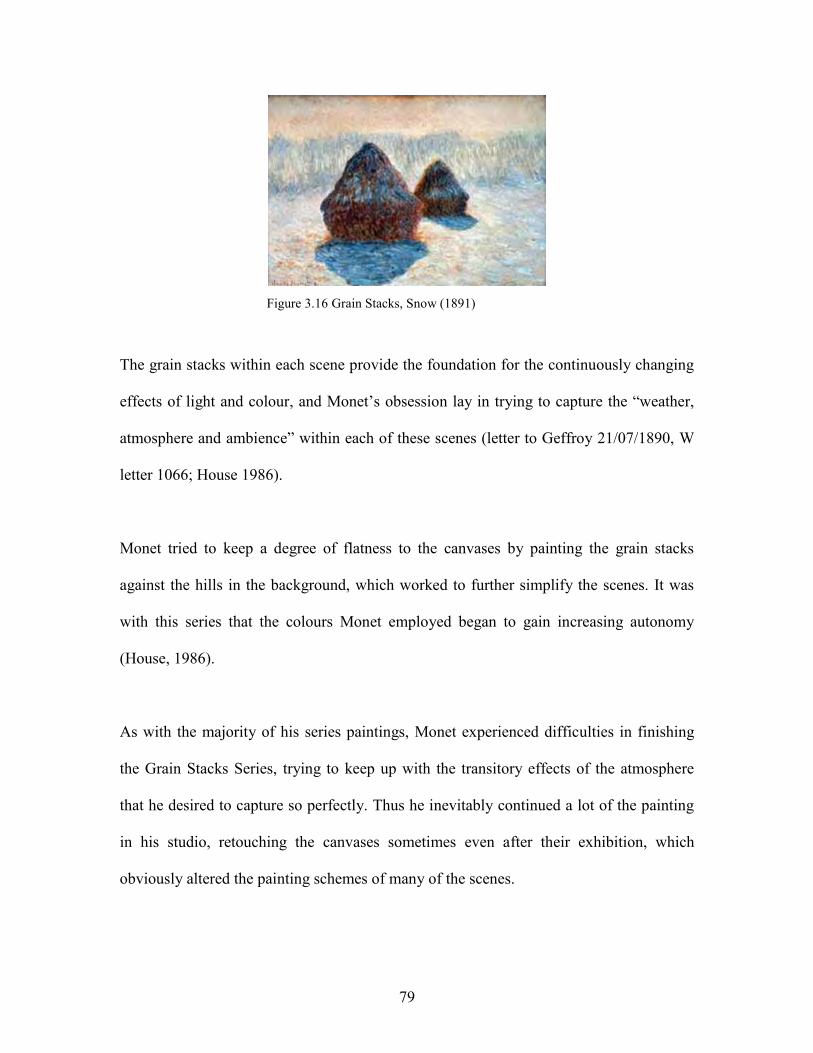
79
Figure 3.16 Grain Stacks, Snow (1891)
The grain stacks within each scene provide the foundation for the continuously changing
effects of light and colour, and Monet‟s obsession lay in trying to capture the “weather,
atmosphere and ambience” within each of these scenes (letter to Geffroy 21/07/1890, W
letter 1066; House 1986).
Monet tried to keep a degree of flatness to the canvases by painting the grain stacks
against the hills in the background, which worked to further simplify the scenes. It was
with this series that the colours Monet employed began to gain increasing autonomy
(House, 1986).
As with the majority of his series paintings, Monet experienced difficulties in finishing
the Grain Stacks Series, trying to keep up with the transitory effects of the atmosphere
that he desired to capture so perfectly. Thus he inevitably continued a lot of the painting
in his studio, retouching the canvases sometimes even after their exhibition, which
obviously altered the painting schemes of many of the scenes.

80
The importance of displaying the Grain Stacks as a series was emphasised by Monet
himself, as he believed that the paintings would “only acquire their value by the
comparison and succession of the entire series” (Bijvanck, 1892).
The work that Monet carried out during the 1890s can be traced back to experiments he
conducted with the use of colour, tone and texture during the 1880s. As Monet‟s series
paintings were primarily concerned with capturing the colour variations within the same
scene under different lighting conditions, Monet appeared to become progressively more
analytical towards the application of colour in his paintings (Kemp, 1990). Yet all of this
experimentation did not completely prepare him for the immense task that he undertook
by making the atmosphere the focus of all of his paintings.
3.5.2. Rouen Cathedral Series
Monet first visited Rouen in order to organise his half sister‟s estate after she died very
suddenly. However, it was whilst he was staying in Rouen that Monet discovered the
cathedral; inspiring him to return to Rouen in order to paint two panoramic views of the
scene, neither of which he managed to finish.
As with most of the painting he conducted away from home, Monet kept his wife, Alice,
regularly informed of his progress with the series. The content of the letters that he sent
to Alice ranged from elation at having found a subject to paint, through to complaints
about the weather during his stay. These changes in the weather were actually quite
beneficial to Monet, as during the grey days he was able to concentrate on his grey-toned
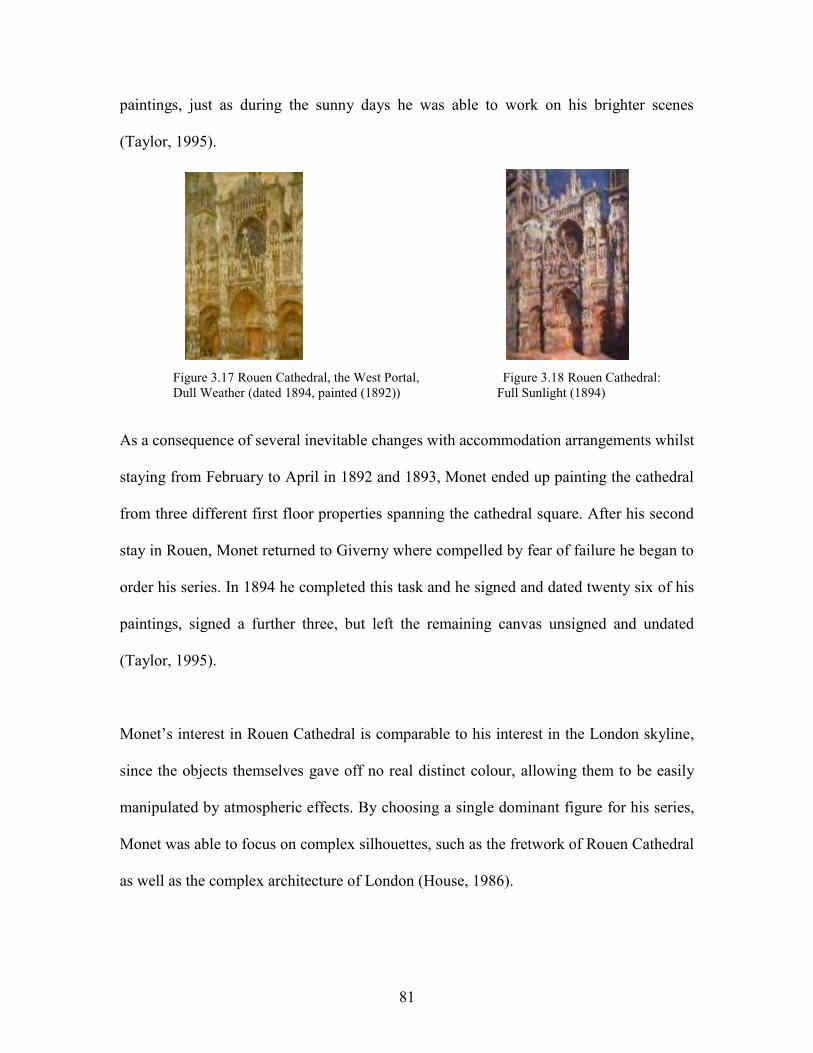
81
paintings, just as during the sunny days he was able to work on his brighter scenes
(Taylor, 1995).
Figure 3.17 Rouen Cathedral, the West Portal, Figure 3.18 Rouen Cathedral: Dull Weather (dated 1894, painted (1892)) Full Sunlight (1894)
As a consequence of several inevitable changes with accommodation arrangements whilst
staying from February to April in 1892 and 1893, Monet ended up painting the cathedral
from three different first floor properties spanning the cathedral square. After his second
stay in Rouen, Monet returned to Giverny where compelled by fear of failure he began to
order his series. In 1894 he completed this task and he signed and dated twenty six of his
paintings, signed a further three, but left the remaining canvas unsigned and undated
(Taylor, 1995).
Monet‟s interest in Rouen Cathedral is comparable to his interest in the London skyline,
since the objects themselves gave off no real distinct colour, allowing them to be easily
manipulated by atmospheric effects. By choosing a single dominant figure for his series,
Monet was able to focus on complex silhouettes, such as the fretwork of Rouen Cathedral
as well as the complex architecture of London (House, 1986).
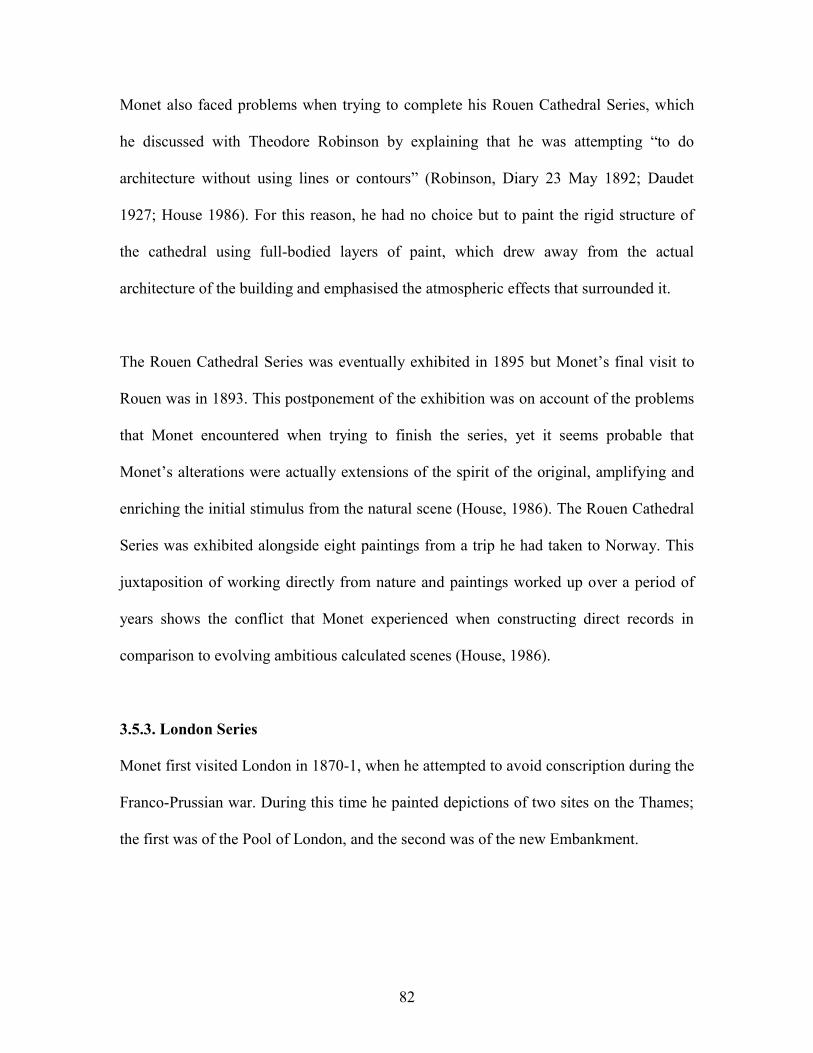
82
Monet also faced problems when trying to complete his Rouen Cathedral Series, which
he discussed with Theodore Robinson by explaining that he was attempting “to do
architecture without using lines or contours” (Robinson, Diary 23 May 1892; Daudet
1927; House 1986). For this reason, he had no choice but to paint the rigid structure of
the cathedral using full-bodied layers of paint, which drew away from the actual
architecture of the building and emphasised the atmospheric effects that surrounded it.
The Rouen Cathedral Series was eventually exhibited in 1895 but Monet‟s final visit to
Rouen was in 1893. This postponement of the exhibition was on account of the problems
that Monet encountered when trying to finish the series, yet it seems probable that
Monet‟s alterations were actually extensions of the spirit of the original, amplifying and
enriching the initial stimulus from the natural scene (House, 1986). The Rouen Cathedral
Series was exhibited alongside eight paintings from a trip he had taken to Norway. This
juxtaposition of working directly from nature and paintings worked up over a period of
years shows the conflict that Monet experienced when constructing direct records in
comparison to evolving ambitious calculated scenes (House, 1986).
3.5.3. London Series
Monet first visited London in 1870-1, when he attempted to avoid conscription during the
Franco-Prussian war. During this time he painted depictions of two sites on the Thames;
the first was of the Pool of London, and the second was of the new Embankment.
83
It is thought that Monet‟s living conditions in London in 1870-1 must have been fairly
meagre, and that he was quite possibly living on the outskirts of the city, just like his
fellow friend Pissarro had when he boarded in Norwood during his visit to England
(Taylor, 1995).
After his first visit, Monet planned to return to London to continue his painting; but he
did not manage this return trip until the autumn of 1899. This is when he began his
London Series. It was over thirty years after Monet had started his painting career that he
approached his painting style in a slightly different way, starting with this particular
series. Jules-Antoine Castagnary described Monet‟s new technique of painting as
painting “not the landscape but the sensation produced by the landscape” (Castagnary,
1874).
On his return to London, Monet was a much more affluent artist, and thus could afford to
travel and lodge in luxury. Nothing made this more apparent than Monet‟s stay at the
Savoy Hotel, which was then regarded as one of the most luxurious hotels in the world
(Taylor, 1995).
In 1899, Monet started to paint scenes of Charing Cross Bridge. He included Cleopatra‟s
Needle in two of his earlier sketches; but he failed to include it in the remainder of his
paintings. It is thought that Monet may have felt that the needle actually split the scene in
two (Reed, 1998). As Monet was staying in the Savoy Hotel, he painted views looking

84
east across Waterloo Bridge and the South Bank, as well as south towards Charing Cross
Bridge and the Houses of Parliament.
Monet then returned to London for the third time in 1900, and as he began work on
February 11th
, he had in mind to stick to a strict painting regime. Daily work was to start
from the Savoy Hotel concentrating on Waterloo Bridge in the early morning sun,
moving on to work on Charing Cross Bridge in the midday to early afternoon sun. Monet
then moved his viewing position to St. Thomas‟s Hospital to paint the Houses of
Parliament at sunset (Thornes and Metherell, 2003). In Monet‟s images of Waterloo
Bridge he chose to include the vast industrialised area east of the bridge, in his scenes, as
he enjoyed the smoke produced by the factories, and would often complain when they did
not produce it (Reed, 1998). When Monet began to study the Houses of Parliament, he
would always paint in the afternoon to ensure that the scenes were as misty as they could
possibly be, as well as being able to incorporate the setting sun behind the buildings. The
mist levels during the afternoon could be attributed to the amalgamation of the smoke
pumped out by all of the factories since opening that morning.
In 1901, Monet made his fourth and final trip to London to continue work on his series,
commenting on the “black, brown, yellow, green, purple fogs” (Bullet, 1901). As
previously discussed, it was London‟s mist and fog which Monet commonly referred to
as „l‟enveloppe‟ that he fondly remembered London for. It was for this reason that Monet
only seemed to paint in London during the winter months, as it was only through these
winter fogs that Monet viewed London as “a beautiful city” (Gimpel, 1963).
85
From studying Monet‟s various paintings of London, it is apparent that he found it
difficult to depict the scenes in just one or two scenes. Since the subject that Monet was
trying to capture was so variable, he was unable to successfully paint them directly which
greatly frustrated him. For example, Monet would begin to paint a scene of the Houses of
Parliament during the afternoon, and come the next day the weather conditions would
have changed so considerably that he would not be able to continue to work on that
particular painting. Since this was the case with so many of the scenes that Monet began,
he retrieved the canvases that he had started in 1900 on the same day during the
following visit in 1901, in the hope that the position of the sun and atmospheric
conditions would be similar enough to continue work on some of them. Hence, even
though painting in London was planned in advance, it was nevertheless postponed on
many occasions because of the weather.
It is known that Monet would write letters to his wife almost every day, each containing
meticulous details regarding the weather in London and how this weather would in turn
affect his work schedule. As well as writing with such regularity to his wife, Monet also
bestowed many letters upon his friends, such as Paul Durand-Ruel and Gustave Geffroy,
which also contained various descriptions of the weather.
The main objective for Monet‟s London Series was to try and capture the effects of the
fogs and mist. Therefore these scenes were regarded as contre-jour, which translates into
„against the light‟, with the sun only visible through the fogs. This ultimately filled the
atmosphere with colour and thus reduced the forms of silhouettes in the paintings (House,

86
1986). Approaching his work in this way shows that Monet tried to capture the
meteorological situation of London, and possibly also tried to capture some degree of the
climatological condition of London as well. Whether he did this inadvertently or
intentionally, only further research will show.
Monet eventually completed his London Series, producing 94 paintings in total; 34 of
Charing Cross Bridge, 41 of Waterloo Bridge and 19 of the Houses of Parliament (Reed,
1998).

87
CHAPTER 4: Methods
4.1. Introduction
Of the ninety four paintings that make up Monet‟s London Series, only fourteen paintings
have the sun directly depicted in the scene. This selection of paintings consists of nine
paintings of the Houses of Parliament, four of Waterloo Bridge and one of Charing Cross
Bridge. These paintings of Waterloo Bridge and Charing Cross Bridge, along with
another three paintings of Charing Cross Bridge where the position of the sun has been
inferred within the scene, have been analysed within this study.
The method that is being employed for the purpose of this study incorporates quantitative
approaches. The content, geometry and meteorological representations of Monet‟s
London Series will be investigated. In order to complete this analytical approach, the
solar position of the Waterloo Bridge and Charing Cross Bridge paintings will be
established which in turn will enable the derivation of the dates and times of the
execution of these paintings.
4.2. Research design
The purpose of the quantitative analysis is to deconstruct Monet‟s London Series through
examining the content, geometry and meteorology contained within each painting. The
final part of the quantitative analysis will introduce work previously conducted by Baker
and Thornes (2006) with respect to the solar geometry of the Houses of Parliament
paintings from Monet‟s London Series. This section is in essence a continuation of the
work started in 2006 to include paintings of Waterloo Bridge and Charing Cross Bridge.

88
A method derived with the help of Prof. Donald W. Olson is also being utilised in the
quantitative analysis of the paintings. A step-by-step guide of this method is given below.
1. Select the paintings that have a direct representation of the sun or one that can be
inferred within the scene.
2. Identify the structures that are visible within each painting, and measure their heights
directly from the reproductions in Wildenstein (1974-1985).
3. Measure the distances between the Savoy Hotel and the respective structures from
the 1897 map of London (Figure 5.3).
4. Measure the azimuthal angle clockwise from the Savoy Hotel to each pier of the
respective bridge of the scene being analysed.
5. Use the position of the sun in the painting with respect to the piers of the bridge, the
azimuthal angle of the sun is determined.
6. Use the derived height of Monet on the fifth floor of the Savoy Hotel (see Section
5.3. „Waterloo Bridge‟), the height of a structure within the scene and the distance
between the Savoy Hotel and the structure, the elevation of the structure above
Monet‟s viewing position is determined.
7. Repeat this for each visible structure within the painting.
8. Use the derived angles of elevation along with the measured heights of the structures
in the painting to determine a vertical degree to millimetre ratio for each structure.
9. Use the azimuthal angles of the bridge piers with the measured distances between the
piers in the painting to determine a horizontal degree to millimetre ratio for each pier.
10. Calculate an average using all ratios within the scene.

89
11. Measure the distance of the sun above a structure in the painting and use the
averaged ratio to determine the elevation of the sun above the structure. Add this
elevation to the known elevation of the structure.
12. Repeat this for all visible structures within the painting.
13. Calculate an average using all solar elevations within the scene.
14. The average solar elevation and solar azimuth (see step 5) are entered into a
computer program and the output is the „best fit‟ elevations and azimuths with
corresponding dates and times.
This method can be employed for all of the selected Waterloo Bridge and Charing Cross
Bridge paintings; hence the date and time that Monet painted each scene can be estimated.
This is the ultimate goal for the methodology mentioned so far.
4.3. Quantitative approaches – solar geometry
In 2006, Baker and Thornes conducted a study primarily focusing on Monet‟s paintings
of the Houses of Parliament from his London Series. Therefore, the solar positions have
already been determined for these paintings. Yet, as discussed earlier, the solar positions
for the remaining Waterloo Bridge and Charing Cross Bridge paintings are still unknown,
hence this is one of the goals for this study.
In order to determine the dates and times of production for Monet‟s paintings of Waterloo
Bridge and Charing Cross Bridge, the position of the sun within the painting is very
important. As the solar elevation and solar azimuthal angles are specific for certain days,

90
or a series of days, paintings of Waterloo Bridge and Charing Cross Bridge that contain a
direct or indirect representation of the sun will only be considered in this section.
4.3.1. Waterloo Bridge
For the analysis of the sun‟s position in Monet‟s Waterloo Bridge paintings, there are
eight images that can be used, with most containing numerous structures that can also be
used to give an indication of the elevation within each painting.
Reproductions of the paintings have been retrieved from Wildenstein (1974-1985)
„Claude Monet : biographie et catalogue raisonné 1840-1926‟, and his numbering system
has been utilised for identifying the images. The most promising scenes of Waterloo
Bridge, because of the position of sun, which can be accurately inferred within each
painting; are W1555 (Figure 5.8), W1563 (Figure 5.9), W1565 (Figure 5.10), W1567
(Figure 5.11), W1572 (Figure 5.4), W1573 (Figure 5.5), W1574 (Figure 5.6) and W1575
(Figure 5.7).
The initial scale was derived using the calculated lengths of the piers as a height scale,
which was then combined with the measured heights of the piers in order to produce a
much more refined scale. The known heights of the Watts Shot Tower and the chimney
of the City Sewers were also used in conjunction with the measured heights of the towers
taken from the painting. The average water level of the River Thames at Waterloo Bridge
can be determined to be 1.37 metres from a sounding conducted by the Thames
Conservancy Board for 1895-1901. The locations of the points for which the depths were
91
measured were all along the „near side‟ of Waterloo Bridge that is the side of the bridge
which can be identified as the nearest side to the Savoy Hotel. Using this value for the
water level, the average amount of bridge that would have been visible was 13.57 metres.
Combining the ratio derived using this bridge height compared to the measured heights at
each visible pier of Waterloo Bridge along with the heights for the Watts Shot Tower and
the City Sewers, the heights from the top of Waterloo Bridge to the middle of the sun can
be determined.
An azimuthal scale for each painting can be produced by determining the angles, along
the horizontal plane, from the position of the Savoy Hotel round to the respective
positions of the piers of the bridge included in each scene. A great deal of care is required
when measuring the angles to the bridge piers, as Monet‟s exact position at the Savoy
Hotel comes with an error, thus this will produce an array of angles for each pier with
respect to each painting.
4.3.2. Charing Cross Bridge
There are four paintings of Charing Cross Bridge that appear to depict a representation of
the sun. These paintings are labelled as W1532 (Figure 5.25), W1536 (Figure 5.28),
W1537 (Figure 5.31) and W1554 (Figure 5.22) by Wildenstein, and the sun either
appears to be partially or completely included in these scenes. The majority of these
paintings contain depictions of Charing Cross Bridge, Westminster Bridge, Big Ben and
Victoria Tower, which will all be used to help determine an elevation scale. Three

92
different scales can be derived using the heights of Westminster Bridge, Big Ben and
Victoria Tower, respectively, and will be combined to produce a much more refined scale.
The average water level at Westminster Bridge was again determined to be 1.37 metres
from the 1895-1901 sounding. Hence the average amount of bridge that would have been
visible was 9.60 metres. The ratio derived using the bridge height compared to the
measured height of the bridge in the painting will be used in conjunction with the scales
derived using the relative heights of Big Ben and Victoria Tower, thus the heights from
the top of Westminster Bridge to the middle of the sun can be determined.
An azimuthal scale for each painting of Charing Cross Bridge can be produced by
determining the angles, along the horizontal plane, from the position of the Savoy Hotel
round to the respective positions of the piers of the bridge included in the scene. As with
the paintings of Waterloo Bridge, a great deal of care is required when measuring the
angles to the bridge piers, on account of the error that comes with Monet‟s position at the
Savoy Hotel, so this will result in an array of angles for each pier with respect to each
painting.
During this study, a mutual working relationship with Prof. Donald W. Olson and his
team at Texas State University has developed. Prof. Donald W. Olson recommended a
method that can be used in conjunction with the previously discussed scaling methods for
the Waterloo Bridge and Charing Cross Bridge paintings. Ultimately a much more
93
refined method for deriving the dates and times of production for Monet‟s paintings has
been achieved.
4.3.3. Waterloo Bridge
The method designed by Prof. Donald W. Olson is going to be used with respect to the
eight paintings of Waterloo Bridge; W1555 (Figure 5.18), W1563 (Figure 5.19), W1565
(Figure 5.20), W1567 (Figure 5.21), W1572 (Figure 5.12), W1573 (Figure 5.15), W1574
(Figure 5.16) and W1575 (Figure 5.17).
The landmarks visible within the Waterloo Bridge scenes are Waterloo Bridge, the Watts
Shot Tower, the City Sewers Tower and the Waterloo Flour Mill. The structures will be
utilised for this method, and the elevations from Monet on the fifth floor of the Savoy
Hotel to the respective visible landmarks will be calculated. The azimuthal angles for the
location of the Watts Shot Tower, the City Sewers Tower and the Waterloo Flour Mill
will also be derived. These sets of angles can be used to establish a scale, which will then
be used to convert the height of the sun, measured above Waterloo Bridge and above the
City Sewers Tower, to give an average altitude.
As previously mentioned, the azimuthal scale for the painting is produced by determining
the angles from the Savoy Hotel round to the identified piers of Waterloo Bridge, the
Watts Shot Tower, the chimney of the City Sewers and the Waterloo Flour Mill.
94
4.3.4. Charing Cross Bridge
It will be shown that a true representation of the sun is not visible in the paintings
labelled W1532 (Figure 5.25), W1536 (Figure 5.28) and W1537 (Figure 5.31), only what
seems to be the outer edges of the sun‟s glow. Therefore, the precise location and thus
elevation of the sun cannot be determined for these three paintings. A program from the
Astronomical Applications Department of the U.S. Naval Observatory
(http://aa.usno.navy.mil/data/docs/AltAz.php) will be employed to determine the solar
elevation and azimuth for the dates that Monet was residing in London.
Fortunately, the painting of Charing Cross Bridge labelled as W1554 (Figure 5.22),
clearly shows a representation of the sun. This painting also shows the tower of the Lead
Works and the Lion Brewery, so these landmarks can be used to derive a scale which in
turn will be used to derive the solar elevation for this scene.
The azimuthal angle of the speculated position of the sun will be estimated for each
painting; and the angles can be used as a reference point for finding the solar elevation.
4.4. Limitations of research
The main limitation, with respect to the methods employed for the analysis of Monet‟s
Waterloo Bridge and Charing Cross Bridge paintings, is the clarity of the reproductions
of the paintings. Of the eight Waterloo Bridge paintings, only four contain clear
representations of the sun, whilst the sun is only visible in one of the four Charing Cross
Bridge paintings. For the paintings where the exact position of the sun is unclear, a

95
certain degree of assumption and approximation is required for the analyses. Finally, at
the beginning of the analysis, it was thought that the unknown date of production for all
of the paintings would be a limitation, but through the quantitative methods employed;
approximate dates and times for each painting can be derived.
4.5. Summary and final comments
Throughout his career, Monet painted most of his scenes for himself, trying to capture the
beauty of the moment that he had seen and that had initially inspired him. When Monet
first saw the Grain Stacks and the continuously changing effects of the light and colour,
his obsession with trying to capture the “weather, atmosphere and ambience” began
(letter to Geffroy 21/07/1890, W letter 1066; House 1986).
The second stage of analysis was with respect to the solar elevations depicted in the eight
chosen paintings of Waterloo Bridge and the four paintings of Charing Cross Bridge.
Once the position of the sun was determined within each painting, an approximate date
and time of production could be derived. Dates were estimated for the paintings using a
two pronged approach. Firstly, the position of the sun was estimated for each painting
with respect to the average water level of the River Thames. Then secondly the known
elevations of the landmarks depicted within each scene were used to estimate the
elevation of the sun in the paintings.
Monet stayed in London for a number of months each year, from 1899 to 1901, whilst he
was painting his London Series. His three visits were as follows.
96
1899: Monet left France on or about September 15th
(Wildenstein, 1985), and stayed in
London until the end of October or early November. During this time Monet stayed in a
sixth floor suite at the Savoy Hotel.
1900: Monet started work on February 11th
with the intention to keep to a rigid painting
regime. As aforementioned, Monet would start to work in the early morning on canvases
of Waterloo Bridge, and then at midday he would turn his attention to Charing Cross
Bridge. Later on Monet would move from the Savoy Hotel to St. Thomas‟s Hospital in
order to paint the Houses of Parliament at sunset (Thornes and Metherell, 2003). Monet
set off for his return to France in early April. During this stay, and again in 1901, Monet
resided in a fifth floor suite at the Savoy Hotel.
1901: Monet left for England on January 23rd
. But it is documented that he had to wait for
his crates of paintings to arrive, and so did not start to work on his series until February.
However, during this wait, Monet began working on a few pastel drawings, which he
could have later turned into painted canvases. On March 10th
, Monet started to show
signs of illness, which placed a major hindrance on his work until he left England at the
end of March (Wildenstein, 1985).

97
CHAPTER 5: The Savoy Hotel
5.1. Monet’s residence at the Savoy Hotel
Monet resided in the much revered Savoy Hotel during his trips to London in 1899, 1900
and 1901. The view from Monet‟s position on the sixth floor of the Savoy Hotel, had
Waterloo Bridge to the left, downstream, and Charing Cross Bridge to the right, upstream.
In the distance beyond Charing Cross Bridge, the Houses of Parliament were visible.
However, it was not until Monet‟s return to London in the February of 1900, that he
decided to include the Houses of Parliament as another motif in his London Series
(Seiberling, 1988). On his return in 1900, Monet discovered that the entire sixth floor of
the hotel had been dedicated to soldiers of the Boer War, as per Princess Louise‟s request
(Wildenstein, 1974-85). Therefore, during this visit and again in 1901, Monet continued
work on his series from a suite on the fifth floor. After painting from this vantage point
for some time, Monet managed to negotiate permission to paint from a viewing position
at St Thomas‟s Hospital (Taylor, 1995), in order to be able to paint the Houses of
Parliament in more detail. Monet began sketching on that very spot on February 13th
(Wildenstein, 1974-85) and continued working from St Thomas‟s Hospital until the end
of March 1901.
There have been differing opinions regarding Monet‟s precise viewing position on the
sixth and fifth floors of the Savoy Hotel during his stays in 1899, 1900 and 1901. Many
art historians believe that Monet resided in the same suite as Whistler did in 1896, which
would imply that both artists stayed in the corner suite on the sixth floor.
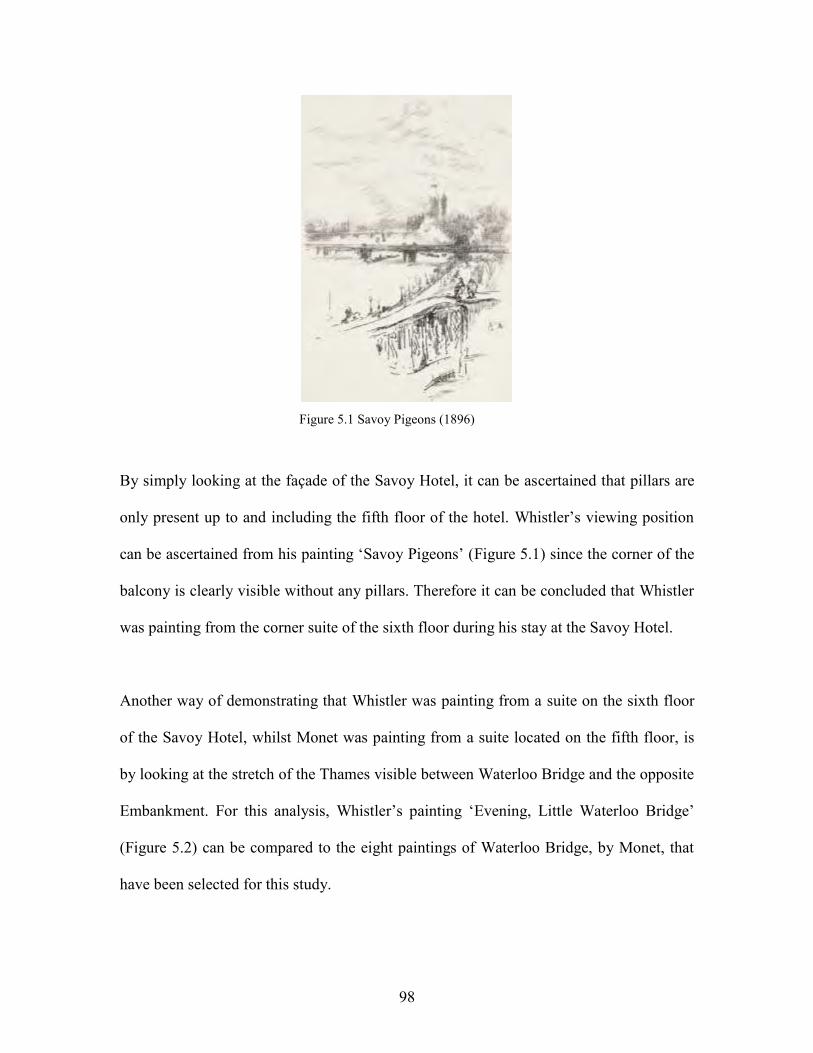
98
Figure 5.1 Savoy Pigeons (1896)
By simply looking at the façade of the Savoy Hotel, it can be ascertained that pillars are
only present up to and including the fifth floor of the hotel. Whistler‟s viewing position
can be ascertained from his painting „Savoy Pigeons‟ (Figure 5.1) since the corner of the
balcony is clearly visible without any pillars. Therefore it can be concluded that Whistler
was painting from the corner suite of the sixth floor during his stay at the Savoy Hotel.
Another way of demonstrating that Whistler was painting from a suite on the sixth floor
of the Savoy Hotel, whilst Monet was painting from a suite located on the fifth floor, is
by looking at the stretch of the Thames visible between Waterloo Bridge and the opposite
Embankment. For this analysis, Whistler‟s painting „Evening, Little Waterloo Bridge‟
(Figure 5.2) can be compared to the eight paintings of Waterloo Bridge, by Monet, that
have been selected for this study.
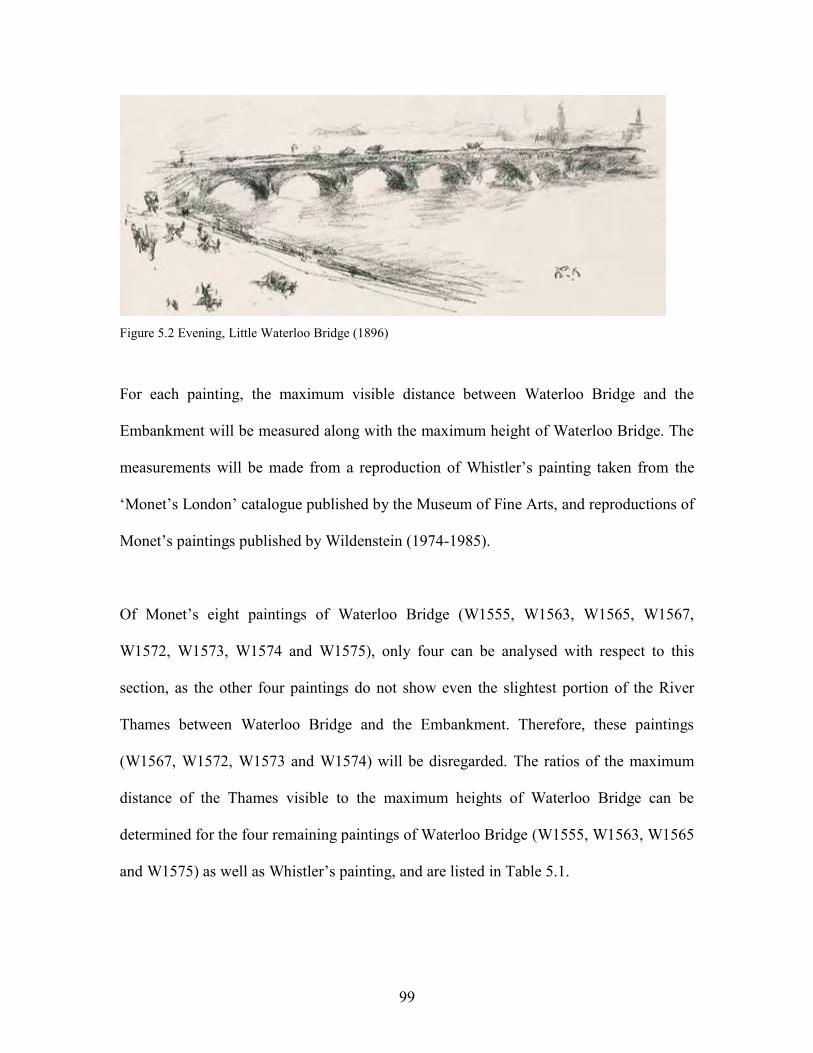
99
Figure 5.2 Evening, Little Waterloo Bridge (1896)
For each painting, the maximum visible distance between Waterloo Bridge and the
Embankment will be measured along with the maximum height of Waterloo Bridge. The
measurements will be made from a reproduction of Whistler‟s painting taken from the
„Monet‟s London‟ catalogue published by the Museum of Fine Arts, and reproductions of
Monet‟s paintings published by Wildenstein (1974-1985).
Of Monet‟s eight paintings of Waterloo Bridge (W1555, W1563, W1565, W1567,
W1572, W1573, W1574 and W1575), only four can be analysed with respect to this
section, as the other four paintings do not show even the slightest portion of the River
Thames between Waterloo Bridge and the Embankment. Therefore, these paintings
(W1567, W1572, W1573 and W1574) will be disregarded. The ratios of the maximum
distance of the Thames visible to the maximum heights of Waterloo Bridge can be
determined for the four remaining paintings of Waterloo Bridge (W1555, W1563, W1565
and W1575) as well as Whistler‟s painting, and are listed in Table 5.1.

100
Painting Thames visible (mm) Waterloo Bridge (mm) Ratio Ratio in %
W1555 7.5 32.0 1 : 4.3 23.44
W1563 3.0 19.0 1 : 6.3 15.79
W1565 4.0 18.0 1 : 4.5 22.22
W1575 2.0 13.0 1 : 6.5 15.38
Whistler 7.5 18.0 1 : 2.4 41.66 Table 5.1 Ratios of the depths of the River Thames to the heights of Waterloo Bridge
As can be seen from Table 5.1, the ratios for Whistler‟s painting are almost double the
values derived for Monet‟s paintings of Waterloo Bridge. That is Whistler was able to see
a greater amount of the Thames from his position at the Savoy Hotel than Monet could. It
is also worth recalling at this stage that Whistler was in fact painting from a corner suite
on the sixth floor, but had he been situated in a suite more central to the façade of the
hotel, similar to the position that Monet had occupied, Whistler‟s view of the Thames
between Waterloo Bridge and the Embankment would have been even greater.
During a trip to the Savoy Hotel on 31st October 2006, Susan Scott, the hotel‟s curator,
divulged some very interesting information regarding Monet‟s viewing position in 1900
and 1901. Susan Scott adamantly stated that Monet stayed in a suite in the middle of the
fifth floor and it is thought that he slept in room 510 and painted in room 511. An
alteration in the numbering system of the rooms at the Savoy Hotel has resulted in the
sequence of increasing room numbers changing from one direction to the other.
Since the Savoy Hotel played such an important role in Monet‟s visits to London it seems
appropriate to investigate the area of Westminster surrounding the hotel and the bridges.
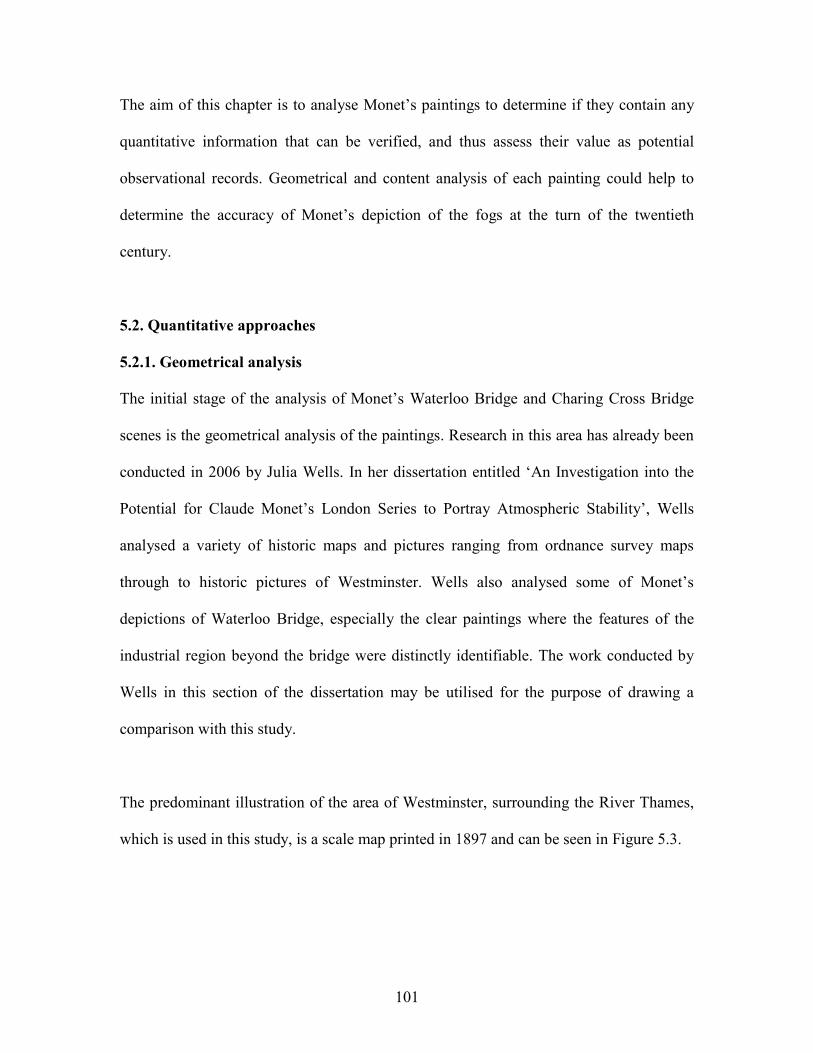
101
The aim of this chapter is to analyse Monet‟s paintings to determine if they contain any
quantitative information that can be verified, and thus assess their value as potential
observational records. Geometrical and content analysis of each painting could help to
determine the accuracy of Monet‟s depiction of the fogs at the turn of the twentieth
century.
5.2. Quantitative approaches
5.2.1. Geometrical analysis
The initial stage of the analysis of Monet‟s Waterloo Bridge and Charing Cross Bridge
scenes is the geometrical analysis of the paintings. Research in this area has already been
conducted in 2006 by Julia Wells. In her dissertation entitled „An Investigation into the
Potential for Claude Monet‟s London Series to Portray Atmospheric Stability‟, Wells
analysed a variety of historic maps and pictures ranging from ordnance survey maps
through to historic pictures of Westminster. Wells also analysed some of Monet‟s
depictions of Waterloo Bridge, especially the clear paintings where the features of the
industrial region beyond the bridge were distinctly identifiable. The work conducted by
Wells in this section of the dissertation may be utilised for the purpose of drawing a
comparison with this study.
The predominant illustration of the area of Westminster, surrounding the River Thames,
which is used in this study, is a scale map printed in 1897 and can be seen in Figure 5.3.
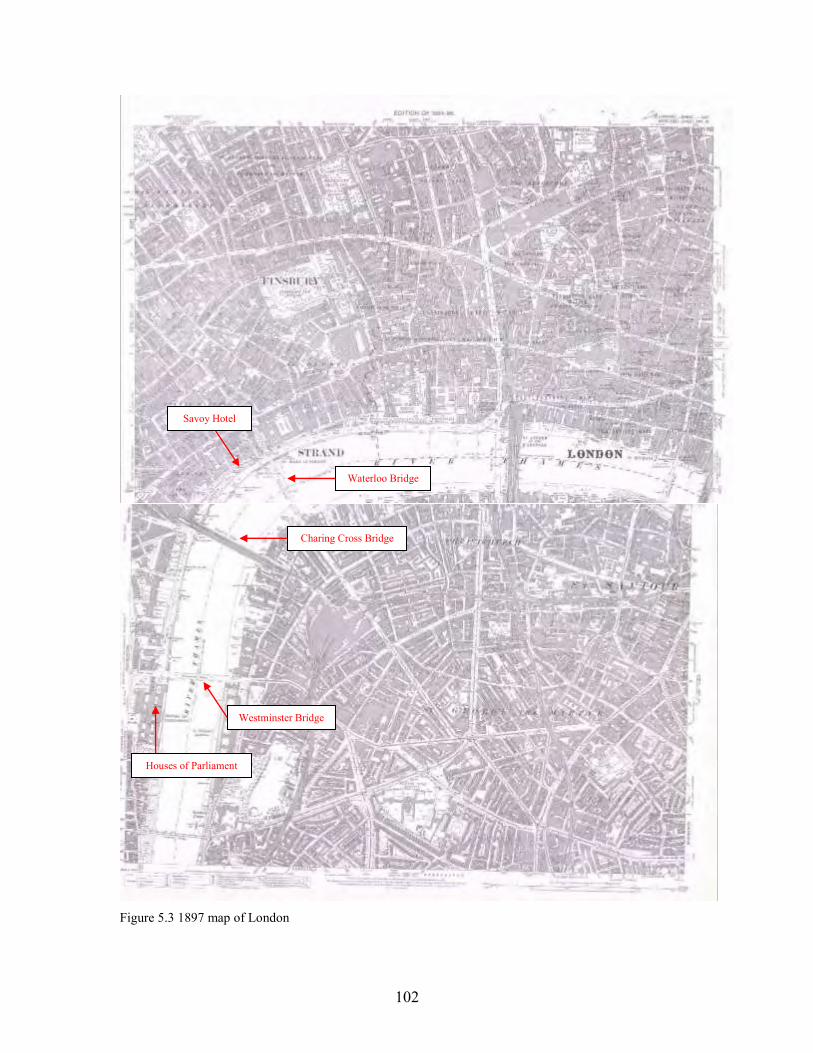
102
Figure 5.3 1897 map of London
Savoy Hotel
Waterloo Bridge
Charing Cross Bridge
Westminster Bridge
Houses of Parliament
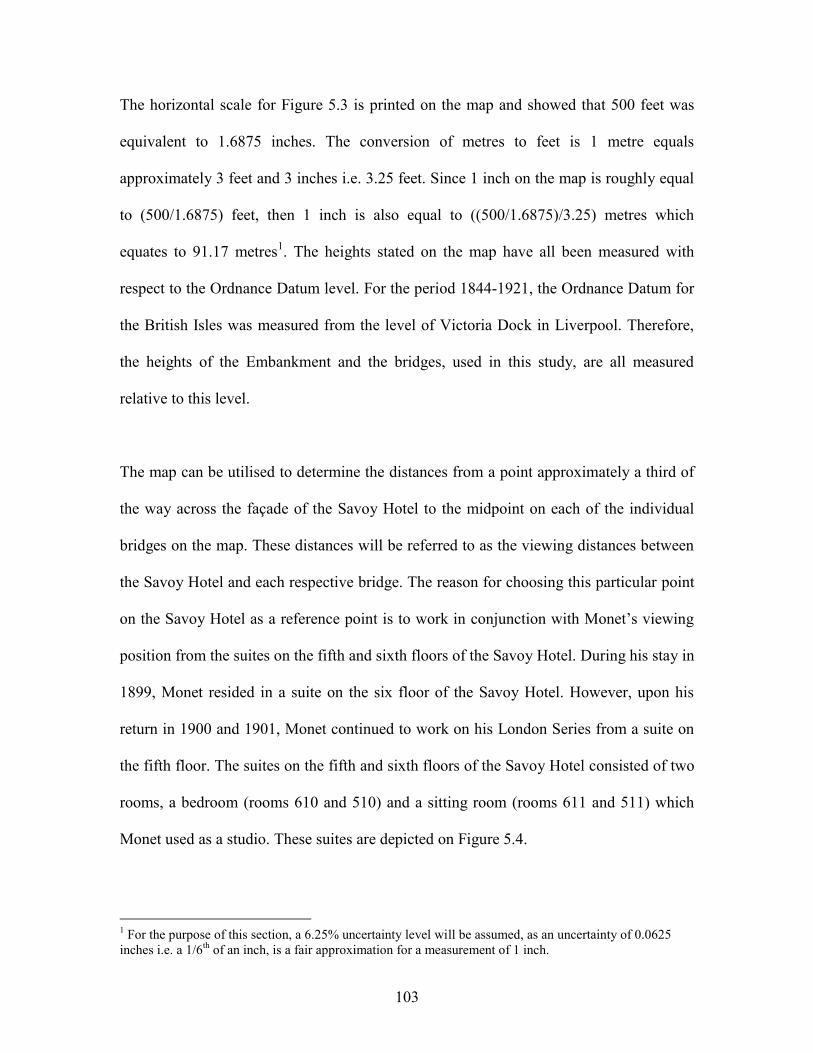
103
The horizontal scale for Figure 5.3 is printed on the map and showed that 500 feet was
equivalent to 1.6875 inches. The conversion of metres to feet is 1 metre equals
approximately 3 feet and 3 inches i.e. 3.25 feet. Since 1 inch on the map is roughly equal
to (500/1.6875) feet, then 1 inch is also equal to ((500/1.6875)/3.25) metres which
equates to 91.17 metres1. The heights stated on the map have all been measured with
respect to the Ordnance Datum level. For the period 1844-1921, the Ordnance Datum for
the British Isles was measured from the level of Victoria Dock in Liverpool. Therefore,
the heights of the Embankment and the bridges, used in this study, are all measured
relative to this level.
The map can be utilised to determine the distances from a point approximately a third of
the way across the façade of the Savoy Hotel to the midpoint on each of the individual
bridges on the map. These distances will be referred to as the viewing distances between
the Savoy Hotel and each respective bridge. The reason for choosing this particular point
on the Savoy Hotel as a reference point is to work in conjunction with Monet‟s viewing
position from the suites on the fifth and sixth floors of the Savoy Hotel. During his stay in
1899, Monet resided in a suite on the six floor of the Savoy Hotel. However, upon his
return in 1900 and 1901, Monet continued to work on his London Series from a suite on
the fifth floor. The suites on the fifth and sixth floors of the Savoy Hotel consisted of two
rooms, a bedroom (rooms 610 and 510) and a sitting room (rooms 611 and 511) which
Monet used as a studio. These suites are depicted on Figure 5.4.
1 For the purpose of this section, a 6.25% uncertainty level will be assumed, as an uncertainty of 0.0625
inches i.e. a 1/6th
of an inch, is a fair approximation for a measurement of 1 inch.

104
5 611610
511510
6
5
4
Figure 5.4 The Savoy Hotel and rooms occupied by Monet in 1899
(6th
floor) and in 1900 and 1901 (5th
floor)
The exact place where Monet stood his easel on the balconies remains unknown and it is
possible that he may have changed his position when facing Charing Cross Bridge to
when he turned towards Waterloo Bridge. Nonetheless, these positions would only have
been within a few metres of each other.
The approximate location of Monet at the Savoy Hotel is required so that the azimuthal
angles measured from Monet‟s viewing position, at the Savoy Hotel, to a variety of
locations identified from the Waterloo Bridge and Charing Cross Bridge paintings, can to
be determined. Figure 5.5 is a magnified section of the previous map (Figure 5.3), with
all of the azimuthal angles highlighted. These angles will be utilised in the analysis of the
paintings selected for the purpose of this study.
105
Figure 5.5 Azimuthal angles of landmarks in Westminster
5.2.2. Waterloo Bridge
By studying the bridge in Figure 5.3 it can be assumed that Waterloo Bridge was
approximately flat in 1897, since three points along the bridge are labelled as 49 feet. The
conversion between feet and meters, is 1 foot equals 0.3048 meters, so this height can be
converted to give 49*0.3048 = 14.9352 meters = 14.94 meters (2 d. p.) The distance from
the Savoy Hotel to the midpoint of Waterloo Bridge is (233.62 ± 5.70) metres.
Pier 1 99°
Pier 2 110°
Pier 3 116°
Pier 4 121°
Pier 5 124°
Watts Shot Tower 114°
City Sewers Chimney 119°
Waterloo Flour Mill 125.5°
Lead Works 143°
Lion Brewery
Pier 1 194°
152°
158.5°
Pier 2 186°
Pier 3 180°
106
5.2.3. Charing Cross Bridge
Charing Cross Bridge (now more commonly known as Hungerford Bridge) has been
extensively altered since 1899/1901 but the original bridge piers are still in place. The
structure that Monet would have seen was a railway bridge that had been opened in 1864
comprising nine spans made of wrought iron lattice girders. Unfortunately, the height of
Charing Cross Bridge is not stated on the map, so for this reason, the Board of Trade plan
of Charing Cross Bridge from 1884 has been used to estimate the height as 12.6 metres.
This plan is included in Appendix 1. The distance from the Savoy Hotel to the midpoint
of Charing Cross Bridge has been determined as (364.68 ± 5.70) metres.
These derived values for the heights of Waterloo Bridge and Charing Cross Bridge will
be used to determine the angle between Monet‟s viewing position on the fifth and sixth
floor of the Savoy Hotel, respectively, and the top of Waterloo Bridge and Charing Cross
Bridge, respectively.
5.2.4. Westminster Bridge
Westminster Bridge was opened in 1862 as a seven-arch wrought iron bridge. The bridge
height has been estimated, from Figure 5.3, to be 36 feet (10.97 metres). The distance
from the Savoy Hotel to the midpoint of Westminster Bridge is (945.89 ± 5.70) metres.
The water levels of the River Thames can be found for the period that Monet was
residing in London. A sounding of the river which was resounded under the direction of
the Thames Conservancy Board for 1895-1901, is held in the archives at the National
107
Maritime Museum. The depths of the River Thames recorded for the sounding are stated
to be the deepest possible depths for the river at the time of recording. The soundings are
in feet, so need to be converted into metres so that the depths can be compared to the
heights of Waterloo Bridge, Charing Cross Bridge and Westminster Bridge.
The locations of the depths to be used for the purpose of this study are taken as the depths
recorded on the near side of the bridges with respect to the Savoy Hotel. Minimum and
maximum water levels are available for each location along the River Thames; so
average water levels can be determined for each of the locations.
5.3. Waterloo Bridge
The geometrical analysis of Monet‟s Waterloo Bridge paintings has only been considered
with respect to the fifth floor of the Savoy Hotel. This decision was made since it is
thought Monet began work on Waterloo Bridge in 1900, whilst residing in a fifth floor
suite at the hotel. Monet continued to work on the Waterloo Bridge paintings in 1901,
again from a viewpoint on the fifth floor.
5.3.1. Fifth floor
In order to begin the geometrical analysis of Monet‟s paintings, the angle of elevation
from ground-level to the fifth floor of the Savoy Hotel needs to be determined. An abney
level was employed to measure the angle from eye level to the window ledge on the fifth
floor of the Savoy Hotel and is determined to be (27.50 ± 0.50)°. The horizontal distance
from the Savoy Hotel to the chosen viewing position was also measured and is equal to

108
(47.30 ± 0.10) metres. The height to eye level (1.60 metres) can be taken into
consideration, so that the height from the ground-level to the window ledge of the fifth
floor can also be ascertained.
Using trigonometry, tan (27.50 ± 0.50) = (a – 1.60) / (47.30 ± 0.10), so a = ((24.62 ± 0.58)
+ 1.60) metres. Therefore, a = (26.22 ± 0.58) metres.
Monet‟s height also has to be considered at this stage. Even though Monet‟s exact height
is not documented, it is thought that he was a man of small stature, so it has been
estimated that the height of Monet‟s eye level was 5 foot and 4 inches. Since the distance
to the window ledge on the fifth floor has already been calculated, and the window ledge
is approximately 1 foot and 6 inches above the floor, then only the difference between
Monet‟s height and the window ledge is used. This height needs to be converted into
metres before it can be included in the calculations, thus 3 foot and 10 inches (3and 5/6
feet) is equal to (3 and 5/6 * 0.3048) = 1.1684 metres. Consequently, this allows the
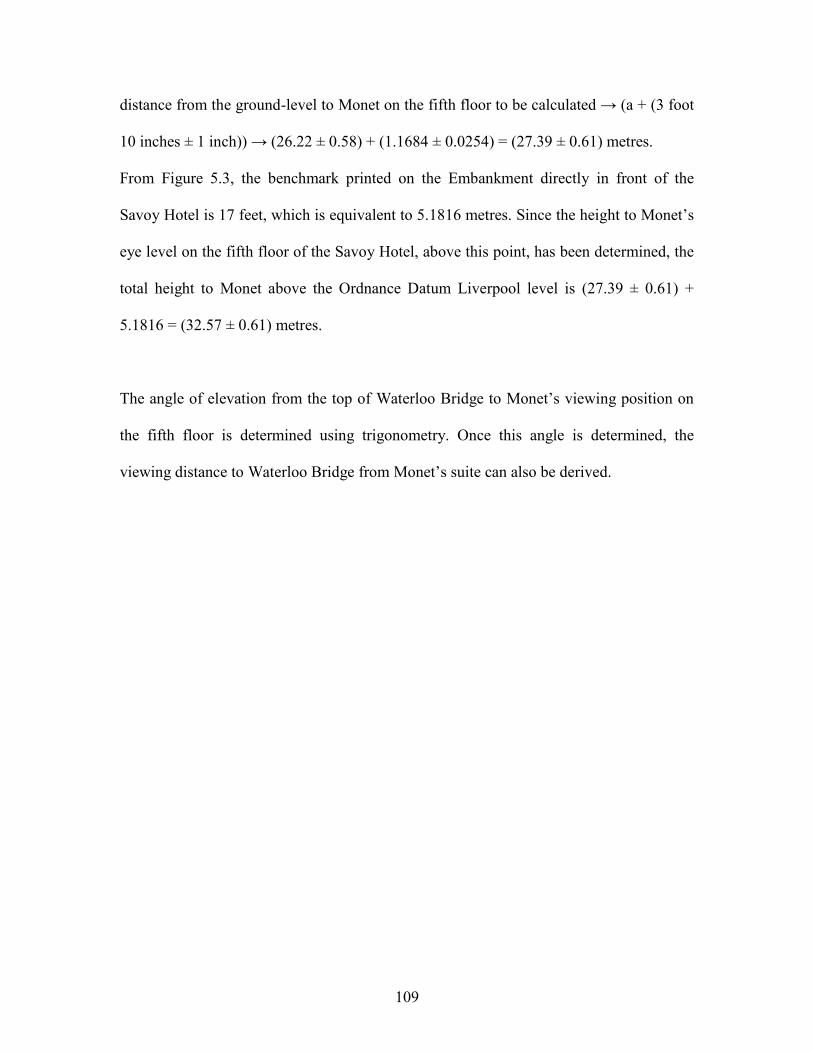
109
distance from the ground-level to Monet on the fifth floor to be calculated → (a + (3 foot
10 inches ± 1 inch)) → (26.22 ± 0.58) + (1.1684 ± 0.0254) = (27.39 ± 0.61) metres.
From Figure 5.3, the benchmark printed on the Embankment directly in front of the
Savoy Hotel is 17 feet, which is equivalent to 5.1816 metres. Since the height to Monet‟s
eye level on the fifth floor of the Savoy Hotel, above this point, has been determined, the
total height to Monet above the Ordnance Datum Liverpool level is (27.39 ± 0.61) +
5.1816 = (32.57 ± 0.61) metres.
The angle of elevation from the top of Waterloo Bridge to Monet‟s viewing position on
the fifth floor is determined using trigonometry. Once this angle is determined, the
viewing distance to Waterloo Bridge from Monet‟s suite can also be derived.
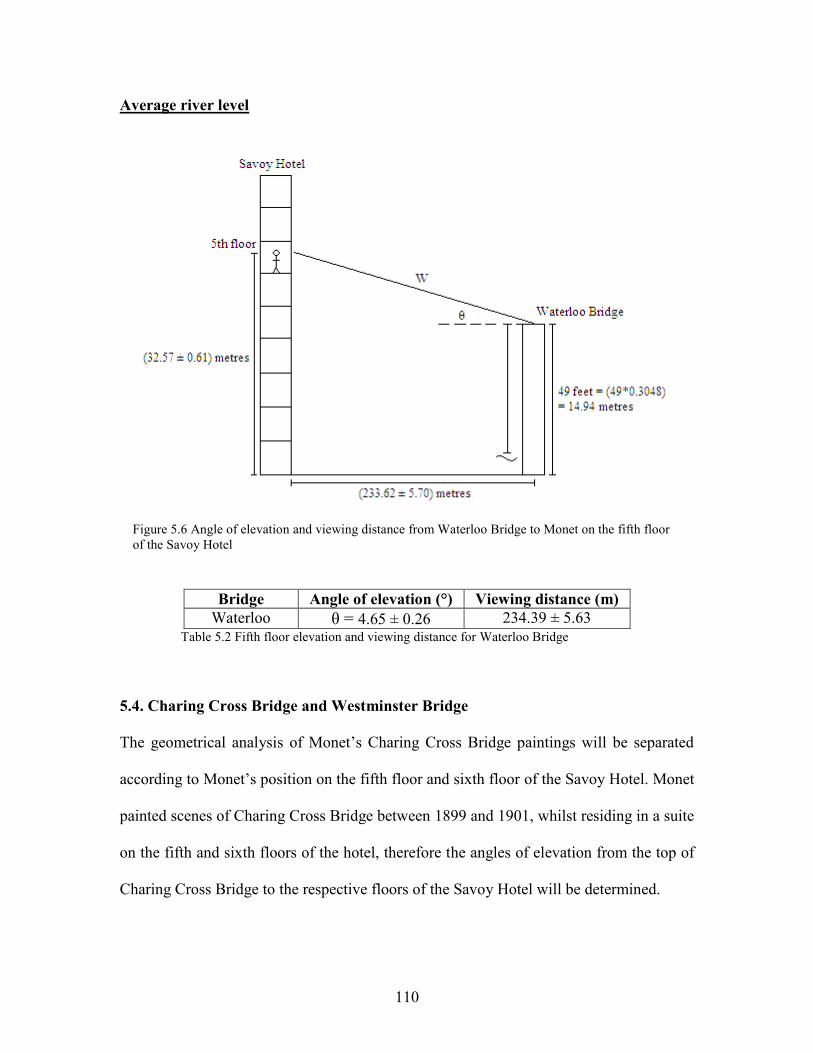
110
Average river level
Figure 5.6 Angle of elevation and viewing distance from Waterloo Bridge to Monet on the fifth floor
of the Savoy Hotel
Bridge Angle of elevation (°) Viewing distance (m)
Waterloo θ = 4.65 ± 0.26 234.39 ± 5.63
Table 5.2 Fifth floor elevation and viewing distance for Waterloo Bridge
5.4. Charing Cross Bridge and Westminster Bridge
The geometrical analysis of Monet‟s Charing Cross Bridge paintings will be separated
according to Monet‟s position on the fifth floor and sixth floor of the Savoy Hotel. Monet
painted scenes of Charing Cross Bridge between 1899 and 1901, whilst residing in a suite
on the fifth and sixth floors of the hotel, therefore the angles of elevation from the top of
Charing Cross Bridge to the respective floors of the Savoy Hotel will be determined.

111
5.4.1. Fifth floor
As discussed earlier, the angle from eye level to the window ledge on the fifth floor of the
Savoy Hotel was determined to be (27.50 ± 0.50)° whilst the horizontal distance from the
Savoy Hotel to the chosen viewing position was measured to be (47.30 ± 0.10) metres.
The height to eye level (1.60 metres) was taken into consideration in order to determine
the height from the ground-level to the window ledge of the fifth floor.
The angles of elevation from the top of Charing Cross Bridge and Westminster Bridge to
Monet‟s viewing position on the fifth floor are determined using trigonometry. Using
these angles the viewing distances to Charing Cross Bridge and Westminster Bridge from
Monet‟s suite can also be derived.

112
Average river level
Figure 5.7 Angles of elevation and viewing distances from Charing Cross Bridge and Westminster Bridge
to Monet on the fifth floor of the Savoy Hotel
Bridge Angle of elevation (°) Viewing distance (m)
Charing Cross θ = 3.35 ± 0.15 c = 365.30 ± 5.65
Westminster θ‟ = 1.39 ± 0.05 w = 946.17 ± 5.68
Table 5.3 Fifth floor elevations and viewing distances for Charing Cross Bridge and
Westminster Bridge
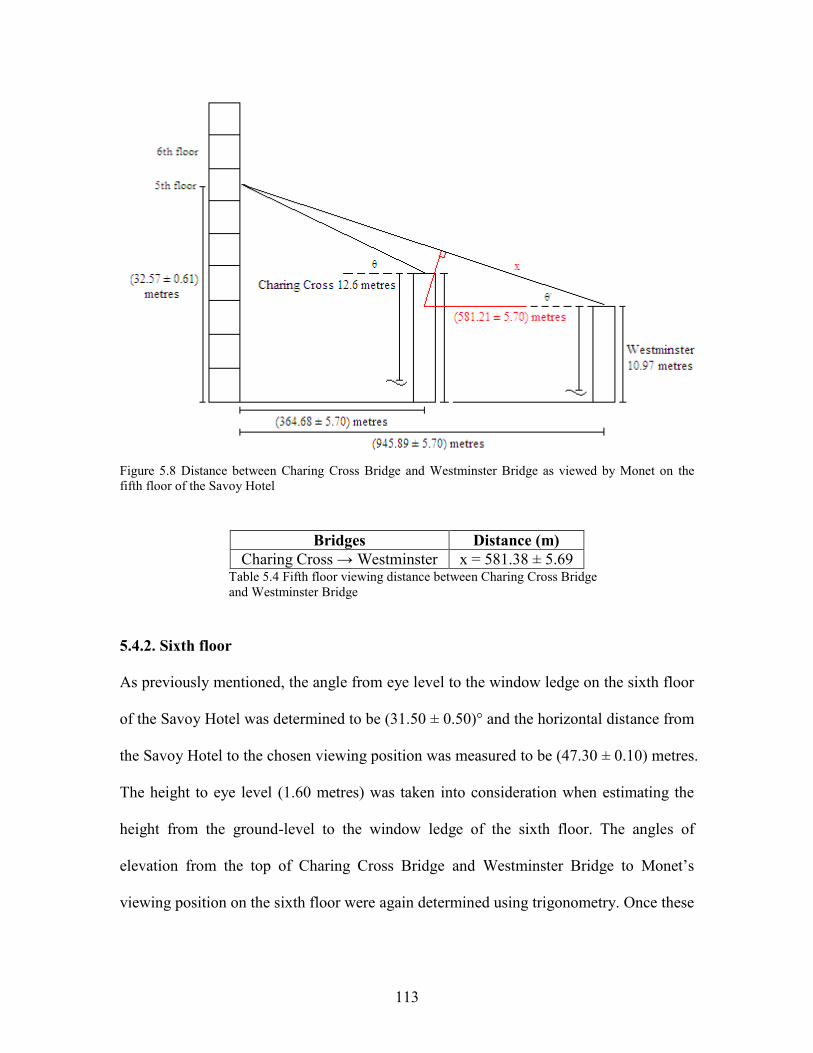
113
Figure 5.8 Distance between Charing Cross Bridge and Westminster Bridge as viewed by Monet on the
fifth floor of the Savoy Hotel
Bridges Distance (m)
Charing Cross → Westminster x = 581.38 ± 5.69 Table 5.4 Fifth floor viewing distance between Charing Cross Bridge
and Westminster Bridge
5.4.2. Sixth floor
As previously mentioned, the angle from eye level to the window ledge on the sixth floor
of the Savoy Hotel was determined to be (31.50 ± 0.50)° and the horizontal distance from
the Savoy Hotel to the chosen viewing position was measured to be (47.30 ± 0.10) metres.
The height to eye level (1.60 metres) was taken into consideration when estimating the
height from the ground-level to the window ledge of the sixth floor. The angles of
elevation from the top of Charing Cross Bridge and Westminster Bridge to Monet‟s
viewing position on the sixth floor were again determined using trigonometry. Once these
114
angles had been determined, the viewing distances to Charing Cross Bridge and
Westminster Bridge from Monet‟s suite could also be derived.
Average river level
Figure 5.9 Angles of elevation and viewing distances from Charing Cross Bridge and Westminster Bridge
to Monet on the sixth floor of the Savoy Hotel
Bridge Angle of elevation (°) Viewing distance (m)
Charing Cross θ = 4.03 ± 0.17 c‟ = 365.58 ± 5.64
Westminster θ‟ = 1.66 ± 0.05 w‟ = 946.29 ± 5.68
Table 5.5 Sixth floor elevations and viewing distances for Charing Cross Bridge and
Westminster Bridge

115
Figure 5.10 Distance between Charing Cross Bridge and Westminster Bridge as viewed by Monet on the
sixh floor of the Savoy Hotel
Bridges Distance (m)
Charing Cross → Westminster x‟ = 581.45 ± 5.69 Table 5.6 Sixth floor viewing distance between Charing Cross Bridge
and Westminster Bridge
The geometrical analysis of Monet‟s depictions of Waterloo Bridge and Charing Cross
Bridge has shown that the angles of elevation from the sixth floor of the Savoy Hotel are
greater than those viewed from the fifth floor. The distances viewed from the sixth floor
suite of the Savoy Hotel to Waterloo Bridge, Charing Cross Bridge and Westminster
Bridge, respectively, were also larger than those distances as viewed from the fifth floor.
Therefore, correspondingly, the distance visible between Charing Cross Bridge and
Westminster Bridge from the sixth floor was greater than the distance visible from the

116
fifth floor of the Savoy Hotel. All of these findings were to be expected on account of the
simple laws of geometry along with the heights of the structures included in the analysis.
5.5. Solar geometry analysis
The eight paintings of Waterloo Bridge will be divided into two groups for the solar
geometry analysis; one group consisting of four paintings (W1572, W1573, W1574 and
W1575) that clearly show the sun within the scene, whilst the second group consists of
four paintings (W1555, W1563, W1565 and W1567) where the position of the sun has to
be inferred. In order to determine an internal scale within the paintings of Waterloo
Bridge, several landmarks on the South Bank will be utilised; namely, the Watts Shot
Tower, the City Sewers Tower and the Waterloo Flour Mill. The heights of these features
have been determined by Prof. Donald W. Olson, taking into consideration the Liverpool
Ordnance Datum which was measured with respect to the tidal pole at Victoria Dock.
The respective elevations for these landmarks can be determined using their known
heights along with the known height of Monet on the fifth floor of the Savoy Hotel and
the horizontal distance between the Savoy Hotel and each individual feature e.g.
tan-1
[(height of the Watts Shot Tower - height of Monet on the fifth floor of the Savoy
Hotel)/(distance from the Savoy Hotel to the Watts Shot Tower)].
The four paintings of Charing Cross Bridge will also be divided into two groups with
respect to the representation of the sun. One painting, W1554, shows the sun clearly in
the image, whilst the position of the sun has to be inferred in the remaining three
paintings (W1532, W1536 and W1537). The landmarks that can be employed in the
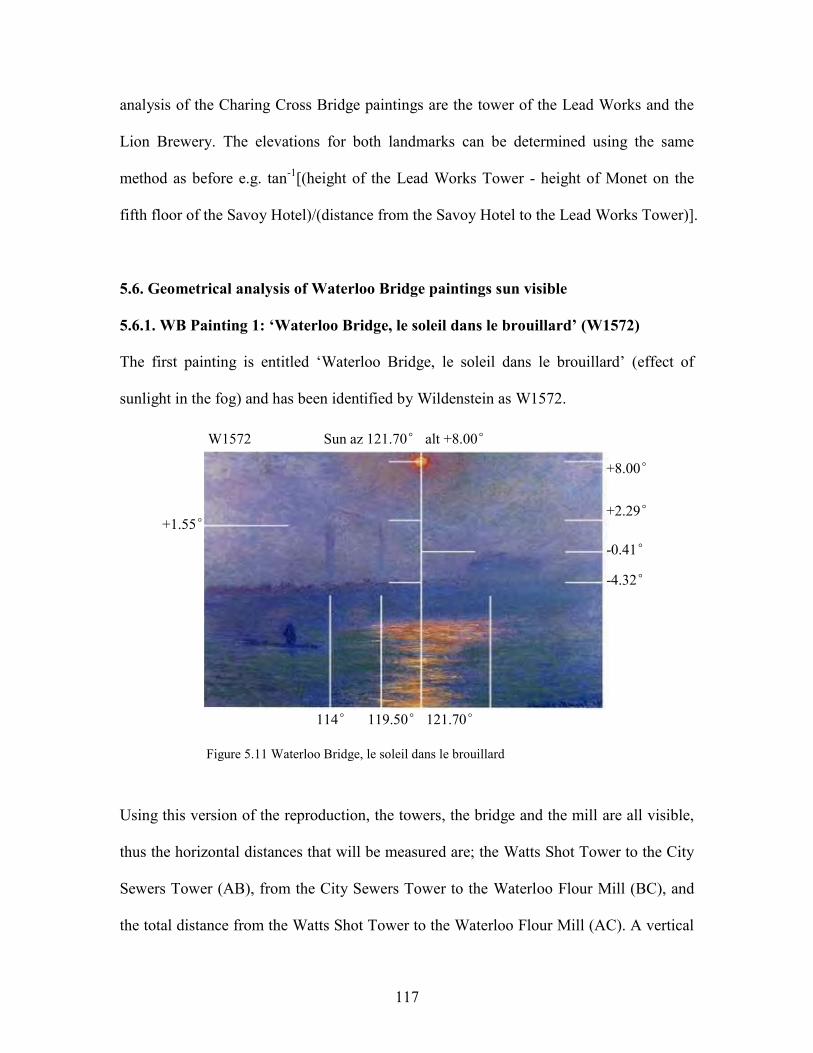
117
analysis of the Charing Cross Bridge paintings are the tower of the Lead Works and the
Lion Brewery. The elevations for both landmarks can be determined using the same
method as before e.g. tan-1
[(height of the Lead Works Tower - height of Monet on the
fifth floor of the Savoy Hotel)/(distance from the Savoy Hotel to the Lead Works Tower)].
5.6. Geometrical analysis of Waterloo Bridge paintings sun visible
5.6.1. WB Painting 1: ‘Waterloo Bridge, le soleil dans le brouillard’ (W1572)
The first painting is entitled „Waterloo Bridge, le soleil dans le brouillard‟ (effect of
sunlight in the fog) and has been identified by Wildenstein as W1572.
Figure 5.11 Waterloo Bridge, le soleil dans le brouillard
Using this version of the reproduction, the towers, the bridge and the mill are all visible,
thus the horizontal distances that will be measured are; the Watts Shot Tower to the City
Sewers Tower (AB), from the City Sewers Tower to the Waterloo Flour Mill (BC), and
the total distance from the Watts Shot Tower to the Waterloo Flour Mill (AC). A vertical
W1572 Sun az 121.70° alt +8.00°
114° 119.50° 121.70°
+2.29°
-0.41°
+8.00°
-4.32°
+1.55°

118
distance will be measured from the top of the Waterloo Flour Mill to the top of Waterloo
Bridge (EF).
Figure 5.12 Landmarks on the South Bank visible in the Waterloo Bridge paintings
The corresponding horizontal and vertical elevations can be determined, which will aid in
the derivation of a degree to millimetre ratio.
Figure 5.13 Azimuthal and elevation angles of landmarks on the South Bank visible
in the Waterloo Bridge paintings

119
The height to the middle of the sun from the top of Waterloo Bridge is measured and
used in conjunction with the degree to millimetre ratio to determine the elevation of the
sun with respect to the elevations of Waterloo Bridge.
Angle (°) Distance (mm) Ratio (°/mm)
Solar Azimuth 121.70 ± 0.50 - -
AB 5.00 ± 0.50 30.50 0.164 ± 0.019
BC 6.50 ± 0.50 65.00 0.100 ± 0.009
AC 11.50 ± 0.50 95.50 0.120 ± 0.006
DE 2.70 ± 0.12 23.00 0.117 ± 0.005
EF 3.91 ± 0.33 22.50 0.174 ± 0.015
DF 6.61 ± 0.29 45.50 0.145 ± 0.006 Table 5.7 Degree to millimetre ratios for the landmarks on the South Bank visible in the Waterloo
Bridge paintings
Average degree to millimetre ratio: (0.137 ± 0.010)°/mm
Distance
(mm)
Elevation above
structure (°)
Elevation of
structure (°)
Elevation
of sun (°)
Sun above Waterloo
Bridge
88.50 ± 0.50 12.13 ± 0.95 -4.32 ± 0.25 7.81 ± 0.70
Sun above City
Sewers
43.00 ± 0.50 5.89 ± 0.50 2.29 ± 0.04 8.18 ± 0.54
Table 5.8 Distances and angles to the sun
Average elevation to the sun: (8.00 ± 0.62)°
Fifth floor solar elevation → February 17th
at 8:16
Range of possible dates: February 16th
– February 18th
at 8:13 – 8:19am
This painting could have been painted in either 1900 or 1901.
Using the program from the Astronomical Applications Department of the U.S. Naval
Observatory (http://aa.usno.navy.mil/data/docs/AltAz.php), the azimuthal angle and
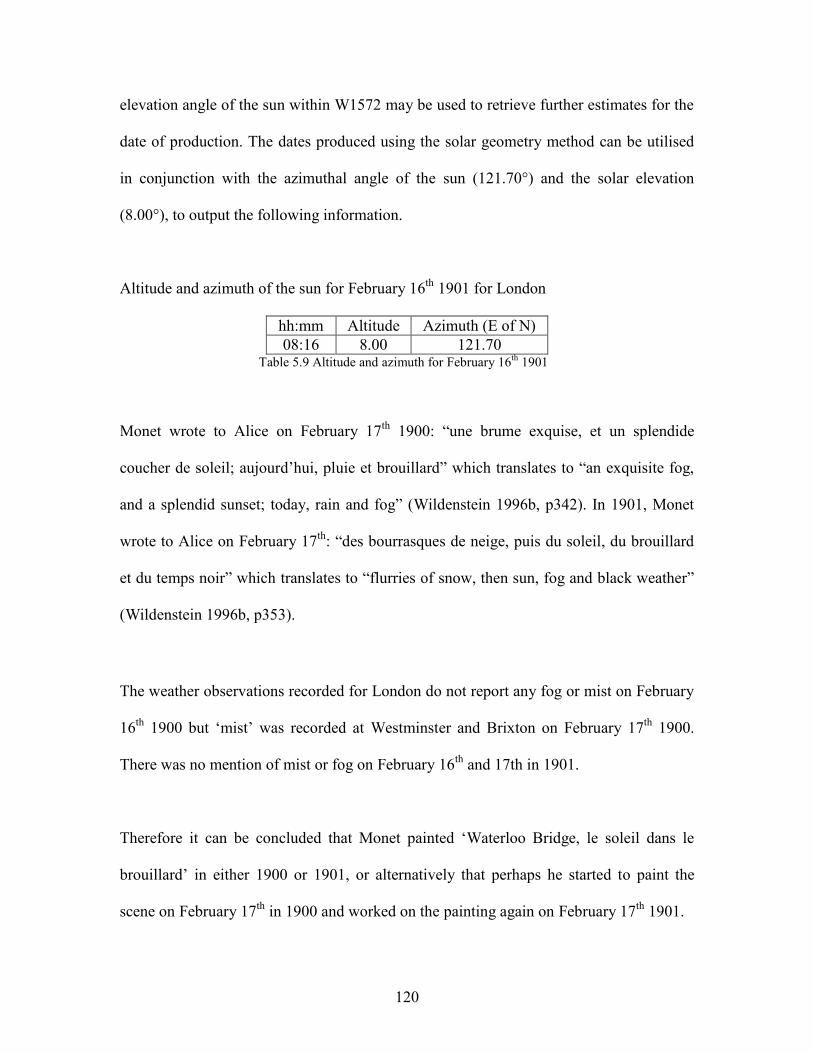
120
elevation angle of the sun within W1572 may be used to retrieve further estimates for the
date of production. The dates produced using the solar geometry method can be utilised
in conjunction with the azimuthal angle of the sun (121.70°) and the solar elevation
(8.00°), to output the following information.
Altitude and azimuth of the sun for February 16th
1901 for London
hh:mm Altitude Azimuth (E of N)
08:16 8.00 121.70 Table 5.9 Altitude and azimuth for February 16
th 1901
Monet wrote to Alice on February 17th
1900: “une brume exquise, et un splendide
coucher de soleil; aujourd‟hui, pluie et brouillard” which translates to “an exquisite fog,
and a splendid sunset; today, rain and fog” (Wildenstein 1996b, p342). In 1901, Monet
wrote to Alice on February 17th
: “des bourrasques de neige, puis du soleil, du brouillard
et du temps noir” which translates to “flurries of snow, then sun, fog and black weather”
(Wildenstein 1996b, p353).
The weather observations recorded for London do not report any fog or mist on February
16th
1900 but „mist‟ was recorded at Westminster and Brixton on February 17th
1900.
There was no mention of mist or fog on February 16th
and 17th in 1901.
Therefore it can be concluded that Monet painted „Waterloo Bridge, le soleil dans le
brouillard‟ in either 1900 or 1901, or alternatively that perhaps he started to paint the
scene on February 17th
in 1900 and worked on the painting again on February 17th
1901.

121
The tables for the rest of the Waterloo Bridge paintings are displayed in Appendix 2.
5.6.2. WB Painting 2: ‘Waterloo Bridge, soleil dans le brouillard’ (W1573)
The painting identified as W1573 by Wildenstein and entitled „Waterloo Bridge, soleil
dans le brouillard‟ (effect of sunlight in the fog), has a depiction of the entire sphere of
the sun within the scene.
Figure 5.14 Waterloo Bridge, soleil dans le brouillard
The positions of the Watts Shot Tower and the City Sewers are only just visible in this
painting, so the heights of the towers cannot be used but their azimuthal angles can be.
Since this is the case, only the height of the Waterloo Flour Mill can be used for this
painting.
Fifth floor solar elevation → February 16th
at 8:19
Range of possible dates: February 15th
– February 18th
at 8:16 – 8:23am
W1573 Sun az 122.50° alt 8.32°
122.50°
+8.32°

122
The date for this painting corresponds to either of Monet‟s visits in 1900 or 1901.
The dates produced from the solar geometry method will be used along with the
azimuthal angle of the sun (122.50°) and the solar elevation (8.32°), to generate the
following information.
Altitude and azimuth of the sun for February 15th
1900 for London
hh:mm Altitude Azimuth (E of N)
08:19 8.20 122.50
08:20 8.30 122.70 Table 5.10 Altitude and azimuth for February 15
th 1900
Monet wrote to Alice on February 17th
1900: “une brume exquise, et un splendide
coucher de soleil; aujourd‟hui, pluie et brouillard” which translates to “an exquisite fog,
and a splendid sunset; today, rain and fog” (Wildenstein 1996b, p342). In 1901, Monet
wrote to Alice on February 17th
: “des bourrasques de neige, puis du soleil, du brouillard
et du temps noir” which translates to “flurries of snow, then sun, fog and black weather”
(Wildenstein 1996b, p353).
„Mist‟ was reported at Kew on February 15th
1900. However the weather observations
recorded for London do not report any fog or mist on February 16th
1900 but „mist‟ was
also recorded at Westminster and Brixton on February 17th
1900. There was no mention
of mist or fog on February 16th
and 17th in 1901 but „mist‟ was recorded on February 15th
1901 at Westminster and again on Februarys 18th
1901 at Brixton and Kew.

123
Therefore it can be concluded that Monet painted „Waterloo Bridge, le soleil dans le
brouillard‟ in either 1900 or 1901, or alternatively that perhaps he started to paint the
scene on February 15th
in 1900 and worked on the painting again on February 17th
1900
and also again on February 15th
and February 18th
in 1901.
5.6.3. WB Painting 3: ‘Waterloo Bridge’ (W1574)
Monet has used large brushstrokes to comprise this particularly impressionist
representation of Waterloo Bridge. The bridge and the Waterloo Flour Mill beyond are
vaguely discernible. The Waterloo Flour Mill is the only decipherable landmark, apart
from Waterloo Bridge, in this painting. However, the globe of the sun is clearly apparent,
so only the height of the mill and the distance from Waterloo Bridge to the middle of the
sun can be used to determine the elevation of the sun within this scene.
Figure 5.15 Waterloo Bridge
Fifth floor solar elevation → February 22nd
at 8:04
W1574 Sun az 118.50° alt 7.91°
118.50°
+7.91°

124
Range of possible dates: February 20th
– February 23rd
at 8:01 – 8: 08am
The dates suggest that this painting may have been painted either during 1900 or 1901.
The program from the Astronomical Applications Department of the U.S. Naval
Observatory can utilise the azimuthal angle and elevation angle of the sun within W1574
to determine another estimate for the date of production.
Altitude and azimuth of the sun for February 21st 1901 for London
hh:mm Altitude Azimuth (E of N)
08:04 7.90 118.40 Table 5.11 Altitude and azimuth for February 21
st 1901
Unfortunately, Monet did not write to Alice on any of the selected dates in February
during 1900 or 1901.
Fog was not recorded on any of the dates in 1900. However, during the following year,
„mist‟ was reported in Kew on February 20th
1901 and in Brixton on February 21st 1901.
Therefore, it seems reasonable to suggest that Monet started to paint „Waterloo Bridge‟
on February 20th
1901 and continued to work on the scene the next day on February 21st
1901.
5.6.4. WB Painting 4: ‘Waterloo Bridge, brouillard’ (W1575)
The final painting is entitled „Waterloo Bridge, brouillard‟ (fog) and has been identified
by Wildenstein as W1575. Monet‟s brush strokes in this particular painting are quite

125
abstract in their appearance. The Watts Shot Tower, the chimney of the City Sewers and
the Waterloo Flour Mill are all visible enough to be used for the analysis of this painting.
The sun is visible as a red sphere in the sky.
Figure 5.16 Waterloo Bridge, brouillard
Fifth floor solar elevation → February 28th
at 8:43
Range of possible dates: February 27th
– March 1st at 8:40 – 8:46am
Monet could have painted this scene during either of his visits in 1900 or 1901. Monet
did not write on any of these dates in 1900 or 1901.
The azimuthal angle and elevation angle of the sun within W1575 can be used in
conjunction with the dates produced using the solar geometry method to retrieve further
estimates for the date of production.
W1575 Sun az 113° alt 7.00°
113°
+7.00°
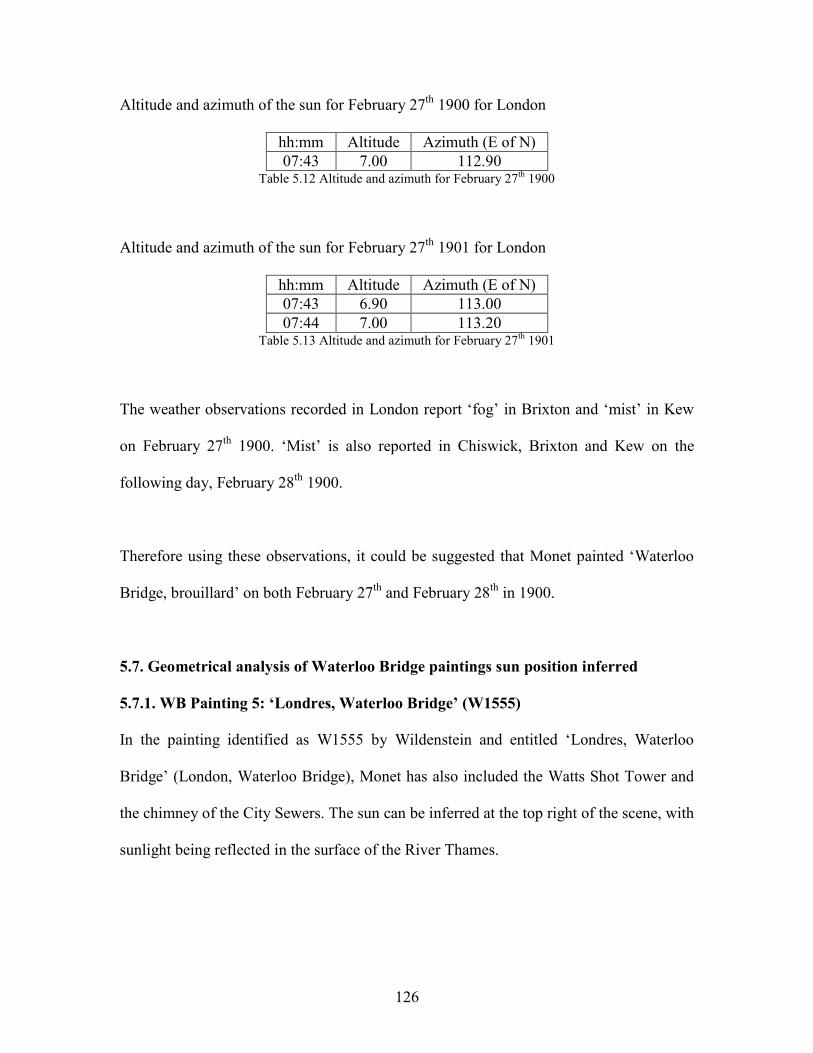
126
Altitude and azimuth of the sun for February 27th
1900 for London
hh:mm Altitude Azimuth (E of N)
07:43 7.00 112.90 Table 5.12 Altitude and azimuth for February 27
th 1900
Altitude and azimuth of the sun for February 27th
1901 for London
hh:mm Altitude Azimuth (E of N)
07:43 6.90 113.00
07:44 7.00 113.20 Table 5.13 Altitude and azimuth for February 27
th 1901
The weather observations recorded in London report „fog‟ in Brixton and „mist‟ in Kew
on February 27th
1900. „Mist‟ is also reported in Chiswick, Brixton and Kew on the
following day, February 28th
1900.
Therefore using these observations, it could be suggested that Monet painted „Waterloo
Bridge, brouillard‟ on both February 27th
and February 28th
in 1900.
5.7. Geometrical analysis of Waterloo Bridge paintings sun position inferred
5.7.1. WB Painting 5: ‘Londres, Waterloo Bridge’ (W1555)
In the painting identified as W1555 by Wildenstein and entitled „Londres, Waterloo
Bridge‟ (London, Waterloo Bridge), Monet has also included the Watts Shot Tower and
the chimney of the City Sewers. The sun can be inferred at the top right of the scene, with
sunlight being reflected in the surface of the River Thames.
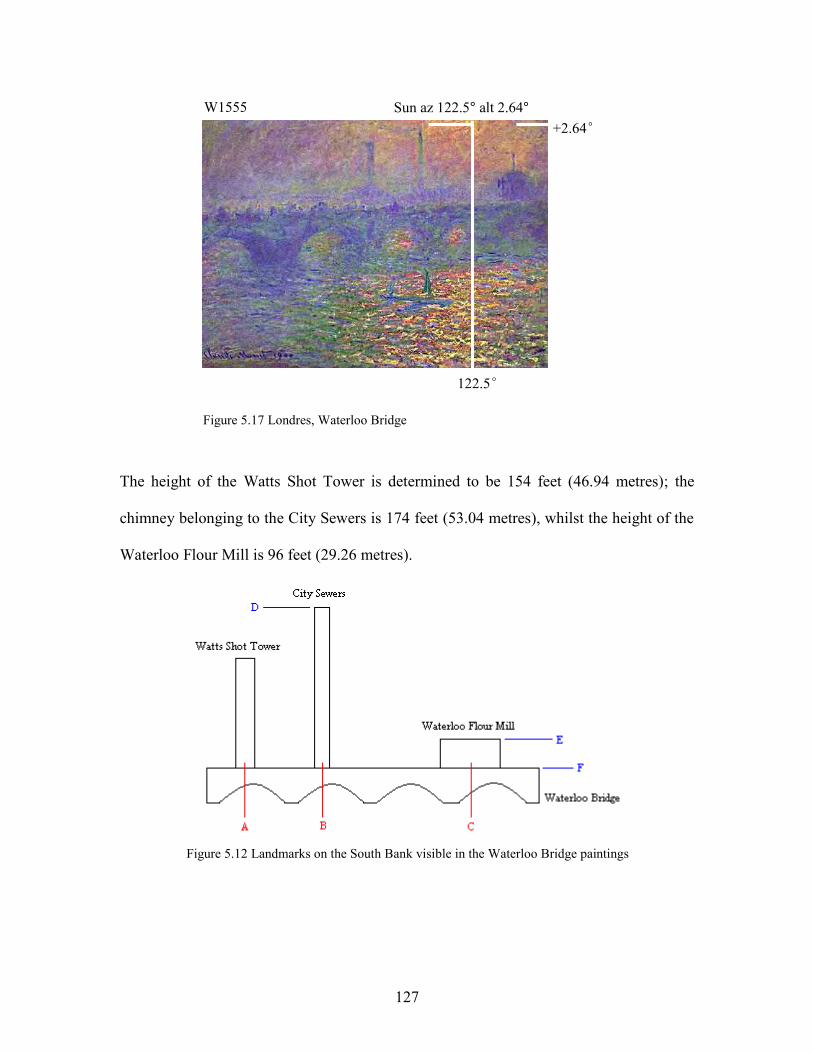
127
Figure 5.17 Londres, Waterloo Bridge
The height of the Watts Shot Tower is determined to be 154 feet (46.94 metres); the
chimney belonging to the City Sewers is 174 feet (53.04 metres), whilst the height of the
Waterloo Flour Mill is 96 feet (29.26 metres).
Figure 5.12 Landmarks on the South Bank visible in the Waterloo Bridge paintings
W1555 Sun az 122.5° alt 2.64°
122.5°
+2.64°
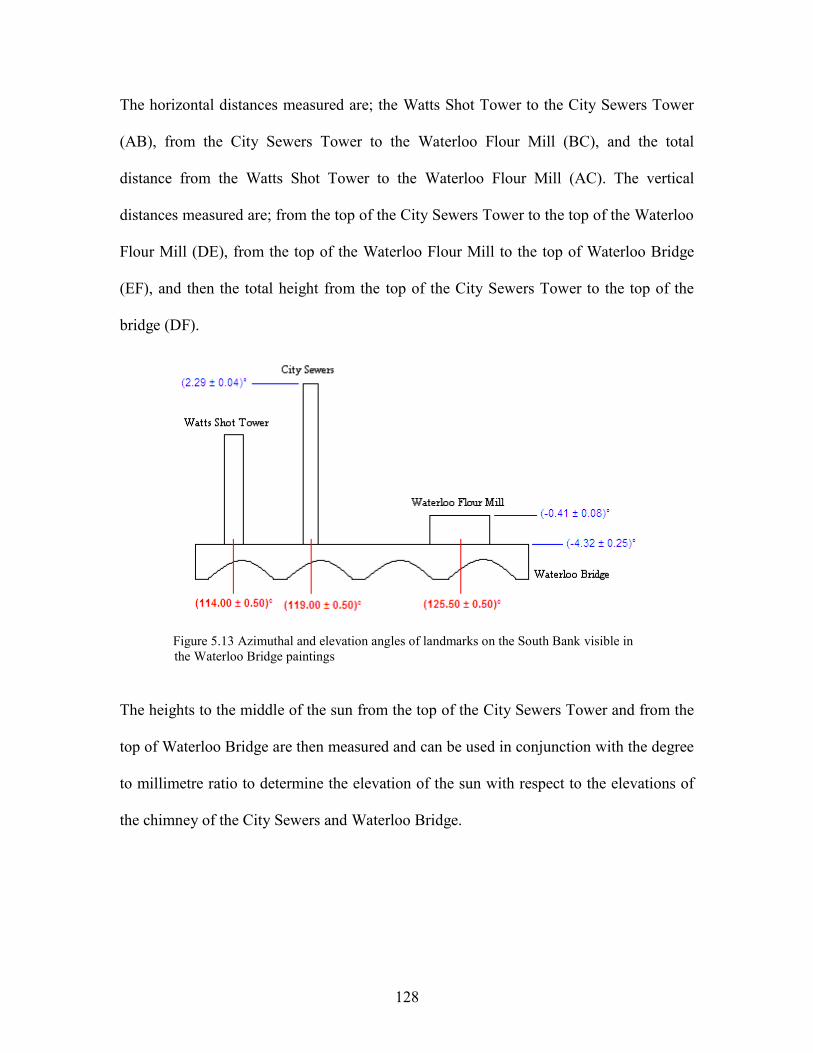
128
The horizontal distances measured are; the Watts Shot Tower to the City Sewers Tower
(AB), from the City Sewers Tower to the Waterloo Flour Mill (BC), and the total
distance from the Watts Shot Tower to the Waterloo Flour Mill (AC). The vertical
distances measured are; from the top of the City Sewers Tower to the top of the Waterloo
Flour Mill (DE), from the top of the Waterloo Flour Mill to the top of Waterloo Bridge
(EF), and then the total height from the top of the City Sewers Tower to the top of the
bridge (DF).
Figure 5.13 Azimuthal and elevation angles of landmarks on the South Bank visible in
the Waterloo Bridge paintings
The heights to the middle of the sun from the top of the City Sewers Tower and from the
top of Waterloo Bridge are then measured and can be used in conjunction with the degree
to millimetre ratio to determine the elevation of the sun with respect to the elevations of
the chimney of the City Sewers and Waterloo Bridge.
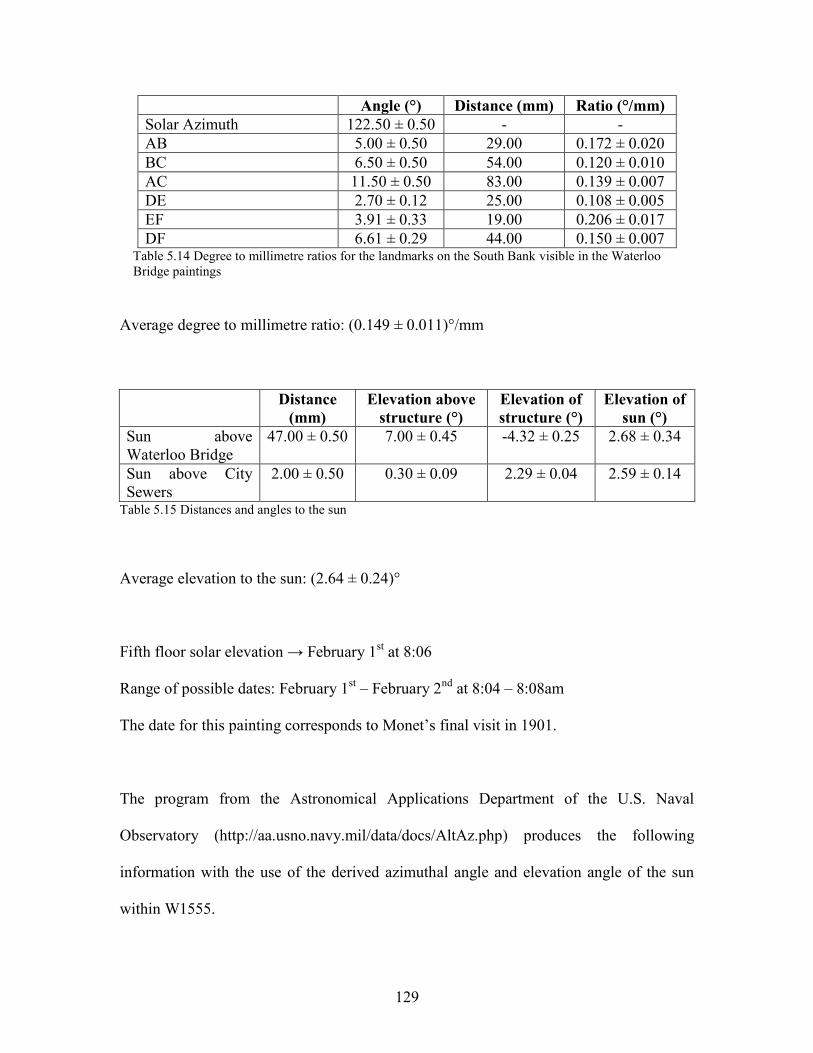
129
Angle (°) Distance (mm) Ratio (°/mm)
Solar Azimuth 122.50 ± 0.50 - -
AB 5.00 ± 0.50 29.00 0.172 ± 0.020
BC 6.50 ± 0.50 54.00 0.120 ± 0.010
AC 11.50 ± 0.50 83.00 0.139 ± 0.007
DE 2.70 ± 0.12 25.00 0.108 ± 0.005
EF 3.91 ± 0.33 19.00 0.206 ± 0.017
DF 6.61 ± 0.29 44.00 0.150 ± 0.007 Table 5.14 Degree to millimetre ratios for the landmarks on the South Bank visible in the Waterloo
Bridge paintings
Average degree to millimetre ratio: (0.149 ± 0.011)°/mm
Distance
(mm)
Elevation above
structure (°)
Elevation of
structure (°)
Elevation of
sun (°)
Sun above
Waterloo Bridge
47.00 ± 0.50 7.00 ± 0.45 -4.32 ± 0.25 2.68 ± 0.34
Sun above City
Sewers
2.00 ± 0.50 0.30 ± 0.09 2.29 ± 0.04 2.59 ± 0.14
Table 5.15 Distances and angles to the sun
Average elevation to the sun: (2.64 ± 0.24)°
Fifth floor solar elevation → February 1st at 8:06
Range of possible dates: February 1st – February 2
nd at 8:04 – 8:08am
The date for this painting corresponds to Monet‟s final visit in 1901.
The program from the Astronomical Applications Department of the U.S. Naval
Observatory (http://aa.usno.navy.mil/data/docs/AltAz.php) produces the following
information with the use of the derived azimuthal angle and elevation angle of the sun
within W1555.
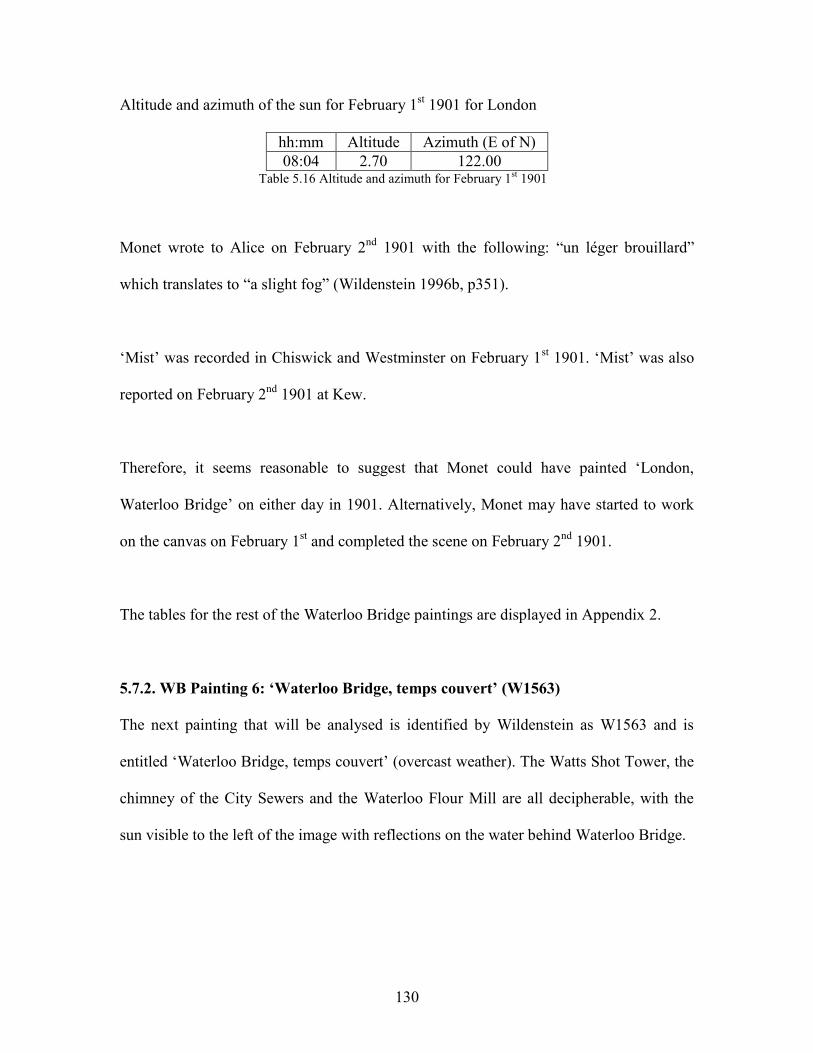
130
Altitude and azimuth of the sun for February 1st 1901 for London
hh:mm Altitude Azimuth (E of N)
08:04 2.70 122.00 Table 5.16 Altitude and azimuth for February 1
st 1901
Monet wrote to Alice on February 2nd
1901 with the following: “un léger brouillard”
which translates to “a slight fog” (Wildenstein 1996b, p351).
„Mist‟ was recorded in Chiswick and Westminster on February 1st 1901. „Mist‟ was also
reported on February 2nd
1901 at Kew.
Therefore, it seems reasonable to suggest that Monet could have painted „London,
Waterloo Bridge‟ on either day in 1901. Alternatively, Monet may have started to work
on the canvas on February 1st and completed the scene on February 2
nd 1901.
The tables for the rest of the Waterloo Bridge paintings are displayed in Appendix 2.
5.7.2. WB Painting 6: ‘Waterloo Bridge, temps couvert’ (W1563)
The next painting that will be analysed is identified by Wildenstein as W1563 and is
entitled „Waterloo Bridge, temps couvert‟ (overcast weather). The Watts Shot Tower, the
chimney of the City Sewers and the Waterloo Flour Mill are all decipherable, with the
sun visible to the left of the image with reflections on the water behind Waterloo Bridge.
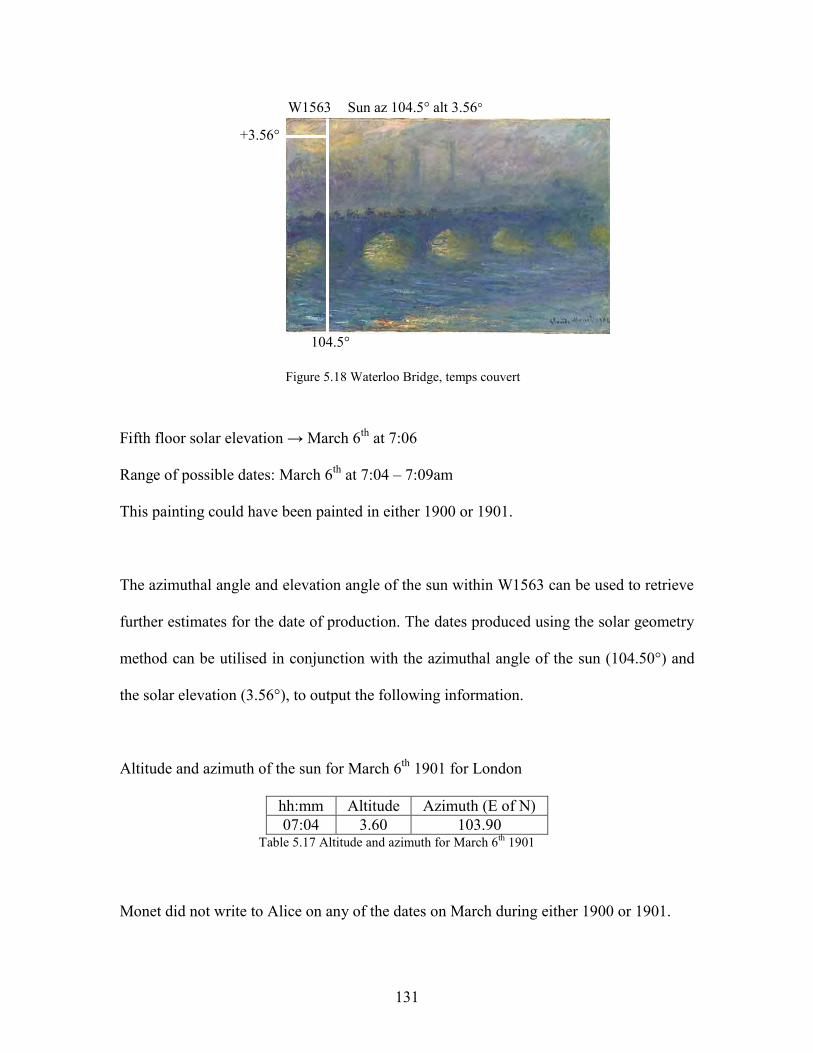
131
Figure 5.18 Waterloo Bridge, temps couvert
Fifth floor solar elevation → March 6th
at 7:06
Range of possible dates: March 6th
at 7:04 – 7:09am
This painting could have been painted in either 1900 or 1901.
The azimuthal angle and elevation angle of the sun within W1563 can be used to retrieve
further estimates for the date of production. The dates produced using the solar geometry
method can be utilised in conjunction with the azimuthal angle of the sun (104.50°) and
the solar elevation (3.56°), to output the following information.
Altitude and azimuth of the sun for March 6th
1901 for London
hh:mm Altitude Azimuth (E of N)
07:04 3.60 103.90 Table 5.17 Altitude and azimuth for March 6
th 1901
Monet did not write to Alice on any of the dates on March during either 1900 or 1901.
W1563 Sun az 104.5° alt 3.56°
104.5°
+3.56°

132
The title of the painting, „Waterloo Bridge, temps couvert‟, suggests that Monet painted
this scene during overcast conditions. „Overcast‟ conditions were recorded at Brixton on
March 6th
1900 and again at Chiswick on March 6th
1901.
Hence it may be concluded that Monet painted „Waterloo Bridge, temps couvert‟ on
either March 6th
1900 or March 6th
1901. On the other hand, Monet could have started to
paint the scene on March 6th
in 1900 and worked on the painting again on March 6th
1901.
5.7.3. WB Painting 7: ‘Waterloo Bridge, effet de soleil’ (W1565)
The painting labelled as W1565 by Wildenstein is entitled „Waterloo Bridge, effet de
soleil‟ (sunlight effect). The Watts Shot Tower and the chimney of the City Sewers are
visible in the background of the painting. A faint representation of the Waterloo Flour
Mill is also discernible. The sun is visible at the top of the canvas and the sunlight is
significantly reflected by the Thames. Boats are also visible in the forefront of this
painting and the angle of view has moved to the right to capture the full reflection of the
sun on the Thames.
Figure 5.19 Waterloo Bridge, effet de soleil
W1565 Sun az 124° alt 4.14°
124°°
+4.14°

133
Fifth floor solar elevation → February 3rd
at 8:15
Range of possible dates: February 2nd
– February 3rd
at 8:13 – 8:17am
Monet could have painted this scene during his last visit to London in 1901.
The program from the Astronomical Applications Department of the U.S. Naval
Observatory can utilise the azimuthal angle and elevation angle of the sun within W1565
to determine another estimate for the date of production.
Altitude and azimuth of the sun for February 2nd
1901 for London
hh:mm Altitude Azimuth (E of N)
08:14 4.10 123.80
08:15 4.20 124.00 Table 5.18 Altitude and azimuth for February 2
nd 1901
Monet wrote to Alice on February 2nd
1901: “un léger brouillard” which translates to “a
slight fog”. Monet also wrote to his wife on February 3rd
1901: “Grâce aux fumées, la
brume est venue, puis des nuages,” - “Through the smoke, the fog came, then the clouds”
(Wildenstein 1996b p 351).
The weather observations recorded in London report „mist‟ in Kew on February 2nd
in
1901. On February 3rd
1901, „mist‟ was recorded in Chiswick and Brixton.
Using these observations in conjunction with Monet‟s letters, it may be concluded that
Monet began to paint „Waterloo Bridge, effet de soleil‟ on February 2nd
1901 and worked
on it again on February 3rd
1901.
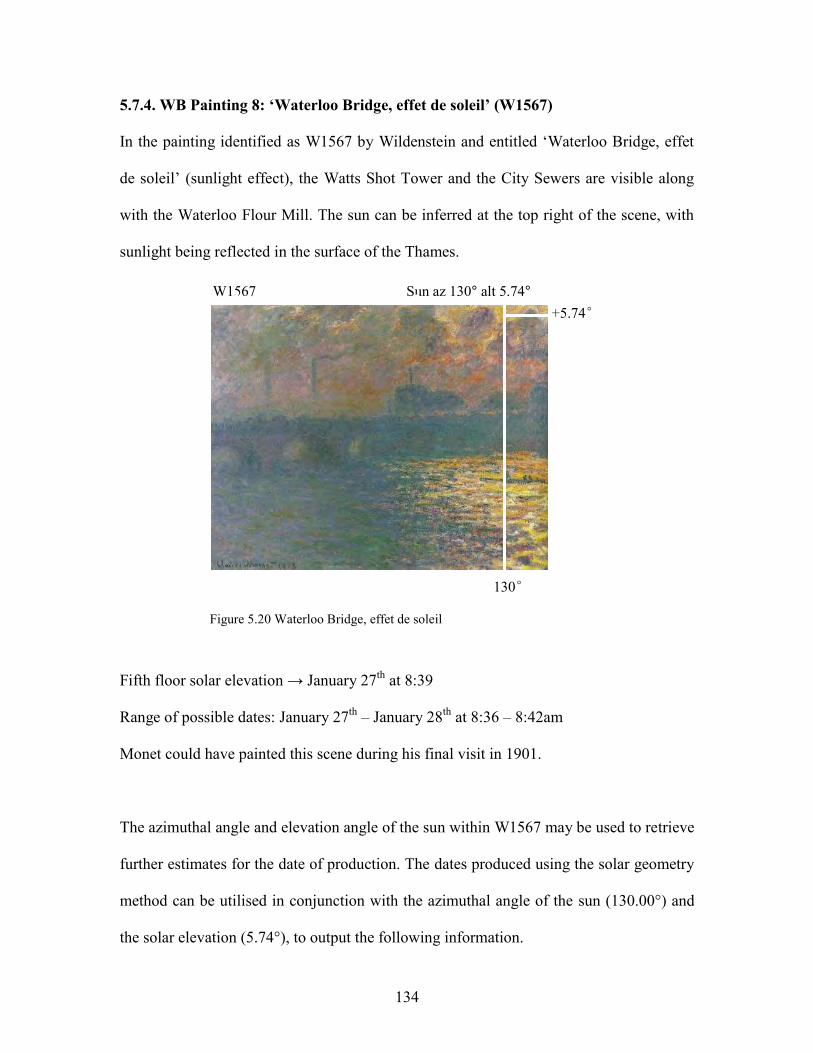
134
5.7.4. WB Painting 8: ‘Waterloo Bridge, effet de soleil’ (W1567)
In the painting identified as W1567 by Wildenstein and entitled „Waterloo Bridge, effet
de soleil‟ (sunlight effect), the Watts Shot Tower and the City Sewers are visible along
with the Waterloo Flour Mill. The sun can be inferred at the top right of the scene, with
sunlight being reflected in the surface of the Thames.
Figure 5.20 Waterloo Bridge, effet de soleil
Fifth floor solar elevation → January 27th
at 8:39
Range of possible dates: January 27th
– January 28th
at 8:36 – 8:42am
Monet could have painted this scene during his final visit in 1901.
The azimuthal angle and elevation angle of the sun within W1567 may be used to retrieve
further estimates for the date of production. The dates produced using the solar geometry
method can be utilised in conjunction with the azimuthal angle of the sun (130.00°) and
the solar elevation (5.74°), to output the following information.
W1567 Sun az 130° alt 5.74°
130°
+5.74°

135
Altitude and azimuth of the sun for January 27th
1901 for London
hh:mm Altitude Azimuth (E of N)
08:37 5.70 129.60
08:38 5.80 129.80
08:39 5.90 130.00 Table 5.19 Altitude and azimuth for January 27
th 1901
Monet did not write to Alice on any of the dates in January 1901.
Also, fog, mist or haze was not reported at any of the weather stations during the selected
dates. However, since the painting seems to depict dull or overcast conditions, these have
been retrieved from the weather reports. „Overcast‟ conditions were reported in
Westminster on January 27th
1901. „Dull‟ conditions were reported in Chiswick on
January 28th
1901, whilst „overcast‟ conditions were recorded at Brixton on the same day.
Therefore, it may be concluded that Monet either worked on „Waterloo Bridge, effet de
soleil‟ on January 27th
1901 or January 28th
1901. Alternatively, Monet may have started
to work on this painting on January 27th
1901 and continued to work on the canvas on
January 28th
1901.
5.8. Geometrical analysis of Charing Cross Bridge paintings sun visible
5.8.1. CCB Painting 1: ‘Charing Cross Bridge, brouillard sur la Tamise’ (W1554)
This painting of Charing Cross Bridge was labelled as W1554 by Wildenstein and
entitled „Charing Cross Bridge, brouillard sur la Tamise‟ (fog on the Thames). The sun is
visible at the top left of the scene as an orange-red sphere. Charing Cross Bridge, the
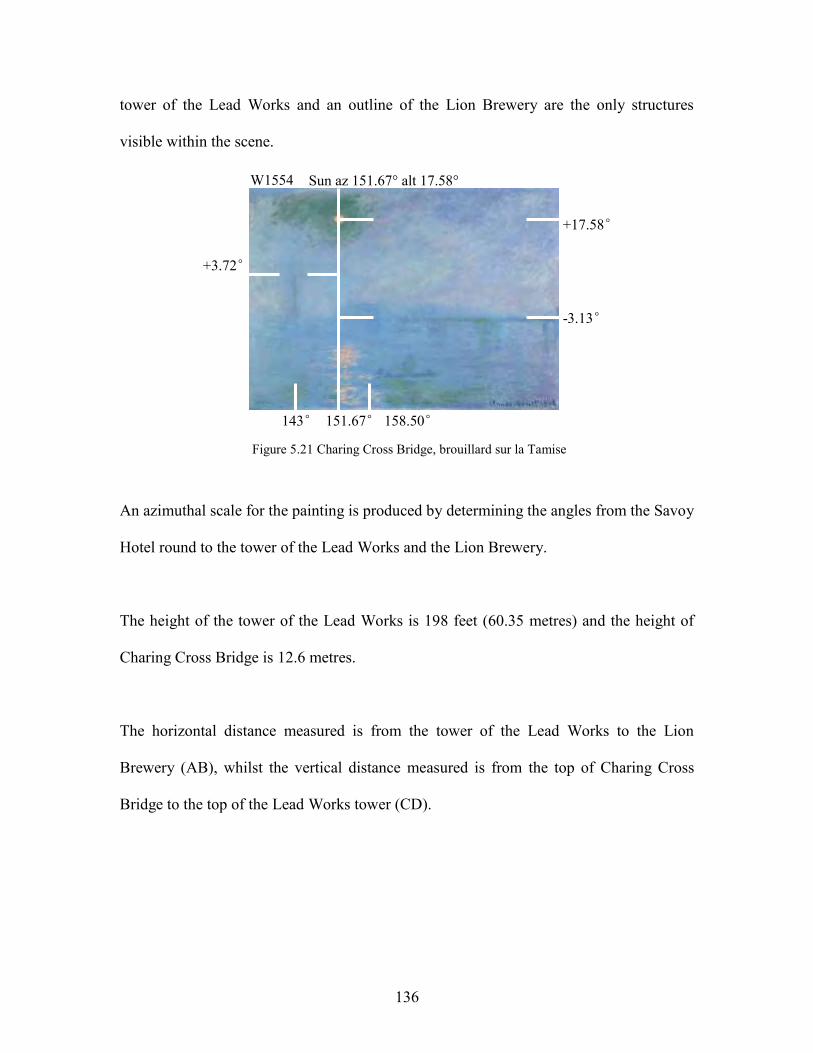
136
tower of the Lead Works and an outline of the Lion Brewery are the only structures
visible within the scene.
Figure 5.21 Charing Cross Bridge, brouillard sur la Tamise
An azimuthal scale for the painting is produced by determining the angles from the Savoy
Hotel round to the tower of the Lead Works and the Lion Brewery.
The height of the tower of the Lead Works is 198 feet (60.35 metres) and the height of
Charing Cross Bridge is 12.6 metres.
The horizontal distance measured is from the tower of the Lead Works to the Lion
Brewery (AB), whilst the vertical distance measured is from the top of Charing Cross
Bridge to the top of the Lead Works tower (CD).
W1554 Sun az 151.67° alt 17.58°
+17.58°
143° 151.67° 158.50°
+3.72°
-3.13°
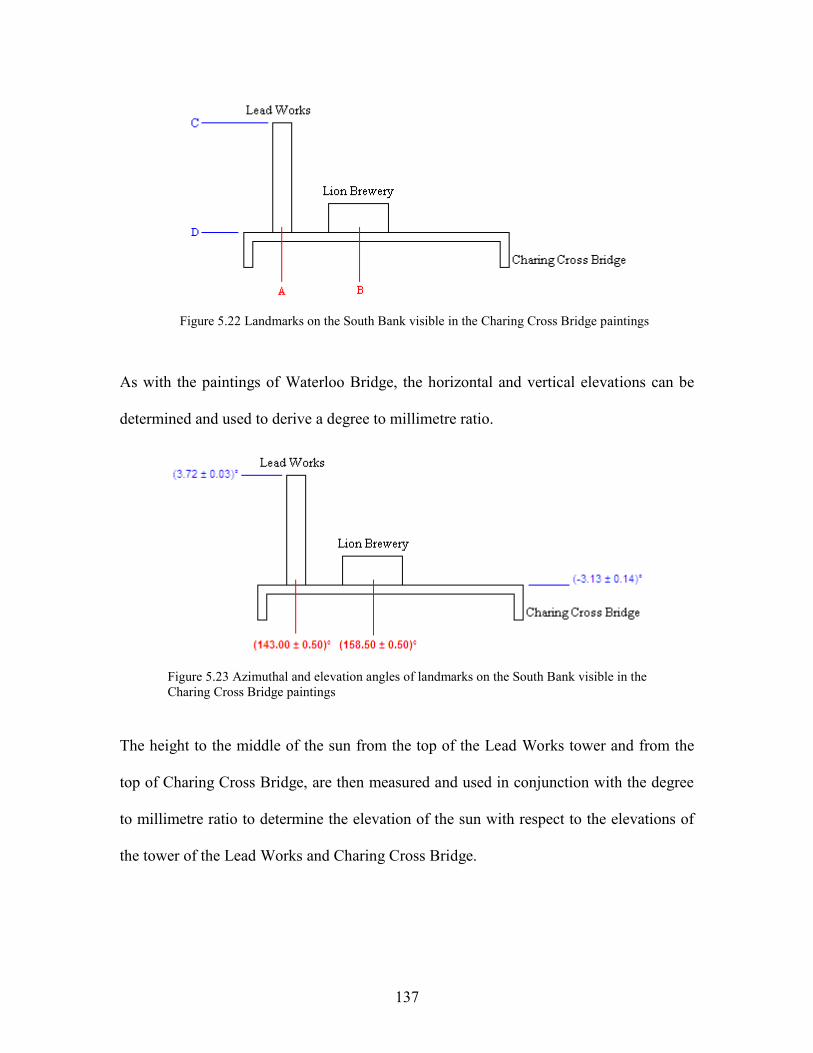
137
Figure 5.22 Landmarks on the South Bank visible in the Charing Cross Bridge paintings
As with the paintings of Waterloo Bridge, the horizontal and vertical elevations can be
determined and used to derive a degree to millimetre ratio.
Figure 5.23 Azimuthal and elevation angles of landmarks on the South Bank visible in the
Charing Cross Bridge paintings
The height to the middle of the sun from the top of the Lead Works tower and from the
top of Charing Cross Bridge, are then measured and used in conjunction with the degree
to millimetre ratio to determine the elevation of the sun with respect to the elevations of
the tower of the Lead Works and Charing Cross Bridge.

138
Angle (°) Distance (mm) Ratio (°/mm)
Solar Azimuth 151.67 ± 0.50 - -
AB 15.50 ± 0.50 41 0.378 ± 0.017
BC 6.85 ± 0.11 33 0.208 ± 0.003 Table 5.20 Degree to millimetre ratios for the landmarks on the South Bank visible in the
Charing Cross Bridge paintings
Average degree to millimetre ratio: (0.293 ± 0.010)°/mm
Distance
(mm)
Elevation above
structure (°)
Elevation of
structure (°)
Elevation of
sun (°)
Sun above
Lead Works
45.00 ± 0.50 13.19 ± 0.60 3.72 ± 0.03 16.91 ± 0.63
Sun above
Charing Cross
Bridge
73.00 ± 0.50 21.39 ± 0.88 -3.13 ± 0.14 18.26 ± 0.74
Table 5.21 Distances and angles to the sun
Average elevation to the sun: (17.58 ± 0.68)°
Fifth floor solar elevation → February 4th
at 10:22
Range of possible dates: February 1st – February 6
th at 10:18 – 10:24am
Using the program from the aforementioned Astronomical Applications Department of
the U.S. Naval Observatory (http://aa.usno.navy.mil/data/docs/AltAz.php), the azimuthal
angle and elevation angle of the sun within W1554 may be used to retrieve further
estimates for the date of production. The dates produced using the solar geometry method
can be utilised in conjunction with the azimuthal angle of the sun (151.67°) and the solar
elevation (17.58°), to output the following information.
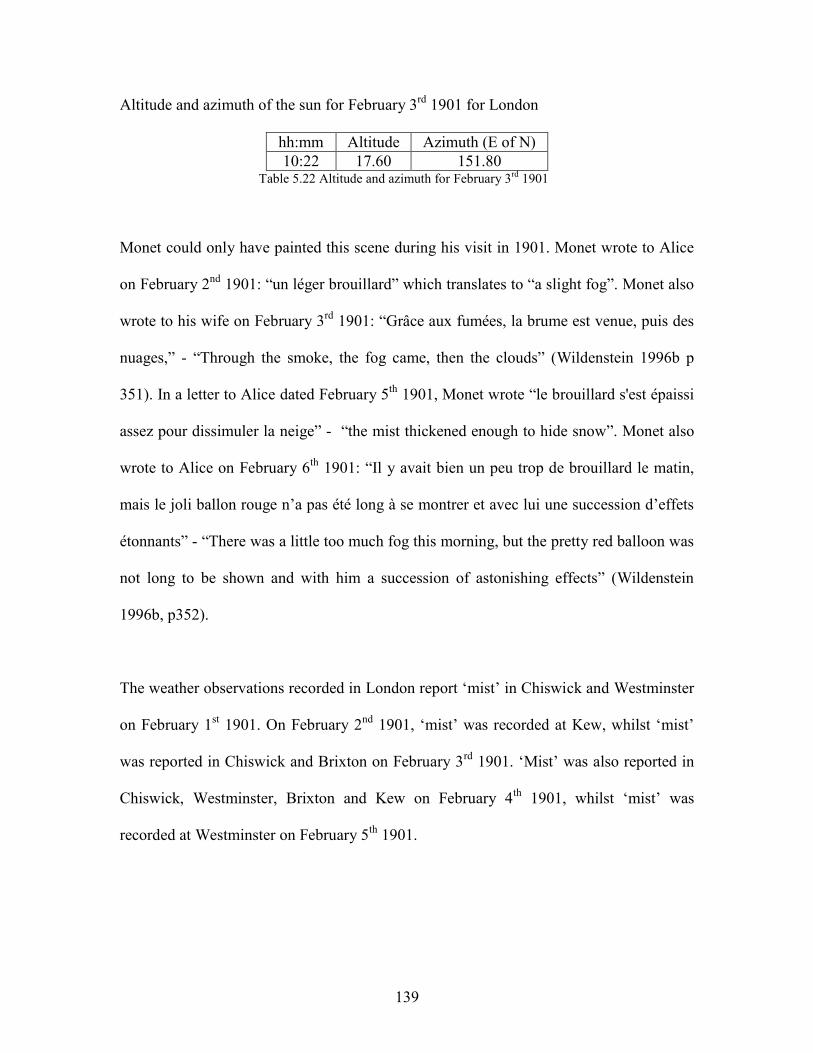
139
Altitude and azimuth of the sun for February 3rd
1901 for London
hh:mm Altitude Azimuth (E of N)
10:22 17.60 151.80 Table 5.22 Altitude and azimuth for February 3
rd 1901
Monet could only have painted this scene during his visit in 1901. Monet wrote to Alice
on February 2nd
1901: “un léger brouillard” which translates to “a slight fog”. Monet also
wrote to his wife on February 3rd
1901: “Grâce aux fumées, la brume est venue, puis des
nuages,” - “Through the smoke, the fog came, then the clouds” (Wildenstein 1996b p
351). In a letter to Alice dated February 5th
1901, Monet wrote “le brouillard s'est épaissi
assez pour dissimuler la neige” - “the mist thickened enough to hide snow”. Monet also
wrote to Alice on February 6th
1901: “Il y avait bien un peu trop de brouillard le matin,
mais le joli ballon rouge n‟a pas été long à se montrer et avec lui une succession d‟effets
étonnants” - “There was a little too much fog this morning, but the pretty red balloon was
not long to be shown and with him a succession of astonishing effects” (Wildenstein
1996b, p352).
The weather observations recorded in London report „mist‟ in Chiswick and Westminster
on February 1st 1901. On February 2
nd 1901, „mist‟ was recorded at Kew, whilst „mist‟
was reported in Chiswick and Brixton on February 3rd
1901. „Mist‟ was also reported in
Chiswick, Westminster, Brixton and Kew on February 4th
1901, whilst „mist‟ was
recorded at Westminster on February 5th
1901.

140
Therefore using these observations in conjunction with Monet‟s letters, it is most likely
that Monet started to paint „Charing Cross Bridge, brouillard sur la Tamise‟ on February
1st 1901 and possibly worked on it again until February 6
th 1901.
5.9. Geometrical analysis of Charing Cross Bridge paintings sun position inferred
5.9.1. CCB Painting 2: ‘Charing Cross Bridge, reflets sur la Tamise’ (W1532)
The first painting is identified as W1532 by Wildenstein and is entitled „Charing Cross
Bridge, reflets sur la Tamise‟ (reflections on the Thames). The glow of the sun is visible
to the left of the centre at the very top of the scene. Westminster Bridge, Victoria Tower,
Big Ben and the Parliament buildings are all visible beyond Charing Cross Bridge.
Figure 5.24 Charing Cross Bridge, reflets sur la Tamise
The azimuthal angle of the speculated position of the sun is estimated to be 183.00°, and
this can be used as a reference point for finding the solar elevation.

141
The earliest date that Monet was in London, in one year, was January 25th
in 1900. This
date, in conjunction with the solar azimuthal angle of 183.00°, produced the smallest
solar elevation of 19.50°. A segment of the angles computed by the program from the
Astronomical Applications Department is displayed below.
Altitude and azimuth of the sun for January 25th
1900 for London
hh:mm Altitude Azimuth (E of N)
12:24 19.50 182.80
12:25 19.50 183.10
12:26 19.50 183.30 Table 5.23 Altitude and azimuth for January 25
th 1900
Figure 5.25 shows the elevation of the sun relative to the elevations of Westminster
Bridge, Victoria Tower and Big Ben.
Figure 5.25 Elevation of the sun
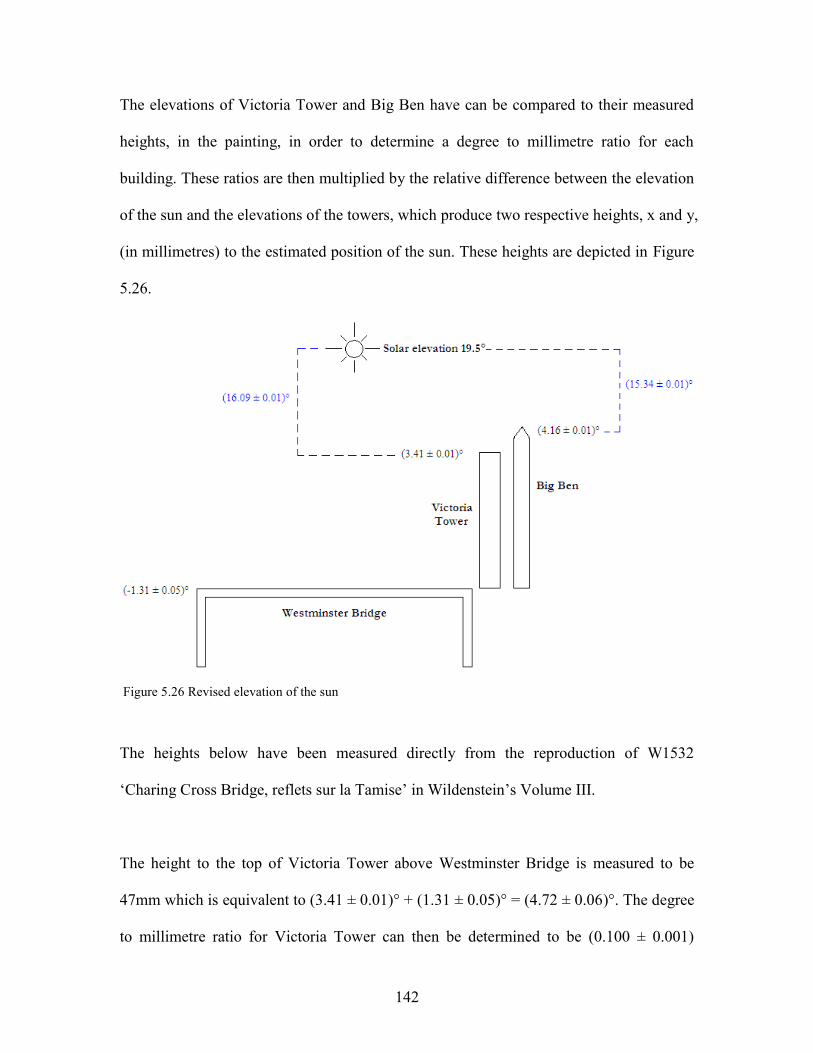
142
The elevations of Victoria Tower and Big Ben have can be compared to their measured
heights, in the painting, in order to determine a degree to millimetre ratio for each
building. These ratios are then multiplied by the relative difference between the elevation
of the sun and the elevations of the towers, which produce two respective heights, x and y,
(in millimetres) to the estimated position of the sun. These heights are depicted in Figure
5.26.
Figure 5.26 Revised elevation of the sun
The heights below have been measured directly from the reproduction of W1532
„Charing Cross Bridge, reflets sur la Tamise‟ in Wildenstein‟s Volume III.
The height to the top of Victoria Tower above Westminster Bridge is measured to be
47mm which is equivalent to (3.41 ± 0.01)° + (1.31 ± 0.05)° = (4.72 ± 0.06)°. The degree
to millimetre ratio for Victoria Tower can then be determined to be (0.100 ± 0.001)

143
degree/mm. Since the difference between the elevation of Victoria Tower to the elevation
of the sun is (16.09 ± 0.01)°, the height of the sun above Victoria Tower is (160.90 ± 1.51)
mm.
The height of Big Ben above Westminster Bridge is 44mm which is also equal to (4.16 ±
0.01)° + (1.31 ± 0.05)° = (5.47 ± 0.06)°. The degree to millimetre ratio for Big Ben is
(0.124 ± 0.001) degree/mm. Since the difference between the elevation of Big Ben to the
elevation of the sun is (15.34 ± 0.01)°, then the height of the sun above Big Ben is
(123.71 ± 1.08) mm.
From these measurements it has been shown that the position of the sun can be estimated
to be approximately 16cm above Victoria Tower and 12.4cm above Big Ben. Looking at
the reproduction of the painting, there is approximately 1.5cm from the top of Victoria
Tower and Big Ben to the top edge of the canvas. Therefore it seems quite reasonable to
estimate that the location of the sun would need to be a further 11-14cm above the top of
the canvas reproduced by Wildenstein (1974-1985). This is an extremely important
finding, as it shows that Monet conducted a degree of vertical stretching whilst painting
this scene.
5.9.2. CCB Painting 3: ‘Charing Cross Bridge, la Tamise’ (W1536)
The next painting has been labelled as W1536 by Wildenstein and entitled „Charing
Cross Bridge, la Tamise‟ (The Thames). The outer glow of the sun is visible at the top of
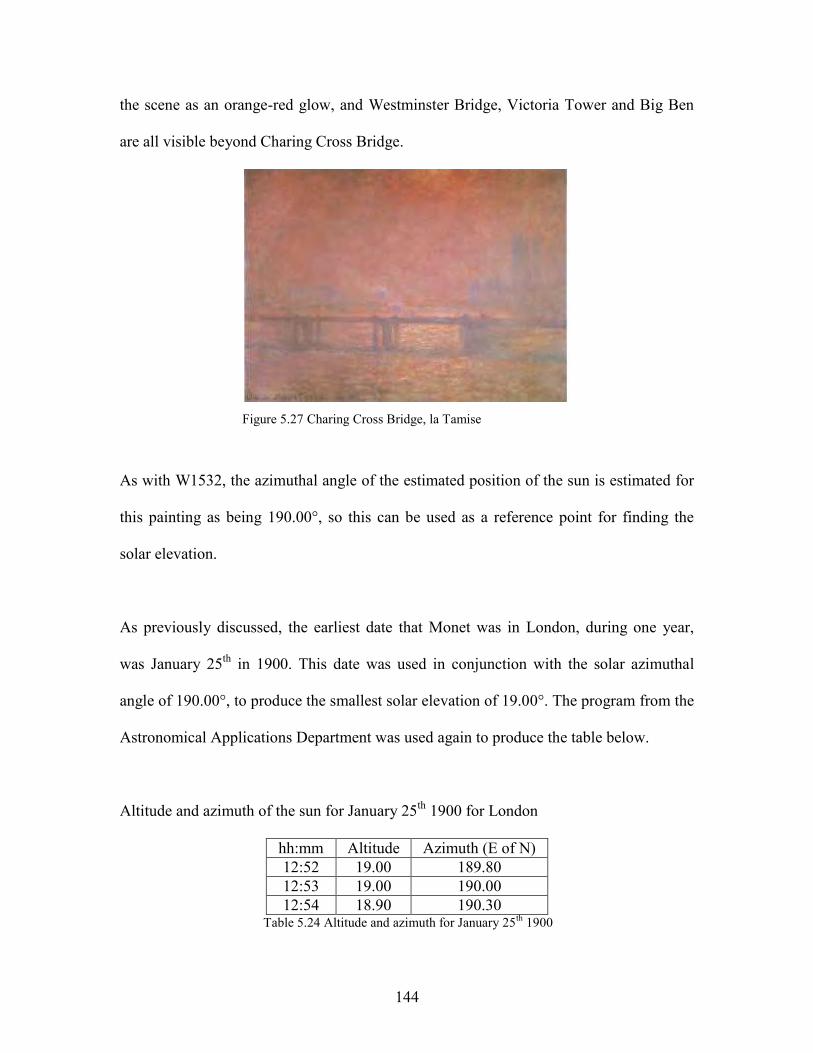
144
the scene as an orange-red glow, and Westminster Bridge, Victoria Tower and Big Ben
are all visible beyond Charing Cross Bridge.
Figure 5.27 Charing Cross Bridge, la Tamise
As with W1532, the azimuthal angle of the estimated position of the sun is estimated for
this painting as being 190.00°, so this can be used as a reference point for finding the
solar elevation.
As previously discussed, the earliest date that Monet was in London, during one year,
was January 25th
in 1900. This date was used in conjunction with the solar azimuthal
angle of 190.00°, to produce the smallest solar elevation of 19.00°. The program from the
Astronomical Applications Department was used again to produce the table below.
Altitude and azimuth of the sun for January 25th
1900 for London
hh:mm Altitude Azimuth (E of N)
12:52 19.00 189.80
12:53 19.00 190.00
12:54 18.90 190.30 Table 5.24 Altitude and azimuth for January 25
th 1900

145
Figure 5.28 shows the elevation of the sun relative to the elevations of Westminster
Bridge, Victoria Tower and Big Ben.
Figure 5.28 Elevation of the sun
The elevations of Victoria Tower and Big Ben can be compared to their measured heights,
in the painting, in order to determine a degree to millimetre ratio for each building. These
ratios are then multiplied by the relative difference between the elevation of the sun and
the elevations of the towers, which produces two respective heights, x and y, (in
millimetres) to the estimated position of the sun. These heights have been depicted in
Figure 5.29.
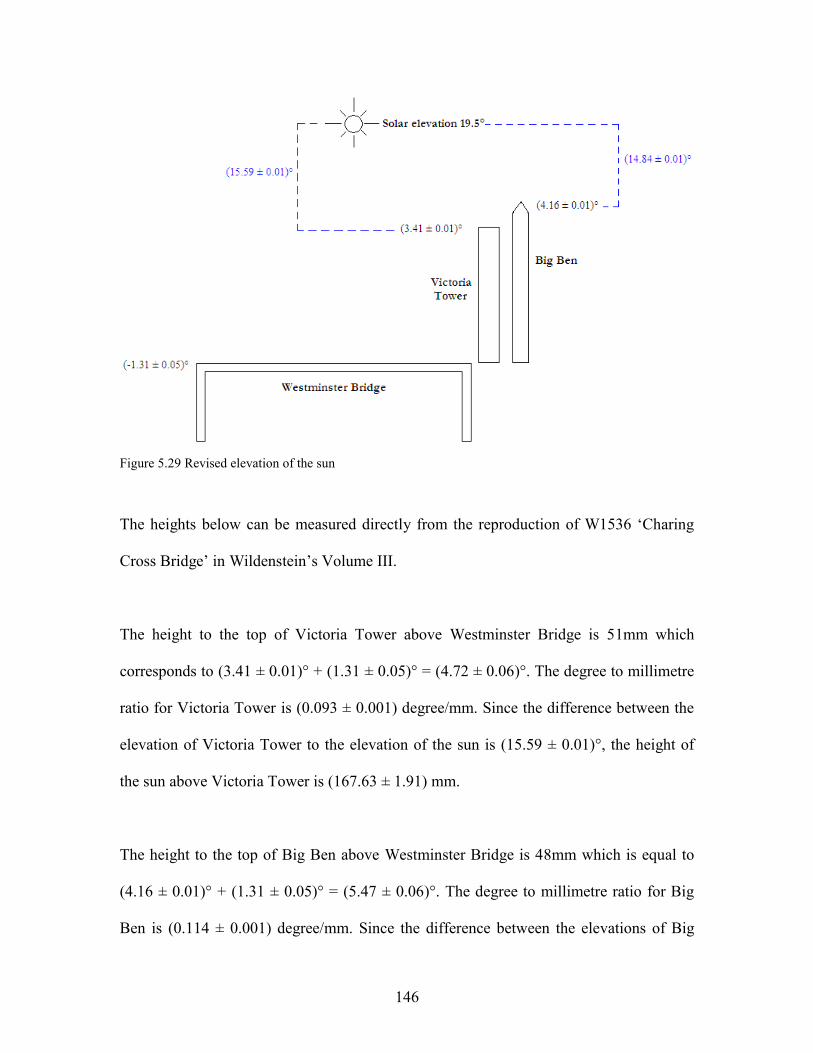
146
Figure 5.29 Revised elevation of the sun
The heights below can be measured directly from the reproduction of W1536 „Charing
Cross Bridge‟ in Wildenstein‟s Volume III.
The height to the top of Victoria Tower above Westminster Bridge is 51mm which
corresponds to (3.41 ± 0.01)° + (1.31 ± 0.05)° = (4.72 ± 0.06)°. The degree to millimetre
ratio for Victoria Tower is (0.093 ± 0.001) degree/mm. Since the difference between the
elevation of Victoria Tower to the elevation of the sun is (15.59 ± 0.01)°, the height of
the sun above Victoria Tower is (167.63 ± 1.91) mm.
The height to the top of Big Ben above Westminster Bridge is 48mm which is equal to
(4.16 ± 0.01)° + (1.31 ± 0.05)° = (5.47 ± 0.06)°. The degree to millimetre ratio for Big
Ben is (0.114 ± 0.001) degree/mm. Since the difference between the elevations of Big
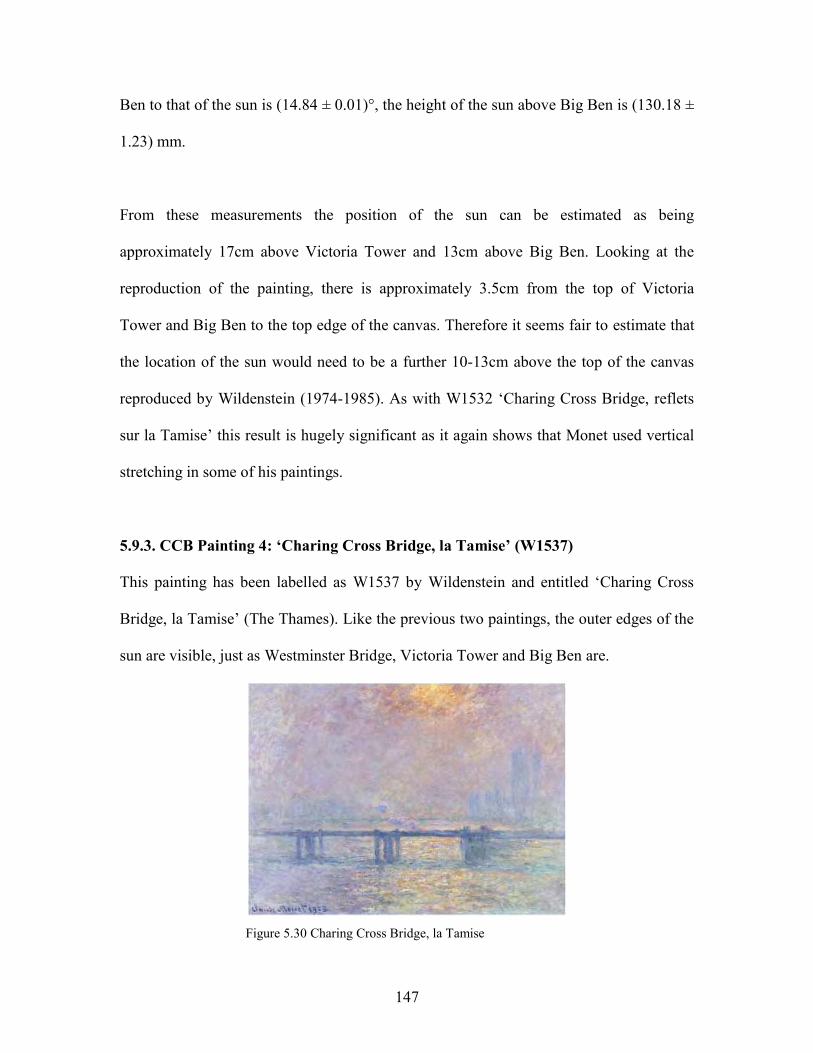
147
Ben to that of the sun is (14.84 ± 0.01)°, the height of the sun above Big Ben is (130.18 ±
1.23) mm.
From these measurements the position of the sun can be estimated as being
approximately 17cm above Victoria Tower and 13cm above Big Ben. Looking at the
reproduction of the painting, there is approximately 3.5cm from the top of Victoria
Tower and Big Ben to the top edge of the canvas. Therefore it seems fair to estimate that
the location of the sun would need to be a further 10-13cm above the top of the canvas
reproduced by Wildenstein (1974-1985). As with W1532 „Charing Cross Bridge, reflets
sur la Tamise‟ this result is hugely significant as it again shows that Monet used vertical
stretching in some of his paintings.
5.9.3. CCB Painting 4: ‘Charing Cross Bridge, la Tamise’ (W1537)
This painting has been labelled as W1537 by Wildenstein and entitled „Charing Cross
Bridge, la Tamise‟ (The Thames). Like the previous two paintings, the outer edges of the
sun are visible, just as Westminster Bridge, Victoria Tower and Big Ben are.
Figure 5.30 Charing Cross Bridge, la Tamise

148
The azimuthal angle for this painting is 190.00°, the same as that for W1536; but the
heights can be measured directly from the reproduction of W1537 „Charing Cross
Bridge‟ in Wildenstein‟s Volume III.
The height to the top of Victoria Tower above Westminster Bridge is 52mm which is
equal to (3.41 ± 0.01)° + (1.31 ± 0.05)° = (4.72 ± 0.06)°. The degree to millimetre ratio
for Victoria Tower is (0.091 ± 0.001) degree/mm. Since the difference between the
elevation of Victoria Tower to the elevation of the sun is (15.59 ± 0.01)°, the height of
the sun above Victoria Tower is (171.32 ± 1.99) mm.
The height to the top of Big Ben above Westminster Bridge is 46mm which corresponds
to (4.16 ± 0.01)° + (1.31 ± 0.05)° = (5.47 ± 0.06)°. The degree to millimetre ratio for Big
Ben is (0.119 ± 0.001) degree/mm. Since the difference between the elevation of Big Ben
to the elevation of the sun is (14.84 ± 0.01)°, the height of the sun above Big Ben is
(124.71 ± 1.13) mm.
From these measurements the position of the sun can be estimated as being
approximately 17cm above Victoria Tower and 12.5cm above Big Ben. Looking at the
reproduction of the painting, there is approximately 3.5-4cm from the top of Victoria
Tower and Big Ben to the top edge of the canvas. Therefore it seems fair to estimate that
the location of the sun would need to be a further 8.5-13.5cm above the top of the canvas
reproduced by Wildenstein (1974-1985). As with the previous two paintings, W1532
„Charing Cross Bridge, reflets sur la Tamise‟ nad W1536 „Charing Cross Bridge, la

149
Tamise‟, this painting reinforces that Monet stretched some of his scenes vertically when
depicting them on the canvases.
The dates, derived using the solar geometry, have been compared to the information
included within Monet‟s letters along with the data retrieved from the weather diaries and
the weather reports. For the eight paintings of Waterloo Bridge and the one painting of
Charing Cross Bridge, the synoptic data sets have reinforced the dates determined with
the solar geometry, which has thus reinforced the perceived accuracy of Monet‟s
depictions of London during 1900 and 1901. There were three paintings of Charing Cross
Bridge that the solar geometry method could not be applied to because of the estimated
height of the sun within each scene. The sun within each of these three paintings was
approximated to be between a minimum of 8.5cm and a maximum of 14cm above the top
of the canvas. Baker et al. (2009) discusses the idea that Monet stretched his paintings in
the vertical direction, working to emphasise the skyline and the atmosphere within each
scene. However, Monet did not repeat this stretching in the horizontal direction, and he
still managed to accurately depict the relative positioning of the structures within each
painting (Baker et al. 2009). This vertical stretching could be the reason that the
speculated solar position for the three paintings (W1532, W1536 and W1537) is so far off
the top of each canvas.
The strengths and weaknesses of the solar geometry method have been considered and
are listed in Table 5.25.
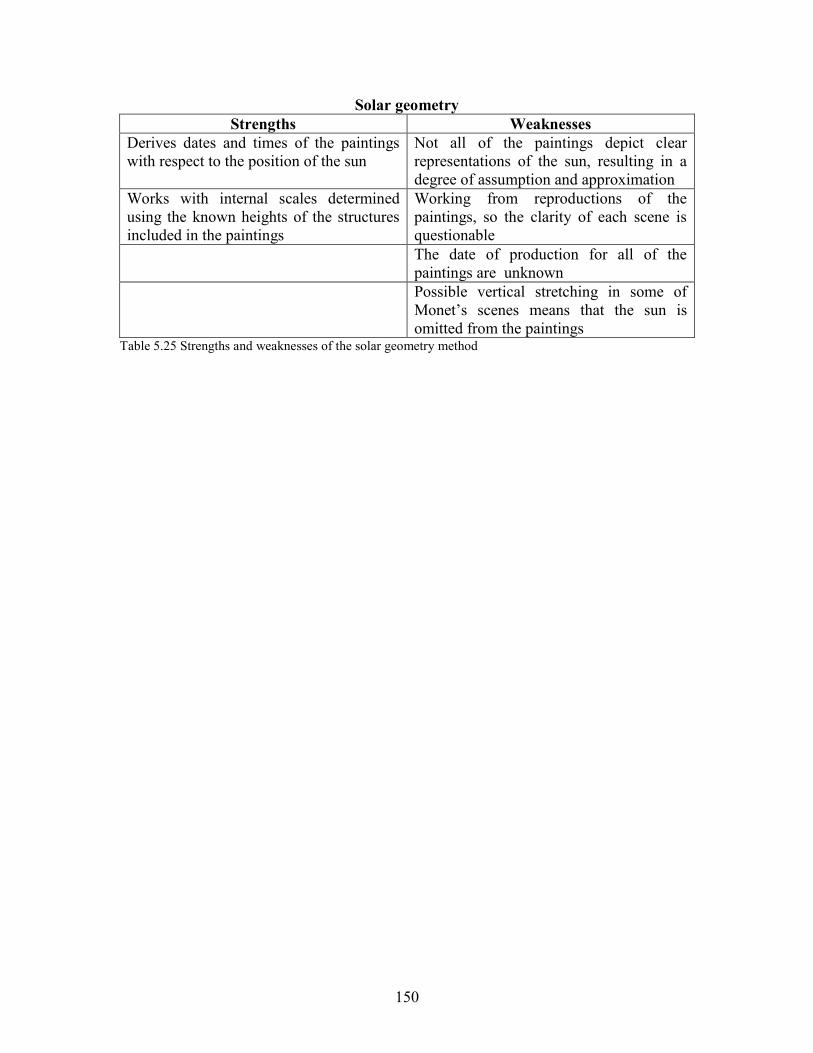
150
Solar geometry
Strengths Weaknesses
Derives dates and times of the paintings
with respect to the position of the sun
Not all of the paintings depict clear
representations of the sun, resulting in a
degree of assumption and approximation
Works with internal scales determined
using the known heights of the structures
included in the paintings
Working from reproductions of the
paintings, so the clarity of each scene is
questionable
The date of production for all of the
paintings are unknown
Possible vertical stretching in some of
Monet‟s scenes means that the sun is
omitted from the paintings Table 5.25 Strengths and weaknesses of the solar geometry method
151
CHAPTER 6: London’s climate 1899-1901
6.1. Introduction
In this chapter, the information retrieved from the weather data have been compared to
the dates derived for Monet‟s paintings of Waterloo Bridge and Charing Cross Bridge.
The dates for the weather data have also been cross-compared to the dates from Monet‟s
letters in an attempt to further refine the dates determined for the paintings.
6.2. Introduction to London’s changing climate
According to one of the latest version of the Köppen-Geiger Climate classification
(Figure 6.1; 2006) London lies in the middle of a warm temperate - fully humid - warm
summer climate (Cfb). The climate experienced in London, as well as the whole of the
British Isles, does not encounter any extremes in temperature, but does experience rain
during every month of the year (Met Office, 2007); with mild, wet summers and cool,
wet winters.

152
Figure 6.1 Köppen-Geiger Climate classification
The climate of London has seen several changes since the turn of the twentieth century,
when Monet was residing in the city. Most of these changes can be attributed to a
reduction of smoke levels and a corresponding increase in visibility and sunshine.
The method of measuring smoke levels, until 1960, consisted of drawing comparisons
between the darkness of a stain formed by air passing through a filter with a series of
standard, calibrated stains (Chandler, 1965). This process was open to a variety of errors
and was therefore replaced by more up-to-date photo-electric methods.
Smoke concentrations for Kew have been recorded for a period spanning a total of twenty
two years within the time frame 1935 to 1962 (1935-1952 and 1957-1962). The mean

153
winter concentrations decreased considerably between the two periods, whereas the
summer concentrations still showed some similarity (Chandler, 1965). The tables below
highlight these situations.
Mean
Winter (October-March) 217
Summer (April-September) 62
Table 6.1 Average smoke concentrations in Kew µg/m3
1932-52 (Chandler, 1965)
Mean
Winter (October-March) 147
Summer (April-September) 61
Table 6.2 Average smoke concentrations in Kew µg/m3
1957-62 (Chandler, 1965)
The decrease in emissions can be partially accredited to smoke control regulations which
encouraged the use of more efficient fuels by industries and domestic consumers, such as
oil and electricity (Chandler, 1965).
Figure 6.2 demonstrates the likely changes in air pollution that has London experienced
since the seventeenth century.
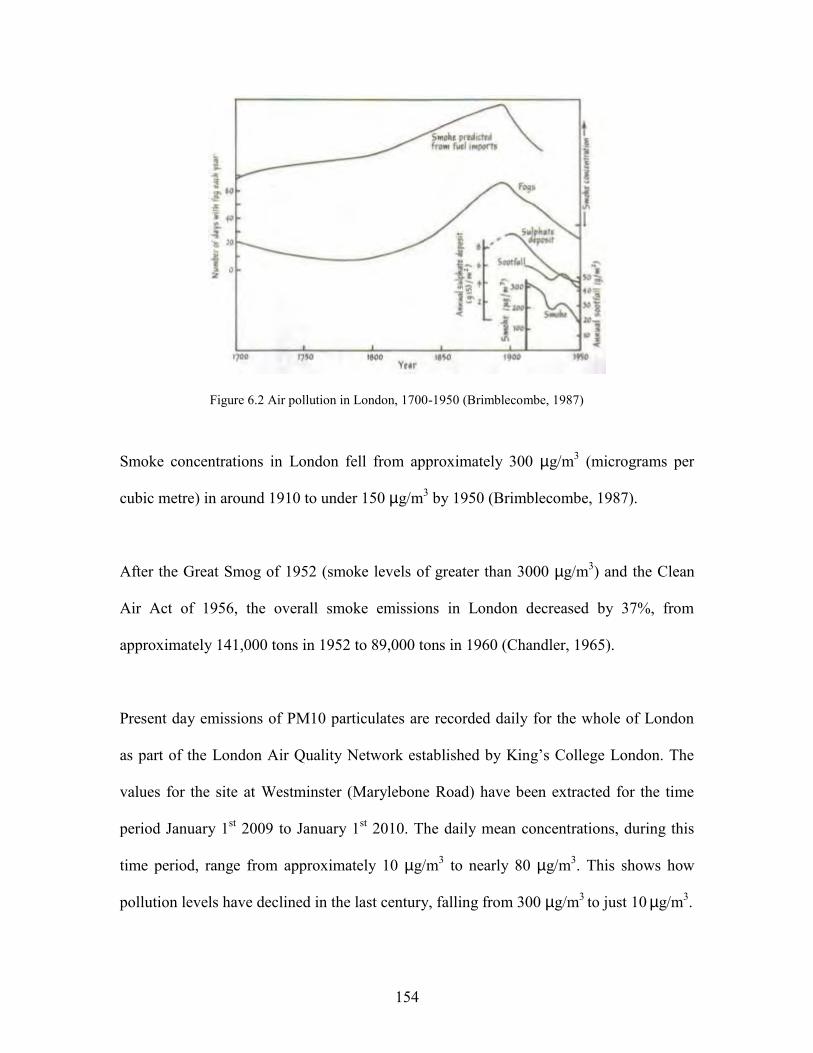
154
Figure 6.2 Air pollution in London, 1700-1950 (Brimblecombe, 1987)
Smoke concentrations in London fell from approximately 300 µg/m3 (micrograms per
cubic metre) in around 1910 to under 150 µg/m3 by 1950 (Brimblecombe, 1987).
After the Great Smog of 1952 (smoke levels of greater than 3000 µg/m3) and the Clean
Air Act of 1956, the overall smoke emissions in London decreased by 37%, from
approximately 141,000 tons in 1952 to 89,000 tons in 1960 (Chandler, 1965).
Present day emissions of PM10 particulates are recorded daily for the whole of London
as part of the London Air Quality Network established by King‟s College London. The
values for the site at Westminster (Marylebone Road) have been extracted for the time
period January 1st 2009 to January 1
st 2010. The daily mean concentrations, during this
time period, range from approximately 10 µg/m3 to nearly 80 µg/m
3. This shows how
pollution levels have declined in the last century, falling from 300 µg/m3
to just 10 µg/m
3.
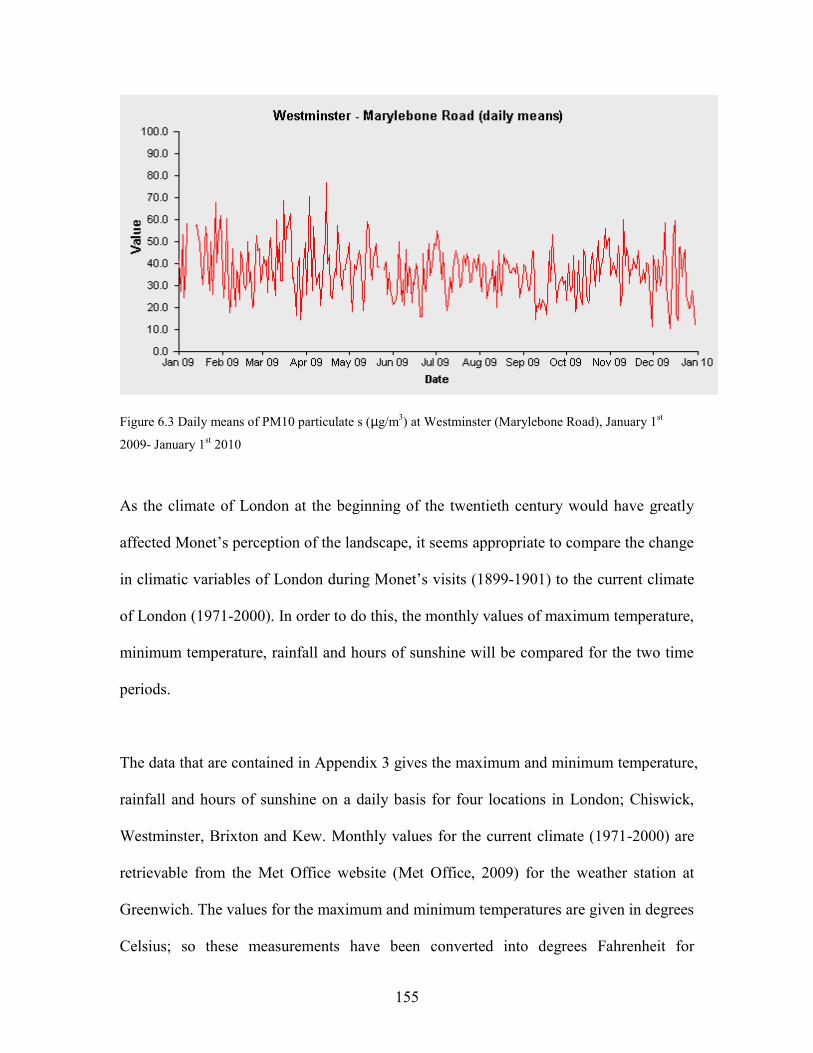
155
Figure 6.3 Daily means of PM10 particulate s (µg/m3) at Westminster (Marylebone Road), January 1
st
2009- January 1st 2010
As the climate of London at the beginning of the twentieth century would have greatly
affected Monet‟s perception of the landscape, it seems appropriate to compare the change
in climatic variables of London during Monet‟s visits (1899-1901) to the current climate
of London (1971-2000). In order to do this, the monthly values of maximum temperature,
minimum temperature, rainfall and hours of sunshine will be compared for the two time
periods.
The data that are contained in Appendix 3 gives the maximum and minimum temperature,
rainfall and hours of sunshine on a daily basis for four locations in London; Chiswick,
Westminster, Brixton and Kew. Monthly values for the current climate (1971-2000) are
retrievable from the Met Office website (Met Office, 2009) for the weather station at
Greenwich. The values for the maximum and minimum temperatures are given in degrees
Celsius; so these measurements have been converted into degrees Fahrenheit for
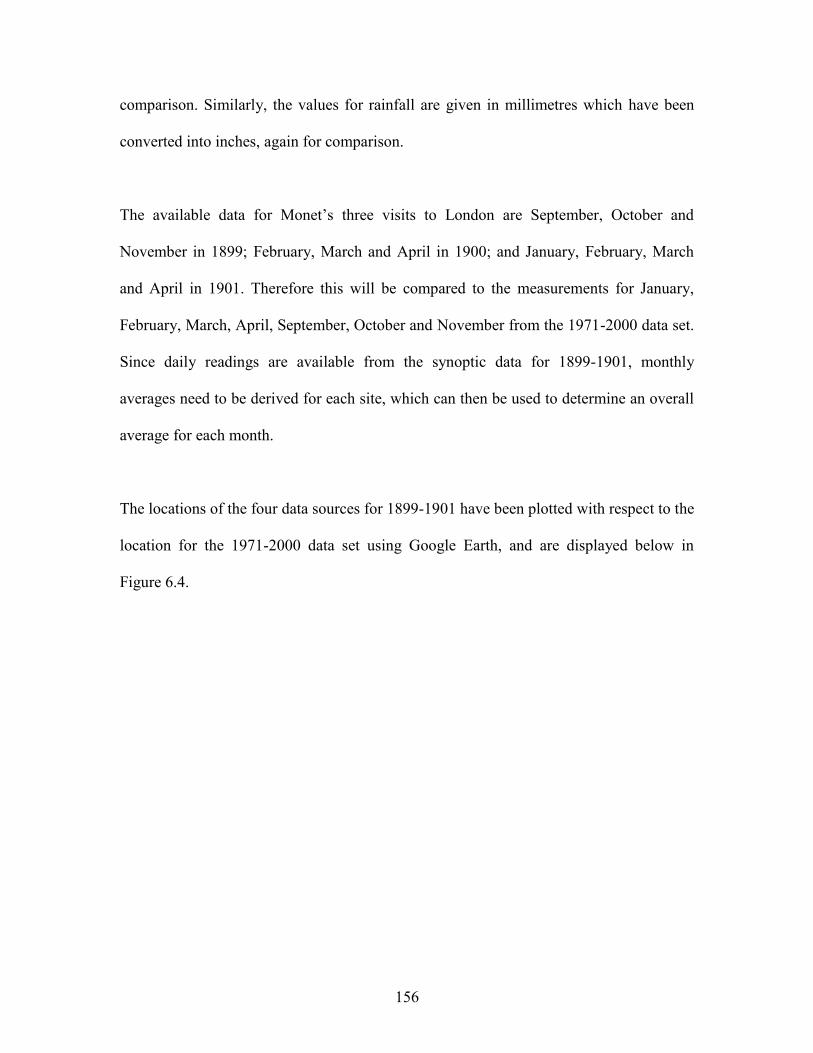
156
comparison. Similarly, the values for rainfall are given in millimetres which have been
converted into inches, again for comparison.
The available data for Monet‟s three visits to London are September, October and
November in 1899; February, March and April in 1900; and January, February, March
and April in 1901. Therefore this will be compared to the measurements for January,
February, March, April, September, October and November from the 1971-2000 data set.
Since daily readings are available from the synoptic data for 1899-1901, monthly
averages need to be derived for each site, which can then be used to determine an overall
average for each month.
The locations of the four data sources for 1899-1901 have been plotted with respect to the
location for the 1971-2000 data set using Google Earth, and are displayed below in
Figure 6.4.
157
Figure 6.4 Locations of the Westminster, Brixton, Chiswick, Kew and Greenwich with respect to the Savoy
Hotel
This map shows the proximity of the data sources, with Greenwich being only 5.24 miles
(8.43 km) east of the Savoy Hotel. Therefore it can be assumed to be reasonable to
compare the information gathered from all of the data sources in question.
The general trends for the maximum and minimum temperatures, between the two time
frames show that the climate in 1971-2000 was generally warmer than the meteorological
situation experienced whilst Monet was residing in London. Nevertheless, the

158
temperatures for November in 1899 were higher than those for the thirty year period,
1971-2000.
On the whole, the rainfall amounts show that the climate in London during 1971-2000
was drier than the situation during Monet‟s stay, at the turn of the twentieth century.
However, the amount of rainfall experienced in January 1901 was exactly the same
amount recorded for the time period 1971-2000.
Finally, the hours of sunshine reported during the thirty year time period are more than
those reported in 1899-1901, with the exception of September and November in 1899
which experienced slightly more sun than the same months in the 1971-2000 data set.
The main reason for the hours of sunshine being lower, during the majority of the months
analysed in the period 1899-1901, is predominantly the result of the levels of smoke and
fog present at the turn of the twentieth century.
The slight anomaly for hours of sunshine recorded in September and November 1899
may be a feature of the averaging process required to determine the monthly amount of
sunshine for these months. On closer inspection, the hours of sunshine for September
1899 range from a minimum of 0.3 hours to a maximum of 9 hours. The difference
between the average hours of sunshine for the two time periods (1899 and 1971-2000) is
only 0.16 hours greater for September 1899. Therefore it is reasonable to look at the
number of days when the hours of sunshine are above and below the average value for

159
1971-2000, which is 4.64 hours. In September 1899, there are an equal amount of days
when sunshine levels are less than or greater than 4.64 hours. This supports the
hypothesis that the average hours of sunshine in September 1899 are greater than
September during 1971-2000 because of the averaging process. Similarly, for November
1899, the hours of sunshine range from a minimum of 0 hours to a maximum of 7.1 hours.
The difference between the average hours of sunshine for November 1899 is 0.48 hours
greater than November in 1971-2000. Hence, it is fair to look at the number of days when
the sunshine levels are above or below the average value for November 1971-2000,
which is 2.02 hours. During this particular month, there is approximately the same
number of occasions that experienced hours of sunshine above or below this figure. This
again highlights that the averaging process resulted in a greater value for sunshine levels
in November 1899 when compared to the same month during 1971-2000.
Overall, it seems that the climatic variables that Monet encountered during his three stays
in London were colder and wetter than the climate during 1971-2000. It also appears, that
Monet would have experienced less sunshine when he was in London, compared to the
values of the 1971-2000 data set. Since Monet was in London to paint the fogs, it seems
that the weather conditions during the time that Monet was residing in London would
have been much more favourable to him rather than the warmer and drier conditions
experienced in 1971-2000. Recordings of fog/mist for the two time periods can be found
in Appendix 3 and Appendix 4.

160
Another factor that may be of interest here is the microclimate of London, which will
affect the temperatures measured in the city compared to those measured in the nearby
rural locations (Jones and Lister, 2009). This effect is known as the Urban Heat Island
(UHI). In 2009, Jones and Lister conducted a study of the urban heat island (UHI)
experienced by locations in Central London and the surrounding areas, during the time
frame 1900-2006. They found that the UHIs and urban-related warming observed
increases at two of the suburban sites; Heathrow and Kew. However, the sites within
Central London experienced constant UHIs and thus did not see any overall urban-related
warming trends. Using the temperature readings for St James‟s Park and the London
Weather Centre, (sites in Central London), Jones and Lister concluded that the UHI for
Central London must have occurred before the beginning of the twentieth century.
Another element of this chapter is to compare the data sets selected for this study. The
analysed data falls into either artistic or scientific categories, so this study is a true case of
art versus science.
By painting his London Series, Monet produced many artistic representations of the
London fogs at the turn of the twentieth century. As previously discussed, Monet wrote
numerous letters to his wife, Alice, and other acquaintances which contained many
observations of the weather that he experienced during his stays. For this reason, Monet‟s
letters are going to be used as another source of information regarding the London fogs.
Whilst visiting London in 1900, Monet wrote a total of forty six letters, eight of which
161
contained observations of fog. During the following year, in 1901, Monet wrote about the
fogs in ten letters out of a total of forty nine.
The scientific data that were retrieved and considered are the Royal Horticultural
Society‟s weather diaries along with the weather reports for Westminster, Brixton and
Kew. The data that has been retrieved from these four sources has also been cross-
referenced with respect to four pairings of the locations in an attempt to determine the
spatial variation of the fogs around London at the turn of the twentieth century.
The concept of comparing artistic representations to „real‟ synoptic data will hopefully
aid in demonstrating that information collated from artistic and scientific fields can be
used concurrently as well as independently.
6.3. Observed weather data for the periods Monet was in London 1899-1901
The term „meteorological data‟ covers a wide range of data criterion. For the purpose of
this investigation, two types of data are being employed. Firstly, the meteorological
observations recorded in the Royal Horticultural Society‟s weather diaries will undergo
analysis. The second criteria of meteorological data that will be used are weather reports
from various weather stations around London. These weather stations provided a base for
meteorologists to collate information that would then be used in the production of daily
weather reports. The Royal Horticultural Society‟s weather diaries and the weather
reports are all held at the Meteorological Office Archives in Exeter.

162
The entries of the diaries can be examined with respect to Monet‟s London Series as well
as his letters. The content of Monet‟s eight paintings of Waterloo Bridge and one painting
of Charing Cross Bridge, for 1900 and 1901, can be compared to the information collated
from the Royal Horticultural Society‟s weather diaries as well as the weather reports for
the same time period. The paintings were split into two groups for analysis; those dated
as being produced in either 1900 or 1901, and those dated as 1901 only. The dates of the
corresponding observations from the weather diaries are displayed in Appendix 10.
Monet‟s letters of correspondence, that he wrote whilst residing in London from 1899 to
1901, have been translated and studied, and the letters that include any details about the
fogs of London have been selected for analysis. Monet wrote of occasions when there
was either too little or too much fog, both of which were useless to him. On the one hand,
too little fog meant that Monet could not capture any atmospheric effects in his paintings,
and on the other hand, too much fog meant that the whole scene would be obscured and
again Monet would not be able to portray the atmospheric effects. Monet was waiting for
the occasions when the fog reached an optimal depth that could be depicted within his
London Series.
6.3.1. Comparison
The information contained in Monet‟s letters can be compared to the data collected from
the various synoptic sources mentioned previously. The dates that Monet wrote his letters
are given at the beginning of each letter, so it was a simple case of selecting the letters
from the known periods that Monet was in London and reading each letter to determine
which ones contained information about the London fogs. The synoptic data can also be
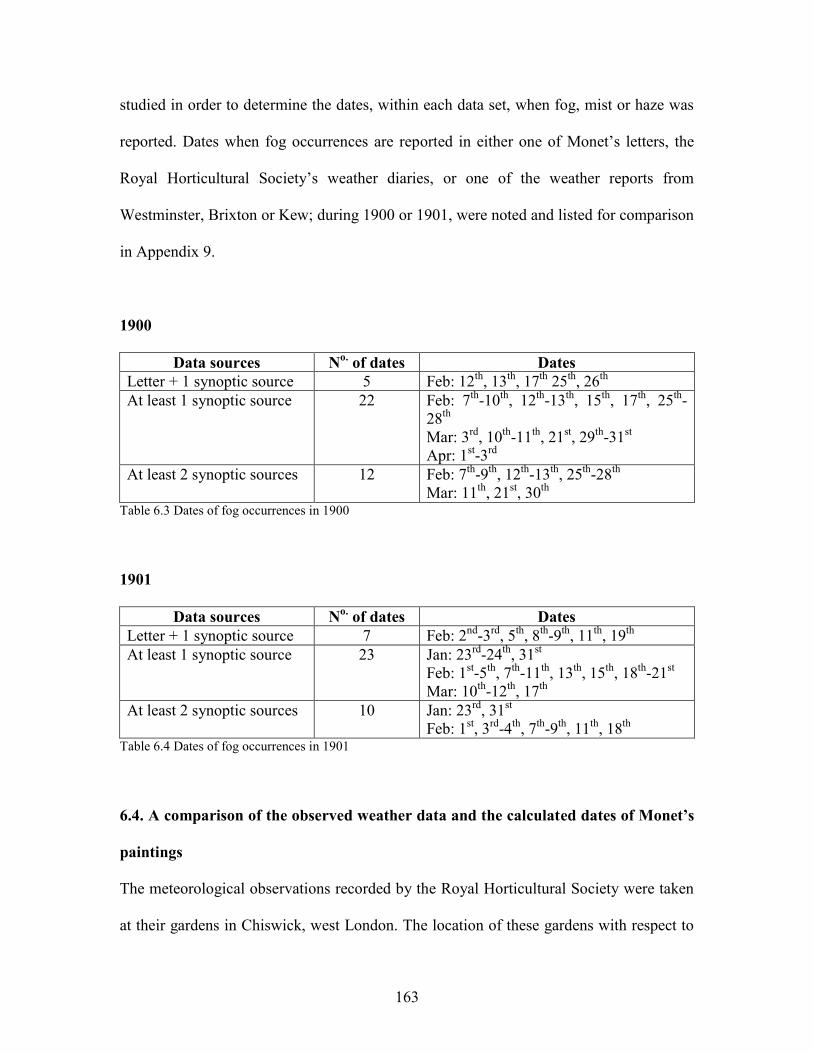
163
studied in order to determine the dates, within each data set, when fog, mist or haze was
reported. Dates when fog occurrences are reported in either one of Monet‟s letters, the
Royal Horticultural Society‟s weather diaries, or one of the weather reports from
Westminster, Brixton or Kew; during 1900 or 1901, were noted and listed for comparison
in Appendix 9.
1900
Data sources No.
of dates Dates
Letter + 1 synoptic source 5 Feb: 12th
, 13th
, 17th
25th
, 26th
At least 1 synoptic source 22 Feb: 7th
-10th
, 12th
-13th
, 15th
, 17th
, 25th
-
28th
Mar: 3rd
, 10th
-11th
, 21st, 29
th-31
st
Apr: 1st-3
rd
At least 2 synoptic sources 12 Feb: 7th
-9th
, 12th
-13th
, 25th
-28th
Mar: 11th
, 21st, 30
th
Table 6.3 Dates of fog occurrences in 1900
1901
Data sources No.
of dates Dates
Letter + 1 synoptic source 7 Feb: 2nd
-3rd
, 5th
, 8th
-9th
, 11th
, 19th
At least 1 synoptic source 23 Jan: 23rd
-24th
, 31st
Feb: 1st-5
th, 7
th-11
th, 13
th, 15
th, 18
th-21
st
Mar: 10th
-12th
, 17th
At least 2 synoptic sources 10 Jan: 23rd
, 31st
Feb: 1st, 3
rd-4
th, 7
th-9
th, 11
th, 18
th
Table 6.4 Dates of fog occurrences in 1901
6.4. A comparison of the observed weather data and the calculated dates of Monet’s
paintings
The meteorological observations recorded by the Royal Horticultural Society were taken
at their gardens in Chiswick, west London. The location of these gardens with respect to
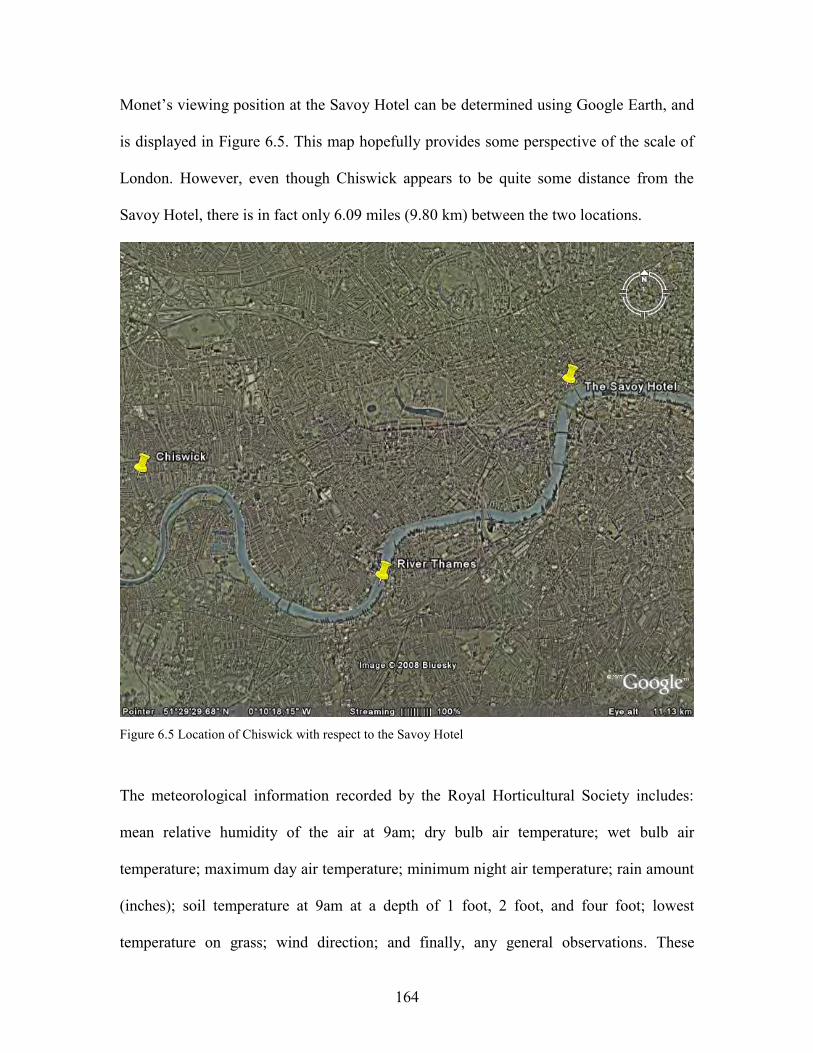
164
Monet‟s viewing position at the Savoy Hotel can be determined using Google Earth, and
is displayed in Figure 6.5. This map hopefully provides some perspective of the scale of
London. However, even though Chiswick appears to be quite some distance from the
Savoy Hotel, there is in fact only 6.09 miles (9.80 km) between the two locations.
Figure 6.5 Location of Chiswick with respect to the Savoy Hotel
The meteorological information recorded by the Royal Horticultural Society includes:
mean relative humidity of the air at 9am; dry bulb air temperature; wet bulb air
temperature; maximum day air temperature; minimum night air temperature; rain amount
(inches); soil temperature at 9am at a depth of 1 foot, 2 foot, and four foot; lowest
temperature on grass; wind direction; and finally, any general observations. These
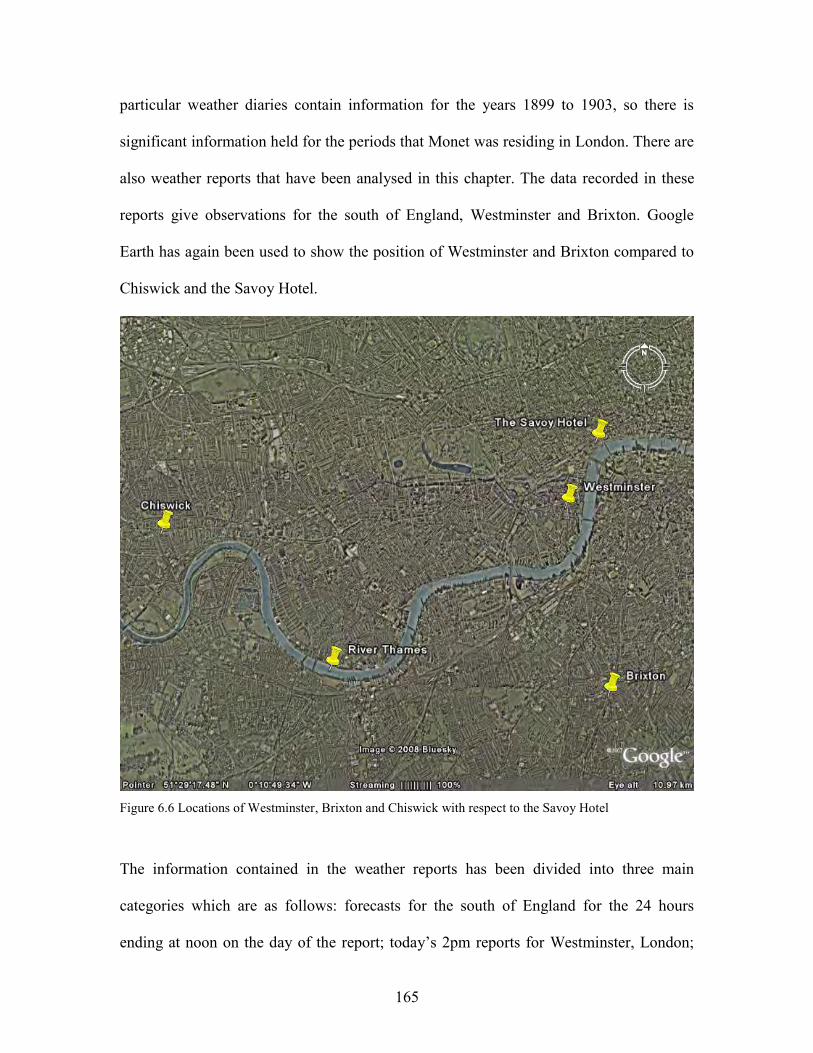
165
particular weather diaries contain information for the years 1899 to 1903, so there is
significant information held for the periods that Monet was residing in London. There are
also weather reports that have been analysed in this chapter. The data recorded in these
reports give observations for the south of England, Westminster and Brixton. Google
Earth has again been used to show the position of Westminster and Brixton compared to
Chiswick and the Savoy Hotel.
Figure 6.6 Locations of Westminster, Brixton and Chiswick with respect to the Savoy Hotel
The information contained in the weather reports has been divided into three main
categories which are as follows: forecasts for the south of England for the 24 hours
ending at noon on the day of the report; today‟s 2pm reports for Westminster, London;
166
and the daily weather reports for Brixton, London. These three categories contain much
more information about the weather than the titles state.
Forecasts for the south of England for the 24 hours ending at noon on the day of the
report → wind direction and strength, observations.
Today‟s 2pm reports for Westminster, London → barometer reading, dry bulb
temperature, wet bulb temperature, wind direction, wind force, observations.
Daily weather reports for Brixton, London → Yesterday evening: barometer reading,
dry bulb temperature, wind direction and force, weather. This morning: barometer
reading, change in barometer reading since yesterday, dry bulb temperature, wet bulb
temperature, change in dry bulb temperature since yesterday, wind direction and force,
weather, sea. Past 24 hours: weather, hours of bright sunshine (recorded on the Tower
of the Wesleyan Training College, Westminster), maximum temperature, minimum
temperature, rainfall amount (inches).
These particular weather reports cover the time period July 1st – December 31
st 1899 and
January 1st – June 30
th 1900, hence Monet‟s first and second visits to London can be
analysed with respect to these reports. As Monet‟s last visit is not covered by these
weather reports, it seemed beneficial to use some alternative weather reports as well.
The information retrieved from the Royal Horticultural Society‟s weather diaries and the
various other weather reports can be found in Appendix 3.

167
There are another set of weather observations for Brixton and Kew, covering the
following time periods; September to November in 1899, February 1900, as well as
January and February in 1901. The daily observations from Brixton weather station are
divided into three time frames: 8am → dry bulb temperature, wet bulb temperature,
maximum temperature, minimum temperature, wind direction and weather; 2pm → dry
bulb temperature, wet bulb temperature, wind direction and weather; 6pm → dry bulb
temperature, wet bulb temperature, wind direction, weather and remarks. Two hourly
observations were taken at Kew weather station, from 10am to 10pm, with any additional
remarks also logged.
The location of Kew has been added to the Google Earth image which highlights all of
the locations that meteorological information was available for.

168
Figure 6.7 Locations of Westminster, Brixton, Chiswick and Kew with respect to the Savoy Hotel
Retrieving data for the four locations, shown in Figure 6.7, will help to produce an
overall picture of the weather conditions experienced in London when Monet was
painting his series.
An analysis of the localities of Chiswick, Westminster, Brixton and Kew, may help to
show the spatial variation of the mists and fogs that occurred in London during the
periods that Monet was residing in the city. Figure 6.7 shows the four locations with
respect to the Savoy Hotel.

169
The likelihood of fog occurring can also be determined from the value of relative
humidity. This is given as a percentage and is a measure of the ratio of the actual
moisture content of the air to the potential moisture content. The relative humidity can be
determined from psychometric charts if both the dry bulb temperature and wet bulb
temperature are known. For the purpose of this study, a relative humidity calculator will
be utilised from the following website http://www.ringbell.co.uk/info/humid.htm. The
dry bulb temperatures and wet bulb temperatures for the observations recorded at
Chiswick, Westminster and Brixton will be entered into the calculator in order to
determine a relative humidity for each reading.
It has been stated that fog normally occurs at a relative humidity near 100% (Gleissman,
2007), mist at a relative humidity of 95% or greater, and haze at a relative humidity
below 95%. Therefore, the dates that will be selected are those when mist, fog or haze
has been reported on that day, or alternatively when the derived relative humidity is
greater than or equal to 90%. The calculated values for the relative humidity are given
with the other values of observations in Appendix 6.
September 1899
Dates Sites Weather observation RH (%)
18th
Westminster Fog Brixton ≥ 90%
20th
Westminster Fog
29th
Chiswick & Brixton Mist ≥ 90%
30th
Chiswick & Brixton ≥ 90%
Table 6.5 Dates in September 1899 when mist, fog or a RH ≥ 90% were reported at Chiswick,
Westminster, Brixton or Kew
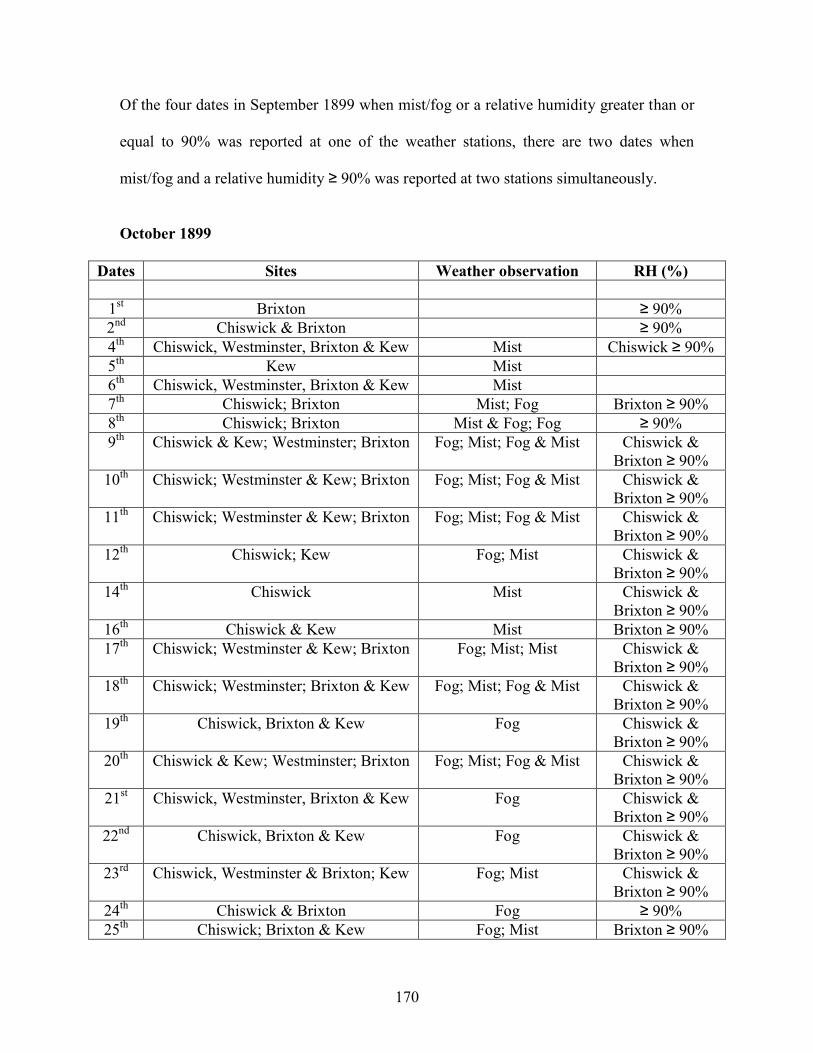
170
Of the four dates in September 1899 when mist/fog or a relative humidity greater than or
equal to 90% was reported at one of the weather stations, there are two dates when
mist/fog and a relative humidity ≥ 90% was reported at two stations simultaneously.
October 1899
Dates Sites Weather observation RH (%)
1st Brixton ≥ 90%
2nd
Chiswick & Brixton ≥ 90%
4th
Chiswick, Westminster, Brixton & Kew Mist Chiswick ≥ 90%
5th
Kew Mist
6th
Chiswick, Westminster, Brixton & Kew Mist
7th
Chiswick; Brixton Mist; Fog Brixton ≥ 90%
8th
Chiswick; Brixton Mist & Fog; Fog ≥ 90%
9th
Chiswick & Kew; Westminster; Brixton Fog; Mist; Fog & Mist Chiswick &
Brixton ≥ 90%
10th
Chiswick; Westminster & Kew; Brixton Fog; Mist; Fog & Mist Chiswick &
Brixton ≥ 90%
11th
Chiswick; Westminster & Kew; Brixton Fog; Mist; Fog & Mist Chiswick &
Brixton ≥ 90%
12th
Chiswick; Kew Fog; Mist Chiswick &
Brixton ≥ 90%
14th
Chiswick Mist Chiswick &
Brixton ≥ 90%
16th
Chiswick & Kew Mist Brixton ≥ 90%
17th
Chiswick; Westminster & Kew; Brixton Fog; Mist; Mist Chiswick &
Brixton ≥ 90%
18th
Chiswick; Westminster; Brixton & Kew Fog; Mist; Fog & Mist Chiswick &
Brixton ≥ 90%
19th
Chiswick, Brixton & Kew Fog Chiswick &
Brixton ≥ 90%
20th
Chiswick & Kew; Westminster; Brixton Fog; Mist; Fog & Mist Chiswick &
Brixton ≥ 90%
21st Chiswick, Westminster, Brixton & Kew Fog Chiswick &
Brixton ≥ 90%
22nd
Chiswick, Brixton & Kew Fog Chiswick &
Brixton ≥ 90%
23rd
Chiswick, Westminster & Brixton; Kew Fog; Mist Chiswick &
Brixton ≥ 90%
24th
Chiswick & Brixton Fog ≥ 90%
25th
Chiswick; Brixton & Kew Fog; Mist Brixton ≥ 90%
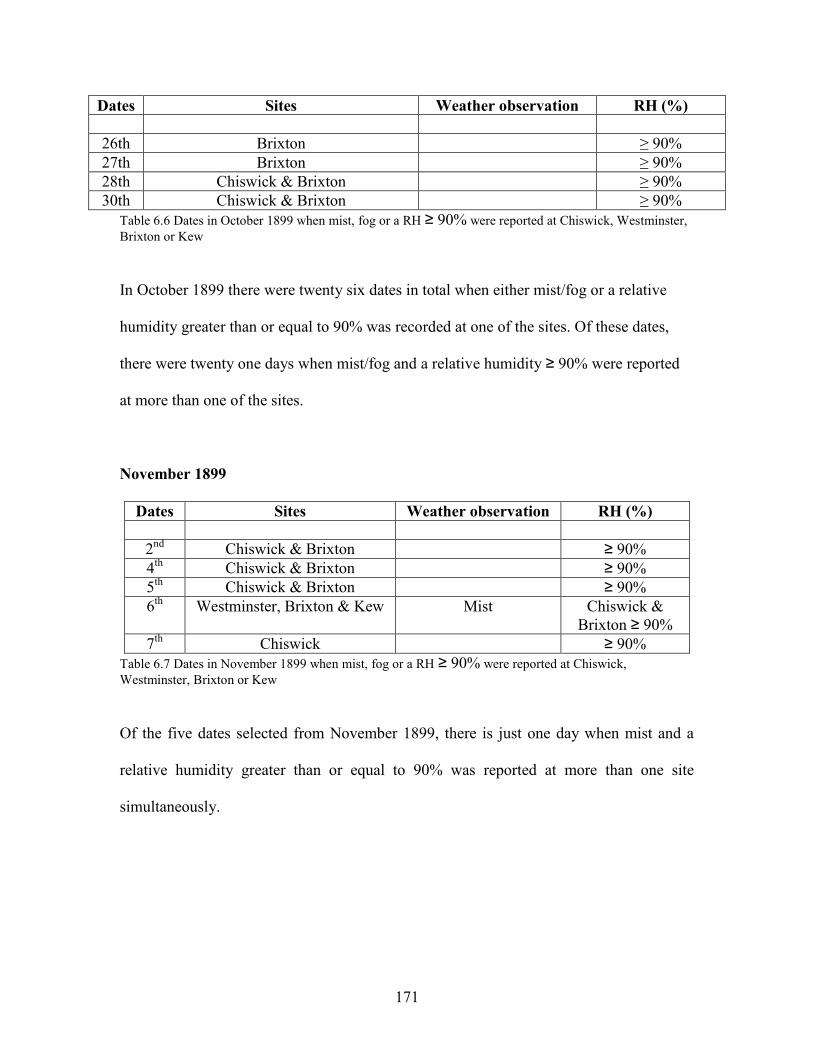
171
Dates Sites Weather observation RH (%)
26th Brixton ≥ 90%
27th Brixton ≥ 90%
28th Chiswick & Brixton ≥ 90%
30th Chiswick & Brixton ≥ 90%
Table 6.6 Dates in October 1899 when mist, fog or a RH ≥ 90% were reported at Chiswick, Westminster,
Brixton or Kew
In October 1899 there were twenty six dates in total when either mist/fog or a relative
humidity greater than or equal to 90% was recorded at one of the sites. Of these dates,
there were twenty one days when mist/fog and a relative humidity ≥ 90% were reported
at more than one of the sites.
November 1899
Dates Sites Weather observation RH (%)
2nd
Chiswick & Brixton ≥ 90%
4th
Chiswick & Brixton ≥ 90%
5th
Chiswick & Brixton ≥ 90%
6th
Westminster, Brixton & Kew Mist Chiswick &
Brixton ≥ 90%
7th
Chiswick ≥ 90%
Table 6.7 Dates in November 1899 when mist, fog or a RH ≥ 90% were reported at Chiswick,
Westminster, Brixton or Kew
Of the five dates selected from November 1899, there is just one day when mist and a
relative humidity greater than or equal to 90% was reported at more than one site
simultaneously.

172
February 1900
Dates Sites Weather observation RH (%) Paintings
7th
Westminster &
Brixton
Mist
8th
Westminster &
Brixton
Mist
9th
Chiswick,
Westminster &
Brixton
Fog Chiswick ≥ 90%
10th
Kew Mist
12th
Chiswick; Brixton;
Kew
Fog & Haze; Mist;
Mist & Fog
Chiswick ≥ 90%
13th
Chiswick;
Westminster; Brixton
& Kew
Fog; Mist; Fog & Mist Chiswick ≥ 90%
14th
Brixton ≥ 90%
15th
Kew Mist Chiswick ≥ 90%
16th
W1573
17th
Westminster &
Brixton
Mist Brixton ≥ 90% W1572
18th
Brixton ≥ 90%
19th
Chiswick ≥ 90%
22nd
W1574
23rd
Chiswick & Brixton ≥ 90%
24th
Brixton ≥ 90%
25th
Chiswick & Kew Mist Chiswick &
Brixton ≥ 90%
26th
Chiswick, Brixton &
Kew
Mist Chiswick &
Brixton ≥ 90%
27th
Brixton; Kew Fog; Mist Chiswick,
Westminster &
Brixton ≥ 90%
28th
Chiswick, Brixton &
Kew
Mist Chiswick,
Westminster &
Brixton ≥ 90%
W1575
Table 6.8 Dates in February 1900 when mist, fog or a RH ≥ 90% were reported at Chiswick, Westminster,
Brixton or Kew
There were nineteen dates in February 1900 when mist/fog or a relative humidity greater
than or equal to 90% was reported at one of the weather stations, and on ten of these days
mist/fog and a relative humidity ≥ 90% was reported at two stations simultaneously. The

173
dates of production derived for two of Monet‟s paintings (W1572 and W1575) also
correspond to two of the dates when mist/fog and a relative humidity ≥ 90% were
reported.
March 1900
Dates Sites Weather observation RH (%) Paintings
3rd
Chiswick Mist
6th
W1563
10th
Chiswick Mist Brixton ≥ 90%
11th
Chiswick & Brixton Mist
16th
Brixton ≥ 90%
19th
Chiswick & Brixton ≥ 90%
21st Chiswick; Brixton Mist; Fog Brixton ≥ 90%
23rd
Chiswick ≥ 90%
29th
Chiswick Fog
30th
Chiswick & Brixton Fog Brixton ≥ 90%
31st Chiswick Mist
Table 6.9 Dates in March 1900 when mist, fog or a RH ≥ 90% were reported at Chiswick, Westminster,
Brixton or Kew
Of the eleven dates in March 1900 when mist/fog or a relative humidity greater than or
equal to 90% was reported at one of the weather stations, there are four dates when
mist/fog and a relative humidity ≥ 90% was reported at two stations simultaneously.
April 1900
Dates Sites Weather observation RH (%) Paintings
1st Chiswick Mist
2nd
Chiswick Mist Brixton ≥ 90%
3rd
Chiswick Mist ≥ 90%
Table 6.10 Dates in April 1900 when mist, fog or a RH ≥ 90% were reported at Chiswick,
Westminster, Brixton or Kew
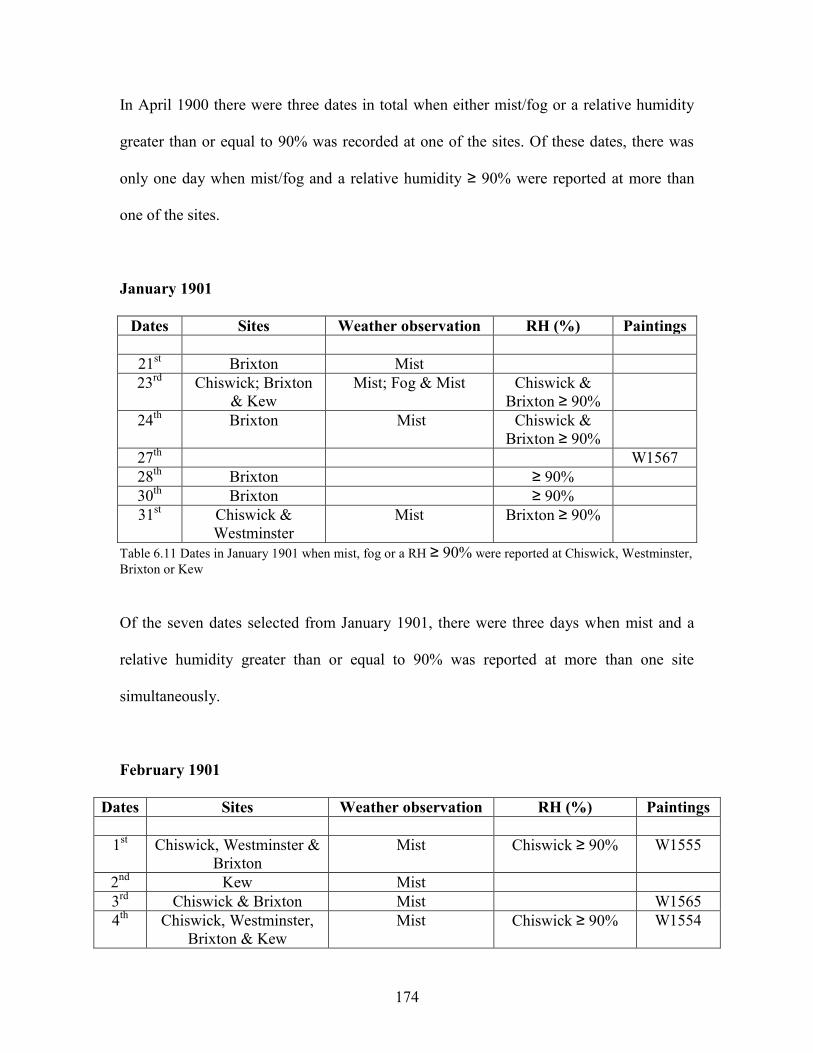
174
In April 1900 there were three dates in total when either mist/fog or a relative humidity
greater than or equal to 90% was recorded at one of the sites. Of these dates, there was
only one day when mist/fog and a relative humidity ≥ 90% were reported at more than
one of the sites.
January 1901
Dates Sites Weather observation RH (%) Paintings
21st Brixton Mist
23rd
Chiswick; Brixton
& Kew
Mist; Fog & Mist Chiswick &
Brixton ≥ 90%
24th
Brixton Mist Chiswick &
Brixton ≥ 90%
27th
W1567
28th
Brixton ≥ 90%
30th
Brixton ≥ 90%
31st Chiswick &
Westminster
Mist Brixton ≥ 90%
Table 6.11 Dates in January 1901 when mist, fog or a RH ≥ 90% were reported at Chiswick, Westminster,
Brixton or Kew
Of the seven dates selected from January 1901, there were three days when mist and a
relative humidity greater than or equal to 90% was reported at more than one site
simultaneously.
February 1901
Dates Sites Weather observation RH (%) Paintings
1st Chiswick, Westminster &
Brixton
Mist Chiswick ≥ 90% W1555
2nd
Kew Mist
3rd
Chiswick & Brixton Mist W1565
4th
Chiswick, Westminster,
Brixton & Kew
Mist Chiswick ≥ 90% W1554

175
Dates Sites Weather observation RH (%) Paintings
5th Westminster & Brixton Mist Brixton ≥ 90%
6th Brixton ≥ 90%
7th Westminster, Brixton &
Kew
Mist
8th Chiswick, Westminster,
Brixton & Kew
Mist Chiswick &
Brixton ≥ 90%
9th Chiswick, Westminster,
Brixton & Kew
Mist Chiswick &
Brixton ≥ 90%
10th Kew Mist Chiswick ≥ 90%
11th Westminster, Brixton &
Kew
Mist
13th Kew Mist Brixton ≥ 90%
14th Westminster & Brixton ≥ 90%
15th Westminster & Brixton Mist
16th Chiswick ≥ 90% W1573
17th Brixton ≥ 90% W1572
18th Brixton & Kew Mist
19th Westminster Fog Chiswick &
Brixton ≥ 90%
20th Kew Mist
21st Brixton Mist
22nd Chiswick & Brixton ≥ 90% W1574
24th Brixton ≥ 90%
25th Brixton ≥ 90%
27th Brixton ≥ 90%
28th Chiswick & Brixton ≥ 90% W1575
Table 6.12 Dates in February 1901 when mist, fog or a RH ≥ 90% were reported at Chiswick,
Westminster, Brixton or Kew
There were twenty five dates in February 1901 when mist/fog or a relative humidity
greater than or equal to 90% was reported at one of the weather stations, and on eleven of
these days mist/fog and a relative humidity ≥ 90% was reported at two stations
simultaneously. The dates of production derived for four of Monet‟s paintings (W1555,
W1554, W1574 and W1575) also correspond to four of the dates when mist/fog and a
relative humidity ≥ 90% were reported.

176
March 1901
Dates Sites Weather observation RH (%) Paintings
1st Chiswick ≥ 90%
2nd
Chiswick ≥ 90%
4th
Chiswick ≥ 90%
5th
Chiswick ≥ 90%
6th
W1563
10th
Chiswick Mist ≥ 90%
11th
Chiswick Mist
12th
Chiswick Mist ≥ 90%
13th
Chiswick ≥ 90%
16th
Chiswick ≥ 90%
17th
Chiswick Mist
25th
Chiswick ≥ 90%
26th
Chiswick ≥ 90%
31st Chiswick ≥ 90%
Table 6.13 Dates in March 1901 when mist, fog or a RH ≥ 90% were reported at Chiswick,
Westminster, Brixton or Kew
Of the fourteen dates in March 1901 when mist/fog or a relative humidity greater than or
equal to 90% was reported at one of the weather stations, there were no occasions when
mist/fog and a relative humidity ≥ 90% was reported at two stations simultaneously.
April 1901
Dates Sites Weather observation RH (%) Paintings
6th
Chiswick ≥ 90%
Table 6.14 Dates in April 1901 when mist, fog or a RH ≥ 90% were reported at Chiswick,
Westminster, Brixton or Kew
In April 1901 there was only one day when either mist/fog or a relative humidity greater
than or equal to 90% was recorded at one of the sites. However, mist/fog and a relative
humidity ≥ 90% was only reported at Chiswick on this particular day.

177
Mist, fog and haze observations recorded by the Royal Horticultural Society at Chiswick
and the weather stations based at Westminster, Brixton and Kew, have been analysed
with respect to each other in order to determine any relationships that exist between the
four locations in London. The data sources with the greatest distances between them have
been separated into four pairings. These are Chiswick and Westminster, Chiswick and
Brixton, Kew and Westminster, and Kew and Brixton.
Chiswick and Westminster
Year Total no. days when
mist/fog/haze reported
No. days mist/fog/haze
reported by both stations
1899 23 10
1900 20 2
1901 19 5
Total 62 17 Table 6.15 Dates when mist/fog/haze was recorded by Chiswick and Westminster
in 1899-1901
Out of a total of sixty two dates in 1899-1901, there were seventeen occasions when
Chiswick and Westminster reported mist or fog on the same day; which is approximately
equivalent to one observation every four days. There are 5.53 miles (8.90 km) between
Chiswick and Westminster, which is the shortest distance between any of the observation
sites. Still they have the least amount of dates in common, out of the four pairings, with
respect to reports of mist or fog occurrences.

178
Chiswick and Brixton
Year Total no. days when
mist/fog/haze reported
No. days mist/fog/haze
reported by both stations
1899 21 17
1900 20 8
1901 19 6
Total 60 31 Table 6.16 Dates when mist/fog/haze was recorded by Chiswick and Brixton in
1899-1901
From a total of sixty dates in 1899-1901, there were thirty one instances when Chiswick
and Brixton reported mist, fog or haze on the same date; which is approximately equal to
one observation every two days. There are 6.49 miles (10.44 km) between Chiswick and
Brixton, making them the second closest pairing of observation sites. The records for
these sites have the most dates in common with respect to reports of mist, fog or haze.
Kew and Westminster
Year Total no. days when
mist/fog/haze reported
No. days mist/fog/haze
reported by both stations
1899 23 11
1900 15 1
1901 19 5
Total 57 17 Table 6.17 Dates when mist/fog/haze was recorded by Kew and Westminster in
1899-1901
Out of a total of fifty seven dates in 1899-1901, there were seventeen occasions when
Kew and Westminster reported mist or fog on the same day; which approximately
corresponds to one observation every three days. There are 6.83 miles (10.99 km)

179
between Kew and Westminster, and they have the third largest amount of dates when
mist or fog was experienced on the same date.
Kew and Brixton
Year Total no. days when
mist/fog/haze reported
No. days mist/fog/haze
reported by both stations
1899 21 14
1900 15 5
1901 18 7
Total 54 26 Table 6.18 Dates when mist/fog/haze was recorded by Kew and Brixton in
1899-1901
From a total of fifty four dates in 1899-1901, there were twenty six instances when Kew
and Brixton reported mist or fog on the same date; which is approximately equivalent to
one observation every two days. There are 7.50 miles (12.07 km) between Kew and
Brixton, which is the greatest distance between the four observation sites. Yet the reports
for these sites have the second largest amount of observations of mist or fog in common.
The spatial variation of the mist and fog in London can be estimated by looking at the
differences between the reports from the sites which are the furthest away from the Savoy
Hotel. These sites are Chiswick and Kew. Chiswick is 6.09 miles (9.80 km) due West of
the Savoy Hotel and Kew is 7.45 miles (11.98 km) due West of the Savoy Hotel. Since
Westminster is 0.97 miles (1.56 km) South South West of the Savoy Hotel, comparing
the observations recorded at Westminster to those for Chiswick and Kew will aid in
determining the distribution of mist and fog around London. For Chiswick and Kew, mist
or fog was reported at both sites approximately once every four days. Whilst for Kew and
Westminster, mist or fog was observed at both sites approximately once every three days.

180
A comparison between the dates when mist or fog was reported at the sites from the two
pairings, Chiswick-Westminster and Kew-Westminster, will highlight any similarities
between the locations.
In 1899, mist or fog was reported by both Chiswick and Westminster a total of ten times
and these dates were echoed by the observations from the pairing of Kew and
Westminster on all occasions. There was only one other date when mist or fog was
reported by both Kew and Westminster that was not also reported by Chiswick. During
1900, Chiswick and Westminster reported similar observations of mist or fog on two days,
one of which was also recorded by Kew. Finally in 1901, both pairings, Chiswick-
Westminster and Kew-Westminster, recorded mist or fog observations on five dates in
total. Of these five dates, observations at Chiswick, Westminster and Kew were in
agreement on three days.
Looking at the observations for the three years draws attention to a significant similarity
in the observations recorded at the three sites depicted in Figure 6.8. This shows that the
distribution of mist/fog around this particular area of London experienced a certain
degree of homogeneity.

181
Figure 6.8 Locations of Chiswick, Westminster and Brixton with respect to the Savoy Hotel
6.5. Weather data from Monet’s letters
Throughout this chapter, the content of Monet‟s letters are compared to the synoptic
information contained within the two data sets; the Royal Horticultural Society‟s weather
diaries and the weather reports from the stations at Westminster, Brixton and Kew.
The first letter that Monet wrote when he visited London in 1900 is dated February 10th
1900. The letter before that is dated February 5th
1900 and is postmarked Giverny. Of a
possible nineteen dates in February 1900, Monet wrote eighteen letters in a total of

182
fifteen days as on three occasions he wrote two letters in the duration of one day. Monet
included observations of fog in seven of his letters that he wrote in February 1900. The
relevant excerpts of these letters, complete with translations, are as follows.
1505 London, Monday 12th
February 1900 to Alice Monet
“il y a un brouillard des plus épais” → there is a very thick fog
1506 London, Tuesday 13th
February 1900 to Alice Monet
“Ce matin et hier, brouillard à ne rien voir” → This morning and yesterday, nothing to
see but fog
1507 London, Wednesday 14th
February 1900 to Alice Monet
“lorsque ce n‟est pas un brouillard à ne rien voir” → when there is a fog nothing is is to
be seen
1509 London, Saturday 17th
February 1900 to Alice Monet
“une brume exquise, et un splendide coucher de soleil; aujourd‟hui, pluie et brouillard”
→ an exquisite fog, and a splendid sunset; today, rain and fog
1517 London, Saturday 24th
February 1900 at 10 o’clock to Alice Monet
“un brouillard superbe” → the fog is superb

183
1518 London, Sunday 25th
February 1900 at 4:30 in the evening to Alice Monet
“beaucoup de brouillard” → lots of fog
1519 London, Monday morning at 10 o’clock 26th
February 1900 to Alice Monet
“Je profile du brouillard très épais” → I benefit from very thick fog have taken advantage
“Ce matin au petit jour, il y a eu un brouillard extraordinaire” → This morning, at
daybreak, there was an extraordinary fog
“Hélas! Le brouillard ne veut pas se dissiper” → Alas! The fog does not want to recede
During the whole of March in 1900, Monet wrote twenty six letters in twenty one days,
where on five occasions he wrote twice a day. However, only one letter that Monet wrote
in March 1900 contained any information regarding the fogs. An extract from this letter
is given below.
1531 London, 17th
March to Alice Monet
“moments très beau avec un brouillard délicieux” → very beautiful moments with a
delicious fog
And in April 1900, Monet wrote two letters, one on each day that he was still in London,
as he left England during this period. Unfortunately, neither of these letters included an
observation of the fog. Monet‟s next letter of correspondence is dated April 10th
1900 and
has a Giverny postmark.

184
During the following year, in 1901, Monet‟s first letter is dated January 25th
1901. The
letter before that one is dated January 18th
1901 and has a Giverny postmark. Out of a
possible seven dates in January 1901, Monet wrote four letters in a total of four days. In
February 1901, Monet wrote twenty six letters in twenty two days, where on two
occasions he wrote twice a day and once he wrote three letters in one day. Of these letters
that he wrote in February 1901, Monet enclosed details of the London fogs in ten.
Passages from these letters are listed below.
1592 London, Saturday 2nd
February 1901 to Alice Monet
“un léger brouillard” → a light fog
1593 London, Sunday 3rd
February 1901 to Alice Monet
“Grâce aux fumées, la brume est venue, puis des nuages” → Through the smoke, the fog
came, then clouds
1596 London, Tuesday 5th
February 1901 to Alice Monet
“le brouillard s'est épaissi assez pour dissimuler la neige” → the mist thickened enough
to hide snow
1597 London, Wednesday 6th
February 1901 to Alice Monet
“Il y avait bien un peu trop de brouillard le matin, mais le joli ballon rouge n‟a pas été
long à se montrer et avec lui une succession d‟effets étonnants” → There was a little too

185
much fog this morning, but the pretty red balloon was not long to be shown and with him
a succession of astonishing effects
1598 London, Friday 8th
February 1901 to Alice Monet
“beau temps, mais obstrué par le brouillard” → beautiful weather, but obstructed by fog
1599 London, Saturday 9th
February 1901 to Alice Monet
“Encore une journée de brouillard complet ” → Again a day of complete fog
1601 London, Monday 11th
February 1901 to Alice Monet
“les effets variables au possible à cause de cette brume merveilleuse” → variable effects
are possible because of this marvellous fog
1604 London, Thursday 14th
February 1901 to Alice Monet
“c‟est le brouillard qui s‟est levé en augmentant d‟intensité” → it is the fog which rose
with increasing intensity
1606a London, Sunday 17th
February 1901 to Alice Monet
“des bourrasques de neige, puis du soleil, du brouillard et du temps noir” → flurries of
snow, then sun, fog and black weather

186
1608a London, Tuesday morning 19th
February 1901 to Alice Monet
“à chaque pas je voyais de belles choses justement à cause de ce grand brouillard” →
with each step I precisely saw beautiful things because of this thick fog
Monet wrote his last letter in London on March 30th
1901, and out of a thirty possible
dates Monet wrote nineteen letters on seventeen days, on one occasion writing three
letters in one day. Observations of fog were not included in any of the letters that Monet
wrote in March 1901. Monet‟s next letter of correspondence is dated April 8th
1901 and is
postmarked Giverny.
6.6. A comparison of Monet’s letters, the observed weather data and the calculated
dates of Monet’s paintings
The information contained within Monet‟s letters, regarding fog occurrences, can be
compared to the dates when fog, mist or haze was reported by any of the synoptic data
sets. Firstly, Monet‟s letters were compared to the data collated from the weather stations;
after which the letters were also compared to the entries of the Royal Horticultural
Society‟s weather diaries.
1900
Data sources No.
of dates Dates
Letter + Westminster/Brixton/Kew 5 Feb: 12th
-13th
, 17th
, 25th
-26th
Table 6.19 Dates of fog occurrences recorded by Monet and a weather station in 1900
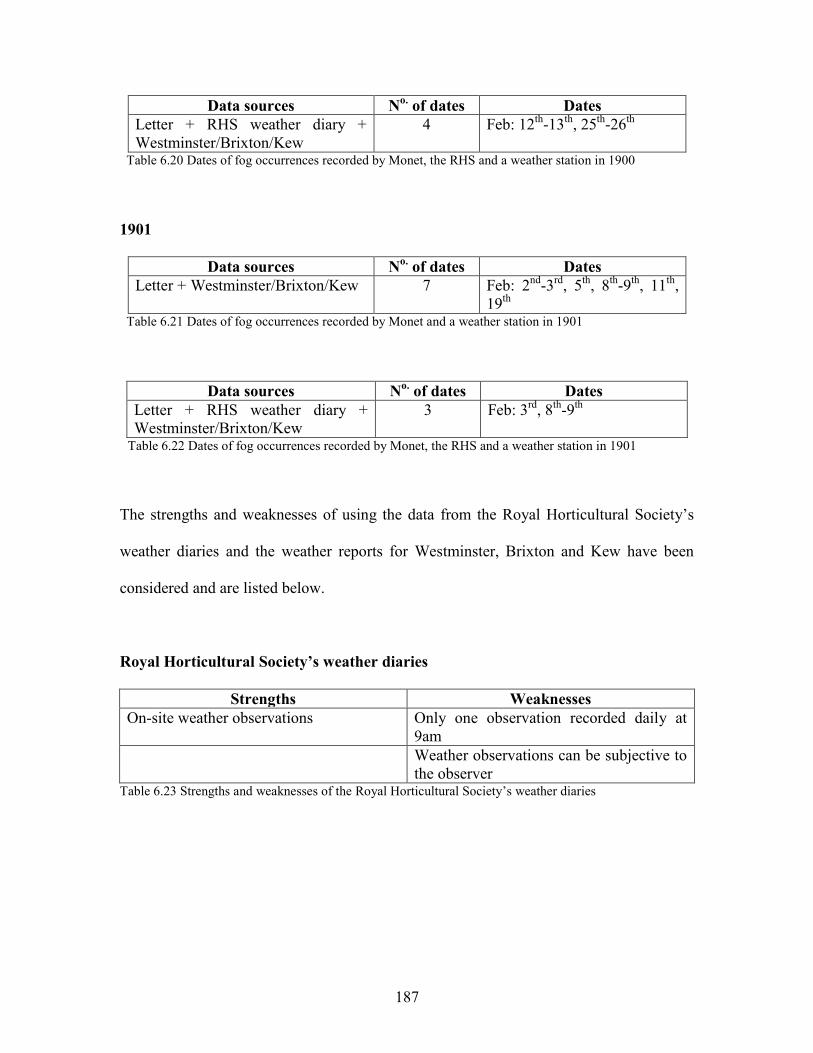
187
Data sources No.
of dates Dates
Letter + RHS weather diary +
Westminster/Brixton/Kew
4 Feb: 12th
-13th
, 25th
-26th
Table 6.20 Dates of fog occurrences recorded by Monet, the RHS and a weather station in 1900
1901
Data sources No.
of dates Dates
Letter + Westminster/Brixton/Kew 7 Feb: 2nd
-3rd
, 5th
, 8th
-9th
, 11th
,
19th
Table 6.21 Dates of fog occurrences recorded by Monet and a weather station in 1901
Data sources No.
of dates Dates
Letter + RHS weather diary +
Westminster/Brixton/Kew
3 Feb: 3rd
, 8th
-9th
Table 6.22 Dates of fog occurrences recorded by Monet, the RHS and a weather station in 1901
The strengths and weaknesses of using the data from the Royal Horticultural Society‟s
weather diaries and the weather reports for Westminster, Brixton and Kew have been
considered and are listed below.
Royal Horticultural Society’s weather diaries
Strengths Weaknesses
On-site weather observations Only one observation recorded daily at
9am
Weather observations can be subjective to
the observer Table 6.23 Strengths and weaknesses of the Royal Horticultural Society‟s weather diaries

188
Weather reports for Westminster
Strengths Weaknesses
On-site weather observations Only one observation recorded daily at
2pm
No observations recorded for March 1900
or 1901
Weather observations can be subjective to
the observer Table 6.24 Strengths and weaknesses of the weather reports for Westminster
Weather reports for Brixton
Strengths Weaknesses
On-site weather observations No observations recorded for March 1901
Two observations recorded at Brixton Two observations for Brixton recorded
„this morning‟, so exact time of
observation remains unknown
Weather observations can be subjective to
the observer Table 6.25 Strengths and weaknesses of the weather reports for Brixton
Weather reports for Kew
Strengths Weaknesses
On-site weather observations No observations recorded for March 1900
or 1901
Observations recorded at two hourly
intervals
No early morning observation recorded
Weather observations can be subjective to
the observer Table 6.26 Strengths and weaknesses of the weather reports for Kew
6.7. Discussion
6.7.1. Royal Horticultural Society weather diaries
The gardens of the Royal Horticultural Society are located in Chiswick, west London,
which is almost directly west of Westminster and the Savoy Hotel. For this reason, dates
when a wind blows from west to east, known as a westerly wind, are of interest here. The
189
corresponding dates can be found in Appendix 7. The weather conditions detected on
these dates can all be identified in one of Monet‟s paintings from his London Series.
Dull and cloudy conditions, as well as mist, fog, rain and snow, all reduce the visibility of
a scene to some degree, which could have been the inspiration for some of Monet‟s hazy
depictions of London, for example W1567 „Waterloo Bridge effet de soleil‟ (sunlight
effect). On the other hand, bright and clear conditions could equally have been the
inspiration for Monet‟s light and colourful portrayals of the city, such as W1532 „Charing
Cross Bridge, reflets sur la Tamise‟ (reflections on the Thames).
6.7.2. Weather reports – south of England, Westminster and Brixton
The observations in these reports consist of „forecasts for 24 hours ending at noon on the
day of the report‟ for the south of England, „today‟s 2pm reports‟ for Westminster, and
„daily weather reports‟ for Brixton. Since the precise location for the south of England
observations is unknown, any conditions that obscure visibility have been considered and
are contained in Appendix 7. The meteorological conditions experienced are primarily
changeable, cloudy, dull, overcast, foggy, misty or unsettled. The changeable, cloudy,
dull and unsettled conditions, with mist, fog and rain, all work to reduce the visibility of a
scene. These conditions have been identified in some of Monet‟s paintings of London, for
example W1573 „Waterloo Bridge, soleil dans le brouillard‟ (effect of sunlight in the fog)
and W1574 „Waterloo Bridge‟. As depicted on the maps previously, Brixton is to the
south of Westminster and the Savoy Hotel. So any observations with a southerly wind,
that is a wind that blows from south to north, recorded in the „daily weather reports‟ may
190
be significant here. The daily observations are recorded for „yesterday evening‟, „this
morning‟ and for the „past 24 hours‟, so dates have been selected with respect to these
three time frames and can again be found in Appendix 7.
The overcast, cloudy, misty and foggy conditions experienced would all reduce visibility.
As aforementioned, these conditions have been identified in some of Monet‟s paintings
of London. Equally, the observations of blue sky have also been identified in Monet‟s
brighter depictions of the city.
6.7.3. Weather reports – Brixton and Kew
The observations were recorded for weather stations posted at Brixton and Kew. The
reports for Brixton were recorded at three times throughout the day; 8am, 2pm and 6pm.
As Monet started his scenes of Waterloo Bridge in the morning and worked on his
paintings of Charing Cross Bridge after noon and into the early afternoon sun, only the
8am and 2pm observations are relevant here. Again, Brixton is to the south of
Westminster and the Savoy Hotel, so observations that corresponded to southerly winds
are important. The corresponding dates can be found in Appendix 7.
The recorded meteorological observations are visible in Monet‟s depictions of London.
For example, overcast conditions would work to reduce the vibrancy of light within a
scene and W1563 „Waterloo Bridge, temps couvert‟ (overcast weather) is a painting that
clearly reflects this. The reports from Kew weather station consist of two hourly
observations from 10am to 10pm, along with any other daily remarks, so the morning to
191
early afternoon observations are important here. Kew is to the west of Westminster, but
since the wind directions are not detailed in these particular reports the dates that have
conditions that will compromise visibility will be used here. As with the dates for Brixton
weather station, the dates recorded by Kew weather station have also been included in
Appendix 7. The weather conditions reported would result in a reduction in visibility, and
is recognisable in many of Monet‟s representations of London at the turn of the twentieth
century. A couple of example of such depictions are W1554 „Charing Cross Bridge,
brouillard sur la Tamise‟ (fog on the Thames) and W1575 „Waterloo Bridge, brouillard‟
(fog).
6.7.4. Fog frequency and spatial variation
The frequency of the fogs observed at Brixton was recorded by the Meteorological Office
for the time period 1871-1903. The measurements showed that the highest total of foggy
days was eighty six in 1886, whilst the lowest was thirteen days in 1900 (Thornes and
Metherell, 2003). Figure 6.9 shows the results published by Marriot for fog occurrences
observed at Brixton and West Norwood, for the years 1878 to 1903.
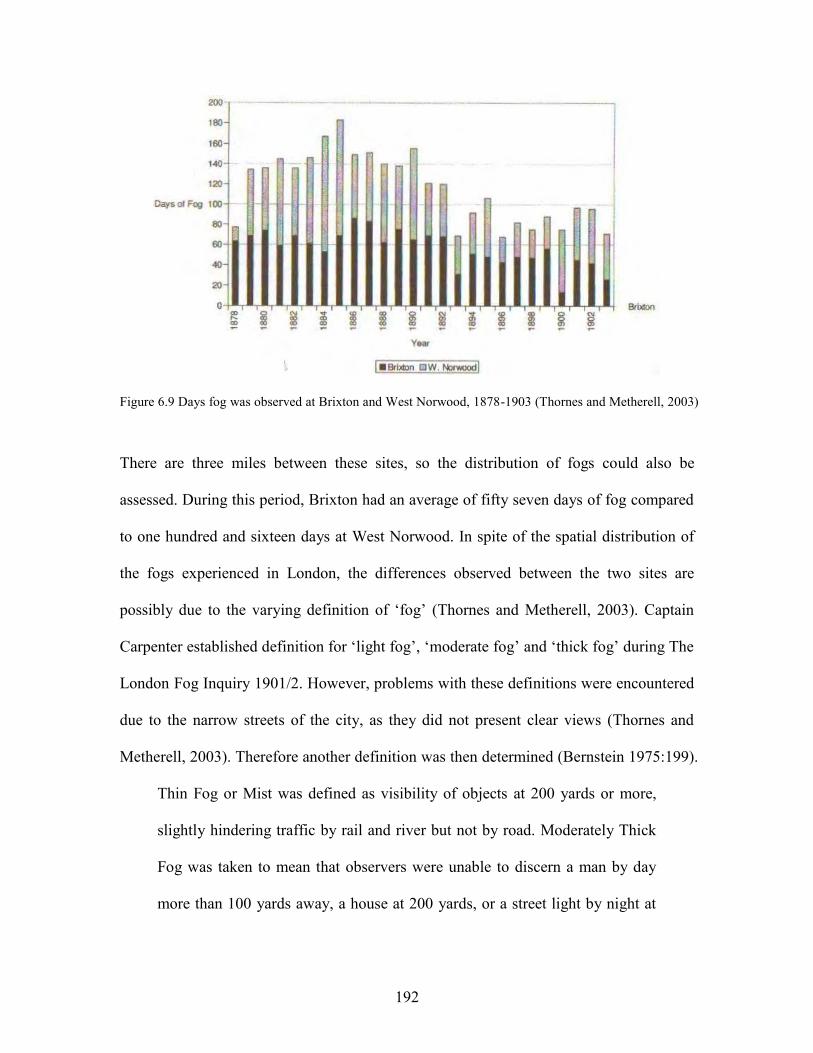
192
Figure 6.9 Days fog was observed at Brixton and West Norwood, 1878-1903 (Thornes and Metherell, 2003)
There are three miles between these sites, so the distribution of fogs could also be
assessed. During this period, Brixton had an average of fifty seven days of fog compared
to one hundred and sixteen days at West Norwood. In spite of the spatial distribution of
the fogs experienced in London, the differences observed between the two sites are
possibly due to the varying definition of „fog‟ (Thornes and Metherell, 2003). Captain
Carpenter established definition for „light fog‟, „moderate fog‟ and „thick fog‟ during The
London Fog Inquiry 1901/2. However, problems with these definitions were encountered
due to the narrow streets of the city, as they did not present clear views (Thornes and
Metherell, 2003). Therefore another definition was then determined (Bernstein 1975:199).
Thin Fog or Mist was defined as visibility of objects at 200 yards or more,
slightly hindering traffic by rail and river but not by road. Moderately Thick
Fog was taken to mean that observers were unable to discern a man by day
more than 100 yards away, a house at 200 yards, or a street light by night at

193
440 yards. Dense Fog meant inability to discern objects across the road by
day or lights of street lamps 60 yards distant by night.
6.7.5. Fog observations – Brixton, Kew, The Times newspaper
As discussed earlier, the fog observations have been recorded by three independent
bodies; Brixton weather station, Kew weather station, and The Times newspaper. The
occasions when fog occurred and was reported by one of the sources mentioned above,
have been noted in Appendix 7.
6.7.6. Fog observations – relative humidity
The values of relative humidity were calculated for the observation sites at Chiswick,
Westminster and Brixton, for 1899-1901, in order to compare the likelihood of
mist/fog/haze occurrences to actual observations of mist/fog/haze. The relative humidity
figures calculated for these sites are listed in Appendix 6 and have been discussed in
Section 6.4. „A comparison of the observed weather data and the calculated dates of
Monet‟s paintings‟
6.7.7. Monet’s letters
In total, Monet wrote ninety five letters to Alice and various other contacts during both
his visits to London in 1900-01. Of those ninety five letters, only eighteen contained
comments about the fogs that he experienced whilst painting his subjects. Excerpts of
these letters have been detailed in Section 6.3. „Weather data from Monet‟s letters‟ and
are also displayed in Appendix 8.

194
6.7.8. Summary
The strengths and weaknesses of the meteorological data that has been considered are
listed in Table 6.27.
Meteorological data
Strengths Weaknesses
Lots of data is available for the required
time periods
All observations recorded are open to
human error
Different site locations shows the spatial
variation of London‟s fogs
Errors are involved with averaging the
daily weather measurements for 1899-
1901 to derive monthly values
Techniques for measuring smoke levels
was limited until 1960
The definition of „fog‟ leads to differing
results Table 6.27 Strengths and weaknesses of the meteorological data
Taking the strengths and weaknesses of the meteorological data into account, it can be
concluded that London‟s emissions saw a definite decline during the twentieth century. In
a hundred years, (1910-2010), pollution levels fell by nearly 97% from 300 µg/m3 to 10
µg/m3. During this time, weather data shows that the meteorological situation in London
also saw changes; becoming drier and warmer with increased levels of sunshine. The
conditions experienced in London at the turn of the twentieth century are also clearly
depicted in Monet‟s paintings of the city, along with his letters of correspondence.

195
CHAPTER 7: Conclusions
7.1. Introduction
The aim of this chapter is to conclude the study of Monet‟s London Series as a whole;
with the intention of answering the all important question “can Monet‟s London Series be
used as proxy data for the London fogs occurring at the turn of the twentieth century?”
In order to answer this question entirely, the key findings determined when investigating
the three objectives outlined in Chapter 1, will be collated into two main categories;
„empirical contributions‟ and „theoretical contributions‟. Both of these terms are umbrella
headings which will cover the majority of the work that has been conducted throughout
this investigation. The three objectives were as follows;
To critically review the evolution of the symbolism of skies in landscape art as
well as the background to London's climate and fogs at the turn of the twentieth
century together with an analytical appraisal of the context of Monet's life and
artistic representations of „l‟enveloppe‟ in his London Series.
Definition of a solar geometry method that will enable the derivation of the dates
and times of production of Monet‟s paintings of Waterloo Bridge and Charing
Cross Bridge.
Investigation of information included in Monet‟s letters of correspondence as well
data from the Royal Horticultural Society‟s weather diaries and weather reports
from three weather stations in London.

196
The „empirical contributions‟ to the key findings consisted of two of the three main
objectives. Firstly, the geometrical analysis of Westminster, encompassing the whole
region from the Savoy Hotel to Waterloo Bridge, Charing Cross Bridge and the Houses
of Parliament, respectively. The solar geometry work carried out for the paintings
selected from Monet‟s London Series has also been considered in this section; as the
dates that have been derived using the methods highlighted in Chapter 5, were
fundamental in the overall conclusion of this thesis. Secondly, the collation of the data
from the various meteorological sources, the calculated values of relative humidity for
the observation sites and the content of Monet‟s letters of correspondence (all discussed
in Chapter 6), contributed significantly to the „empirical contributions‟ within this study.
And finally, the comparative analysis of all of the data exhibited in Chapter 6 in
conjunction with the analysis of Monet‟s paintings on Waterloo Bridge and Charing
Cross Bridge (also in Chapter 6) forms the remainder of the „empirical contributions‟
section.
The „theoretical contributions‟ to this investigation covers one of the three objectives
stated at the beginning of this study. The aim of the research presented in the literature
review (Chapter 2) was to introduce the reader to the subject area and to provide
background information to aid in their understanding. This began with an introduction to
previous work conducted within a similar context; covering topics such as landscape art,
the portrayal of skies within paintings, and finally the intended deconstruction of Monet‟s
London Series. The literature review also covered more scientific theory that was
involved in trying to analyse the London fogs, as well as their cause and effect. Finally,
197
the „theoretical contributions‟ addressed the various media used in the depictions of
London during the nineteenth century and Monet‟s development as an artist during this
time.
By evaluating all of the contributions in this way, an informed decision regarding the
question that underpins this study, can be made.
7.2. Key findings
The „empirical contributions‟ to this study can be condensed into three main categories;
the geometrical analysis of Westminster,
the solar geometry analysis to derive the dates and times of production for each
painting,
the comparative analysis between Monet‟s paintings, letters and the synoptic data
sets
These analyses were carried out with the intention of determining Monet‟s accuracy in
depicting the fogs in his London Series.
A geometrical analysis of Westminster was conducted to aid with the visualisation of the
area of London that Monet resided in and painted. In addition to this, the analysis of the
structures within Monet‟s paintings means that an internal scale could be derived thus
providing the necessary information that was required for the solar geometry analysis.

198
The dates derived using the solar geometry method, for the twelve initially selected
paintings, were consistent with the periods that Monet visited London, in 1899-1901, for
all but three paintings (W1532, W1536 and W1537). The reason for this is that the
position of the sun within these three paintings is too far above the top of the canvas to
allow an accurate analysis of the solar geometry. Consequently, any dates that could be
derived would be erroneous and misleading. Nevertheless, the other nine paintings were
successfully dated. Five paintings of Waterloo Bridge were dated as being produced in
either 1900 or 1901, and the remaining four paintings, one of Charing Cross Bridge and
three of Waterloo Bridge, were dated with 1901 as being the only possible year of
production. The derivation of these dates meant that the content of the Monet‟s paintings
and thus his representations of the meteorological situation could be compared to the
synoptic data gathered from the Royal Horticultural Society‟s weather diaries, and the
weather reports from Westminster, Brixton and Kew. These data sources were used to
further refine the derived dates to produce „new dates‟ for each painting. The dates for the
Waterloo Bridge and Charing Cross Bridge paintings are displayed overleaf along with
the dates that Baker and Thornes derived in 2006 for Monet‟s Houses of Parliament
paintings. These tables are also displayed in Appendix 9.
The dates for the Waterloo Bridge and Charing Cross Bridge paintings are displayed in
Appendix 9, along with the dates that Baker and Thornes derived in 2006 for Monet‟s
Houses of Parliament paintings. From this data, the dates derived for the paintings of
Waterloo Bridge and Charing Cross Bridge, that are consistent with observations
recorded in the weather reports, weather diaries or Monet‟s letters, have been selected in
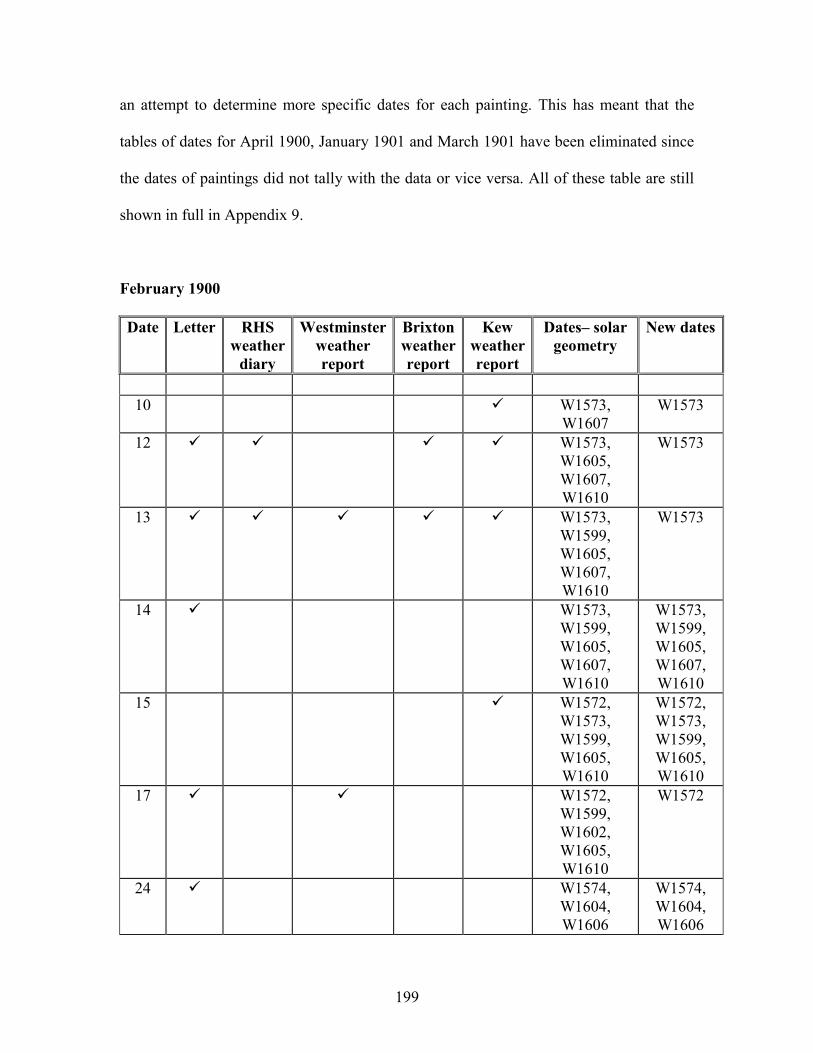
199
an attempt to determine more specific dates for each painting. This has meant that the
tables of dates for April 1900, January 1901 and March 1901 have been eliminated since
the dates of paintings did not tally with the data or vice versa. All of these table are still
shown in full in Appendix 9.
February 1900
Date Letter RHS
weather
diary
Westminster
weather
report
Brixton
weather
report
Kew
weather
report
Dates– solar
geometry
New dates
10 W1573,
W1607
W1573
12 W1573,
W1605,
W1607,
W1610
W1573
13 W1573,
W1599,
W1605,
W1607,
W1610
W1573
14 W1573,
W1599,
W1605,
W1607,
W1610
W1573,
W1599,
W1605,
W1607,
W1610
15 W1572,
W1573,
W1599,
W1605,
W1610
W1572,
W1573,
W1599,
W1605,
W1610
17 W1572,
W1599,
W1602,
W1605,
W1610
W1572
24 W1574,
W1604,
W1606
W1574,
W1604,
W1606

200
Date Letter RHS
weather
diary
Westminster
weather
report
Brixton
weather
report
Kew
weather
report
Dates– solar
geometry
New dates
25 W1575,
W1604,
W1606
W1575
26 W1575,
W1604,
W1606
W1575,
W1606
27 W1575 W1575
28 W1575 W1575
Table 7.1 Fog/Mist/Haze events in London from sources used in this thesis for February 1900
March 1900
Date Letter RHS
weather
diary
Westminster
weather
report
Brixton
weather
report
Kew
weather
report
Dates – solar
geometry
New dates
21 W1597 W1597 Table 7.2 Fog/Mist/Haze events in London from sources used in this thesis for March 1900
February 1901
Date Letter RHS
weather
diary
Westminster
weather
report
Brixton
weather
report
Kew
weather
report
Dates – solar
geometry
New dates
1 W1554,
W1555
W1554,
W1555
2 W1554,
W1555,
W1565
W1554,
W1555,
W1565
3 W1554,
W1565
W1554,
W1565
4 W1554,
W1565
W1554,
W1565
5 W1554 W1554
6 W1554 W1554
7 W1554 W1554
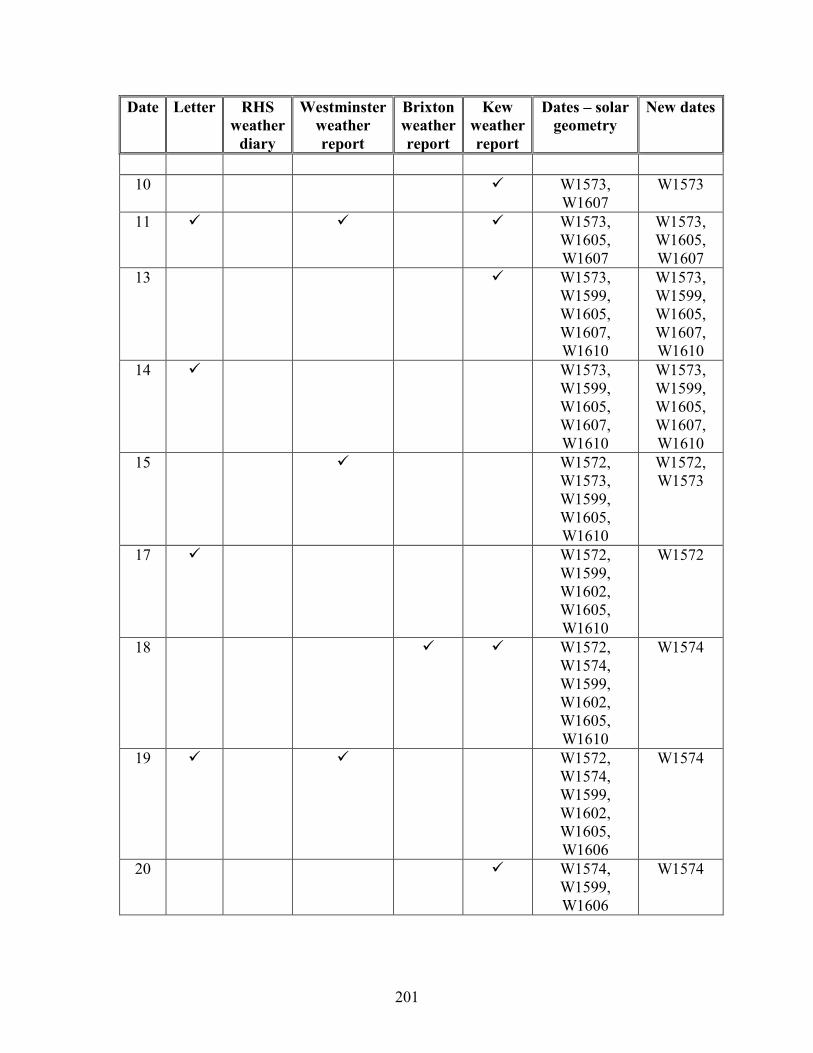
201
Date Letter RHS
weather
diary
Westminster
weather
report
Brixton
weather
report
Kew
weather
report
Dates – solar
geometry
New dates
10 W1573,
W1607
W1573
11 W1573,
W1605,
W1607
W1573,
W1605,
W1607
13 W1573,
W1599,
W1605,
W1607,
W1610
W1573,
W1599,
W1605,
W1607,
W1610
14 W1573,
W1599,
W1605,
W1607,
W1610
W1573,
W1599,
W1605,
W1607,
W1610
15 W1572,
W1573,
W1599,
W1605,
W1610
W1572,
W1573
17 W1572,
W1599,
W1602,
W1605,
W1610
W1572
18 W1572,
W1574,
W1599,
W1602,
W1605,
W1610
W1574
19 W1572,
W1574,
W1599,
W1602,
W1605,
W1606
W1574
20 W1574,
W1599,
W1606
W1574

202
Date Letter RHS
weather
diary
Westminster
weather
report
Brixton
weather
report
Kew
weather
report
Dates – solar
geometry
New dates
21 W1574,
W1599,
W1606
W1574
Table 7.3 Fog/Mist/Haze events in London from sources used in this thesis for February 1901
Monet also wrote many letters during his stays in London, which would often contain
observations of the weather. These letters provided support to the theory that Monet had
painted the canvases on the particular dates that were derived using the solar geometry.
As discussed earlier in this chapter, with the use of the information contained in the
various sources of synoptic data, along with Monet‟s letters, the initial dates derived for
each painting using the solar geometry, were refined further still. These two sets of dates
are displayed in a table, for comparison, in Appendix 11.
The „theoretical contributions‟ to this study have come largely from the literature review
that was conducted at the beginning of this investigation (Chapter 2). The literature
review provided an introduction to the research area. The motivation behind this
investigation is based on the work conducted by previous studies that used art as a form
of proxy data for the weather and climate. A number of these studies explored the
relationship between elements such as the sky, atmosphere, weather, climate and climate
change, and how they are represented through an artistic medium. The aim of this
investigation was to utilise some of the principles of these past studies in order to
examine Monet‟s London Series accurately.
203
Another key study that inspired this work was that of Baker and Thornes (2006) when
they analysed Monet‟s paintings of the Houses of Parliament from his London Series.
Baker and Thornes used solar geometry in order to determine the dates and times of
production for these paintings. Therefore, this new study could be viewed as a
continuation of the Baker and Thornes report with the intention of incorporating the
analysis of the Waterloo Bridge and Charing Cross Bridge paintings from the same series.
7.3. Future work
Given more time, work within this research area could have progressed in a number of
directions. Firstly, the scientific analysis of Monet‟s London Series could have been
developed to include an investigation of the visual range within the selected paintings, as
well as a deeper analysis of the colour and content of the London fogs. The other area of
development that could be pursued would fall under the artistic side of this research, as it
would incorporate studying a wider range of paintings of London produced during the
nineteenth century. This would ultimately create a kind of pictorial catalogue of events
tracking the rise and decline of the London fogs.
These are just a couple of suggestions for the continuation of this study; however there
are probably a plethora of other avenues that could also be explored.
7.4. Final words
The main driving force at the start of this study was to try to show that Monet produced
accurate representations of the London skies in his paintings of Waterloo Bridge and
204
Charing Cross Bridge. Now that the analysis of Monet‟s depictions of Waterloo Bridge
and Charing Cross Bridge, with respect to various sources of data, has come to fruition, it
is fair to conclude that Monet did in fact paint accurate representations of London on a
number of occasions during his visits at the turn of the twentieth century. Since this is the
case, the hypothesis at the very beginning of the investigation that, if successful, this
work could provide a ready made pictorial as well as a numerical representation of the
London fogs, has been achieved.

205
REFERENCES:
Ahrens, C. Donald. (2000) Meteorology Today: An Introduction to Weather, Climate,
and the Environment. Brooks/Cole, USA.
Alloway, B. J. and Ayres, D. C., (1993) Chemical Principles of Environmental Pollution.
Blackie Academic & Professional, Glasgow.
Andrews, M. (1999) Landscape and Western Art, Oxford University Press.
Badt, K. (1950) John Constable‟s Clouds, Routledge & Kegan Paul, London.
Baker, J. and Thornes, J. E. (2006) Solar Position within Monet’s Houses of Parliament,
Proc. of the Royal Society A: Mathematical, Physical and Engineering Sciences,
462 (2076), 3775-3788
Baker, J., Thornes, J. E., Khan, S. F., Olson, D. W. and Doescher, R. L. (2009) Claude
Monet Pinpointed by Cleopatra’s Needle, Unpublished
Baxandall, M. (1972) Painting and Experience in 15th
Century Italy: A Primer in the
Social History of Pictorial Style, Clarendon Press, Oxford.
Beale, S. S. (1908) Recollections of a Spinster Aunt, Heinemann, London.
206
Benson, E. F. (1905) The Image in the Sand, Heinemann, London.
Berkeley, G. (1709) A New Theory of Vision
Bernstein, H. T. (1975) The Mysterious Disappearance of Edwardian London Fogs,
Weather, Climate, Culture Strauss, S. and Orlove, B. S. (2003) Berg.
Bijvanck, W. G. C. (1892) Un Hollandais à Paris en 1891, Perrin, Paris.
Brimblecombe, P. (1987) The Big Smoke. Methuen & co., London.
Brimblecombe, P. (2004) „Perceptions and Effects of Late Victorian Air Pollution‟, in E.
Melanie DuPuis (eds), The Politics and Culture of Air Pollution: Smoke and
Mirrors. New York University Press, pp. 15-26.
Brimblecombe, P. and Ogden, C. (1977) Air pollution in art and literature. Weather 32,
285-291
Brodie, F. J. (1892) The prevalence of fog in London during twenty years 1871-1890,
The Quarterly Journal of the Royal Meteorological Society 18, 40-5
Brodie, F. J. (1905) Decrease of fog in London during recent years,
The Quarterly Journal of the Royal Meteorological Society 31, 15-28
207
Bullet, E. (1901) Macmonnies, the sculptor, working hard as a painter. The Eagle.
Castagnary, J. (1874) L‟Exposition du boulevard des Capucines : Les Impressionnistes.
Le Siècle 29 April 1874
Chandler, T. J. (1965) The Climate of London, Hutchinson & Co. Ltd, London.
Clark, K. (1976) Landscape into Art, John Murray, London.
Cosgrove, D. E. (1979) John Ruskin and the geographical imagination, Geographical
Review, 69, pp. 43-62.
Cosgrove, D. (1985) Prospect, perspective and the evolution of the landscape idea,
Transactions of the Institute of British Geographers NS 10 (1), pp. 45-62.
Cosgrove, D. E. and Daniels, S. (1988) The Iconography of Landscape: Essays on the
Symbolic Representation, Design and Use of Past Environments, Cambridge
University Press.
Crimp, D. (1999) Getting the Warhol We Deserve, Social Text, 59:17, pp. 49-66.
Daniels, S. (1989) Marxism, culture and the duplicity of landscape, in Peet, R. and Thrift,
N. (eds) New Models in Geography, vol. 2, Unwin Hyman., London.

208
Driver, F. and Martins, L. (2005) Tropical Visions in an Age of Empire, University of
Chicago Press, Chicago.
Duranty, E. (1867) Aspect de Londres. Revue libérale, p433.
Elkins, J. (2003) Visual Studies, Routledge.
Eliasson, O. (2003) The Weather Project, Exhibition Catalogue, Tate Modern, London.
Fuller, P. (1988) „The geography of Mother Nature‟, in D. E. Cosgrove and S. Daniels
The Iconography of Landscape: Essays on the Symbolic Representation, Design
and Use of Past Environments, Cambridge University Press. pp. 11-31.
Gedzelman, S. D. (1989) Cloud classification before Luke Howard, Bulletin of the
American Meteorological Society, 70(4), pp. 381-95.
Geffroy, G. (1897) Pays d’ouest (extract translated by Stuckey 1985) p. 261
Gimpel, R. (1963) Journal d‟un collectionneur, marchand de tableaux. Paris.
Gleissman, S. (2007) Agroecology: the ecology of sustainable food systems, CRC Press.
Gregory, K. J. (2000) The changing nature of physical geography, Arnold, London.
209
Hamilton, E. (1894) The Pall Mall Magazine
Harrison, R. G. (2004) The global atmospheric electrical circuit and climate Surveys in
Geophysics. 25 (5–6), pp. 441–484.
Harrison, R. G. (2006) Urban smoke concentrations at Kew, London 1898-2004.
Harrison, R. G. and Aplin, K. L., (2002) Mid-nineteenth century diurnal smoke
concentrations at Kew, London Atmospheric Environment. 36 (25), pp. 4037–
4043.
House, J. (1986) Monet: Nature into Art. Yale University Press.
House, J. (2005) Vision of the Thames. Monet‟s London, Exhibition Catalogue, Snoeck
publishers, pp15-37.
Jay, M. (2002) That visual turn: The advent of visual culture, Journal of Visual Culture, 1,
pp. 87-92.
Jenkins, I. (1971) Decrease in the Frequency of Fog in Central London, Meteorological
Magazine, C, 317-22.

210
Kemp, M. (1990) The Science of art: optical themes in western art from Brunelleschi to
Seurat. New Haven, London.
Khan, S., Thornes, J. E., Baker, J., Olson, D. W. and Doescher, R. L. (2009) Monet at the
Savoy, Area, pp. 1-9.
Kottek, M., Grieser, J., Beck, C., Rudolf, B. and Rubel, F. (2006) World Map of Köppen-
Geiger Climate Classification, Meteorol. Z., 15, 259-263.
Lamb, H. H. (1967) Britain’s changing climate. Geographical Journal, 33, 445-466
Lamb, H. H. (1982) Climate, History, and the Modern World, Taylor and Francis.
Le Roux, H. (1889) Silhouettes parisiennes, l‟exposition Claude Monet‟
Leslie, C. R. (1845) Memoirs of the Life of John Constable, 2nd
edn, Longman‟s, Brown,
Green and Longman‟s, London.
Levinson, P. (1997) The Soft Edge; a Natural History and Future of the Information
Revolution, Routledge, London and New York.
Luckin, B. (2002) Demographic, social and cultural parameters of environmental Crisis:
the great London smoke fogs in the late 19th
and early 20th
centuries. pp. 219-238.

211
Mackenzie, J. (1990) Imperialism and the Natural World, Manchester University Press,
Manchester.
Making the Modern World. 2004. The Science Museum [online]. Available from
http://www.makingthemodernworld.org.uk/ [Accessed 10 September 2009]
Meinig, D. W. (1979) The Beholding Eye: Ten Versions of the Same Scene, The
Interpretation of Ordinary Landscapes: Geographical Essays, edited by D. W.
Meining and J. Brinckerhoff Jackson. Oxford University Press, New York.
Met Office, 2007. Met Office [online]. Available from
http://www.metoffice.gov.uk/corporate/library/factsheets/factsheet03.pdf
[Accessed 12 May 2010]
Met Office, 2007. Met Office [online]. Available from
http://www.metoffice.gov.uk/corporate/library/factsheets/factsheet16.pdf
[Accessed 15 February 2010]
Met Office. 2009. Met Office [online]. Available from
http://www.metoffice.gov.uk/climate/uk/averages/19712000/sites/greenwich.html
[Accessed 14 September 2009]

212
Minnaert, M. (1974) Light and Colour in the Outdoors. B. V. W. J. Thieme & Cie.,
Zutphen, Holland.
Mirbeau, O. (1889) Claude Monet preface to catalogue of Claude Monet, Auguste Rodin.
Mitchell, W. J. T. (1995) Interdisciplinarity and Visual Culture, The Art Bulletin, 77:4,
pp. 540-44.
Mitchell, W. J. T. (2002) Showing seeing: a critique of visual culture, Journal of Visual
Culture, 1, pp. 166-182.
Mitchell, W. J. T. (2005) There Are No Visual Media, Journal of Visual Culture, 4, pp.
257-266.
Mogridge, M. and Parr, J. B. (1997) Metropolis or Region: On the Development and
Structure of London, Regional Studies, 31, pp. 97-115.
„Monet‟s London‟ catalogue, Museum of Fine Arts, St Petersburg, Florida pp. 144.
Morier, J. (1849) Adventures of a Frenchman in London. London pp. 33.
Mosley, S. (2001) The Chimney of the World. The White Horse Press, Cambridge.

213
Mosley, S. (2003) Fresh air and foul: the role of the open fireplace in ventilating the
British home, 1837-1910 Planning Perspectives. Routledge, London.
Mossman, R. C. (1897) The non-instrumental meteorology of London 1713-1897,
Quarterly Journal of Royal Meteorological Society, 23, pp. 287
MPMC 1901-02, 6 November 1901, p. 68; 4 December 1901, pp. 99-100.
MPMC 1901-02, 17 January 1902, p. 114.
Museum of London. 2006. Museum of London [online]. Available from
www.museumoflondon.org.uk [Accessed 05 March 2007]
National Maritime Museum. 2008. NMM [online]. Available from
http://www.nmm.ac.uk/more-about-the-project [Accessed 04 October 2008]
Neuberger, H. (1970) Climate in art. Weather, 25, pp. 46-56
Novakov, A. and Novakov, T., (2006) The Chromatic Effects of Late Nineteenth Century
London Fog Literary London: Interdisciplinary Studies in the Representation of
London
214
Olson, D. W., Doescher, R. L. and Olson, M. S. (2003) Dating van Gogh’s Moonrise,
Sky & Telescope, pp. 54-60.
Olson, D. W., Doescher, R. L. and Olson, M. S. (2004) When The Sky Ran Red: The
Story Behind The Scream, Sky & Telescope, pp. 29-35.
Olson, D. W., Robertson, B. and Doescher, R. L. (2006) Reflections on Edvard Munch’s
Girls on the Pier, Sky & Telescope, pp. 38-41.
Pauly Hyslop, N. (2009) Impaired visibility: the air pollution people see, Atmospheric
Environment, 43, pp. 182-195
Pioch, N. (2006) WebMuseum, Paris [online]. Available from www.ibiblio.org/wm
[Accessed 20 May 2009]
Pratt, M. L. (1992) Imperial Eyes: Travel Literature and Transculturation. Routledge,
London.
Reed, N. (1998) Monet and The Thames. Lilburne Press, London.
Ringbell. 2010. Humidity [online]. Available from
http://www.ringbell.co.uk/info/humid.htm [Accessed 28 February 2010]
215
Rose, G. (2001) Visual methodologies: an introduction to the interpretation of visual
materials. Sage, London.
Ruskin, J. (1884) The Storm Cloud of the Nineteenth Century. George Allen, Kent.
Russell, R. (1880) London Fogs, pp. 31-2.
Scarrow, H. A. (1972) The Impact of British Domestic Air Pollution Legislation, British
Journal of Political Science, II, 3, 272.
Seiberling, G. (1988) Monet in London. High Museum of Art, Atlanta, Georgia.
Seinfeld, J. H. (1986) Atmospheric Chemistry and Physics of Air Pollution. John Wiley
& Sons, USA.
Shaw, W. N. (1906) Is London Fog Inevitable?, Journal of the Sanitary Institution,
XXVII, 51.
Sinclair, D. J. (1964) The Growth of London since 1880, in Clayton, K A Guide to
London Excursions, Supplement to the International Geographical Union
Congress, London, International Geographical Union, pp. 12-19
216
Strutt Galton, D. (1888) Fog and Smoke: a lecture…., Sanitary Engineering, 17, 6, 18.
Tayler, E. W. (1964) „Renaissance uses of Nature and Art’, Nature and Art in
Renaissance Literature, Columbia University Press, New York.
Taylor, J. R. (1995) Claude Monet: Impressions of France – From Le Havre to Giverny,
Collins and Brown, London.
The Thames and Hudson Dictionary of Art and Artists (1994), revised edition, Thames
and Hudson, London.
The Times newspaper (1855)
Thiebault-Sisson (1927) Le Temps (translated in Stuckey 1985)
Thornes, J. E. (1999) John Constable‟s Skies, Birmingham: The University of
Birmingham Press.
Thornes, J. E. (2008) A Rough Guide to Environmental Art, Annual Review of
Environment and Resources, 33, pp. 391-411.
217
Thornes, J. E. and Metherell, G. (2003) Monet’s London Series and the Cultural Climate
of London at the turn of the Twentieth Century. Weather, Climate and Culture, eds.
Strauss, S. and Orlove, B., Berg Press, Oxford, pp141-160.
United Kingdom, Ministry of Fuel and Power, Statistical Digest 1962, table 45, p. 63.
Universidad Complutense Madrid, 2003. UCM [online]. Available from
http://www.ucm.es/info/cliwoc/ [Accessed 15 February 2010]
USNO Astronomical Applications Department. 2008. Astronomical Applications
Department [online]. Available from http://aa.usno.navy.mil/data/docs/AltAz.php
[Accessed 25 August 2009]
Warnock, S. and Brown, N., (March 1998) Putting Landscape First, Landscape Design,
pp. 44-6.
Whitehead, M. (2009) State, Science and the Skies, Wiley-Blakewell.
Wildenstein, D. (1974-1985) Claude Monet : biographie et catalogue raisonné 1840-1926
Wildenstein, D. (1996b) Monet or the triumph of Impressionism, Taschen: Cologne,
Germany.

218
Wylie, J. (2007) Landscape, Routledge.

219
BIBLIOGRAPHY:
Adhemar, H. (1984) Ernest Hoschedé, in Rewald and Weitzenhoffer 1984, and Paris,
Grand Palais, 1980, pp. 169-83.
Douglas, C. K. M. (1953) London Fog of December 5-8, 1952 Meteorological Magazine.
82, pp. 67-71.
Masters, B. R. (1973) The City of London and Clean Air 1273AD to 1973AD,
Corporation of London pamphlet.
Ministry of Health (1954) Mortality and Morbidity during the London Fog of December
1952 London: HMSO. Table 3.
Oke, T. R. (1987) Boundary Layer Climates. Routledge, London.
Ruskin, J. (1903-12) The Works of John Ruskin, edited by E. T. Cook and A.Wedderburn,
39 vols. London: Library Edition.
Simmons, J. (1986) The railway in town and country, 1830-1914. David & Charles PLC.
Tate. 2009. Tate [online]. Available from http://tate.org.uk/modern/exhibitions/eliasson
[Accessed 01 October 2009]

220
Taylor, J. C. (1957) Learning to Look: A Handbook for the Visual Arts. Chicago
University Press, Chicago.
Wall, G. (1973) Public Response to Air Pollution in South Yorkshire, England,
Environment and Behaviour, V, 2, 225.
Whitely, N. (1999) `Readers of the lost art: visuality and particularity in art criticism', in I.
Heywood and B. Sandywell (eds), Interpreting Visual Culture: Explorations in the
Hermeneutics of the Visual. Routledge, London. pp. 99-122.
Wikipedia. 2006. Wikipedia [online]. Available from
http://en.wikipedia.org/wiki/Alvin_Langdon_Coburn [Accessed 11 April 2007]
Wikipedia. 2010. Wikipedia [online]. Available from
http://en.wikipedia.org/wiki/Fog [Accessed 10 March 2010]
Wikipedia. 2010. Wikipedia [online]. Available from
http://en.wikipedia.org/wiki/Natural_science [Accessed 26 March 2010]
Wikipedia. 2010. Wikipedia [online]. Available from
http://en.wikipedia.org/wiki/Oceanic_climate#Europe [Accessed 12 May 2010]
221
Wildenstein, D. (1996a) Claude Monet: biographie et catalogue raisonné, Taschen:
Cologne, Germany.
Wilkins, E. T. (1954) Air Pollution and the London Fog of December, 1952 Journal of
the Royal Sanitary Institute. 74, pp. 1-21.
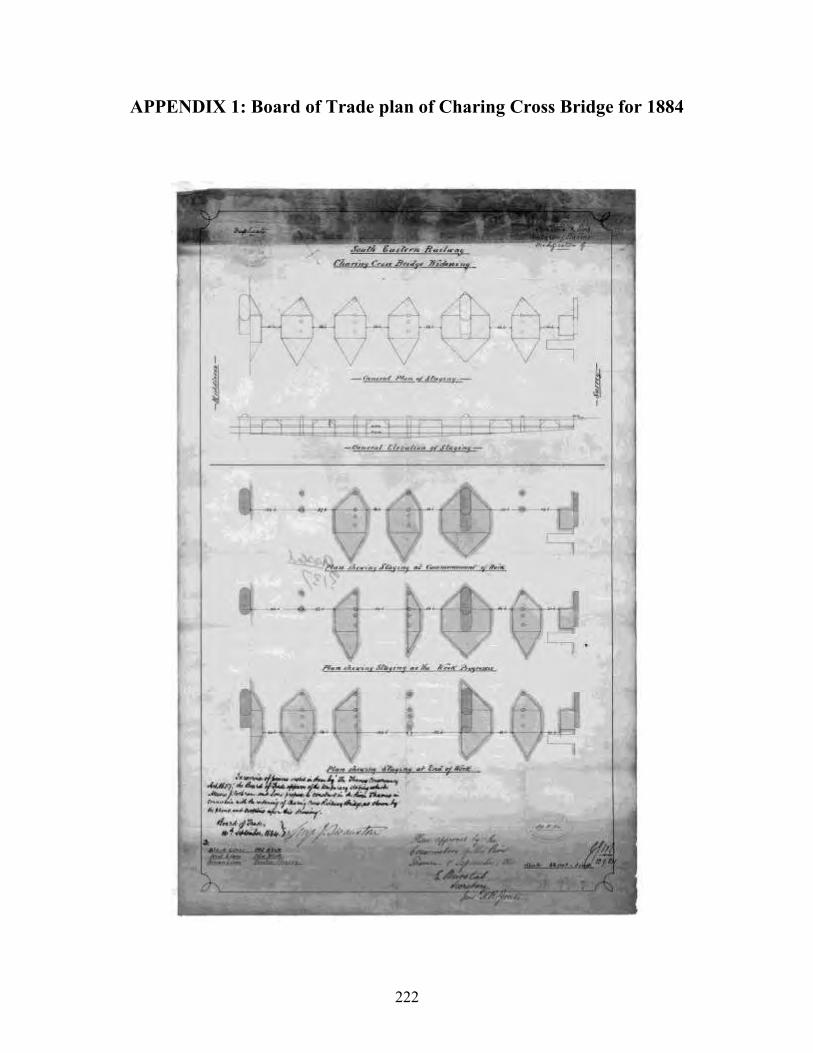
222
APPENDIX 1: Board of Trade plan of Charing Cross Bridge for 1884

223
APPENDIX 2: Geometrical analysis of the Waterloo Bridge paintings
Geometrical analysis of Waterloo Bridge paintings sun visible
WB Painting 2: ‘Waterloo Bridge, soleil dans le brouillard’ (W1573)
Angle (°) Distance (mm) Ratio (°/mm)
Solar Azimuth 122.50 ± 0.50 - -
AB 7.00 ± 0.50 25.00 0.280 ± 0.026
BC 5.00 ± 0.50 23.50 0.213 ± 0.026
AC 12.00 ± 0.50 48.50 0.247 ± 0.013
DE 2.70 ± 0.16 - -
EF 3.86 ± 0.05 13.00 0.297 ± 0.015
DF 6.56 ± 0.11 - -
Average degree to millimetre ratio: (0.259 ± 0.020) °/mm
Distance (mm) Angle (°)
Sun above Waterloo Bridge 42.00 ± 0.50 6.648 ± 1.000
Sun above City Sewers - -
Average elevation to the sun: (6.65 ± 1.00) °
WB Painting 3: ‘Waterloo Bridge’ (W1574)
Angle (°) Distance (mm) Ratio (°/mm)
Solar Azimuth 118.50 ± 0.50 - -
AB - - -
BC - - -
AC - - -
DE 2.70 ± 0.16 - -
EF 3.86 ± 0.05 8.00 0.483 ± 0.037
DF 6.56 ± 0.11 - -
Average degree to millimetre ratio: (0.483 ± 0.037) °/mm
Distance (mm) Angle (°)
Sun above Waterloo Bridge 25.00 ± 0.50 7.845 ± 1.196
Sun above City Sewers - -
Average elevation to the sun: (7.85 ± 1.20) °
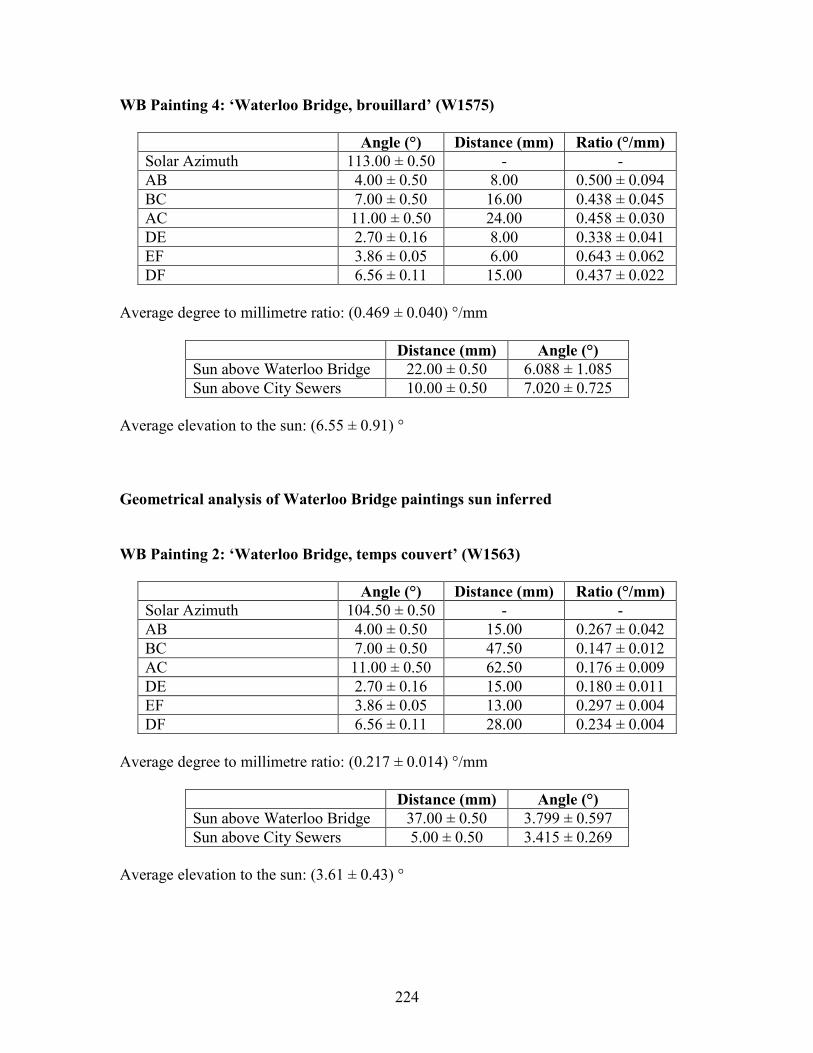
224
WB Painting 4: ‘Waterloo Bridge, brouillard’ (W1575)
Angle (°) Distance (mm) Ratio (°/mm)
Solar Azimuth 113.00 ± 0.50 - -
AB 4.00 ± 0.50 8.00 0.500 ± 0.094
BC 7.00 ± 0.50 16.00 0.438 ± 0.045
AC 11.00 ± 0.50 24.00 0.458 ± 0.030
DE 2.70 ± 0.16 8.00 0.338 ± 0.041
EF 3.86 ± 0.05 6.00 0.643 ± 0.062
DF 6.56 ± 0.11 15.00 0.437 ± 0.022
Average degree to millimetre ratio: (0.469 ± 0.040) °/mm
Distance (mm) Angle (°)
Sun above Waterloo Bridge 22.00 ± 0.50 6.088 ± 1.085
Sun above City Sewers 10.00 ± 0.50 7.020 ± 0.725
Average elevation to the sun: (6.55 ± 0.91) °
Geometrical analysis of Waterloo Bridge paintings sun inferred
WB Painting 2: ‘Waterloo Bridge, temps couvert’ (W1563)
Angle (°) Distance (mm) Ratio (°/mm)
Solar Azimuth 104.50 ± 0.50 - -
AB 4.00 ± 0.50 15.00 0.267 ± 0.042
BC 7.00 ± 0.50 47.50 0.147 ± 0.012
AC 11.00 ± 0.50 62.50 0.176 ± 0.009
DE 2.70 ± 0.16 15.00 0.180 ± 0.011
EF 3.86 ± 0.05 13.00 0.297 ± 0.004
DF 6.56 ± 0.11 28.00 0.234 ± 0.004
Average degree to millimetre ratio: (0.217 ± 0.014) °/mm
Distance (mm) Angle (°)
Sun above Waterloo Bridge 37.00 ± 0.50 3.799 ± 0.597
Sun above City Sewers 5.00 ± 0.50 3.415 ± 0.269
Average elevation to the sun: (3.61 ± 0.43) °
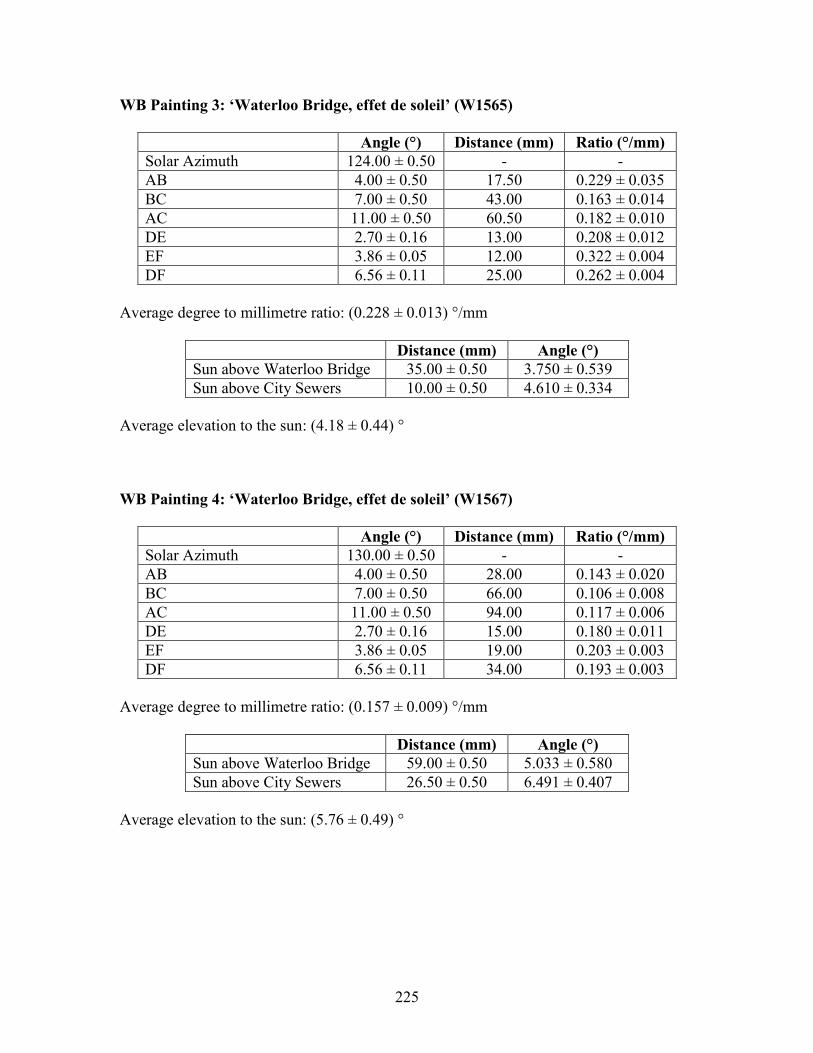
225
WB Painting 3: ‘Waterloo Bridge, effet de soleil’ (W1565)
Angle (°) Distance (mm) Ratio (°/mm)
Solar Azimuth 124.00 ± 0.50 - -
AB 4.00 ± 0.50 17.50 0.229 ± 0.035
BC 7.00 ± 0.50 43.00 0.163 ± 0.014
AC 11.00 ± 0.50 60.50 0.182 ± 0.010
DE 2.70 ± 0.16 13.00 0.208 ± 0.012
EF 3.86 ± 0.05 12.00 0.322 ± 0.004
DF 6.56 ± 0.11 25.00 0.262 ± 0.004
Average degree to millimetre ratio: (0.228 ± 0.013) °/mm
Distance (mm) Angle (°)
Sun above Waterloo Bridge 35.00 ± 0.50 3.750 ± 0.539
Sun above City Sewers 10.00 ± 0.50 4.610 ± 0.334
Average elevation to the sun: (4.18 ± 0.44) °
WB Painting 4: ‘Waterloo Bridge, effet de soleil’ (W1567)
Angle (°) Distance (mm) Ratio (°/mm)
Solar Azimuth 130.00 ± 0.50 - -
AB 4.00 ± 0.50 28.00 0.143 ± 0.020
BC 7.00 ± 0.50 66.00 0.106 ± 0.008
AC 11.00 ± 0.50 94.00 0.117 ± 0.006
DE 2.70 ± 0.16 15.00 0.180 ± 0.011
EF 3.86 ± 0.05 19.00 0.203 ± 0.003
DF 6.56 ± 0.11 34.00 0.193 ± 0.003
Average degree to millimetre ratio: (0.157 ± 0.009) °/mm
Distance (mm) Angle (°)
Sun above Waterloo Bridge 59.00 ± 0.50 5.033 ± 0.580
Sun above City Sewers 26.50 ± 0.50 6.491 ± 0.407
Average elevation to the sun: (5.76 ± 0.49) °

226
APPENDIX 3: Royal Horticultural Society’s weather diaries and weather reports for Westminster, Brixton
and Kew
b = blue sky
bc = partly cloudy
c = cloudy (detached opening clouds)
d = drizzling rain
f = fog
g = gale
h = hail
l = lightning
m = mist
o = overcast (the whole sky is covered with one impervious cloud)
p = shower (passing showers)
q = squally
r = rain (continuous rain)
rs = sleet
s = snow
t = thunder
v = visibility of distant objects whether sky cloudy
w = dew deposit
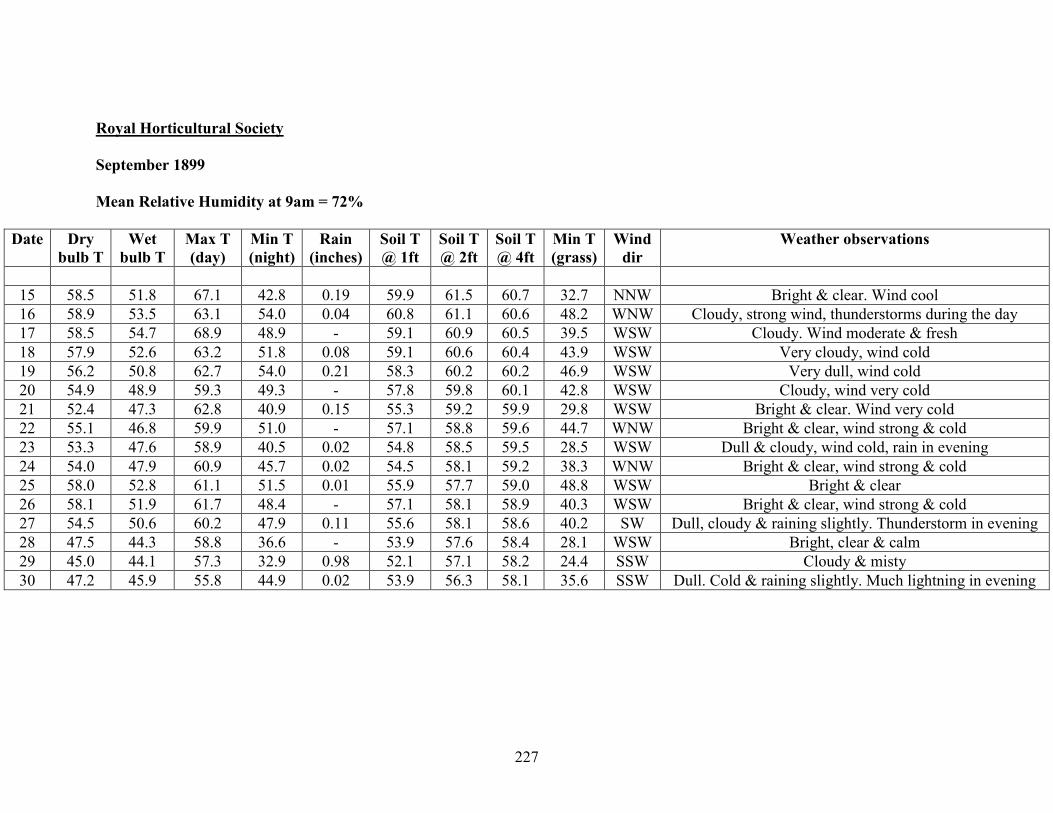
227
Royal Horticultural Society
September 1899
Mean Relative Humidity at 9am = 72%
Date Dry
bulb T
Wet
bulb T
Max T
(day)
Min T
(night)
Rain
(inches)
Soil T
@ 1ft
Soil T
@ 2ft
Soil T
@ 4ft
Min T
(grass)
Wind
dir
Weather observations
15 58.5 51.8 67.1 42.8 0.19 59.9 61.5 60.7 32.7 NNW Bright & clear. Wind cool
16 58.9 53.5 63.1 54.0 0.04 60.8 61.1 60.6 48.2 WNW Cloudy, strong wind, thunderstorms during the day
17 58.5 54.7 68.9 48.9 - 59.1 60.9 60.5 39.5 WSW Cloudy. Wind moderate & fresh
18 57.9 52.6 63.2 51.8 0.08 59.1 60.6 60.4 43.9 WSW Very cloudy, wind cold
19 56.2 50.8 62.7 54.0 0.21 58.3 60.2 60.2 46.9 WSW Very dull, wind cold
20 54.9 48.9 59.3 49.3 - 57.8 59.8 60.1 42.8 WSW Cloudy, wind very cold
21 52.4 47.3 62.8 40.9 0.15 55.3 59.2 59.9 29.8 WSW Bright & clear. Wind very cold
22 55.1 46.8 59.9 51.0 - 57.1 58.8 59.6 44.7 WNW Bright & clear, wind strong & cold
23 53.3 47.6 58.9 40.5 0.02 54.8 58.5 59.5 28.5 WSW Dull & cloudy, wind cold, rain in evening
24 54.0 47.9 60.9 45.7 0.02 54.5 58.1 59.2 38.3 WNW Bright & clear, wind strong & cold
25 58.0 52.8 61.1 51.5 0.01 55.9 57.7 59.0 48.8 WSW Bright & clear
26 58.1 51.9 61.7 48.4 - 57.1 58.1 58.9 40.3 WSW Bright & clear, wind strong & cold
27 54.5 50.6 60.2 47.9 0.11 55.6 58.1 58.6 40.2 SW Dull, cloudy & raining slightly. Thunderstorm in evening
28 47.5 44.3 58.8 36.6 - 53.9 57.6 58.4 28.1 WSW Bright, clear & calm
29 45.0 44.1 57.3 32.9 0.98 52.1 57.1 58.2 24.4 SSW Cloudy & misty
30 47.2 45.9 55.8 44.9 0.02 53.9 56.3 58.1 35.6 SSW Dull. Cold & raining slightly. Much lightning in evening

228
October 1899
Mean Relative Humidity at 9am = 88%
Date Dry
bulb T
Wet
bulb T
Max T
(day)
Min T
(night)
Rain
(inches)
Soil T
@ 1ft
Soil T
@ 2ft
Soil T
@ 4ft
Min T
(grass)
Wind
dir
Weather observations
1 51.9 50.0 63.2 42.5 0.17 52.1 55.8 57.8 32.4 ESE Raining. Wind cold
2 51.8 50.7 52.7 50.8 - 53.2 55.6 57.5 42.1 WSW Dull, cloudy & cold
3 52.9 49.1 61.6 37.4 0.05 51.2 55.3 57.2 27.1 WSW Clear & bright, wind cool
4 51.2 50.6 51.9 50.9 0.15 54.1 55.1 56.9 50.4 NNE Misty & raining
5 51.1 47.0 52.6 47.5 - 53.5 55.3 56.9 47.5 ENE Dull & overcast, wind moderate & fresh
6 48.6 45.4 53.3 37.5 - 51.8 55.1 56.9 27.5 ENE Misty, fine, wind cool
7 45.6 44.0 56.1 34.9 - 50.2 54.6 56.7 26.2 SSE Misty, fine, wind cool
8 36.6 36.2 51.1 32.4 - 49.2 54.1 55.4 25.4 NNW Very misty or white fog, cold
9 40.1 40.0 59.7 31.7 - 48.3 53.3 56.1 25.9 ESE Dense fog
10 36.1 35.6 60.2 32.1 - 48.2 52.9 55.9 24.9 ESE Dense fog
11 41.0 40.3 63.7 34.6 - 48.2 52.5 55.6 27.1 SE Dense fog
12 51.2 50.6 62.9 40.5 0.07 49.6 52.5 55.4 33.2 SE Slight fog
13 47.8 43.5 53.6 41.2 - 50.5 52.8 55.1 32.8 WSW Bright & clear wind fresh
14 41.0 39.7 52.5 29.0 - 47.9 52.6 54.9 20.2 NNE Slightly misty
15 49.9 44.7 52.2 39.3 - 47.3 51.8 54.9 26.1 ESE Bright & clear, wind strong & cold
16 47.9 44.0 56.1 42.9 - 47.3 51.3 54.6 33.7 ENE Slightly misty, strong & cold wind
17 44.8 44.2 59.1 42.0 - 47.8 51.3 54.4 32.0 ENE Thick fog
18 40.0 40.0 61.7 34.0 - 47.1 51.2 54.3 25.6 ENE Thick fog
19 43.9 43.7 57.7 36.1 - 46.8 50.9 53.9 25.5 ENE Dense fog
20 40.8 40.6 52.6 35.0 - 46.2 50.5 53.8 26.5 ENE Dense fog
21 40.0 40.0 43.2 33.9 - 45.6 49.9 53.5 25.8 ENE Dense fog
22 43.1 42.9 53.3 39.9 - 46.4 49.9 53.3 39.0 ENE Dense fog, so dense at night impossible to see anything

229
Date Dry
bulb T
Wet
bulb T
Max T
(day)
Min T
(night)
Rain
(inches)
Soil T
@ 1ft
Soil T
@ 2ft
Soil T
@ 4ft
Min T
(grass)
Wind
dir
Weather observations
23 43.8 43.8 54.0 39.1 - 46.9 49.9 53.1 36.4 NW Slight fog
24 47.5 47.5 59.9 42.5 - 47.1 50.2 52.9 33.1 WNW Slight fog
25 49.7 47.9 59.7 39.8 - 49.1 50.5 52.9 34.9 ESE Slight fog
26 55.1 52.6 57.2 44.9 0.21 49.7 50.9 52.8 33.9 SSW Bright & clear, rain later
27 57.8 56.3 60.2 53.9 1.08 51.8 51.3 52.8 51.5 SW Dull & cloudy, heavy rain later
28 58.5 57.2 62.7 57.1 - 54.2 52.1 52.8 51.9 SSW Cloudy to clear, fine day
29 58.2 55.8 60.5 50.5 0.27 54.7 52.9 52.9 43.9 SSW Dull & cloudy, rain in the evening
30 48.2 47.5 51.1 47.9 0.02 54.4 53.2 53.1 47.8 NNW Overcast & raining slightly
31 47.0 43.7 55.5 35.9 - 50.8 53.2 53.3 35.9 WSW Clear & bright
November 1899
Mean Relative Humidity = 86%
Date Dry
bulb T
Wet
bulb T
Max T
(day)
Min T
(night)
Rain
(inches)
Soil T
@ 1ft
Soil T
@ 2ft
Soil T
@ 4ft
Min T
(grass)
Wind
dir
Weather observations
1 51.9 48.8 63.3 34.5 0.04 48.5 52.3 53.4 26.4 SSE Bright & clear
2 58.9 57.5 60.0 48.5 0.32 48.5 51.5 53.3 35.9 SSE Dull, very mild and raining
3 56.8 51.6 59.0 52.5 1.33 51.6 51.8 53.2 44.5 SW Clear & bright at first, rain later
4 59.2 58.4 60.9 48.9 0.31 51.9 52.2 53.1 48.1 SW Cloudy & raining, wind strong
5 55.1 53.8 61.2 54.0 1.25 54.1 52.7 53.1 52.5 SW Cloudy & raining, calmer, thorough wet day
6 49.5 48.4 52.5 48.8 0.02 53.3 53.2 53.1 47.5 ENE Overcast & raining
7 50.2 48.8 55.7 35.3 0.32 50.2 53.1 53.3 28.9 SSW Clear & bright at first, rain later
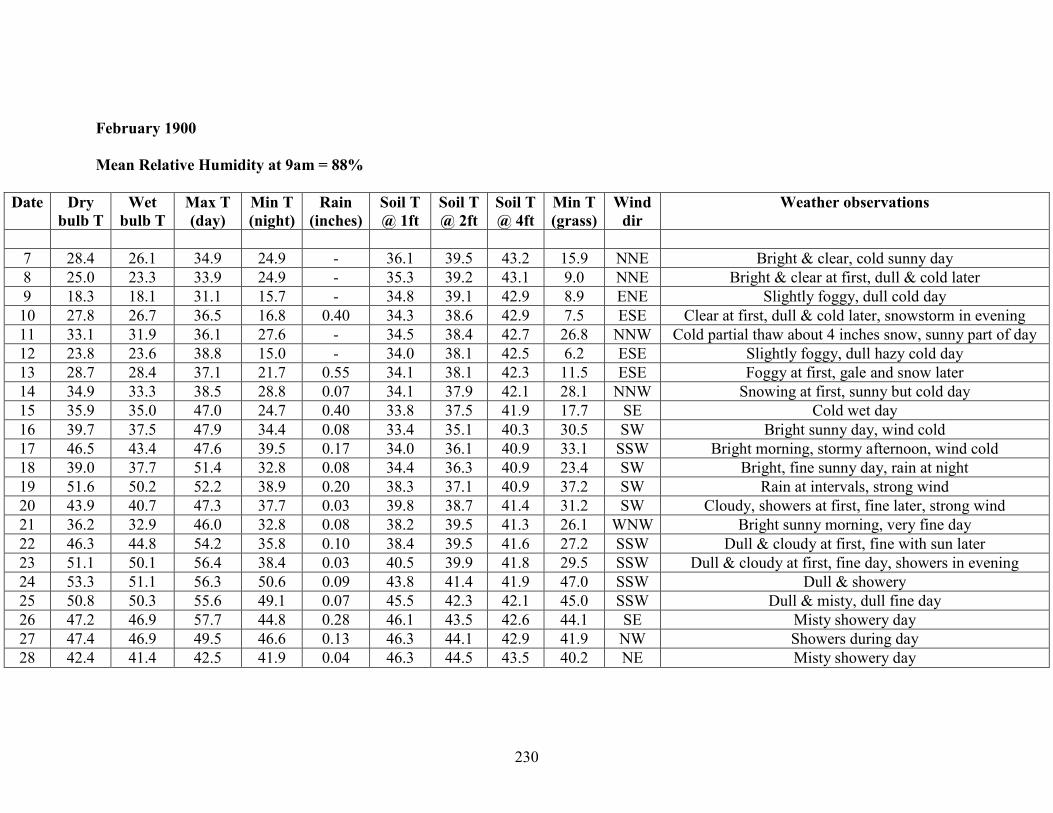
230
February 1900
Mean Relative Humidity at 9am = 88%
Date Dry
bulb T
Wet
bulb T
Max T
(day)
Min T
(night)
Rain
(inches)
Soil T
@ 1ft
Soil T
@ 2ft
Soil T
@ 4ft
Min T
(grass)
Wind
dir
Weather observations
7 28.4 26.1 34.9 24.9 - 36.1 39.5 43.2 15.9 NNE Bright & clear, cold sunny day
8 25.0 23.3 33.9 24.9 - 35.3 39.2 43.1 9.0 NNE Bright & clear at first, dull & cold later
9 18.3 18.1 31.1 15.7 - 34.8 39.1 42.9 8.9 ENE Slightly foggy, dull cold day
10 27.8 26.7 36.5 16.8 0.40 34.3 38.6 42.9 7.5 ESE Clear at first, dull & cold later, snowstorm in evening
11 33.1 31.9 36.1 27.6 - 34.5 38.4 42.7 26.8 NNW Cold partial thaw about 4 inches snow, sunny part of day
12 23.8 23.6 38.8 15.0 - 34.0 38.1 42.5 6.2 ESE Slightly foggy, dull hazy cold day
13 28.7 28.4 37.1 21.7 0.55 34.1 38.1 42.3 11.5 ESE Foggy at first, gale and snow later
14 34.9 33.3 38.5 28.8 0.07 34.1 37.9 42.1 28.1 NNW Snowing at first, sunny but cold day
15 35.9 35.0 47.0 24.7 0.40 33.8 37.5 41.9 17.7 SE Cold wet day
16 39.7 37.5 47.9 34.4 0.08 33.4 35.1 40.3 30.5 SW Bright sunny day, wind cold
17 46.5 43.4 47.6 39.5 0.17 34.0 36.1 40.9 33.1 SSW Bright morning, stormy afternoon, wind cold
18 39.0 37.7 51.4 32.8 0.08 34.4 36.3 40.9 23.4 SW Bright, fine sunny day, rain at night
19 51.6 50.2 52.2 38.9 0.20 38.3 37.1 40.9 37.2 SW Rain at intervals, strong wind
20 43.9 40.7 47.3 37.7 0.03 39.8 38.7 41.4 31.2 SW Cloudy, showers at first, fine later, strong wind
21 36.2 32.9 46.0 32.8 0.08 38.2 39.5 41.3 26.1 WNW Bright sunny morning, very fine day
22 46.3 44.8 54.2 35.8 0.10 38.4 39.5 41.6 27.2 SSW Dull & cloudy at first, fine with sun later
23 51.1 50.1 56.4 38.4 0.03 40.5 39.9 41.8 29.5 SSW Dull & cloudy at first, fine day, showers in evening
24 53.3 51.1 56.3 50.6 0.09 43.8 41.4 41.9 47.0 SSW Dull & showery
25 50.8 50.3 55.6 49.1 0.07 45.5 42.3 42.1 45.0 SSW Dull & misty, dull fine day
26 47.2 46.9 57.7 44.8 0.28 46.1 43.5 42.6 44.1 SE Misty showery day
27 47.4 46.9 49.5 46.6 0.13 46.3 44.1 42.9 41.9 NW Showers during day
28 42.4 41.4 42.5 41.9 0.04 46.3 44.5 43.5 40.2 NE Misty showery day

231
March 1900
Mean Relative Humidity at 9am = 79%
Date Dry
bulb T
Wet
bulb T
Max T
(day)
Min T
(night)
Rain
(inches)
Soil T
@ 1ft
Soil T
@ 2ft
Soil T
@ 4ft
Min T
(grass)
Wind
dir
Weather observations
1 38.8 35.0 41.7 36.7 0.01 43.7 44.5 43.8 33.5 NE Dull fine day, wind cold
2 38.1 36.5 42.2 31.8 0.02 41.2 43.6 44.1 22.6 NNW Dull & cold
3 38.9 36.8 43.0 35.9 0.01 41.0 42.9 44.1 30.4 NW Misty, dull & cold
4 36.6 34.4 39.6 35.3 0.01 40.9 42.7 44.1 33.8 NE Dull cold day
5 38.0 35.8 39.6 35.2 - 40.5 42.4 44.1 31.1 NE Dull cold day
6 38.4 36.0 39.4 37.6 - 40.4 42.2 44.0 35.3 NE Very dull cold day
7 36.9 33.9 42.0 34.8 - 39.8 42.1 43.9 32.9 NW Very dull cold day
8 39.8 34.8 41.5 37.1 - 40.5 42.1 43.9 34.5 ENE Very dull cold day
9 40.4 36.7 46.2 37.2 - 40.0 41.9 43.9 33.3 ESE Very dull cold day
10 43.8 41.0 55.5 38.8 - 40.4 41.9 43.9 32.9 ENE Misty at first, bright sunshine later
11 42.8 40.7 52.2 37.5 - 41.2 42.2 43.9 29.2 ENE Dull & misty
12 39.7 37.2 56.9 32.9 - 41.2 42.4 43.9 23.6 NNW Bright morning, very fine day
13 45.8 42.8 46.6 36.6 - 42.1 42.8 43.9 26.5 NNW Dull & cloudy, no sun
14 44.2 41.6 52.4 31.9 - 40.6 42.6 43.9 22.3 NNW Dull & cloudy, flashes of sunshine
15 46.2 42.5 49.4 42.2 0.06 42.4 43.1 43.9 38.5 W Dull cold day
16 38.9 36.9 43.6 36.7 - 42.6 43.1 43.9 33.9 WNW Dull and cloudy flashes of sunshine
17 33.8 30.5 41.0 25.6 - 40.4 43.1 43.9 16.5 WNW Dull with cold sleet showers
18 38.0 32.9 41.6 21.7 0.37 39.0 42.4 44.1 14.4 ENE Bright & clear at first, sleet showers later
19 36.2 35.8 45.3 32.9 0.18 38.8 41.9 44.1 31.3 SSE Dull at first, fine with sun later
20 44.4 40.5 51.5 36.1 - 40.4 41.9 43.9 27.6 SSW Bright & clear, fine bright day throughout
21 39.1 37.7 47.5 33.4 0.11 40.4 42.2 43.9 21.6 ENE Misty cold day, rain at night
22 43.8 41.7 45.7 38.9 - 41.1 42.2 43.9 36.9 ENE Dull cold day
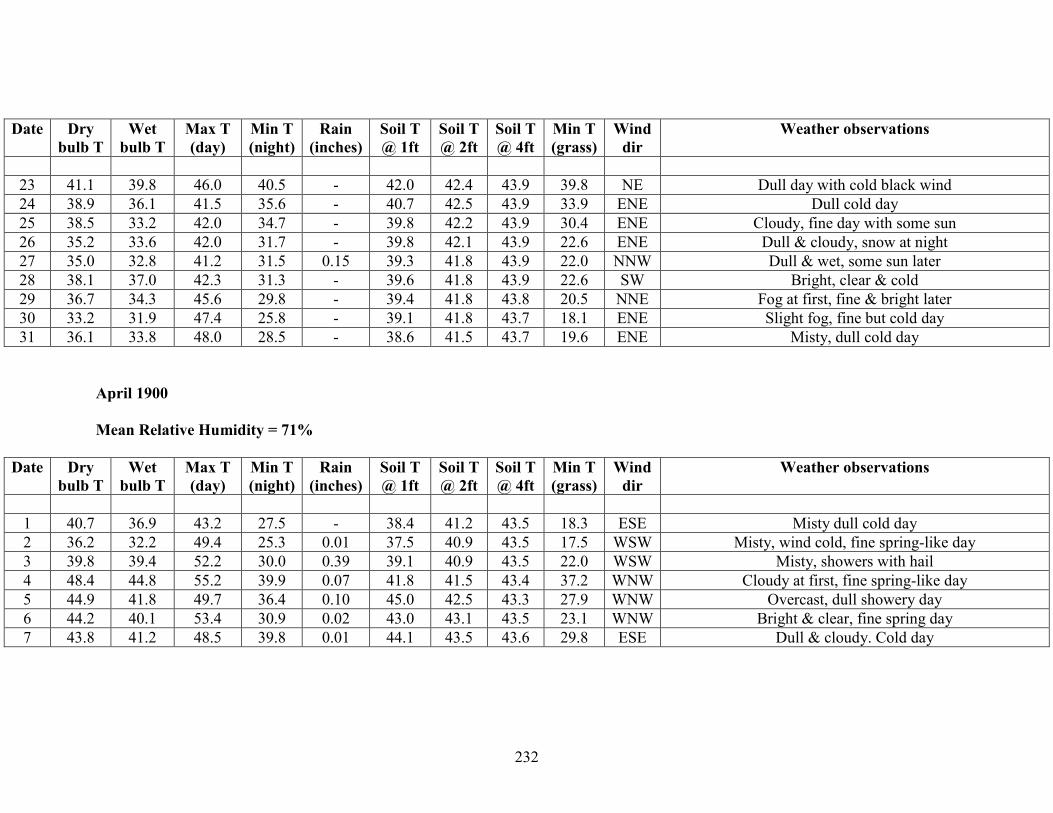
232
Date Dry
bulb T
Wet
bulb T
Max T
(day)
Min T
(night)
Rain
(inches)
Soil T
@ 1ft
Soil T
@ 2ft
Soil T
@ 4ft
Min T
(grass)
Wind
dir
Weather observations
23 41.1 39.8 46.0 40.5 - 42.0 42.4 43.9 39.8 NE Dull day with cold black wind
24 38.9 36.1 41.5 35.6 - 40.7 42.5 43.9 33.9 ENE Dull cold day
25 38.5 33.2 42.0 34.7 - 39.8 42.2 43.9 30.4 ENE Cloudy, fine day with some sun
26 35.2 33.6 42.0 31.7 - 39.8 42.1 43.9 22.6 ENE Dull & cloudy, snow at night
27 35.0 32.8 41.2 31.5 0.15 39.3 41.8 43.9 22.0 NNW Dull & wet, some sun later
28 38.1 37.0 42.3 31.3 - 39.6 41.8 43.9 22.6 SW Bright, clear & cold
29 36.7 34.3 45.6 29.8 - 39.4 41.8 43.8 20.5 NNE Fog at first, fine & bright later
30 33.2 31.9 47.4 25.8 - 39.1 41.8 43.7 18.1 ENE Slight fog, fine but cold day
31 36.1 33.8 48.0 28.5 - 38.6 41.5 43.7 19.6 ENE Misty, dull cold day
April 1900
Mean Relative Humidity = 71%
Date Dry
bulb T
Wet
bulb T
Max T
(day)
Min T
(night)
Rain
(inches)
Soil T
@ 1ft
Soil T
@ 2ft
Soil T
@ 4ft
Min T
(grass)
Wind
dir
Weather observations
1 40.7 36.9 43.2 27.5 - 38.4 41.2 43.5 18.3 ESE Misty dull cold day
2 36.2 32.2 49.4 25.3 0.01 37.5 40.9 43.5 17.5 WSW Misty, wind cold, fine spring-like day
3 39.8 39.4 52.2 30.0 0.39 39.1 40.9 43.5 22.0 WSW Misty, showers with hail
4 48.4 44.8 55.2 39.9 0.07 41.8 41.5 43.4 37.2 WNW Cloudy at first, fine spring-like day
5 44.9 41.8 49.7 36.4 0.10 45.0 42.5 43.3 27.9 WNW Overcast, dull showery day
6 44.2 40.1 53.4 30.9 0.02 43.0 43.1 43.5 23.1 WNW Bright & clear, fine spring day
7 43.8 41.2 48.5 39.8 0.01 44.1 43.5 43.6 29.8 ESE Dull & cloudy. Cold day
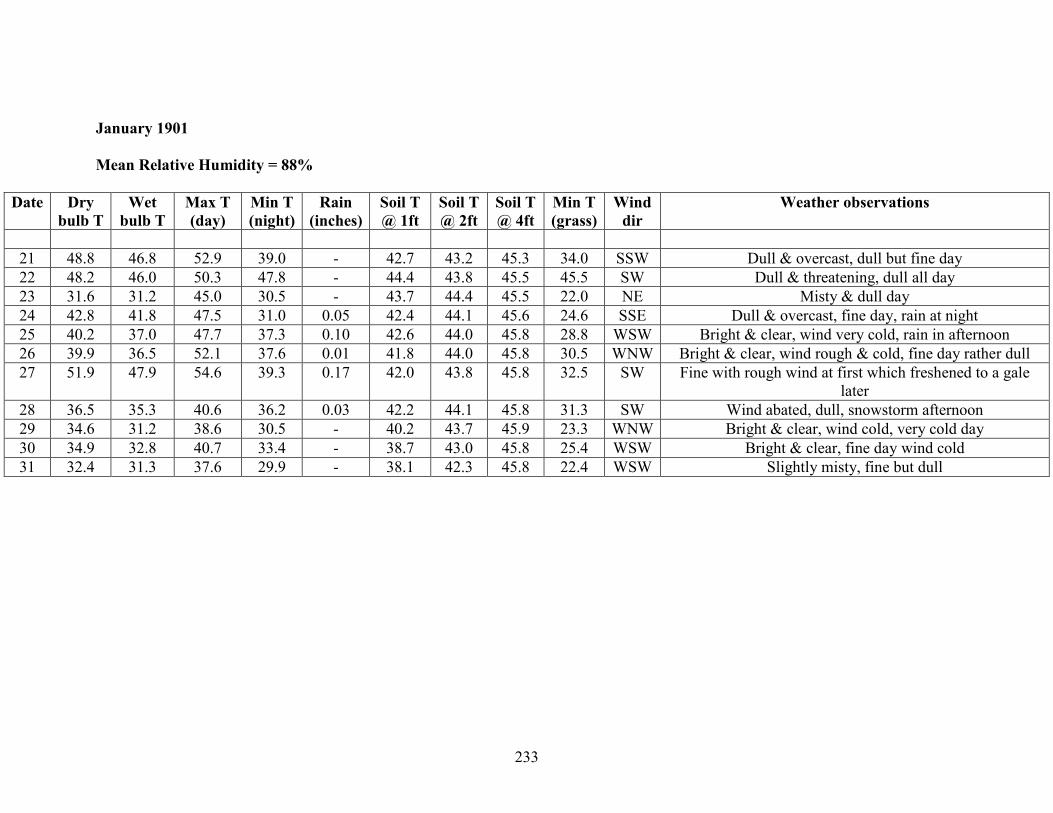
233
January 1901
Mean Relative Humidity = 88%
Date Dry
bulb T
Wet
bulb T
Max T
(day)
Min T
(night)
Rain
(inches)
Soil T
@ 1ft
Soil T
@ 2ft
Soil T
@ 4ft
Min T
(grass)
Wind
dir
Weather observations
21 48.8 46.8 52.9 39.0 - 42.7 43.2 45.3 34.0 SSW Dull & overcast, dull but fine day
22 48.2 46.0 50.3 47.8 - 44.4 43.8 45.5 45.5 SW Dull & threatening, dull all day
23 31.6 31.2 45.0 30.5 - 43.7 44.4 45.5 22.0 NE Misty & dull day
24 42.8 41.8 47.5 31.0 0.05 42.4 44.1 45.6 24.6 SSE Dull & overcast, fine day, rain at night
25 40.2 37.0 47.7 37.3 0.10 42.6 44.0 45.8 28.8 WSW Bright & clear, wind very cold, rain in afternoon
26 39.9 36.5 52.1 37.6 0.01 41.8 44.0 45.8 30.5 WNW Bright & clear, wind rough & cold, fine day rather dull
27 51.9 47.9 54.6 39.3 0.17 42.0 43.8 45.8 32.5 SW Fine with rough wind at first which freshened to a gale
later
28 36.5 35.3 40.6 36.2 0.03 42.2 44.1 45.8 31.3 SW Wind abated, dull, snowstorm afternoon
29 34.6 31.2 38.6 30.5 - 40.2 43.7 45.9 23.3 WNW Bright & clear, wind cold, very cold day
30 34.9 32.8 40.7 33.4 - 38.7 43.0 45.8 25.4 WSW Bright & clear, fine day wind cold
31 32.4 31.3 37.6 29.9 - 38.1 42.3 45.8 22.4 WSW Slightly misty, fine but dull

234
February 1901
Mean Relative Humidity = 85%
Date Dry
bulb T
Wet
bulb T
Max T
(day)
Min T
(night)
Rain
(inches)
Soil T
@ 1ft
Soil T
@ 2ft
Soil T
@ 4ft
Min T
(grass)
Wind
dir
Weather observations
1 32.1 31.2 40.1 28.0 - 37.6 41.8 45.5 19.4 WSW Slightly misty at first, fine day with sun afternoon
2 35.7 33.8 42.4 29.7 - 37.0 41.3 45.3 20.7 SE Dull & cloudy fine but dull all day
3 36.2 34.5 39.0 35.2 - 38.0 41.2 45.1 30.0 ENE Dull cold & misty, fine day but dull
4 30.8 30.2 36.9 23.8 0.48 37.6 41.2 44.9 16.3 ENE Misty, snow showers afternoon & evening
5 33.0 31.8 35.2 30.3 - 37.3 40.8 44.7 30.5 NNE Snow & rain had fallen during the night, about 2 inches
laying
6 35.4 34.2 38.0 31.5 - 37.3 40.6 44.7 26.2 NNE Cloudy, fine but dull day, cold
7 30.9 29.4 39.3 30.2 - 37.1 40.5 44.4 22.4 NNW Bright, fine day, cold
8 34.0 32.9 39.6 29.8 - 36.8 40.3 44.2 22.3 SE Misty, fine but dull day
9 36.8 36.2 41.3 34.0 - 38.0 40.3 44.2 33.1 WNW Dull & misty. Dull & cold all day
10 39.0 37.8 43.1 35.6 - 38.4 40.5 44.1 25.1 NNE Dull & cloudy, dull day
11 36.7 34.6 38.6 36.2 - 39.2 41.0 43.9 33.6 NNE Dull & overcast fine day
12 31.1 28.0 37.9 25.1 - 37.8 41.0 43.9 16.7 NNW Bright, fine day with some sunshine
13 33.1 32.0 36.2 30.6 - 36.4 40.5 43.9 23.6 NNW Cloudy, fine day but dull
14 28.0 25.7 33.9 20.7 - 35.8 40.1 43.9 14.6 NNW Bright, fine day, cold wind
15 32.0 30.2 34.5 28.7 - 35.4 39.5 43.6 17.9 WSW Bright, fine day, wind cold
16 34.0 32.9 43.1 25.1 0.07 35.3 39.4 43.6 17.9 WSW Bright at first, rain in afternoon
17 36.8 34.5 41.1 33.9 0.02 35.3 39.2 43.3 29.7 NW Bright, snow showers at intervals
18 35.7 33.5 36.4 31.3 - 35.5 39.2 43.2 24.1 NNE Cloudy, fine day, dull
19 33.0 32.0 35.0 29.5 0.05 35.7 39.2 43.0 21.4 WNW Slight snow showers, very dark afternoon
20 33.5 30.7 35.0 32.4 - 35.9 39.2 43.0 29.2 ENE Dark dull day
21 30.5 29.2 39.4 24.1 0.07 35.7 39.2 42.9 16.2 NNE Bright at first, rain and snow later
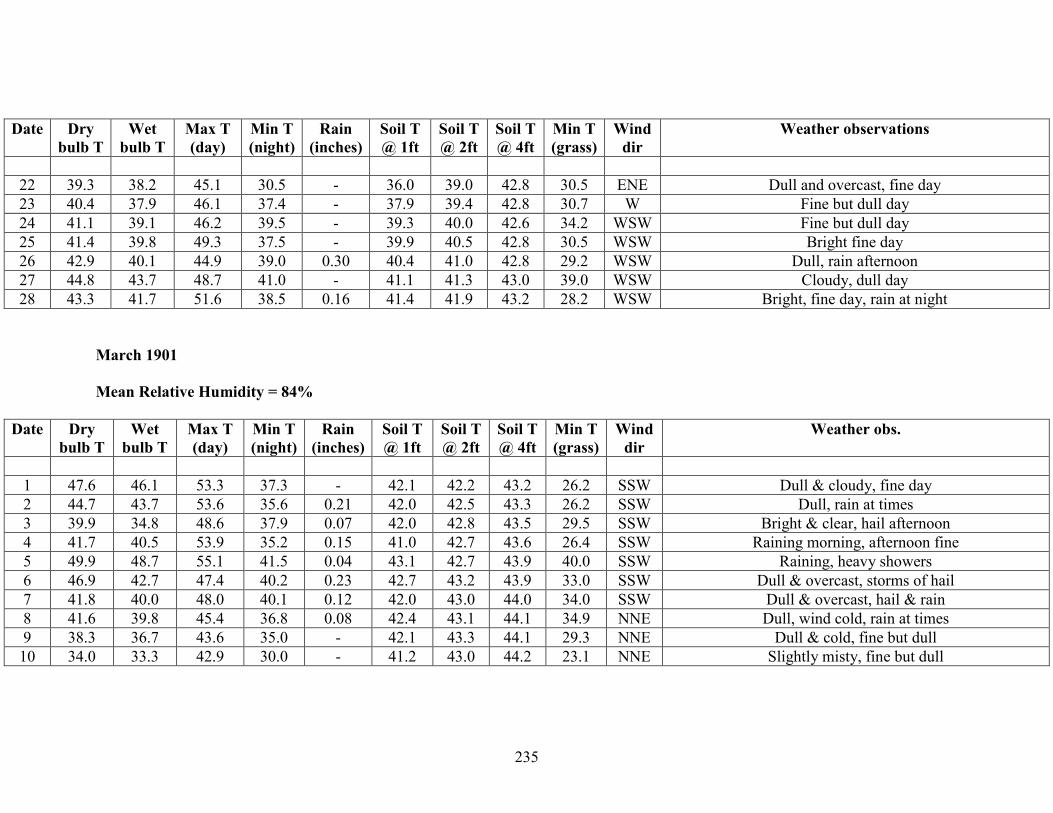
235
Date Dry
bulb T
Wet
bulb T
Max T
(day)
Min T
(night)
Rain
(inches)
Soil T
@ 1ft
Soil T
@ 2ft
Soil T
@ 4ft
Min T
(grass)
Wind
dir
Weather observations
22 39.3 38.2 45.1 30.5 - 36.0 39.0 42.8 30.5 ENE Dull and overcast, fine day
23 40.4 37.9 46.1 37.4 - 37.9 39.4 42.8 30.7 W Fine but dull day
24 41.1 39.1 46.2 39.5 - 39.3 40.0 42.6 34.2 WSW Fine but dull day
25 41.4 39.8 49.3 37.5 - 39.9 40.5 42.8 30.5 WSW Bright fine day
26 42.9 40.1 44.9 39.0 0.30 40.4 41.0 42.8 29.2 WSW Dull, rain afternoon
27 44.8 43.7 48.7 41.0 - 41.1 41.3 43.0 39.0 WSW Cloudy, dull day
28 43.3 41.7 51.6 38.5 0.16 41.4 41.9 43.2 28.2 WSW Bright, fine day, rain at night
March 1901
Mean Relative Humidity = 84%
Date Dry
bulb T
Wet
bulb T
Max T
(day)
Min T
(night)
Rain
(inches)
Soil T
@ 1ft
Soil T
@ 2ft
Soil T
@ 4ft
Min T
(grass)
Wind
dir
Weather obs.
1 47.6 46.1 53.3 37.3 - 42.1 42.2 43.2 26.2 SSW Dull & cloudy, fine day
2 44.7 43.7 53.6 35.6 0.21 42.0 42.5 43.3 26.2 SSW Dull, rain at times
3 39.9 34.8 48.6 37.9 0.07 42.0 42.8 43.5 29.5 SSW Bright & clear, hail afternoon
4 41.7 40.5 53.9 35.2 0.15 41.0 42.7 43.6 26.4 SSW Raining morning, afternoon fine
5 49.9 48.7 55.1 41.5 0.04 43.1 42.7 43.9 40.0 SSW Raining, heavy showers
6 46.9 42.7 47.4 40.2 0.23 42.7 43.2 43.9 33.0 SSW Dull & overcast, storms of hail
7 41.8 40.0 48.0 40.1 0.12 42.0 43.0 44.0 34.0 SSW Dull & overcast, hail & rain
8 41.6 39.8 45.4 36.8 0.08 42.4 43.1 44.1 34.9 NNE Dull, wind cold, rain at times
9 38.3 36.7 43.6 35.0 - 42.1 43.3 44.1 29.3 NNE Dull & cold, fine but dull
10 34.0 33.3 42.9 30.0 - 41.2 43.0 44.2 23.1 NNE Slightly misty, fine but dull

236
Date Dry
bulb T
Wet
bulb T
Max T
(day)
Min T
(night)
Rain
(inches)
Soil T
@ 1ft
Soil T
@ 2ft
Soil T
@ 4ft
Min T
(grass)
Wind
dir
Weather obs.
11 32.3 30.6 45.1 30.0 - 40.0 42.8 44.2 21.8 NNE Slightly misty, fine but dull
12 40.9 39.9 53.3 31.9 - 40.3 42.5 44.2 30.2 NNE Slightly misty, fine but dull
13 37.5 36.3 42.1 31.5 - 41.6 42.9 44.2 24.3 NNE Overcast, fine, dull & cold
14 40.2 38.8 47.3 36.7 - 41.0 42.7 44.2 30.5 ENE Dull day, wind cold
15 39.9 37.9 42.1 37.7 0.09 41.5 42.8 44.2 36.3 E Very dull all day, rain at night
16 38.2 37.6 45.1 36.8 - 41.5 42.8 44.2 36.2 NE Raining morning, fine bright afternoon
17 42.2 39.1 47.6 33.8 - 41.6 42.8 44.2 26.0 ENE Misty, fine day
18 39.7 37.7 41.6 39.4 - 41.2 43.0 44.2 38.2 ENE Dull cold day
19 38.7 34.6 41.6 35.3 0.27 41.2 42.9 44.2 33.0 ENE Bright. Wind cold, sleet showers
20 38.6 37.2 41.3 34.6 0.12 41.2 42.9 44.2 33.4 ENE Raining, wet cold day
21 39.2 35.1 43.1 36.7 - 40.5 42.5 44.2 32.7 ENE Dull, wind very cold
22 38.0 33.8 43.3 31.5 - 39.8 42.3 44.2 24.9 ENE Dull, wind cold, fine day. Gale
23 39.7 37.2 42.4 36.1 - 40.2 42.1 44.2 31.0 ENE Dull, fine day
24 38.0 35.7 44.5 32.8 - 40.3 42.2 44.2 23.4 NE Dull at first, bright afternoon, wind cold
25 35.5 34.6 38.0 31.3 0.03 39.8 42.2 44.2 22.1 ENE Dull, snow at intervals
26 32.7 32.0 38.3 27.0 - 38.7 42.0 44.2 22.0 NW Bright & clear, fine bright day, snow evening
27 34.2 32.0 38.3 27.0 - 38.2 41.5 44.0 19.5 NW Bright & clear, very fine day, wind cold
28 33.5 31.8 39.4 25.3 - 37.8 41.3 43.9 19.1 N Cloudy, dull cold day
29 35.0 30.9 43.2 24.1 0.07 37.4 40.9 43.9 16.0 WNW Bright & clear, fine day
30 43.3 41.4 50.5 34.9 0.49 38.8 40.9 43.7 33.2 SSW Heavy gale with rain
31 43.9 43.2 50.9 42.1 - 40.8 41.2 43.5 37.3 SSW Raining at first, fine bright afternoon

237
April 1901
Mean Relative Humidity = 65%
Date Dry
bulb T
Wet
bulb T
Max T
(day)
Min T
(night)
Rain
(inches)
Soil T
@ 1ft
Soil T
@ 2ft
Soil T
@ 4ft
Min T
(grass)
Wind
dir
Weather obs.
1 44.1 39.9 50.4 35.2 - 41.9 42.1 43.5 24.8 W Cloudy at first, fine bright day
2 45.2 41.8 54.0 27.9 0.02 41.2 42.5 43.5 20.1 SSW Bright, fine day, cold
3 51.9 50.0 56.7 45.7 0.58 43.9 42.8 43.7 40.8 SSW Dull, wind strong, rain evening
4 44.8 40.9 58.2 41.7 - 45.6 43.7 43.9 40.0 WNW Dull at first, fine & bright later
5 40.1 38.4 46.6 32.2 0.02 44.5 44.4 44.0 27.2 SE Dull cold day
6 42.2 41.5 55.3 29.7 0.13 42.4 44.2 44.2 21.5 SE Raining at first, fine afternoon
7 51.8 49.9 60.3 42.2 0.10 44.5 43.9 44.3 41.5 SW Dull, showers at intervals
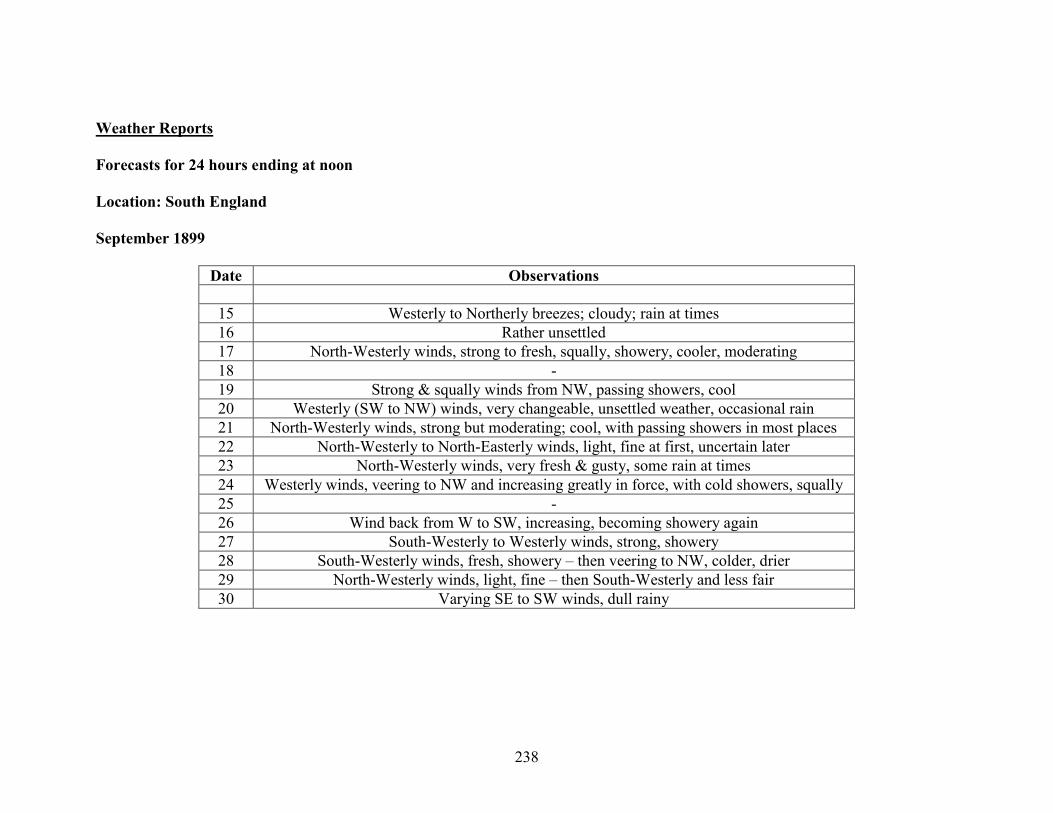
238
Weather Reports
Forecasts for 24 hours ending at noon
Location: South England
September 1899
Date Observations
15 Westerly to Northerly breezes; cloudy; rain at times
16 Rather unsettled
17 North-Westerly winds, strong to fresh, squally, showery, cooler, moderating
18 -
19 Strong & squally winds from NW, passing showers, cool
20 Westerly (SW to NW) winds, very changeable, unsettled weather, occasional rain
21 North-Westerly winds, strong but moderating; cool, with passing showers in most places
22 North-Westerly to North-Easterly winds, light, fine at first, uncertain later
23 North-Westerly winds, very fresh & gusty, some rain at times
24 Westerly winds, veering to NW and increasing greatly in force, with cold showers, squally
25 -
26 Wind back from W to SW, increasing, becoming showery again
27 South-Westerly to Westerly winds, strong, showery
28 South-Westerly winds, fresh, showery – then veering to NW, colder, drier
29 North-Westerly winds, light, fine – then South-Westerly and less fair
30 Varying SE to SW winds, dull rainy

239
October 1899
Date Observations
1 South-Westerly to North-Westerly winds, unsettled, some rain
2 -
3 Westerly to North-Westerly winds, strong & squally, but moderating, rainy to fair
4 South-Westerly to Westerly winds, freshening; fair at first, some rain later
5 South-Westerly to Westerly winds, strong to a gale on coasts; dull at first, with some rain, improving later
6 North-Westerly winds, light; local showers at first, then fair; frost inland at night
7 Easterly to North-Easterly winds, light or moderate, fair generally, frosty at night, with local fogs
8 Northerly to North-Easterly winds, light, fair generally, frosty & foggy at night
9 -
10 Southerly & South-Westerly winds, light, fine generally but local fogs at night
11 Light breezes chiefly South-Westerly, fair generally, local fogs at night
12 Southerly winds, light or moderate, fine at first, cloudy later probably some rain
13 Southerly to Westerly winds, moderate, cloudy, some rain, cooler
14 North-Westerly winds, fresh or strong at first, moderating later, fair generally, but local showers, frost inland at night
15 Northerly to North-Easterly winds, light or moderate; fine generally, local fogs at night
16 -
17 Easterly to South-Easterly winds, fresh, fair at first, cloudy later, possibly some rain
18 Easterly to South-Easterly winds, light or moderate, fine generally, local fogs at night
19 Easterly winds, light, fine generally but local fogs at night
20 Easterly to South-Easterly winds, light, fair generally, but local fogs at night
21 Variable to Easterly airs, fair in places, but mostly foggy or misty
22 Variable to Easterly airs, fair in places, but mostly foggy or misty
23 -
24 Variable or Westerly airs, foggy or misty in most places
25 North-Westerly or North-Easterly breezes, very light, fair, but cooler & foggy

240
Date Observations
26 Southerly and South-Westerly winds, light to moderate, changeable, fair milder
27 South-Westerly & Westerly winds, light, slight showers, then colder & finer
28 South-Westerly & Southerly winds, light; rainy then cooler
29 Varying light breezes between SW & NW; weather very changeable, rain at times
30 -
31 North-Westerly to South-Westerly winds, temperatures finer, not settled
November 1899
Date Observations
1 Westerly & South-Westerly winds, moderate, fair, cool
2 Southerly & South-Westerly winds, freshening, fine at first, cloudy later, probably some rain
3 Southerly winds, strong in places, mild, changeable, some showers, with bright intervals
4 South-Westerly winds, strong to a gale, fine at first, some rain later
5 South-Westerly to Southerly winds, increasing to a gale, fair at first, some rain later
6 -
7 Light variable breezes, dull & misty at first; with rain in places, improving temperatures later

241
February 1900
Date Observations
7 Northerly to North-Easterly winds; moderate, fine at first, snow showers later
8 Northerly to North-Easterly winds, fine at first, fog in places, cloudy later, probably some snow
9 North-Easterly winds, light, fair generally, foggy or misty in places
10 Easterly & South-Easterly winds, light, fine at first, cloudy later, possibly snow becoming milder
11 Southerly winds increasing in force, gale in places, squally, some snow
12 -
13 Easterly winds increasing in force, cloudy, squally, some snow
14 Calms & South-Easterly winds, freshening, milder
15 Northerly winds light, finer, very cold tonight, South-Westerly light, mild after fog
16 South-Easterly to North-Easterly gales, rain and snow. Colder again
17 Westerly winds, strong to moderate, fair to showery
18 Southerly to Easterly strong winds & gales, rain perhaps snow, colder
19 -
20 South-Westerly & Westerly winds, strong to a gale at times, rainy to fair & colder
21 South-Westerly to North-Westerly winds, moderate to fresh, changeable, some showers
22 North-Westerly to South-Westerly winds freshening, fine at first, cloudy later with some rain or sleet
23 South-Westerly to Westerly winds, strong, squally, showery
24 South-Westerly winds, strong in places, mild, changeable, some rain
25 Southerly winds moderate, mild, changeable, showery
26 -
27 Easterly to South-Easterly winds moderate, rainy at first, improving temperatures later
28 Wind becoming Northerly generally and weather improving slowly

242
March 1900
Date Observations
1 Easterly to North-Easterly winds, moderate to fresh, colder, rainy, dull
2 North-Easterly winds moderate, fair, dry, cold
3 North-Westerly to Westerly winds moderate to fresh. Fair & milder then cold showers
4 Varying Westerly to Northerly winds, some rain in most places, unsettled
5 -
6 North-Easterly & Northerly winds. Light to moderate. Cold, fair generally
7 Northerly to North-Westerly winds light dull misty or foggy in places
8 Northerly to North-Westerly winds light. Weather becoming brighter, but local showers probable
9 Variable or North-Easterly airs. Cloudy. Some mist or fog
10 Easterly winds moderate. Cloudy misty, slight rain locally
11 Easterly & South-Easterly winds, light, fair generally, warmer
12 -
13 Light Northerly breezes fine generally frosty at night. Local fogs
14 North-Westerly & Northerly winds. Fresh to moderate. Very slight showers. Colder
15 North-Westerly winds. Moderate. Fine at first. Some showers later
16 Westerly & North-Westerly winds. Fresh. Squally & showery then colder
17 Westerly & Northerly winds. Moderate. Few cold showers then finer. Frost at night
18 Northerly & North-Westerly winds light, cold shift to SW milder, rainy, unsettled
19 -
20 Southerly & South-Westerly winds, fresh to strong. Much rain at times. Milder
21 Southerly winds. Moderate or fresh. Changeable, some showers
22 Easterly winds. Moderate to fresh. Fair cold
23 Easterly & North-Easterly winds strong in places, changeable, some rain
24 North-Easterly winds strong, cloudy, slight rain locally
25 Northerly & North-Easterly winds moderate or fresh. Fair generally but rain or sleet locally

243
Date Observations
26 -
27 North-Westerly winds freshening, changeable, some snow showers
28 Northerly winds backing W. Light fine, milder, not settled
29 South-Westerly to North-Westerly & Northerly winds colder some slight cold showers
30 Northerly airs & calms then South-Westerly & Southerly & milder weather
31 Calm, fine, foggy in places, very cold tonight
April 1900
Date Observations
1 Variable & Southerly airs, fine, hazy at times, very little milder
2 -
3 Varying & North-Easterly airs, hazy, cloudy
4 South-Westerly winds, moderate or fresh, cloudy, some rain
5 South-Westerly & Southerly winds freshening. Rain at times. Milder
6 North-Westerly winds. Light or moderate fair generally but perhaps local showers
7 Southerly & South-Westerly winds becoming strong & squally, showery, milder, unsettled

244
Today’s 2pm reports
Location: Westminster, London
September 1899
Date Barometer Dry bulb T Wet bulb T Wind dir Wind F Observations
15 29.96 67 59 WSW 3 c
16 29.60 63 57 NNW 3 bc
17 - - - - - -
18 29.71 63 55 NW 4 cf
19 29.71 63 57 WNW 3 c
20 29.67 60 52 NW 5 cf
21 29.89 63 54 WNW 3 bc
22 29.82 60 49 WNW 4 c
23 29.95 61 53 W 3 o
24 - - - - - -
25 29.75 67 58 WSW 3 o
26 29.52 63 55 W 3 bc
27 29.45 60 56 W 4 c
28 29.72 58 51 W 2 bc
29 29.67 54 51 SSW 2 od
30 29.32 56 50 SW 3 o

245
October 1899
Date Barometer Dry bulb T Wet bulb T Wind dir Wind F Observations
1 - - - - - -
2 29.70 54 50 NW 5 o
3 29.96 62 53 WSW 4 o
4 29.88 54 52 SE 2 omg
5 30.11 54 50 NE 2 og
6 30.17 53 50 E 1 om
7 30.23 57 50 NW 2 bc
8 - - - - - -
9 30.29 59 50 S 1 bm
10 30.24 61 53 SSW 1 bm
11 29.89 64 58 SSW 2 bm
12 29.52 62 58 WSW 2 c
13 29.92 55 47 NW 5 bcq
14 30.16 52 46 Z 0 c
15 - - - - - -
16 29.91 56 51 E 3 b
17 30.10 60 53 E 1 bm
18 30.34 63 55 ENE 1 bm
19 30.39 59 51 ESE 2 b
20 30.34 60 51 E 2 bm
21 30.40 47 45 Z 0 f
22 - - - - - -
23 30.22 55 52 NW 1 bf
24 30.33 59 53 WSW 2 o
25 30.28 61 54 S 2 o

246
Date Barometer Dry bulb T Wet bulb T Wind dir Wind F Observations
26 29.92 58 55 SW 3 or
27 29.76 61 59 SSW 3 or
28 29.83 62 58 WSW 2 o
29 - - - - - -
30 29.80 57 47 NW 3 bc
31 30.10 57 50 WSW 3 c
November 1899
Date Barometer Dry bulb T Wet bulb T Wind dir Wind F Observations
1 29.89 56 49 S 4 bc
2 29.56 61 59 SW 3 ogd
3 29.48 60 53 SW 6 o
4 29.64 62 60 SW 4 o
5 - - - - - -
6 29.91 53 50 NNW 2 om
7 29.98 54 49 S 4 o

247
February 1900
Date Barometer Dry bulb T Wet bulb T Wind dir Wind F Observations
7 29.86 36 32 NW 3 bm
8 29.99 36 32 NE 2 bm
9 29.98 37 32 ESE 2 f
10 29.64 38 34 SSE 4 o
11 - - - - - -
12 29.38 40 36 ESE 2 o
13 29.46 38 35 ESE 2 m
14 29.90 38 35 N 5 c
15 29.62 39 37 SSE 7 or
16 29.35 48 43 WNW 5 bc
17 29.11 47 46 SSW 1 ogm
18 - - - - - -
19 28.62 53 51 SW 6 cr
20 28.75 48 44 WSW 6 cp
21 29.60 46 40 WNW 3 bc
22 29.41 54 50 SW 2 o
23 29.62 56 52 WSW 3 c
24 29.73 57 53 S 3 c
25 - - - - - -
26 29.56 55 51 SSE 3 c
27 29.51 50 50 WNW 1 ogd
28 29.95 43 42 ENE 3 og

248
January 1901
Date Barometer Dry bulb T Wet bulb T Wind dir Wind F Observations
25 30.07 49 43 WSW 4 c
26 29.91 46 41 WNW 4 c
27 - - - - - -
28 29.44 41 38 W 2 c
29 29.48 40 36 NW 3 c
30 29.37 41 38 NW 3 c
31 29.48 39 36 WNW 1 ogm
February 1901
Date Barometer Dry bulb T Wet bulb T Wind dir Wind F Observations
1 29.75 40 37 NW 2 bcm
2 29.52 42 39 S 3 og
3 - - - - - -
4 29.43 38 35 WSW 2 cm
5 29.42 36 34 N 3 om
6 30.01 39 36 NNE 3 og
7 30.25 40 36 NW 3 bcm
8 30.33 41 39 W 1 om
9 30.36 43 41 NW 1 ogm
10 - - - - - -
11 30.33 38 34 N 2 cm
12 30.22 38 33 NNW 3 bc

249
Date Barometer Dry bulb T Wet bulb T Wind dir Wind F Observations
13 30.33 36 33 E 3 os
14 30.49 33 32 NNW 2 c
15 30.57 35 33 NE 2 om
16 30.37 42 39 NNW 3 od
17 - - - - - -
18 30.40 37 33 NNE 1 og
19 30.23 37 36 Z 0 fg
20 30.29 35 32 E 3 o
21 30.29 37 33 W 1 o
22 30.24 44 41 NNE 1 c
23 30.12 47 43 NNW 1 o
24 - - - - - -
25 29.68 50 45 SW 2 o
26 29.50 45 40 SSW 3 o
27 29.35 48 44 W 2 o
28 29.50 52 46 WNW 2 br
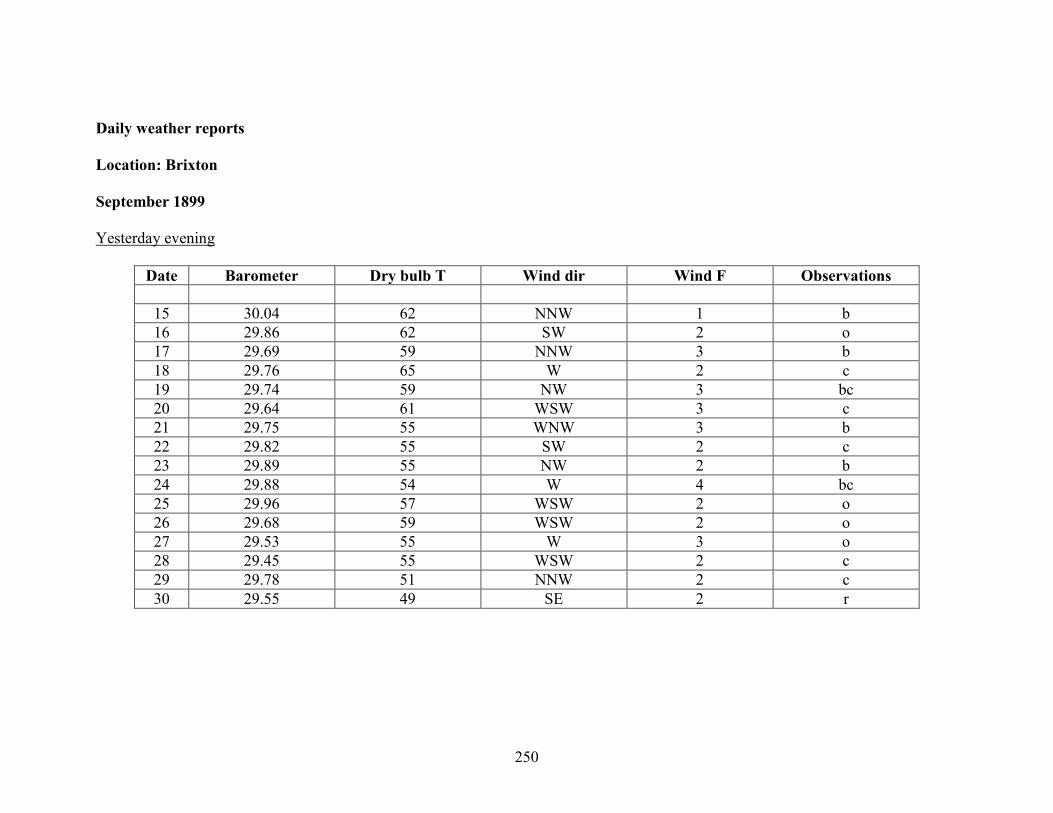
250
Daily weather reports
Location: Brixton
September 1899
Yesterday evening
Date Barometer Dry bulb T Wind dir Wind F Observations
15 30.04 62 NNW 1 b
16 29.86 62 SW 2 o
17 29.69 59 NNW 3 b
18 29.76 65 W 2 c
19 29.74 59 NW 3 bc
20 29.64 61 WSW 3 c
21 29.75 55 WNW 3 b
22 29.82 55 SW 2 c
23 29.89 55 NW 2 b
24 29.88 54 W 4 bc
25 29.96 57 WSW 2 o
26 29.68 59 WSW 2 o
27 29.53 55 W 3 o
28 29.45 55 WSW 2 c
29 29.78 51 NNW 2 c
30 29.55 49 SE 2 r

251
This morning
Date Barometer ∆ yesterday Dry bulb T Wet bulb T ∆ yesterday Wind dir Wind F Observations Sea
15 30.11 +0.05 54 51 -5 NW 1 b *
16 28.57 -0.54 59 54 +5 NW 4 cq *
17 29.83 +0.26 56 52 -3 WSW 2 o *
18 29.71 -0.12 56 57 0 NW 4 c *
19 29.78 +0.07 54 49 -2 WSW 4 o *
20 29.66 -0.12 53 48 -1 WNW 5 bc *
21 29.95 +0.29 49 45 -4 NW 3 bc *
22 29.72 -0.23 53 47 +4 WNW 5 bc *
23 30.05 +0.33 49 45 -4 WSW 2 bc *
24 29.94 -0.11 51 45 +2 WNW 5 bq *
25 29.83 -0.11 55 51 +4 WNW 2 c *
26 29.63 -0.20 54 50 -1 W 3 b *
27 29.58 -0.05 54 50 0 SW 2 o *
28 29.68 +0.10 45 43 -9 NW 2 bw *
29 29.78 +0.10 45 44 0 SW 1 om *
30 29.29 -0.49 47 46 +2 S 1 o *
Past 24 hours
Date Weather Hours of bright sunshine T(max) T(min) Rainfall (inches)
15 b.bm 4.0 69 46 -
16 bc.oqp 6.1 70 53 0.20
17 cpt.b 4.1 65 50 0.07
18 c.b 2.8 69 51 -

252
Date Weather Hours of bright sunshine T(max) T(min) Rainfall (inches)
19 q p bc o 5.2 64 53 0.12
20 c.op.b 0.3 63 49 0.10
21 bc.b 9.0 61 40 -
22 bc.oqr 7.2 65 48 0.18
23 bc.b 8.8 61 41 -
24 bc.op 2.8 61 45 0.03
25 b.c.od 8.8 62 51 0.02
26 bc.or 4.6 68 48 0.01
27 c.ol.b 5.2 63 47 -
28 o.tlp.b 2.1 63 39 0.44
29 cph.blw 6.0 61 37 0.01
30 o.r 0.5 57 45 0.99
October 1899
Yesterday evening
Date Barometer Dry bulb T Wind dir Wind F Observations
1 29.40 51 S 3 b
2 29.17 58 SSW 3 c
3 29.90 52 NNW 2 om
4 29.92 57 WSW 3 c
5 29.92 51 ESE 1 ogm
6 30.15 52 E 3 o
7 30.16 51 E 3 o

253
Date Barometer Dry bulb T Wind dir Wind F Observations
8 30.28 46 Z 0 m
9 30.38 52 NE 1 bcm
10 30.29 49 SW 1 bcm
11 30.22 50 Z 0 m
12 29.84 55 S 1 bm
13 29.48 58 W 3 op
14 30.02 48 WNW 2 cm
15 30.18 46 NE 1 o
16 30.06 45 E 5 bq
17 29.92 51 ESE 1 om
18 30.16 53 E 1 b
19 30.40 53 SE 1 b
20 30.37 50 SE 1 b
21 30.35 49 SE 1 bm
22 30.42 42 Z 0 f
23 30.33 44 Z 0 f
24 30.23 51 NW 1 cm
25 30.36 50 NW 1 om
26 30.24 55 SSW 1 o
27 29.88 55 SW 2 or
28 29.77 60 SW 2 od
29 29.92 55 W 2 bc
30 29.84 55 SW 4 o
31 29.89 46 NW 2 b

254
This morning
Date Barometer ∆ yesterday Dry bulb T Wet bulb T ∆ yesterday Wind dir Wind F Observations Sea
1 29.42 +0.13 51 50 +4 SE 3 ogq *
2 29.38 -0.04 52 51 +1 W 3 og *
3 30.07 +0.69 51 48 -1 SW 2 b *
4 29.82 -0.25 58 56 +7 SW 2 o *
5 30.07 +0.25 49 47 -9 E 2 og *
6 30.21 +0.14 47 45 -2 E 1 bw *
7 30.22 +0.01 37 37 -10 Z 0 f *
8 30.38 +0.16 39 39 +2 Z 0 fw *
9 30.36 -0.02 42 41 +3 NE 1 bfw *
10 30.28 -0.08 35 35 -7 Z 0 f *
11 30.02 -0.26 41 41 +6 Z 0 f *
12 29.61 -0.41 51 50 +10 Z 0 c *
13 29.80 +0.19 43 41 -8 WNW 3 bc *
14 30.16 +0.36 38 37 -5 W 1 c *
15 30.20 +0.04 45 42 +7 E 4 b *
16 29.96 -0.24 43 42 -2 E 3 b *
17 30.04 +0.08 46 45 +3 E 1 bm *
18 30.33 +0.29 41 41 -5 E 1 f *
19 30.42 +0.09 41 41 0 Z 0 f *
20 30.39 -0.03 41 40 0 Z 0 f *
21 30.35 -0.04 41 41 0 Z 0 f *
22 30.43 +0.08 44 44 +3 Z 0 f *
23 30.28 -0.15 41 41 -3 W 1 of *
24 30.33 +0.05 47 47 +6 W 1 cf *
25 30.37 +0.04 48 47 +1 ENE 1 cm *

255
Date Barometer ∆ yesterday Dry bulb T Wet bulb T ∆ yesterday Wind dir Wind F Observations Sea
26 30.01 -0.36 53 522 +5 S 2 o *
27 29.83 -0.18 57 56 +4 SW 1 od *
28 29.81 -0.02 58 57 +1 WSW 1 c *
29 30.00 -0.19 56 54 -2 SW 2 oc *
30 29.63 -0.37 51 40 -5 NNW 3 o *
31 30.06 +0.43 45 43 -6 WSW 3 b *
Past 24 hours
Date Weather Hours of bright sunshine T(max) T(min) Rainfall (inches)
1 cp.o.bl 1.5 57 45 0.01
2 orq.c.or 0.2 63 50 0.17
3 od.om.b 0.0 52 40 -
4 bc.oq.p 5.0 64 51 0.01
5 opdm 0.0 59 47 0.23
6 od.mw 0.0 53 42 0.02
7 op.o.bw 0.3 55 35 -
8 bc.fw 3.4 55 35 -
9 bf.c.bw 2.5 62 35 -
10 b.bfw 6.5 62 33 -
11 b.bm.bw 3.5 62 35 -
12 b.m.bw 4.8 65 40 -
13 c.op.b 1.2 64 40 0.07
14 b.bmw 7.3 55 33 -
15 c.b 0.5 51 37 -
16 bq 8.1 56 40 -
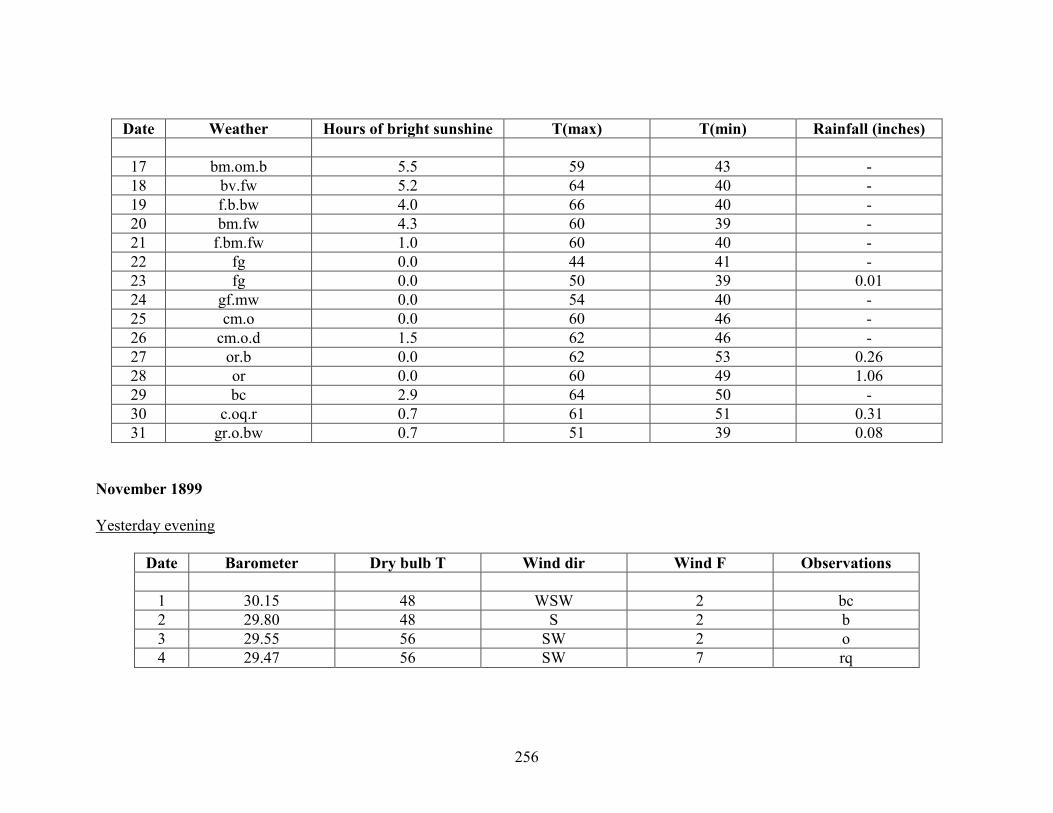
256
Date Weather Hours of bright sunshine T(max) T(min) Rainfall (inches)
17 bm.om.b 5.5 59 43 -
18 bv.fw 5.2 64 40 -
19 f.b.bw 4.0 66 40 -
20 bm.fw 4.3 60 39 -
21 f.bm.fw 1.0 60 40 -
22 fg 0.0 44 41 -
23 fg 0.0 50 39 0.01
24 gf.mw 0.0 54 40 -
25 cm.o 0.0 60 46 -
26 cm.o.d 1.5 62 46 -
27 or.b 0.0 62 53 0.26
28 or 0.0 60 49 1.06
29 bc 2.9 64 50 -
30 c.oq.r 0.7 61 51 0.31
31 gr.o.bw 0.7 51 39 0.08
November 1899
Yesterday evening
Date Barometer Dry bulb T Wind dir Wind F Observations
1 30.15 48 WSW 2 bc
2 29.80 48 S 2 b
3 29.55 56 SW 2 o
4 29.47 56 SW 7 rq

257
Date Barometer Dry bulb T Wind dir Wind F Observations
5 29.68 61 SSW 5 odr
6 29.86 53 S 1 o
7 30.00 48 Z 0 bm
This morning
Date Barometer ∆ yesterday Dry bulb T Wet bulb T ∆ yesterday Wind dir Wind F Observations Sea
1 30.08 +0.02 49 47 +4 S 2 b *
2 29.62 -0.46 59 58 +10 S 4 or *
3 29.63 +0.01 54 51 -5 SSW 4 b *
4 29.64 +0.01 58 58 +4 SSW 4 c *
5 29.74 +0.10 54 53 -4 S 3 or *
6 29.86 +0.11 49 49 -5 SE 1 ogr *
7 30.09 +0.24 47 45 -2 S 3 bc *
Past 24 hours
Date Weather Hours of bright
sunshine
T(max) T(min) Rainfall (inches)
1 c.o.bw 7.0 56 43 -
2 bc.b.od 7.1 59 47 0.01
3 or.cqp.b 0.0 62 52 0.56
4 cp.orq 3.4 60 49 1.14
5 od.oqr 0.0 62 54 0.20
6 ogr 0.0 55 48 1.44
7 or.c.bm 0.0 51 42 0.06
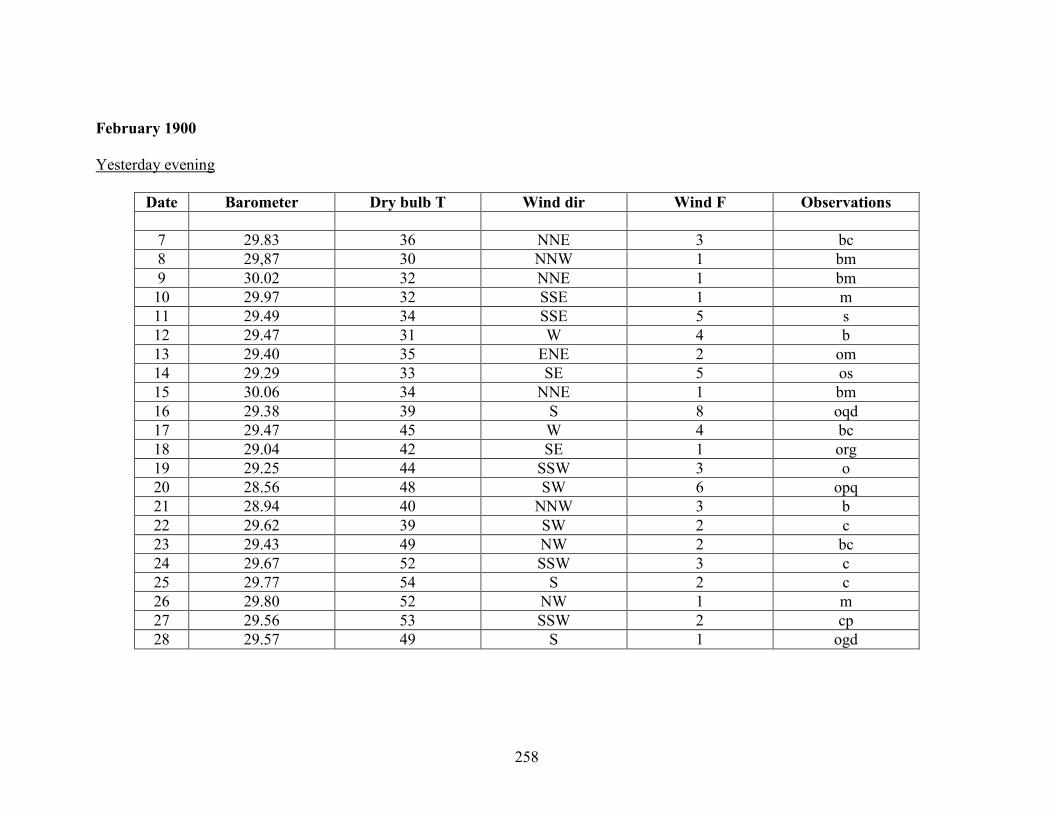
258
February 1900
Yesterday evening
Date Barometer Dry bulb T Wind dir Wind F Observations
7 29.83 36 NNE 3 bc
8 29,87 30 NNW 1 bm
9 30.02 32 NNE 1 bm
10 29.97 32 SSE 1 m
11 29.49 34 SSE 5 s
12 29.47 31 W 4 b
13 29.40 35 ENE 2 om
14 29.29 33 SE 5 os
15 30.06 34 NNE 1 bm
16 29.38 39 S 8 oqd
17 29.47 45 W 4 bc
18 29.04 42 SE 1 org
19 29.25 44 SSW 3 o
20 28.56 48 SW 6 opq
21 28.94 40 NNW 3 b
22 29.62 39 SW 2 c
23 29.43 49 NW 2 bc
24 29.67 52 SSW 3 c
25 29.77 54 S 2 c
26 29.80 52 NW 1 m
27 29.56 53 SSW 2 cp
28 29.57 49 S 1 ogd
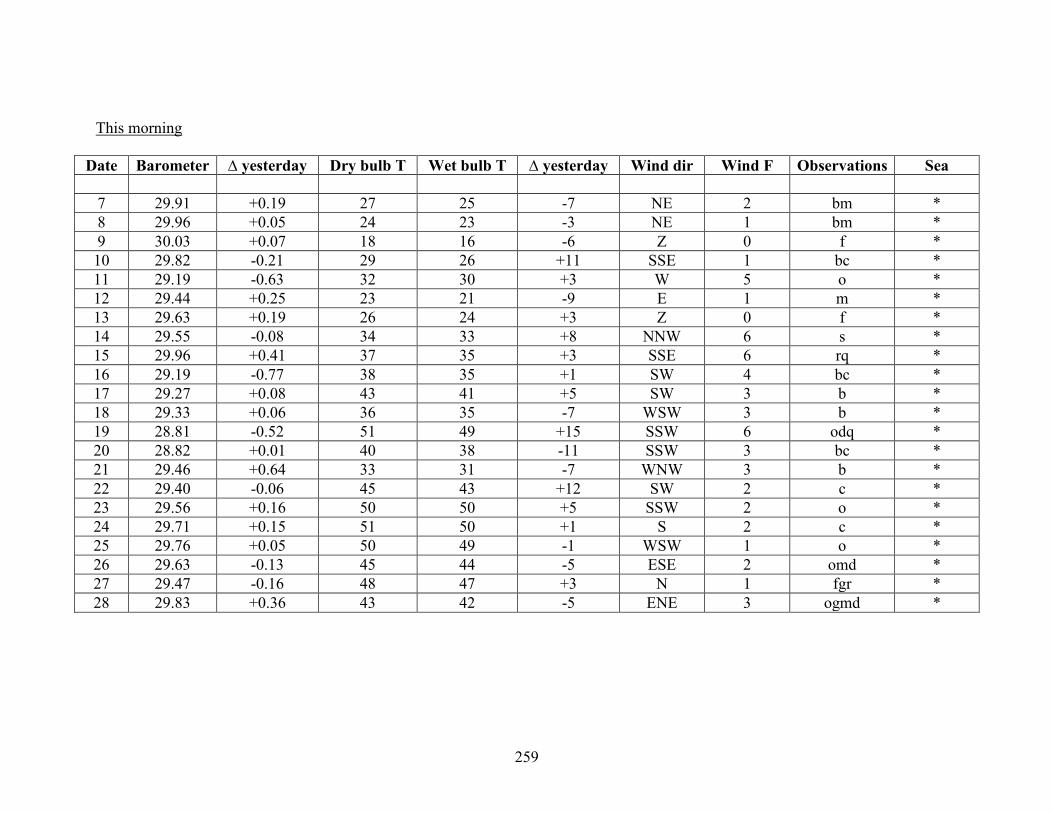
259
This morning
Date Barometer ∆ yesterday Dry bulb T Wet bulb T ∆ yesterday Wind dir Wind F Observations Sea
7 29.91 +0.19 27 25 -7 NE 2 bm *
8 29.96 +0.05 24 23 -3 NE 1 bm *
9 30.03 +0.07 18 16 -6 Z 0 f *
10 29.82 -0.21 29 26 +11 SSE 1 bc *
11 29.19 -0.63 32 30 +3 W 5 o *
12 29.44 +0.25 23 21 -9 E 1 m *
13 29.63 +0.19 26 24 +3 Z 0 f *
14 29.55 -0.08 34 33 +8 NNW 6 s *
15 29.96 +0.41 37 35 +3 SSE 6 rq *
16 29.19 -0.77 38 35 +1 SW 4 bc *
17 29.27 +0.08 43 41 +5 SW 3 b *
18 29.33 +0.06 36 35 -7 WSW 3 b *
19 28.81 -0.52 51 49 +15 SSW 6 odq *
20 28.82 +0.01 40 38 -11 SSW 3 bc *
21 29.46 +0.64 33 31 -7 WNW 3 b *
22 29.40 -0.06 45 43 +12 SW 2 c *
23 29.56 +0.16 50 50 +5 SSW 2 o *
24 29.71 +0.15 51 50 +1 S 2 c *
25 29.76 +0.05 50 49 -1 WSW 1 o *
26 29.63 -0.13 45 44 -5 ESE 2 omd *
27 29.47 -0.16 48 47 +3 N 1 fgr *
28 29.83 +0.36 43 42 -5 ENE 3 ogmd *
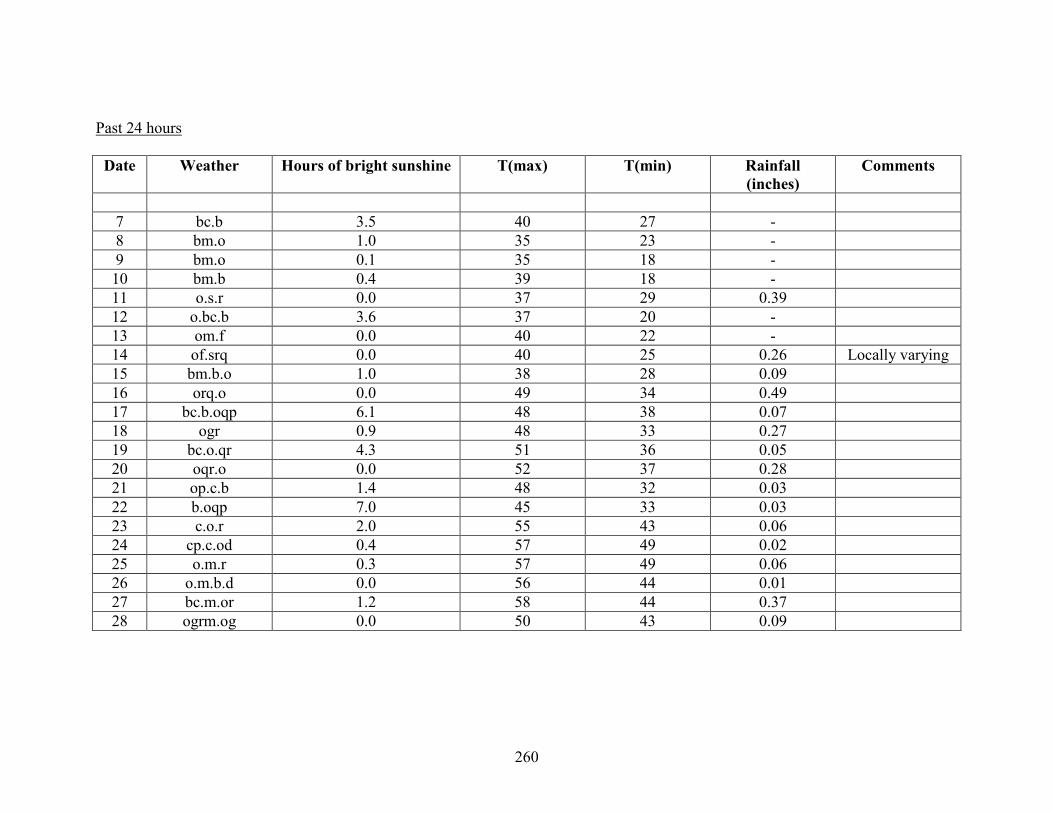
260
Past 24 hours
Date Weather Hours of bright sunshine T(max) T(min) Rainfall
(inches)
Comments
7 bc.b 3.5 40 27 -
8 bm.o 1.0 35 23 -
9 bm.o 0.1 35 18 -
10 bm.b 0.4 39 18 -
11 o.s.r 0.0 37 29 0.39
12 o.bc.b 3.6 37 20 -
13 om.f 0.0 40 22 -
14 of.srq 0.0 40 25 0.26 Locally varying
15 bm.b.o 1.0 38 28 0.09
16 orq.o 0.0 49 34 0.49
17 bc.b.oqp 6.1 48 38 0.07
18 ogr 0.9 48 33 0.27
19 bc.o.qr 4.3 51 36 0.05
20 oqr.o 0.0 52 37 0.28
21 op.c.b 1.4 48 32 0.03
22 b.oqp 7.0 45 33 0.03
23 c.o.r 2.0 55 43 0.06
24 cp.c.od 0.4 57 49 0.02
25 o.m.r 0.3 57 49 0.06
26 o.m.b.d 0.0 56 44 0.01
27 bc.m.or 1.2 58 44 0.37
28 ogrm.og 0.0 50 43 0.09

261
March 1900
Yesterday evening
Date Barometer Dry bulb T Wind dir Wind F Observations
1 30.02 41 NE 4 o
2 30.30 37 NE 2 b
3 30.25 40 NNW 3 bmd
4 30.18 42 NNW 1 og
5 30.15 38 NNE 2 o
6 30.27 40 N 2 o
7 30.30 37 NE 3 o
8 30.28 41 NNW 1 og
9 30.23 40 E 2 o
10 30.23 41 ESE 3 bc
11 30.27 48 E 2 b
12 30.26 49 NE 2 c
13 30.45 53 NW 3 b
14 30.57 42 N 5 bc
15 30.51 49 NNW 3 o
16 29.91 45 W 3 og
17 29.54 38 NW 3 b
18 29.51 34 Z 0 m
19 29.39 37 SSE 5 ors
20 29.36 42 SE 2 bc
21 29.76 46 SE 2 b
22 29.69 43 NE 4 b
23 29.53 46 E 3 o
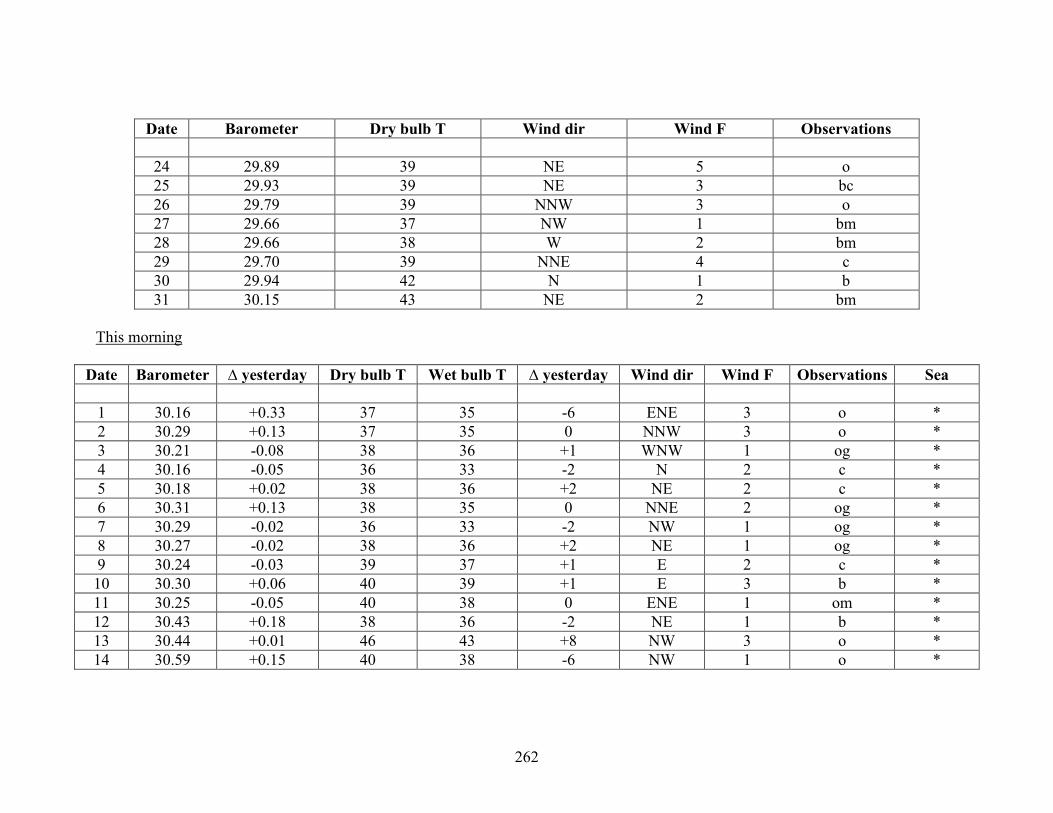
262
Date Barometer Dry bulb T Wind dir Wind F Observations
24 29.89 39 NE 5 o
25 29.93 39 NE 3 bc
26 29.79 39 NNW 3 o
27 29.66 37 NW 1 bm
28 29.66 38 W 2 bm
29 29.70 39 NNE 4 c
30 29.94 42 N 1 b
31 30.15 43 NE 2 bm
This morning
Date Barometer ∆ yesterday Dry bulb T Wet bulb T ∆ yesterday Wind dir Wind F Observations Sea
1 30.16 +0.33 37 35 -6 ENE 3 o *
2 30.29 +0.13 37 35 0 NNW 3 o *
3 30.21 -0.08 38 36 +1 WNW 1 og *
4 30.16 -0.05 36 33 -2 N 2 c *
5 30.18 +0.02 38 36 +2 NE 2 c *
6 30.31 +0.13 38 35 0 NNE 2 og *
7 30.29 -0.02 36 33 -2 NW 1 og *
8 30.27 -0.02 38 36 +2 NE 1 og *
9 30.24 -0.03 39 37 +1 E 2 c *
10 30.30 +0.06 40 39 +1 E 3 b *
11 30.25 -0.05 40 38 0 ENE 1 om *
12 30.43 +0.18 38 36 -2 NE 1 b *
13 30.44 +0.01 46 43 +8 NW 3 o *
14 30.59 +0.15 40 38 -6 NW 1 o *
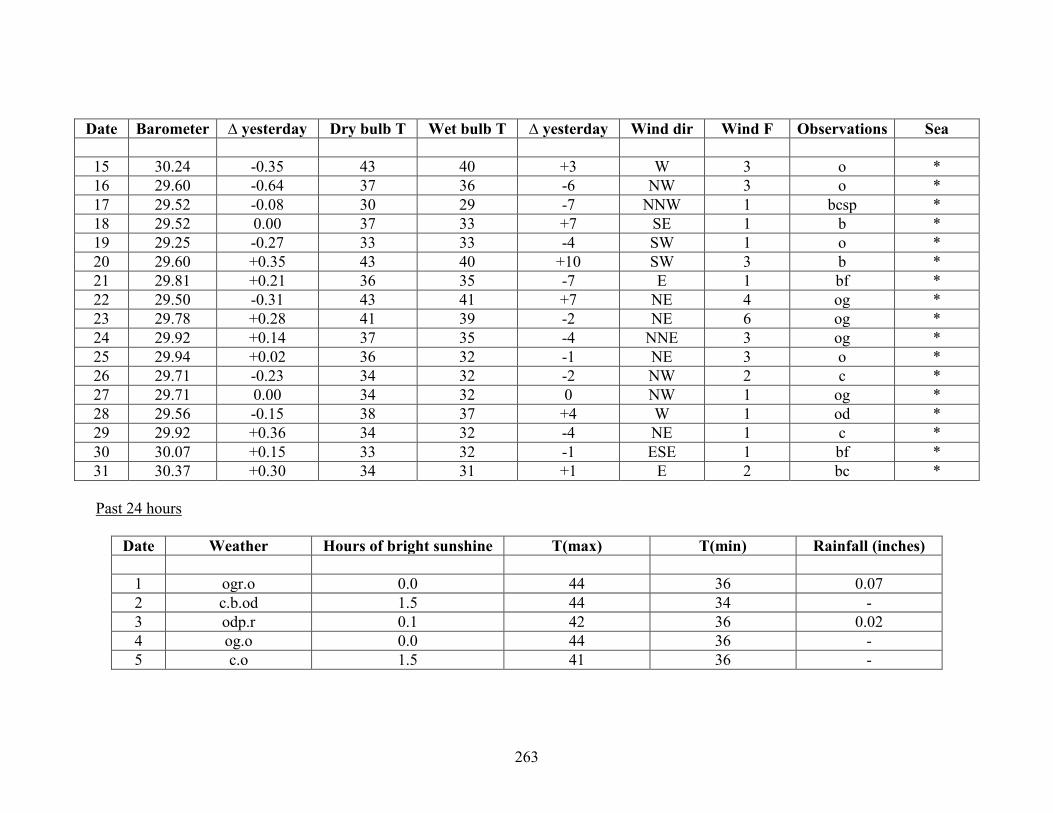
263
Date Barometer ∆ yesterday Dry bulb T Wet bulb T ∆ yesterday Wind dir Wind F Observations Sea
15 30.24 -0.35 43 40 +3 W 3 o *
16 29.60 -0.64 37 36 -6 NW 3 o *
17 29.52 -0.08 30 29 -7 NNW 1 bcsp *
18 29.52 0.00 37 33 +7 SE 1 b *
19 29.25 -0.27 33 33 -4 SW 1 o *
20 29.60 +0.35 43 40 +10 SW 3 b *
21 29.81 +0.21 36 35 -7 E 1 bf *
22 29.50 -0.31 43 41 +7 NE 4 og *
23 29.78 +0.28 41 39 -2 NE 6 og *
24 29.92 +0.14 37 35 -4 NNE 3 og *
25 29.94 +0.02 36 32 -1 NE 3 o *
26 29.71 -0.23 34 32 -2 NW 2 c *
27 29.71 0.00 34 32 0 NW 1 og *
28 29.56 -0.15 38 37 +4 W 1 od *
29 29.92 +0.36 34 32 -4 NE 1 c *
30 30.07 +0.15 33 32 -1 ESE 1 bf *
31 30.37 +0.30 34 31 +1 E 2 bc *
Past 24 hours
Date Weather Hours of bright sunshine T(max) T(min) Rainfall (inches)
1 ogr.o 0.0 44 36 0.07
2 c.b.od 1.5 44 34 -
3 odp.r 0.1 42 36 0.02
4 og.o 0.0 44 36 -
5 c.o 1.5 41 36 -

264
Date Weather Hours of bright sunshine T(max) T(min) Rainfall (inches)
6 og 0.3 40 37 -
7 og 0.0 40 35 -
8 og 0.0 42 35 -
9 o.op 0.0 45 37 -
10 bc.c.bw.g 0.0 48 37 -
11 bm.o 4.0 56 38 -
12 om.bc.cm 0.0 51 34 -
13 bm.b 1.3 56 37 -
14 ogq.b 0.0 46 34 -
15 c.o 0.5 52 40 -
16 og.rq 0.1 50 37 0.06
17 c.b 0.7 44 27 -
18 cm - 40 23 -
19 b.or.rs 2.5 42 33 0.50
20 cp.bc.b 2.6 45 33 0.01
21 bc.b 6.1 52 32 -
22 bcm.orq 0.2 48 35 0.11
23 og.ogq 0.0 46 40 -
24 og 0.0 42 36 -
25 og.bc.o 0.0 42 35 -
26 bc.ps.og 1.2 41 32 -
27 o.phs.bm 0.4 42 32 -
28 o.bm 0.0 42 33 0.12
29 o.b.bc 0.0 43 30 -
30 c.b.f 2.6 44 28 -
31 bc.b 2.0 48 29 -

265
April 1900
Yesterday evening
Date Barometer Dry bulb T Wind dir Wind F Observations
1 30.36 46 SE 2 bm
2 30.18 42 SE 1 b
3 29.99 46 NW 1 bcm
4 29.55 43 S 3 or
5 29.41 50 W 1 b
6 29.71 44 W 2 c
7 29.80 45 SW 2 c
This morning
Date Barometer ∆ yesterday Dry bulb T Wet bulb T ∆ yesterday Wind dir Wind F Observations Sea
1 30.33 -0.04 37 34 +3 E 2 b *
2 30.13 -0.20 34 31 -3 WSW 1 c *
3 29.83 -0.30 38 37 +4 SW 1 o *
4 29.31 -0.52 47 45 +9 W 4 bc *
5 29.55 +0.24 44 42 -3 NNW 1 og *
6 29.92 +0.37 40 38 -4 W 2 b *
7 29.71 -0.21 44 41 +4 E 1 od *

266
Past 24 hours
Date Weather Hours of bright sunshine T(max) T(min) Rainfall (inches)
1 b 0.1 49 31 -
2 o.b.m 0.8 45 27 -
3 c.bv.od 0.0 49 31 -
4 cpd.or 0.3 52 37 0.25
5 cp.bv.op 5.8 56 40 0.05
6 cp.or.bc 0.0 49 34 0.04
7 c.b.o 8.0 54 40 0.01
Brixton Weather Station Data
September 1899
Time = 8am
Date Dry bulb T Wet bulb T Max T Min T Wind dir Weather
15 54 51 70 46 NW b
16 59 54 65 53 NW cq
17 56 52 69 50 WSW o
18 56 51 64 51 NW c
19 54 49 63 53 WSW o
20 53 48 61 49 WNW bc
21 49 45 65 40 NW b
22 53 47 61 48 WNW b
23 49 45 61 41 WSW bc
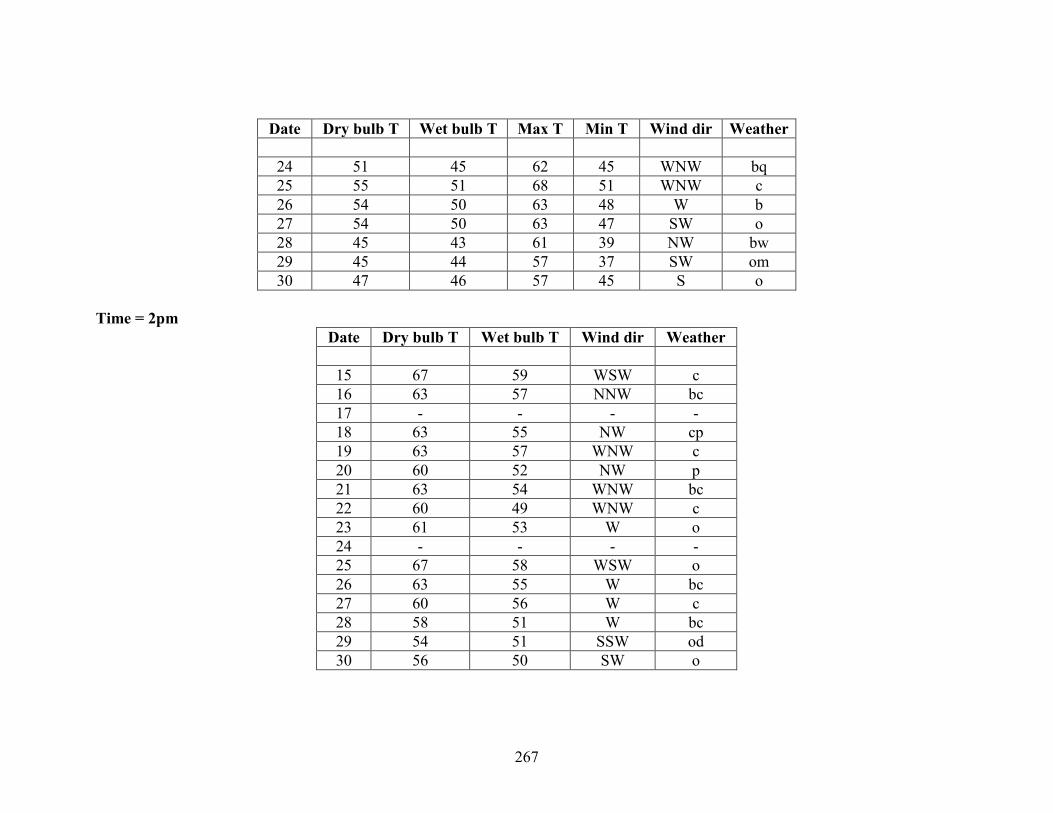
267
Date Dry bulb T Wet bulb T Max T Min T Wind dir Weather
24 51 45 62 45 WNW bq
25 55 51 68 51 WNW c
26 54 50 63 48 W b
27 54 50 63 47 SW o
28 45 43 61 39 NW bw
29 45 44 57 37 SW om
30 47 46 57 45 S o
Time = 2pm
Date Dry bulb T Wet bulb T Wind dir Weather
15 67 59 WSW c
16 63 57 NNW bc
17 - - - -
18 63 55 NW cp
19 63 57 WNW c
20 60 52 NW p
21 63 54 WNW bc
22 60 49 WNW c
23 61 53 W o
24 - - - -
25 67 58 WSW o
26 63 55 W bc
27 60 56 W c
28 58 51 W bc
29 54 51 SSW od
30 56 50 SW o

268
Time = 6pm
Date Dry bulb T Wet bulb T Wind dir Weather Remarks
15 62 - SW o
16 59 - N b Thunder in several parts
17 65 - W c
18 59 - NW bc
19 61 - WSW c
20 55 - WNW b
21 55 - SW c
22 55 - NW b
23 54 - W bc
24 57 - WSW o
25 59 - WSW o
26 55 - W o
27 55 - WSW c Thunderstorms 3pm and 5:45pm
28 51 - NNW c
29 49 - SE r
30 51 - S b
October 1899
Time = 8am
Date Dry bulb T Wet bulb T Max T Min T Wind dir Weather
1 51 50 63 45 SE ogq
2 52 51 52 50 W og
3 51 48 64 40 SW b

269
Date Dry bulb T Wet bulb T Max T Min T Wind dir Weather
4 58 56 59 51 SW o
5 49 47 53 47 E og
6 47 45 55 42 E bw
7 37 37 55 35 Z f
8 39 39 62 35 Z fw
9 42 41 62 35 NE bfw
10 35 35 62 33 Z f
11 41 41 65 35 Z f
12 51 50 64 40 Z c
13 43 41 55 40 WNW bc
14 38 37 51 33 W b
15 45 42 56 3? E b
16 43 42 59 40 E b
17 46 45 64 43 E bm
18 41 41 66 40 E f
19 41 41 60 40 Z f
20 41 40 60 39 Z f
21 41 41 44 40 Z f
22 44 44 50 41 Z f
23 41 41 54 39 W of
24 47 47 60 40 W cf
25 48 47 62 46 ENE cm
26 53 52 62 46 S o
27 57 56 60 53 SW od
28 58 57 64 49 WSW c
29 56 54 61 50 SW o
30 51 50 51 51 NNW o
31 45 43 56 39 WSW b
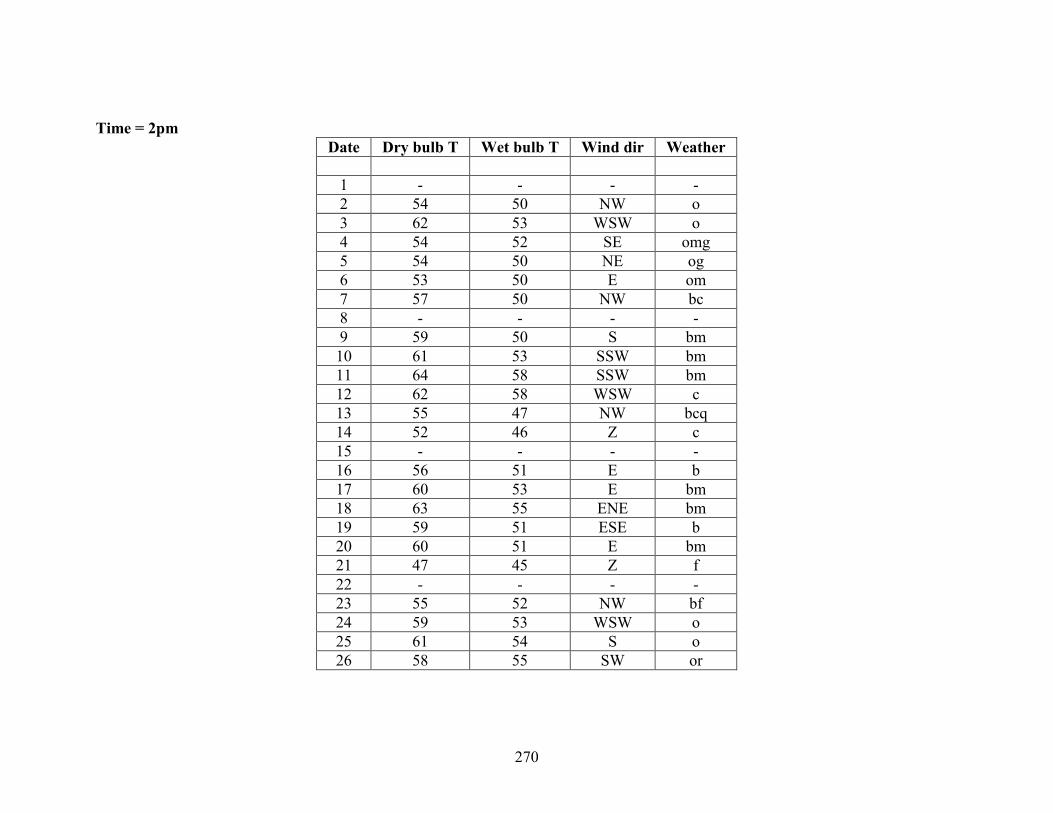
270
Time = 2pm
Date Dry bulb T Wet bulb T Wind dir Weather
1 - - - -
2 54 50 NW o
3 62 53 WSW o
4 54 52 SE omg
5 54 50 NE og
6 53 50 E om
7 57 50 NW bc
8 - - - -
9 59 50 S bm
10 61 53 SSW bm
11 64 58 SSW bm
12 62 58 WSW c
13 55 47 NW bcq
14 52 46 Z c
15 - - - -
16 56 51 E b
17 60 53 E bm
18 63 55 ENE bm
19 59 51 ESE b
20 60 51 E bm
21 47 45 Z f
22 - - - -
23 55 52 NW bf
24 59 53 WSW o
25 61 54 S o
26 58 55 SW or

271
Date Dry bulb T Wet bulb T Wind dir Weather
27 61 59 SSW or
28 62 58 WSW o
29 - - - -
30 51 47 NE bc
31 57 50 WSW c
Time = 6pm
Date Dry bulb T Wet bulb T Wind dir Weather
1 58 SSW c
2 52 NNW om
3 57 WSW c
4 51 ESE ogm
5 52 E b
6 51 E o
7 46 Z m
8 52 NE bcm
9 49 SW bcm
10 50 Z m
11 55 S bm
12 58 W op
13 48 WNW cm
14 46 NE o
15 45 E bq
16 51 ESE om
17 51 E b
18 53 SE b

272
Date Dry bulb T Wet bulb T Wind dir Weather
19 50 SE b
20 49 SE bm
21 42 Z f
22 44 Z f
23 51 NW cm
24 50 NW om
25 55 SSW o
26 55 SW or
27 60 SW od
28 55 W bc
29 55 SW o
30 46 NW b
31 48 WSW bc
November 1899
Time = 8am
Date Dry bulb T Wet bulb T Max T Min T Wind dir Weather
1 49 47 59 43 S b
2 59 58 62 47 S or
3 54 51 60 52 SSW b
4 58 58 62 49 SSW c
5 54 53 55 54 S or
6 49 48 51 48 SE ogr
7 47 45 57 42 S bc
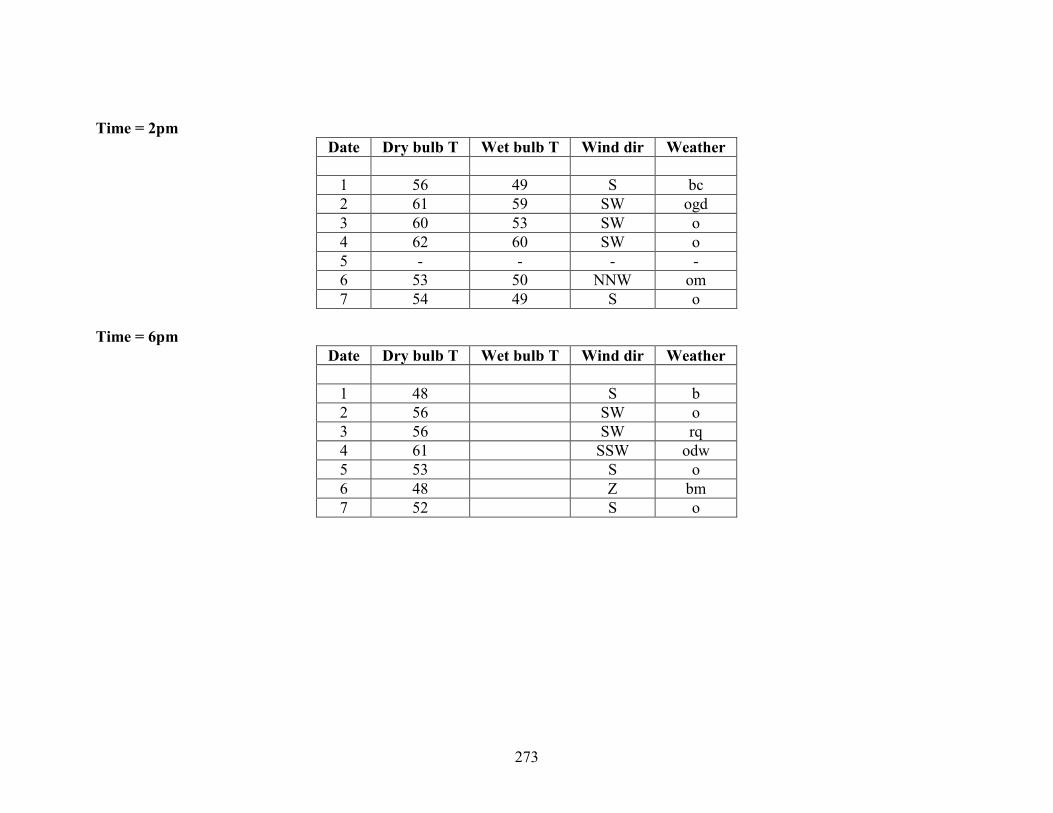
273
Time = 2pm
Date Dry bulb T Wet bulb T Wind dir Weather
1 56 49 S bc
2 61 59 SW ogd
3 60 53 SW o
4 62 60 SW o
5 - - - -
6 53 50 NNW om
7 54 49 S o
Time = 6pm
Date Dry bulb T Wet bulb T Wind dir Weather
1 48 S b
2 56 SW o
3 56 SW rq
4 61 SSW odw
5 53 S o
6 48 Z bm
7 52 S o

274
February 1900
Time = 8am
Date Dry bulb T Wet bulb T Max T Min T Wind dir Weather
7 27 25 35 27 NE bm
8 24 23 35 23 NE bm
9 18 16 39 18 Z f
10 29 26 37 18 SSE bc
11 32 30 37 29 W o
12 23 21 40 20 E m
13 26 24 40 22 Z f
14 34 33 38 25 NNW s
15 37 35 49 28 SSE rq
16 38 35 48 34 SW bc
17 43 41 48 38 SW b
18 36 35 51 33 WSW b
19 51 49 52 36 SSW odq
20 40 38 48 37 SSW bc
21 33 31 45 32 WNW b
22 45 43 55 33 SW c
23 50 50 57 43 SSW o
24 51 50 57 49 S c
25 50 49 56 49 WSW o
26 45 44 58 44 ESE omd
27 48 47 50 44 N fgr
28 43 42 44 43 ENE ogmd

275
Time = 2pm
Date Dry bulb T Wet bulb T Wind dir Weather
7 36 32 NW bm
8 36 32 NE bm
9 37 32 ESE f
10 38 34 SSE o
11 - - - -
12 40 36 ESE o
13 38 35 ESE m
14 38 35 N c
15 39 37 SSE or
16 48 43 WNW bc
17 47 46 SSW ogm
18 - - - -
19 53 51 SW cr
20 48 44 WSW cp
21 46 40 WNW bc
22 54 50 SW o
23 56 52 WSW c
24 57 53 S c
25 - - - -
26 55 51 SSE c
27 50 50 WNW ogd
28 43 42 ENE og
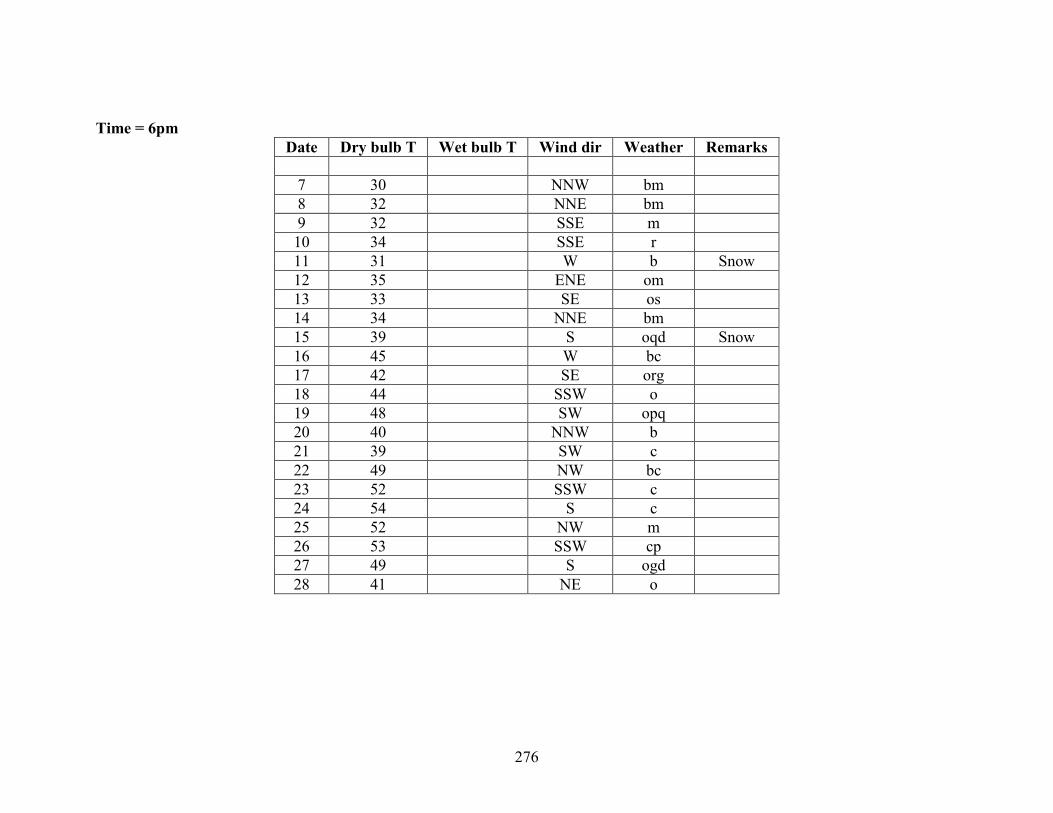
276
Time = 6pm
Date Dry bulb T Wet bulb T Wind dir Weather Remarks
7 30 NNW bm
8 32 NNE bm
9 32 SSE m
10 34 SSE r
11 31 W b Snow
12 35 ENE om
13 33 SE os
14 34 NNE bm
15 39 S oqd Snow
16 45 W bc
17 42 SE org
18 44 SSW o
19 48 SW opq
20 40 NNW b
21 39 SW c
22 49 NW bc
23 52 SSW c
24 54 S c
25 52 NW m
26 53 SSW cp
27 49 S ogd
28 41 NE o

277
January 1901
Time = 8am
Date Dry bulb T Wet bulb T Max T Min T Wind dir Weather
21 48 46 53 42 SW c
22 48 46 51 47 WSW og
23 36 35 46 36 E fg
24 42 41 47 36 SE ogm
25 38 36 48 37 WSW b
26 38 36 52 37 WNW b
27 52 49 55 38 W c
28 36 35 41 36 SW op
29 30 29 39 29 W b
30 33 32 40 29 WSW bc
31 31 30 37 29 W bc
Time = 2pm
Date Dry bulb T Wet bulb T Wind dir Weather
21 53 51 WSW om
22 51 47 SW og
23 47 41 ESE mg
24 46 45 SSW om
25 49 43 WSW c
26 46 41 WNW c
27 - - - -
28 41 38 W c
29 40 36 NW c
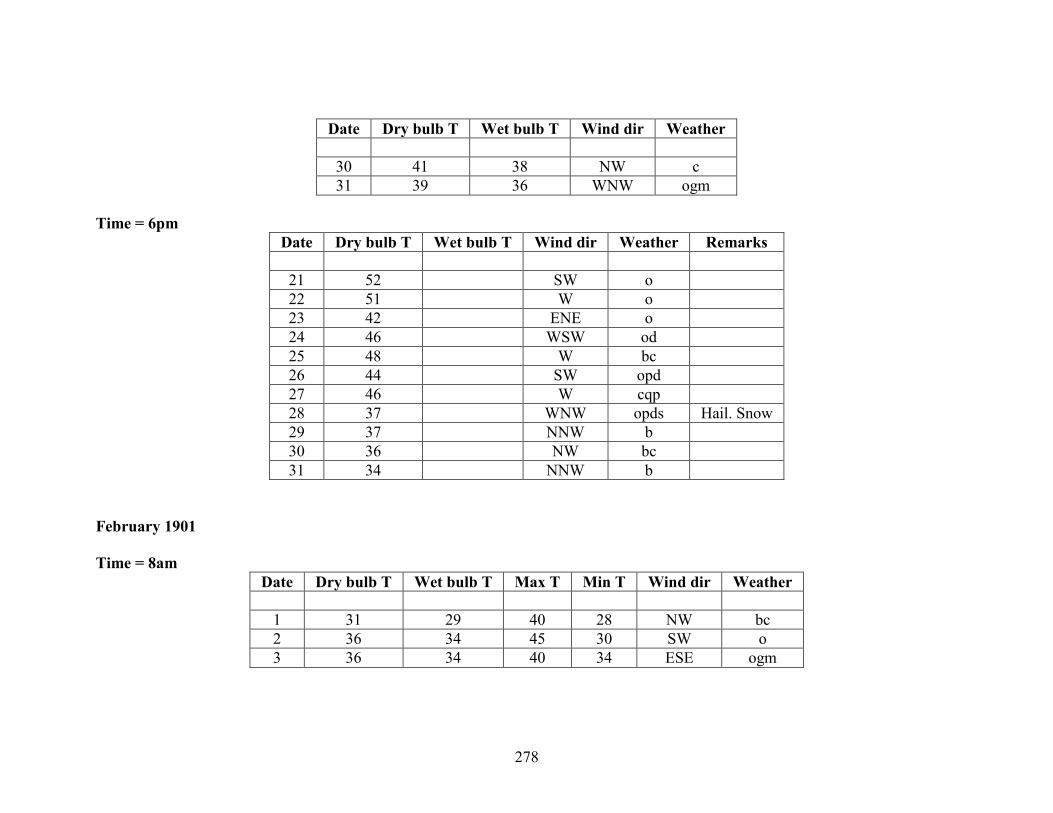
278
Date Dry bulb T Wet bulb T Wind dir Weather
30 41 38 NW c
31 39 36 WNW ogm
Time = 6pm
Date Dry bulb T Wet bulb T Wind dir Weather Remarks
21 52 SW o
22 51 W o
23 42 ENE o
24 46 WSW od
25 48 W bc
26 44 SW opd
27 46 W cqp
28 37 WNW opds Hail. Snow
29 37 NNW b
30 36 NW bc
31 34 NNW b
February 1901
Time = 8am
Date Dry bulb T Wet bulb T Max T Min T Wind dir Weather
1 31 29 40 28 NW bc
2 36 34 45 30 SW o
3 36 34 40 34 ESE ogm

279
Date Dry bulb T Wet bulb T Max T Min T Wind dir Weather
4 27 25 37 25 NE ogm
5 33 32 36 27 NE o
6 35 34 39 32 NE og
7 32 30 40 32 WNW bcmg
8 33 32 41 29 Z c
9 37 37 42 33 W om
10 40 38 42 36 NW og
11 37 35 39 36 NE og
12 26 24 38 25 W b
13 32 32 36 26 NW og
14 23 22 35 21 W b
15 30 28 36 22 NE bc
16 30 28 43 25 W bc
17 36 35 40 30 N osp
18 33 32 37 32 NE bm
19 32 31 35 29 SW os
20 33 30 37 29 NE c
21 27 25 40 27 NW m
22 39 38 45 27 NE og
23 39 37 46 37 WNW o
24 40 39 46 39 W og
25 39 38 49 39 WSW c
26 43 41 45 38 SE o
27 44 43 48 41 SW op
28 41 40 52 40 SW b

280
Time = 2pm
Date Dry bulb T Wet bulb T Wind dir Weather
1 40 37 NW bcm
2 42 39 S og
3 - - - -
4 38 35 WSW cm
5 36 34 N om
6 39 36 NNE og
7 40 36 NW bcm
8 41 39 W om
9 43 41 NW ogm
10 - - - -
11 38 34 N cm
12 38 33 NNW bc
13 36 33 E os
14 33 32 NNW c
15 35 33 NE om
16 42 39 NNW od
17 - - - -
18 37 33 NNE og
19 37 36 Z fg
20 35 32 E o
21 37 33 W o
22 44 41 NNE c
23 47 43 NNW o
24 - - - -
25 50 45 SW o
26 45 40 SSW o
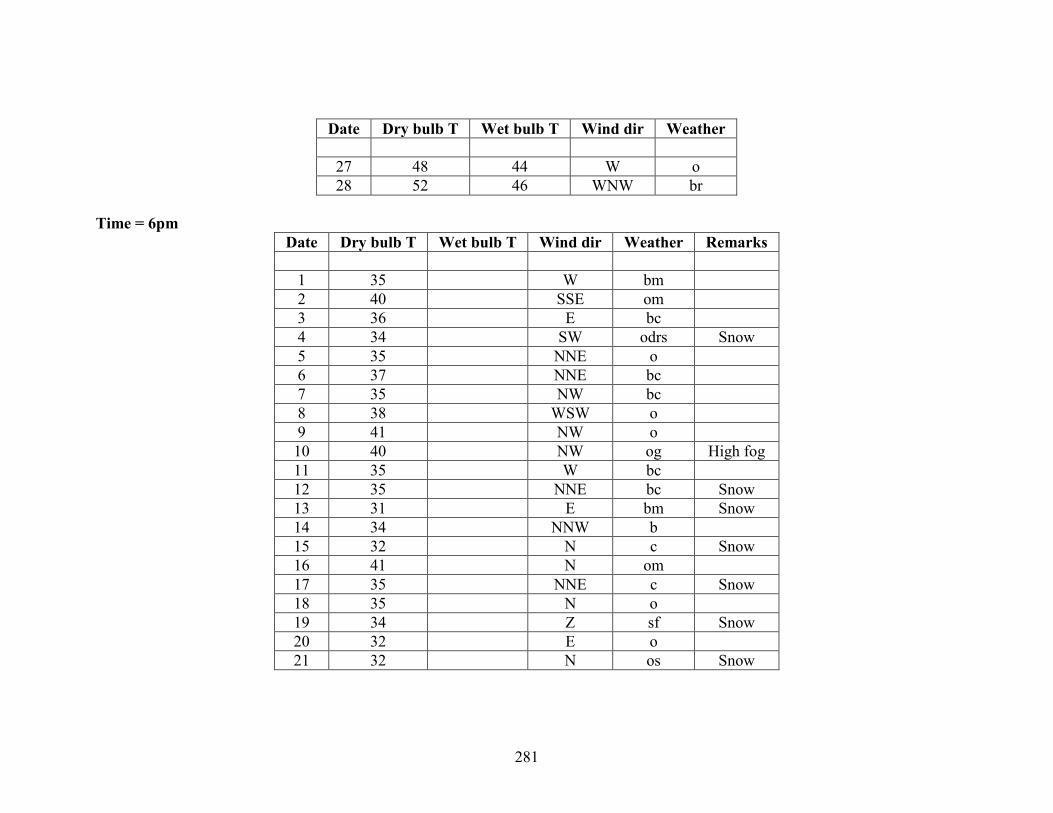
281
Date Dry bulb T Wet bulb T Wind dir Weather
27 48 44 W o
28 52 46 WNW br
Time = 6pm
Date Dry bulb T Wet bulb T Wind dir Weather Remarks
1 35 W bm
2 40 SSE om
3 36 E bc
4 34 SW odrs Snow
5 35 NNE o
6 37 NNE bc
7 35 NW bc
8 38 WSW o
9 41 NW o
10 40 NW og High fog
11 35 W bc
12 35 NNE bc Snow
13 31 E bm Snow
14 34 NNW b
15 32 N c Snow
16 41 N om
17 35 NNE c Snow
18 35 N o
19 34 Z sf Snow
20 32 E o
21 32 N os Snow

282
Date Dry bulb T Wet bulb T Wind dir Weather Remarks
22 42 NNE om
23 45 NW ogm
24 43 W o
25 47 SW o
26 42 SSW od
27 46 W o
28 48 SSW o
Kew Weather Station Data
September 1899
Date 10am 12pm 2pm 4pm 6pm 8pm 10pm Remarks
15
16
17 Cloudy and dull all day
18
19
20
21
22
23
24
25
26
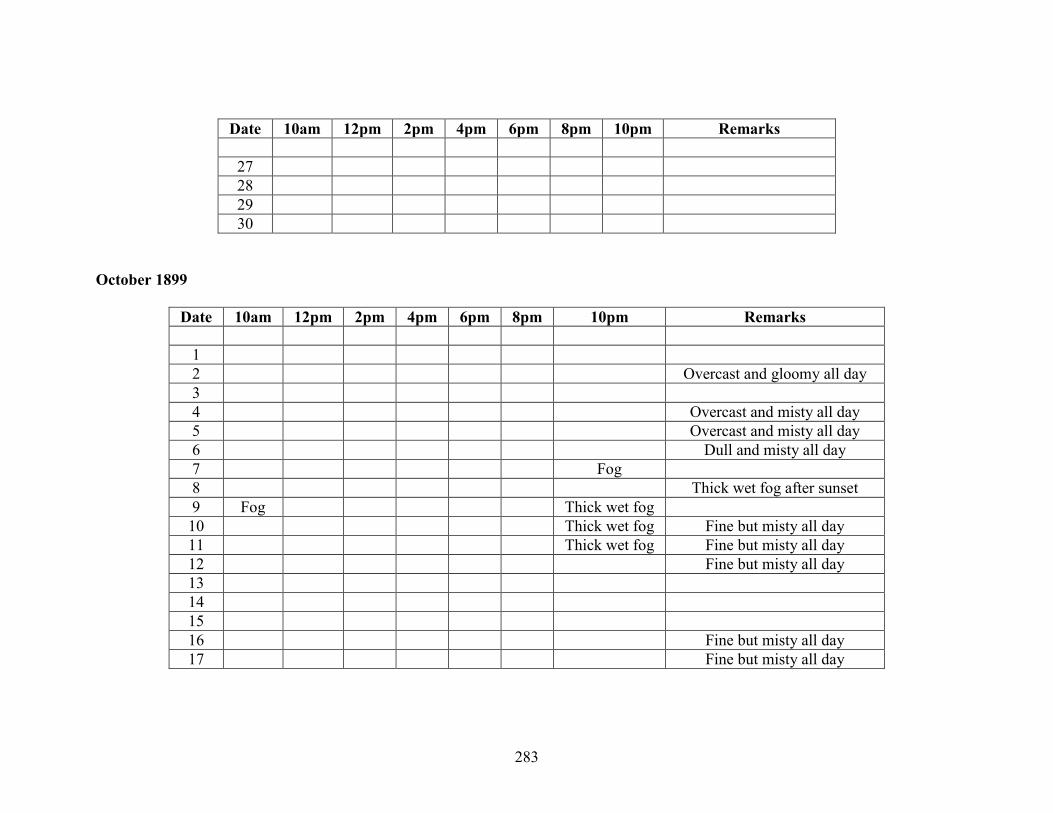
283
Date 10am 12pm 2pm 4pm 6pm 8pm 10pm Remarks
27
28
29
30
October 1899
Date 10am 12pm 2pm 4pm 6pm 8pm 10pm Remarks
1
2 Overcast and gloomy all day
3
4 Overcast and misty all day
5 Overcast and misty all day
6 Dull and misty all day
7 Fog
8 Thick wet fog after sunset
9 Fog Thick wet fog
10 Thick wet fog Fine but misty all day
11 Thick wet fog Fine but misty all day
12 Fine but misty all day
13
14
15
16 Fine but misty all day
17 Fine but misty all day

284
Date 10am 12pm 2pm 4pm 6pm 8pm 10pm Remarks
18 Fog Fine but misty all day
19 Fog Fine Fine Fine Fine Fine Fine
20 Fog nearly all day
21 Foggy all day. Very damp
22 Fog Thick fog during the evening
23 Dull and misty all day
24
25 Fine but misty through the day
26
27
28
29
30
31
November 1899
Date 10am 12pm 2pm 4pm 6pm 8pm 10pm Remarks
1
2 Overcast all day, rain at times
3
4 Dull all day
5
6 Overcast and misty till approx. 3:30pm
7

285
February 1900
Date 10am 12pm 2pm 4pm 6pm 8pm 10pm Remarks
7
8
9
10 o, m 7 inches of snow
11
12 o, f o, m o, m o, m o, m Fog or mist all day
13 Fog o, m o, m o, m o, m Fog with thick mist
14
15 o, m
16
17
18
19
20
21
22
23
24
25 o, m
26 o, m
27 o, m o, m o, m Dull and misty all day
28 o, m o, m o, m Overcast with mist all day
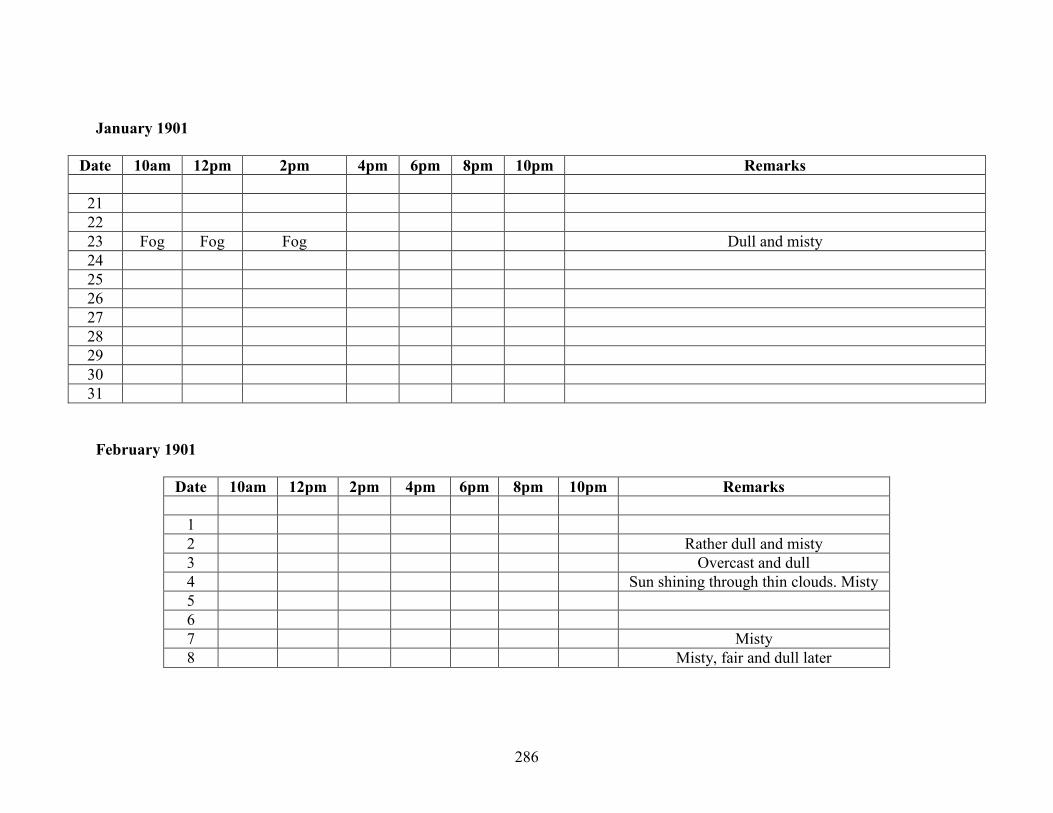
286
January 1901
Date 10am 12pm 2pm 4pm 6pm 8pm 10pm Remarks
21
22
23 Fog Fog Fog Dull and misty
24
25
26
27
28
29
30
31
February 1901
Date 10am 12pm 2pm 4pm 6pm 8pm 10pm Remarks
1
2 Rather dull and misty
3 Overcast and dull
4 Sun shining through thin clouds. Misty
5
6
7 Misty
8 Misty, fair and dull later
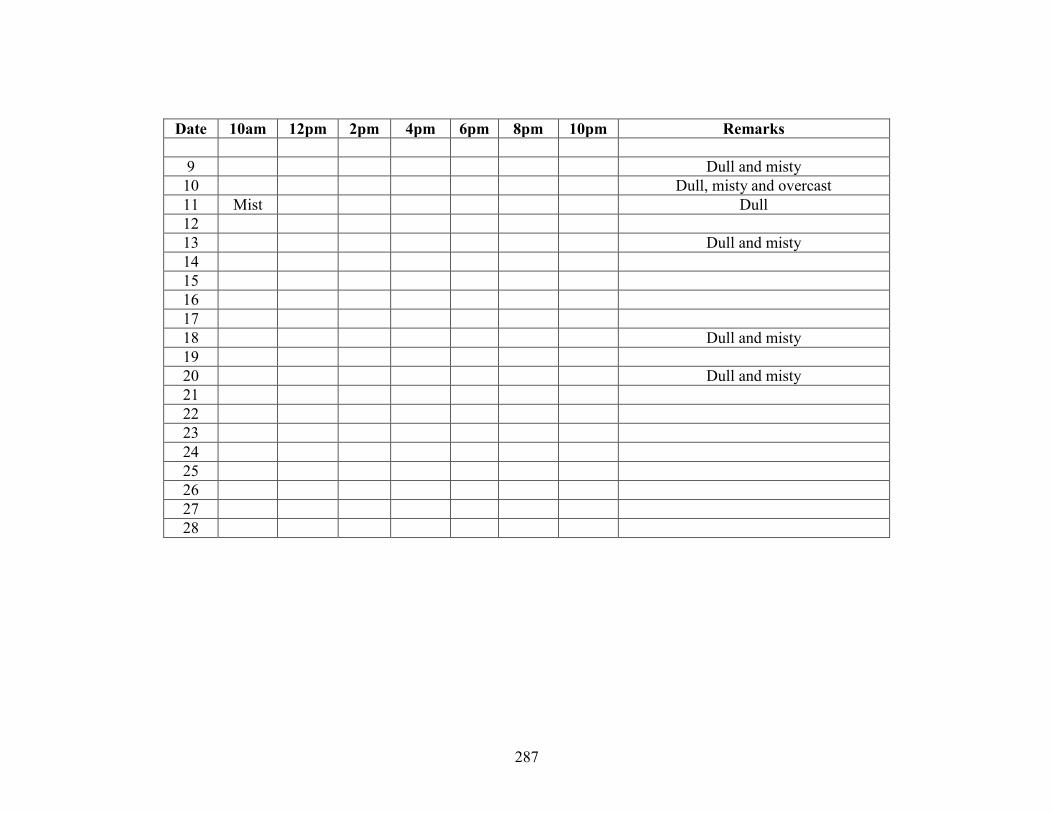
287
Date 10am 12pm 2pm 4pm 6pm 8pm 10pm Remarks
9 Dull and misty
10 Dull, misty and overcast
11 Mist Dull
12
13 Dull and misty
14
15
16
17
18 Dull and misty
19
20 Dull and misty
21
22
23
24
25
26
27
28
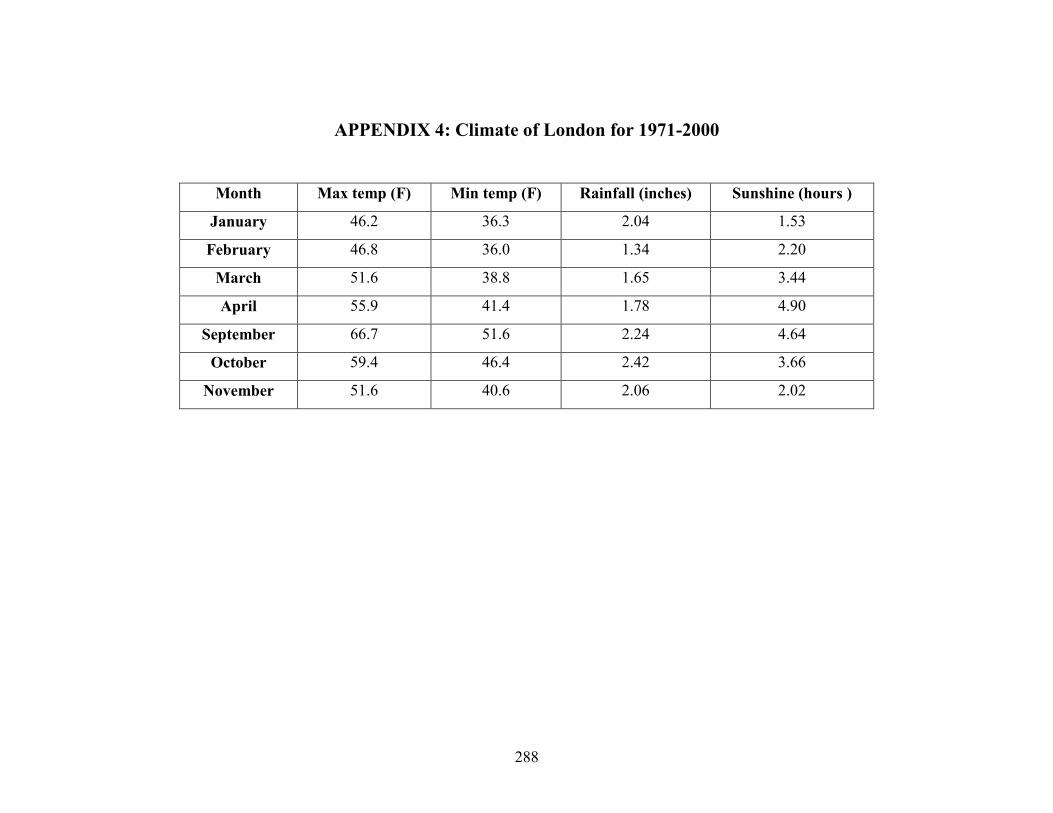
288
APPENDIX 4: Climate of London for 1971-2000
Month Max temp (F) Min temp (F) Rainfall (inches) Sunshine (hours )
January 46.2 36.3 2.04 1.53
February 46.8 36.0 1.34 2.20
March 51.6 38.8 1.65 3.44
April 55.9 41.4 1.78 4.90
September 66.7 51.6 2.24 4.64
October 59.4 46.4 2.42 3.66
November 51.6 40.6 2.06 2.02

289
APPENDIX 5: Fog observations from Brixton weather station, Kew
weather station and The Times newspaper
Fog Observations
October 1899
Brixton Kew The Times
7 (am) 7 (pm) 7 (Fog)
8 (am) 8 (Thick wet fog after sunset) 8 (Fog)
9 (am) 9 (am) (Thick wet fog) 9 (Fog)
10 (am) 10 (pm) (Thick wet fog) 10 (Fog)
11 (am) 11 (pm) (Thick wet fog) 11 (Fog)
18 (am) 18 (am)
19 (am) 19 (am) 19 (Fog)
20 (am) 20 (Fog nearly all day) 20 (Fog)
21 (am) 21 (Foggy all day) 21 (Fog)
22 (am-pm) 22 (am) (Thick fog during the
evening)
23 (am-pm)
24 (am)
November 1899
Brixton Kew The Times
14 (pm) (Ground fog)
15 (am) 15 (am) (Thick fog) 15 (Fog)
16 (am)
17 (Foggy throughout the day)
18 (am)
19 (Foggy early)
29 (am) 29 (Foggy all day) 29 (Fog)
30 (am-pm) 30 (Foggy all day) 30 (Fog)

290
February 1900
Brixton Kew The Times
4 (am)
9 (am-pm)
12 (am) (Fog or mist all day)
13 (am) 13 (am) (Fog with thick mist) 13 (Fog)
27 (am)
January 1901
Brixton Kew The Times
1 (pm)
2 (am-pm) 2 (Fine but misty and foggy) 2 (Fog)
3 (am-pm) 3 (Thick fog all day) 3 (Fog)
4 (Fog)
5 (am) 5 (Fog) 5 (Fog)
6 (Fog)
9 (pm)
11 (am)
12 (am-pm)
15 (am)
16 (Fog all day)
17 (am) (Fog dispersed soon
after noon)
23 (am)
24 (Fog)
February 1901
Brixton Kew The Times
10 (High fog)
19 (pm)

291
APPENDIX 6: Relative humidity calculations
Royal Horticultural Society
September 1899
Date Dry
bulb T
Wet
bulb T
RH
(%)
Weather observations
29 45.0 44.1 93.3 Cloudy & misty
30 47.2 45.9 90.8 Dull. Cold & raining slightly. Much lightning in
evening
October 1899
Date Dry
bulb T
Wet
bulb T
RH
(%)
Weather observations
2 51.8 50.7 92.9 Dull, cloudy & cold
4 51.2 50.6 96.0 Misty & raining
6 48.6 45.4 78.3 Misty, fine, wind cool
7 45.6 44.0 88.3 Misty, fine, wind cool
8 36.6 36.2 96.4 Very misty or white fog, cold
9 40.1 40.0 99.2 Dense fog
10 36.1 35.6 95.5 Dense fog
11 41.0 40.3 94.3 Dense fog
12 51.2 50.6 96.0 Slight fog
14 41.0 39.7 89.5 Slightly misty
16 47.9 44.0 73.4 Slightly misty, strong & cold wind
17 44.8 44.2 95.5 Thick fog
18 40.0 40.0 100.0 Thick fog
19 43.9 43.7 98.5 Dense fog
20 40.8 40.6 98.4 Dense fog
21 40.0 40.0 100.0 Dense fog
22 43.1 42.9 98.4 Dense fog, so dense at night impossible to see
anything
23 43.8 43.8 100.0 Slight fog
24 46.5 47.5 100.0 Slight fog
25 49.7 47.9 87.9 Slight fog
28 58.5 57.2 92.5 Cloudy to clear, fine day
30 48.2 47.5 95.1 Overcast & raining slightly

292
November 1899
Date Dry
bulb T
Wet
bulb T
RH
(%)
Weather observations
2 58.9 57.5 92.0 Dull, very mild and raining
4 59.2 58.4 95.4 Cloudy & raining, wind strong
5 55.1 53.8 92.1 Cloudy & raining, calmer, thorough wet day
6 49.5 48.4 92.5 Overcast & raining
7 50.2 48.8 90.7 Clear & bright at first, rain later
February 1900
Date Dry
bulb T
Wet
bulb T
RH
(%)
Weather observations
9 18.3 18.1 97.0 Slightly foggy, dull cold day
12 23.8 23.6 97.5 Slightly foggy, dull hazy cold day
13 28.7 28.4 96.7 Foggy at first, gale and snow later
15 35.9 35.0 91.8 Cold wet day
19 51.6 50.2 90.9 Rain at intervals, strong wind
23 51.1 50.1 93.4 Dull & cloudy at first, fine day, showers in
evening
25 50.8 50.3 96.7 Dull & misty, dull fine day
26 47.2 46.9 97.9 Misty showery day
27 47.4 46.9 96.5 Showers during day
28 42.4 41.4 92.2 Misty showery day
March 1900
Date Dry
bulb T
Wet
bulb T
RH
(%)
Weather observations
3 38.9 36.8 82.4 Misty, dull & cold
10 43.8 41.0 79.0 Misty at first, bright sunshine later
11 42.8 40.7 83.8 Dull & misty
19 36.2 35.8 96.4 Dull at first, fine with sun later
21 39.1 37.7 88.2 Misty cold day, rain at night
23 41.1 39.8 89.5 Dull day with cold black wind
28 38.1 37.0 90.5 Bright, clear & cold
29 36.7 34.3 78.8 Fog at first, fine & bright later
30 33.2 31.9 87.4 Slight fog, fine but cold day
31 36.1 33.8 79.4 Misty, dull cold day

293
April 1900
Date Dry
bulb T
Wet
bulb T
RH
(%)
Weather observations
1 40.7 36.9 69.8 Misty dull cold day
2 36.2 32.2 64.7 Misty, wind cold, fine spring-like day
3 39.8 39.4 96.7 Misty, showers with hail
January 1901
Date Dry
bulb T
Wet
bulb T
RH
(%)
Weather observations
23 31.6 31.2 95.9 Misty & dull day
24 42.8 41.8 92.2 Dull & overcast, fine day, rain at night
31 32.4 31.3 89.1 Slightly misty, fine but dull
February 1901
Date Dry
bulb T
Wet
bulb T
RH
(%)
Weather observations
1 32.1 31.2 91.0 Slightly misty at first, fine day with sun
afternoon
3 36.2 34.5 84.7 Dull cold & misty, fine day but dull
4 30.8 30.2 93.8 Misty, snow showers afternoon & evening
8 34.0 32.9 89.5 Misty, fine but dull day
9 36.8 36.2 94.6 Dull & misty. Dull & cold all day
10 39.0 37.8 89.9 Dull & cloudy, dull day
16 34.0 32.9 89.5 Bright at first, rain in afternoon
19 33.0 32.9 90.2 Slight snow showers, very dark afternoon
22 39.3 38.2 90.8 Dull and overcast, fine day
27 44.8 43.7 91.8 Cloudy, dull day

294
March 1901
Date Dry
bulb T
Wet
bulb T
RH
(%)
Weather obs.
1 47.6 46.1 89.5 Dull & cloudy, fine day
2 44.7 43.7 92.5 Dull, rain at times
4 41.7 40.5 90.5 Raining morning, afternoon fine
5 49.9 48.7 91.9 Raining, heavy showers
10 34.0 33.3 93.3 Slightly misty, fine but dull
11 32.3 30.6 83.2 Slightly misty, fine but dull
12 40.9 39.9 91.9 Slightly misty, fine but dull
13 37.5 36.3 89.5 Overcast, fine, dull & cold
16 38.2 37.6 94.8 Raining morning, fine bright afternoon
17 42.2 39.1 76.0 Misty, fine day
25 35.5 34.6 91.7 Dull, snow at intervals
26 32.7 32.0 93.1 Bright & clear, fine bright day, snow evening
31 43.9 43.2 94.7 Raining at first, fine bright afternoon
April 1901
Date Dry bulb T Wet bulb T RH (%) Weather obs.
6 42.2 41.5 94.5 Raining at first, fine afternoon
Westminster – 2pm
September 1899
Date Dry bulb T Wet bulb T RH (%) Observations
18 63 55 59.8 cf
20 60 52 57.8 cf
October 1899
Date Dry bulb T Wet bulb T RH (%) Observations
4 54 52 87.6 omg
6 53 50 81.3 om
9 59 50 52.2 bm

295
Date Dry bulb T Wet bulb T RH (%) Observations
10 61 53 58.5 bm
11 64 58 69.7 bm
17 60 53 62.7 bm
18 63 55 59.8 bm
20 60 51 53.0 bm
21 47 45 85.9 f
23 55 52 81.9 bf
November 1899
Date Dry bulb T Wet bulb T RH (%) Observations
6 53 50 81.3 om
February 1900
Date Dry bulb T Wet bulb T RH (%) Observations
7 36 32 64.5 bm
8 36 32 64.5 bm
9 37 32 57.0 f
13 38 35 74.4 m
17 47 46 92.9 ogm
27 50 50 100 ogd
28 43 42 92.3 og
January 1901
Date Dry bulb T Wet bulb T RH (%) Observations
31 39 36 75.0 ogm
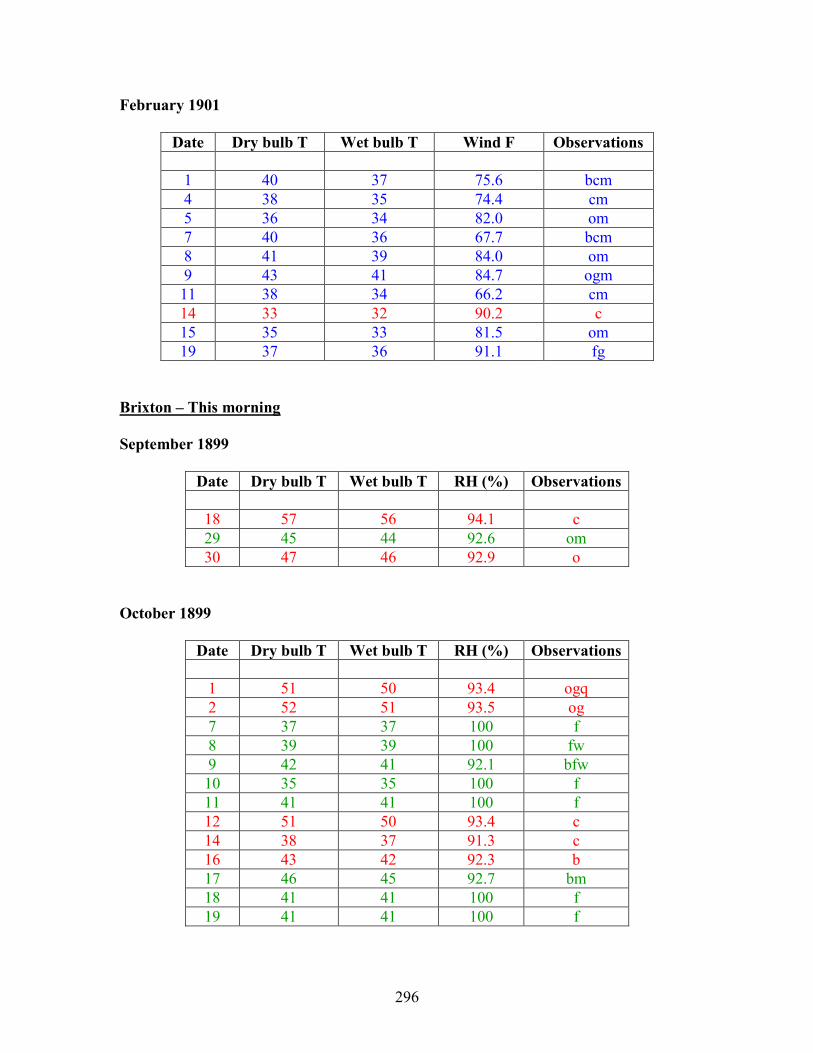
296
February 1901
Date Dry bulb T Wet bulb T Wind F Observations
1 40 37 75.6 bcm
4 38 35 74.4 cm
5 36 34 82.0 om
7 40 36 67.7 bcm
8 41 39 84.0 om
9 43 41 84.7 ogm
11 38 34 66.2 cm
14 33 32 90.2 c
15 35 33 81.5 om
19 37 36 91.1 fg
Brixton – This morning
September 1899
Date Dry bulb T Wet bulb T RH (%) Observations
18 57 56 94.1 c
29 45 44 92.6 om
30 47 46 92.9 o
October 1899
Date Dry bulb T Wet bulb T RH (%) Observations
1 51 50 93.4 ogq
2 52 51 93.5 og
7 37 37 100 f
8 39 39 100 fw
9 42 41 92.1 bfw
10 35 35 100 f
11 41 41 100 f
12 51 50 93.4 c
14 38 37 91.3 c
16 43 42 92.3 b
17 46 45 92.7 bm
18 41 41 100 f
19 41 41 100 f
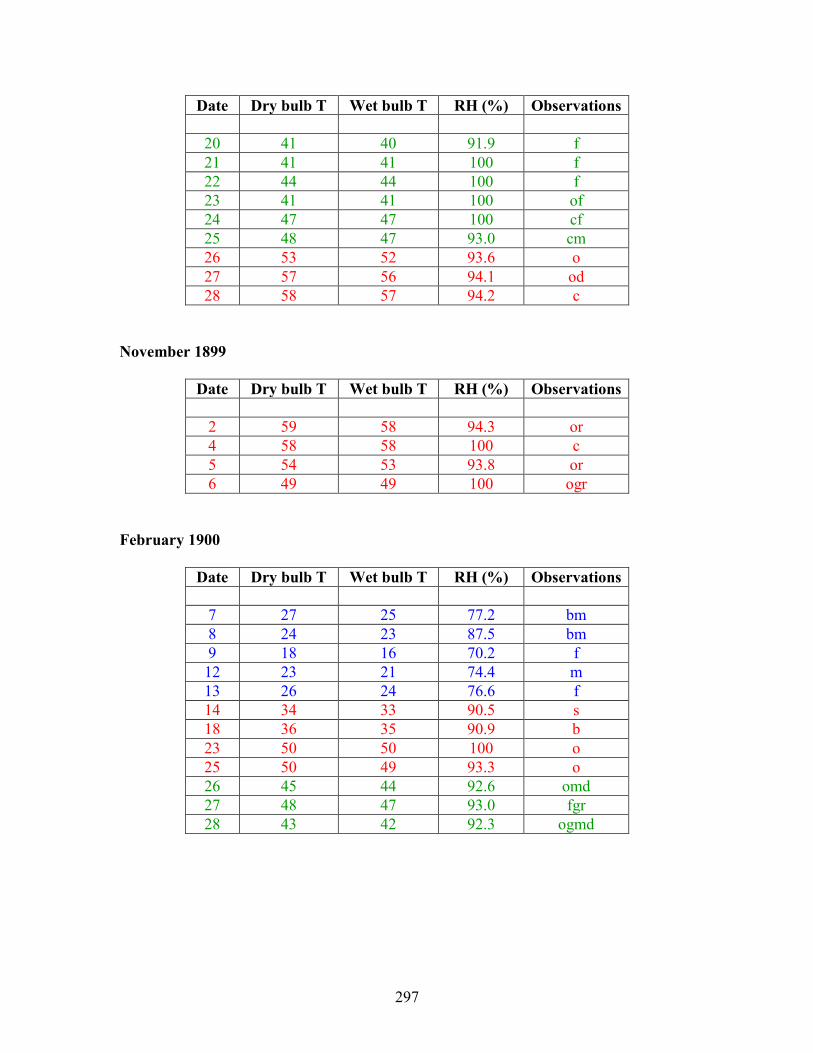
297
Date Dry bulb T Wet bulb T RH (%) Observations
20 41 40 91.9 f
21 41 41 100 f
22 44 44 100 f
23 41 41 100 of
24 47 47 100 cf
25 48 47 93.0 cm
26 53 52 93.6 o
27 57 56 94.1 od
28 58 57 94.2 c
November 1899
Date Dry bulb T Wet bulb T RH (%) Observations
2 59 58 94.3 or
4 58 58 100 c
5 54 53 93.8 or
6 49 49 100 ogr
February 1900
Date Dry bulb T Wet bulb T RH (%) Observations
7 27 25 77.2 bm
8 24 23 87.5 bm
9 18 16 70.2 f
12 23 21 74.4 m
13 26 24 76.6 f
14 34 33 90.5 s
18 36 35 90.9 b
23 50 50 100 o
25 50 49 93.3 o
26 45 44 92.6 omd
27 48 47 93.0 fgr
28 43 42 92.3 ogmd

298
March 1900
Date Dry bulb T Wet bulb T RH (%) Observations
10 40 39 91.7 b
11 40 38 83.6 om
16 37 36 91.1 o
19 33 33 100 o
21 36 35 90.9 bf
28 38 37 91.3 od
30 33 32 90.2 bf
April 1900
Date Dry bulb T Wet bulb T RH (%) Observations
3 38 37 91.3 o
Brixton
September 1899
Time = 8am
Date Dry bulb T Wet bulb T RH (%) Weather
29 45 44 92.6 om
30 47 46 92.9 o
Time = 2pm
No dates
October 1899
Time = 8am
Date Dry bulb T Wet bulb T RH (%) Weather
1 51 50 93.4 ogq
2 52 51 93.5 og
7 37 37 100 f
8 39 39 100 fw

299
Date Dry bulb T Wet bulb T RH (%) Weather
9 42 41 92.1 bfw
10 35 35 100 f
11 41 41 100 f
17 46 45 92.7 bm
18 41 41 100 f
19 41 41 100 f
20 41 40 91.9 f
21 41 41 100 f
22 44 44 100 f
23 41 41 100 of
24 47 47 100 cf
25 48 47 93.0 cm
26 53 52 93.6 o
27 57 56 94.1 od
28 58 57 94.2 c
30 51 50 93.4 o
Time = 2pm
Date Dry bulb T Wet bulb T RH (%) Weather
4 54 52 87.6 omg
6 53 50 81.3 om
9 59 50 52.2 bm
10 61 53 58.5 bm
11 64 58 69.7 bm
17 60 53 62.7 bm
18 63 55 59.8 bm
20 60 51 53.0 bm
21 47 45 85.9 f
23 55 52 81.9 bf
November 1899
Time = 8am
Date Dry bulb T Wet bulb T RH (%) Weather
4 58 58 100 c
5 54 53 93.8 or
6 49 48 93.2 ogr

300
Time = 2pm
Date Dry bulb T Wet bulb T RH (%) Weather
6 53 50 81.3 om
February 1900
Time = 8am
Date Dry bulb T Wet bulb T RH (%) Weather
7 27 25 77.2 bm
8 24 23 87.5 bm
9 18 16 70.2 f
12 23 21 74.4 m
13 26 24 76.6 f
14 34 33 90.5 s
18 36 35 90.9 b
23 50 50 100 o
24 51 50 93.4 c
25 50 49 93.3 o
26 45 44 92.6 omd
27 48 47 93.0 fgr
28 43 42 92.3 ogmd
Time = 2pm
Date Dry bulb T Wet bulb T RH (%) Weather
7 36 32 64.5 bm
8 36 32 64.5 bm
9 37 32 57.0 f
13 38 35 74.4 m
17 47 46 92.9 ogm
27 50 50 100 ogd
28 43 42 92.3 og

301
January 1901
Time = 8am
Date Dry bulb T Wet bulb T RH (%) Weather
23 36 35 90.9 fg
24 42 41 92.1 ogm
28 36 35 90.9 op
30 33 32 90.2 bc
31 31 30 89.7 bc
Time = 2pm
Date Dry bulb T Wet bulb T RH (%) Weather
21 53 51 87.4 om
23 47 41 59.1 mg
24 46 45 92.7 om
31 39 36 75.0 ogm
February 1901
Time = 8am
Date Dry bulb T Wet bulb T RH (%) Weather
3 36 34 82.0 ogm
4 27 25 77.2 ogm
5 33 32 90.2 o
6 35 34 90.7 og
7 32 30 80.1 bcmg
8 33 32 90.2 c
9 37 37 100 om
13 32 32 100 og
17 36 35 90.9 osp
18 33 32 90.2 bm
19 32 31 90.0 os
21 27 25 77.2 m
22 39 38 91.5 og
24 40 39 91.7 og
25 39 38 91.5 c
27 44 43 92.4 op
28 41 40 91.9 b

302
Time = 2pm
Date Dry bulb T Wet bulb T RH (%) Weather
1 40 37 75.6 bcm
4 38 35 74.4 cm
5 36 34 82.0 om
7 40 36 67.7 bcm
8 41 39 84.0 om
9 43 41 84.7 ogm
11 38 34 66.2 cm
14 33 32 90.2 c
15 35 33 81.5 om
18 37 33 65.4 og
19 37 36 91.1 fg

303
APPENDIX 7: Analysis of Monet’s paintings with respect to the Royal
Horticultural Society’s weather diaries and weather reports for
Westminster, Brixton and Kew
Royal Horticultural Society weather diary
September 1899
Date Wind
dir
Weather obs.
16 WNW Cloudy, strong wind, thunderstorms during the day
17 WSW Cloudy. Wind moderate & fresh
18 WSW Very cloudy, wind cold
19 WSW Very dull, wind cold
20 WSW Cloudy, wind very cold
21 WSW Bright & clear. Wind very cold
22 WNW Bright & clear, wind strong & cold
23 WSW Dull & cloudy, wind cold, rain in evening
24 WNW Bright & clear, wind strong & cold
25 WSW Bright & clear
26 WSW Bright & clear, wind strong & cold
27 SW Dull, cloudy & raining slightly. Thunderstorm in evening
28 WSW Bright, clear & calm
October 1899
Date Wind
dir
Weather obs.
2 WSW Dull, cloudy & cold
3 WSW Clear & bright, wind cool
13 WSW Bright & clear wind fresh
24 WNW Slight fog
31 WSW Clear & bright

304
February 1900
Date Wind
dir
Weather obs.
21 WNW Bright sunny morning, very fine day
March 1900
Date Wind
dir
Weather obs.
16 WNW Dull and cloudy flashes of sunshine
17 WNW Dull with cold sleet showers
April 1900
Date Wind
dir
Weather obs.
2 WSW Misty, wind cold, fine spring-like day
3 WSW Misty, showers with hail
4 WNW Cloudy at first, fine spring-like day
5 WNW Overcast, dull showery day
6 WNW Bright & clear, fine spring day
Weather reports – south of England, Westminster and Brixton
Forecasts for 24 hours ending at noon, Location: South England
September 1899
Date Observations
15 Westerly to Northerly breezes; cloudy; rain at times
16 Rather unsettled
18 -
19 Strong & squally winds from NW, passing showers, cool
20 Westerly (SW to NW) winds, very changeable, unsettled weather, occasional
rain
21 North-Westerly winds, strong but moderating; cool, with passing showers in
most places
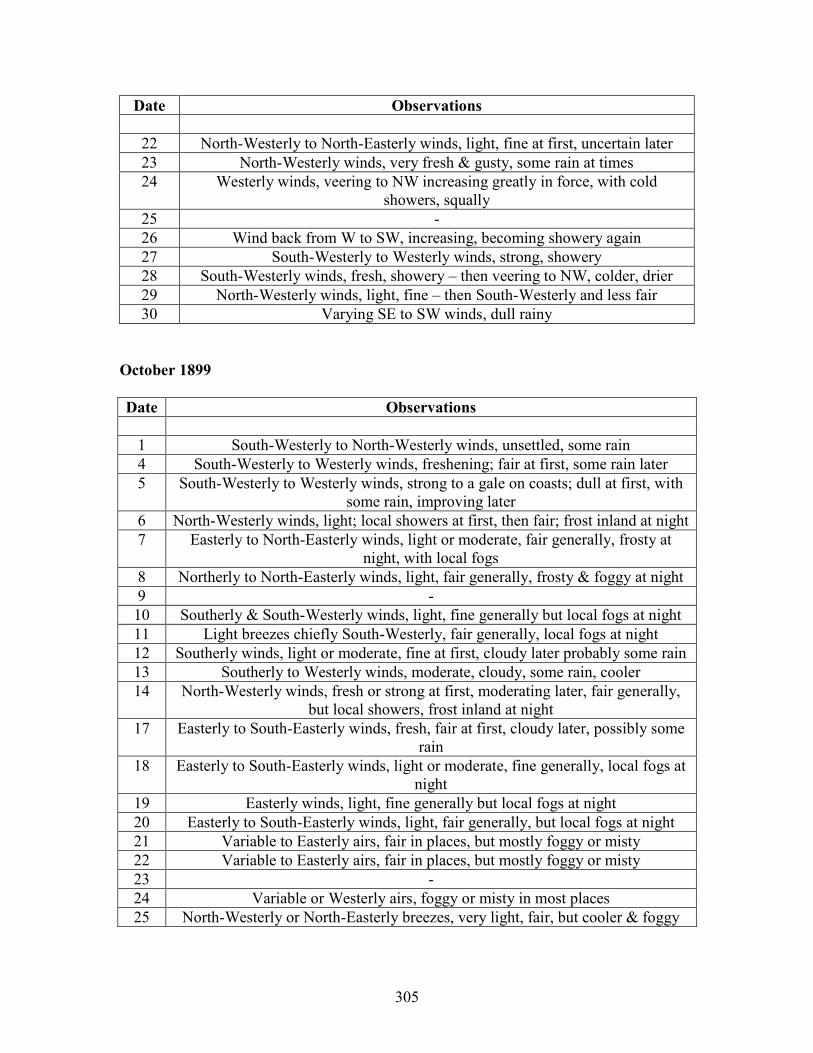
305
Date Observations
22 North-Westerly to North-Easterly winds, light, fine at first, uncertain later
23 North-Westerly winds, very fresh & gusty, some rain at times
24 Westerly winds, veering to NW increasing greatly in force, with cold
showers, squally
25 -
26 Wind back from W to SW, increasing, becoming showery again
27 South-Westerly to Westerly winds, strong, showery
28 South-Westerly winds, fresh, showery – then veering to NW, colder, drier
29 North-Westerly winds, light, fine – then South-Westerly and less fair
30 Varying SE to SW winds, dull rainy
October 1899
Date Observations
1 South-Westerly to North-Westerly winds, unsettled, some rain
4 South-Westerly to Westerly winds, freshening; fair at first, some rain later
5 South-Westerly to Westerly winds, strong to a gale on coasts; dull at first, with
some rain, improving later
6 North-Westerly winds, light; local showers at first, then fair; frost inland at night
7 Easterly to North-Easterly winds, light or moderate, fair generally, frosty at
night, with local fogs
8 Northerly to North-Easterly winds, light, fair generally, frosty & foggy at night
9 -
10 Southerly & South-Westerly winds, light, fine generally but local fogs at night
11 Light breezes chiefly South-Westerly, fair generally, local fogs at night
12 Southerly winds, light or moderate, fine at first, cloudy later probably some rain
13 Southerly to Westerly winds, moderate, cloudy, some rain, cooler
14 North-Westerly winds, fresh or strong at first, moderating later, fair generally,
but local showers, frost inland at night
17 Easterly to South-Easterly winds, fresh, fair at first, cloudy later, possibly some
rain
18 Easterly to South-Easterly winds, light or moderate, fine generally, local fogs at
night
19 Easterly winds, light, fine generally but local fogs at night
20 Easterly to South-Easterly winds, light, fair generally, but local fogs at night
21 Variable to Easterly airs, fair in places, but mostly foggy or misty
22 Variable to Easterly airs, fair in places, but mostly foggy or misty
23 -
24 Variable or Westerly airs, foggy or misty in most places
25 North-Westerly or North-Easterly breezes, very light, fair, but cooler & foggy

306
Date Observations
26 Southerly and South-Westerly winds, light to moderate, changeable, fair milder
27 South-Westerly & Westerly winds, light, slight showers, then colder & finer
28 South-Westerly & Southerly winds, light; rainy then cooler
29 Varying light breezes between SW & NW; weather very changeable, rain at
times
30 -
31 North-Westerly to South-Westerly winds, temperatures finer, not settled
November 1899
Date Observations
1 Westerly & South-Westerly winds, moderate, fair, cool
2 Southerly & South-Westerly winds, freshening, fine at first, cloudy later,
probably some rain
3 Southerly winds, strong in places, mild, changeable, some showers, with bright
intervals
4 South-Westerly winds, strong to a gale, fine at first, some rain later
6 -
7 Light variable breezes, dull & misty at first; with rain in places, improving
temperatures later
February 1900
Date Observations
7 Northerly to North-Easterly winds; moderate, fine at first, snow showers later
8 Northerly to North-Easterly winds, fine at first, fog in places, cloudy later,
probably some snow
9 North-Easterly winds, light, fair generally, foggy or misty in places
10 Easterly & South-Easterly winds, light, fine at first, cloudy later, possibly snow
becoming milder
12 -
13 Easterly winds increasing in force, cloudy, squally, some snow
14 Calms & South-Easterly winds, freshening, milder
16 South-Easterly to North-Easterly gales, rain and snow. Colder again
17 Westerly winds, strong to moderate, fair to showery
19 -
20 South-Westerly & Westerly winds, strong to a gale at times, rainy to fair &
colder

307
Date Observations
21 South-Westerly to North-Westerly winds, moderate to fresh, changeable, some
showers
22 North-Westerly to South-Westerly winds freshening, fine at first, cloudy later
with some rain or sleet
23 South-Westerly to Westerly winds, strong, squally, showery
24 South-Westerly winds, strong in places, mild, changeable, some rain
25 Southerly winds moderate, mild, changeable, showery
26 -
27 Easterly to South-Easterly winds moderate, rainy at first, improving
temperatures later
28 Wind becoming Northerly generally and weather improving slowly
March 1900
Date Observations
1 Easterly to North-Easterly winds, moderate to fresh, colder, rainy, dull
4 Varying Westerly to Northerly winds, some rain in most places, unsettled
5 -
7 Northerly to North-Westerly winds light dull misty or foggy in places
9 Variable or North-Easterly airs. Cloudy. Some mist or fog
10 Easterly winds moderate. Cloudy misty, slight rain locally
11 Easterly & South-Easterly winds, light, fair generally, warmer
17 Westerly & Northerly winds. Moderate. Few cold showers then finer. Frost at
night
21 Southerly winds. Moderate or fresh. Changeable, some showers
23 Easterly & North-Easterly winds strong in places, changeable, some rain
24 North-Easterly winds strong, cloudy, slight rain locally
26 -
27 North-Westerly winds freshening, changeable, some snow showers
28 Northerly winds backing W. Light fine, milder, not settled
29 South-Westerly to North-Westerly & Northerly winds colder some slight cold
showers
30 Northerly airs & calms then South-Westerly & Southerly & milder weather
31 Calm, fine, foggy in places, very cold tonight

308
April 1900
Date Observations
1 Variable & Southerly airs, fine, hazy at times, very little milder
2 -
3 Varying & North-Easterly airs, hazy, cloudy
4 South-Westerly winds, moderate or fresh, cloudy, some rain
7 Southerly & South-Westerly winds becoming strong & squally, showery,
milder, unsettled
Today’s 2pm reports, Location: Westminster, London
September 1899
Date Wind dir Observations
18 NW cf
20 NW cf
October 1899
Date Wind dir Observations
4 SE omg
6 E om
9 S bm
10 SSW bm
11 SSW bm
17 E bm
18 ENE bm
20 E bm
21 Z f
23 NW bf
November 1899
Date Wind dir Observations
6 NNW om

309
February 1900
Date Wind dir Observations
7 NW bm
8 NE bm
9 ESE f
13 ESE m
14 N c
15 SSE or
16 WNW bc
17 SSW ogm
January 1901
Date Wind dir Observations
31 WNW ogm
February 1901
Date Wind dir Observations
1 NW bcm
4 WSW cm
5 N om
7 NW bcm
8 W om
9 NW ogm
11 N cm
15 NE om
19 Z fg

310
Daily weather reports
Location: Brixton
Yesterday evening
September 1899
Date Wind dir Observations
16 SW o
22 SW c
30 SE r
October 1899
Date Wind dir Observations
1 S b
2 SSW c
10 SW bcm
12 S bm
19 SE b
20 SE b
21 SE bm
26 SSW o
27 SW or
28 SW od
30 SW o
November 1899
Date Wind dir Observations
2 S b
3 SW o
4 SW rq
5 SSW odr
6 S o

311
February 1900
Date Wind dir Observations
10 SSE m
11 SSE s
14 SE os
16 S oqd
18 SE org
19 SSW o
20 SW opq
22 SW c
24 SSW c
25 S c
27 SSW cp
28 S ogd
March 1900
Date Wind dir Observations
19 SSE ors
20 SE bc
21 SE b
April 1900
Date Wind dir Observations
1 SE bm
2 SE b
4 S or
7 SW c

312
This morning
September 1899
Date Wind dir Observations
27 SW o
29 SW om
30 S o
October 1899
Date Wind dir Observations
1 SE ogq
3 SW b
4 SW o
26 S o
27 SW od
29 SW oc
November 1899
Date Wind dir Observations
1 S b
2 S or
3 SSW b
4 SSW c
5 S or
6 SE ogr
7 S bc
February 1900
Date Wind dir Observations
10 SSE bc
15 SSE rq
16 SW bc
17 SW b

313
Date Wind dir Observations
19 SSW odq
20 SSW bc
22 SW c
23 SSW o
24 S c
March 1900
Date Wind dir Observations
19 SW o
20 SW b
21 E bf
April 1900
Date Wind dir Observations
3 SW o
Past 24 hours
September 1899
Date Weather
15 b.bm
October 1899
Date Weather
3 od.om.b
5 opdm
6 od.mw
8 bc.fw
9 bf.c.bw
10 b.bfw

314
Date Weather
11 b.bm.bw
12 b.m.bw
14 b.bmw
17 bm.om.b
18 bv.fw
19 f.b.bw
20 bm.fw
21 f.bm.fw
22 fg
23 fg
24 gf.mw
25 cm.o
26 cm.o.d
November 1899
Date Weather
7 or.c.bm
February 1900
Date Weather
8 bm.o
9 bm.o
10 bm.b
13 om.f
14 of.srq
15 bm.b.o
25 o.m.r
26 o.m.b.d
27 bc.m.or
28 ogrm.og

315
March 1900
Date Weather
11 bm.o
12 om.bc.cm
13 bm.b
18 cm
22 bcm.orq
27 o.phs.bm
28 o.bm
April 1900
Date Weather
2 o.b.m
Brixton Weather Station Data
September 1899
Time = 8am
Date Wind dir Weather
27 SW o
29 SW om
30 S o
Time = 2pm
Date Wind dir Weather
29 SSW od
30 SW o
October 1899
Time = 8am
Date Wind dir Weather
1 SE ogq
3 SW b

316
Date Wind dir Weather
4 SW o
26 S o
27 SW od
29 SW o
Time = 2pm
Date Wind dir Weather
4 SE omg
9 S bm
10 SSW bm
11 SSW bm
25 S o
26 SW or
27 SSW or
November 1899
Time = 8am
Date Wind dir Weather
1 S b
2 S or
3 SSW b
4 SSW c
5 S or
6 SE ogr
7 S bc
Time = 2pm
Date Wind dir Weather
1 S bc
2 SW ogd
3 SW o
4 SW o
7 S o
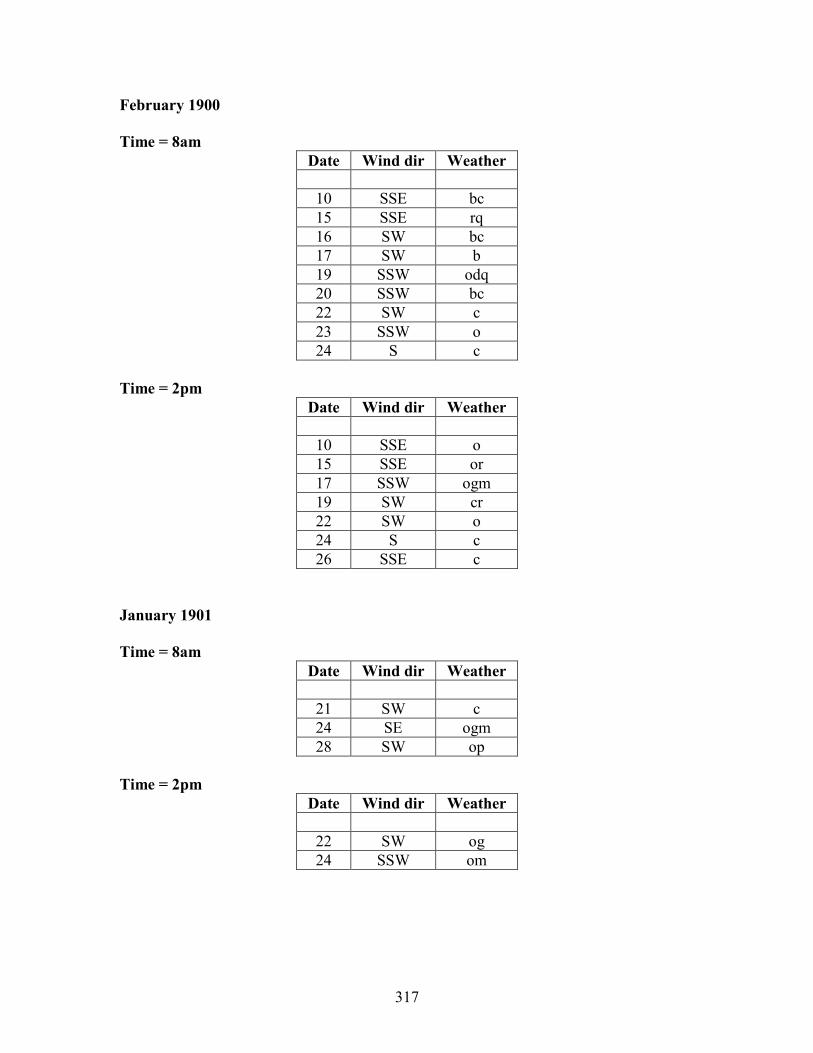
317
February 1900
Time = 8am
Date Wind dir Weather
10 SSE bc
15 SSE rq
16 SW bc
17 SW b
19 SSW odq
20 SSW bc
22 SW c
23 SSW o
24 S c
Time = 2pm
Date Wind dir Weather
10 SSE o
15 SSE or
17 SSW ogm
19 SW cr
22 SW o
24 S c
26 SSE c
January 1901
Time = 8am
Date Wind dir Weather
21 SW c
24 SE ogm
28 SW op
Time = 2pm
Date Wind dir Weather
22 SW og
24 SSW om

318
February 1901
Time = 8am
Date Wind dir Weather
2 SW o
19 SW os
26 SE o
27 SW op
28 SW b
Time = 2pm
Date Wind dir Weather
2 S og
25 SW o
26 SSW o
Kew Weather Station Data
September 1899
Date 10am 12pm 2pm 4pm 6pm 8pm 10pm Remarks
17 Cloudy and dull all day
October 1899
Date 10am 12pm 2pm 4pm 6pm 8pm 10pm Remarks
2 Overcast and
gloomy all day
4 Overcast and misty
all day
5 Overcast and misty
all day
6 Dull and misty all
day
9 Fog Thick wet
fog
10 Thick wet
fog
Fine but misty all
day

319
Date 10am 12pm 2pm 4pm 6pm 8pm 10pm Remarks
11 Thick wet
fog
Fine but misty all
day
12 Fine but misty all
day
16 Fine but misty all
day
17 Fine but misty all
day
18 Fog Fine but misty all
day
19 Fog Fine Fine Fine Fine Fine Fine
20 Fog nearly all day
21 Foggy all day.
Very damp
22 Fog Thick fog during
the evening
23 Dull and misty all
day
25 Fine but misty
through the day
November 1899
Date 10am 12pm 2pm 4pm 6pm 8pm 10pm Remarks
2 Overcast all day,
rain at times
4 Dull all day
6 Overcast and
misty till approx.
3:30pm
February 1900
Date 10am 12pm 2pm 4pm 6pm 8pm 10pm Remarks
10 o, m 7 inches of snow
12 o, f o, m o, m o, m o, m Fog or mist all
day
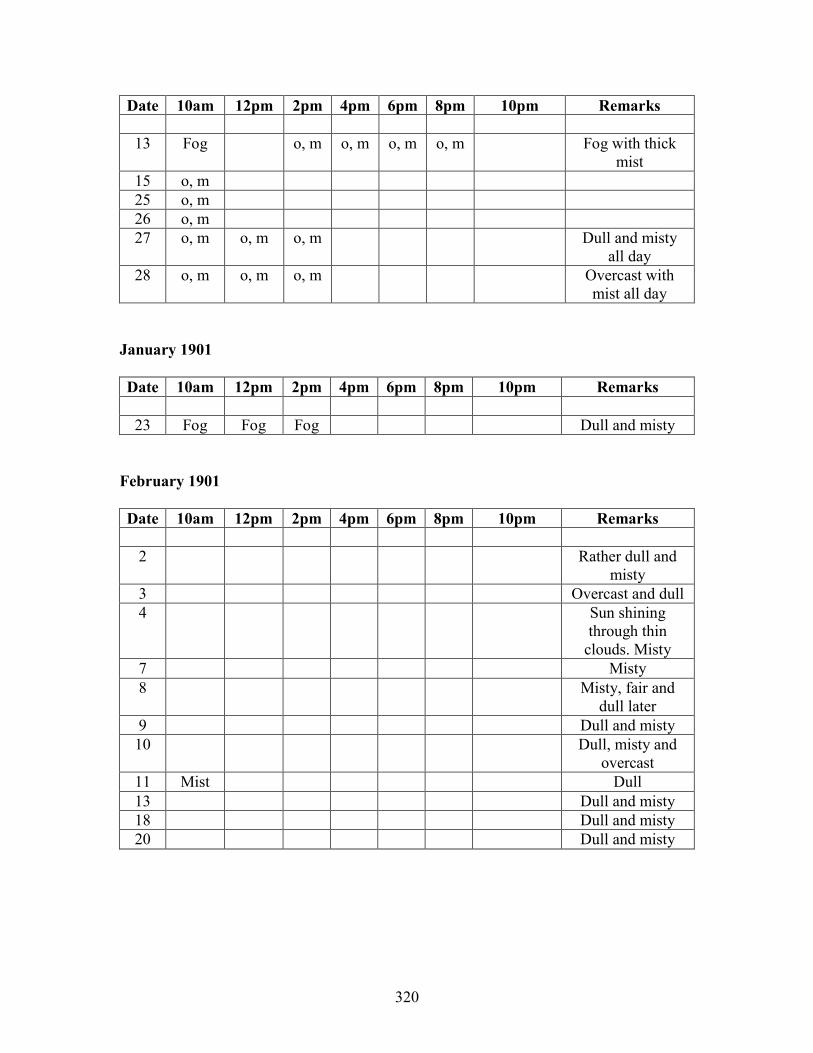
320
Date 10am 12pm 2pm 4pm 6pm 8pm 10pm Remarks
13 Fog o, m o, m o, m o, m Fog with thick
mist
15 o, m
25 o, m
26 o, m
27 o, m o, m o, m Dull and misty
all day
28 o, m o, m o, m Overcast with
mist all day
January 1901
Date 10am 12pm 2pm 4pm 6pm 8pm 10pm Remarks
23 Fog Fog Fog Dull and misty
February 1901
Date 10am 12pm 2pm 4pm 6pm 8pm 10pm Remarks
2 Rather dull and
misty
3 Overcast and dull
4 Sun shining
through thin
clouds. Misty
7 Misty
8 Misty, fair and
dull later
9 Dull and misty
10 Dull, misty and
overcast
11 Mist Dull
13 Dull and misty
18 Dull and misty
20 Dull and misty

321
Fog Observations
October 1899
Brixton Kew The Times
9 (am) 9 (am) (Thick wet fog) 9 (Fog)
18 (am) 18 (am)
19 (am) 19 (am) 19 (Fog)
20 (am) 20 (Fog nearly all day) 20 (Fog)
21 (am) 21 (Foggy all day) 21 (Fog)
23 (am-pm)
24 (am)
November 1899
Brixton Kew The Times
15 (am) 15 (am) (Thick fog) 15 (Fog)
16 (am)
17 (Foggy throughout the day)
18 (am)
19 (Foggy early)
29 (am) 29 (Foggy all day) 29 (Fog)
30 (am-pm) 30 (Foggy all day) 30 (Fog)
February 1900
Brixton Kew The Times
4 (am)
9 (am-pm)
12 (am) (Fog or mist all day)
13 (am) 13 (am) (Fog with thick mist) 13 (Fog)
27 (am)
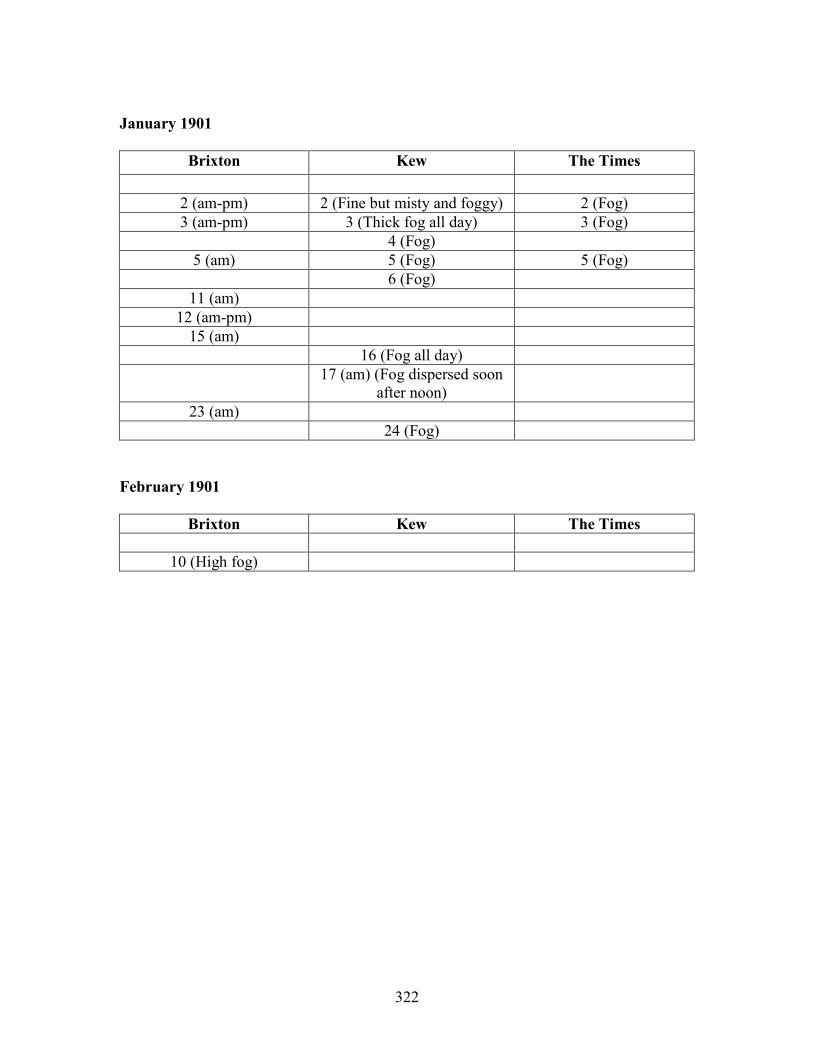
322
January 1901
Brixton Kew The Times
2 (am-pm) 2 (Fine but misty and foggy) 2 (Fog)
3 (am-pm) 3 (Thick fog all day) 3 (Fog)
4 (Fog)
5 (am) 5 (Fog) 5 (Fog)
6 (Fog)
11 (am)
12 (am-pm)
15 (am)
16 (Fog all day)
17 (am) (Fog dispersed soon
after noon)
23 (am)
24 (Fog)
February 1901
Brixton Kew The Times
10 (High fog)

323
APPENDIX 8: Monet’s letters
Monet’s second visit in 1900
Monet’s letters
1505 London, Monday 12th
February 1900 to Alice Monet
“il y a un brouillard des plus épais” → there is a very thick fog
1506 London, Tuesday 13th
February 1900 to Alice Monet
“Ce matin et hier, brouillard à ne rien voir” → This morning and yesterday, nothing to
see but fog
1507 London, Wednesday 14th
February 1900 to Alice Monet
“lorsque ce n‟est pas un brouillard à ne rien voir” → when there is a fog nothing is is to
be seen
1509 London, Saturday 17th
February 1900 to Alice Monet
“une brume exquise, et un splendide coucher de soleil; aujourd‟hui, pluie et brouillard”
→ an exquisite fog, and a splendid sunset; today, rain and fog
1517 London, Saturday 24th
February 1900 at 10 o’clock to Alice Monet
“un brouillard superbe” → the fog is superb
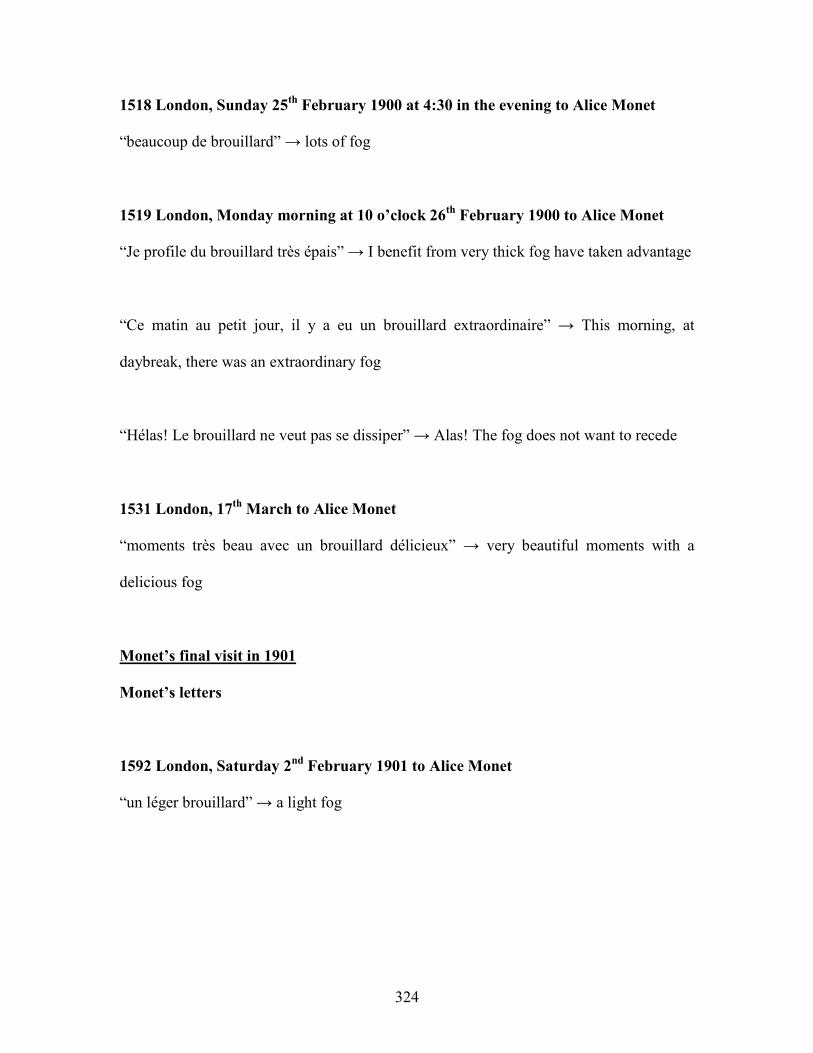
324
1518 London, Sunday 25th
February 1900 at 4:30 in the evening to Alice Monet
“beaucoup de brouillard” → lots of fog
1519 London, Monday morning at 10 o’clock 26th
February 1900 to Alice Monet
“Je profile du brouillard très épais” → I benefit from very thick fog have taken advantage
“Ce matin au petit jour, il y a eu un brouillard extraordinaire” → This morning, at
daybreak, there was an extraordinary fog
“Hélas! Le brouillard ne veut pas se dissiper” → Alas! The fog does not want to recede
1531 London, 17th
March to Alice Monet
“moments très beau avec un brouillard délicieux” → very beautiful moments with a
delicious fog
Monet’s final visit in 1901
Monet’s letters
1592 London, Saturday 2nd
February 1901 to Alice Monet
“un léger brouillard” → a light fog
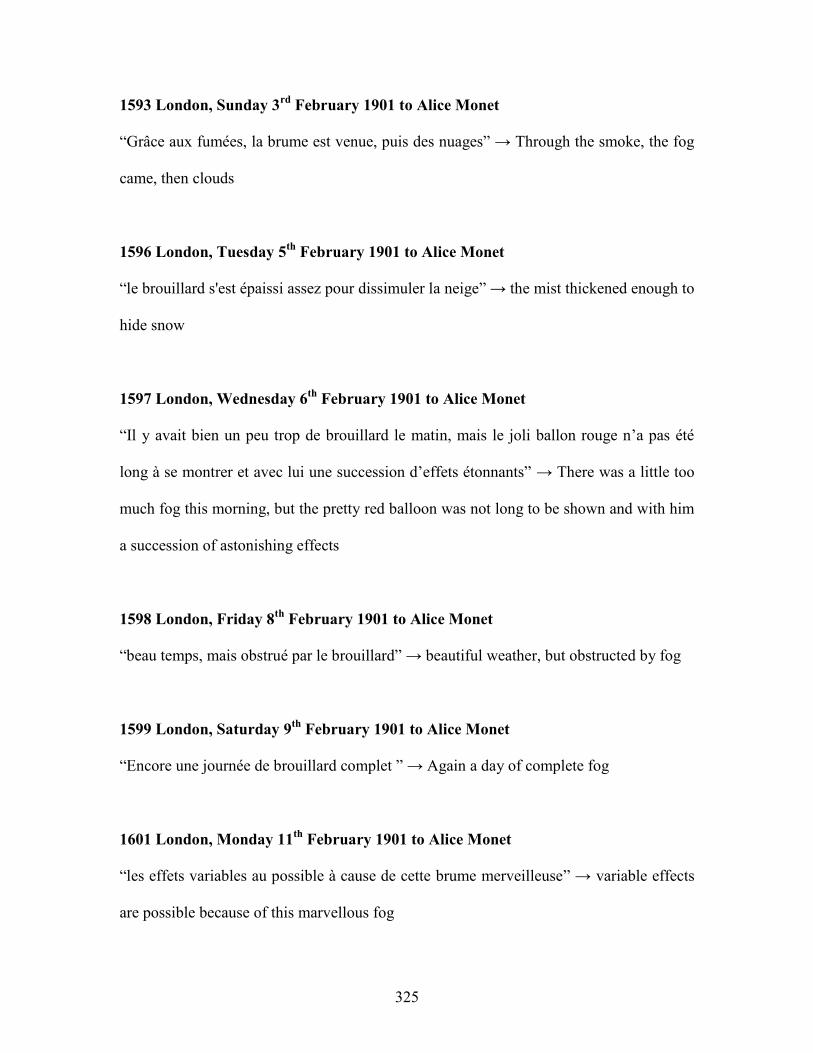
325
1593 London, Sunday 3rd
February 1901 to Alice Monet
“Grâce aux fumées, la brume est venue, puis des nuages” → Through the smoke, the fog
came, then clouds
1596 London, Tuesday 5th
February 1901 to Alice Monet
“le brouillard s'est épaissi assez pour dissimuler la neige” → the mist thickened enough to
hide snow
1597 London, Wednesday 6th
February 1901 to Alice Monet
“Il y avait bien un peu trop de brouillard le matin, mais le joli ballon rouge n‟a pas été
long à se montrer et avec lui une succession d‟effets étonnants” → There was a little too
much fog this morning, but the pretty red balloon was not long to be shown and with him
a succession of astonishing effects
1598 London, Friday 8th
February 1901 to Alice Monet
“beau temps, mais obstrué par le brouillard” → beautiful weather, but obstructed by fog
1599 London, Saturday 9th
February 1901 to Alice Monet
“Encore une journée de brouillard complet ” → Again a day of complete fog
1601 London, Monday 11th
February 1901 to Alice Monet
“les effets variables au possible à cause de cette brume merveilleuse” → variable effects
are possible because of this marvellous fog

326
1604 London, Thursday 14th
February 1901 to Alice Monet
“c‟est le brouillard qui s‟est levé en augmentant d‟intensité” → it is the fog which rose
with increasing intensity
1606a London, Sunday 17th
February 1901 to Alice Monet
“des bourrasques de neige, puis du soleil, du brouillard et du temps noir” → flurries of
snow, then sun, fog and black weather
1608a London, Tuesday morning 19th
February 1901 to Alice Monet
“à chaque pas je voyais de belles choses justement à cause de ce grand brouillard” →
with each step I precisely saw beautiful things because of this thick fog
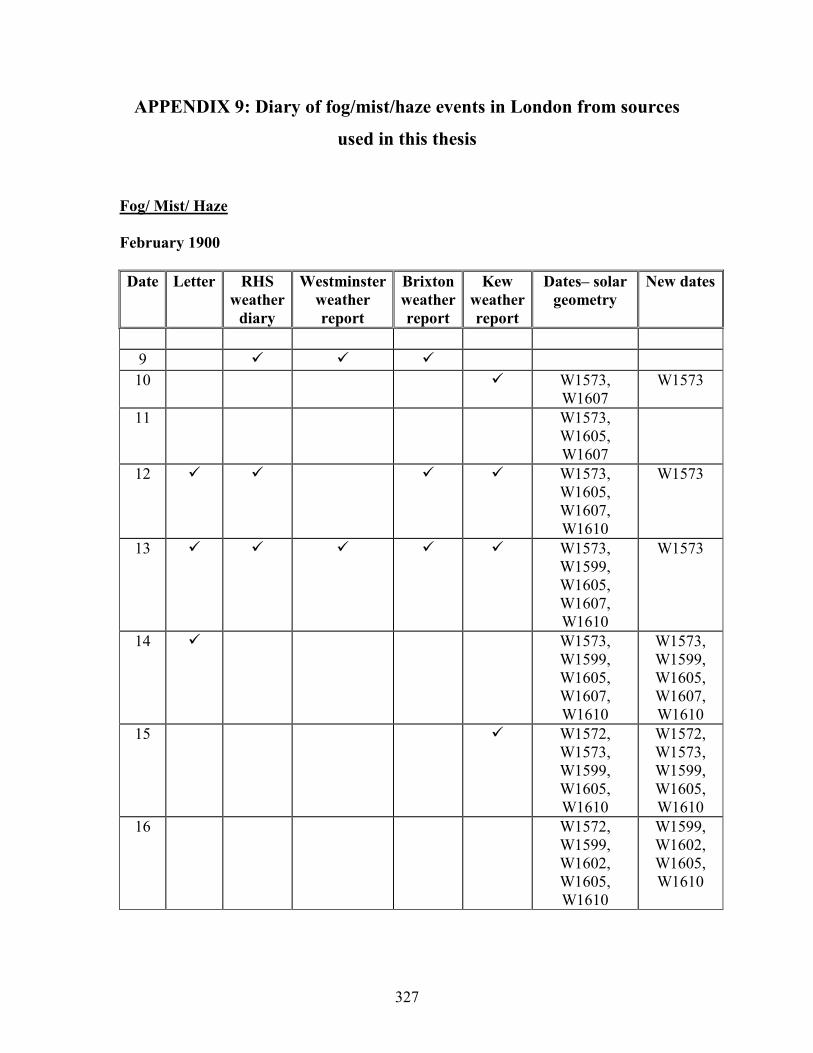
327
APPENDIX 9: Diary of fog/mist/haze events in London from sources
used in this thesis
Fog/ Mist/ Haze
February 1900
Date Letter RHS
weather
diary
Westminster
weather
report
Brixton
weather
report
Kew
weather
report
Dates– solar
geometry
New dates
9
10 W1573,
W1607
W1573
11 W1573,
W1605,
W1607
12 W1573,
W1605,
W1607,
W1610
W1573
13 W1573,
W1599,
W1605,
W1607,
W1610
W1573
14 W1573,
W1599,
W1605,
W1607,
W1610
W1573,
W1599,
W1605,
W1607,
W1610
15 W1572,
W1573,
W1599,
W1605,
W1610
W1572,
W1573,
W1599,
W1605,
W1610
16 W1572,
W1599,
W1602,
W1605,
W1610
W1599,
W1602,
W1605,
W1610

328
Date Letter RHS
weather
diary
Westminster
weather
report
Brixton
weather
report
Kew
weather
report
Dates– solar
geometry
New dates
17 W1572,
W1599,
W1602,
W1605,
W1610
W1572
18 W1572,
W1574,
W1599,
W1602,
W1605,
W1610
19 W1572,
W1574,
W1599,
W1602,
W1605,
W1606
W1599,
W1602,
W1605,
W1606
20 W1574,
W1599,
W1606
W1599,
W1606
21 W1574,
W1599,
W1606
W1599,
W1606
22 W1574,
W1604,
W1606
W1604,
W1606
23 W1574,
W1604,
W1606
W1604,
W1606
24 W1574,
W1604,
W1606
W1574,
W1604,
W1606
25 W1575,
W1604,
W1606
W1575
26 W1575,
W1604,
W1606
W1575,
W1606
27 W1575 W1575
28 W1575 W1575

329
March 1900
Date Letter RHS
weather
diary
Westminster
weather
report
Brixton
weather
report
Kew
weather
report
Dates – solar
geometry
New dates
1 W1575
3
5 W1563
6 W1563,
W1596
7 W1563,
W1596
8 W1596
9 W1596
10
11
17
20 W1597 W1597
21 W1597 W1597
22 W1597
23 W1597
24 W1597 W1597
25 W1597
29
30
31
April 1900
Date Letter RHS
weather
diary
Westminster
weather
report
Brixton
weather
report
Kew
weather
report
Dates – solar
geometry
New dates
1
2
3
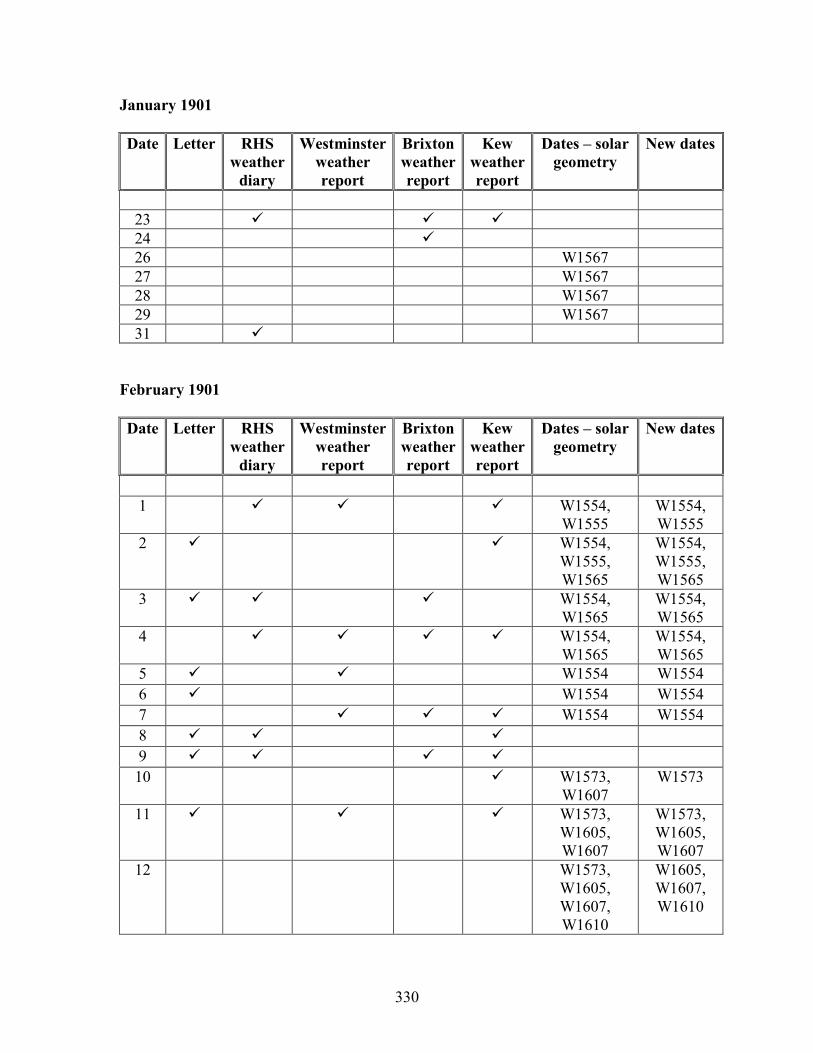
330
January 1901
Date Letter RHS
weather
diary
Westminster
weather
report
Brixton
weather
report
Kew
weather
report
Dates – solar
geometry
New dates
23
24
26 W1567
27 W1567
28 W1567
29 W1567
31
February 1901
Date Letter RHS
weather
diary
Westminster
weather
report
Brixton
weather
report
Kew
weather
report
Dates – solar
geometry
New dates
1 W1554,
W1555
W1554,
W1555
2 W1554,
W1555,
W1565
W1554,
W1555,
W1565
3 W1554,
W1565
W1554,
W1565
4 W1554,
W1565
W1554,
W1565
5 W1554 W1554
6 W1554 W1554
7 W1554 W1554
8
9
10 W1573,
W1607
W1573
11 W1573,
W1605,
W1607
W1573,
W1605,
W1607
12 W1573,
W1605,
W1607,
W1610
W1605,
W1607,
W1610

331
Date Letter RHS
weather
diary
Westminster
weather
report
Brixton
weather
report
Kew
weather
report
Dates – solar
geometry
New dates
13 W1573,
W1599,
W1605,
W1607,
W1610
W1573,
W1599,
W1605,
W1607,
W1610
14 W1573,
W1599,
W1605,
W1607,
W1610
W1573,
W1599,
W1605,
W1607,
W1610
15 W1572,
W1573,
W1599,
W1605,
W1610
W1572,
W1573
16 W1572,
W1599,
W1602,
W1605,
W1610
17 W1572,
W1599,
W1602,
W1605,
W1610
W1572
18 W1572,
W1574,
W1599,
W1602,
W1605,
W1610
W1574
19 W1572,
W1574,
W1599,
W1602,
W1605,
W1606
W1574
20 W1574,
W1599,
W1606
W1574

332
Date Letter RHS
weather
diary
Westminster
weather
report
Brixton
weather
report
Kew
weather
report
Dates – solar
geometry
New dates
21 W1574,
W1599,
W1606
W1574
22 W1574,
W1604,
W1606
23 W1574,
W1604,
W1606
24 W1574,
W1604,
W1606
25 W1575,
W1604,
W1606
26 W1575,
W1604,
W1606
27 W1575
28 W1575
March 1901
Date Letter RHS
weather
diary
Westminster
weather
report
Brixton
weather
report
Kew
weather
report
Dates – solar
geometry
New dates
1 W1575
5 W1563
6 W1563,
W1596
7 W1563,
W1596
8 W1596
20 W1597
21 W1597
22 W1597
23 W1597
24 W1597

333
Date Letter RHS
weather
diary
Westminster
weather
report
Brixton
weather
report
Kew
weather
report
Dates – solar
geometry
New dates
25 W1597
Monet’s paintings vs. Royal Horticultural Society’s weather diaries
February 1900
Date Painting
22 W1574 d
23 W1574 d
28 W1575
March 1900
Date Painting
1 W1575 d
6 W1563 d
January 1901
Date Painting
28 W1567 d
February 1901
Date Painting
1 W1554, W1555
2 W1554 d, W1555 d, W1565 d
3 W1554 d, W1565
4 W1554
6 W1554 d
18 W1572 d, W1573 d
20 W1574 d
22 W1574 d
23 W1574 d

334
Date Painting
27 W1575 d
March 1901
Date Painting
1 W1575 d
6 W1563 d
Monet’s paintings vs. weather reports
February 1900
Date Painting
15 W1573
17 W1572, W1573
22 W1574 o
27 W1575
28 W1575
March 1900
Date Painting
1 W1575 o
6 W1565 o g
January 1901
Date Painting
28 W1567 o

335
February 1901
Date Painting
1 W1554, W1555
2 W1554, W1555, W1565
3 W1554, W1565
4 W1554
5 W1554
6 W1554 o g
15 W1573
16 W1572 o d, W1573 o d
17 W1573 o
18 W1572, W1573
20 W1574
21 W1574
22 W1574 o g
23 W1574 o
27 W1575 o
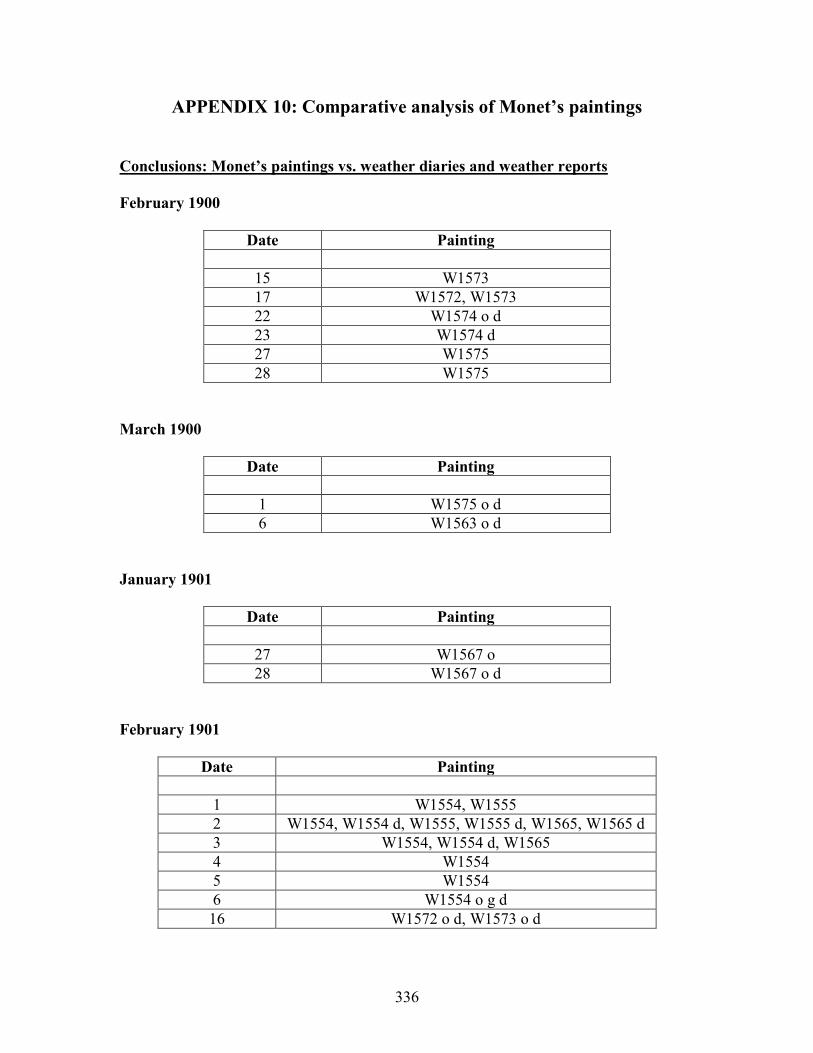
336
APPENDIX 10: Comparative analysis of Monet’s paintings
Conclusions: Monet’s paintings vs. weather diaries and weather reports
February 1900
Date Painting
15 W1573
17 W1572, W1573
22 W1574 o d
23 W1574 d
27 W1575
28 W1575
March 1900
Date Painting
1 W1575 o d
6 W1563 o d
January 1901
Date Painting
27 W1567 o
28 W1567 o d
February 1901
Date Painting
1 W1554, W1555
2 W1554, W1554 d, W1555, W1555 d, W1565, W1565 d
3 W1554, W1554 d, W1565
4 W1554
5 W1554
6 W1554 o g d
16 W1572 o d, W1573 o d

337
Date Painting
17 W1573 o
18 W1572 d, W1573 d
20 W1574 d
22 W1574 o g d
23 W1574 o d
27 W1575 o d
March 1901
Date Painting
1 W1575 d
6 W1563 o d
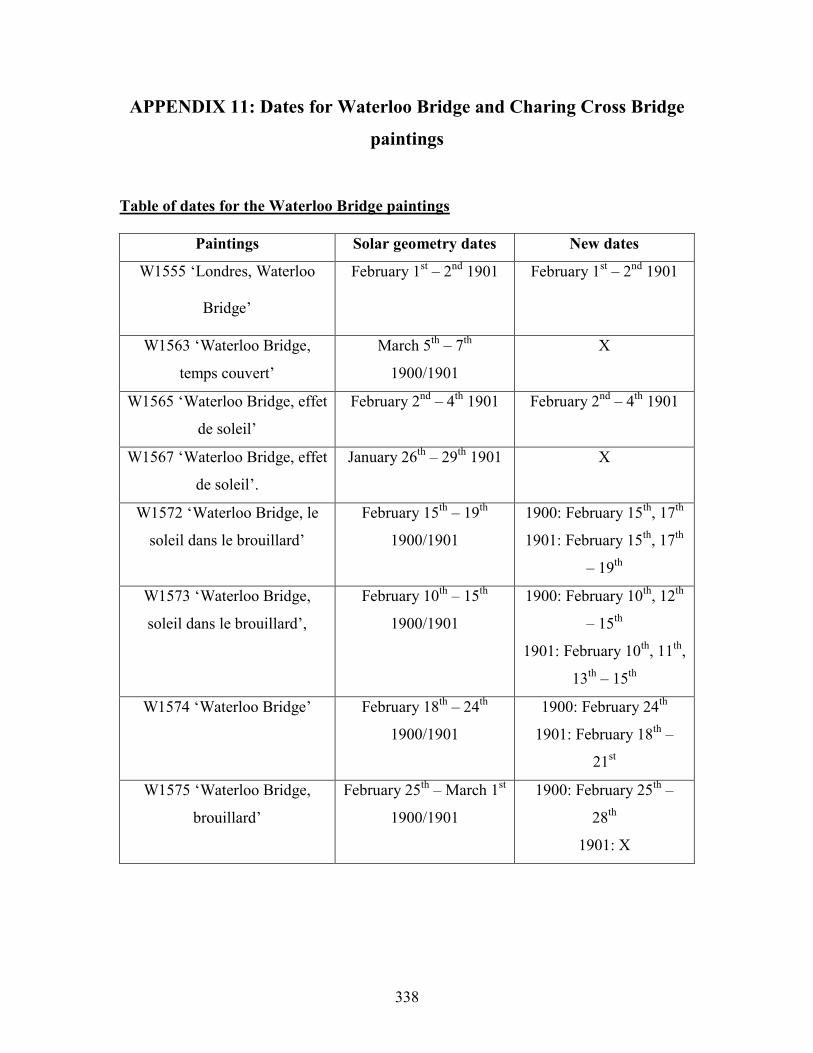
338
APPENDIX 11: Dates for Waterloo Bridge and Charing Cross Bridge
paintings
Table of dates for the Waterloo Bridge paintings
Paintings Solar geometry dates New dates
W1555 „Londres, Waterloo
Bridge‟
February 1st – 2
nd 1901 February 1
st – 2
nd 1901
W1563 „Waterloo Bridge,
temps couvert‟
March 5th
– 7th
1900/1901
X
W1565 „Waterloo Bridge, effet
de soleil‟
February 2nd
– 4th
1901 February 2nd
– 4th
1901
W1567 „Waterloo Bridge, effet
de soleil‟.
January 26th
– 29th
1901 X
W1572 „Waterloo Bridge, le
soleil dans le brouillard‟
February 15th
– 19th
1900/1901
1900: February 15th
, 17th
1901: February 15th
, 17th
– 19th
W1573 „Waterloo Bridge,
soleil dans le brouillard‟,
February 10th
– 15th
1900/1901
1900: February 10th
, 12th
– 15th
1901: February 10th
, 11th
,
13th
– 15th
W1574 „Waterloo Bridge‟ February 18th
– 24th
1900/1901
1900: February 24th
1901: February 18th
–
21st
W1575 „Waterloo Bridge,
brouillard‟
February 25th
– March 1st
1900/1901
1900: February 25th
–
28th
1901: X
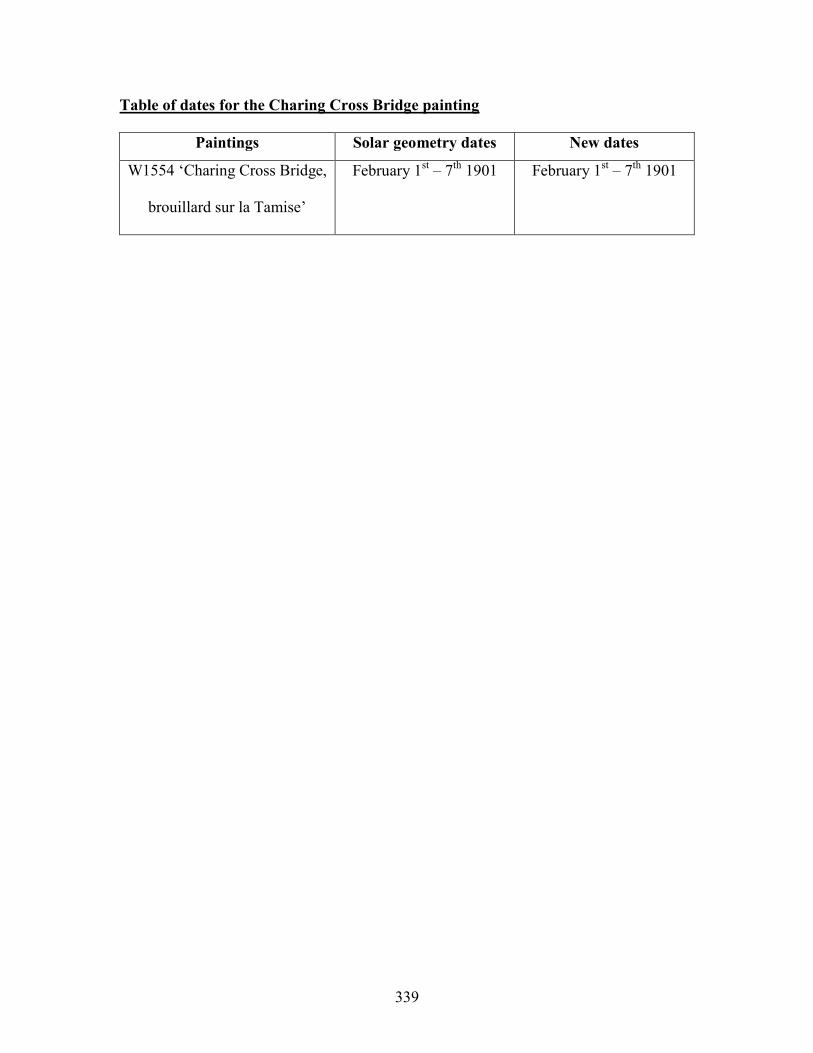
339
Table of dates for the Charing Cross Bridge painting
Paintings Solar geometry dates New dates
W1554 „Charing Cross Bridge,
brouillard sur la Tamise‟
February 1st – 7
th 1901 February 1
st – 7
th 1901
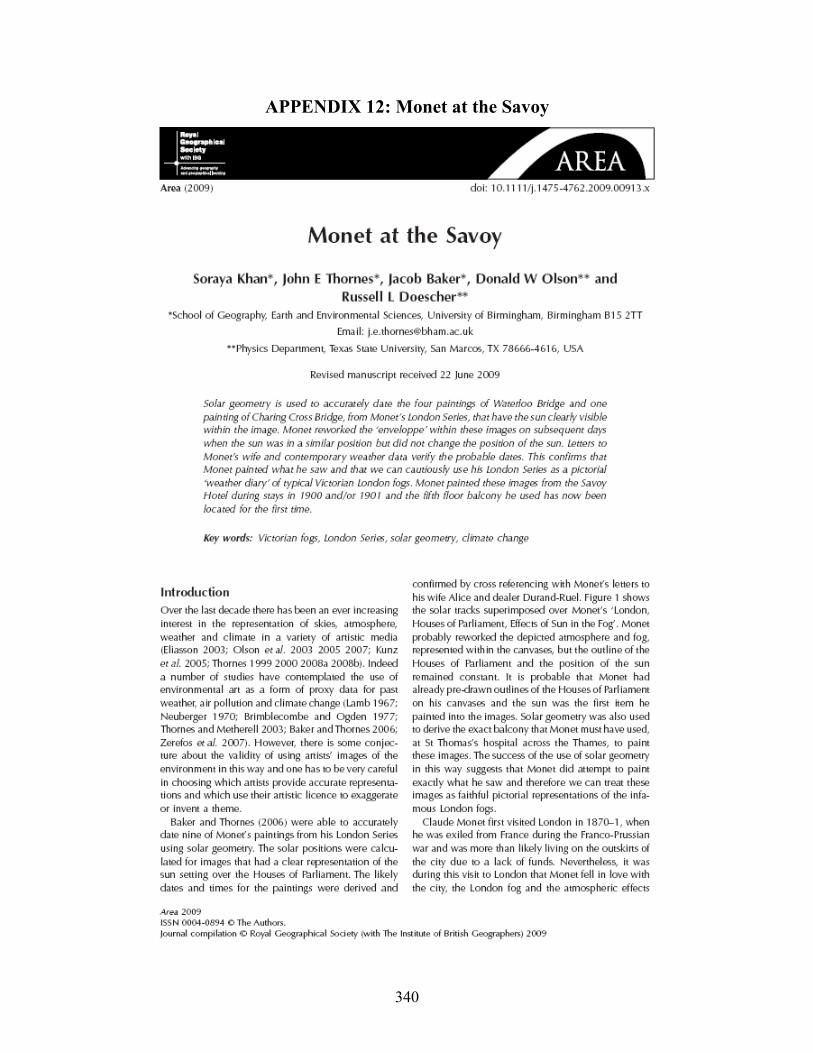
340
APPENDIX 12: Monet at the Savoy

341

342

343

344
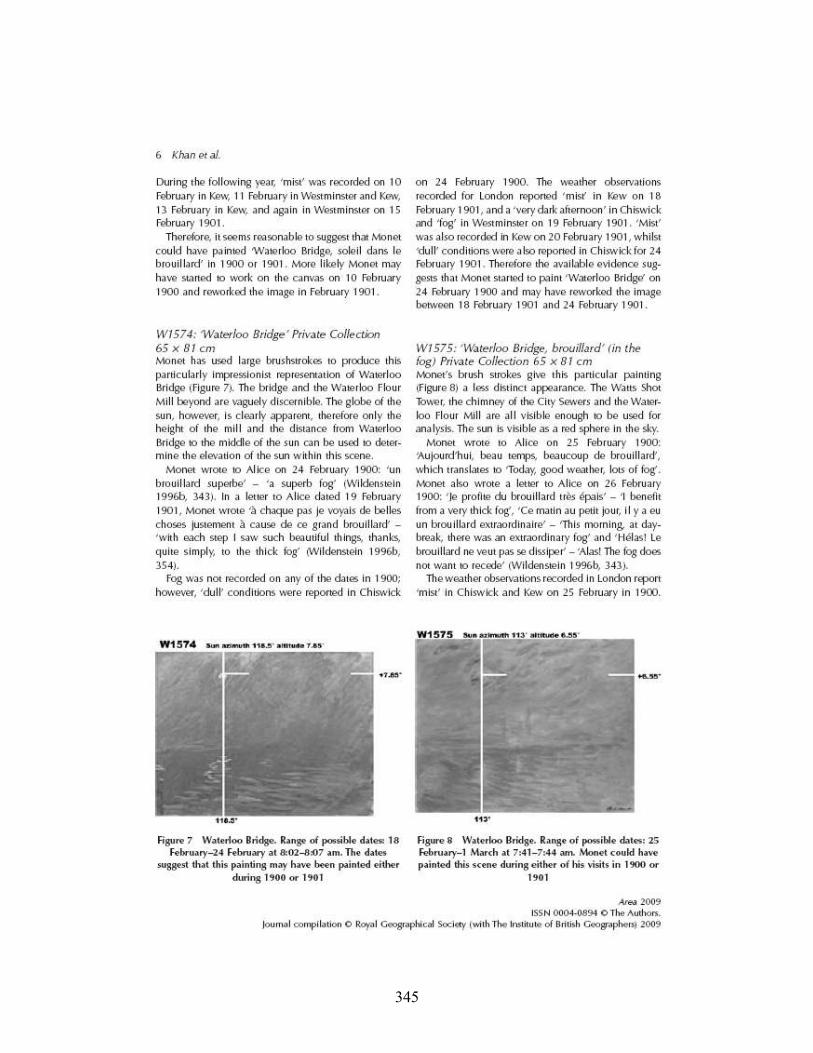
345

346

347

348