monarques gold corporation technical report...
TRANSCRIPT
October 25, 2017
RPA T55 University Ave. Suite 501 I Toronto, ON, Canada M5J 2H7 I + 1 (416) 947 0907 www.rpacan.com
MONARQUES GOLD CORPORATION
TECHNICAL REPORT ONTHE WASAMAC PROJECT,ROUYN-NORANDA,QUEBÉC, CANADA
NI 43-101 Report
Qualified Person:Tudorel Ciuculescu, M.Sc., P.Geo.
Report Control Form
Document Title Technical Report on the Wasamac Project, Rouyn-Noranda, Quebec, Canada
Client Name & Address Monarques Gold Corporation 1, Place Ville-Marie Bureau 2901 Montréal, QC H3B 0E9
Document Reference Project #2869
Status & Issue No.
FINAL Version
Issue Date
Lead Author Tudorel Ciuculescu, P.Geo. (Signed)
Peer Reviewer David Ross, P.Geo. (Signed)
Project Manager Approval David Ross, P.Geo. (Signed)
Project Director Approval Luke Evans, P.Eng. (Signed)
Report Distribution Name No. of Copies
Client
RPA Filing 1 (project box)
Roscoe Postle Associates Inc. 1305 Boulevard Lebourgneuf, Suite 302
Québec, QC G2K 2E4 Canada
T (418)263-4462 [email protected]
www.rpacan.com
Monarques Gold Corporation – Wasamac Project, Project #2869
Technical Report NI 43-101 – October 25, 2017 Page i
TABLE OF CONTENTS PAGE
1 SUMMARY ...................................................................................................................... 1-1 Executive Summary ....................................................................................................... 1-1 Technical Summary ....................................................................................................... 1-5
2 INTRODUCTION ............................................................................................................. 2-1
3 RELIANCE ON OTHER EXPERTS ................................................................................. 3-1
4 PROPERTY DESCRIPTION AND LOCATION ................................................................ 4-1 Location and Land Tenure ............................................................................................. 4-1 Mineral Rights ................................................................................................................ 4-2 Royalties and Other Encumbrances ............................................................................... 4-3 Surface Rights ............................................................................................................... 4-3 Permitting ...................................................................................................................... 4-3 Environmental Liabilities ................................................................................................ 4-3
5 ACCESSIBILITY, CLIMATE, LOCAL RESOURCES, INFRASTRUCTURE AND PHYSIOGRAPHY ............................................................................................................... 5-1
6 HISTORY ........................................................................................................................ 6-1
7 GEOLOGICAL SETTING AND MINERALIZATION .......................................................... 7-1 Regional Geology .......................................................................................................... 7-1 Local and Property Geology........................................................................................... 7-2 Mineralization ................................................................................................................ 7-5
8 DEPOSIT TYPES ............................................................................................................ 8-1
9 EXPLORATION ............................................................................................................... 9-1
10 DRILLING .................................................................................................................... 10-1 Drilling Programs ......................................................................................................... 10-1 Drill Hole Surveys ........................................................................................................ 10-3 Core Recovery and RQD Data ..................................................................................... 10-3
11 SAMPLE PREPARATION, ANALYSES AND SECURITY ............................................ 11-1 Core Logging and Sampling Procedures...................................................................... 11-1 Sample Preparation and Assaying Procedures ............................................................ 11-1 Density Measurements ................................................................................................ 11-3 Quality Assurance/Quality Control Procedures ............................................................ 11-3
12 DATA VERIFICATION ................................................................................................. 12-1
13 MINERAL PROCESSING AND METALLURGICAL TESTING ..................................... 13-1 Metallurgical Testwork Programs ................................................................................. 13-1 Testwork Interpretation and Conclusions ..................................................................... 13-4 Testwork Recommendations ........................................................................................ 13-5
14 MINERAL RESOURCE ESTIMATE ............................................................................. 14-1
www.rpacan.com
Monarques Gold Corporation – Wasamac Project, Project #2869
Technical Report NI 43-101 – October 25, 2017 Page ii
15 MINERAL RESERVE ESTIMATE ................................................................................ 15-1
16 MINING METHODS ..................................................................................................... 16-1
17 RECOVERY METHODS .............................................................................................. 17-1
18 PROJECT INFRASTRUCTURE .................................................................................. 18-1
19 MARKET STUDIES AND CONTRACTS ...................................................................... 19-1
20 ENVIRONMENTAL STUDIES, PERMITTING, AND SOCIAL OR COMMUNITY IMPACT ......................................................................................................................................... 20-1
21 CAPITAL AND OPERATING COSTS .......................................................................... 21-1
22 ECONOMIC ANALYSIS............................................................................................... 22-1
23 ADJACENT PROPERTIES .......................................................................................... 23-1
24 OTHER RELEVANT DATA AND INFORMATION ........................................................ 24-1
25 INTERPRETATION AND CONCLUSIONS .................................................................. 25-1
26 RECOMMENDATIONS................................................................................................ 26-1
27 REFERENCES ............................................................................................................ 27-1
28 DATE AND SIGNATURE PAGE .................................................................................. 28-1
29 CERTIFICATE OF QUALIFIED PERSON .................................................................... 29-1
LIST OF TABLES PAGE
Table 1-1 Mineral Resource Statement as of October 20, 2017 ........................................ 1-2 Table 1-2 Proposed Budget – Phase I .............................................................................. 1-4 Table 1-3 Proposed Budget – Phase II ............................................................................. 1-5 Table 4-1 Mining Titles ..................................................................................................... 4-2 Table 6-1 Historical Gold Production – Wasamac Mines Ltd. ............................................ 6-2 Table 11-1 CRM Result Statistics ................................................................................... 11-5 Table 11-2 Pulp Duplicate Statistics ............................................................................. 11-11 Table 11-3 Reject Re-Assaying Statistics ..................................................................... 11-11 Table 11-4 CRM Nominal Assay Values ....................................................................... 11-13 Table 11-5 2012 CRM Results Summary ...................................................................... 11-14 Table 12-1 Surface and Underground Diamond Drill Holes in Wasamac Database ........ 12-1 Table 13-1 Grindability Results for the Main Zone and Zones 1, 2 and 3 Samples ......... 13-2 Table 13-2 Summary of Whole Rock Leaching Test Results .......................................... 13-3 Table 13-3 Summary of Combined Flotation/Leaching Tests .......................................... 13-4 Table 14-1 Mineral Resource Statement as of October 20, 2017 .................................... 14-1 Table 14-2 Drift Height Summary .................................................................................... 14-3 Table 14-3 Assay Descriptive Statistics .......................................................................... 14-6 Table 14-4 Decile Analysis ............................................................................................. 14-9 Table 14-5 Assay Descriptive Statistics – Gold and Capped Gold .................................. 14-9 Table 14-6 Composites Descriptive Statistics ............................................................... 14-11 Table 14-7 Block Model Setup ...................................................................................... 14-15 Table 14-8 Sample Selection and Search Ellipse Geometry ......................................... 14-16
www.rpacan.com
Monarques Gold Corporation – Wasamac Project, Project #2869 Technical Report NI 43-101 – October 25, 2017 Page iii
Table 14-9 Cut-off Grade Parameters and Assumptions ............................................... 14-24 Table 14-10 Tonnage and Grades by Cut-off Grade ..................................................... 14-25 Table 14-11 Comparison with Previous Mineral Resource Estimate ............................. 14-28 Table 26-1 Proposed Budget – Phase I .......................................................................... 26-1 Table 26-2 Proposed Budget – Phase II ......................................................................... 26-2
LIST OF FIGURES PAGE
Figure 4-1 Location Map ................................................................................................... 4-4 Figure 4-2 Property Map ................................................................................................... 4-5 Figure 4-3 Wasamac Claim Map....................................................................................... 4-6 Figure 7-1 Property Geology and Mineralized Zones ........................................................ 7-4 Figure 7-2 Relationship Between Main Lithologies: The Wasa Shear Zone and Mineralized Zones at 500 m Below Surface ........................................................................................... 7-6 Figure 7-3 Main Zone Geological Section ......................................................................... 7-7 Figure 7-4 Zone 1 Geological Section ............................................................................... 7-9 Figure 7-5 Zone 2 Geological Section ............................................................................. 7-10 Figure 7-6 Core Photographs of the Progressive Deformation and Alteration of the Dykes Inside the Wasa Shear Zone. ........................................................................................... 7-11 Figure 10-1 Drilling on Property and Surrounding Area ................................................... 10-4 Figure 10-2 Vertical Composite Long Section with the Main, 1, 2, and 3 Zones Hanging Wall RQD Data (10 m Above the Hanging Wall) ....................................................................... 10-5 Figure 11-1 Expert Laboratory Results for Standard SG56 ............................................. 11-6 Figure 11-2 Expert Laboratory Results for Standard SH55 ............................................. 11-6 Figure 11-3 Expert Laboratory Results for Standard SI42 ............................................... 11-7 Figure 11-4 Expert Laboratory Results for Standard SE58 ............................................. 11-7 Figure 11-5 Expert Laboratory Results for Standard SI54 ............................................... 11-8 Figure 11-6 Expert Laboratory Results for Standard SL46 .............................................. 11-8 Figure 11-7 Expert Laboratory Results for Standard SL61 .............................................. 11-9 Figure 11-8 Expert Laboratory Results for Standard SP37 ............................................. 11-9 Figure 11-9 Expert Laboratory Results for Blank Samples ............................................ 11-10 Figure 11-10 Results of Pulp Re-Assaying ................................................................... 11-11 Figure 11-11 Results of Reject Re-Assaying................................................................. 11-12 Figure 11-12 Blank assays ........................................................................................... 11-13 Figure 11-13 CRM Assay – SL61 ................................................................................. 11-14 Figure 11-14 CRM assay – SG56 ................................................................................. 11-15 Figure 11-15 Rejects - External Laboratory Check ....................................................... 11-16 Figure 11-16 Pulps - External Laboratory Check .......................................................... 11-17 Figure 14-1 Longitudinal Vertical Section.......................... .............................................. 14-4 Figure 14-2 Underground Development and Mined-Out Stopes...................................... 14-5 Figure 14-3 Resource Assays Histogram ........................................................................ 14-7 Figure 14-4 Resource Assays Log Probability Plot ......................................................... 14-8 Figure 14-5 Sample Length Histogram ......................................................................... 14-10 Figure 14-6 Variogram Models - Main Zone .................................................................. 14-12 Figure 14-7 Variogram Models - Zones 1 and 2 ............................................................ 14-12 Figure 14-8 Inclined Section Grade Thickness Trend Plot ............................................ 14-14 Figure 14-9 Year of Drilling Supporting the Mineral Resource Estimate ........................ 14-17 Figure 14-10 Typical Cross Section (3020E) ................................................................ 14-19
www.rpacan.com
Monarques Gold Corporation – Wasamac Project, Project #2869 Technical Report NI 43-101 – October 25, 2017 Page iv
Figure 14-11 Typical Plan View – 4990 m ..................................................................... 14-20 Figure 14-12 Block Grades - Longitudinal Section......................................................... 14-21 Figure 14-13 Longitudinal Section with Classified Blocks.............................................. 14-23 Figure 14-14 Grade-Tonnage Curves – Measured and Indicated Resources................ 14-26 Figure 14-15 Grade-Tonnage Curves – Inferred Resources ......................................... 14-27 Figure 23-1 Mineral Occurrences Near the Wasamac Property ...................................... 23-4
www.rpacan.com
Monarques Gold Corporation – Wasamac Project, Project #2869
Technical Report NI 43-101 – October 25, 2017 Page 1-1
1 SUMMARY EXECUTIVE SUMMARY Roscoe Postle Associates Inc. (RPA) was retained by Monarques Gold Corporation
(Monarques) to update the Mineral Resource estimate and prepare an independent Technical
Report on the Wasamac Project (the Project). This Technical Report conforms to National
Instrument 43-101 Standards of Disclosure for Mineral Projects (NI 43-101). RPA visited the
property on September 29 to 30, 2017.
The Wasamac property is located approximately 15 km west-southwest of Rouyn-Noranda in
Beauchastel Township and consists of a contiguous block comprising three mining leases
covering 757.65 ha and eleven mining claims covering 391.68 ha for a total area of 1,149.33
ha.
Monarques is a Montreal-based gold exploration company formed in February 2011 (as
Monarques Resources Inc.) and is a reporting issuer in British Columbia, Alberta, Ontario, and
Quebec. The common shares of Monarques trade on the TSX Venture Exchange and the
company is under the jurisdiction of the Autorité des marchés financiers du Québec.
On September 11, 2017, Monarques announced that it had entered into a definitive agreement
with Richmont Mines Inc. (Richmont) whereby it would acquire all of Richmont’s mining and
exploration assets in Quebec, including the producing Beaufor Mine and the Wasamac
property, in exchange for 19.9% of its diluted issued and outstanding common shares. On
October 2, 2017, Monarques announced that the transaction had closed.
The Project is at the resource development stage. A Preliminary Economic Assessment (PEA)
was completed by RPA, Genivar Inc. (Genivar), and BBA Inc. (BBA) in 2012 but is no longer
considered current due to changes in gold price, costs, and the Mineral Resource.
Historical production from the Wasamac Mine from 1965 to 1971 totalled 1.9 Mt at an average
grade of 4.16 g/t Au for a total of 253,000 ounces of gold.
Since entering into an agreement to acquire the Project, Monarques has performed no work.
www.rpacan.com
Monarques Gold Corporation – Wasamac Project, Project #2869
Technical Report NI 43-101 – October 25, 2017 Page 1-2
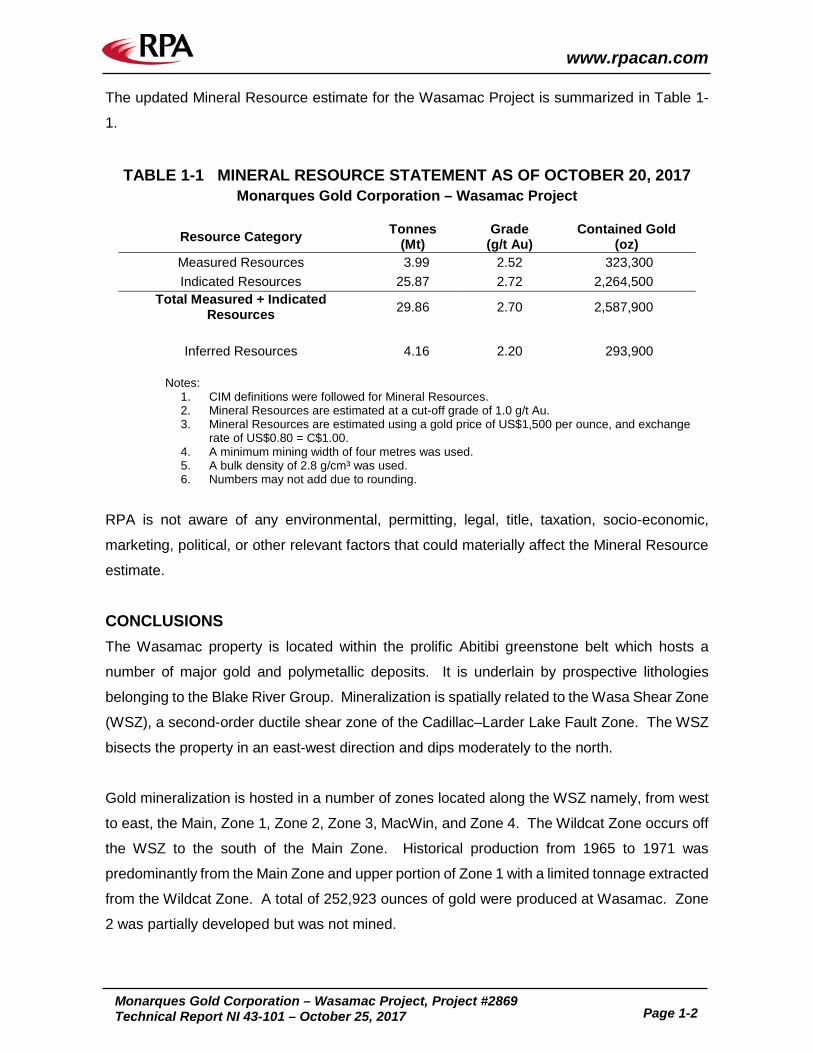
The updated Mineral Resource estimate for the Wasamac Project is summarized in Table 1-
1.
TABLE 1-1 MINERAL RESOURCE STATEMENT AS OF OCTOBER 20, 2017 Monarques Gold Corporation – Wasamac Project
Resource Category Tonnes (Mt)
Grade (g/t Au)
Contained Gold (oz)
Measured Resources 3.99 2.52 323,300 Indicated Resources 25.87 2.72 2,264,500
Total Measured + Indicated Resources 29.86 2.70 2,587,900
Inferred Resources 4.16 2.20 293,900
Notes:
1. CIM definitions were followed for Mineral Resources. 2. Mineral Resources are estimated at a cut-off grade of 1.0 g/t Au. 3. Mineral Resources are estimated using a gold price of US$1,500 per ounce, and exchange
rate of US$0.80 = C$1.00. 4. A minimum mining width of four metres was used. 5. A bulk density of 2.8 g/cm³ was used. 6. Numbers may not add due to rounding.
RPA is not aware of any environmental, permitting, legal, title, taxation, socio-economic,
marketing, political, or other relevant factors that could materially affect the Mineral Resource
estimate.
CONCLUSIONS The Wasamac property is located within the prolific Abitibi greenstone belt which hosts a
number of major gold and polymetallic deposits. It is underlain by prospective lithologies
belonging to the Blake River Group. Mineralization is spatially related to the Wasa Shear Zone
(WSZ), a second-order ductile shear zone of the Cadillac–Larder Lake Fault Zone. The WSZ
bisects the property in an east-west direction and dips moderately to the north.
Gold mineralization is hosted in a number of zones located along the WSZ namely, from west
to east, the Main, Zone 1, Zone 2, Zone 3, MacWin, and Zone 4. The Wildcat Zone occurs off
the WSZ to the south of the Main Zone. Historical production from 1965 to 1971 was
predominantly from the Main Zone and upper portion of Zone 1 with a limited tonnage extracted
from the Wildcat Zone. A total of 252,923 ounces of gold were produced at Wasamac. Zone
2 was partially developed but was not mined.
www.rpacan.com
Monarques Gold Corporation – Wasamac Project, Project #2869
Technical Report NI 43-101 – October 25, 2017 Page 1-3
RPA updated the Mineral Resource estimate using both surface and underground drilling and
based on the assumption that the deposit would potentially be developed and mined using
underground mining methods. At a cut-off grade of 1.0 g/t Au, RPA estimated 3.99 Mt at an
average grade of 2.52 g/t Au, containing 323,300 ounces in the Measured category, and 25.87
Mt at an average grade of 2.72 g/t Au, containing 2,264,500 ounces in the Indicated category.
An additional 4.16 Mt at an average grade of 2.20 g/t Au, containing 293,900 ounces are
estimated in the Inferred category.
The estimate was supported by a block model and was constrained with mineralized
wireframes capturing mineralized intercepts with a nominal grade of 1.0 g/t Au over a minimum
thickness of four metres. Erratic higher-grade samples were capped at 35 g/t Au prior to
compositing to two metre long intervals. Block gold grade was estimated using an inverse
distance to the power three (ID3) interpolation method.
The current Mineral Resource estimate reflects a number of changes, including exclusion of
previous resources, addition of new resources, a lower cut-off grade, and classification
upgrade of Inferred Mineral Resources to the Indicated category.
Drilling to date indicates that the Main Zone is open to the east and at depth. Zone 2 and Zone
3 are also open at depth.
The Property benefits from significant infrastructure including proximity to a major mining
centre in a mining friendly jurisdiction, underground openings that could be re-developed, road
access, access to the provincial power grid, and a restored tailings disposal area.
RPA is of the opinion that the Wasamac property hosts a significant gold deposit and that the
Project has good exploration potential which warrants additional exploration and technical
studies.
RECOMMENDATIONS RPA has reviewed and concurs with Monarques’ proposed exploration programs and budgets.
Phase I of the recommended work program will include:
• An exploration potential study to determine the minimum grade, thickness, and tonnage for new targets
www.rpacan.com
Monarques Gold Corporation – Wasamac Project, Project #2869
Technical Report NI 43-101 – October 25, 2017 Page 1-4
• A drill hole targeting exercise to optimize future drilling programs with the objective of upgrading areas of Inferred Resources to Indicated Resources, and extending the Mineral Resource to areas which remain open
• An investigation into the Horne Creek Fault and its potential control on the Wasamac deposit
• Testing of advanced 3D modelling techniques based on the current database
• GIS database compilation of all available and relevant data
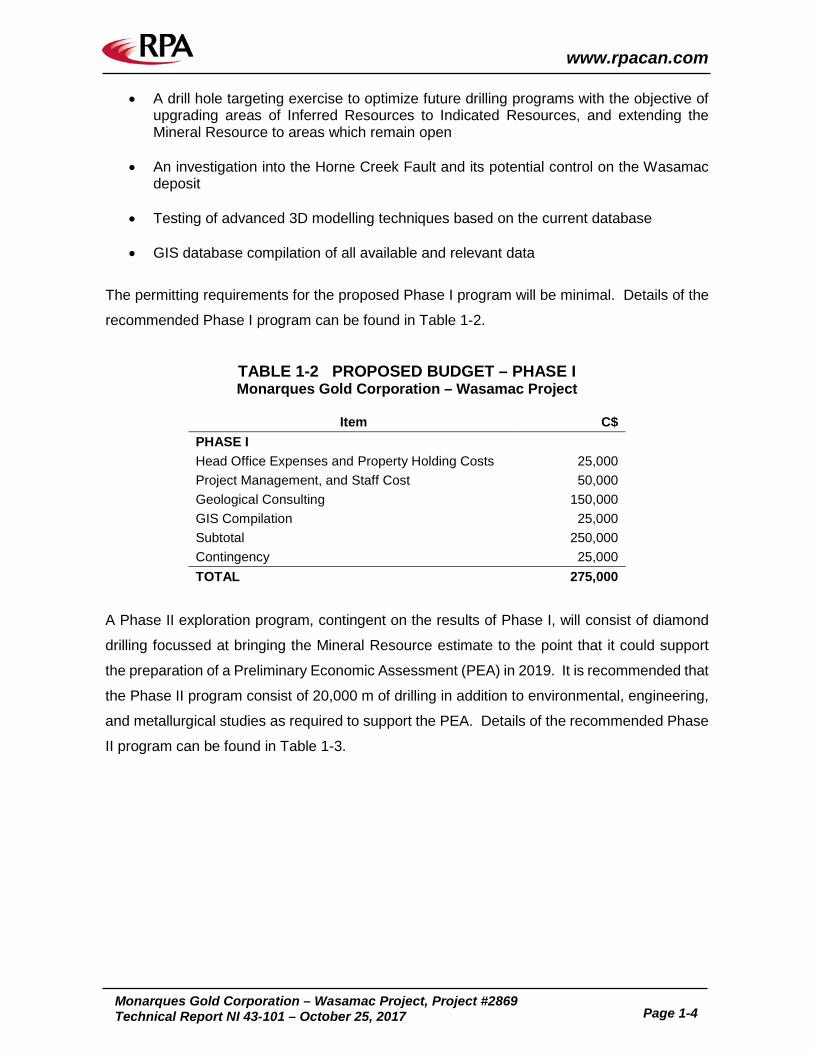
The permitting requirements for the proposed Phase I program will be minimal. Details of the
recommended Phase I program can be found in Table 1-2.
TABLE 1-2 PROPOSED BUDGET – PHASE I Monarques Gold Corporation – Wasamac Project
Item C$
PHASE I Head Office Expenses and Property Holding Costs 25,000 Project Management, and Staff Cost 50,000 Geological Consulting 150,000 GIS Compilation 25,000 Subtotal 250,000 Contingency 25,000 TOTAL 275,000
A Phase II exploration program, contingent on the results of Phase I, will consist of diamond
drilling focussed at bringing the Mineral Resource estimate to the point that it could support
the preparation of a Preliminary Economic Assessment (PEA) in 2019. It is recommended that
the Phase II program consist of 20,000 m of drilling in addition to environmental, engineering,
and metallurgical studies as required to support the PEA. Details of the recommended Phase
II program can be found in Table 1-3.
www.rpacan.com
Monarques Gold Corporation – Wasamac Project, Project #2869
Technical Report NI 43-101 – October 25, 2017 Page 1-5
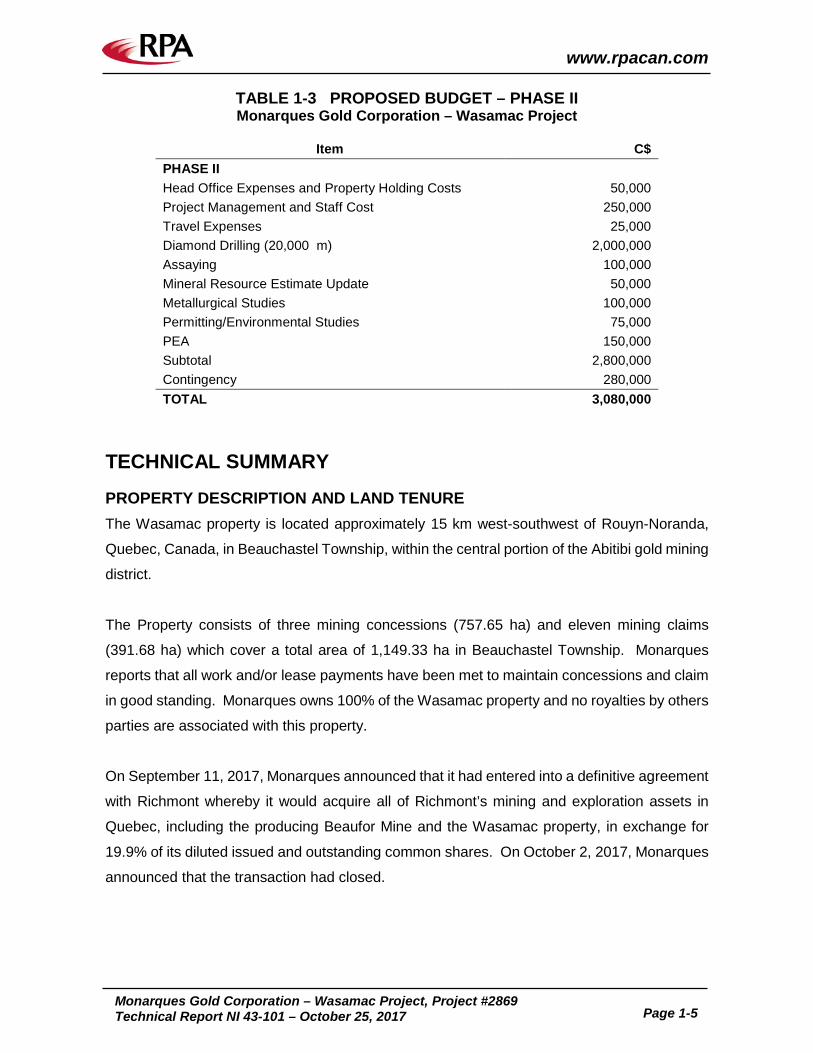
TABLE 1-3 PROPOSED BUDGET – PHASE II Monarques Gold Corporation – Wasamac Project
Item C$
PHASE II Head Office Expenses and Property Holding Costs 50,000 Project Management and Staff Cost 250,000 Travel Expenses 25,000 Diamond Drilling (20,000 m) 2,000,000 Assaying 100,000 Mineral Resource Estimate Update 50,000 Metallurgical Studies 100,000 Permitting/Environmental Studies 75,000 PEA 150,000 Subtotal 2,800,000 Contingency 280,000 TOTAL 3,080,000
TECHNICAL SUMMARY
PROPERTY DESCRIPTION AND LAND TENURE The Wasamac property is located approximately 15 km west-southwest of Rouyn-Noranda,
Quebec, Canada, in Beauchastel Township, within the central portion of the Abitibi gold mining
district.
The Property consists of three mining concessions (757.65 ha) and eleven mining claims
(391.68 ha) which cover a total area of 1,149.33 ha in Beauchastel Township. Monarques
reports that all work and/or lease payments have been met to maintain concessions and claim
in good standing. Monarques owns 100% of the Wasamac property and no royalties by others
parties are associated with this property.
On September 11, 2017, Monarques announced that it had entered into a definitive agreement
with Richmont whereby it would acquire all of Richmont’s mining and exploration assets in
Quebec, including the producing Beaufor Mine and the Wasamac property, in exchange for
19.9% of its diluted issued and outstanding common shares. On October 2, 2017, Monarques
announced that the transaction had closed.
www.rpacan.com
Monarques Gold Corporation – Wasamac Project, Project #2869
Technical Report NI 43-101 – October 25, 2017 Page 1-6
EXISTING INFRASTRUCTURE The Project is accessible from Provincial Highway 117, which connects Rouyn-Noranda to the
community of Arntfield. Rouyn-Noranda (population 41,000) is a long-standing mining
community offering mining equipment sales and services; and experienced administrative
personnel, technicians, geologists, mining engineers, and miners.
The historical Wasamac Mine had an inclined shaft dipping to the north in the footwall of the
Main Zone to a depth of approximately 420 m. Drifting was completed on seven main levels
to approximately 400 m below surface. Two lateral drifts accessed Zones 1 and 2, with the
Wildcat shaft used as a ventilation raise to the south. The underground mine was closed in
1971 and entirely flooded. All infrastructure was dismantled and equipment, removed.
Hydro- Québec electric power is available from a provincial 25 kV hydro line which runs along
Highway 117 and from another line along the secondary road (Rang des Cavaliers). Another
Hydro-Québec 120 kV line is also available about eight kilometres east of the Project.
HISTORY The Wasamac property has been the object of extensive past exploration work. Gold
mineralization was originally discovered in 1936 by Mine d’Or Champlain through surface
trenching work. A 60 m shaft (Wildcat shaft) was sunk and one underground level was
developed. From 1945 to 1948, both exploration and development work was carried out. A
production decision was reached in 1964 and commercial production officially commenced on
April 1, 1965. Between 1965 and 1971, nearly 1.9 Mt of ore from the Wasamac deposit were
treated by Wasamac Mines Ltd. and afterwards by Wright-Hargreaves Mines Ltd. In May 1971,
the mine ceased operation due to low gold prices, increasing production costs, and the
abolishment of Federal aid to the mining sector.
During the early 1970s and 1980s, Lac Minerals Ltd. (Lac Minerals) re-activated exploration
work on the property. In 1983, following pre-feasibility work on the surface pillar recovery, Lac
Minerals completed additional drilling to upgrade the level of confidence of the crown pillar
resource. Several open-pit studies were subsequently prepared for the surface pillar, however,
low gold prices at the time prevented the company from undertaking a production decision.
Following the option agreement with Lac Minerals in 1986, exploration drilling was carried out
www.rpacan.com
Monarques Gold Corporation – Wasamac Project, Project #2869
Technical Report NI 43-101 – October 25, 2017 Page 1-7
by Resources Minières Rouyn (RMR). RMR dewatered the mine in an attempt to explore the
down dip extension of Zone 1 through underground drilling.
In 1994, Richmont reclaimed the Wasamac Mine site. All surface installations were
dismantled, the shaft was capped, and the tailings were re-vegetated. From 1989 to 2002,
exploration work on the property consisted of limited surface diamond drilling to keep the
mining lease in good standing. In 2002, Richmont re-activated exploration work on the
Wasamac property in an attempt to evaluate the down plunge extension of Zones 1 and 2 at
depth. From 2002 to 2004, Richmont drilled a total of 13,770 m which resulted in an updated
Mineral Resource estimate in 2004.
From 2005 to 2009, Richmont drilled a total of six holes to test geophysical and geological
targets along the WSZ. From 2011 to 2012, Richmont completed a 16-hole drill program
totalling 11,803 m to test the WSZ between the vertical depths of 200 m and 1,000 m across
claims optioned from Globex Mining Enterprises Inc. (Globex). All holes intersected the WSZ,
however, where intersected, the structure appeared to be less highly deformed and not as
highly altered as elsewhere. From 2015 to 2016, Richmont completed two drill holes totalling
600 m to the test the eastern and western extensions of the Wildcat Zone.
GEOLOGY AND MINERALIZATION The Wasamac property is located within the Rouyn-Noranda mining district, in the Abitibi
greenstone belt of the Superior province of the Canadian Shield. The area consists mostly of
felsic to mafic volcanic rocks of Archean age with related dioritic sills which are concordant to
the regional rock formations. The Superior Province is the largest exposed Archean craton in
the world and hosts several world class gold deposits. It has produced approximately 300
million ounces of gold from hundreds of deposits since the beginning of the 20th century. One
prominent characteristic of all significant gold deposits in the Superior Province is their
occurrence within or immediately adjacent to greenstone belts.
The Property is subdivided into two distinct volcanic sequences separated by a subsidiary fault
of the Larder Lake-Cadillac tectonic zone, called the WSZ, which cross cuts the property from
east to west. The WSZ is a reverse fault with a north dipping trend and is strongly
hydrothermally altered and hosts most known gold mineralization on the property.
www.rpacan.com
Monarques Gold Corporation – Wasamac Project, Project #2869
Technical Report NI 43-101 – October 25, 2017 Page 1-8
Originally discovered in 1944 through surface drilling, the Main Zone, is located near the centre
of the property and is hosted by the WSZ. Higher grade portions have true widths of 10 m to
15 m (up to 25 m locally) over a strike length of 400 m. Gold mineralization is associated with
quartz, carbonate, sericite, albite, pyrite, and chlorite inside the shear zone. Zone 1 and Zone
2 are located 400 m and 800 m east of the Main Zone, respectively. Zone 3 is located in the
lower part of the shear zone, near the footwall, below the MacWin Zone.
MINERAL RESOURCE The Mineral Resource estimate was completed by RPA based on the resource database and
wireframe interpretation provided and interpreted by Richmont. RPA validated the database
and considers it acceptable to be used to estimate Mineral Resource. Similarly, RPA reviewed
the wireframe interpretation and found the wireframes to be acceptable to constrain the Mineral
Resource estimate.
The current Mineral Resource estimate for the Wasamac Project is based on underground
mining methods and includes 3.99 Mt at an average grade of 2.52 g/t Au, containing 323,300
ounces in the Measured category, and 25.87 Mt at an average grade of 2.72 g/t Au, containing
2,264,500 ounces in the Indicated category. An additional 4.16 Mt at an average grade of 2.20
g/t Au, containing 293,900 ounces, is estimated in the Inferred category. The Mineral
Resources are estimated at a 1.00 g/t Au cut-off grade, based on a gold price of US$1,500 per
ounce and have an effective date of October 20, 2017 (Table 1-1).
The estimate was supported by a block model and was constrained with mineralized
wireframes capturing mineralized intercepts with a nominal grade of 1.0 g/t Au over a minimum
thickness of four metres. Erratic higher-grade samples were capped at 35 g/t Au prior to
compositing to two metre long intervals. Block gold grade was estimated using an ID3
interpolation method.
METALLURGICAL TESTWORK For the 2012 metallurgical testwork program, representative core samples from the Main Zone,
Zone 1, Zone 2, and Zone 3 were selected by the Richmont geologists and sent to SGS
Lakefield. The testwork included mineralogical analysis of the Main Zone, Zone 1, and Zone
2 samples by gold deportment study, investigation of gold recovery by whole rock leaching
versus flotation followed by leaching of both tailings and re-ground concentrate products.
www.rpacan.com
Monarques Gold Corporation – Wasamac Project, Project #2869
Technical Report NI 43-101 – October 25, 2017 Page 1-9
GRINDABILITY TESTS Grindability tests, including semi-autogenous grinding (SAG) mill comminution (SMC) tests
and measurement of Bond rod mill and Bond ball mill indices, were conducted on samples
from each of the four zones. The Bond rod mill work indices (RWI) were deemed hard with
measurements for the four zones ranging from 15.5 kWh/t to 16.8 kWh/t. The Bond ball mill
work indices (BWI) were in the medium range, with measured values between 13.5 kWh/t to
15.5 kWh/t. The average bulk density of the rocks varied from 2.76 g/cm3 to 2.82 g/cm3 across
the zones and the abrasion indices (AI) ranged from 0.13 to 0.419.
LEACHING TESTS Leaching was conducted at four different grind sizes for each zone. In all 16 tests conducted,
the leaching parameters including cyanide concentration of 500 ppm, pH of 10.5, air sparging,
and leaching time of 48 hours were maintained constant.
For all zonal composites, gold extraction improved with decreasing feed particle size. The
overall gold extraction ranged from 92.8% to 97.4% in Main Zone samples, from 80.5% to
89.4% in Zone 1, from 80.4% to 87.2% in Zone 2, and from 90.7% to 96.8% in Zone 3.
HISTORIC PROCESSING From 1965 to 1971, production from the Wasamac Mine totalled 252,923 ounces of gold. The
limited information available regarding the process indicates that the mill processed
approximately 1,500 tonnes per day (tpd) of feed grading 4.16 g/t Au and consisted of a straight
cyanidation process.
ENVIRONMENTAL STUDIES, PERMITTING AND SOCIAL CONSIDERATIONS CURRENT NATURAL ENVIRONMENT The Wasamac property is located in a rural and agricultural area. South of the property, there
is a recreational and conservation areas related to the Kekeko Hills. Private properties
constitute most of the Project area and the vegetation is typical of the boreal forest.
There are three lakes on or proximal to the Project: Hélène Lake, Adéline Lake and Wasa
Lake, and there are three distinct local watersheds on the Wasamac property. Similar to
elsewhere in the Abitibi-Témiscaminque region, the Wasamac sector holds good potential for
moose habitat.
www.rpacan.com
Monarques Gold Corporation – Wasamac Project, Project #2869
Technical Report NI 43-101 – October 25, 2017 Page 1-10
The initial groundwater study was carried out on the wells used by residents living on Rang
des Cavaliers. This baseline study will identify potential changes to the water supply caused
by future mining activities. Several other studies were carried out in 2011 related to proposed
mine dewatering. The first results obtained with the numerical model show a potential
diminution of the water table following dewatering of the mine.
www.rpacan.com
Monarques Gold Corporation – Wasamac Project, Project #2869
Technical Report NI 43-101 – October 25, 2017 Page 2-1
2 INTRODUCTION Roscoe Postle Associates Inc. (RPA) was retained by Monarques Gold Corporation
(Monarques) to update the Mineral Resource estimate and prepare an independent Technical
Report on the Wasamac Project (the Project). This Technical Report conforms to National
Instrument 43-101 Standards of Disclosure for Mineral Projects (NI 43-101). RPA visited the
property on September 29 to 30, 2017.
The Wasamac property is located approximately 15 km west southwest of Rouyn-Noranda in
Beauchastel Township and consists of a contiguous block comprising three mining leases
covering 757.65 ha and eleven mining claims covering 391.68 ha for a total area of 91,149.33
ha.
Monarques is a Montreal-based gold exploration company formed in February 2011 (as
Monarques Resources Inc.) and is a reporting issuer in British Columbia, Alberta, Ontario, and
Quebec. The common shares of Monarques trade on the TSX Venture Exchange and the
company is under the jurisdiction of the Autorité des marchés financiers du Québec.
On September 11, 2017, Monarques announced that it had entered into a definitive agreement
with Richmont Mines Inc. (Richmont) whereby it would acquire all of Richmont’s mining and
exploration assets in Quebec, including the producing Beaufor Mine and the Wasamac
property, in exchange for 19.9% of its diluted issued and outstanding common shares. On
October 2, 2017, Monarques announced that the transaction had closed.
The Project is at the resource development stage. A Preliminary Economic Assessment (PEA)
was completed by RPA, Genivar, and BBA Inc. in 2012 but is no longer considered current
due to changes in gold price, costs, and the Mineral Resource.
Production from the historical Wasamac Mine from 1965 to 1971 totalled 1.9 Mt at an average
grade of 4.16 g/t Au for a total of 253,000 ounces of gold.
www.rpacan.com
Monarques Gold Corporation – Wasamac Project, Project #2869 Technical Report NI 43-101 – October 25, 2017 Page 2-2
SOURCES OF INFORMATION A site visit to the property was carried out on September 29 to 30, 2017 by Mr. Tudorel
Ciuculescu, P.Geo., RPA Senior Geologist. Prior to, during, and subsequent to the site visit,
discussions were held with the following personnel:
• Mr. Daniel Adam, geo., Ph.D., Vice-President Exploration, Richmont
• Julie St-Georges, Senior Geomatics Technician, Richmont
Mr. Ciuculescu is responsible for the overall preparation of the Technical Report.
www.rpacan.com
Monarques Gold Corporation – Wasamac Project, Project #2869
Technical Report NI 43-101 – October 25, 2017 Page 2-3
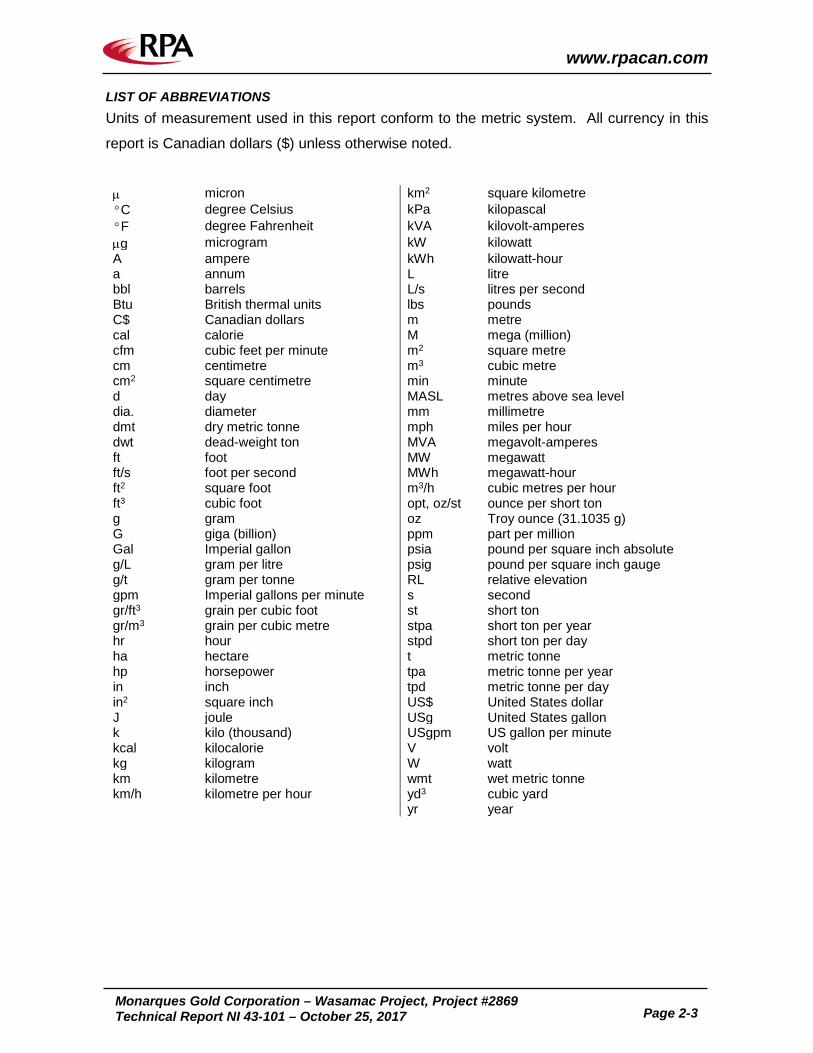
LIST OF ABBREVIATIONS Units of measurement used in this report conform to the metric system. All currency in this
report is Canadian dollars ($) unless otherwise noted.
µ micron km2 square kilometre °C degree Celsius kPa kilopascal °F degree Fahrenheit kVA kilovolt-amperes µg microgram kW kilowatt A ampere kWh kilowatt-hour a annum L litre bbl barrels L/s litres per second Btu British thermal units lbs pounds C$ Canadian dollars m metre cal calorie M mega (million) cfm cubic feet per minute m2 square metre cm centimetre m3 cubic metre cm2 square centimetre min minute d day MASL metres above sea level dia. diameter mm millimetre dmt dry metric tonne mph miles per hour dwt dead-weight ton MVA megavolt-amperes ft foot MW megawatt ft/s foot per second MWh megawatt-hour ft2 square foot m3/h cubic metres per hour ft3 cubic foot opt, oz/st ounce per short ton g gram oz Troy ounce (31.1035 g) G giga (billion) ppm part per million Gal Imperial gallon psia pound per square inch absolute g/L gram per litre psig pound per square inch gauge g/t gram per tonne RL relative elevation gpm Imperial gallons per minute s second gr/ft3 grain per cubic foot st short ton gr/m3 grain per cubic metre stpa short ton per year hr hour stpd short ton per day ha hectare t metric tonne hp horsepower tpa metric tonne per year in inch tpd metric tonne per day in2 square inch US$ United States dollar J joule USg United States gallon k kilo (thousand) USgpm US gallon per minute kcal kilocalorie V volt kg kilogram W watt km kilometre wmt wet metric tonne km/h kilometre per hour yd3 cubic yard yr year
www.rpacan.com
Monarques Gold Corporation – Wasamac Project, Project #2869
Technical Report NI 43-101 – October 25, 2017 Page 3-1
3 RELIANCE ON OTHER EXPERTS This report has been prepared by RPA for Monarques. The information, conclusions, opinions,
and estimates contained herein are based on:
• Information available to RPA at the time of preparation of this report, • Assumptions, conditions, and qualifications as set forth in this report, and • Data, reports, and other information supplied by Monarques and other third-party
sources.
For the purpose of this report, RPA has relied on ownership information provided by
Monarques. RPA has not researched property title or mineral rights for the Wasamac Project
and expresses no opinion as to the ownership status of the property. RPA did review the
status of the Project’s mining leases and claims on the web site of the Ministère de l’Énergie
et des Ressources Naturelles du Québec (https://gestim.mines.gouv.qc.ca). The information
for the Project leases and claims are as noted in Section 4 of this report as of October 2, 2017,
the date of RPA’s review.
Except for the purposes legislated under provincial securities laws, any use of this report by
any third party is at that party’s sole risk.
www.rpacan.com
Monarques Gold Corporation – Wasamac Project, Project #2869
Technical Report NI 43-101 – October 25, 2017 Page 4-1
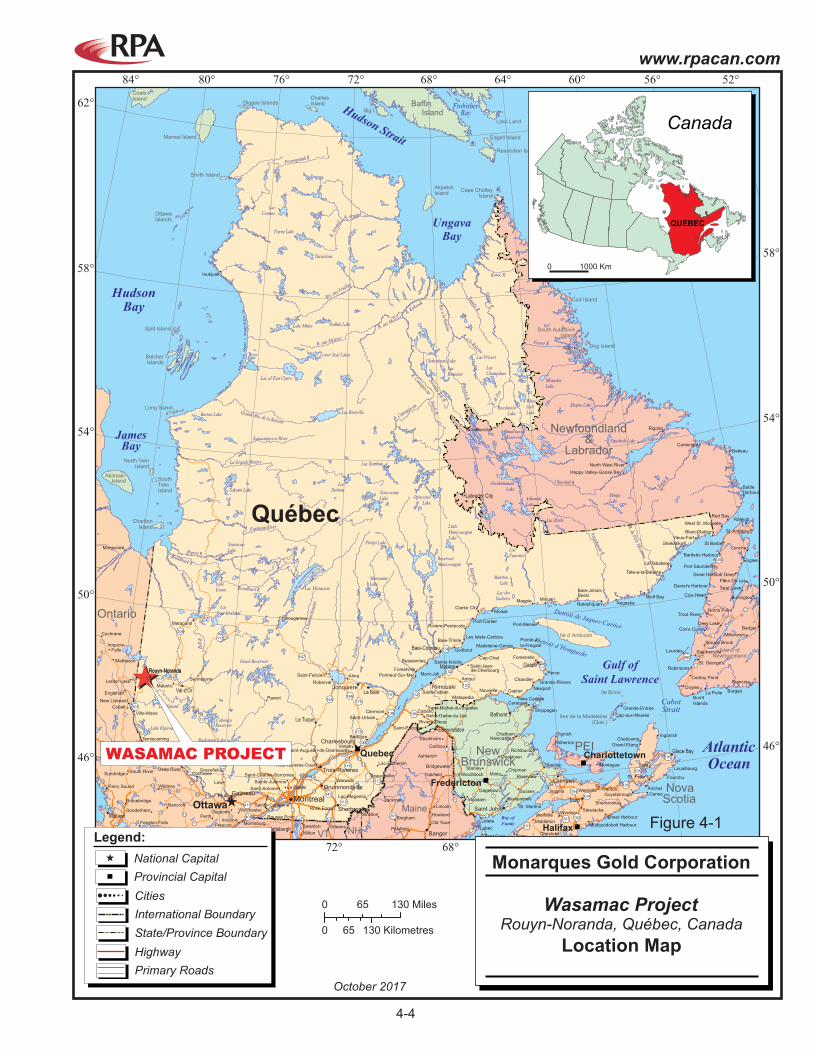
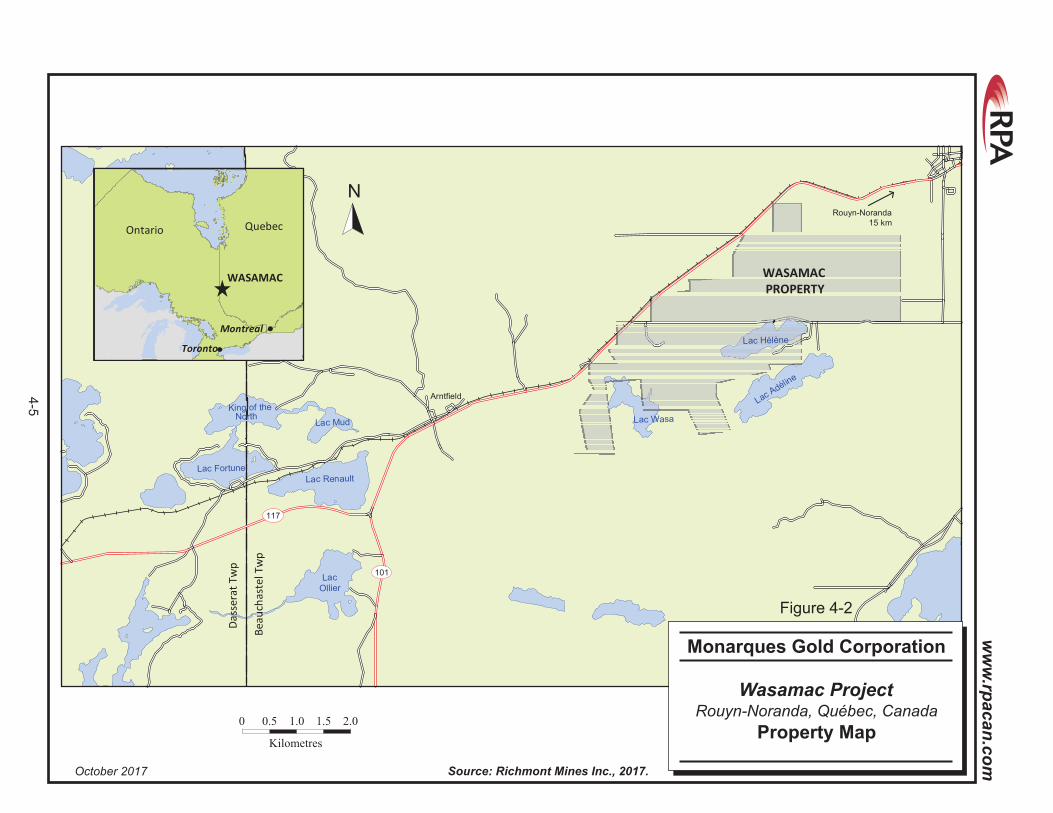
4 PROPERTY DESCRIPTION AND LOCATION LOCATION AND LAND TENURE The Wasamac property is located approximately 15 km west-southwest of Rouyn-Noranda,
Quebec, Canada, within the central portion of the Abitibi gold mining district (Figures 4-1 and
4-2).
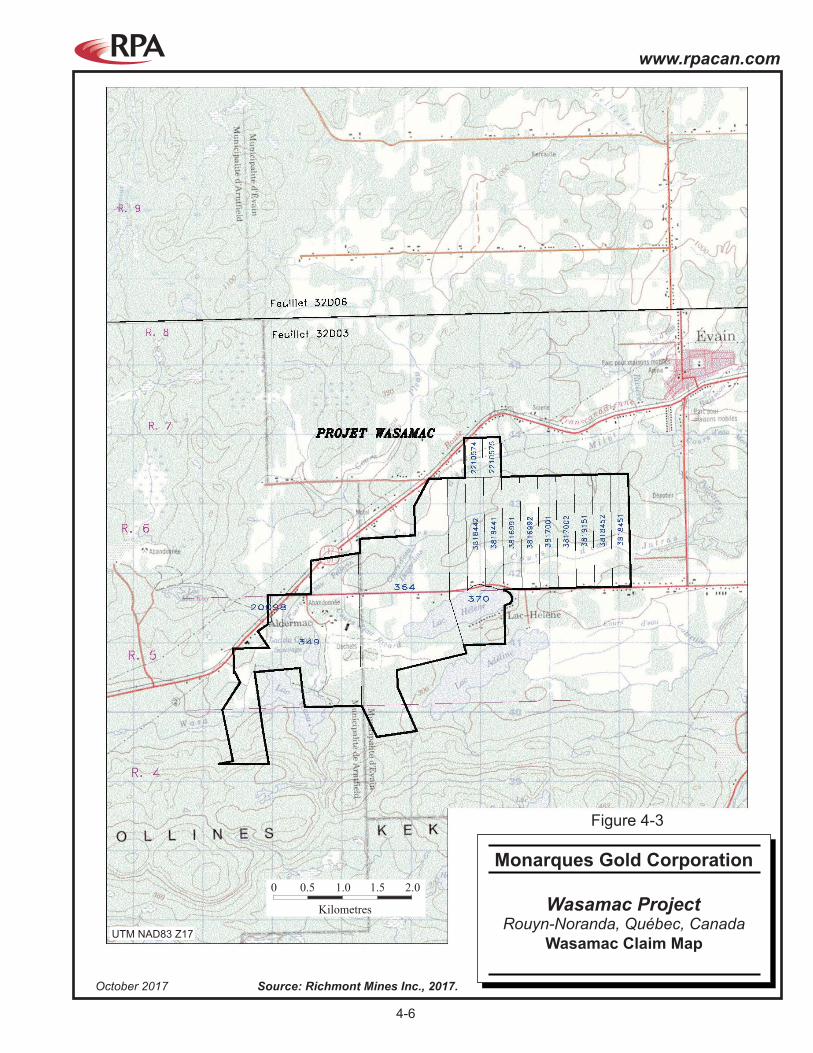
The property consists of three mining concessions covering 757.65 ha and eleven mining
claims covering 391.68 ha for a total area of 1,149.33 ha in Beauchastel Township (Table 4-
1, Figure 4-3).
On September 11, 2017, Monarques announced that it had entered into a definitive agreement
(the Agreement) with Richmont whereby it would acquire all of Richmont’s mining and
exploration assets in Quebec, in exchange for 19.9% of its diluted issued and outstanding
common shares. As a result of the Agreement, a 1.5% net smelter return (NSR) royalty is
payable to Richmont upon commercial production from the property, of which 0.5% can be
bought back for $7.5 million. On October 2, 2017, Monarques announced that the transaction
had closed. As a result of the Agreement, Richmont acquired 34,633,203 common shares of
Monarques. Richmont also acquired 5,715,000 common shares of Monarques through the
conversion of 5,715,000 subscription receipts that Richmont had previously subscribed for at
a price of $0.35 per subscription receipt.
The mining concessions, which give Monarques the right to conduct mining activity on the
property, must be renewed every year with either $26,517.75 ($35 per ha) of exploration work
or lease payments of the same amount, if no exploration work is performed.
The mining claims require that a total of $8,775 in exploration work be performed and $353.22
in renewal fees be paid on a bi-annual basis in order to keep all the claims in good standing
upon their respective anniversary dates. A total of $956,117.62 in excess assessment credits
are available.
www.rpacan.com
Monarques Gold Corporation – Wasamac Project, Project #2869
Technical Report NI 43-101 – October 25, 2017 Page 4-2
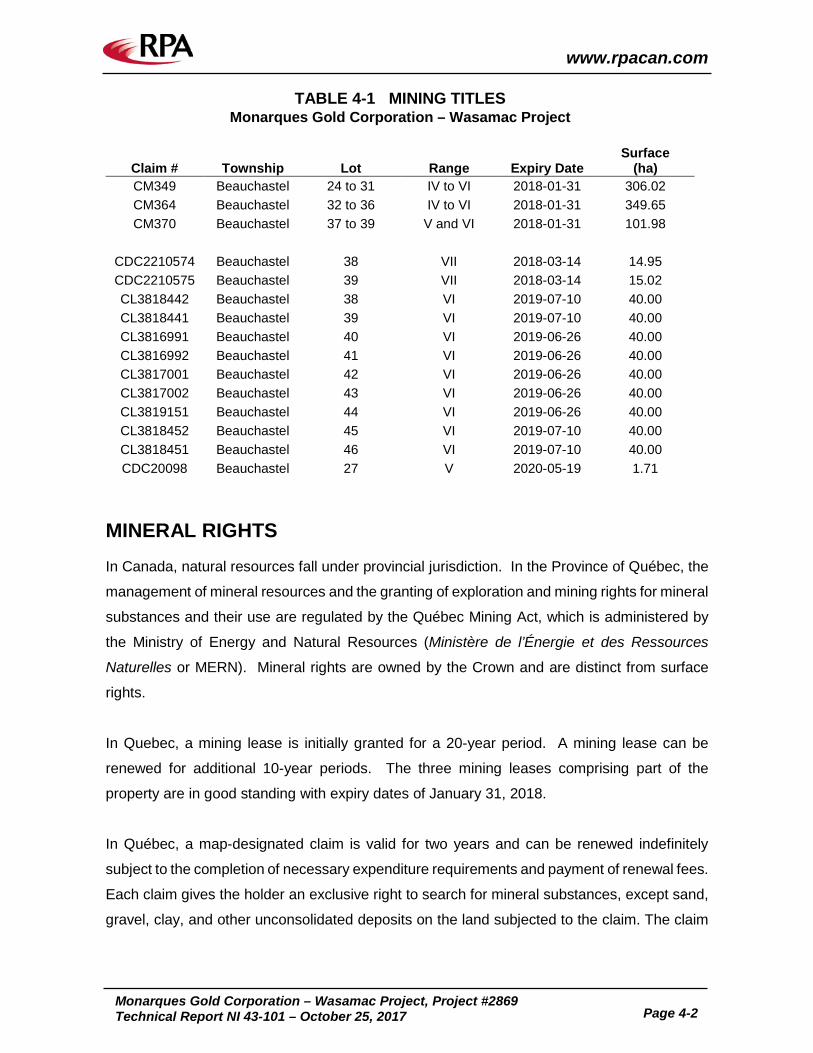
TABLE 4-1 MINING TITLES Monarques Gold Corporation – Wasamac Project
Claim # Township Lot Range Expiry Date Surface
(ha) CM349 Beauchastel 24 to 31 IV to VI 2018-01-31 306.02 CM364 Beauchastel 32 to 36 IV to VI 2018-01-31 349.65 CM370 Beauchastel 37 to 39 V and VI 2018-01-31 101.98
CDC2210574 Beauchastel 38 VII 2018-03-14 14.95 CDC2210575 Beauchastel 39 VII 2018-03-14 15.02 CL3818442 Beauchastel 38 VI 2019-07-10 40.00 CL3818441 Beauchastel 39 VI 2019-07-10 40.00 CL3816991 Beauchastel 40 VI 2019-06-26 40.00 CL3816992 Beauchastel 41 VI 2019-06-26 40.00 CL3817001 Beauchastel 42 VI 2019-06-26 40.00 CL3817002 Beauchastel 43 VI 2019-06-26 40.00 CL3819151 Beauchastel 44 VI 2019-06-26 40.00 CL3818452 Beauchastel 45 VI 2019-07-10 40.00 CL3818451 Beauchastel 46 VI 2019-07-10 40.00 CDC20098 Beauchastel 27 V 2020-05-19 1.71
MINERAL RIGHTS In Canada, natural resources fall under provincial jurisdiction. In the Province of Québec, the
management of mineral resources and the granting of exploration and mining rights for mineral
substances and their use are regulated by the Québec Mining Act, which is administered by
the Ministry of Energy and Natural Resources (Ministère de l’Énergie et des Ressources
Naturelles or MERN). Mineral rights are owned by the Crown and are distinct from surface
rights.
In Quebec, a mining lease is initially granted for a 20-year period. A mining lease can be
renewed for additional 10-year periods. The three mining leases comprising part of the
property are in good standing with expiry dates of January 31, 2018.
In Québec, a map-designated claim is valid for two years and can be renewed indefinitely
subject to the completion of necessary expenditure requirements and payment of renewal fees.
Each claim gives the holder an exclusive right to search for mineral substances, except sand,
gravel, clay, and other unconsolidated deposits on the land subjected to the claim. The claim
www.rpacan.com
Monarques Gold Corporation – Wasamac Project, Project #2869
Technical Report NI 43-101 – October 25, 2017 Page 4-3
also guarantees the holder’s right to obtain an extraction permit upon discovery of a mineral
deposit. Ownership of the mining rights confers the right to acquire the surface rights.
ROYALTIES AND OTHER ENCUMBRANCES RPA is not aware of any royalties (other than the 1.5% NSR royalty payable to Richmont upon
commercial production from the property), back-in rights, or other obligations related to any
underlying agreement.
SURFACE RIGHTS The mining claims included in the property are located on Crown land. Monarques has the
first right to acquire the surface rights to the property by taking it to the mining lease status.
Under Québec Mining Legislation, the owner of the mining rights can make use of the timber
on the leased property by paying a nominal fee if such timber is deemed to be of commercial
value.
PERMITTING Minimal permitting is required to undertake the work program contemplated in this report. For
drilling, however, Monarques will have to obtain certain permits and certification from relevant
governmental agencies, including a timber permit (Autorisation de coupe de bois sur un
territoire du domaine de l'État où s'exerce un droit minier) from the MRNF.
ENVIRONMENTAL LIABILITIES RPA is not aware of any environmental liabilities associated with the property.
RPA is not aware of any other significant factors and risks that may affect access, title, or the
right or ability to perform work on the property.
11
16
1
1
1
60
63
9
17
2
28
4
1
8
1
8
66
11
1
60
12
7
7
11
16
16
11
41
11
30
10
2
60
7
11
2
26
105
101
109
113
417
401
112
147
116
173
138
175
138 185
201
101
101 102
104
105
105
460
430
105
104
170 132
132
132
138
169
167
175155
117
117
117
41
132
13
1
69
1
1
3
17
2
2
95
17
2
2
17
1155
1
13
11
1
69
20
40
55
20
40
20
20 1
ReservoirManicouagan
SmallwoodReservoir
OpiscoteoLake
Lac Mistassini
Lac Simard
CabongaReservoir
OssokmanuanLake
MinipiLake
LittleManicouaganLake
LacChampdore
Chakonipau Lake
Lac Brule
AtikonakLake
Payne Lake
LacCouture
Lac Bienville
Lake Minto
Lac al`Eau Claire
Sakami Lake
Lac Rambau
Pletipi Lake
NaococaneLake
ManouaneLake
Lake Kipawa
Gouin Reservoir
LakeEvans
LacDalmas
Burton Lake
Baskatong Lake
WhiteGullLake
Shapio Lake
LacRomanet
ResolutionLake
Lac Privert
Nipishish Lake
MistastinLake
ManitouLake
LacFournier
Lac desEudistes
Tassialouc
NemiscauLake
Nedluk Lake
Lower Seal Lakes
Lacau Goeland
Tunulic R.
Riv a`la B
aleine
R. a`la Baleine
Koroc R.
George R
.
Fraser R.
R. d
e Pa
s
Wheeler R
.
Swampy Bay R.Sandy R
.
Eagle
R.
R. du Petit Mecatina
Natashquan R.
R. M
arguerite
Povungnituk R.
R. Arnaud
R.Ar
naud
Riv. aux Feuille
s
R. auz Melezes
R. auz Melezes
Kanaaupscow River
Eastmain River
Rupert R.Broadback R.
Broadback R.
R. Kokso
ak
R. Caniapisc
auR. Caniapiscau
Churchill R.
Grande Riv. de la Baleine
La Grande Riviere
Nottaw
ay R.
Bel
l R.
Ottawa
R. C
ham
ouch
ouan
e
Per
ibon
ca R
.
R. M
anicouagan
Maine
NY VT NH
PEI
NovaScotia
NewBrunswick
Ontario
Québec
Newfoundland&
Labrador
UngavaBay
Gulf of
Saint Lawrence
Bay of
Fundy
AtlanticOcean
CabotStrait
Detroit d`Honguedo
Detroit de Jaques-Cartier
LabradorSea
HudsonBay
JamesBay
Hudson Strait
FrobisherBay
South AulatsivikIsland
Cape ChidleyIsland
Ile d`Anticosti
Dog Island
Cod Island
Ile Brion
Island ofNewfoundland
AkpatokIsland
Iles de la Madeleine(Que.)
BelcherIslands
AkimiskiIsland
BaffinIsland
OttawaIslands
Mansel Island
CoatsIsland
SouthTwinIsland
North TwinIsland
CharltonIsland
Long Island
Split Island
Smith Island
Digges IslandsCharlesIsland
Big I.
Resolution Island
Edgell Island
Loks Land
Swanton
Stratton
Stockholm
Rouses Point
PittsfieldOrleansOld Town
Oakfield
MiltonLubec
Lincoln
Jackman
Howland
Caribou
Bridgewater
Bingham
Ashland
Cochrane
Osgoode
Sainte-Catherine
Saint-Antoine La Plaine
Vanier
Trois-Rivieres-Ouest
Saint-Charles-Borromee
Saint-Augustin-de-Desmaures
Rock Forest
Riverview
Quispamsis
Notre-Dame-du-Lac
Prescott
Chester
Musquodoboit Harbour
Sheet HarbourWindsor
DigbySeal Cove
MiddletonIroquoisMorrisburg
Perth
Havelock Tweed
Madoc
Fenelon Falls
Gooderham
Louisbourg
Francois
Burnt
Islands
BurgeoLa PoileDoyles
Codroy Pond
St. George's
StephenvilleLourdes
Spruce Brook
Millertown
BadgerDeer Lake
Trout RiverNorris Point
Burlington
Seal Cove
WolfvilleStewiacke
Westville TrentonJoggins
Amherst
MontagueShediac
Richibucto
Alberton
Tignish
Caraquet
Sherbrooke
CansoGuysborough
Arichat
St. Peter's Fourchu
Iona
Grand Etang
CheticampIngonish
Grande-Entree
Newport
ChandlerGrande-Riviere
Perce
Fontenelle
Pointe-a-
la-Fregate
Port-Menier
St. Martins
Mcadam
SussexGagetown
MintoWoodstockChipmanStanley
Doaktown
NewcastleChatham
Saint-Pacome
CabanoSaint-Michel-du-Squatec
MatapediaSaint-Fabien
Mont-JoliPortneuf-Sur-Mer
Forestville
Betsiamites
New Carlisle
CaplanNouvelle
Amqui
Saint-Jean-de-Cherbourg
Madeleine-CentreGodbout
Baie-TriniteLes Islets-Caribou
Riviere-Pentecote
Lac-Megantic
WarwickSainte-Julienne
Beauceville
Beaupre
Saint-Urbain
Clermont
Parent
Roberval
Alma
Chibougamau
Winchester
Low
Gracefield
Maniwaki
Mont-Laurier
BracebridgeBancroft
Whitney
SundridgeSouth River
Temiscaming
Ville-Marie
Cobalt
New Liskeard
Englehart
Larder LakeMalartic
Senneterre
Matagami
Parry Sound
Verner
Matheson
IroquoisFalls
Cochrane
Fleur De Lys
Great Harbour Deep
Port Saunders
Englee
Conche
Bartletts Harbour
Tete-a-la-Baleine
La Tabatiere
St BarbeShekatika
St. Anthony
Vieux-Fort
Blanc-Sablon
RaleighWest St. Modeste
Red Bay
BattleHarbour
Cartwright
Rigolet
KegaskaNatashquan
Wolf Bay
Baie-Johan-Beetz
MinganMagpie
North West River
Port-Cartier
Clarke CityMoisie
Schefferville
Moosonee
Nain
Hebron
Inukjuak
Shippagan
Saint-Felicien
Lac-Etchemin
Sainte-felicite
Robinsons
Riviere-Bleue
Mattawan
Letete
Happy Valley-Goose Bay
Deep River
Daniel's Harbour
Cox's Cove
Cow Head
Cap-Chat
Cap-aux-Meules
Batteau
Plattsburgh
Midland
Glace Bay
Truro
Bathurst
Baie-Comeau
Matane
La Tuque
La BaieVal-d'Or
Rouyn-Noranda
Labrador City
Gaspe
Edmundston
Sherbrooke
Drummondville
Trois-Rivieres
Hull Gatineau
Saint John
RimouskiJonquiere
North Bay
Charlesbourg
Bangor
Montreal
Quebec
Halifax
Fredericton
Charlottetown
Ottawa
84°
80°
80°
76°
76°
72°
72° 68°
68°
64°
64°
60°
60°
56° 52°
46°
46°
50°
50°
54°
54°
58°
58°
62°
WASAMAC PROJECT
Rouyn-Noranda
Canada
QUEBEC
0 1000 mK
National Capital
Legend:
Cities
Provincial Capital
International Boundary
State/Province Boundary
Highway
Primary Roads
0 130 Miles65
0 130 Kilometres65
October 7201
Wasamac Project
Location Map
Monarques Gold Corporation
Rouyn-Noranda, Québec, Canada
Figure 4-1
4-4
www.rpacan.com
Lac
Demin
Lac Arnoux
Can
ton
Dassera
t
Lac Fortune
King of theNorth
Lac
Ollier
Ca
nto
nB
ea
ucha
ste
l
Arntfield
Lac Renault
Lac Mud
PROPRIÉTÉWASAMAC
Lac Wasa
Lac Adéline
Rouyn-Noranda
15 km
Lac Hélène�
�
�
�
Ontario Quebec
Toronto
Montreal
WASAMAC
Be
au
cha
ste
lT
wp
Da
sse
rat
Tw
p
WASAMAC
PROPERTY
117
101
N
0 0.5
Kilometres
1.0 1.5 2.0
October 2017 Source: Richmont Mines Inc., 201 .7
Wasamac Project
Property Map
Monarques Gold Corporation
Rouyn-Noranda, Québec, Canada
Figure 4-2
4-5
ww
w.rp
acan
.co
m
0 0.5
Kilometres
1.0 1.5 2.0
October 2017 Source: 7Richmont Mines Inc., 201 .
Wasamac Project
Wasamac Claim Map
Monarques Gold Corporation
Rouyn-Noranda, Québec, Canada
Figure 34-
4-6
www.rpacan.com
UTM NAD83 Z17
www.rpacan.com
Monarques Gold Corporation – Wasamac Project, Project #2869
Technical Report NI 43-101 – October 25, 2017 Page 5-1
5 ACCESSIBILITY, CLIMATE, LOCAL RESOURCES, INFRASTRUCTURE AND PHYSIOGRAPHY ACCESSIBILITY The property is located approximately 15 km west-southwest of Rouyn-Noranda, Quebec,
Canada. Rouyn-Noranda is serviced by daily flights to Montreal. The Property is accessed
from Provincial Highway 117 that links Rouyn-Noranda and the community of Arntfield. A
secondary road (Rang des Cavaliers) leads directly to the property from Provincial Highway
117.
CLIMATE The Property lies within the Abitibi Plains ecoregion of the Boreal Shield ecozone and is
marked by warm summers and cold, snowy winters. The mean annual temperature is
approximately 1°C, the mean summer temperature is 14°C, and the mean winter temperature
is -12°C (Marshall and Schutt, 1999).
Despite the harsh winters, drilling and geophysical surveys can be performed year round.
Geological and geochemical surveys are generally restricted to the months from May to
October.
LOCAL RESOURCES Rouyn-Noranda (population 41,000) is a well-established mining town offering a wide variety
of general and mining related products and services including temporary and permanent
accommodations, hospital services, 24-hour fuel (gas and propane) station, building supplies,
post office, police services, and restaurants. The Horne copper smelter is the most significant
employer in the town with a workforce of approximately 500. Skilled personnel including,
technicians, geologists, mining engineers, experienced miners, and mining contractors are
available in the area.

www.rpacan.com
Monarques Gold Corporation – Wasamac Project, Project #2869
Technical Report NI 43-101 – October 25, 2017 Page 5-2
INFRASTRUCTURE In the past, the Wasamac Mine had an inclined shaft dipping to the north in the footwall of the
Main Zone to depth of approximately 420 m. Drifting was done on seven main levels (every
200 ft) to approximately 400 m below surface. Two lateral drifts accessed Zones 1 and 2
towards the east (at the 400 ft and 800 ft levels). Immediately to the south, the Wildcat shaft
was used as a ventilation raise and connected to the Wasamac Mine by a drift at the 200 ft
level.
The mine was closed in 1971 and is currently flooded. All infrastructure was dismantled and
equipment was removed from site. As ore has been processed at the mine site, there is an
old non-acid generating tailings pond in the centre of the property.
The surface rights covering the area of the old infrastructure and of the tailings pond are owned
by Monarques.
Hydro- Québec electric power is available from a provincial 25 kV hydro line which runs along
Provincial Highway 117 and from another line along the secondary road (Rang des Cavaliers).
Another Hydro-Québec 120 kV line is located approximately eight kilometres east of the
property.
The Ontario Northland Railway runs north of the property, parallel to Provincial Highway 117.
PHYSIOGRAPHY The ecoregion is classified as having a humid, mid-boreal eco-climate. The topography is
comparatively flat, with no hills rising more than 20 m in the immediate vicinity.
The region’s mixed forest is characterized by stands of white spruce, balsam fir, birch, and
aspen. Drier sites may have stands of jack pine or mixtures of jack pine, birch, and aspen.
Wet sites are characterized by black spruce and balsam fir. The landscape is dominated by
fine-textured, level to undulating lacustrine deposits. Domed, flat and basin bogs are the
characteristic wetlands found in over 50% of the ecoregion. Grey luvisols and gleysols found
on the clayey lacustrine and loamy tills are the dominant soils in the area.
www.rpacan.com
Monarques Gold Corporation – Wasamac Project, Project #2869
Technical Report NI 43-101 – October 25, 2017 Page 5-3
The region provides habitat for moose, black bear, lynx, snowshoe hare, beaver, wolf, and
coyote. Bird species include sharp-tailed grouse, black duck, wood duck, hooded merganser,
and pileated woodpecker.
RPA is of the opinion that, to the extent relevant to the mineral project, there is a sufficiency of
surface rights and water.
www.rpacan.com
Monarques Gold Corporation – Wasamac Project, Project #2869
Technical Report NI 43-101 – October 25, 2017 Page 6-1
6 HISTORY The Wasamac property has been the object of extensive exploration work. Gold mineralization
was originally discovered in 1936 by Mine d’Or Champlain through surface trenching work.
Subsequent surface diamond drilling intersected encouraging gold values, however,
geological continuity initially appeared erratic. A 60 m shaft (Wildcat shaft) was sunk and one
underground level was developed.
In 1944, Mine d’Or Champlain changed its name to Wasa Lake Gold Mines and initiated an
exploration program. This led to the discovery of a new gold bearing zone, the Main Zone,
located approximately 300 m north of the Wildcat Zone.
During the period from 1945 to 1948, an inclined shaft was sunk at a 55° angle down to the
1,000 ft level which was followed by significant development work on five underground levels.
“Ore reserves” established at the time were approximately two million tonnes at an average
grade of 5.28 g/t Au. This estimate is considered to be historical in nature and should not be
relied upon, however, it does give an indication of mineralization on the property.
In 1960, Barnat Mines Ltd., in association with Little Long Lac Gold Mines, acquired control of
Wasa Lake Gold Mines and changed its name to Wasamac Mines Ltd. A production decision
was reached in 1964, the underground workings were dewatered and rehabilitated, and
commercial production officially commenced on April 1, 1965.
From 1965 to 1971, approximately 1.9 million tonnes of ore from the Wasamac deposit were
treated by Wasamac Mines Ltd. and later by Wright-Hargreaves Mines Ltd. An average
recovered grade of 4.16 g/t Au was recorded (Karpoff, 1986) (Table 6-1).
www.rpacan.com
Monarques Gold Corporation – Wasamac Project, Project #2869
Technical Report NI 43-101 – October 25, 2017 Page 6-2
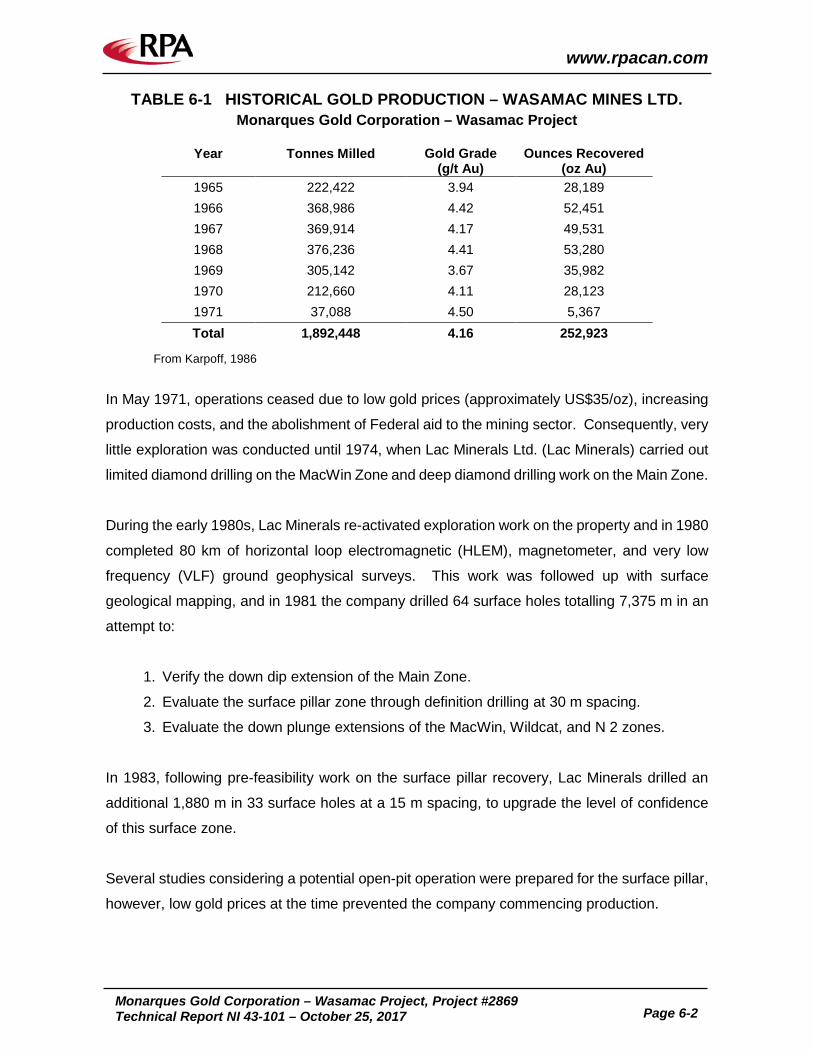
TABLE 6-1 HISTORICAL GOLD PRODUCTION – WASAMAC MINES LTD. Monarques Gold Corporation – Wasamac Project
Year Tonnes Milled Gold Grade
(g/t Au) Ounces Recovered
(oz Au) 1965 222,422 3.94 28,189 1966 368,986 4.42 52,451 1967 369,914 4.17 49,531 1968 376,236 4.41 53,280 1969 305,142 3.67 35,982 1970 212,660 4.11 28,123 1971 37,088 4.50 5,367 Total 1,892,448 4.16 252,923
From Karpoff, 1986
In May 1971, operations ceased due to low gold prices (approximately US$35/oz), increasing
production costs, and the abolishment of Federal aid to the mining sector. Consequently, very
little exploration was conducted until 1974, when Lac Minerals Ltd. (Lac Minerals) carried out
limited diamond drilling on the MacWin Zone and deep diamond drilling work on the Main Zone.
During the early 1980s, Lac Minerals re-activated exploration work on the property and in 1980
completed 80 km of horizontal loop electromagnetic (HLEM), magnetometer, and very low
frequency (VLF) ground geophysical surveys. This work was followed up with surface
geological mapping, and in 1981 the company drilled 64 surface holes totalling 7,375 m in an
attempt to:
1. Verify the down dip extension of the Main Zone.
2. Evaluate the surface pillar zone through definition drilling at 30 m spacing.
3. Evaluate the down plunge extensions of the MacWin, Wildcat, and N 2 zones.
In 1983, following pre-feasibility work on the surface pillar recovery, Lac Minerals drilled an
additional 1,880 m in 33 surface holes at a 15 m spacing, to upgrade the level of confidence
of this surface zone.
Several studies considering a potential open-pit operation were prepared for the surface pillar,
however, low gold prices at the time prevented the company commencing production.
www.rpacan.com
Monarques Gold Corporation – Wasamac Project, Project #2869
Technical Report NI 43-101 – October 25, 2017 Page 6-3
Following the option agreement with Lac Minerals in 1986, the exploration work conducted by
Ressources Minières Rouyn (RMR), which changed its name to Richmont in 1991, consisted
of 11 surface holes totalling 3,710 m, and was aimed at further evaluating the surface pillar
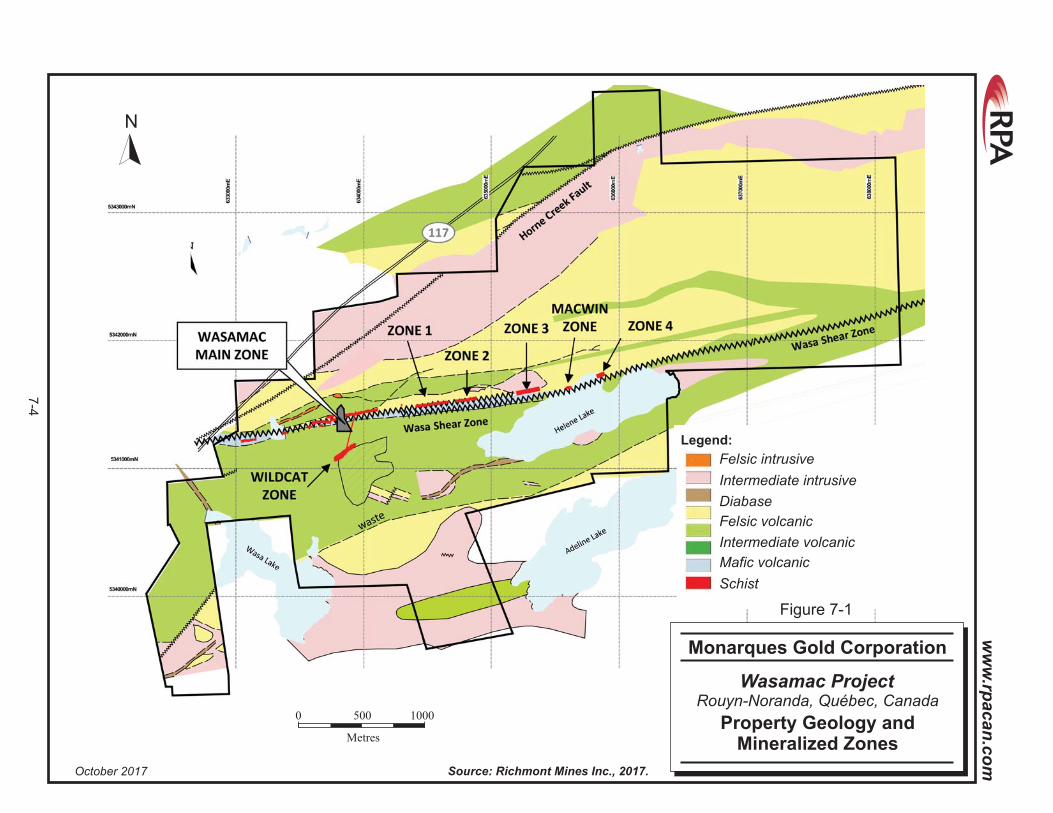
zone along with the Zone 1 and Main Zone down dip extensions.
From November 1987 to June 1988, RMR dewatered the mine to a depth of 975 ft and
rehabilitated the 400 ft and 800 ft levels in an attempt to explore the down dip extension of
Zone 1 through underground drilling. Again, the Project was not developed due to low gold
prices.
In 1994, Richmont reclaimed the Wasamac Mine site. All surface installations were
dismantled, the shaft was capped, and the tailings pond was re-vegetated.
From 1989 to 2002, exploration work included eight surface holes totalling just over 4,500 m
primarily targeting the WSZ at depth (Zones 1 and 2).
In 2002, Richmont re-activated exploration work in an attempt to evaluate the down plunge
extension of Zones 1 and 2 at depth. Richmont drilled a 420 m hole from surface that targeted
the down plunge extension of Zone 2. Drill hole WS-02-01 intersected 4.15 g/t Au over a true
width of 6.8 m. Richmont followed up with a 15-hole (9,475 m) surface drilling program in
2003. All holes intersected the WSZ at depth which demonstrated good continuity. Nine holes
returned assay values greater than 4.0 g/t Au and six holes returned grades greater than 4.5
g/t Au in Zones 2 and 3. An additional 3,859 m of drilling was completed in 2004. Results
from the 2002 to 2004 drilling supported an internal Inferred Mineral Resource estimate for
Zones 2 and 3 (Guay, 2004) as discussed under Historical Mineral Resource Estimates.
In 2005, one hole (WS-05-21), 745 m in length, was drilled west of Zone 1, and intersected
gold values of 0.91 g/t Au over 4.1 m. In 2007, two holes were completed on the West
extension of the Wildcat Zone. Hole WS-07-22 cut the Wildcat structure with a gold intercept
of 1.39 g/t Au over 6.6 m. In 2008-2009, three exploration holes targeted geophysical
anomalies that could indicate parallel structure to the WSZ. Alteration zones were intersected
but returned no significant gold values.
From May 2011 to July 2012, Richmont completed a 16-hole drill program totalling 11,803 m
to test the WSZ between the vertical depths of 200 m and 1,000 m across claims optioned
www.rpacan.com
Monarques Gold Corporation – Wasamac Project, Project #2869
Technical Report NI 43-101 – October 25, 2017 Page 6-4
from Globex Mining Enterprises Inc. (Globex). All holes intersected the WSZ, however, where
intersected, the structure appeared to be less highly deformed and not as highly altered as
elsewhere. The best intersections from within the WSZ included 4.07 g/t Au across 5.60 m in
hole WG-480-02, 2.25 g/t Au across 6.70 m in hole WG-480-04, 1.07 g/t Au across 8.00 m in
hole WG-482-o2, and 1.43 g/t Au across 5.00 m in hole WG-589-01. Several short
intersections were achieved outside of the WSZ.
From December 2015 to January 2016, Richmont completed two drill holes totalling 600 m to
test the eastern and western extensions of the Wildcat Zone. The best intersections included
2.55 g/t Au across 2.00 m in hole WC-15-01 east of the zone and 1.78 g/t Au across 2.00 m,
2.71 g/t Au across 3.50 m, 1.53 g/t Au across 4.5 m and 14.02 g/t Au across 1.50 m in hole
WC-16-01, west of the zone.
HISTORICAL MINERAL RESOURCE ESTIMATES The estimates discussed below are considered to be historical in nature and should not be
relied upon, however, they do give an indication of mineralization on the property.
In 1981, Exploration Long Lac Limitée (Exploration Long Lac), after the completion of a surface
diamond drilling campaign, re-assessed the resources of the Wasamac Mine, including the
surface pillar of the Main Zone (Bugnon, 1981).
In 1983, Lac Minerals completed another drilling campaign in the surface pillar of the Main
Zone and re-assessed the resource. A total of 588,650 tonnes at a grade of 2.85 g/t Au was
estimated for this pillar (Bugnon, 1983).
Karpoff (1986) updated the resource estimates for all zones:
Main Zone Surface Pillar 740,000 t at 3.39 g/t Au Main Zone 814,000 t at 5.83 g/t Au Zone 1 88,000 t at 5.14 g/t Au Zone 2 25,000 t at 5.79 g/t Au Zone MacWin 92,000 t at 4.94 g/t Au
Following the 2002-2003 drilling campaigns, Richmont completed an internal resource
estimation for the extension of Zones 1 and 2 at depth (Guay, 2004). This estimation was
updated with the 2004 drilling results and Inferred Mineral Resources were estimated for the
down plunge extension of Zones 1 and 2 totalling 1,282,000 t at an average grade of 6.92 g/t
www.rpacan.com
Monarques Gold Corporation – Wasamac Project, Project #2869
Technical Report NI 43-101 – October 25, 2017 Page 6-5
Au. This resource was estimated at a cut-off grade of 4.45 g/t Au and a gold price of
US$400/oz.
In 2012, the Mineral Resources were updated for a Preliminary Economic Assessment (PEA),
prepared by RPA and filed on SEDAR on May 11, 2012. As of December 31, 2011, at a 1.5
g/t Au cut-off grade, the Measured and Indicated Resources were estimated to total 6,762,455
t grading 2.56 g/t Au for 556,385 ounces of gold. Inferred Resources totalled 25.7 Mt grading
2.58 g/t Au for 2.1 million ounces of gold (Gauthier et al., 2012).
www.rpacan.com
Monarques Gold Corporation – Wasamac Project, Project #2869
Technical Report NI 43-101 – October 25, 2017 Page 7-1
7 GEOLOGICAL SETTING AND MINERALIZATION REGIONAL GEOLOGY The following is taken from Richmont (2013).
The Wasamac property is located within the Rouyn-Noranda mining district, in the Abitibi
greenstone belt of the Superior province of the Canadian Shield. The area consists mostly of
felsic to mafic volcanic rocks of Archean age together with related dioritic sills which are
concordant to the regional rock formations. These volcanic and intrusive rocks have generally
been metamorphosed to the greenschist facies.
The Superior Province is the largest exposed Archean craton in the world and hosts several
world class gold deposits. It has yielded nearly 300 million ounces of gold from hundreds of
deposits since the beginning of the twentieth century. One prominent characteristic of all
significant gold deposits in the Superior Province is their occurrence within or immediately
adjacent to greenstone belts. Another characteristic is their occurrence within major tectonic
zones which comprise a series of shear zones (Colvine et al., 1988). The Superior Province
is divided into four major subprovince types (Card and Ciesielski, 1986): volcano-plutonic,
plutonic, metasedimentary, and high metamorphic grade gneiss. The boundaries of these
subprovinces are either major dextral, transcurrent, east-striking faults, or zones of structural
and metamorphic transition.
The greenstone belts which host the gold deposits occur as east-northeasterly trending ribbon
domains in the volcano-plutonic terrains. They typically consist of mafic to ultramafic and felsic
metavolcanic rocks, interlayered with metasedimentary rocks. The supracrustal rocks were
intruded by syn-volcanic plutons. Saturated and undersaturated felsic to mafic igneous rocks
intruded into the greenstone belts in late Archean.
The metamorphic grade of most of the present greenstone terrains ranges from sub-
greenschist to greenschist facies in the centre, to lower amphibolite facies at the margin.
Amphibolite facies contact metamorphic aureoles occur around intrusions into the greenstones
(Jolly 1978, 1980) with the exception of the synvolcanic ones.
www.rpacan.com
Monarques Gold Corporation – Wasamac Project, Project #2869
Technical Report NI 43-101 – October 25, 2017 Page 7-2
LOCAL AND PROPERTY GEOLOGY The following is taken from Richmont (2013).
The geology of the Rouyn-Noranda area has been well described by numerous authors
(Dimroth et al. 1982, 1983a, 1983b; Gélinas et al. 1983; Couture and Pilote 1991).
Volcanic rocks of the Blake River Group, which host the gold deposits, are the principal
Archean rock types exposed in the study area. Rocks of the Blake River Group are bounded
to the north by the Porcupine-Destor-Parfouru fault system, and to the south by the Larder
Lake-Cadillac Fault. The Blake River Group is the youngest volcanic sequence in the Superior
Province and forms a central volcanic complex, which is characterized by cyclic bimodal
andesite-rhyolite units of calc-alkaline and tholeiitic affinity (Péloquin et al. 1990). These units
are underlain by the sedimentary rocks of the Timiskaming Group, which are overlain by mildly
deformed Proterozoic sedimentary rocks of the Cobalt Group along the south boundary. The
volcanic rocks are intruded by two major intrusive rocks, mafic gabbro-diorite sills and stocks
that are either synvolcanic or clearly post-tectonic. All lithologies, except for the syenites, are
folded and metamorphosed.
Two large granitic bodies are located just north of the Wasamac property; the Flavrian and the
Powell batholiths. These two bodies cross-cut the volcanic rocks and are located within the
general axis of the Blake River Group syncline. Elsewhere on the property, diabase dykes of
Proterozoic age and lamprophyre dykes are also found.
The property can basically be subdivided into two distinct volcanic sequences; the
southeastern portion is characterized by massive mafic to intermediate flows, while the
northern portion is underlain by an intercalation of mafic volcanic flows, felsic tuffs, and
brecciated rhyolite. These two volcanic sequences are separated by a subsidiary fault of the
Larder Lake-Cadillac tectonic zone, called the WSZ, which crosses the entire length of the
property from east to west (Figure 7-1).
Elsewhere on the property, several small mafic intrusive bodies composed of gabbro and
diorite can be found. These intrusive bodies vary in size and seem to be generally concordant
with the regional stratigraphy which runs east-west.
www.rpacan.com
Monarques Gold Corporation – Wasamac Project, Project #2869
Technical Report NI 43-101 – October 25, 2017 Page 7-3
Below the Proterozoic Cobalt sediments, just south of the Wasamac property, the Larder Lake-
Cadillac Fault cuts the Archean rocks. This regional fault separates the rocks of the Blake
River Group to the north with the sedimentary rocks of the Timiskaming Group to the south.
Beside this major structure, the Archean rocks are also affected by two families of very different
faults, one of which is related to the WSZ, and the other to the Horne Creek fault. Like the
regional structures, these faults and shear zones are striking east-west. The WSZ is a reverse
fault with a north dipping trend and is strongly hydrothermally altered on the Wasamac
property. Most of the gold mineralization found on the property to date is related to the WSZ.
Minor folding has been observed on the property. Schistosity varies between southeast to
northeast with a northern dip of approximately 55° and corresponds to regional schistosity.
The stratigraphic top, from pillow observations, is towards the north.
Detailed geological mapping was done on the Wasamac property in 1980. A detailed
description of the lithological units is provided in Bugnon (1981) and Bugnon et al. (1981).
0 1000
Metres
500
Legend:
Felsic intrusive
Intermediate intrusive
Felsic volcanic
Intermediate volcanic
Mafic volcanic
Schist
Diabase
N
October 2017 Source: Richmont Mines Inc., 201 .7
Wasamac Project
Property Geology andMineralized Zones
Monarques Gold Corporation
Rouyn-Noranda, Québec, Canada
Figure 7-1
7-4
ww
w.rp
acan
.co
m
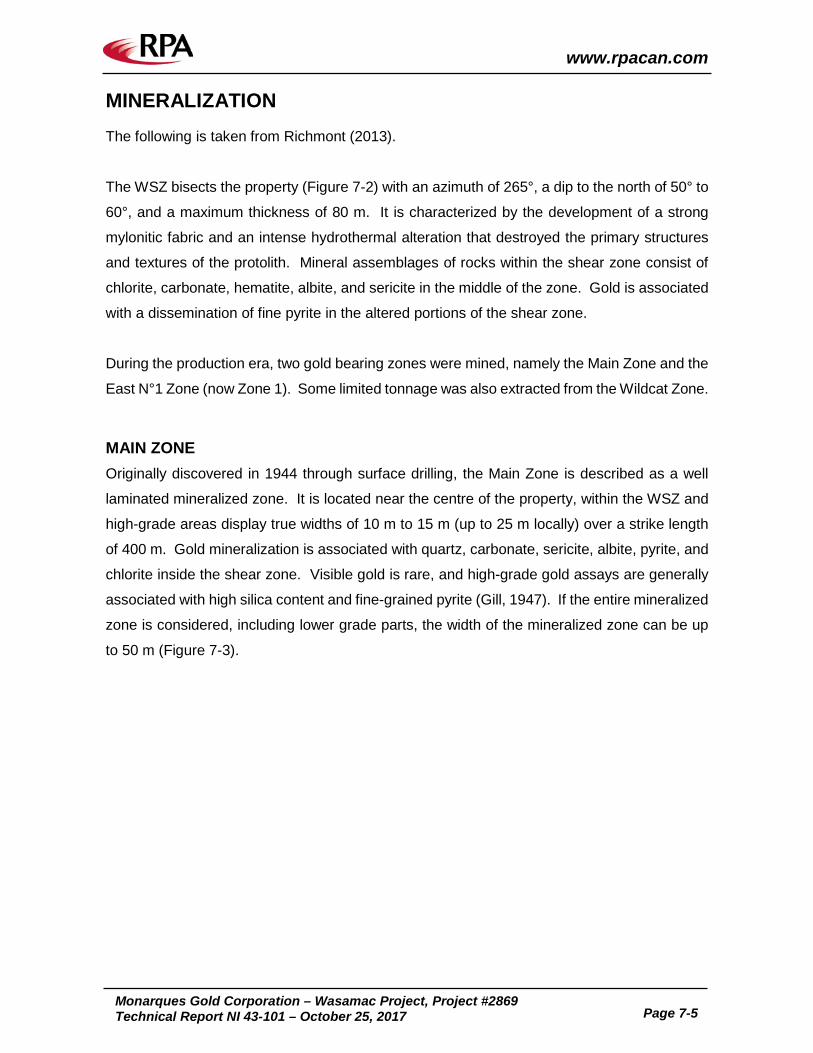
www.rpacan.com
Monarques Gold Corporation – Wasamac Project, Project #2869
Technical Report NI 43-101 – October 25, 2017 Page 7-5
MINERALIZATION The following is taken from Richmont (2013).
The WSZ bisects the property (Figure 7-2) with an azimuth of 265°, a dip to the north of 50° to
60°, and a maximum thickness of 80 m. It is characterized by the development of a strong
mylonitic fabric and an intense hydrothermal alteration that destroyed the primary structures
and textures of the protolith. Mineral assemblages of rocks within the shear zone consist of
chlorite, carbonate, hematite, albite, and sericite in the middle of the zone. Gold is associated
with a dissemination of fine pyrite in the altered portions of the shear zone.
During the production era, two gold bearing zones were mined, namely the Main Zone and the
East N°1 Zone (now Zone 1). Some limited tonnage was also extracted from the Wildcat Zone.
MAIN ZONE Originally discovered in 1944 through surface drilling, the Main Zone is described as a well
laminated mineralized zone. It is located near the centre of the property, within the WSZ and
high-grade areas display true widths of 10 m to 15 m (up to 25 m locally) over a strike length
of 400 m. Gold mineralization is associated with quartz, carbonate, sericite, albite, pyrite, and
chlorite inside the shear zone. Visible gold is rare, and high-grade gold assays are generally
associated with high silica content and fine-grained pyrite (Gill, 1947). If the entire mineralized
zone is considered, including lower grade parts, the width of the mineralized zone can be up
to 50 m (Figure 7-3).
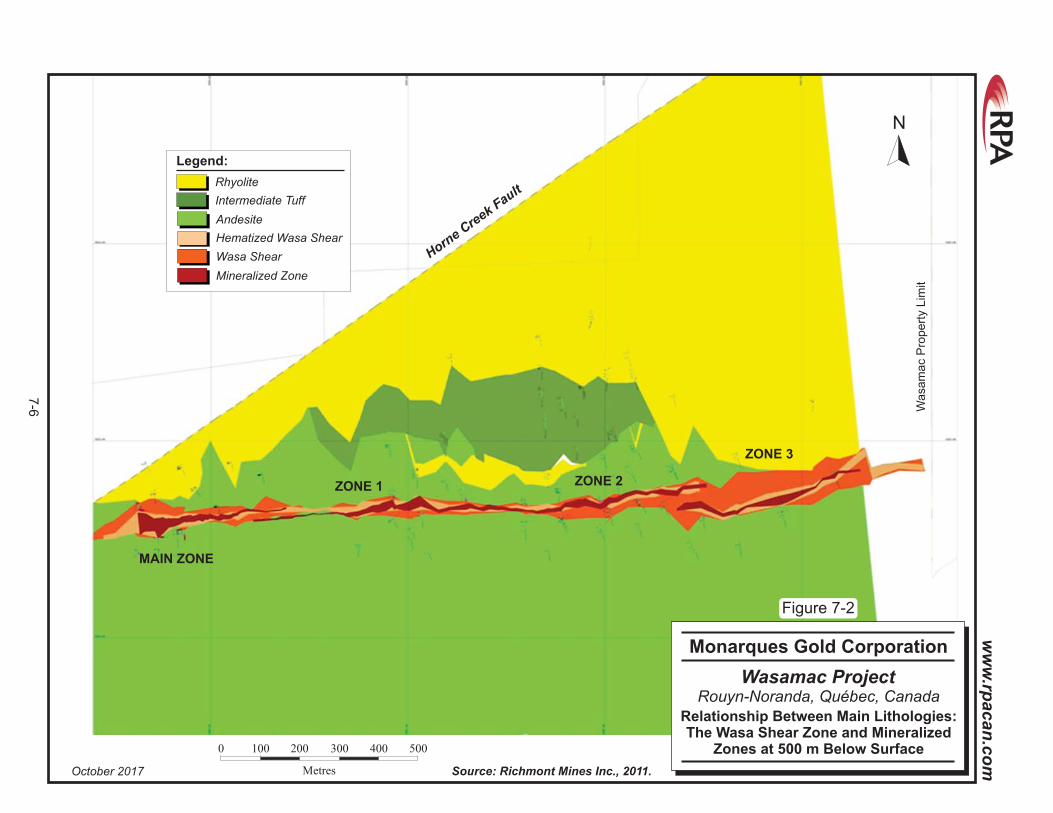
MAIN ZONE
ZONE 1 ZONE 2
ZONE 3
Horne
Creek
Fault
Wasam
ac P
ropert
y L
imit
Rhyolite
Legend:
Andesite
Intermediate Tuff
Hematized Wasa Shear
Wasa Shear
Mineralized Zone
0 100 500
Metres
200 300 400
October 7201 Source: Richmont Mines Inc., 2011.
Wasamac Project
Relationship Between Main Lithologies:The Wasa Shear Zone and Mineralized
Zones at 500 m Below Surface
Monarques Gold Corporation
Rouyn-Noranda, Québec, Canada
Figure 7-2
N
7-6
ww
w.rp
acan
.co
m
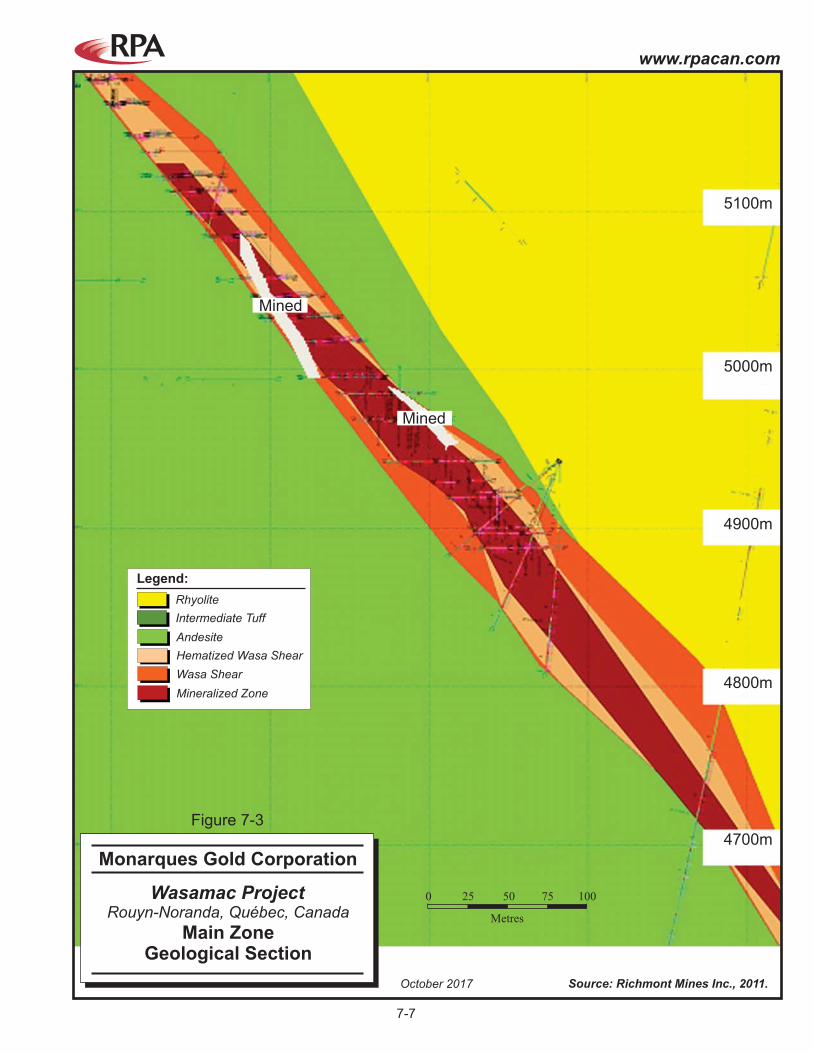
4800m
4700m
5000m
4900m
5100m
Mined
Mined
0 25
Metres
50 75 100
Rhyolite
Legend:
Andesite
Intermediate Tuff
Hematized Wasa Shear
Wasa Shear
Mineralized Zone
October 7201 Source: Richmont Mines Inc., 2011.
Wasamac Project
Main ZoneGeological Section
Monarques Gold Corporation
Rouyn-Noranda, Québec, Canada
Figure 7-3
7-7
www.rpacan.com
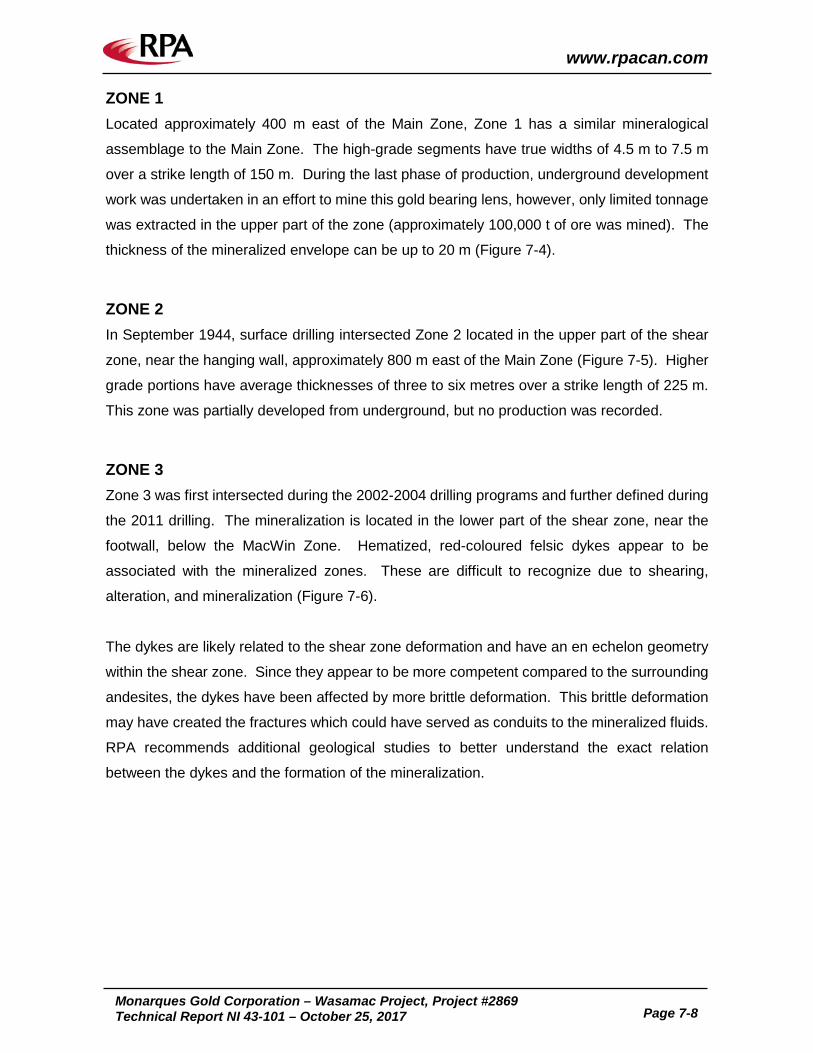
www.rpacan.com
Monarques Gold Corporation – Wasamac Project, Project #2869
Technical Report NI 43-101 – October 25, 2017 Page 7-8
ZONE 1 Located approximately 400 m east of the Main Zone, Zone 1 has a similar mineralogical
assemblage to the Main Zone. The high-grade segments have true widths of 4.5 m to 7.5 m
over a strike length of 150 m. During the last phase of production, underground development
work was undertaken in an effort to mine this gold bearing lens, however, only limited tonnage
was extracted in the upper part of the zone (approximately 100,000 t of ore was mined). The
thickness of the mineralized envelope can be up to 20 m (Figure 7-4).
ZONE 2 In September 1944, surface drilling intersected Zone 2 located in the upper part of the shear
zone, near the hanging wall, approximately 800 m east of the Main Zone (Figure 7-5). Higher
grade portions have average thicknesses of three to six metres over a strike length of 225 m.
This zone was partially developed from underground, but no production was recorded.
ZONE 3 Zone 3 was first intersected during the 2002-2004 drilling programs and further defined during
the 2011 drilling. The mineralization is located in the lower part of the shear zone, near the
footwall, below the MacWin Zone. Hematized, red-coloured felsic dykes appear to be
associated with the mineralized zones. These are difficult to recognize due to shearing,
alteration, and mineralization (Figure 7-6).
The dykes are likely related to the shear zone deformation and have an en echelon geometry
within the shear zone. Since they appear to be more competent compared to the surrounding
andesites, the dykes have been affected by more brittle deformation. This brittle deformation
may have created the fractures which could have served as conduits to the mineralized fluids.
RPA recommends additional geological studies to better understand the exact relation
between the dykes and the formation of the mineralization.
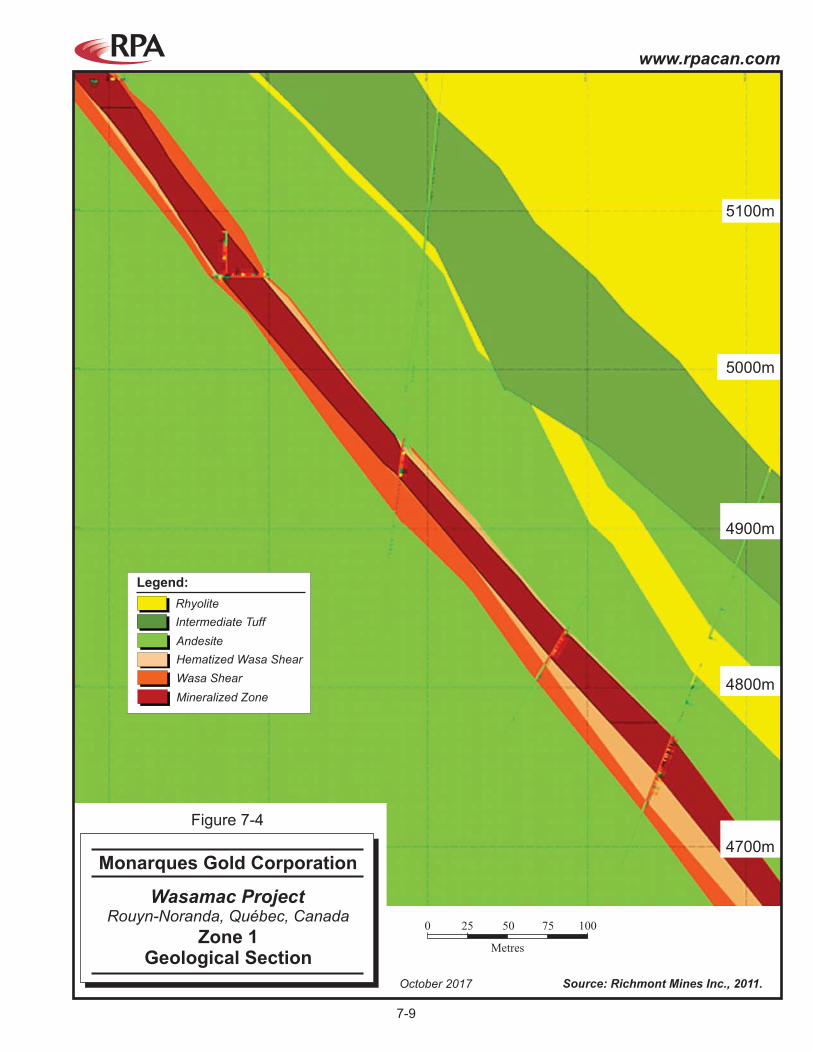
4800m
4700m
5000m
4900m
5100m
0 25
Metres
50 75 100
Rhyolite
Legend:
Andesite
Intermediate Tuff
Hematized Wasa Shear
Wasa Shear
Mineralized Zone
October 7201 Source: Richmont Mines Inc., 2011.
Wasamac Project
Zone 1Geological Section
Monarques Gold Corporation
Rouyn-Noranda, Québec, Canada
Figure 7-4
7-9
www.rpacan.com
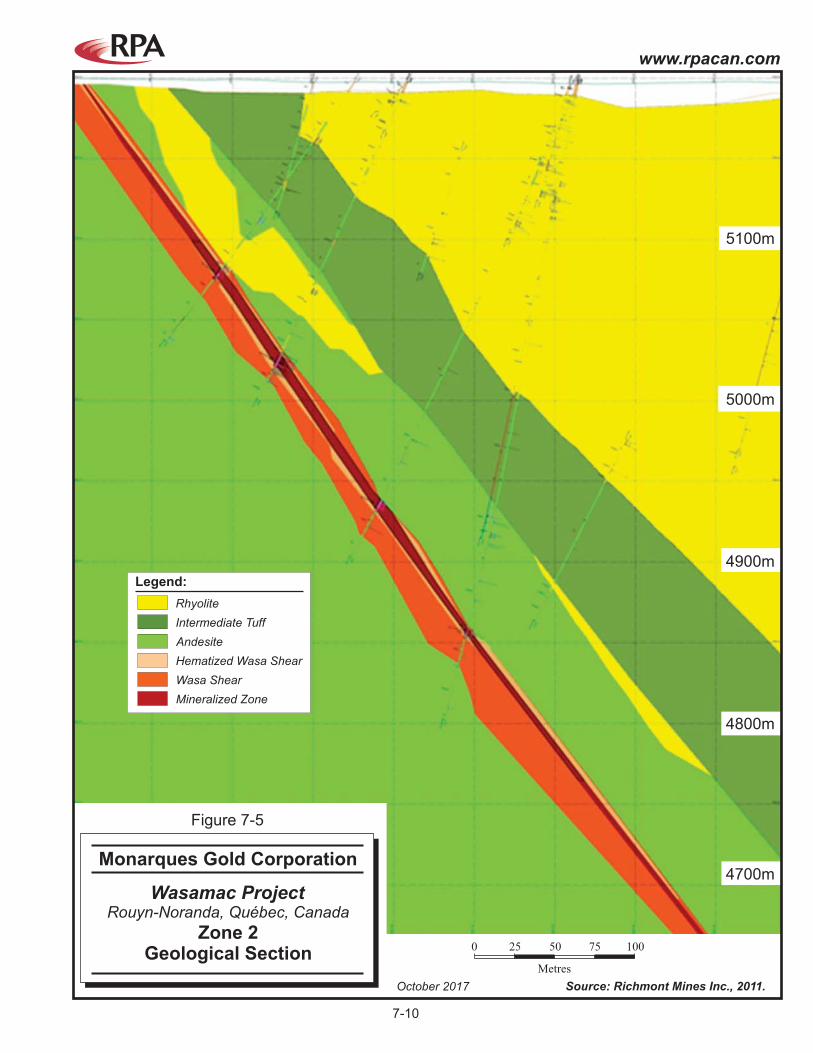
0 25
Metres
50 75 100
4800m
4700m
5000m
4900m
5100m
Rhyolite
Legend:
Andesite
Intermediate Tuff
Hematized Wasa Shear
Wasa Shear
Mineralized Zone
October 7201 Source: Richmont Mines Inc., 2011.
Wasamac Project
Zone 2Geological Section
Monarques Gold Corporation
Rouyn-Noranda, Québec, Canada
Figure 7-5
7-10
www.rpacan.com
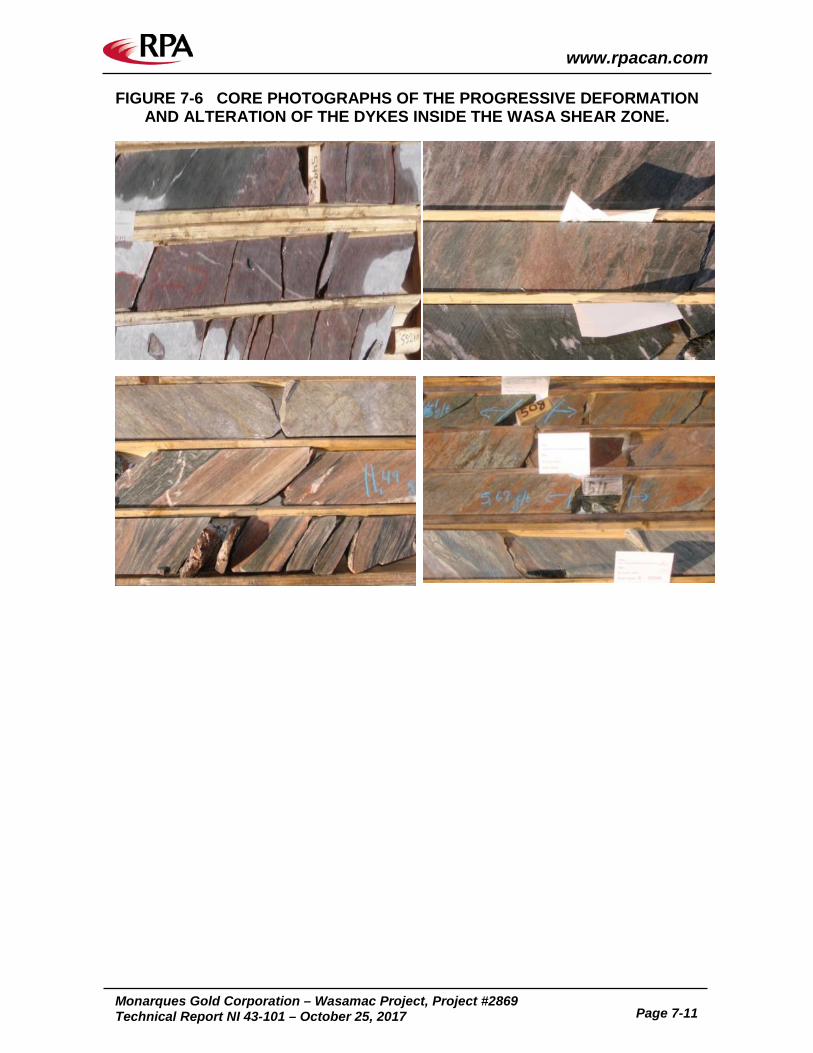
www.rpacan.com
Monarques Gold Corporation – Wasamac Project, Project #2869
Technical Report NI 43-101 – October 25, 2017 Page 7-11
FIGURE 7-6 CORE PHOTOGRAPHS OF THE PROGRESSIVE DEFORMATION AND ALTERATION OF THE DYKES INSIDE THE WASA SHEAR ZONE.
www.rpacan.com
Monarques Gold Corporation – Wasamac Project, Project #2869
Technical Report NI 43-101 – October 25, 2017 Page 7-12
MACWIN ZONE Formerly known as the Wingate Zone, the MacWin Zone was discovered in 1945 within the
WSZ near the eastern property boundary. Gold mineralization is located outside the shear
zone, within rhyolites located just at the hanging wall of the shear.
WILDCAT ZONE The Wildcat Zone was discovered in 1936, the first gold showing discovered on the property.
Located 300 m south of the Main Zone, the mineralization is related to a carbonate altered
zone at the margins of a gabbroic unit. This zone, which has been interpreted as being erratic,
was investigated through underground development work in 1937, however, operations
ceased a year later due to lower than expected gold grades. Further surface drilling was
subsequently completed in 1944, but efforts failed to improve the grade. Limited tonnage was
extracted from this zone. The Wildcat shaft was later used as a ventilation raise, and was
connected to the Wasamac Mine by a drift on the 200 ft level.
In 1981, Exploration Long Lac completed 18 holes for 1,562 m. These vertical holes showed
a possible extension of the mineralization to the southeast (Caillé, 1981). Richmont drilling in
this area also indicated a possible extension of the mineralized structure to the southwest.
www.rpacan.com
Monarques Gold Corporation – Wasamac Project, Project #2869
Technical Report NI 43-101 – October 25, 2017 Page 8-1
8 DEPOSIT TYPES The Wasamac deposit is an Archean greenstone-hosted gold deposit hosted in the WSZ, a
second-order ductile shear zone of the Cadillac–Larder Lake Fault Zone. Gold mineralization
is constrained to the altered and sheared portion of the WSZ. The following is taken from
Dubé and Gosselin (2006).
Greenstone-hosted quartz carbonate vein deposits occur in deformed greenstone belts of all
ages elsewhere in the world, especially those with variolitic tholeiitic basalts and ultramafic
flows intruded by intermediate to felsic porphyry intrusions, and sometimes with swarms of
albitite or lamprophyre dykes.
They are distributed along major compressional to transpressional crustal-scale fault zones in
deformed greenstone terranes commonly marking the convergent margins between major
lithological boundaries, such as volcano-plutonic and sedimentary domains. The large
greenstone-hosted quartz-carbonate vein deposits are commonly spatially associated with
fluvio-alluvial conglomerate (e.g., Timiskaming-type) distributed along major crustal fault
zones. This association suggests an empirical time and space relationship between large-
scale deposits and regional unconformities.
These types of deposits are most abundant and significant, in terms of total gold content, in
Archean terranes, however, a significant number of world-class deposits are also found in
Proterozoic and Paleozoic terranes. In Canada, they represent the main source of gold and
are mainly located in the Archean greenstone belts of the Superior and Slave provinces. They
also occur in the Paleozoic greenstone terranes of the Appalachian orogen and in the oceanic
terranes of the Cordillera.
The greenstone-hosted quartz-carbonate vein deposits correspond to structurally controlled,
complex epigenetic deposits characterized by simple to complex networks of gold-bearing,
laminated quartz-carbonate fault-fill veins. These veins are hosted by moderately to steeply
dipping, compressional, brittle-ductile shear zones and faults with locally associated shallow-
dipping extensional veins and hydrothermal breccias. These deposits are hosted by
greenschist to locally amphibolite-facies metamorphic rocks of dominantly mafic composition
and formed at intermediate depth (5 km to 10 km). The mineralization is syn- to late-
www.rpacan.com
Monarques Gold Corporation – Wasamac Project, Project #2869
Technical Report NI 43-101 – October 25, 2017 Page 8-2
deformation and typically post-peak greenschist-facies or syn-peak amphibolite-facies
metamorphism. It is typically associated with iron carbonate alteration. Gold is largely
confined to the quartz-carbonate vein network but may also be present in significant amounts
within iron-rich sulphidized wall rock selvages or within silicified and arsenopyrite-rich
replacement zones.
There is a general consensus that the greenstone-hosted quartz-carbonate vein deposits are
related to metamorphic fluids from accretionary processes and generated by prograde
metamorphism and thermal re-equilibration of subducted volcano-sedimentary terranes. The
deep-seated gold transporting metamorphic fluid has been channelled to higher crustal levels
through major crustal faults or deformation zones. Along its pathway, the fluid has dissolved
various components, notably gold, from volcano-sedimentary packages, including a potential
gold-rich precursor. The fluid then precipitated as vein material or wall rock replacement in
second and third order structures at higher crustal levels through fluid pressure cycling
processes and temperature, pH and other physico-chemical variations.
www.rpacan.com
Monarques Gold Corporation – Wasamac Project, Project #2869
Technical Report NI 43-101 – October 25, 2017 Page 9-1
9 EXPLORATION As of the effective date of this report, Monarques has completed no exploration work on the
property. Historical exploration is discussed in Section 6 of this report.
www.rpacan.com
Monarques Gold Corporation – Wasamac Project, Project #2869
Technical Report NI 43-101 – October 25, 2017 Page 10-1
10 DRILLING DRILLING PROGRAMS As of the effective date of this report, Monarques has completed no drilling on the property.
The following relates to previous drilling performed on the property and is taken mostly from
Gauthier et al. (2012).
Part of the drill hole database is available on Sigeom’s website (www.mrn.gouv.qc.ca/mines)
with supporting hard copies of diamond drill logs and assay results from both surface and
underground holes stored at Richmont’s Rouyn-Noranda office.
Surface drilling completed in 1980 and 1981 by Exploration Long Lac was of BQ size. All the
holes were surveyed at that time (Bugnon, 1982).
BQ size surface drilling from 2002 to 2005 were spaced at 110 m. Reflex EZ-shot orientation
measurements were taken at 30 m intervals.
Surface drilling in 2010 by Bradley Bros. Limited, using NQ size equipment, targeted results in
Zone 2 and a portion of Zone 1 that were identified during the 2002 to 2004 drilling.
Drilling sites are located mainly on private land, and access agreements have been signed
with the landowners. Access to drilling sites is via dirt roads. Construction of gravel roads
began at the end of 2011 for some of the accesses. In forested areas, trees were cut prior to
drill mobilization. Drilling sites and access will be restored after the drilling, and some
restoration works began at the end of 2011.
The 2011 drilling campaign was planned to:
• verify the extension of the mineralization below the Main Zone,
• explore between the Main Zone and Zone 1,
• delineate and verify the continuity mineralization in Zones 1, 2, and 3
Drilling was planned using a hole spacing of approximately 75 m on a vertical longitudinal
section. Three to four NQ size diamond drill rigs were used on the property for the 2011
www.rpacan.com
Monarques Gold Corporation – Wasamac Project, Project #2869
Technical Report NI 43-101 – October 25, 2017 Page 10-2
campaign. A total of 78 holes were completed (11 holes were stopped and re-drilled due to
excessive deviations) totalling approximately 52,000 m.
The major results of the 2011 drilling campaign were as follows:
• Confirmed the mineralization at the bottom of the Main Zone with a large thickness in the western portion, where gold mineralization is also found in the footwall of the shear zone.
• Widened Zone 2 at depth to the west and demonstrated its junction with Zone 1. Indicated also that Zone 2 remains open at depth.
• Better delineated Zone 3, which has now been intersected by more than 20 holes. Indicated that Zone 3 remains open at depth.
In 2012, 87 NQ diameter drill holes were drilled. Most of these holes were drilled on private
land, and agreements were reached with the respective owners. Also, to minimize disturbance
to area residents, anti-noise walls were used and drilling schedules were adapted.
The main results of the 2012 drilling program were:
• Main Zone resources at depth almost all have been upgraded to the Indicated category.
• Main Zone remains open to the east and at depth.
• Zone 3 mineralization is now better defined, and it is still partly open at depth.
• A fourth mineralized zone was intersected at the eastern edge of the property. This area continues into part on the neighbouring property.
• Silver grades were systematically assayed with gold. Also, samples of all the available mineralized intersections were also re-assayed for silver. The silver has now been included in the new resource estimate.
• Approximately 45% of the Wasamac resources are now in the Measured and Indicated Resource categories.
More extensive metallurgical tests were initiated on composite samples of drill core for the four
main mineralized zones of the property.
Over twenty geotechnical holes were also drilled to verify the quality of the rock in the crown
pillar and the hanging wall of the Main Zone and Zone 1. A large diameter borehole was also
drilled to intersect existing development of the former Wasamac Mine and serve as a
dewatering well.
www.rpacan.com
Monarques Gold Corporation – Wasamac Project, Project #2869 Technical Report NI 43-101 – October 25, 2017 Page 10-3
In 2012, 13 holes totalling 10,136 m were completed on five claims of the adjoining property
that had been optioned from Globex Mining Enterprises (Globex). Only the small mineralized
Zone 4, at the edge of the two properties, was intersected. Currently, the area is part of the
Wasamac property.
Figure 10-1 presents the drilling on the Wasamac property and surrounding areas. The current
property boundary includes the former Globex options and additional claims, reflecting the
expansion of the property to the east and northeast.
DRILL HOLE SURVEYS In 2011, holes were spotted by Richmont personnel using a GPS and, subsequently, an APS
instrument and most 2011 casings were left in the ground. Corriveau J.L. & Associés Inc.
surveyed most of the 2011 drill hole collars with an accurate GPS system.
Deviation was measured using a Flexit SmartTool or a Reflex instrument at 30 m intervals. A
correction of -12.4° was applied to the results. Magnetism was measured at the same time
and some readings were discarded due to high values. In some cases, a multi-shot reading
was taken at the end of the hole.
CORE RECOVERY AND RQD DATA The core recovery was 95% to 100%. Some fault material was intersected in the most
brecciated parts of the Wasa Shear Zone. Rock quality designation (RQD) were calculated
for some of the previous surface holes and in almost all the 2010 to 2011 holes. In 2011,
Itasca Consulting Group, Inc. (Itasca) was contracted to complete a preliminary empirical geo-
mechanical stability analysis for underground excavations (Andrieux, 2011). A summary of
RQD calculations and observations at the hanging wall is illustrated in Figure 10-2.
Representative core samples were selected in the hanging wall, the footwall, and inside the
four mineralized zones to be tested at Montréal École Polytechnique’s laboratory.
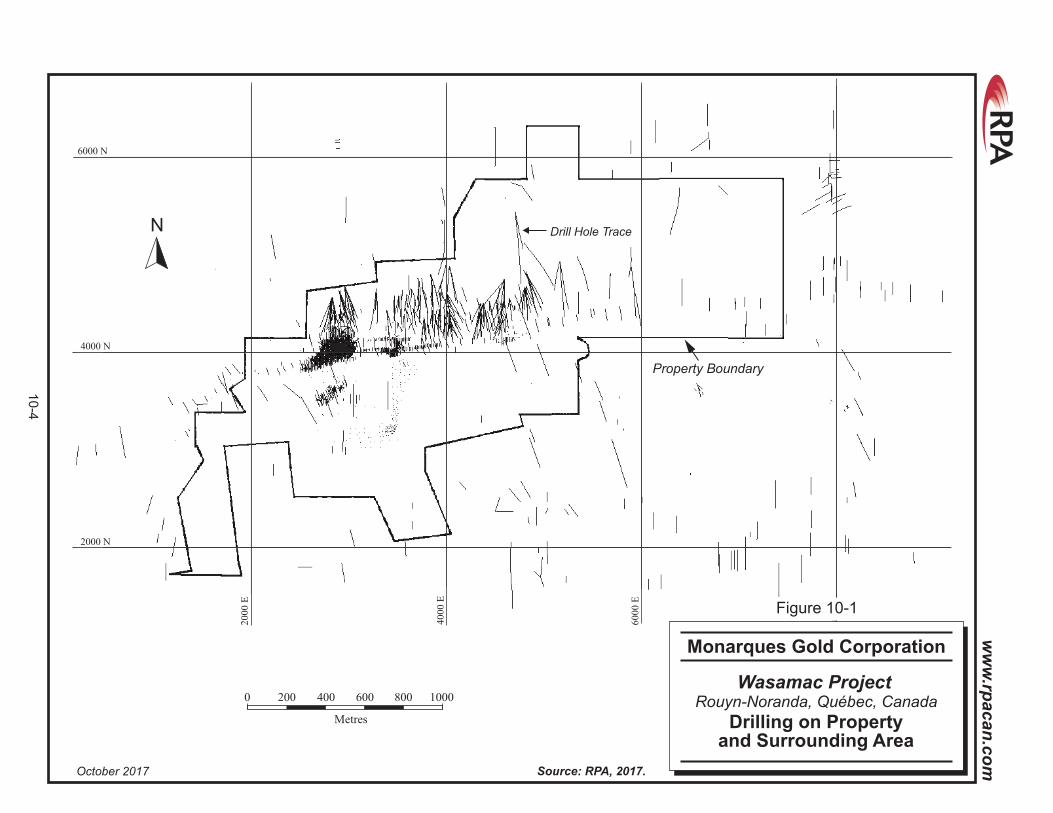
2000 N
4 N000
60 N00
2000 E
4000
E
6000 E
Drill Hole Trace
Property Boundary
0 200 1000
Metres
4 00 6 00 8 00
N
October 2017 Source: RPA, 2017.
Wasamac Project
Drilling on Propertyand Surrounding Area
Monarques Gold Corporation
Rouyn-Noranda, Québec, Canada
Figure 10-1
10
-4
ww
w.rp
acan
.co
m
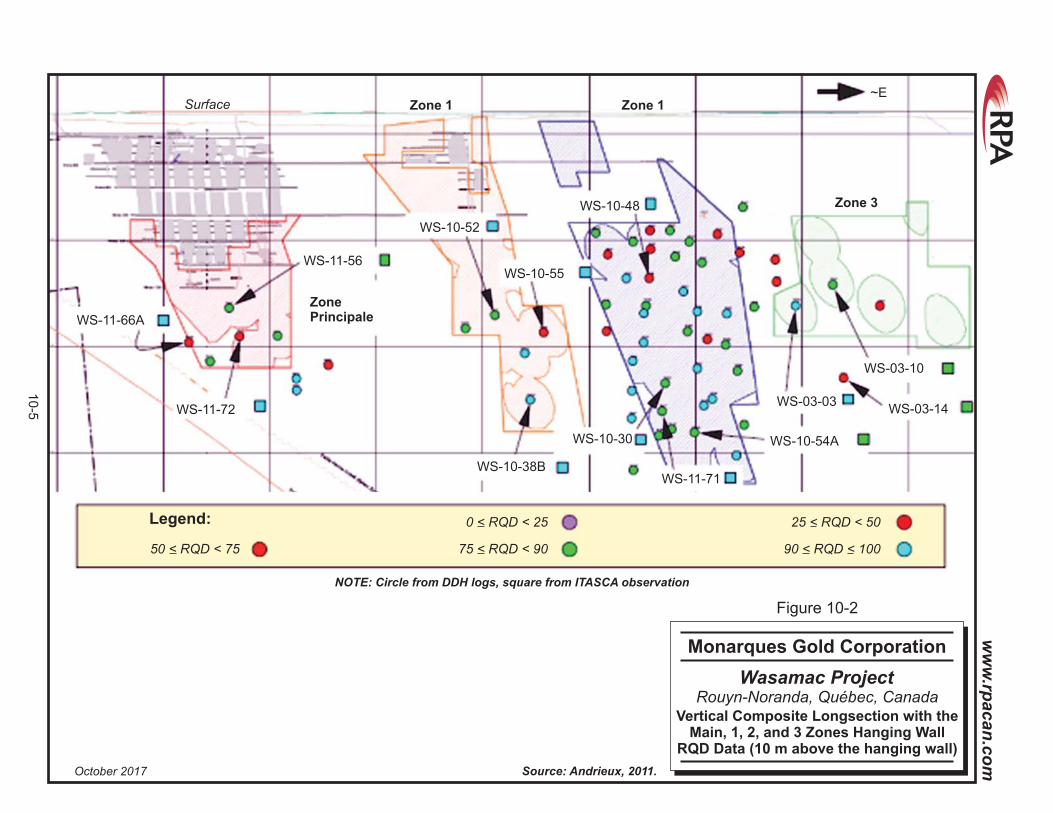
WS-11-66A
WS-11-72
0 < RQD < 25
75 < RQD < 90
Zone 1
ZonePrincipale
Zone 3
WS-11-56
WS-10-52
WS-10-55
WS-10-38B
WS-10-30
WS-11-71
WS-03-03
~ESurface
WS-10-54A
WS-03-10
WS-03-14
WS-10-48
Zone 1
25 < RQD < 50
90 < RQD < 10050 < RQD < 75
Legend:
October 2017 Source: Andrieux, 2011.
NOTE: Circle from DDH logs, square from ITASCA observation
Wasamac Project
Vertical Composite Longsection with theMain, 1, 2, and 3 Zones Hanging Wall
RQD Data (10 m above the hanging wall)
Monarques Gold Corporation
Rouyn-Noranda, Québec, Canada
Figure 10-2
10
-5
ww
w.rp
acan
.co
m
www.rpacan.com
Monarques Gold Corporation – Wasamac Project, Project #2869
Technical Report NI 43-101 – October 25, 2017 Page 11-1
11 SAMPLE PREPARATION, ANALYSES AND SECURITY CORE LOGGING AND SAMPLING PROCEDURES Limited information is available regarding sampling methods used underground, either for core
drilling or wall sampling, from when the mine was in operation.
Since 2002, core logging has been performed by Richmont’s geological staff using industry
standard procedures.
Since 2010, logging has been done on Richmont’s Francoeur mine site. Data entered into the
logging software were:
• log header, hole location, parameters, and surveys,
• descriptions of the main and sub-geological units,
• mineralized zones with their mineralogy, attitude, thickness; and
• structures, alterations, and RQD.
Selected intervals were sawn in half with one half being kept as a reference in core boxes, the
other half bagged, labelled, and transported to Laboratoire Expert Inc. (Expert Laboratory) in
Rouyn-Noranda by Richmont for assay. Assay results and core descriptions were collected
and plotted onto vertical sections for interpretation and drill hole planning.
The core boxes were marked with aluminum tags and moved to permanent storage in steel
core-racks on the Francoeur mine site. Since 2003, most of the split core was stored at the
Francoeur Mine and remains available. Since 2009, sample rejects and pulps have been
stored at the Francoeur mine site.
SAMPLE PREPARATION AND ASSAYING PROCEDURES
TECHNI-LAB RPA does not have any details regarding the analytical procedures used by various
laboratories prior to 2002.
www.rpacan.com
Monarques Gold Corporation – Wasamac Project, Project #2869
Technical Report NI 43-101 – October 25, 2017 Page 11-2
During the 2002-2004 surface drilling programs, diamond drill core was logged and split at
Richmont’s core logging facility. Samples from one half of the core were tagged and bagged
and delivered directly to the Techni-Lab S.G.B. Abitibi Inc. assay office in Ste-Germaine-Boulé,
QC (Actlabs). At Actlabs, samples were counted and classified. A project list was created and
the sample identification numbers were compared with the order form provided by Richmont.
Each sample is allocated two identification tags, one for the pulp and the other for the reject.
Wet samples were dried in an oven at 60°C for one hour. Samples were crushed to -2 mm,
homogenized, and split with a Jones riffle splitter to retain a 250 g sample which was then
pulverized to 80% passing -200 mesh for three minutes in a ring pulverizer. Pulps were
analyzed using standard fire assay methods with an atomic absorption spectrometry (AAS)
finish. If the results were greater than 10 g/t Au, a second 30 g pulp sample was fire assayed
with a gravimetric finish.
Techni-Lab employed industry standard quality assurance/quality control (QA/QC) procedures
including daily checks of equipment, and the insertion and review of blanks, duplicates, and
Certified Reference Materials (CRMs).
EXPERT LABORATORY In 2010 and 2011, samples were sent to the Expert Laboratory in Rouyn-Noranda. Also in
2011, approximately 20% of pulps and rejects from the mineralized zone were re-assayed by
Actlabs.
At Expert Laboratory, samples were dried if necessary and then reduced to -1/4 inch with a
jaw crusher which was cleaned with compressed air and barren material between samples.
The sample was then reduced to 90% -10 mesh with a roll crusher. The roll crusher was
cleaned between samples with a wire brush and compressed air and barren material between
sample batches. The sample was then split using a Jones type riffle to approximately 300 g,
which was then pulverized to 90% -200 mesh in a ring and puck type pulverizer. The pulverizer
was cleaned with compressed air between samples and silica sand between batches.
One assay-ton samples (29.166 g) were fire assayed with an AAS finish. Samples were
assayed in batches of 28 which included a reagent blank and a gold CRM.
Samples assaying over 1,000 ppb were checked by fire assay with a gravimetric finish.
www.rpacan.com
Monarques Gold Corporation – Wasamac Project, Project #2869
Technical Report NI 43-101 – October 25, 2017 Page 11-3
DENSITY MEASUREMENTS The historic tonnage factor used for the Wasamac Mine ore was 12 ft3/ton, which corresponds
to a density of 2.80 g/cm3.
In May 2010, Richmont requested that Unité de Recherche et de Service en Technologie
Minérale (URSTM) make density measurements on samples from Zone 2 which were sent for
metallurgical testing (holes WS-10-31 and WS-10-36) (Lelièvre, 2011). The average density
of the 21 samples was 2.823 g/cm3.
In 2011, approximately forty new density measurements were made by URSTM, with averages
of 2.80 g/cm3 for the Main Zone, 2.83 g/cm3 for Zone 1, and 2.84 g/cm3 for Zone 2.
The density value of 2.80 g/cm3 was considered representative and was used to convert
volumes to tonnages for the resource estimate.
QUALITY ASSURANCE/QUALITY CONTROL PROCEDURES There are no records of a quality control program for the period when the mine was in operation
from 1965 to 1971.
Exploration completed by Exploration Long Lac in the 1980s included checks for assay results
from the 1980-1981 drilling campaign. Two laboratories were used for this campaign:
Laboratoire d’analyse Bourlamaque Ltée of Val-d’Or, QC (Bourlamaque), and Assayers
Limited of Rouyn-Noranda, QC (Assayers). Some of the samples sent to one laboratory were
resent to the other. Only the pulp was used, and samples were separated into two groups:
one for the WSZ, the other for the Wildcat Zone. Pulps prepared by Bourlamaque and assayed
by the two laboratories showed a very good correlation. Pulps prepared by Assayers and
assayed by the two laboratories showed a lower correlation (Bugnon, 1982).
For the 2002 to 2004 drill campaigns, the QA/QC program for drill core samples included the
re-assay of all samples with good initial results by a second laboratory facility. Chimitec (ALS
CHEMEX) of Val-d’Or, QC, re-assayed those pulps.
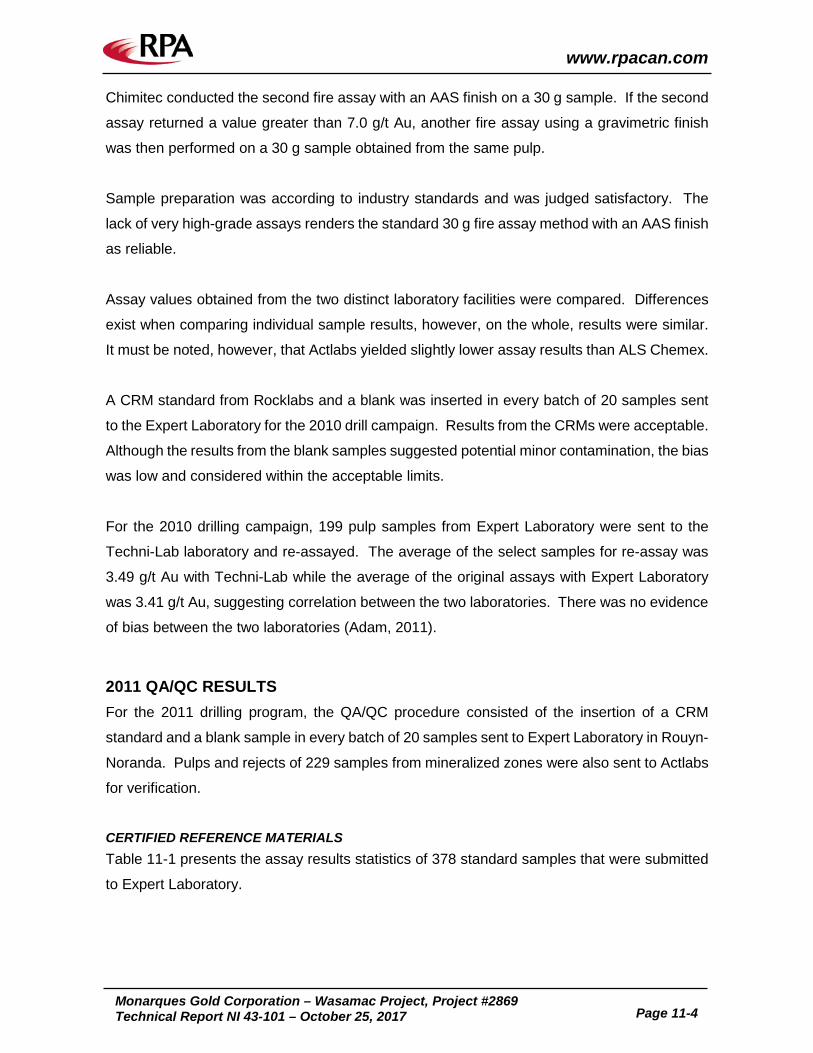
www.rpacan.com
Monarques Gold Corporation – Wasamac Project, Project #2869
Technical Report NI 43-101 – October 25, 2017 Page 11-4
Chimitec conducted the second fire assay with an AAS finish on a 30 g sample. If the second
assay returned a value greater than 7.0 g/t Au, another fire assay using a gravimetric finish
was then performed on a 30 g sample obtained from the same pulp.
Sample preparation was according to industry standards and was judged satisfactory. The
lack of very high-grade assays renders the standard 30 g fire assay method with an AAS finish
as reliable.
Assay values obtained from the two distinct laboratory facilities were compared. Differences
exist when comparing individual sample results, however, on the whole, results were similar.
It must be noted, however, that Actlabs yielded slightly lower assay results than ALS Chemex.
A CRM standard from Rocklabs and a blank was inserted in every batch of 20 samples sent
to the Expert Laboratory for the 2010 drill campaign. Results from the CRMs were acceptable.
Although the results from the blank samples suggested potential minor contamination, the bias
was low and considered within the acceptable limits.
For the 2010 drilling campaign, 199 pulp samples from Expert Laboratory were sent to the
Techni-Lab laboratory and re-assayed. The average of the select samples for re-assay was
3.49 g/t Au with Techni-Lab while the average of the original assays with Expert Laboratory
was 3.41 g/t Au, suggesting correlation between the two laboratories. There was no evidence
of bias between the two laboratories (Adam, 2011).
2011 QA/QC RESULTS For the 2011 drilling program, the QA/QC procedure consisted of the insertion of a CRM
standard and a blank sample in every batch of 20 samples sent to Expert Laboratory in Rouyn-
Noranda. Pulps and rejects of 229 samples from mineralized zones were also sent to Actlabs
for verification.
CERTIFIED REFERENCE MATERIALS Table 11-1 presents the assay results statistics of 378 standard samples that were submitted
to Expert Laboratory.
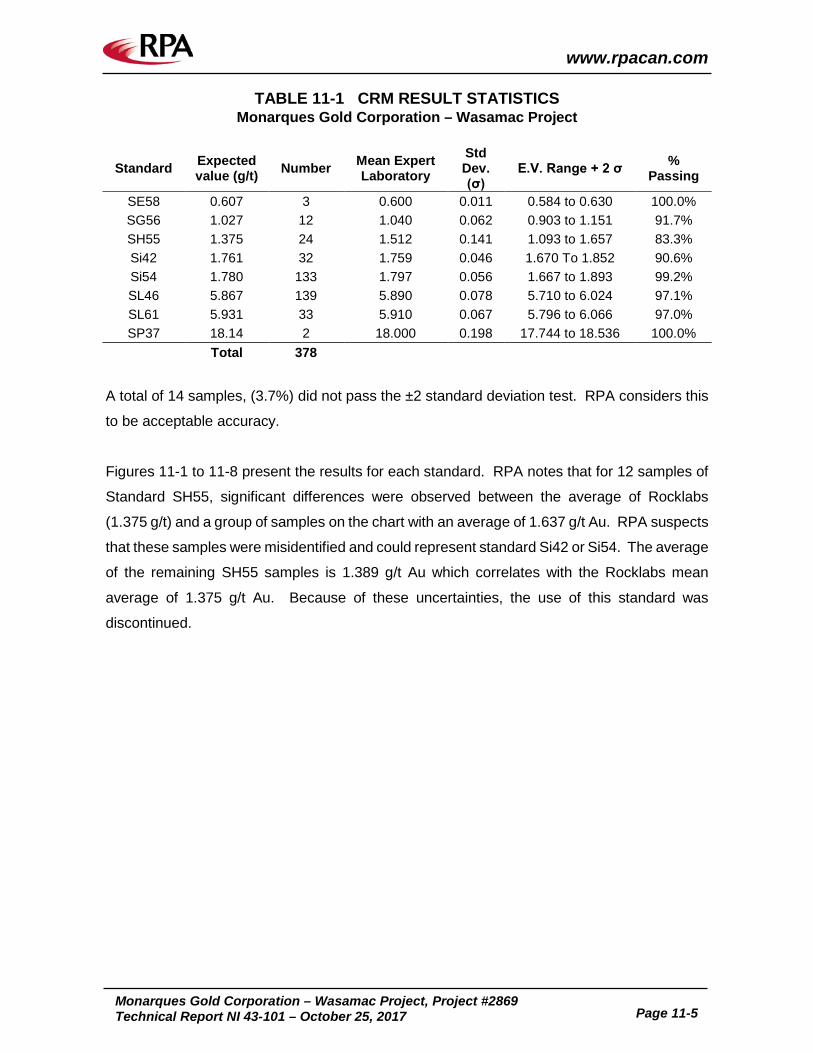
www.rpacan.com
Monarques Gold Corporation – Wasamac Project, Project #2869
Technical Report NI 43-101 – October 25, 2017 Page 11-5
TABLE 11-1 CRM RESULT STATISTICS Monarques Gold Corporation – Wasamac Project
Standard Expected value (g/t) Number Mean Expert
Laboratory Std Dev. (σ)
E.V. Range + 2 σ % Passing
SE58 0.607 3 0.600 0.011 0.584 to 0.630 100.0% SG56 1.027 12 1.040 0.062 0.903 to 1.151 91.7% SH55 1.375 24 1.512 0.141 1.093 to 1.657 83.3% Si42 1.761 32 1.759 0.046 1.670 To 1.852 90.6% Si54 1.780 133 1.797 0.056 1.667 to 1.893 99.2% SL46 5.867 139 5.890 0.078 5.710 to 6.024 97.1% SL61 5.931 33 5.910 0.067 5.796 to 6.066 97.0% SP37 18.14 2 18.000 0.198 17.744 to 18.536 100.0%
Total 378
A total of 14 samples, (3.7%) did not pass the ±2 standard deviation test. RPA considers this
to be acceptable accuracy.
Figures 11-1 to 11-8 present the results for each standard. RPA notes that for 12 samples of
Standard SH55, significant differences were observed between the average of Rocklabs
(1.375 g/t) and a group of samples on the chart with an average of 1.637 g/t Au. RPA suspects
that these samples were misidentified and could represent standard Si42 or Si54. The average
of the remaining SH55 samples is 1.389 g/t Au which correlates with the Rocklabs mean
average of 1.375 g/t Au. Because of these uncertainties, the use of this standard was
discontinued.
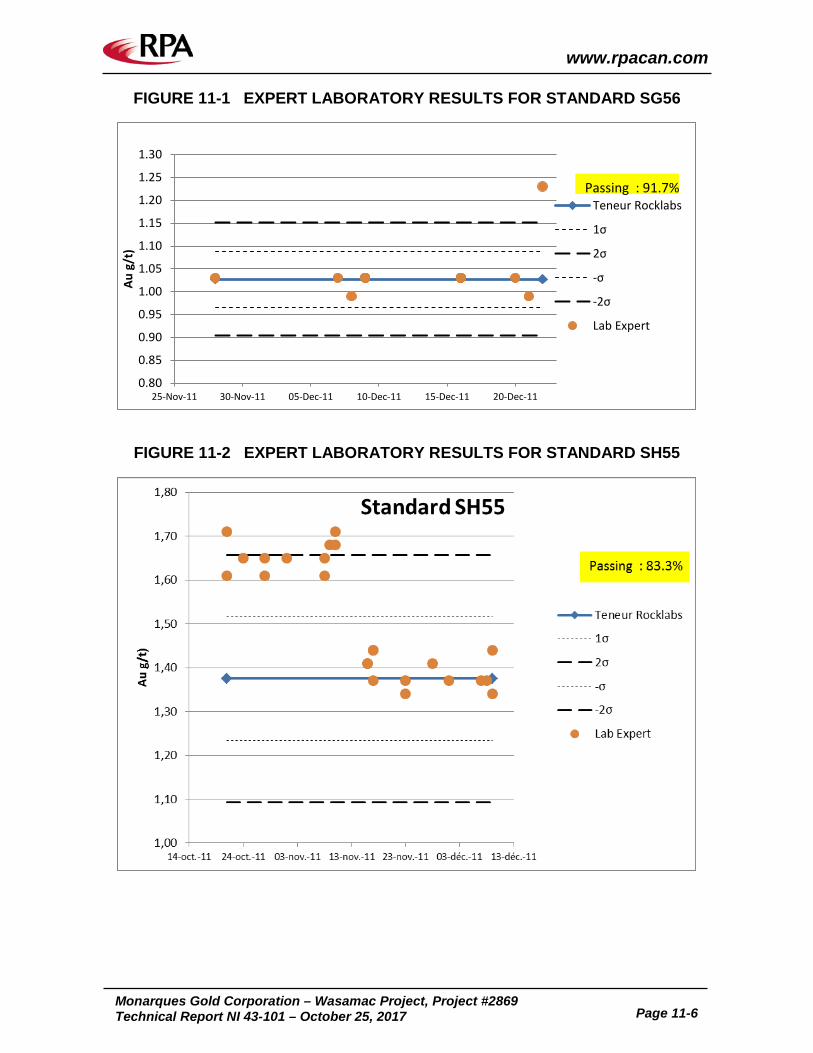
www.rpacan.com
Monarques Gold Corporation – Wasamac Project, Project #2869
Technical Report NI 43-101 – October 25, 2017 Page 11-6
FIGURE 11-1 EXPERT LABORATORY RESULTS FOR STANDARD SG56
FIGURE 11-2 EXPERT LABORATORY RESULTS FOR STANDARD SH55
0.80
0.85
0.90
0.95
1.00
1.05
1.10
1.15
1.20
1.25
1.30
25-Nov-11 30-Nov-11 05-Dec-11 10-Dec-11 15-Dec-11 20-Dec-11
Au g
/t)
Teneur Rocklabs
1σ
2σ
-σ
-2σ
Lab Expert
Passing : 91.7%
www.rpacan.com
Monarques Gold Corporation – Wasamac Project, Project #2869
Technical Report NI 43-101 – October 25, 2017 Page 11-7
FIGURE 11-3 EXPERT LABORATORY RESULTS FOR STANDARD SI42
FIGURE 11-4 EXPERT LABORATORY RESULTS FOR STANDARD SE58
1.60
1.65
1.70
1.75
1.80
1.85
1.90
2010/12/28 2011/01/17 2011/02/06 2011/02/26 2011/03/18 2011/04/07
Au g
/t)
Mean Rocklabs
1σ
2σ
-σ
-2σ
Lab Expert
Passing : 90.6%
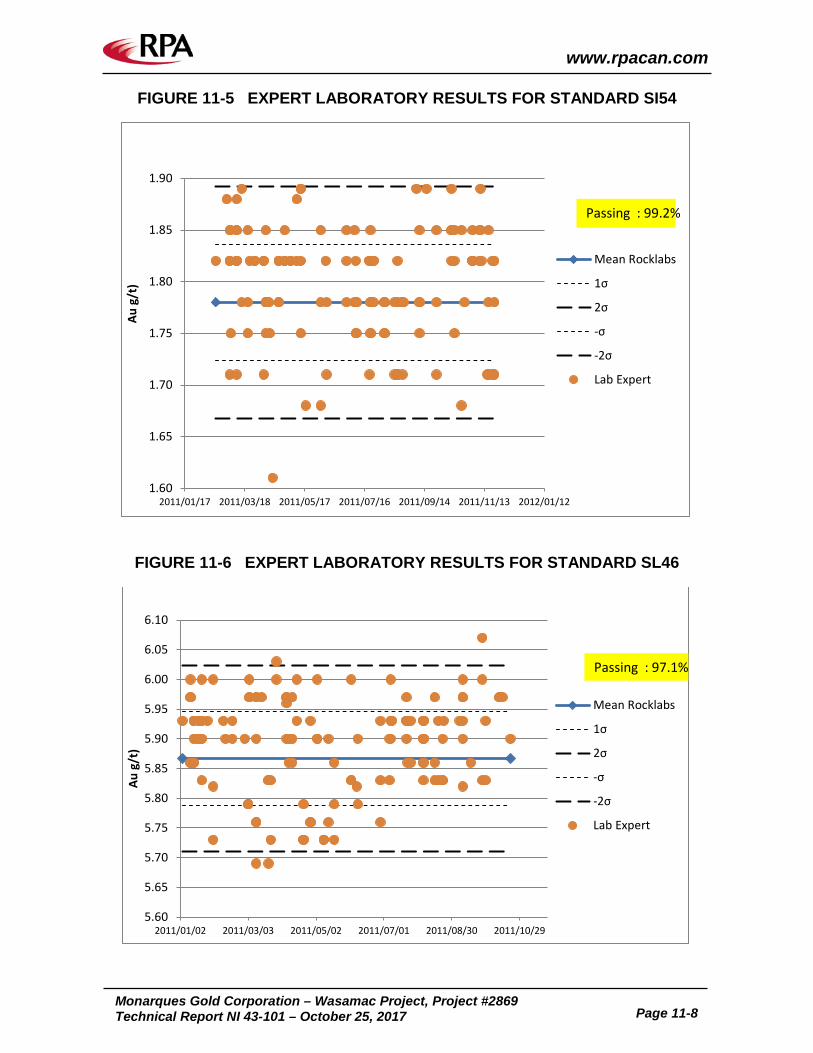
www.rpacan.com
Monarques Gold Corporation – Wasamac Project, Project #2869
Technical Report NI 43-101 – October 25, 2017 Page 11-8
FIGURE 11-5 EXPERT LABORATORY RESULTS FOR STANDARD SI54
FIGURE 11-6 EXPERT LABORATORY RESULTS FOR STANDARD SL46
1.60
1.65
1.70
1.75
1.80
1.85
1.90
2011/01/17 2011/03/18 2011/05/17 2011/07/16 2011/09/14 2011/11/13 2012/01/12
Au g
/t)
Mean Rocklabs
1σ
2σ
-σ
-2σ
Lab Expert
Passing : 99.2%
5.60
5.65
5.70
5.75
5.80
5.85
5.90
5.95
6.00
6.05
6.10
2011/01/02 2011/03/03 2011/05/02 2011/07/01 2011/08/30 2011/10/29
Au g
/t)
Mean Rocklabs
1σ
2σ
-σ
-2σ
Lab Expert
Passing : 97.1%
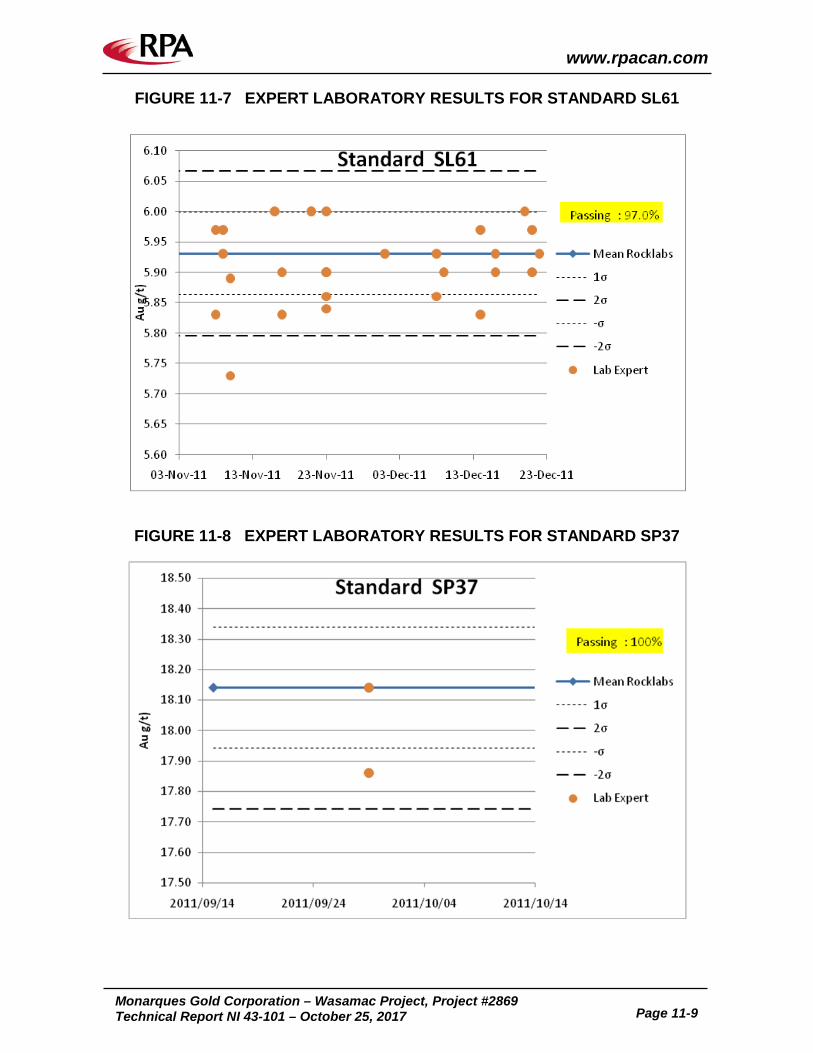
www.rpacan.com
Monarques Gold Corporation – Wasamac Project, Project #2869
Technical Report NI 43-101 – October 25, 2017 Page 11-9
FIGURE 11-7 EXPERT LABORATORY RESULTS FOR STANDARD SL61
FIGURE 11-8 EXPERT LABORATORY RESULTS FOR STANDARD SP37
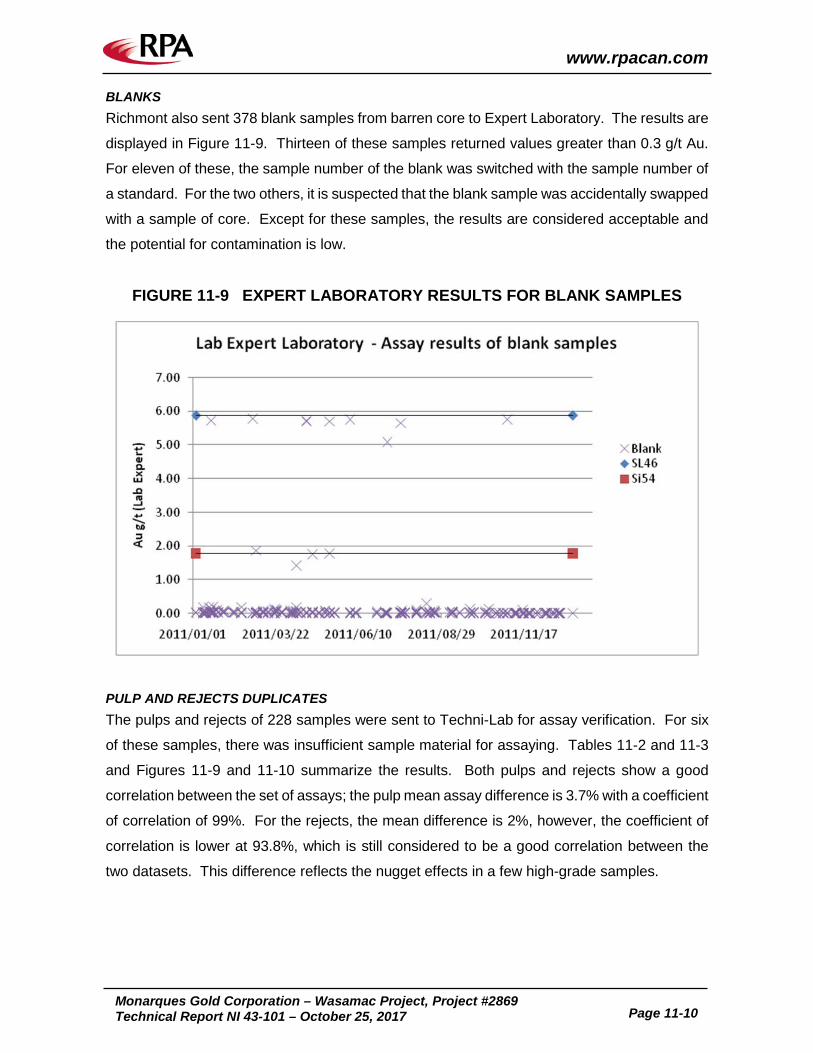
www.rpacan.com
Monarques Gold Corporation – Wasamac Project, Project #2869
Technical Report NI 43-101 – October 25, 2017 Page 11-10
BLANKS Richmont also sent 378 blank samples from barren core to Expert Laboratory. The results are
displayed in Figure 11-9. Thirteen of these samples returned values greater than 0.3 g/t Au.
For eleven of these, the sample number of the blank was switched with the sample number of
a standard. For the two others, it is suspected that the blank sample was accidentally swapped
with a sample of core. Except for these samples, the results are considered acceptable and
the potential for contamination is low.
FIGURE 11-9 EXPERT LABORATORY RESULTS FOR BLANK SAMPLES
PULP AND REJECTS DUPLICATES The pulps and rejects of 228 samples were sent to Techni-Lab for assay verification. For six
of these samples, there was insufficient sample material for assaying. Tables 11-2 and 11-3
and Figures 11-9 and 11-10 summarize the results. Both pulps and rejects show a good
correlation between the set of assays; the pulp mean assay difference is 3.7% with a coefficient
of correlation of 99%. For the rejects, the mean difference is 2%, however, the coefficient of
correlation is lower at 93.8%, which is still considered to be a good correlation between the
two datasets. This difference reflects the nugget effects in a few high-grade samples.
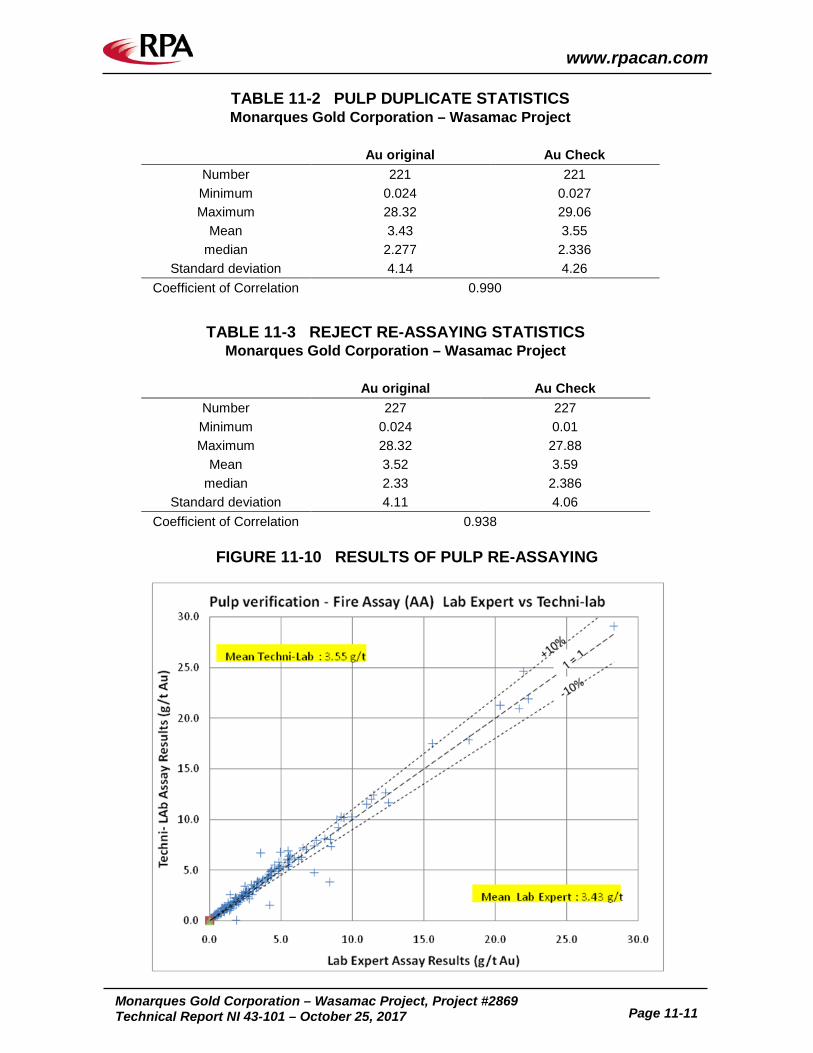
www.rpacan.com
Monarques Gold Corporation – Wasamac Project, Project #2869
Technical Report NI 43-101 – October 25, 2017 Page 11-11
TABLE 11-2 PULP DUPLICATE STATISTICS Monarques Gold Corporation – Wasamac Project
Au original Au Check
Number 221 221 Minimum 0.024 0.027 Maximum 28.32 29.06
Mean 3.43 3.55 median 2.277 2.336
Standard deviation 4.14 4.26 Coefficient of Correlation 0.990
TABLE 11-3 REJECT RE-ASSAYING STATISTICS Monarques Gold Corporation – Wasamac Project
Au original Au Check
Number 227 227 Minimum 0.024 0.01 Maximum 28.32 27.88
Mean 3.52 3.59 median 2.33 2.386
Standard deviation 4.11 4.06 Coefficient of Correlation 0.938
FIGURE 11-10 RESULTS OF PULP RE-ASSAYING
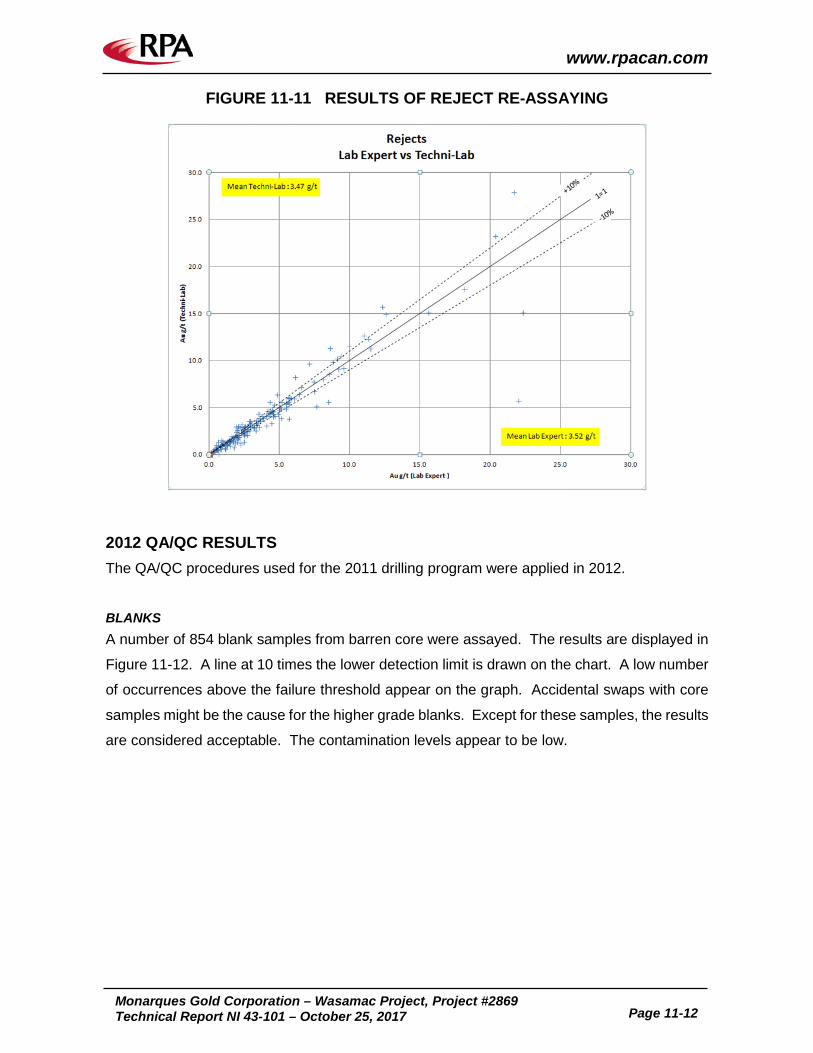
www.rpacan.com
Monarques Gold Corporation – Wasamac Project, Project #2869
Technical Report NI 43-101 – October 25, 2017 Page 11-12
FIGURE 11-11 RESULTS OF REJECT RE-ASSAYING
2012 QA/QC RESULTS The QA/QC procedures used for the 2011 drilling program were applied in 2012.
BLANKS A number of 854 blank samples from barren core were assayed. The results are displayed in
Figure 11-12. A line at 10 times the lower detection limit is drawn on the chart. A low number
of occurrences above the failure threshold appear on the graph. Accidental swaps with core
samples might be the cause for the higher grade blanks. Except for these samples, the results
are considered acceptable. The contamination levels appear to be low.
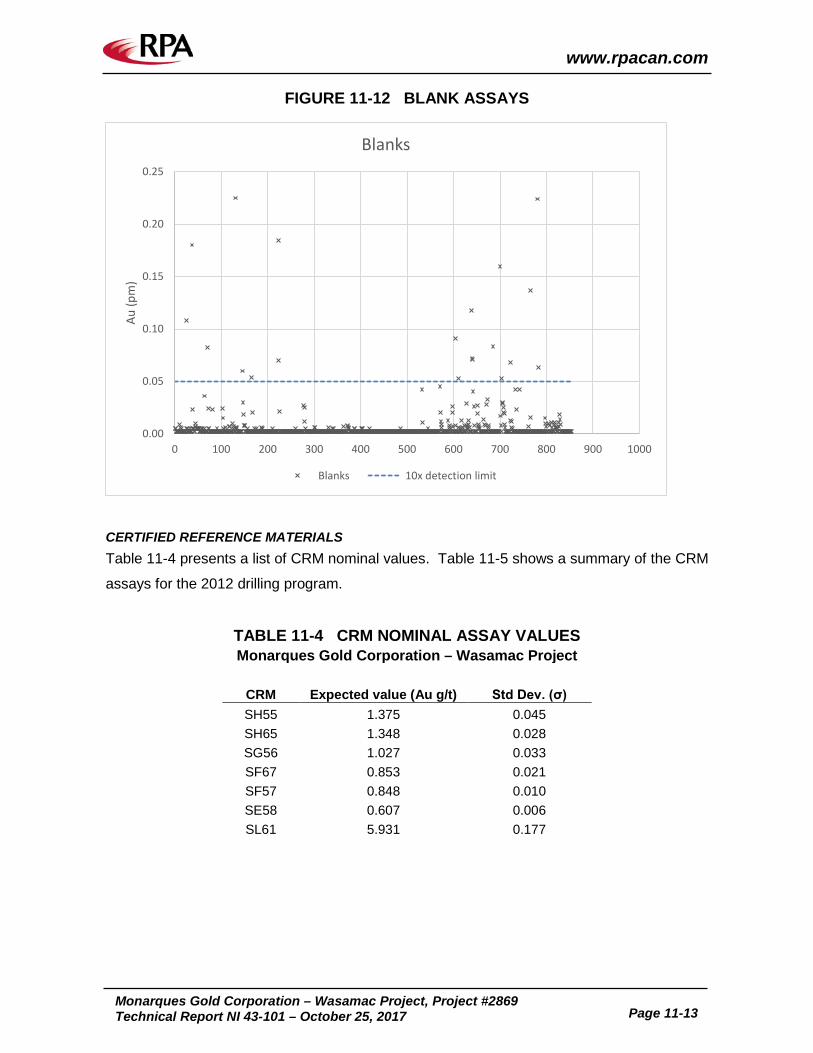
www.rpacan.com
Monarques Gold Corporation – Wasamac Project, Project #2869
Technical Report NI 43-101 – October 25, 2017 Page 11-13
FIGURE 11-12 BLANK ASSAYS
CERTIFIED REFERENCE MATERIALS Table 11-4 presents a list of CRM nominal values. Table 11-5 shows a summary of the CRM
assays for the 2012 drilling program.
TABLE 11-4 CRM NOMINAL ASSAY VALUES Monarques Gold Corporation – Wasamac Project
CRM Expected value (Au g/t) Std Dev. (σ) SH55 1.375 0.045 SH65 1.348 0.028 SG56 1.027 0.033 SF67 0.853 0.021 SF57 0.848 0.010 SE58 0.607 0.006 SL61 5.931 0.177
0.00
0.05
0.10
0.15
0.20
0.25
0 100 200 300 400 500 600 700 800 900 1000
Au (p
m)
Blanks
Blanks 10x detection limit
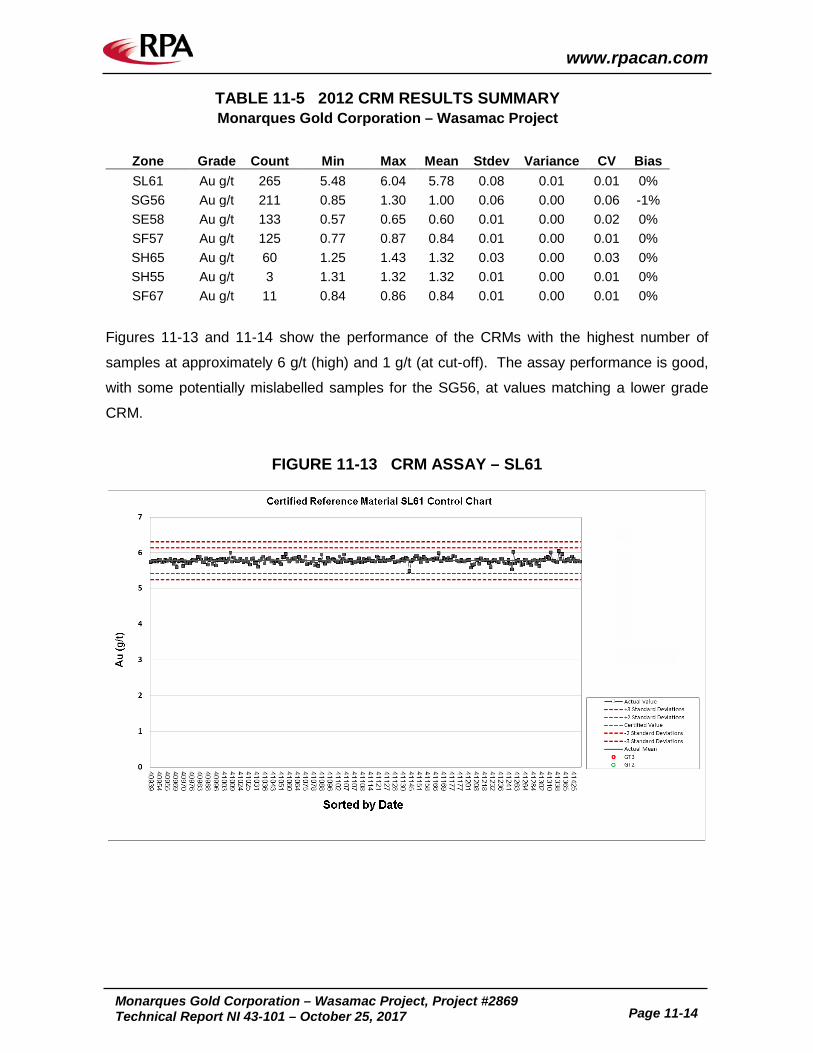
www.rpacan.com
Monarques Gold Corporation – Wasamac Project, Project #2869
Technical Report NI 43-101 – October 25, 2017 Page 11-14
TABLE 11-5 2012 CRM RESULTS SUMMARY Monarques Gold Corporation – Wasamac Project
Zone Grade Count Min Max Mean Stdev Variance CV Bias SL61 Au g/t 265 5.48 6.04 5.78 0.08 0.01 0.01 0% SG56 Au g/t 211 0.85 1.30 1.00 0.06 0.00 0.06 -1% SE58 Au g/t 133 0.57 0.65 0.60 0.01 0.00 0.02 0% SF57 Au g/t 125 0.77 0.87 0.84 0.01 0.00 0.01 0% SH65 Au g/t 60 1.25 1.43 1.32 0.03 0.00 0.03 0% SH55 Au g/t 3 1.31 1.32 1.32 0.01 0.00 0.01 0% SF67 Au g/t 11 0.84 0.86 0.84 0.01 0.00 0.01 0%
Figures 11-13 and 11-14 show the performance of the CRMs with the highest number of
samples at approximately 6 g/t (high) and 1 g/t (at cut-off). The assay performance is good,
with some potentially mislabelled samples for the SG56, at values matching a lower grade
CRM.
FIGURE 11-13 CRM ASSAY – SL61
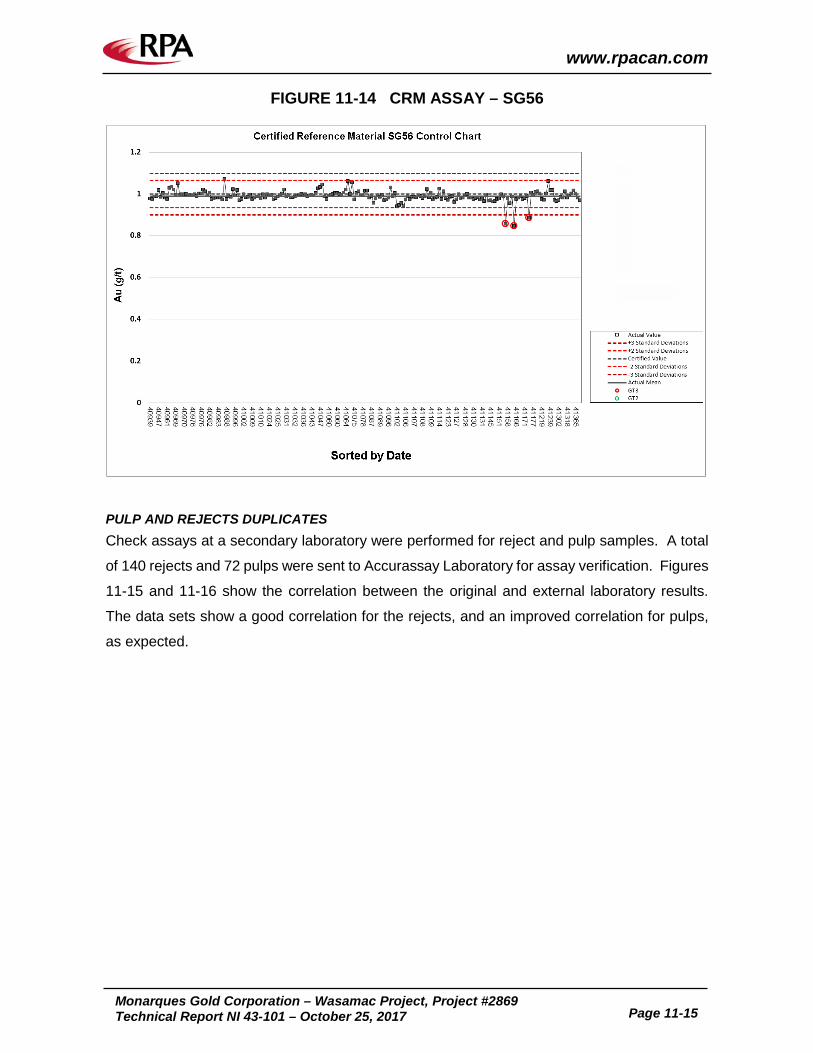
www.rpacan.com
Monarques Gold Corporation – Wasamac Project, Project #2869
Technical Report NI 43-101 – October 25, 2017 Page 11-15
FIGURE 11-14 CRM ASSAY – SG56
PULP AND REJECTS DUPLICATES Check assays at a secondary laboratory were performed for reject and pulp samples. A total
of 140 rejects and 72 pulps were sent to Accurassay Laboratory for assay verification. Figures
11-15 and 11-16 show the correlation between the original and external laboratory results.
The data sets show a good correlation for the rejects, and an improved correlation for pulps,
as expected.
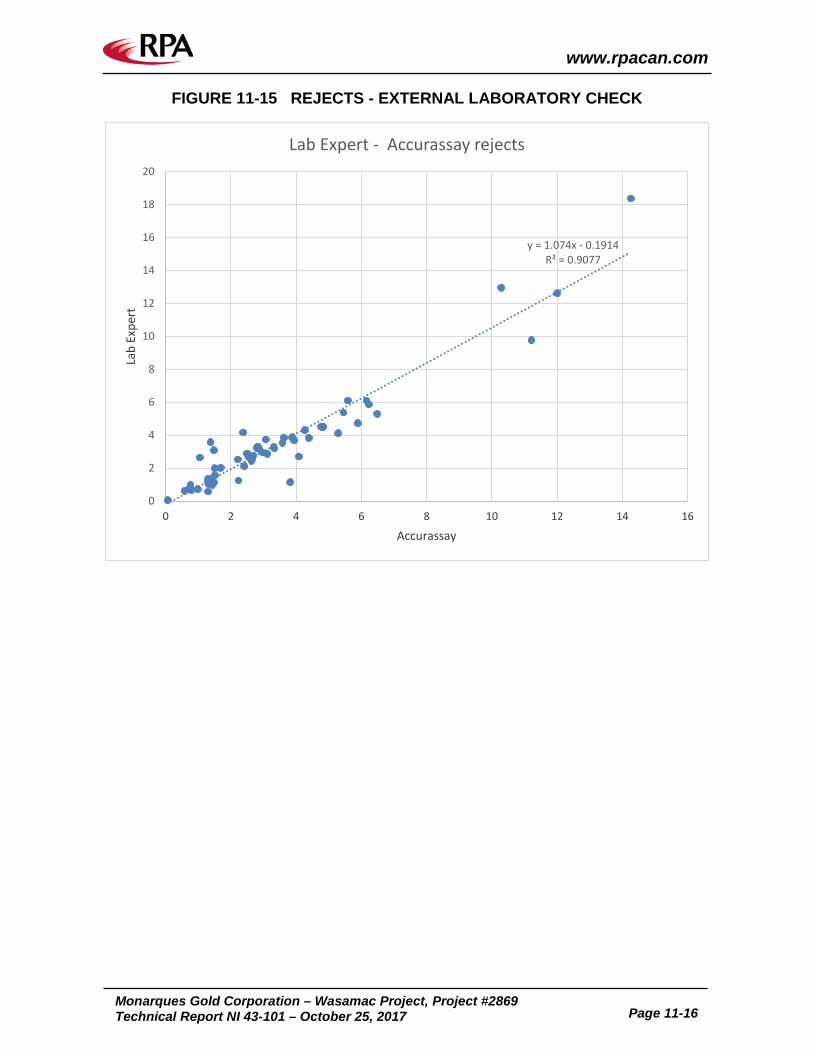
www.rpacan.com
Monarques Gold Corporation – Wasamac Project, Project #2869
Technical Report NI 43-101 – October 25, 2017 Page 11-16
FIGURE 11-15 REJECTS - EXTERNAL LABORATORY CHECK
y = 1.074x - 0.1914R² = 0.9077
0
2
4
6
8
10
12
14
16
18
20
0 2 4 6 8 10 12 14 16
Lab
Expe
rt
Accurassay
Lab Expert - Accurassay rejects
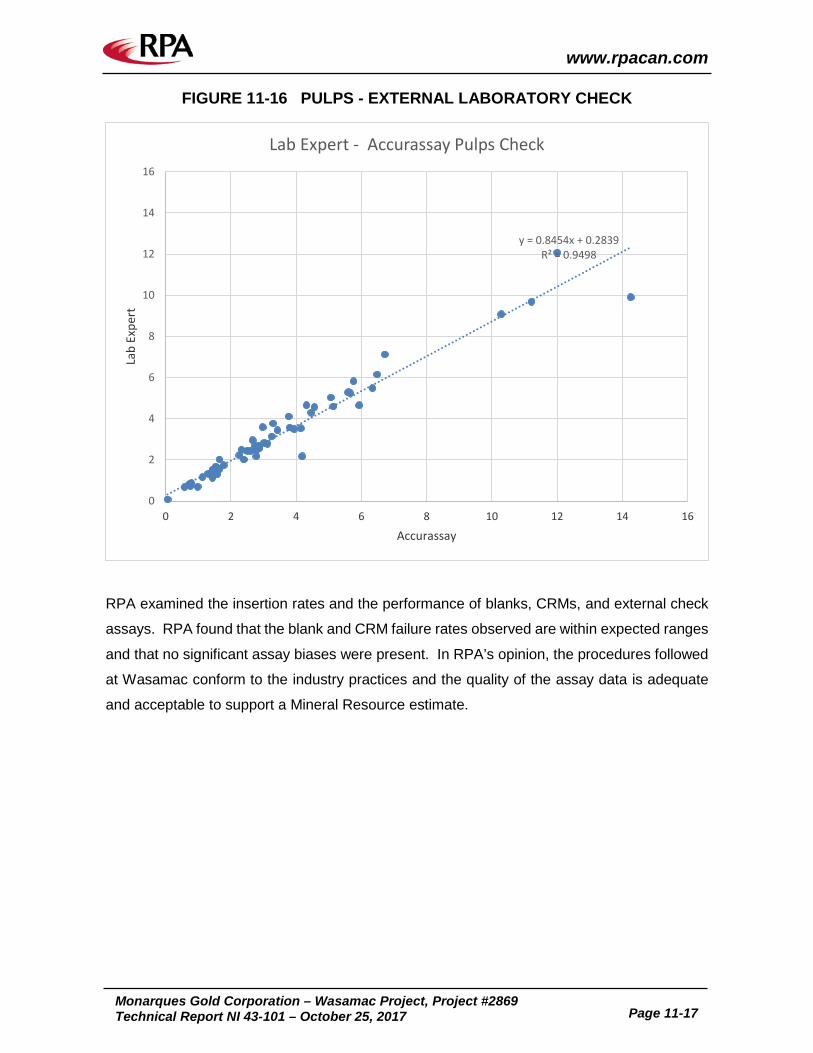
www.rpacan.com
Monarques Gold Corporation – Wasamac Project, Project #2869
Technical Report NI 43-101 – October 25, 2017 Page 11-17
FIGURE 11-16 PULPS - EXTERNAL LABORATORY CHECK
RPA examined the insertion rates and the performance of blanks, CRMs, and external check
assays. RPA found that the blank and CRM failure rates observed are within expected ranges
and that no significant assay biases were present. In RPA’s opinion, the procedures followed
at Wasamac conform to the industry practices and the quality of the assay data is adequate
and acceptable to support a Mineral Resource estimate.
y = 0.8454x + 0.2839R² = 0.9498
0
2
4
6
8
10
12
14
16
0 2 4 6 8 10 12 14 16
Lab
Expe
rt
Accurassay
Lab Expert - Accurassay Pulps Check
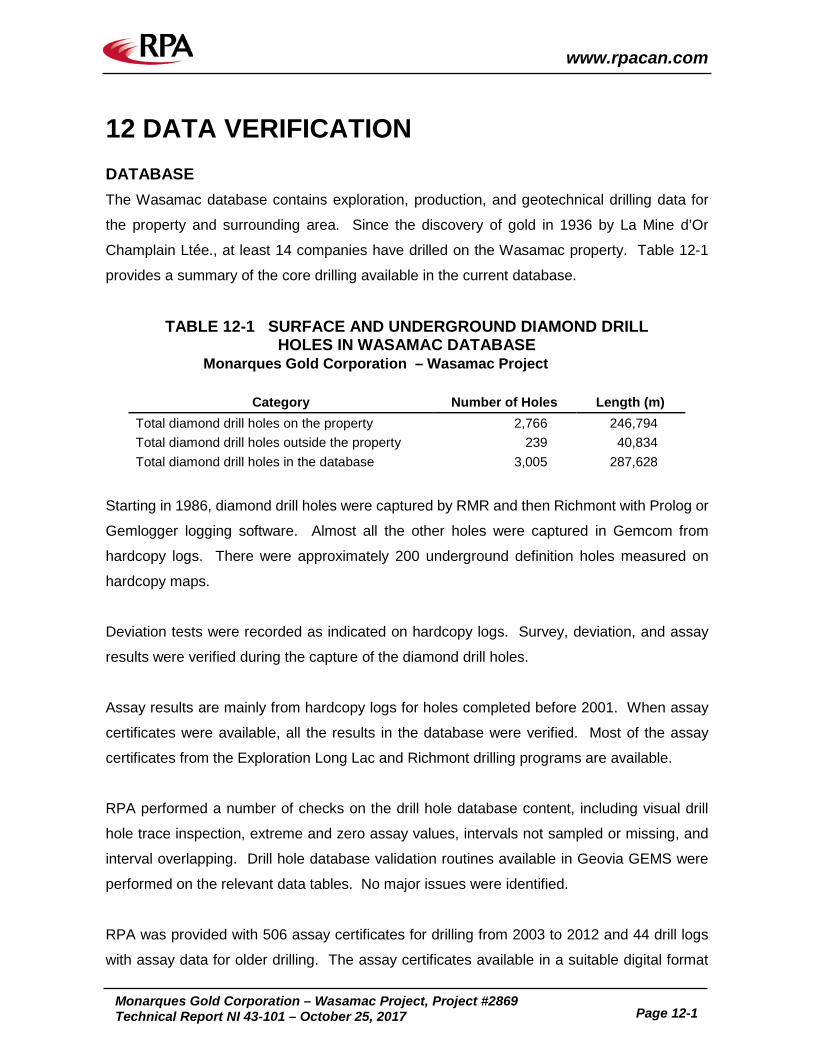
www.rpacan.com
Monarques Gold Corporation – Wasamac Project, Project #2869
Technical Report NI 43-101 – October 25, 2017 Page 12-1
12 DATA VERIFICATION DATABASE The Wasamac database contains exploration, production, and geotechnical drilling data for
the property and surrounding area. Since the discovery of gold in 1936 by La Mine d’Or
Champlain Ltée., at least 14 companies have drilled on the Wasamac property. Table 12-1
provides a summary of the core drilling available in the current database.
TABLE 12-1 SURFACE AND UNDERGROUND DIAMOND DRILL HOLES IN WASAMAC DATABASE
Monarques Gold Corporation – Wasamac Project
Category Number of Holes Length (m) Total diamond drill holes on the property 2,766 246,794 Total diamond drill holes outside the property 239 40,834 Total diamond drill holes in the database 3,005 287,628
Starting in 1986, diamond drill holes were captured by RMR and then Richmont with Prolog or
Gemlogger logging software. Almost all the other holes were captured in Gemcom from
hardcopy logs. There were approximately 200 underground definition holes measured on
hardcopy maps.
Deviation tests were recorded as indicated on hardcopy logs. Survey, deviation, and assay
results were verified during the capture of the diamond drill holes.
Assay results are mainly from hardcopy logs for holes completed before 2001. When assay
certificates were available, all the results in the database were verified. Most of the assay
certificates from the Exploration Long Lac and Richmont drilling programs are available.
RPA performed a number of checks on the drill hole database content, including visual drill
hole trace inspection, extreme and zero assay values, intervals not sampled or missing, and
interval overlapping. Drill hole database validation routines available in Geovia GEMS were
performed on the relevant data tables. No major issues were identified.
RPA was provided with 506 assay certificates for drilling from 2003 to 2012 and 44 drill logs
with assay data for older drilling. The assay certificates available in a suitable digital format
www.rpacan.com
Monarques Gold Corporation – Wasamac Project, Project #2869
Technical Report NI 43-101 – October 25, 2017 Page 12-2
were compiled and then used for comparison with database gold grades for matched samples.
Approximately 20,000 assays were checked, representing approximately 25% of the assay
database. Spot checks were performed on randomly selected intervals from eight drill holes
with log data for approximately 200 samples. No errors were found.
RPA is of the opinion that the drill hole database complies with the industry standards and is
adequate for Mineral Resource estimation.
A large number of wall channel samples were taken during the development of the Wasamac
Mine, from 1944 to 1970, and most of them are present in the database. Channel samples
have been captured with Promine software and then imported in GEMS. Sample length was
indicated on the maps. Later, documents with channel length, assay results, and location were
found in the archives. After inspecting the channel sampling location and continuity, and
comparing them on plans with the closest drilling, RPA decided not to use the channel sample
data for resource estimation.
Mr. Tudorel Ciuculescu, P.Geo, RPA Senior Geologist, carried out a site visit on September
29 and 30, 2017. During the site visit, Mr. Ciuculescu reviewed drill core and logs from several
drill holes and visited drilling collar locations on the property. Several collar positions were
recorded with a hand-held GPS and were found to be within several metres from the
coordinates in the database.
www.rpacan.com
Monarques Gold Corporation – Wasamac Project, Project #2869
Technical Report NI 43-101 – October 25, 2017 Page 13-1
13 MINERAL PROCESSING AND METALLURGICAL TESTING Monarques has completed no metallurgical testwork. The following relates to previous
testwork and is taken from Gauthier et al. (2012).
BBA Inc. (BBA) was retained to complete the preliminary design of a gold processing plant for
the Wasamac Project. The study involved a review of past metallurgical testwork, the
identification, coordination, and management of a new testwork program, the development of
a preliminary process flow sheet and mass balance as well as the calculation of the capital
and operating costs for the selected process flow sheet.
METALLURGICAL TESTWORK PROGRAMS
2010 TESTWORK A testwork program was conducted in 2010 at the URSTM on a sample of Zone 2 material.
Mineralogical observation of the sample revealed that the gold is fine grained, with the majority
measuring less than 5 µm. A Bond ball work index (BWI) of 13.7 kWh/t was measured. Gravity
recovery testwork was not successful and further testwork results indicated that a combined
flotation/leaching process achieved an overall gold recovery of approximately 87%. The whole
rock leach tests performed for 24 hours on samples ground between 120 µm and 45 µm
resulted in recoveries ranging between 82% and 86% respectively.
2012 TESTWORK For the 2012 metallurgical testwork program, representative core samples of the Main Zone,
Zone 1, Zone 2, and Zone 3 were selected by the geologists at Richmont and sent to SGS
Lakefield. The 2012 testwork program included: mineralogical analysis of the Main Zone, Zone
1, and Zone 2 samples by gold deportment study, investigation of gold recovery by whole rock
leaching versus flotation followed by leaching of both tailings and re-ground concentrate
products.
Environmental tests, including acid base accounting (ABA) and toxicity characteristic leaching
procedure (TCLP) tests, on both the whole rock leach and flotation/leaching solid residues
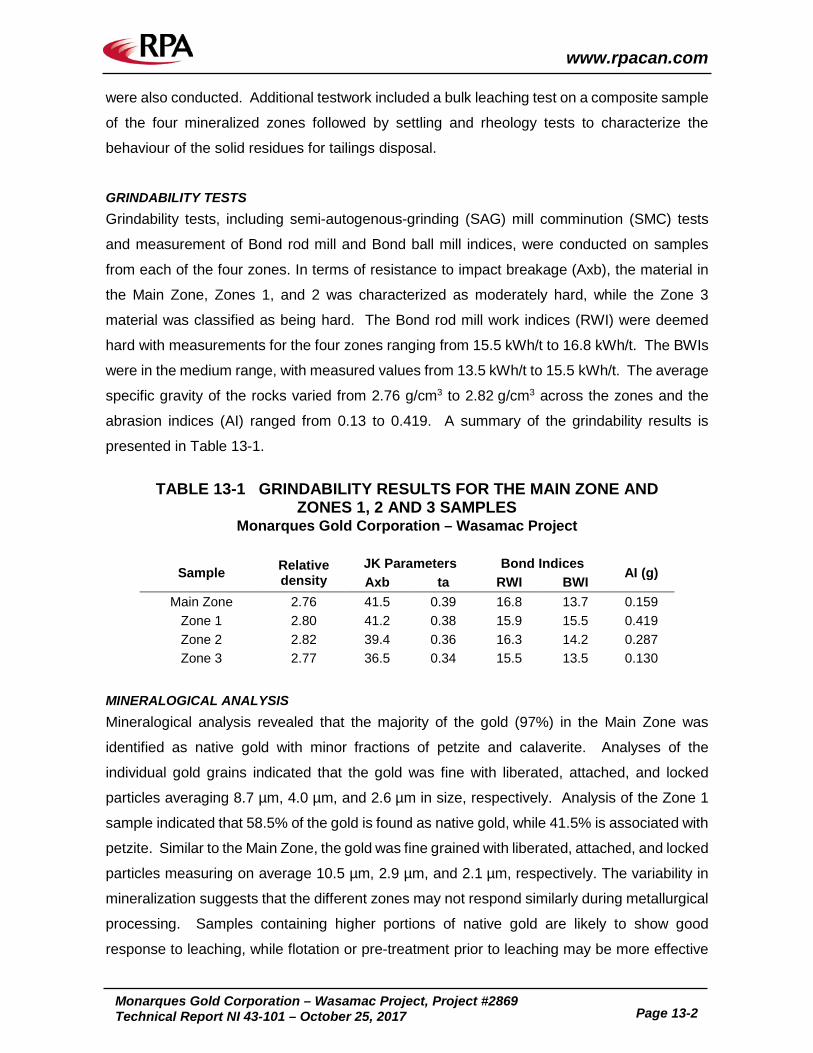
www.rpacan.com
Monarques Gold Corporation – Wasamac Project, Project #2869
Technical Report NI 43-101 – October 25, 2017 Page 13-2
were also conducted. Additional testwork included a bulk leaching test on a composite sample
of the four mineralized zones followed by settling and rheology tests to characterize the
behaviour of the solid residues for tailings disposal.
GRINDABILITY TESTS Grindability tests, including semi-autogenous-grinding (SAG) mill comminution (SMC) tests
and measurement of Bond rod mill and Bond ball mill indices, were conducted on samples
from each of the four zones. In terms of resistance to impact breakage (Axb), the material in
the Main Zone, Zones 1, and 2 was characterized as moderately hard, while the Zone 3
material was classified as being hard. The Bond rod mill work indices (RWI) were deemed
hard with measurements for the four zones ranging from 15.5 kWh/t to 16.8 kWh/t. The BWIs
were in the medium range, with measured values from 13.5 kWh/t to 15.5 kWh/t. The average
specific gravity of the rocks varied from 2.76 g/cm3 to 2.82 g/cm3 across the zones and the
abrasion indices (AI) ranged from 0.13 to 0.419. A summary of the grindability results is
presented in Table 13-1.
TABLE 13-1 GRINDABILITY RESULTS FOR THE MAIN ZONE AND
ZONES 1, 2 AND 3 SAMPLES Monarques Gold Corporation – Wasamac Project
Sample Relative density
JK Parameters Bond Indices AI (g)
Axb ta RWI BWI Main Zone 2.76 41.5 0.39 16.8 13.7 0.159
Zone 1 2.80 41.2 0.38 15.9 15.5 0.419 Zone 2 2.82 39.4 0.36 16.3 14.2 0.287 Zone 3 2.77 36.5 0.34 15.5 13.5 0.130
MINERALOGICAL ANALYSIS Mineralogical analysis revealed that the majority of the gold (97%) in the Main Zone was
identified as native gold with minor fractions of petzite and calaverite. Analyses of the
individual gold grains indicated that the gold was fine with liberated, attached, and locked
particles averaging 8.7 µm, 4.0 µm, and 2.6 µm in size, respectively. Analysis of the Zone 1
sample indicated that 58.5% of the gold is found as native gold, while 41.5% is associated with
petzite. Similar to the Main Zone, the gold was fine grained with liberated, attached, and locked
particles measuring on average 10.5 µm, 2.9 µm, and 2.1 µm, respectively. The variability in
mineralization suggests that the different zones may not respond similarly during metallurgical
processing. Samples containing higher portions of native gold are likely to show good
response to leaching, while flotation or pre-treatment prior to leaching may be more effective
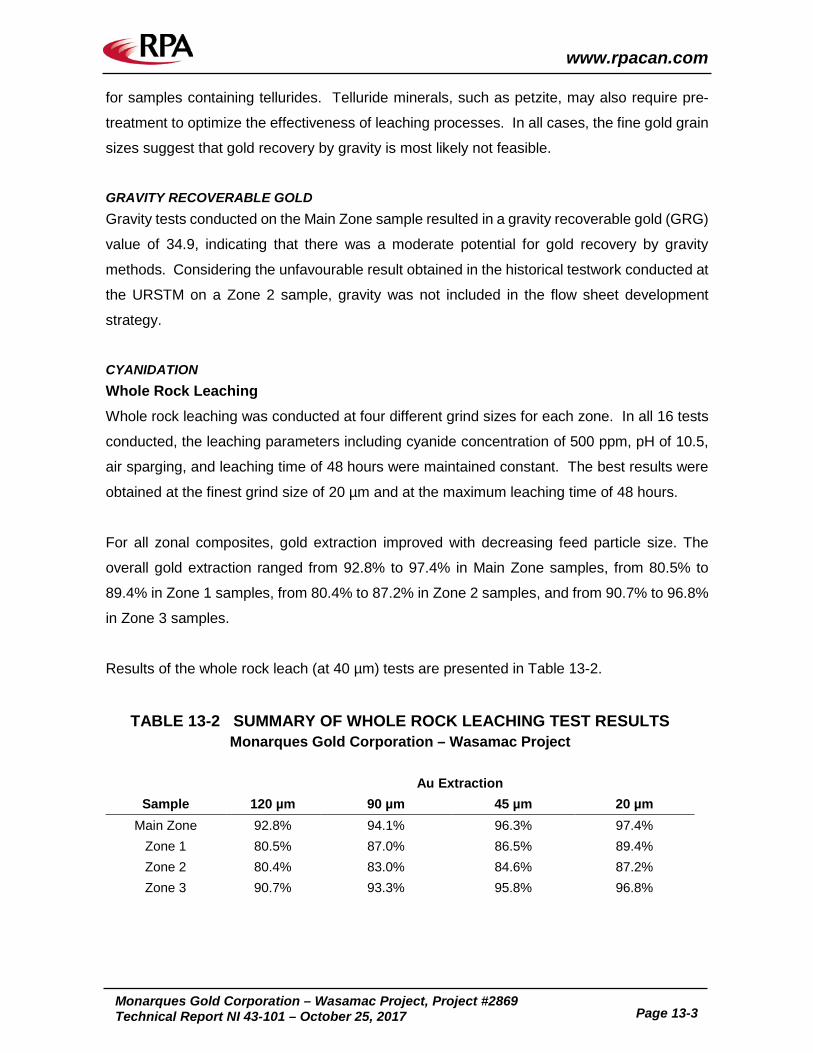
www.rpacan.com
Monarques Gold Corporation – Wasamac Project, Project #2869
Technical Report NI 43-101 – October 25, 2017 Page 13-3
for samples containing tellurides. Telluride minerals, such as petzite, may also require pre-
treatment to optimize the effectiveness of leaching processes. In all cases, the fine gold grain
sizes suggest that gold recovery by gravity is most likely not feasible.
GRAVITY RECOVERABLE GOLD Gravity tests conducted on the Main Zone sample resulted in a gravity recoverable gold (GRG)
value of 34.9, indicating that there was a moderate potential for gold recovery by gravity
methods. Considering the unfavourable result obtained in the historical testwork conducted at
the URSTM on a Zone 2 sample, gravity was not included in the flow sheet development
strategy.
CYANIDATION Whole Rock Leaching
Whole rock leaching was conducted at four different grind sizes for each zone. In all 16 tests
conducted, the leaching parameters including cyanide concentration of 500 ppm, pH of 10.5,
air sparging, and leaching time of 48 hours were maintained constant. The best results were
obtained at the finest grind size of 20 µm and at the maximum leaching time of 48 hours.
For all zonal composites, gold extraction improved with decreasing feed particle size. The
overall gold extraction ranged from 92.8% to 97.4% in Main Zone samples, from 80.5% to
89.4% in Zone 1 samples, from 80.4% to 87.2% in Zone 2 samples, and from 90.7% to 96.8%
in Zone 3 samples.
Results of the whole rock leach (at 40 µm) tests are presented in Table 13-2.
TABLE 13-2 SUMMARY OF WHOLE ROCK LEACHING TEST RESULTS Monarques Gold Corporation – Wasamac Project
Au Extraction
Sample 120 µm 90 µm 45 µm 20 µm Main Zone 92.8% 94.1% 96.3% 97.4%
Zone 1 80.5% 87.0% 86.5% 89.4% Zone 2 80.4% 83.0% 84.6% 87.2% Zone 3 90.7% 93.3% 95.8% 96.8%
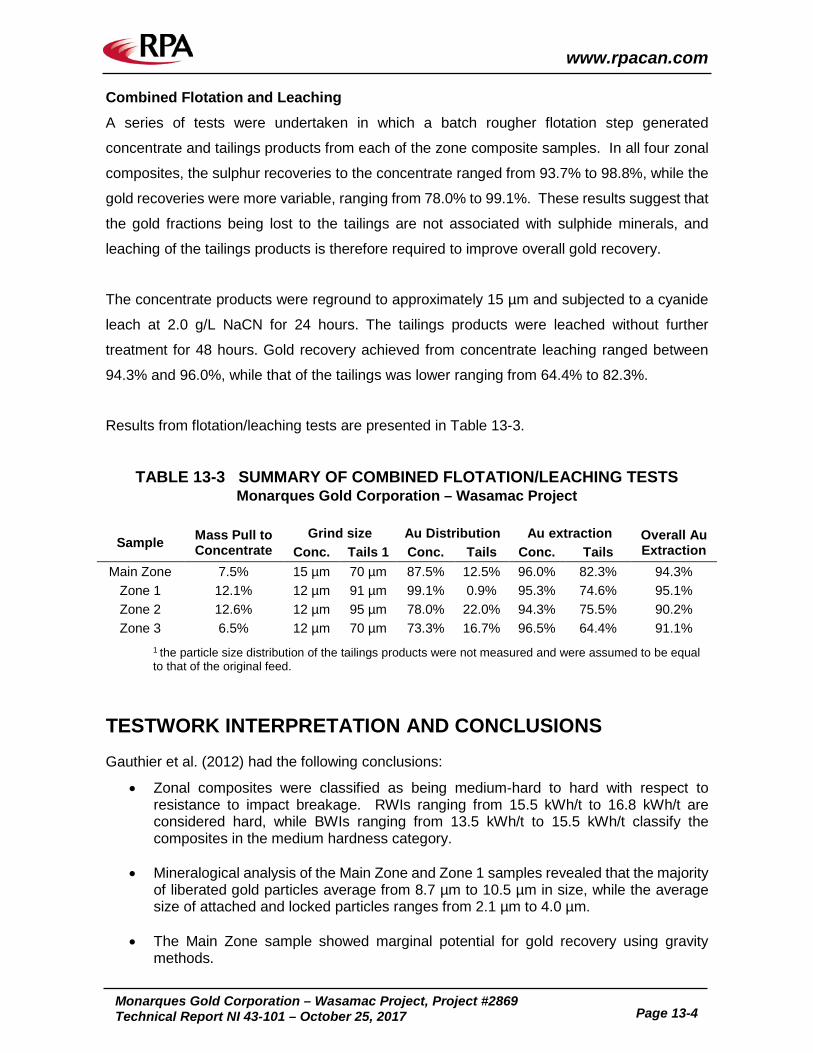
www.rpacan.com
Monarques Gold Corporation – Wasamac Project, Project #2869
Technical Report NI 43-101 – October 25, 2017 Page 13-4
Combined Flotation and Leaching
A series of tests were undertaken in which a batch rougher flotation step generated
concentrate and tailings products from each of the zone composite samples. In all four zonal
composites, the sulphur recoveries to the concentrate ranged from 93.7% to 98.8%, while the
gold recoveries were more variable, ranging from 78.0% to 99.1%. These results suggest that
the gold fractions being lost to the tailings are not associated with sulphide minerals, and
leaching of the tailings products is therefore required to improve overall gold recovery.
The concentrate products were reground to approximately 15 µm and subjected to a cyanide
leach at 2.0 g/L NaCN for 24 hours. The tailings products were leached without further
treatment for 48 hours. Gold recovery achieved from concentrate leaching ranged between
94.3% and 96.0%, while that of the tailings was lower ranging from 64.4% to 82.3%.
Results from flotation/leaching tests are presented in Table 13-3.
TABLE 13-3 SUMMARY OF COMBINED FLOTATION/LEACHING TESTS Monarques Gold Corporation – Wasamac Project
Sample Mass Pull to Concentrate
Grind size Au Distribution Au extraction Overall Au Extraction Conc. Tails 1 Conc. Tails Conc. Tails
Main Zone 7.5% 15 µm 70 µm 87.5% 12.5% 96.0% 82.3% 94.3% Zone 1 12.1% 12 µm 91 µm 99.1% 0.9% 95.3% 74.6% 95.1% Zone 2 12.6% 12 µm 95 µm 78.0% 22.0% 94.3% 75.5% 90.2% Zone 3 6.5% 12 µm 70 µm 73.3% 16.7% 96.5% 64.4% 91.1%
1 the particle size distribution of the tailings products were not measured and were assumed to be equal to that of the original feed.
TESTWORK INTERPRETATION AND CONCLUSIONS Gauthier et al. (2012) had the following conclusions:
• Zonal composites were classified as being medium-hard to hard with respect to resistance to impact breakage. RWIs ranging from 15.5 kWh/t to 16.8 kWh/t are considered hard, while BWIs ranging from 13.5 kWh/t to 15.5 kWh/t classify the composites in the medium hardness category.
• Mineralogical analysis of the Main Zone and Zone 1 samples revealed that the majority
of liberated gold particles average from 8.7 µm to 10.5 µm in size, while the average size of attached and locked particles ranges from 2.1 µm to 4.0 µm.
• The Main Zone sample showed marginal potential for gold recovery using gravity
methods.

www.rpacan.com
Monarques Gold Corporation – Wasamac Project, Project #2869
Technical Report NI 43-101 – October 25, 2017 Page 13-5
• Flotation testwork followed by leaching of both the tailings and reground concentrate products conducted using all four zonal composites resulted in overall gold recoveries ranging from 90.2% to 95.1%.
• Whole rock leaching test conducted on the four zonal composites ground to 45 µm
resulted in gold recoveries of 84.6% to 96.3%.
• A technico-economic trade-off study was conducted to compare the combined flotation/leaching and whole rock leach options. Based on the results, the whole rock leach option was selected.
• The whole rock leach flow sheet was designed for a final grind size P80 of 40 µm and a
leaching retention time of 48 hours. The overall gold recovery was assumed to be 90.2% based on the blending of the four zonal composites over the life of mine, as provided by Richmont.
TESTWORK RECOMMENDATIONS Gauthier et al. (2012) had the following recommendations for future testwork:
• Test both the whole rock leach and combined flotation/leaching flow sheet options on a larger number of samples.
• Carry out additional grindability testwork to ensure accurate sizing of the SAG and ball
mills.
• Investigate the optimization of gold leaching through the use of oxygen and lead nitrate addition. Improvements in recovery and kinetics may result in decreased number or size of leach tanks required.
• Conduct cyanide destruction tests.
• Continue with environmental testing of residue samples.
• Conduct settling and rheology tests on residues of the selected flow sheet to allow for
accurate pump, tailings pipeline, and tailings impoundment sizing.
• Recommended budget of approximately $500,000 for the next phase of metallurgical testwork.
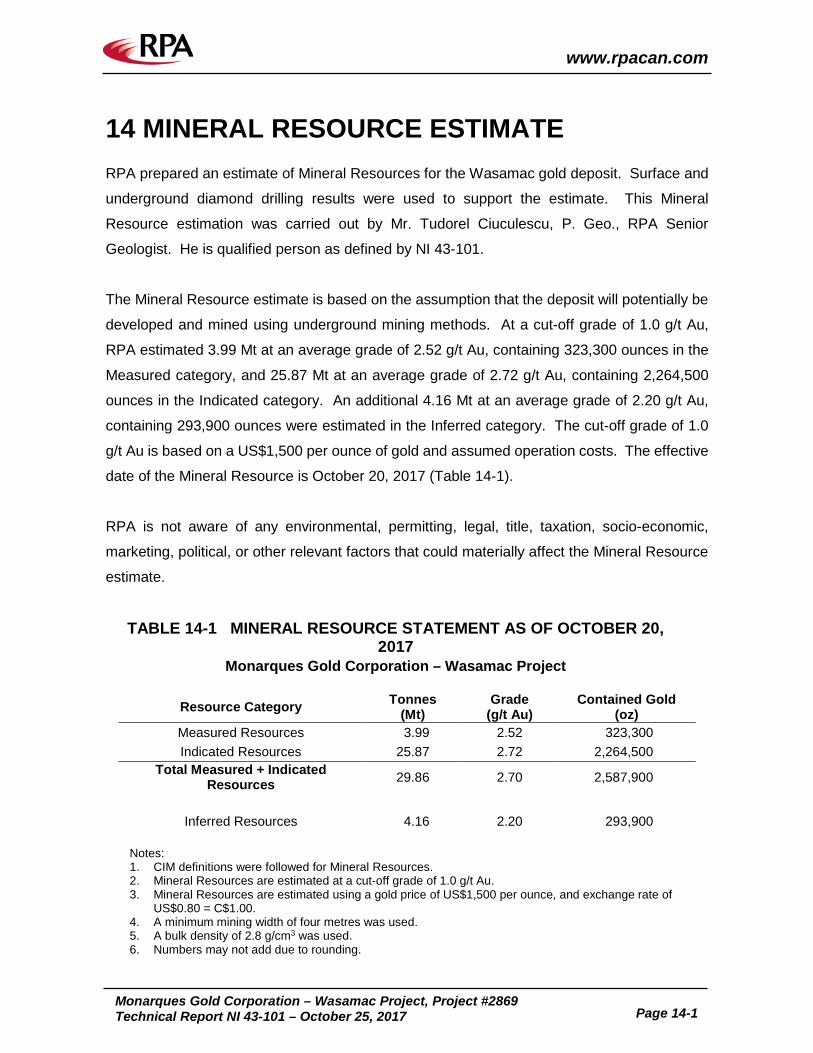
www.rpacan.com
Monarques Gold Corporation – Wasamac Project, Project #2869 Technical Report NI 43-101 – October 25, 2017 Page 14-1
14 MINERAL RESOURCE ESTIMATE RPA prepared an estimate of Mineral Resources for the Wasamac gold deposit. Surface and
underground diamond drilling results were used to support the estimate. This Mineral
Resource estimation was carried out by Mr. Tudorel Ciuculescu, P. Geo., RPA Senior
Geologist. He is qualified person as defined by NI 43-101.
The Mineral Resource estimate is based on the assumption that the deposit will potentially be
developed and mined using underground mining methods. At a cut-off grade of 1.0 g/t Au,
RPA estimated 3.99 Mt at an average grade of 2.52 g/t Au, containing 323,300 ounces in the
Measured category, and 25.87 Mt at an average grade of 2.72 g/t Au, containing 2,264,500
ounces in the Indicated category. An additional 4.16 Mt at an average grade of 2.20 g/t Au,
containing 293,900 ounces were estimated in the Inferred category. The cut-off grade of 1.0
g/t Au is based on a US$1,500 per ounce of gold and assumed operation costs. The effective
date of the Mineral Resource is October 20, 2017 (Table 14-1).
RPA is not aware of any environmental, permitting, legal, title, taxation, socio-economic,
marketing, political, or other relevant factors that could materially affect the Mineral Resource
estimate.
TABLE 14-1 MINERAL RESOURCE STATEMENT AS OF OCTOBER 20, 2017
Monarques Gold Corporation – Wasamac Project
Resource Category Tonnes (Mt)
Grade (g/t Au)
Contained Gold (oz)
Measured Resources 3.99 2.52 323,300 Indicated Resources 25.87 2.72 2,264,500
Total Measured + Indicated Resources 29.86 2.70 2,587,900
Inferred Resources 4.16 2.20 293,900
Notes: 1. CIM definitions were followed for Mineral Resources.2. Mineral Resources are estimated at a cut-off grade of 1.0 g/t Au.3. Mineral Resources are estimated using a gold price of US$1,500 per ounce, and exchange rate of
US$0.80 = C$1.00.4. A minimum mining width of four metres was used.5. A bulk density of 2.8 g/cm3 was used.6. Numbers may not add due to rounding.
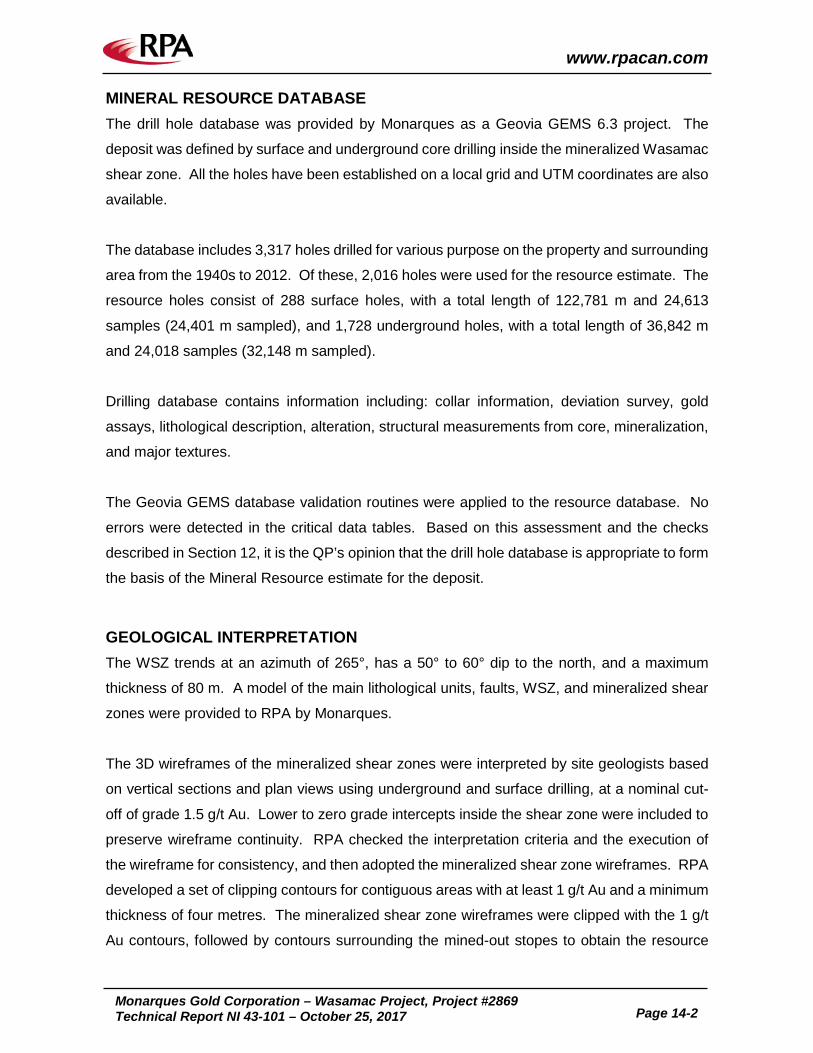
www.rpacan.com
Monarques Gold Corporation – Wasamac Project, Project #2869 Technical Report NI 43-101 – October 25, 2017 Page 14-2
MINERAL RESOURCE DATABASE The drill hole database was provided by Monarques as a Geovia GEMS 6.3 project. The
deposit was defined by surface and underground core drilling inside the mineralized Wasamac
shear zone. All the holes have been established on a local grid and UTM coordinates are also
available.
The database includes 3,317 holes drilled for various purpose on the property and surrounding
area from the 1940s to 2012. Of these, 2,016 holes were used for the resource estimate. The
resource holes consist of 288 surface holes, with a total length of 122,781 m and 24,613
samples (24,401 m sampled), and 1,728 underground holes, with a total length of 36,842 m
and 24,018 samples (32,148 m sampled).
Drilling database contains information including: collar information, deviation survey, gold
assays, lithological description, alteration, structural measurements from core, mineralization,
and major textures.
The Geovia GEMS database validation routines were applied to the resource database. No
errors were detected in the critical data tables. Based on this assessment and the checks
described in Section 12, it is the QP’s opinion that the drill hole database is appropriate to form
the basis of the Mineral Resource estimate for the deposit.
GEOLOGICAL INTERPRETATION The WSZ trends at an azimuth of 265°, has a 50° to 60° dip to the north, and a maximum
thickness of 80 m. A model of the main lithological units, faults, WSZ, and mineralized shear
zones were provided to RPA by Monarques.
The 3D wireframes of the mineralized shear zones were interpreted by site geologists based
on vertical sections and plan views using underground and surface drilling, at a nominal cut-
off of grade 1.5 g/t Au. Lower to zero grade intercepts inside the shear zone were included to
preserve wireframe continuity. RPA checked the interpretation criteria and the execution of
the wireframe for consistency, and then adopted the mineralized shear zone wireframes. RPA
developed a set of clipping contours for contiguous areas with at least 1 g/t Au and a minimum
thickness of four metres. The mineralized shear zone wireframes were clipped with the 1 g/t
Au contours, followed by contours surrounding the mined-out stopes to obtain the resource
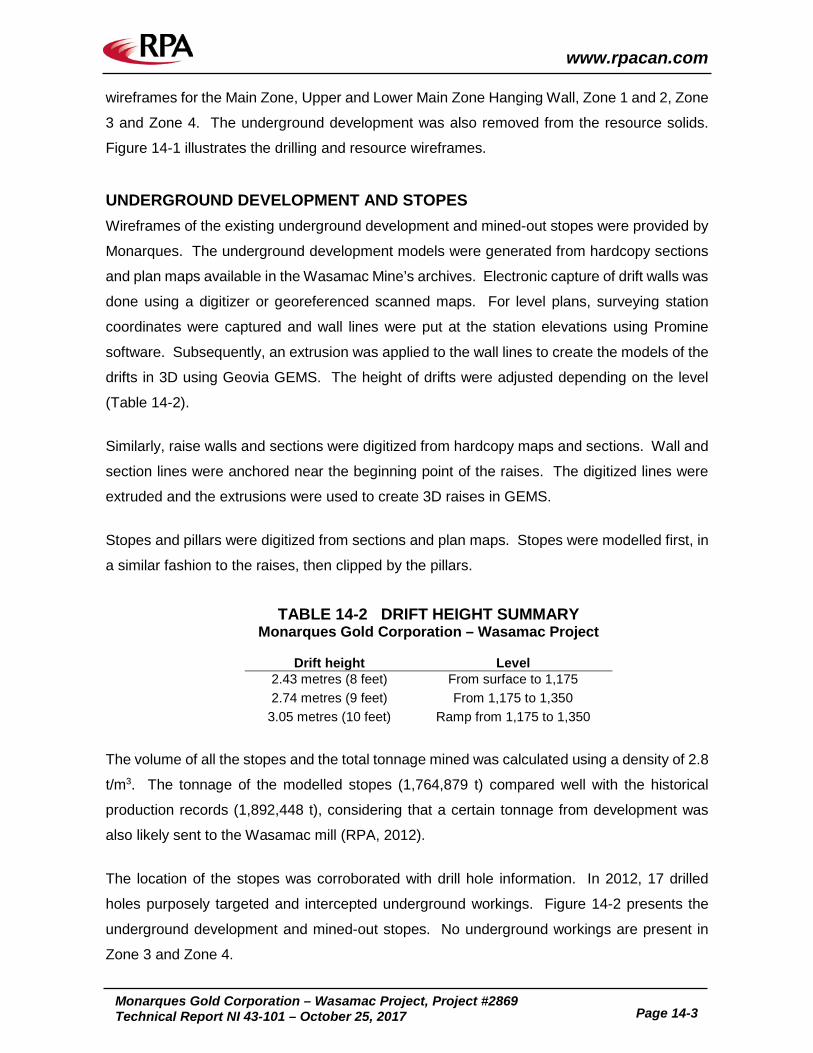
www.rpacan.com
Monarques Gold Corporation – Wasamac Project, Project #2869 Technical Report NI 43-101 – October 25, 2017 Page 14-3
wireframes for the Main Zone, Upper and Lower Main Zone Hanging Wall, Zone 1 and 2, Zone
3 and Zone 4. The underground development was also removed from the resource solids.
Figure 14-1 illustrates the drilling and resource wireframes.
UNDERGROUND DEVELOPMENT AND STOPES Wireframes of the existing underground development and mined-out stopes were provided by
Monarques. The underground development models were generated from hardcopy sections
and plan maps available in the Wasamac Mine’s archives. Electronic capture of drift walls was
done using a digitizer or georeferenced scanned maps. For level plans, surveying station
coordinates were captured and wall lines were put at the station elevations using Promine
software. Subsequently, an extrusion was applied to the wall lines to create the models of the
drifts in 3D using Geovia GEMS. The height of drifts were adjusted depending on the level
(Table 14-2).
Similarly, raise walls and sections were digitized from hardcopy maps and sections. Wall and
section lines were anchored near the beginning point of the raises. The digitized lines were
extruded and the extrusions were used to create 3D raises in GEMS.
Stopes and pillars were digitized from sections and plan maps. Stopes were modelled first, in
a similar fashion to the raises, then clipped by the pillars.
TABLE 14-2 DRIFT HEIGHT SUMMARY Monarques Gold Corporation – Wasamac Project
Drift height Level 2.43 metres (8 feet) From surface to 1,175 2.74 metres (9 feet) From 1,175 to 1,350
3.05 metres (10 feet) Ramp from 1,175 to 1,350
The volume of all the stopes and the total tonnage mined was calculated using a density of 2.8
t/m3. The tonnage of the modelled stopes (1,764,879 t) compared well with the historical
production records (1,892,448 t), considering that a certain tonnage from development was
also likely sent to the Wasamac mill (RPA, 2012).
The location of the stopes was corroborated with drill hole information. In 2012, 17 drilled
holes purposely targeted and intercepted underground workings. Figure 14-2 presents the
underground development and mined-out stopes. No underground workings are present in
Zone 3 and Zone 4.
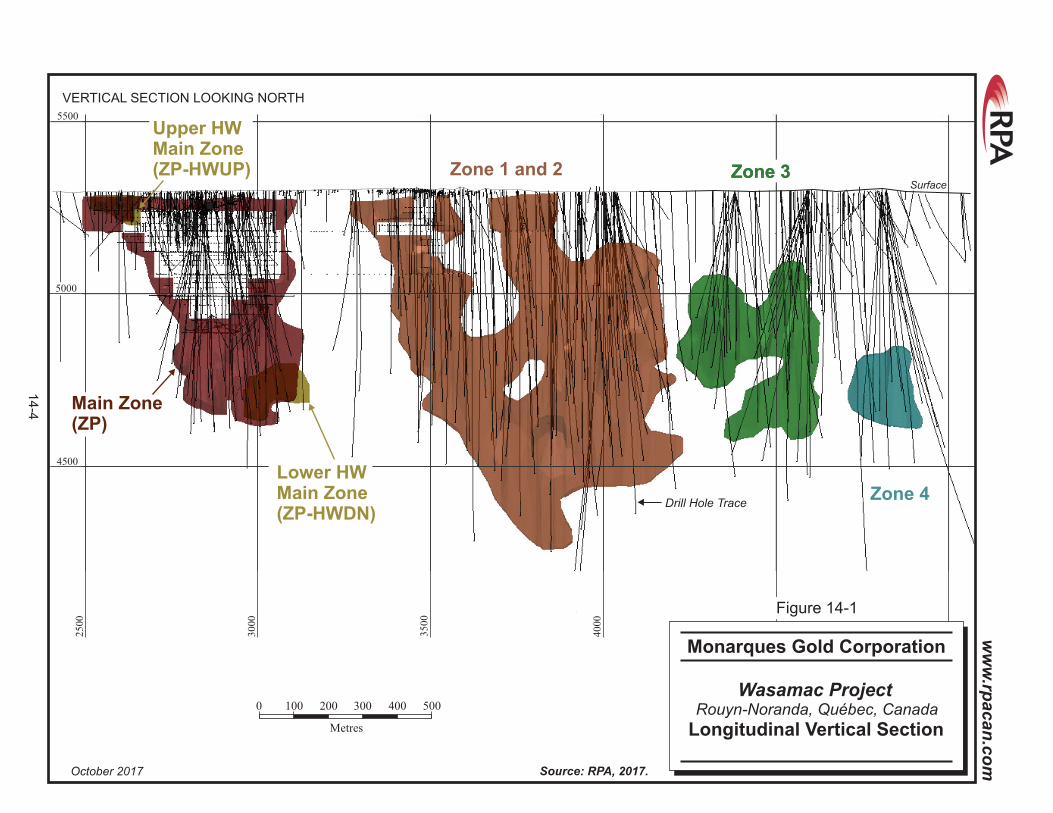
4500
VERTICAL SECTION LOOKING NORTH
3000
2500
5000
5500
3500
4000
Upper HWMain Zone(ZP-HWUP)
Lower HWMain Zone(ZP-HWDN)
Main Zone(ZP)
Zone 1 and 2 Zone 3Zone 3
Zone 4
Surface
Drill Hole Trace
0 100 500
Metres
200 300 400
October 2017 Source: RPA, 2017.
Wasamac Project
Longitudinal Vertical Section
Monarques Gold Corporation
Rouyn-Noranda, Québec, Canada
Figure 14-1
14-4
ww
w.rp
acan
.co
m
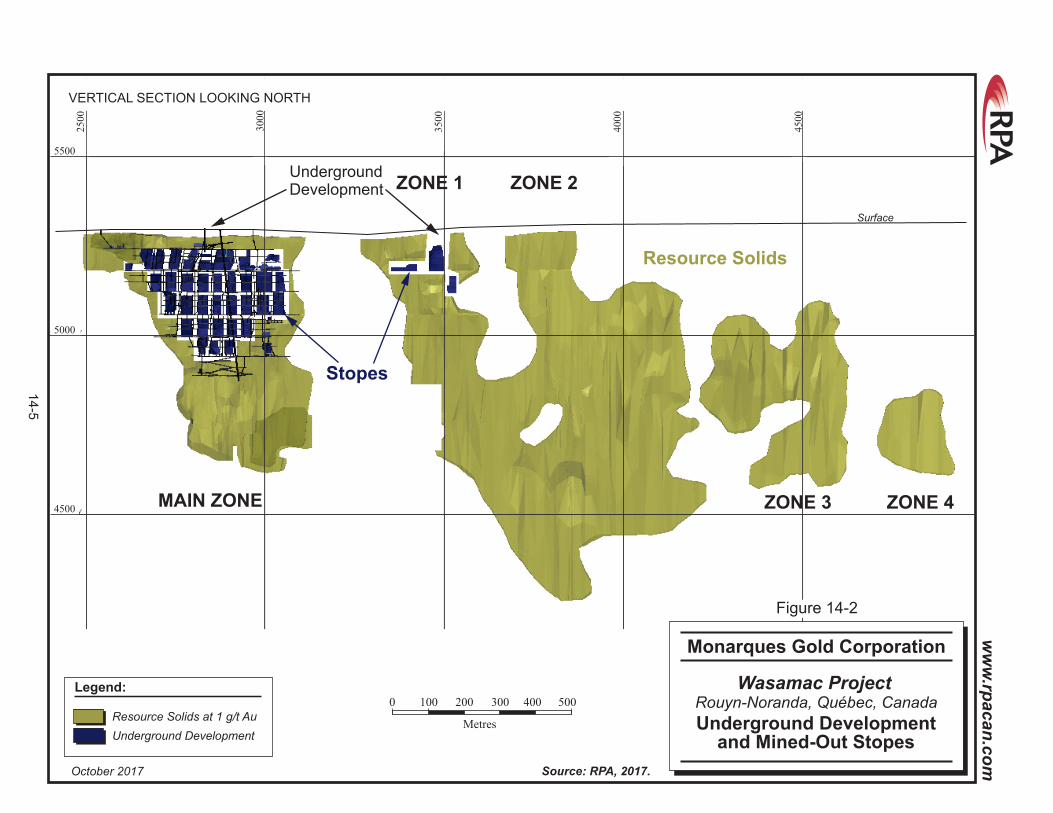
Main Zone Zone 1 and 2
Zone 3
Zone 4
4500
VERTICAL SECTION LOOKING NORTH
5000
5500
3500
3000
2500
4000
4500
UndergroundDevelopment
Resource Solids
Stopes
MAIN ZONE
ZONE 1
ZONE 3
ZONE 2
ZONE 4
Surface
Resource Solids at 1 g/t Au
Legend:
Underground Development
0 100 500
Metres
200 300 400
Figure 14-2
October 2017 Source: RPA, 2017.
Wasamac Project
Underground Developmentand Mined-Out Stopes
Monarques Gold Corporation
Rouyn-Noranda, Québec, Canada
14-5
ww
w.rp
acan
.co
m
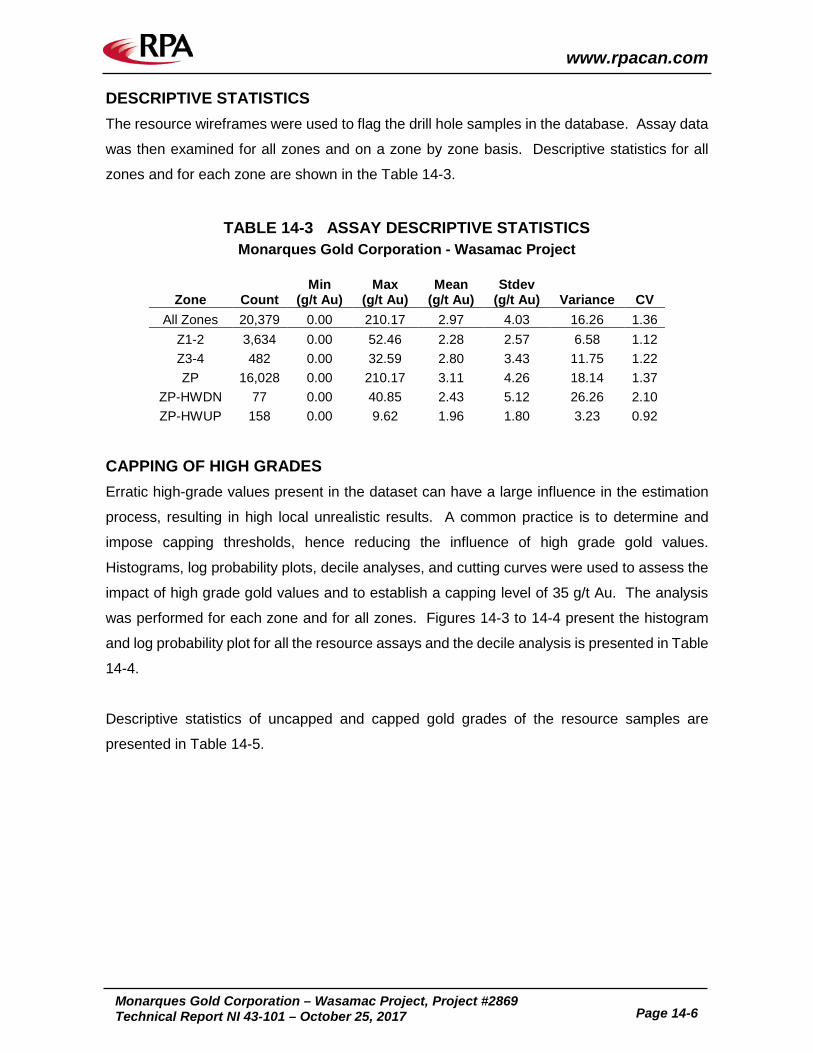
www.rpacan.com
Monarques Gold Corporation – Wasamac Project, Project #2869
Technical Report NI 43-101 – October 25, 2017 Page 14-6
DESCRIPTIVE STATISTICS The resource wireframes were used to flag the drill hole samples in the database. Assay data
was then examined for all zones and on a zone by zone basis. Descriptive statistics for all
zones and for each zone are shown in the Table 14-3.
TABLE 14-3 ASSAY DESCRIPTIVE STATISTICS Monarques Gold Corporation - Wasamac Project
Zone Count Min
(g/t Au) Max
(g/t Au) Mean
(g/t Au) Stdev
(g/t Au) Variance CV All Zones 20,379 0.00 210.17 2.97 4.03 16.26 1.36
Z1-2 3,634 0.00 52.46 2.28 2.57 6.58 1.12 Z3-4 482 0.00 32.59 2.80 3.43 11.75 1.22 ZP 16,028 0.00 210.17 3.11 4.26 18.14 1.37
ZP-HWDN 77 0.00 40.85 2.43 5.12 26.26 2.10 ZP-HWUP 158 0.00 9.62 1.96 1.80 3.23 0.92
CAPPING OF HIGH GRADES Erratic high-grade values present in the dataset can have a large influence in the estimation
process, resulting in high local unrealistic results. A common practice is to determine and
impose capping thresholds, hence reducing the influence of high grade gold values.
Histograms, log probability plots, decile analyses, and cutting curves were used to assess the
impact of high grade gold values and to establish a capping level of 35 g/t Au. The analysis
was performed for each zone and for all zones. Figures 14-3 to 14-4 present the histogram
and log probability plot for all the resource assays and the decile analysis is presented in Table
14-4.
Descriptive statistics of uncapped and capped gold grades of the resource samples are
presented in Table 14-5.
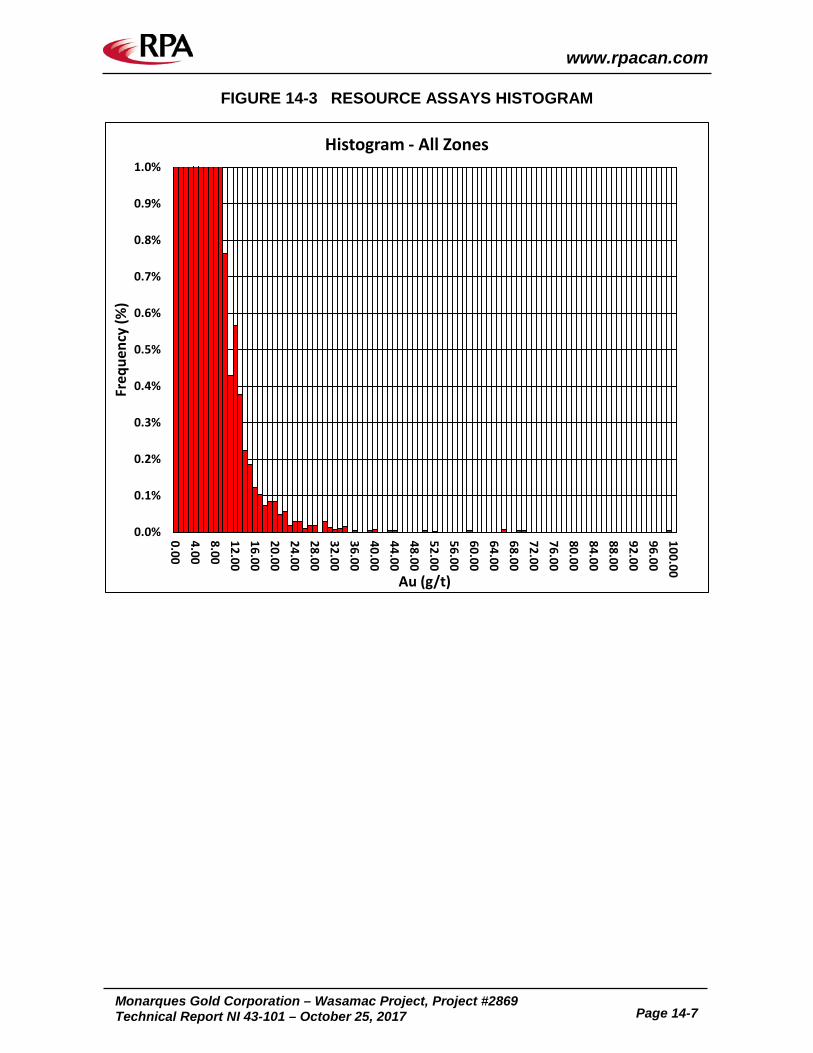
www.rpacan.com
Monarques Gold Corporation – Wasamac Project, Project #2869
Technical Report NI 43-101 – October 25, 2017 Page 14-7
FIGURE 14-3 RESOURCE ASSAYS HISTOGRAM
0.0%
0.1%
0.2%
0.3%
0.4%
0.5%
0.6%
0.7%
0.8%
0.9%
1.0%
0.004.008.0012.0016.0020.0024.0028.0032.0036.0040.0044.0048.0052.0056.0060.0064.0068.0072.0076.0080.0084.0088.0092.0096.00100.00
Freq
uenc
y (%
)
Au (g/t)
Histogram - All Zones
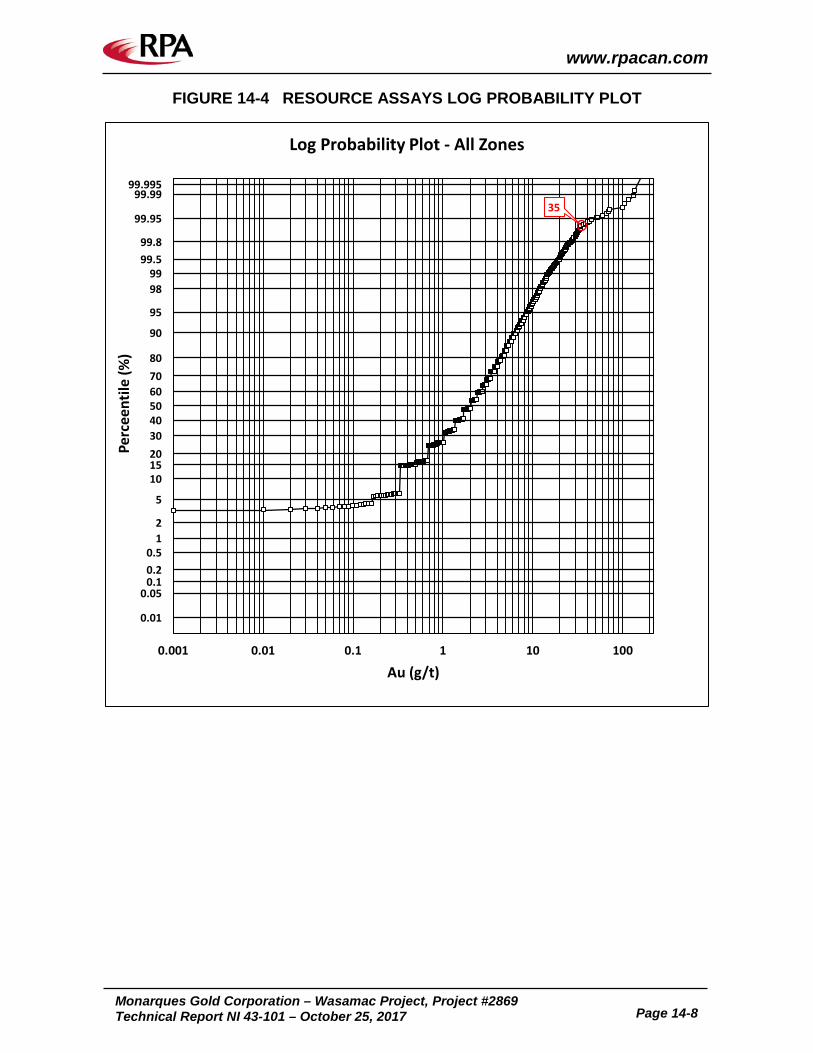
www.rpacan.com
Monarques Gold Corporation – Wasamac Project, Project #2869
Technical Report NI 43-101 – October 25, 2017 Page 14-8
FIGURE 14-4 RESOURCE ASSAYS LOG PROBABILITY PLOT
0.01
0.050.10.20.5
12
5
101520304050607080
90
95
9899
99.599.8
99.95
99.9999.995
35
0.001 0.01 0.1 1 10 100
Perc
eent
ile (%
)
Au (g/t)
Log Probability Plot - All Zones
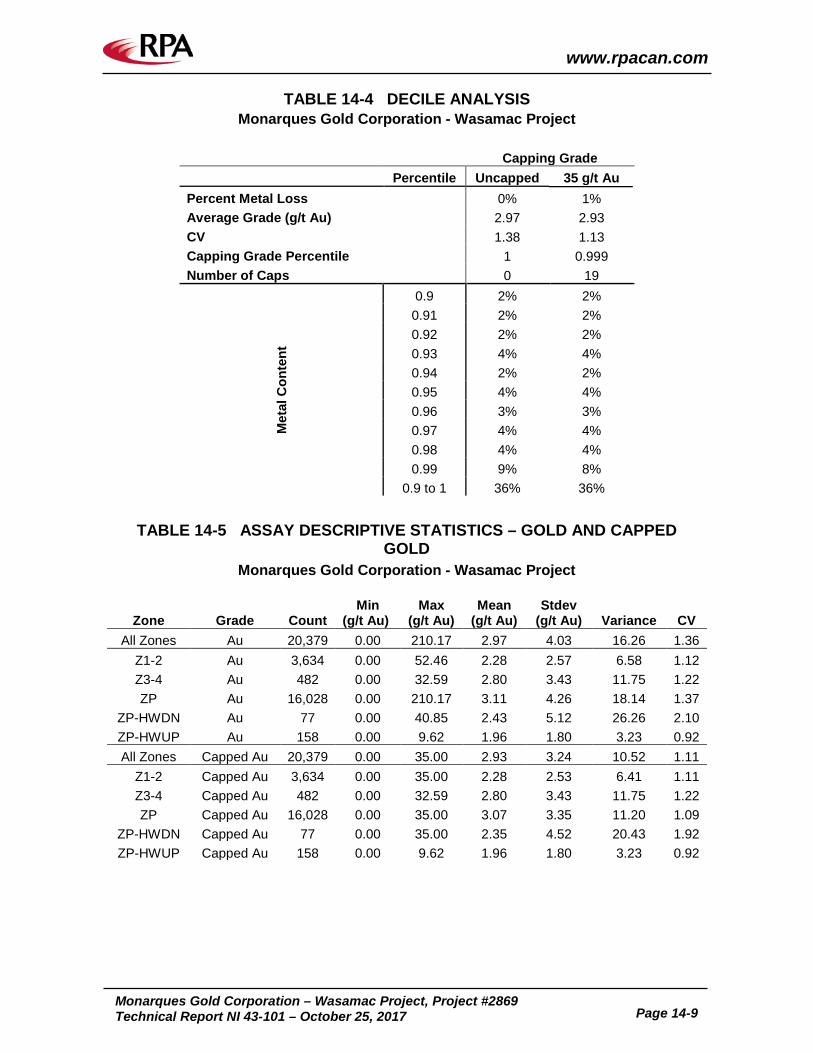
www.rpacan.com
Monarques Gold Corporation – Wasamac Project, Project #2869 Technical Report NI 43-101 – October 25, 2017 Page 14-9
TABLE 14-4 DECILE ANALYSIS Monarques Gold Corporation - Wasamac Project
Capping Grade Percentile Uncapped 35 g/t Au
Percent Metal Loss 0% 1% Average Grade (g/t Au) 2.97 2.93 CV 1.38 1.13 Capping Grade Percentile 1 0.999 Number of Caps 0 19
Met
al C
onte
nt
0.9 2% 2% 0.91 2% 2% 0.92 2% 2% 0.93 4% 4% 0.94 2% 2% 0.95 4% 4% 0.96 3% 3% 0.97 4% 4% 0.98 4% 4% 0.99 9% 8%
0.9 to 1 36% 36%
TABLE 14-5 ASSAY DESCRIPTIVE STATISTICS – GOLD AND CAPPED GOLD
Monarques Gold Corporation - Wasamac Project
Zone Grade Count Min
(g/t Au) Max
(g/t Au) Mean
(g/t Au) Stdev
(g/t Au) Variance CV All Zones Au 20,379 0.00 210.17 2.97 4.03 16.26 1.36
Z1-2 Au 3,634 0.00 52.46 2.28 2.57 6.58 1.12 Z3-4 Au 482 0.00 32.59 2.80 3.43 11.75 1.22 ZP Au 16,028 0.00 210.17 3.11 4.26 18.14 1.37
ZP-HWDN Au 77 0.00 40.85 2.43 5.12 26.26 2.10 ZP-HWUP Au 158 0.00 9.62 1.96 1.80 3.23 0.92 All Zones Capped Au 20,379 0.00 35.00 2.93 3.24 10.52 1.11
Z1-2 Capped Au 3,634 0.00 35.00 2.28 2.53 6.41 1.11 Z3-4 Capped Au 482 0.00 32.59 2.80 3.43 11.75 1.22 ZP Capped Au 16,028 0.00 35.00 3.07 3.35 11.20 1.09
ZP-HWDN Capped Au 77 0.00 35.00 2.35 4.52 20.43 1.92 ZP-HWUP Capped Au 158 0.00 9.62 1.96 1.80 3.23 0.92
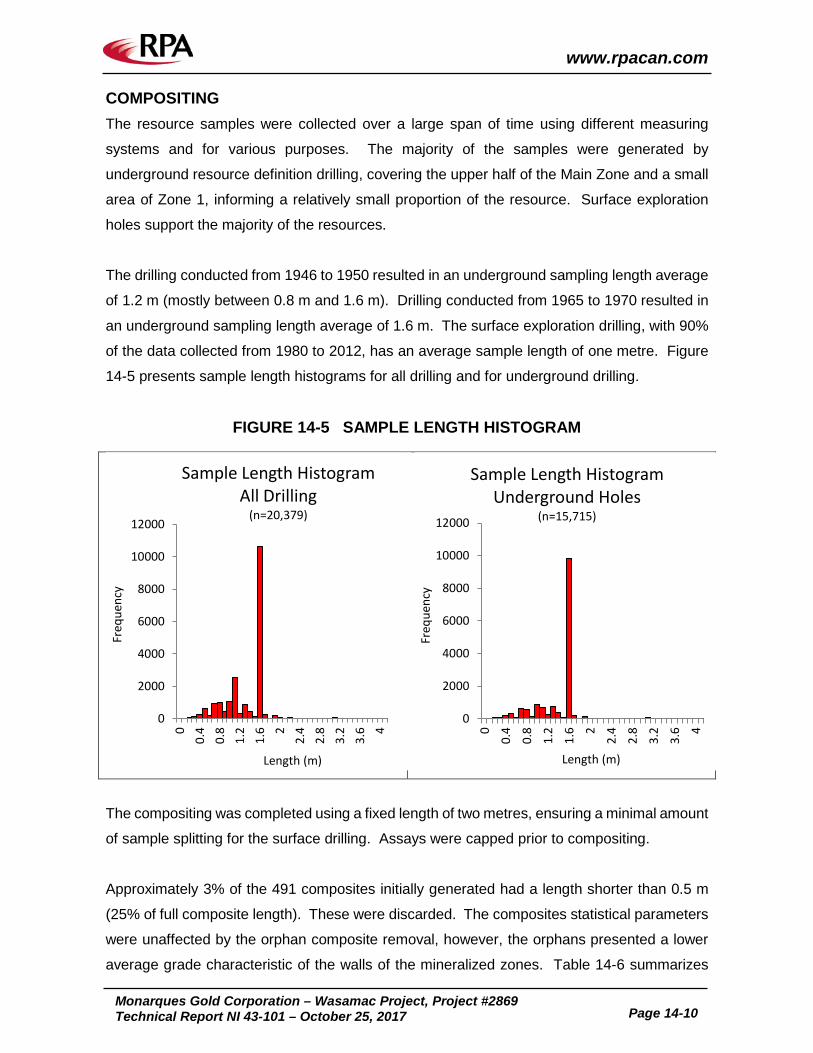
www.rpacan.com
Monarques Gold Corporation – Wasamac Project, Project #2869
Technical Report NI 43-101 – October 25, 2017 Page 14-10
COMPOSITING The resource samples were collected over a large span of time using different measuring
systems and for various purposes. The majority of the samples were generated by
underground resource definition drilling, covering the upper half of the Main Zone and a small
area of Zone 1, informing a relatively small proportion of the resource. Surface exploration
holes support the majority of the resources.
The drilling conducted from 1946 to 1950 resulted in an underground sampling length average
of 1.2 m (mostly between 0.8 m and 1.6 m). Drilling conducted from 1965 to 1970 resulted in
an underground sampling length average of 1.6 m. The surface exploration drilling, with 90%
of the data collected from 1980 to 2012, has an average sample length of one metre. Figure
14-5 presents sample length histograms for all drilling and for underground drilling.
FIGURE 14-5 SAMPLE LENGTH HISTOGRAM
The compositing was completed using a fixed length of two metres, ensuring a minimal amount
of sample splitting for the surface drilling. Assays were capped prior to compositing.
Approximately 3% of the 491 composites initially generated had a length shorter than 0.5 m
(25% of full composite length). These were discarded. The composites statistical parameters
were unaffected by the orphan composite removal, however, the orphans presented a lower
average grade characteristic of the walls of the mineralized zones. Table 14-6 summarizes
0
2000
4000
6000
8000
10000
12000
00.
40.
81.
21.
6 22.
42.
83.
23.
6 4
Freq
uenc
y
Length (m)
Sample Length HistogramAll Drilling
(n=20,379)
0
2000
4000
6000
8000
10000
12000
0
0.4
0.8
1.2
1.6 2
2.4
2.8
3.2
3.6 4
Freq
uenc
y
Length (m)
Sample Length Histogram Underground Holes
(n=15,715)
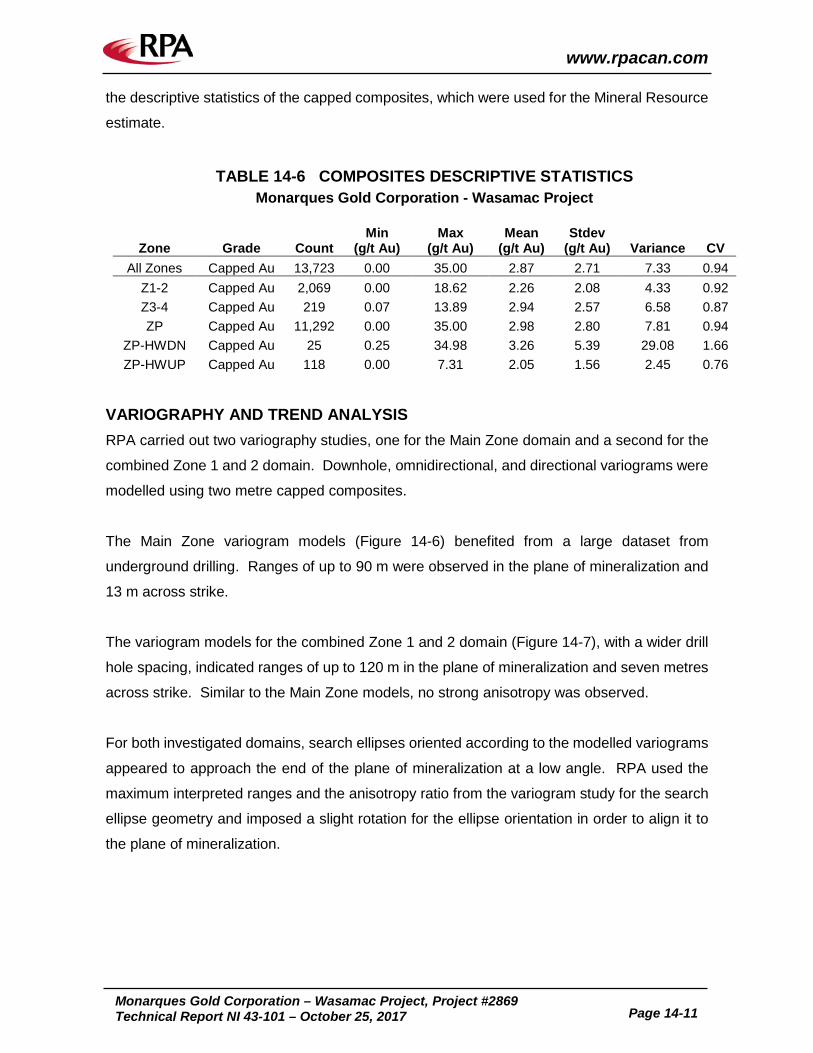
www.rpacan.com
Monarques Gold Corporation – Wasamac Project, Project #2869
Technical Report NI 43-101 – October 25, 2017 Page 14-11
the descriptive statistics of the capped composites, which were used for the Mineral Resource
estimate.
TABLE 14-6 COMPOSITES DESCRIPTIVE STATISTICS Monarques Gold Corporation - Wasamac Project
Zone Grade Count Min
(g/t Au) Max
(g/t Au) Mean
(g/t Au) Stdev
(g/t Au) Variance CV All Zones Capped Au 13,723 0.00 35.00 2.87 2.71 7.33 0.94
Z1-2 Capped Au 2,069 0.00 18.62 2.26 2.08 4.33 0.92 Z3-4 Capped Au 219 0.07 13.89 2.94 2.57 6.58 0.87 ZP Capped Au 11,292 0.00 35.00 2.98 2.80 7.81 0.94
ZP-HWDN Capped Au 25 0.25 34.98 3.26 5.39 29.08 1.66 ZP-HWUP Capped Au 118 0.00 7.31 2.05 1.56 2.45 0.76
VARIOGRAPHY AND TREND ANALYSIS RPA carried out two variography studies, one for the Main Zone domain and a second for the
combined Zone 1 and 2 domain. Downhole, omnidirectional, and directional variograms were
modelled using two metre capped composites.
The Main Zone variogram models (Figure 14-6) benefited from a large dataset from
underground drilling. Ranges of up to 90 m were observed in the plane of mineralization and
13 m across strike.
The variogram models for the combined Zone 1 and 2 domain (Figure 14-7), with a wider drill
hole spacing, indicated ranges of up to 120 m in the plane of mineralization and seven metres
across strike. Similar to the Main Zone models, no strong anisotropy was observed.
For both investigated domains, search ellipses oriented according to the modelled variograms
appeared to approach the end of the plane of mineralization at a low angle. RPA used the
maximum interpreted ranges and the anisotropy ratio from the variogram study for the search
ellipse geometry and imposed a slight rotation for the ellipse orientation in order to align it to
the plane of mineralization.
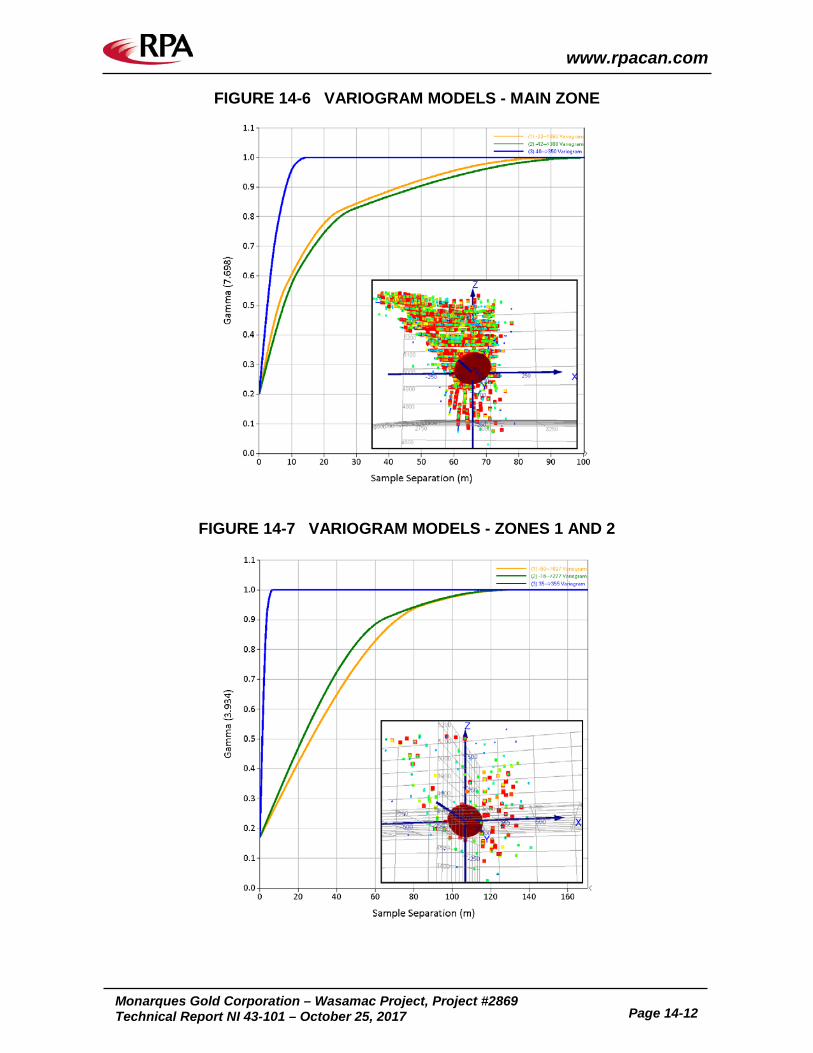
www.rpacan.com
Monarques Gold Corporation – Wasamac Project, Project #2869
Technical Report NI 43-101 – October 25, 2017 Page 14-12
FIGURE 14-6 VARIOGRAM MODELS - MAIN ZONE
FIGURE 14-7 VARIOGRAM MODELS - ZONES 1 AND 2
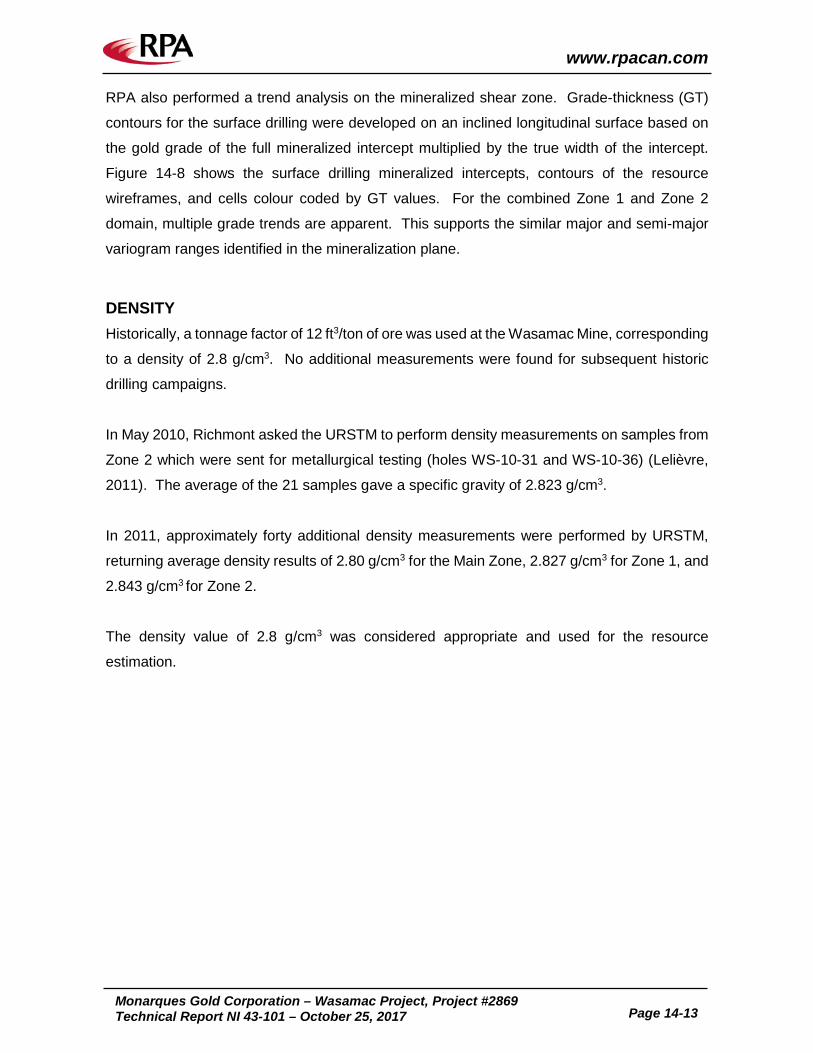
www.rpacan.com
Monarques Gold Corporation – Wasamac Project, Project #2869
Technical Report NI 43-101 – October 25, 2017 Page 14-13
RPA also performed a trend analysis on the mineralized shear zone. Grade-thickness (GT)
contours for the surface drilling were developed on an inclined longitudinal surface based on
the gold grade of the full mineralized intercept multiplied by the true width of the intercept.
Figure 14-8 shows the surface drilling mineralized intercepts, contours of the resource
wireframes, and cells colour coded by GT values. For the combined Zone 1 and Zone 2
domain, multiple grade trends are apparent. This supports the similar major and semi-major
variogram ranges identified in the mineralization plane.
DENSITY Historically, a tonnage factor of 12 ft3/ton of ore was used at the Wasamac Mine, corresponding
to a density of 2.8 g/cm3. No additional measurements were found for subsequent historic
drilling campaigns.
In May 2010, Richmont asked the URSTM to perform density measurements on samples from
Zone 2 which were sent for metallurgical testing (holes WS-10-31 and WS-10-36) (Lelièvre,
2011). The average of the 21 samples gave a specific gravity of 2.823 g/cm3.
In 2011, approximately forty additional density measurements were performed by URSTM,
returning average density results of 2.80 g/cm3 for the Main Zone, 2.827 g/cm3 for Zone 1, and
2.843 g/cm3 for Zone 2.
The density value of 2.8 g/cm3 was considered appropriate and used for the resource
estimation.
Main Zone
Zone 3 Zone 4
Zone 2Zone 1
<1.0
50.0 - 75.0
Au (g/t) x T (m) :
5.0 - 10.0
100.00 - 150.00
1.0 - 5.0
75.0 - 100.0
10.0 - 25.0
150.00 - 200.00
25.0 - 50.0
200.00 - 250.00
>250.00
0 100 500
Metres
200 300 400
October 2017 Source: RPA, 2017.
Inclined SectionTrend PlotGrade Thickness
Wasamac Project
Monarques Gold Corporation
Rouyn-Noranda, Québec, Canada
Figure 14-8
14-1
4
ww
w.rp
acan
.co
m
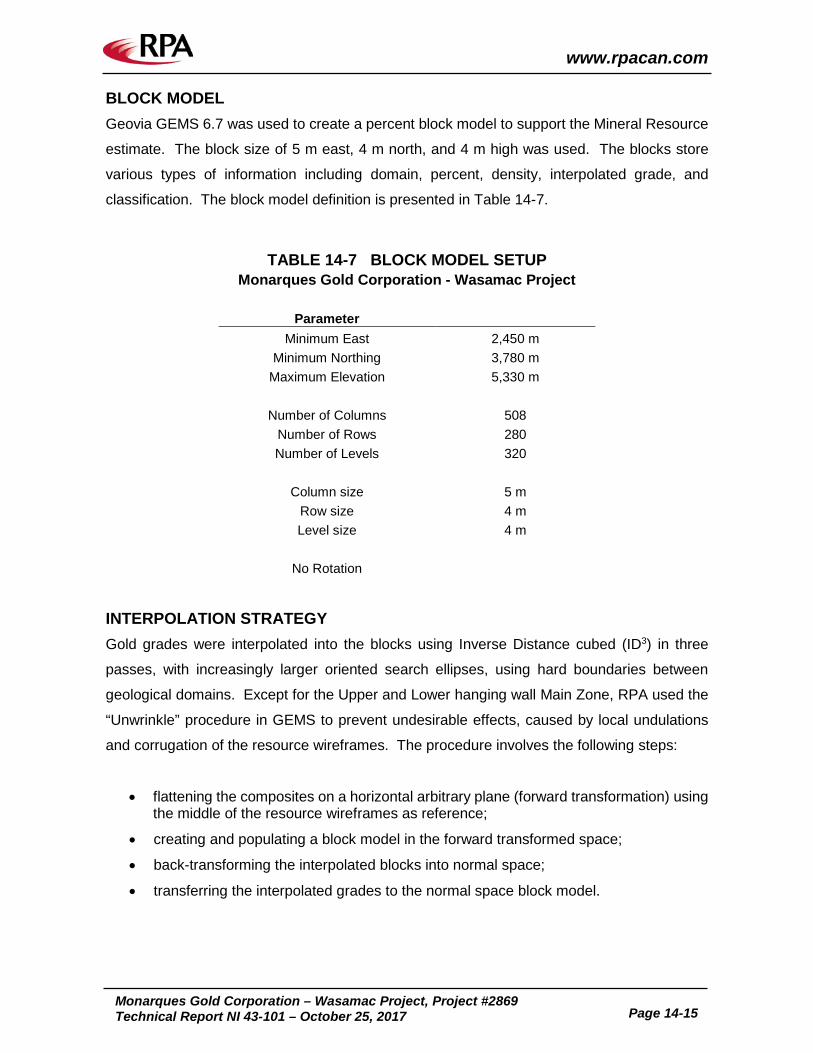
www.rpacan.com
Monarques Gold Corporation – Wasamac Project, Project #2869
Technical Report NI 43-101 – October 25, 2017 Page 14-15
BLOCK MODEL Geovia GEMS 6.7 was used to create a percent block model to support the Mineral Resource
estimate. The block size of 5 m east, 4 m north, and 4 m high was used. The blocks store
various types of information including domain, percent, density, interpolated grade, and
classification. The block model definition is presented in Table 14-7.
TABLE 14-7 BLOCK MODEL SETUP Monarques Gold Corporation - Wasamac Project
Parameter
Minimum East 2,450 m Minimum Northing 3,780 m
Maximum Elevation 5,330 m
Number of Columns 508 Number of Rows 280 Number of Levels 320
Column size 5 m
Row size 4 m Level size 4 m
No Rotation
INTERPOLATION STRATEGY Gold grades were interpolated into the blocks using Inverse Distance cubed (ID3) in three
passes, with increasingly larger oriented search ellipses, using hard boundaries between
geological domains. Except for the Upper and Lower hanging wall Main Zone, RPA used the
“Unwrinkle” procedure in GEMS to prevent undesirable effects, caused by local undulations
and corrugation of the resource wireframes. The procedure involves the following steps:
• flattening the composites on a horizontal arbitrary plane (forward transformation) using the middle of the resource wireframes as reference;
• creating and populating a block model in the forward transformed space;
• back-transforming the interpolated blocks into normal space;
• transferring the interpolated grades to the normal space block model.
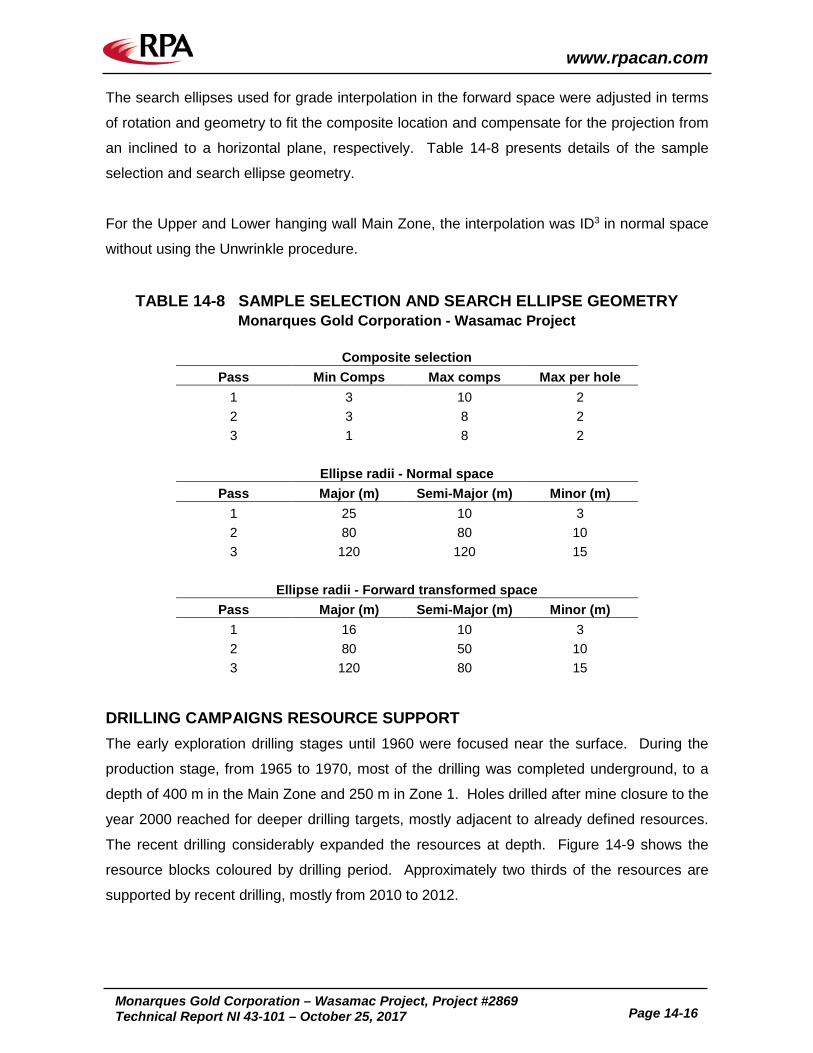
www.rpacan.com
Monarques Gold Corporation – Wasamac Project, Project #2869
Technical Report NI 43-101 – October 25, 2017 Page 14-16
The search ellipses used for grade interpolation in the forward space were adjusted in terms
of rotation and geometry to fit the composite location and compensate for the projection from
an inclined to a horizontal plane, respectively. Table 14-8 presents details of the sample
selection and search ellipse geometry.
For the Upper and Lower hanging wall Main Zone, the interpolation was ID3 in normal space
without using the Unwrinkle procedure.
TABLE 14-8 SAMPLE SELECTION AND SEARCH ELLIPSE GEOMETRY Monarques Gold Corporation - Wasamac Project
Composite selection
Pass Min Comps Max comps Max per hole 1 3 10 2 2 3 8 2 3 1 8 2
Ellipse radii - Normal space Pass Major (m) Semi-Major (m) Minor (m)
1 25 10 3 2 80 80 10 3 120 120 15
Ellipse radii - Forward transformed space
Pass Major (m) Semi-Major (m) Minor (m) 1 16 10 3 2 80 50 10 3 120 80 15
DRILLING CAMPAIGNS RESOURCE SUPPORT The early exploration drilling stages until 1960 were focused near the surface. During the
production stage, from 1965 to 1970, most of the drilling was completed underground, to a
depth of 400 m in the Main Zone and 250 m in Zone 1. Holes drilled after mine closure to the
year 2000 reached for deeper drilling targets, mostly adjacent to already defined resources.
The recent drilling considerably expanded the resources at depth. Figure 14-9 shows the
resource blocks coloured by drilling period. Approximately two thirds of the resources are
supported by recent drilling, mostly from 2010 to 2012.
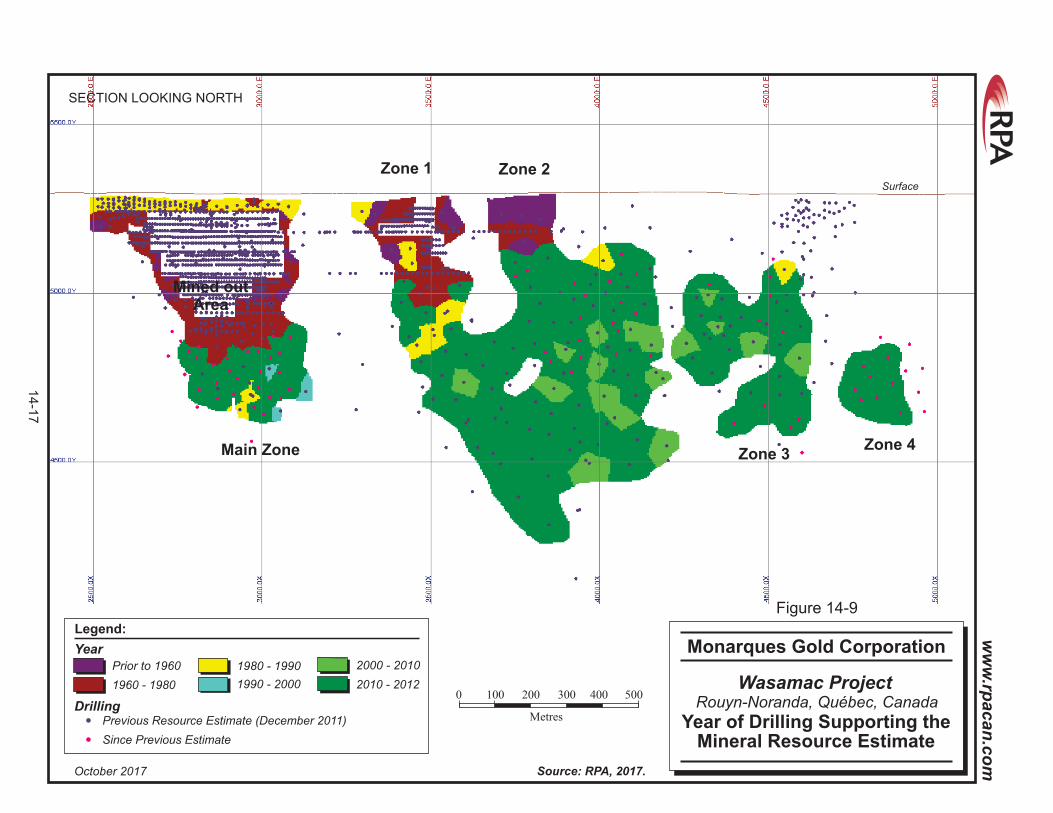
SECTION LOOKING NORTH
3000
Main Zone Zone 3Zone 4
Zone 2
Mined outArea
Zone 1Surface
Prior to 1960
Year
2000 - 2010
Legend:
1980 - 1990
1960 - 1980
Previous Resource Estimate (December 2011)
1990 - 2000
Since Previous Estimate
2010 - 2012
Drilling0 100 500
Metres
200 300 400
Figure 14-9
October 2017 Source: RPA, 2017.
Wasamac Project
Year of Drilling Supporting theMineral Resource Estimate
Monarques Gold Corporation
Rouyn-Noranda, Québec, Canada
14-1
7
ww
w.rp
acan
.co
m
www.rpacan.com
Monarques Gold Corporation – Wasamac Project, Project #2869
Technical Report NI 43-101 – October 25, 2017 Page 14-18
BLOCK MODEL VALIDATION Block model estimated grades were validated by various methods including: visual comparison
of the interpolated block grades versus composite grades on plan views and vertical sections,
comparison with alternative interpolation methods, reporting from mined-out stopes, and
comparing with available historical production.
The visual inspection focused on comparing the composite grade versus the interpolated block
grade, distribution of grades inside and along the edges of the wireframes, as well as the
general aspect around areas with local changes in wireframe orientation, for both densely and
sparsely drilled areas. A typical cross section (Section 3020E) showing the resource wireframe
outline, composites, drill hole traces, and colour coded interpolated block grades is presented
in Figure 14-10. Figure 14-11 shows a typical plan view (4,990 m) with the resource wireframe
outline, composites, and colour coded interpolated block grades. A long section looking north
showing blocks from all zones is presented in Figure 14-12.
RPA compared the resource interpolated block grades with alternative ID2, ID3, and average
interpolation methods in normal space (no Unwrinkle procedure applied) and obtained similar
results overall, however, the Unwrinkle procedure used for the resource estimate produced a
more natural block grade distribution.
For comparison with historical production data, RPA also interpolated block grades in the
mined-out areas of the Main Zone and Zone 1. The tonnage, grade, and gold ounces reported
from the available mined-out stopes compared well with production numbers and matched
production validation from previous studies, however, a more in-depth comparison required
better control on the development and raises.
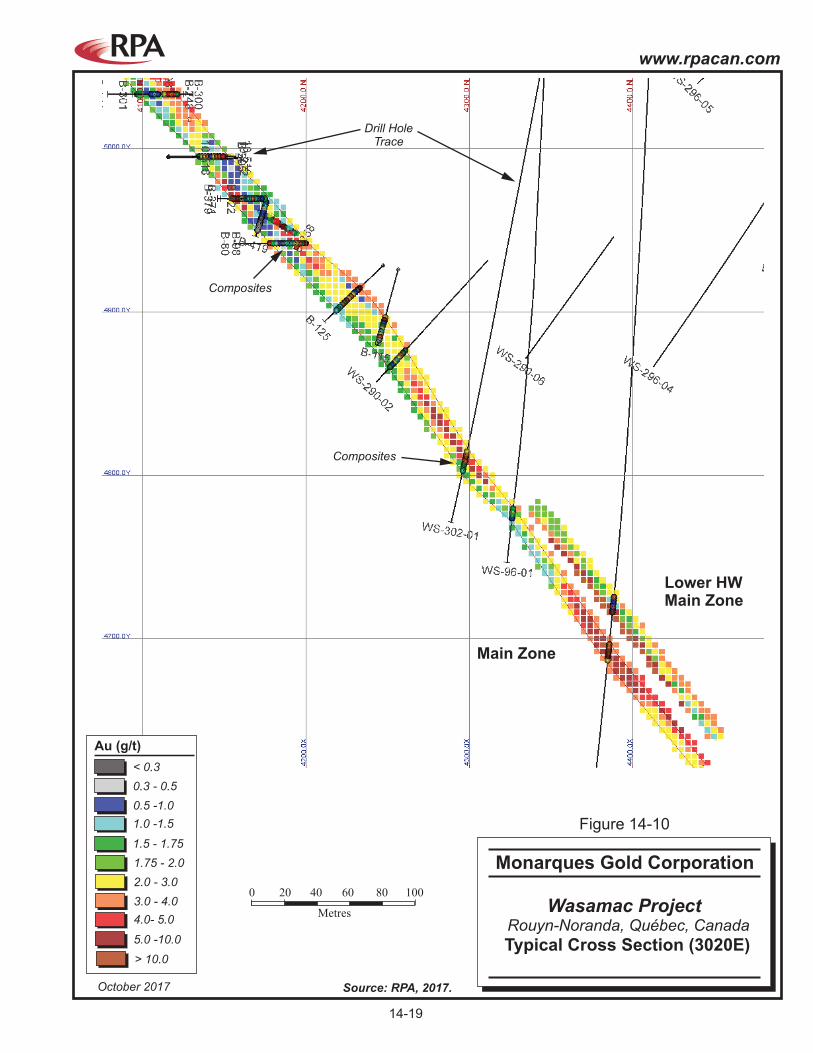
Drill HoleTrace
Main Zone
Lower HWMain Zone
Composites
Composites
< 0.3
1.75 - 2.0
Au (g/t)
0.5 -1.0
3.0 - 4.0
0.3 - 0.5
2.0 - 3.0
1.0 -1.5
4.0- 5.0
1.5 - 1.75
5.0 -10.0
> 10.0
0 20 100
Metres
40 60 80
October 2017 Source: RPA, 2017.
Typical Cross ( )Section 3020E
Wasamac Project
Monarques Gold Corporation
Rouyn-Noranda, Québec, Canada
Figure 14-10
14-19
www.rpacan.com
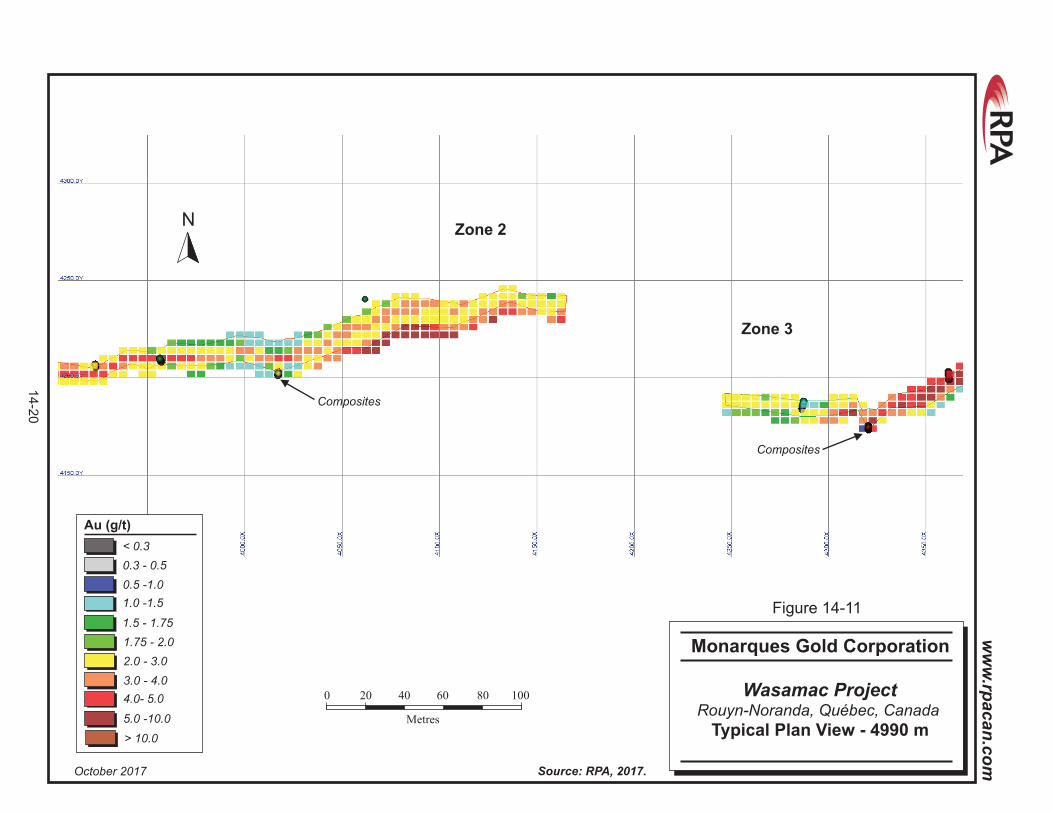
Composites
Composites
Zone 2
Zone 3
< 0.3
1.75 - 2.0
Au (g/t)
0.5 -1.0
3.0 - 4.0
0.3 - 0.5
2.0 - 3.0
1.0 -1.5
4.0- 5.0
1.5 - 1.75
5.0 -10.0
> 10.0
0 20 100
Metres
40 60 80
N
October 2017 Source: RPA, 2017.
Typical - mPlan View 4990
Wasamac Project
Monarques Gold Corporation
Rouyn-Noranda, Québec, Canada
Figure 14-11
14-2
0
ww
w.rp
acan
.co
m
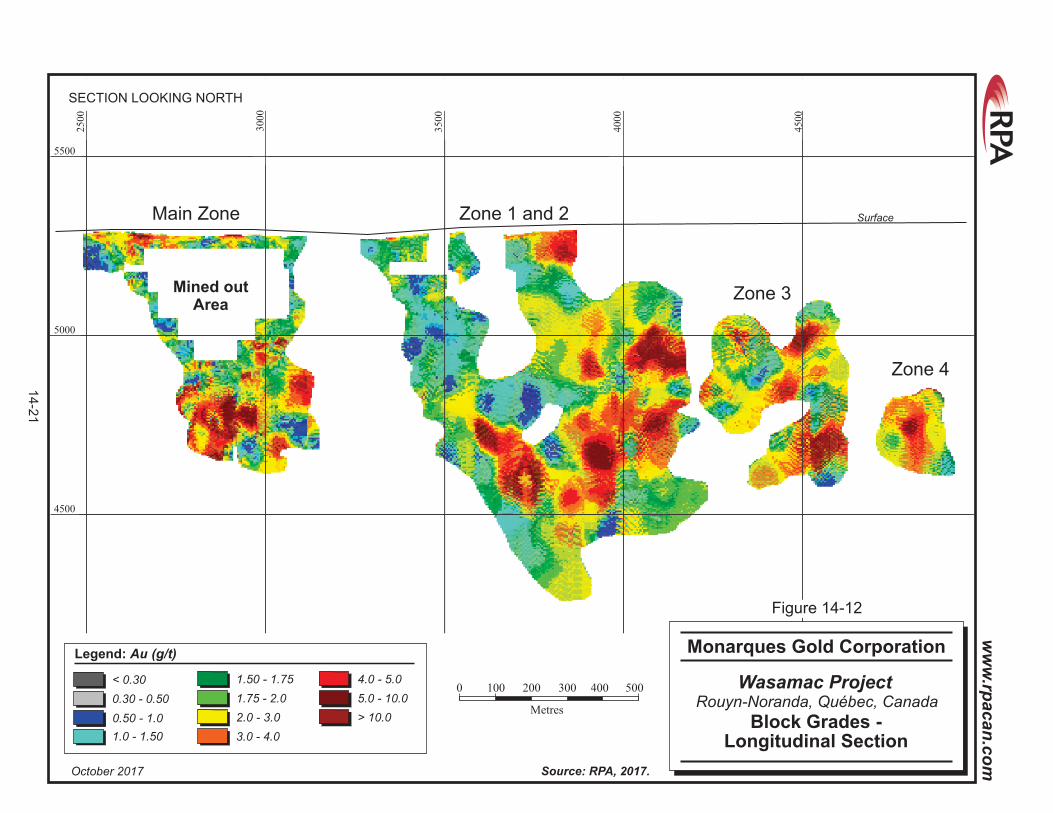
Main Zone Zone 1 and 2
Zone 3
Zone 4
4500
3000
3000
3000
3000
5000
5500
3500
3000
2500
4000
4500
Mined outArea
Surface
SECTION LOOKING NORTH
< 0.30 1.50 - 1.75 4.0 - 5.0
2.0 - 3.0 > 10.0
Legend: Au (g/t)
0.50 - 1.0
0.30 - 0.50 1.75 - 2.0 5.0 - 10.0
3.0 - 4.01.0 - 1.50
0 100 500
Metres
200 300 400
Figure 14-12
October 2017 Source: RPA, 2017.
Wasamac Project
Block Grades -Longitudinal Section
Monarques Gold Corporation
Rouyn-Noranda, Québec, Canada
14-2
1
ww
w.rp
acan
.co
m
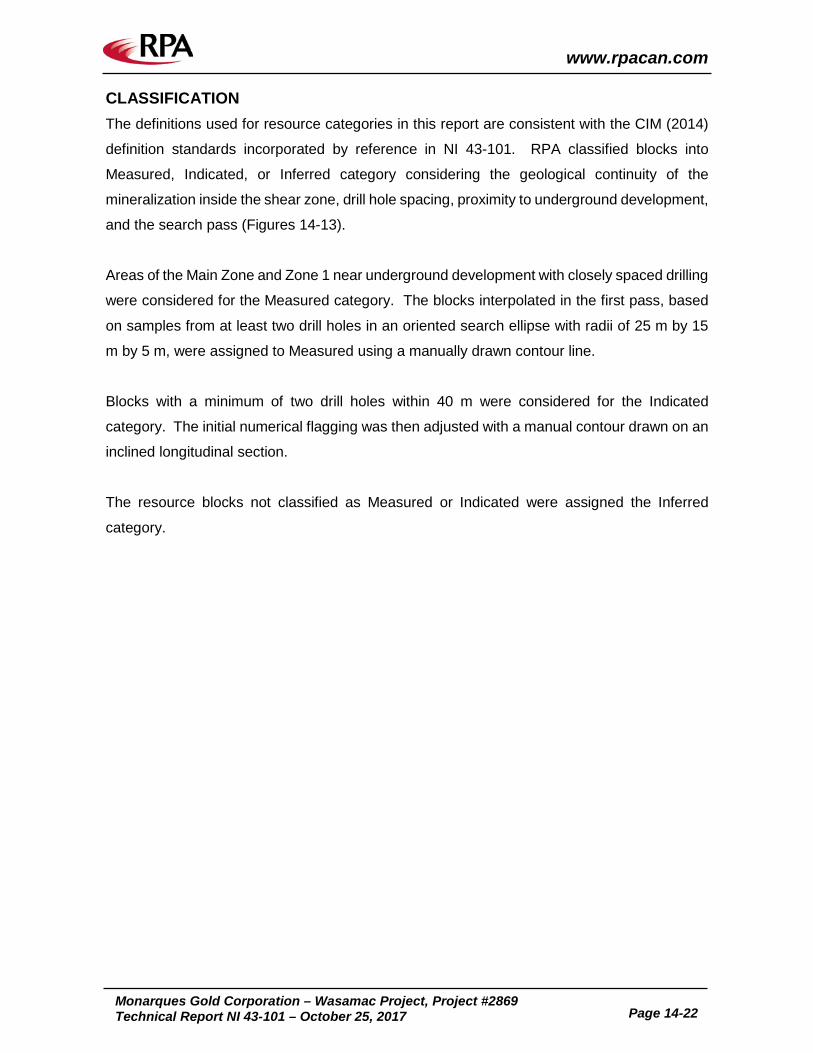
www.rpacan.com
Monarques Gold Corporation – Wasamac Project, Project #2869
Technical Report NI 43-101 – October 25, 2017 Page 14-22
CLASSIFICATION The definitions used for resource categories in this report are consistent with the CIM (2014)
definition standards incorporated by reference in NI 43-101. RPA classified blocks into
Measured, Indicated, or Inferred category considering the geological continuity of the
mineralization inside the shear zone, drill hole spacing, proximity to underground development,
and the search pass (Figures 14-13).
Areas of the Main Zone and Zone 1 near underground development with closely spaced drilling
were considered for the Measured category. The blocks interpolated in the first pass, based
on samples from at least two drill holes in an oriented search ellipse with radii of 25 m by 15
m by 5 m, were assigned to Measured using a manually drawn contour line.
Blocks with a minimum of two drill holes within 40 m were considered for the Indicated
category. The initial numerical flagging was then adjusted with a manual contour drawn on an
inclined longitudinal section.
The resource blocks not classified as Measured or Indicated were assigned the Inferred
category.
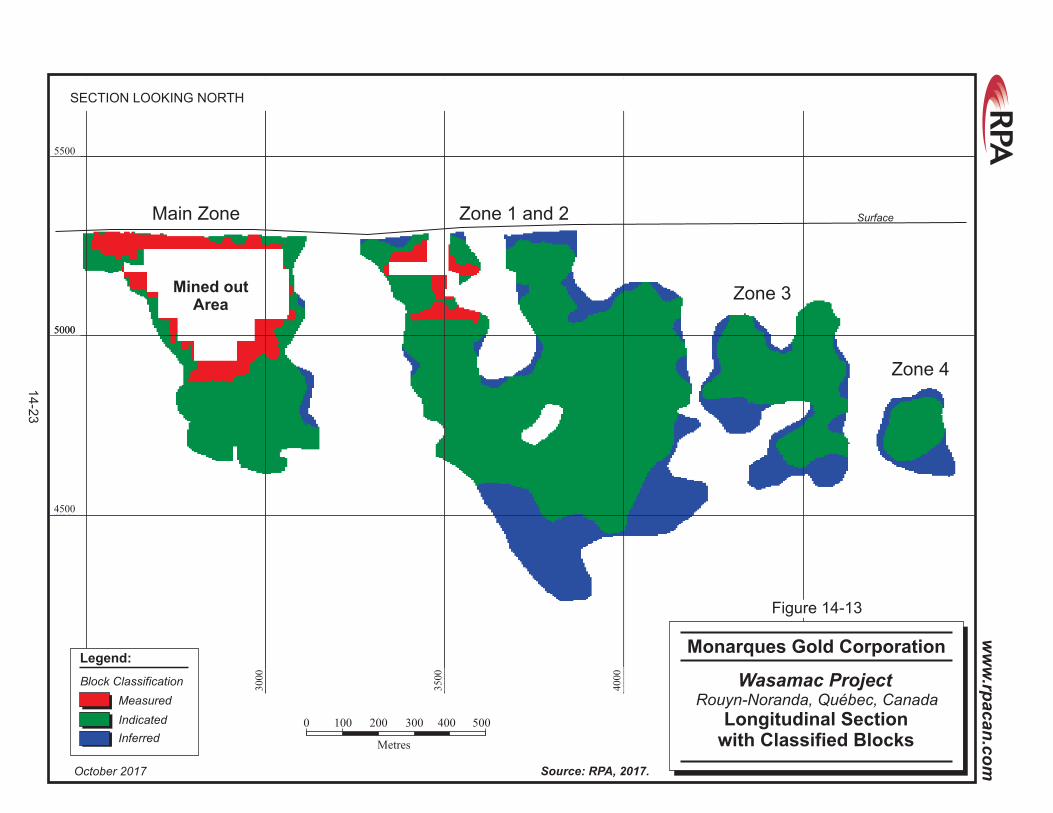
0 100 500
Metres
200 300 400
4500
SECTION LOOKING NORTH
3000
5000
5500
3500
4000
Main Zone Zone 1 and 2
Zone 3
Zone 4
5000
Mined outArea
Surface
Block Classification
Legend:
Indicated
Measured
Inferred
October 2017 Source: RPA, 2017.
Wasamac Project
Longitudinal Sectionwith Classified Blocks
Monarques Gold Corporation
Rouyn-Noranda, Québec, Canada
Figure 14-13
14-2
3
ww
w.rp
acan
.co
m
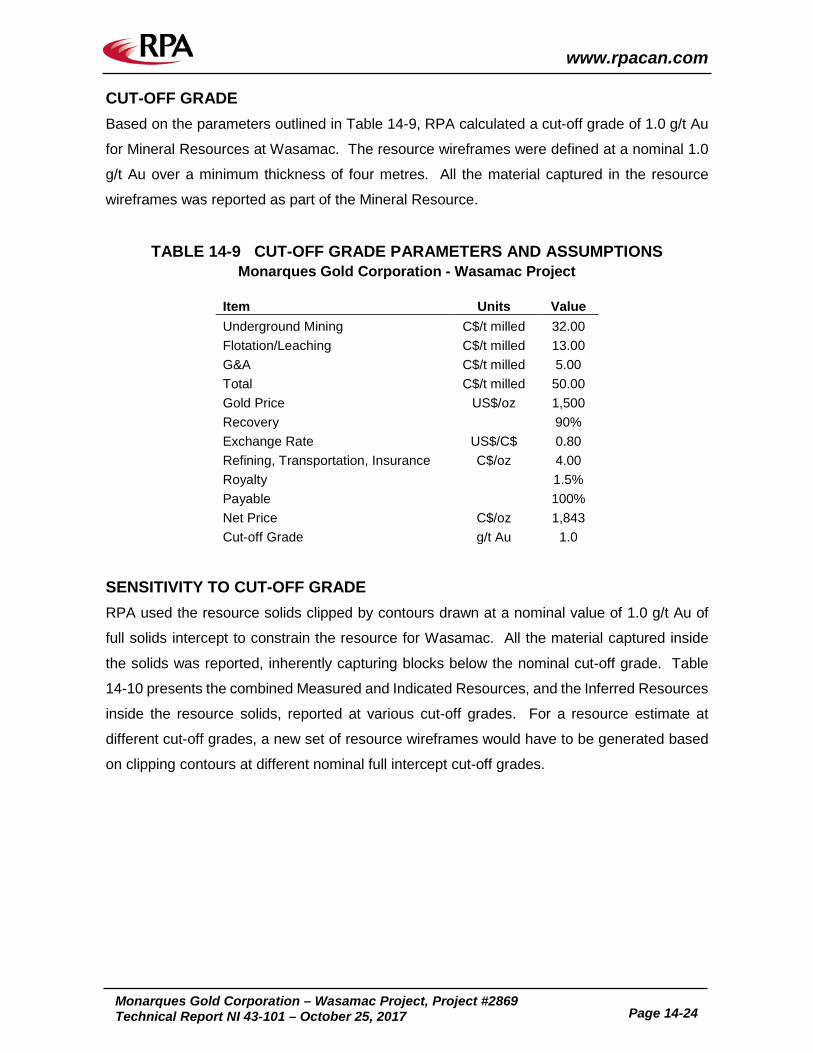
www.rpacan.com
Monarques Gold Corporation – Wasamac Project, Project #2869
Technical Report NI 43-101 – October 25, 2017 Page 14-24
CUT-OFF GRADE Based on the parameters outlined in Table 14-9, RPA calculated a cut-off grade of 1.0 g/t Au
for Mineral Resources at Wasamac. The resource wireframes were defined at a nominal 1.0
g/t Au over a minimum thickness of four metres. All the material captured in the resource
wireframes was reported as part of the Mineral Resource.
TABLE 14-9 CUT-OFF GRADE PARAMETERS AND ASSUMPTIONS Monarques Gold Corporation - Wasamac Project
Item Units Value Underground Mining C$/t milled 32.00 Flotation/Leaching C$/t milled 13.00 G&A C$/t milled 5.00 Total C$/t milled 50.00 Gold Price US$/oz 1,500 Recovery 90% Exchange Rate US$/C$ 0.80 Refining, Transportation, Insurance C$/oz 4.00 Royalty 1.5% Payable 100% Net Price C$/oz 1,843 Cut-off Grade g/t Au 1.0
SENSITIVITY TO CUT-OFF GRADE RPA used the resource solids clipped by contours drawn at a nominal value of 1.0 g/t Au of
full solids intercept to constrain the resource for Wasamac. All the material captured inside
the solids was reported, inherently capturing blocks below the nominal cut-off grade. Table
14-10 presents the combined Measured and Indicated Resources, and the Inferred Resources
inside the resource solids, reported at various cut-off grades. For a resource estimate at
different cut-off grades, a new set of resource wireframes would have to be generated based
on clipping contours at different nominal full intercept cut-off grades.
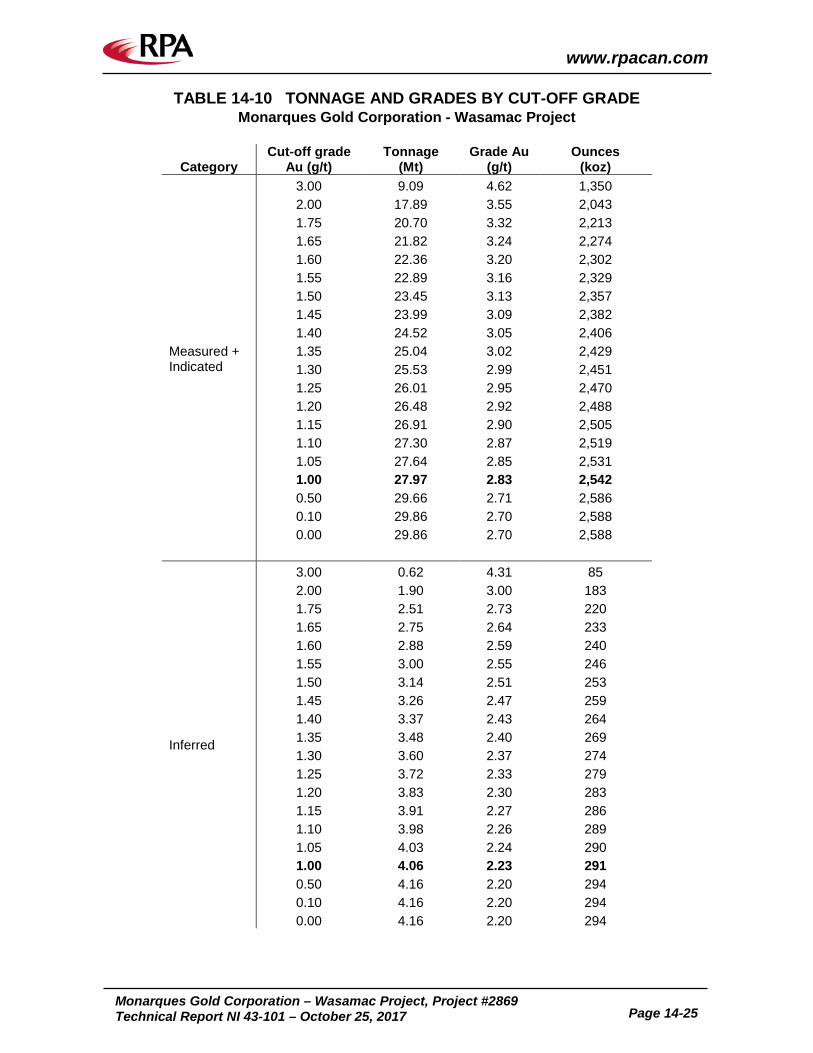
www.rpacan.com
Monarques Gold Corporation – Wasamac Project, Project #2869
Technical Report NI 43-101 – October 25, 2017 Page 14-25
TABLE 14-10 TONNAGE AND GRADES BY CUT-OFF GRADE Monarques Gold Corporation - Wasamac Project
Category Cut-off grade
Au (g/t) Tonnage
(Mt) Grade Au
(g/t) Ounces
(koz)
Measured + Indicated
3.00 9.09 4.62 1,350 2.00 17.89 3.55 2,043 1.75 20.70 3.32 2,213 1.65 21.82 3.24 2,274 1.60 22.36 3.20 2,302 1.55 22.89 3.16 2,329 1.50 23.45 3.13 2,357 1.45 23.99 3.09 2,382 1.40 24.52 3.05 2,406 1.35 25.04 3.02 2,429 1.30 25.53 2.99 2,451 1.25 26.01 2.95 2,470 1.20 26.48 2.92 2,488 1.15 26.91 2.90 2,505 1.10 27.30 2.87 2,519 1.05 27.64 2.85 2,531 1.00 27.97 2.83 2,542 0.50 29.66 2.71 2,586 0.10 29.86 2.70 2,588 0.00 29.86 2.70 2,588
Inferred
3.00 0.62 4.31 85 2.00 1.90 3.00 183 1.75 2.51 2.73 220 1.65 2.75 2.64 233 1.60 2.88 2.59 240 1.55 3.00 2.55 246 1.50 3.14 2.51 253 1.45 3.26 2.47 259 1.40 3.37 2.43 264 1.35 3.48 2.40 269 1.30 3.60 2.37 274 1.25 3.72 2.33 279 1.20 3.83 2.30 283 1.15 3.91 2.27 286 1.10 3.98 2.26 289 1.05 4.03 2.24 290 1.00 4.06 2.23 291 0.50 4.16 2.20 294 0.10 4.16 2.20 294 0.00 4.16 2.20 294
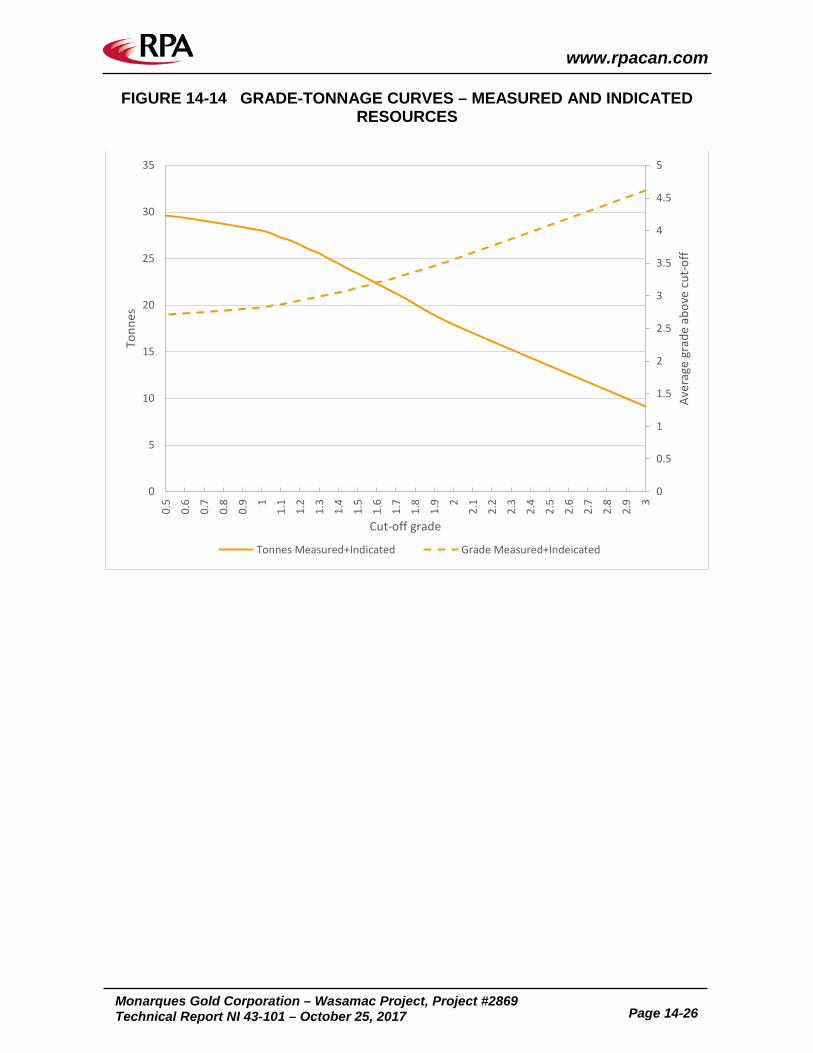
www.rpacan.com
Monarques Gold Corporation – Wasamac Project, Project #2869 Technical Report NI 43-101 – October 25, 2017 Page 14-26
FIGURE 14-14 GRADE-TONNAGE CURVES – MEASURED AND INDICATED RESOURCES
0
0.5
1
1.5
2
2.5
3
3.5
4
4.5
5
0
5
10
15
20
25
30
350.
5
0.6
0.7
0.8
0.9 1
1.1
1.2
1.3
1.4
1.5
1.6
1.7
1.8
1.9 2
2.1
2.2
2.3
2.4
2.5
2.6
2.7
2.8
2.9 3
Aver
age
grad
e ab
ove
cut-
off
Tonn
es
Cut-off grade
Tonnes Measured+Indicated Grade Measured+Indeicated
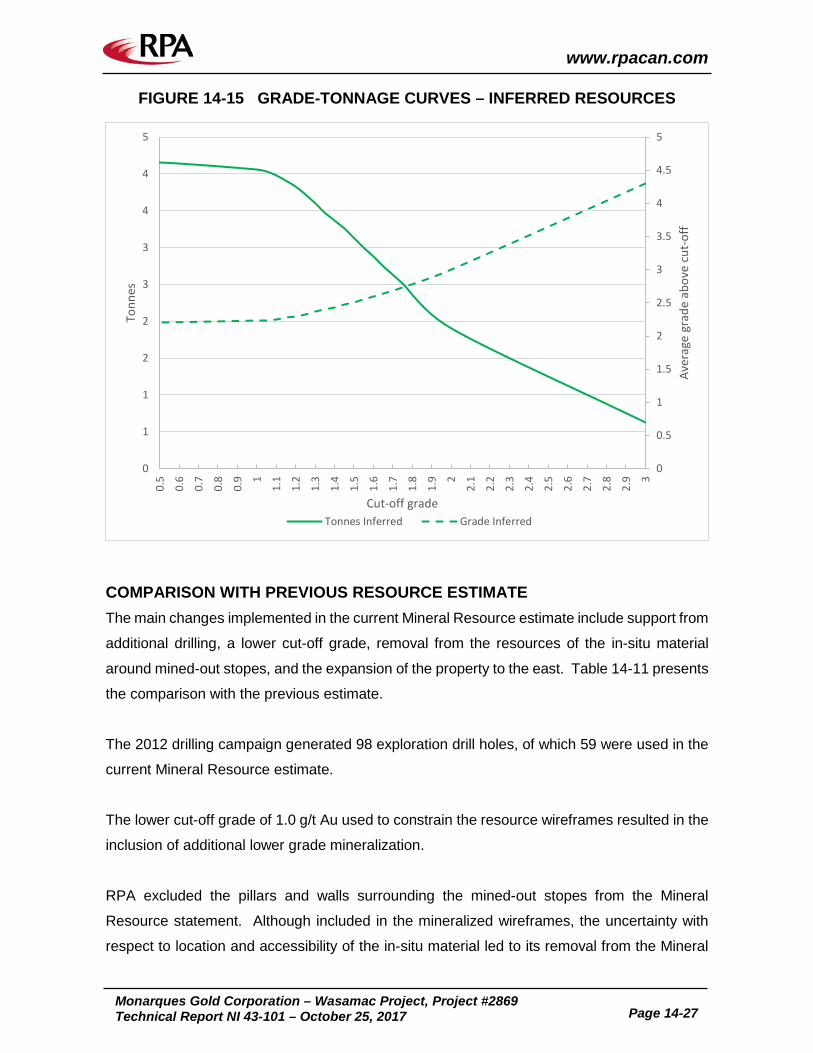
www.rpacan.com
Monarques Gold Corporation – Wasamac Project, Project #2869
Technical Report NI 43-101 – October 25, 2017 Page 14-27
FIGURE 14-15 GRADE-TONNAGE CURVES – INFERRED RESOURCES
COMPARISON WITH PREVIOUS RESOURCE ESTIMATE
The main changes implemented in the current Mineral Resource estimate include support from
additional drilling, a lower cut-off grade, removal from the resources of the in-situ material
around mined-out stopes, and the expansion of the property to the east. Table 14-11 presents
the comparison with the previous estimate.
The 2012 drilling campaign generated 98 exploration drill holes, of which 59 were used in the
current Mineral Resource estimate.
The lower cut-off grade of 1.0 g/t Au used to constrain the resource wireframes resulted in the
inclusion of additional lower grade mineralization.
RPA excluded the pillars and walls surrounding the mined-out stopes from the Mineral
Resource statement. Although included in the mineralized wireframes, the uncertainty with
respect to location and accessibility of the in-situ material led to its removal from the Mineral
0
0.5
1
1.5
2
2.5
3
3.5
4
4.5
5
0
1
1
2
2
3
3
4
4
5
0.5
0.6
0.7
0.8
0.9 1
1.1
1.2
1.3
1.4
1.5
1.6
1.7
1.8
1.9 2
2.1
2.2
2.3
2.4
2.5
2.6
2.7
2.8
2.9 3
Aver
age
grad
e ab
ove
cut-
off
Tonn
es
Cut-off gradeTonnes Inferred Grade Inferred
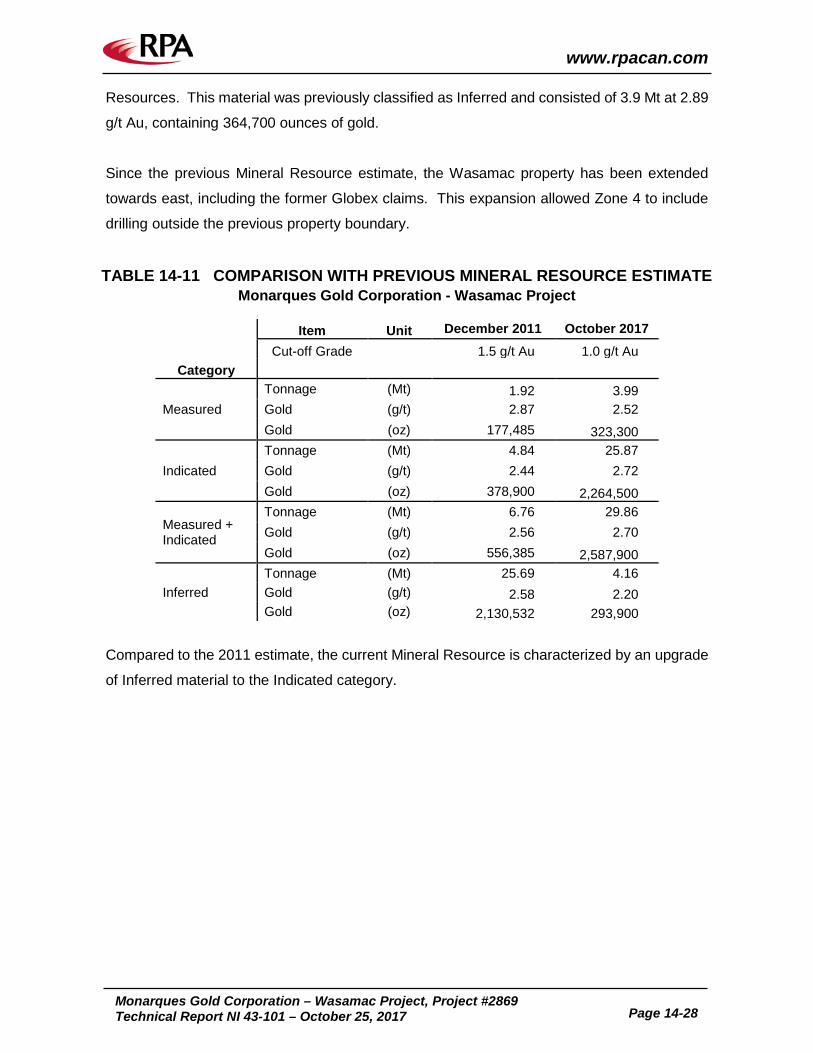
www.rpacan.com
Monarques Gold Corporation – Wasamac Project, Project #2869
Technical Report NI 43-101 – October 25, 2017 Page 14-28
Resources. This material was previously classified as Inferred and consisted of 3.9 Mt at 2.89
g/t Au, containing 364,700 ounces of gold.
Since the previous Mineral Resource estimate, the Wasamac property has been extended
towards east, including the former Globex claims. This expansion allowed Zone 4 to include
drilling outside the previous property boundary.
TABLE 14-11 COMPARISON WITH PREVIOUS MINERAL RESOURCE ESTIMATE Monarques Gold Corporation - Wasamac Project
Item Unit December 2011 October 2017
Cut-off Grade 1.5 g/t Au 1.0 g/t Au Category
Measured Tonnage (Mt) 1.92 3.99 Gold (g/t) 2.87 2.52 Gold (oz) 177,485 323,300
Indicated Tonnage (Mt) 4.84 25.87 Gold (g/t) 2.44 2.72 Gold (oz) 378,900 2,264,500
Measured + Indicated
Tonnage (Mt) 6.76 29.86 Gold (g/t) 2.56 2.70 Gold (oz) 556,385 2,587,900
Inferred Tonnage (Mt) 25.69 4.16 Gold (g/t) 2.58 2.20 Gold (oz) 2,130,532 293,900
Compared to the 2011 estimate, the current Mineral Resource is characterized by an upgrade
of Inferred material to the Indicated category.
www.rpacan.com
Monarques Gold Corporation – Wasamac Project, Project #2869
Technical Report NI 43-101 – October 25, 2017 Page 15-1
15 MINERAL RESERVE ESTIMATE There is no current estimate of Mineral Reserves on the Wasamac Project.
www.rpacan.com
Monarques Gold Corporation – Wasamac Project, Project #2869
Technical Report NI 43-101 – October 25, 2017 Page 16-1
16 MINING METHODS This section is not applicable.
www.rpacan.com
Monarques Gold Corporation – Wasamac Project, Project #2869
Technical Report NI 43-101 – October 25, 2017 Page 17-1
17 RECOVERY METHODS This section is not applicable.
www.rpacan.com
Monarques Gold Corporation – Wasamac Project, Project #2869
Technical Report NI 43-101 – October 25, 2017 Page 18-1
18 PROJECT INFRASTRUCTURE This section is not applicable.
www.rpacan.com
Monarques Gold Corporation – Wasamac Project, Project #2869
Technical Report NI 43-101 – October 25, 2017 Page 19-1
19 MARKET STUDIES AND CONTRACTS This section is not applicable.
www.rpacan.com
Monarques Gold Corporation – Wasamac Project, Project #2869
Technical Report NI 43-101 – October 25, 2017 Page 20-1
20 ENVIRONMENTAL STUDIES, PERMITTING, AND SOCIAL OR COMMUNITY IMPACT This section is not applicable.
www.rpacan.com
Monarques Gold Corporation – Wasamac Project, Project #2869
Technical Report NI 43-101 – October 25, 2017 Page 21-1
21 CAPITAL AND OPERATING COSTS This section is not applicable.
www.rpacan.com
Monarques Gold Corporation – Wasamac Project, Project #2869
Technical Report NI 43-101 – October 25, 2017 Page 22-1
22 ECONOMIC ANALYSIS This section is not applicable

www.rpacan.com
Monarques Gold Corporation – Wasamac Project, Project #2869
Technical Report NI 43-101 – October 25, 2017 Page 23-1
23 ADJACENT PROPERTIES The Property is contiguous with claims held by a number of companies and individuals (Figure
23-1). RPA has not relied upon any information from the adjoining properties in the preparation
of this report.
FRANCOEUR The Francoeur deposits include the Francoeur No. 1, No. 2, and No. 3 deposits. They occur
along the Francoeur-Wasa Shear Zone and, from west to east, are linked with the Arntfield
No. 1, No. 2, and No. 3 deposits, the Wasamac Mine, and the Wingate deposit. Despite
showing local differences, all these deposits are very similar to one another in both geological
aspects and type of mineralization.
The Francoeur No. 3 deposit, the largest deposit, is hosted in the metavolcanic rocks of the
Blake River Group. Gold mineralization mainly developed in the ductile Francoeur-Wasa
Shear Zone, and is in contact with the southern margin of a gabbro-diorite stock. The "West
Zone" is located to the west of the No. 3 deposit, which was mined until 2001 down to the 17th
level by Richmont. The West Zone orebody is in the same Francoeur-Wawa Shear Zone, dips
northward at approximately 30° to 40°, and gold-bearing mineralization is closely associated
with albite-pyrite alteration.
Resources of the West Zone of the Francoeur Mine were re-assessed in 2009, at which time
probable reserves of 615,664 t grading 6.91 g/t were defined (Adam et al., 2009)
LAC FORTUNE Located less than 5 km south of the Francoeur Mine, the Lac Fortune property contains three
veins, including the "Central" Zone from which historical resources of 224,425 t grading 5.38
g/t Au were estimated. This estimate is considered to be historical in nature and should not
be relied upon.
The quartz-tourmaline gold bearing veins are within a strong shear zone that cross-cut
carbonatized andesite. This andesite is part of the Blake River Group and the Lac Fortune
www.rpacan.com
Monarques Gold Corporation – Wasamac Project, Project #2869
Technical Report NI 43-101 – October 25, 2017 Page 23-2
shear is likely associated with the regional scale Larder Lake-Cadillac Break which extends
from Matachewan, Ontario to Val-d’Or, Quebec.
ALDERMAC The past-producing Aldermac copper mine occurs to the northwest of the property. The
following is extracted from Barrett et al. (1991):
The original Aldermac mine near Noranda contained several Cu–Zn massive sulphide lenses
hosted by felsic to mafic volcanic rocks of the late Archean Blake River Group. The original
Nos. 3–6 orebodies, which consisted of massive pyrite, with lesser magnetite, pyrrhotite,
chalcopyrite, and sphalerite, contained 1.87 Mt of Cu-Zn ore that averaged 1.47% Cu (Zn was
not recovered). The orebodies occurred within felsic breccias and tuffs up to 100 m thick that
are stratigraphically overlain by an extensive dome of mainly massive rhyolite and rhyodacite
(up to 250 m thick and at least 550 m across). Most of the volcanic rocks that laterally flank
and overlie the felsic dome are dacitic to andesitic flows, breccia, and tuff, with minor rhyolites,
and associated subvolcanic sills of quartz-feldspar porphyry and gabbro.
The new massive sulphide deposit, discovered in 1988, lies 150 m to 200 m east of the mined-
out orebodies, at a similar stratigraphic level within altered felsic breccia and tuff. The sulphides
are mainly in the No. 8 lens, which contains 1.0 Mt at an average grade of 1.54% Cu, 4.12%
Zn, 31.2 g/t Ag, and 0.48 g/t Au”.
This estimate is considered to be historical in nature and should not be relied upon.
RM NICKEL Northwest of the Wasamac property is the RM Nickel deposit, which occurs at the base of a
gabbro intrusion. The mineralization consists of lenses of massive to semi-massive sulphides,
up to four metres thick. Zones of disseminated sulphides occur above these mineralized
lenses. In 1980, Falconbridge Copper estimated the resource at 131,352 t grading 0.79% Cu
and 0.46% Ni. This estimation was based on the results of more than 100 holes drilled by RM
Nickel in the late 1950s. The RM Nickel property also belongs to Richmont.
www.rpacan.com
Monarques Gold Corporation – Wasamac Project, Project #2869
Technical Report NI 43-101 – October 25, 2017 Page 23-3
RPA has not independently verified this information relating to the properties mentioned above
and this information is not necessarily indicative of the mineralization at the Wasamac
Property.
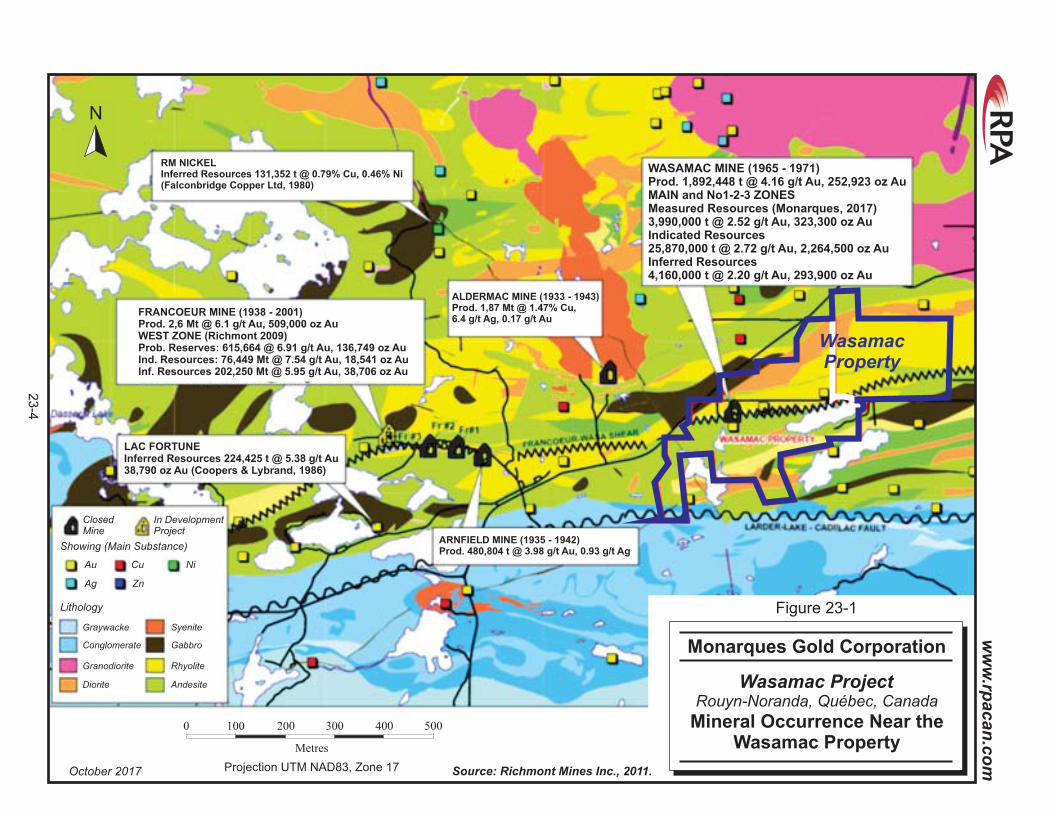
Lithology
ARNFIELD MINE (1935 - 1942)Prod. 480,804 t @ 3.98 g/t Au, 0.93 g/t Ag
ALDERMAC MINE (1933 - 1943)Prod. 1,87 Mt @ 1.47% Cu,6.4 g/t Ag, 0.17 g/t Au
WASAMAC MINE (1965 - 1971)Prod. 1,892,448 t @ 4.16 g/t Au, 252,923 oz AuMAIN and No1-2-3 ZONESMeasured Resources ( , 201 )Monarques 7
t @ 2. g/t Au, oz Au3,990,000 52 323,300Indicated Resources
t @ 2. g/t Au, oz Au25,870,000 72 2,264,500Inferred Resources
t @ 2. g/t Au, oz Au4,160,000 20 293,900
LAC FORTUNEInferred Resources 224,425 t @ 5.38 g/t Au38,790 oz Au (Coopers & Lybrand, 1986)
ClosedMine
In DevelopmentProject
Au Cu Ni
Ag Zn
Showing (Main Substance)
Graywacke
Conglomerate
Granodiorite
Diorite
Syenite
Gabbro
Rhyolite
Andesite
RM NICKELInferred Resources 131,352 t @ 0.79% Cu, 0.46% Ni(Falconbridge Copper Ltd, 1980)
FRANCOEUR MINE (1938 - 2001)Prod. 2,6 Mt @ 6.1 g/t Au, 509,000 oz AuWEST ZONE (Richmont 2009)Prob. Reserves: 615,664 @ 6.91 g/t Au, 136,749 oz AuInd. Resources: 76,449 Mt @ 7.54 g/t Au, 18,541 oz AuInf. Resources 202,250 Mt @ 5.95 g/t Au, 38,706 oz Au
WasamacpertyPro
0 100 500
Metres
200 300 400
Projection UTM NAD83, Zone 17October 2017 Source: Richmont Mines Inc., 2011.
Wasamac Project
Mineral Occurrence theNearWasamac Property
Monarques Gold Corporation
Rouyn-Noranda, Québec, Canada
Figure 23-1
23
-4
ww
w.rp
acan
.co
m
N
www.rpacan.com
Monarques Gold Corporation – Wasamac Project, Project #2869
Technical Report NI 43-101 – October 25, 2017 Page 24-1
24 OTHER RELEVANT DATA AND INFORMATION No additional information or explanation is necessary to make this Technical Report
understandable and not misleading.
www.rpacan.com
Monarques Gold Corporation – Wasamac Project, Project #2869
Technical Report NI 43-101 – October 25, 2017 Page 25-1
25 INTERPRETATION AND CONCLUSIONS The Wasamac property is located within the prolific Abitibi greenstone belt which hosts a
number of major gold and polymetallic deposits. It is underlain by prospective lithologies
belonging to the Blake River Group. Mineralization is spatially related to the WSZ, a second-
order ductile shear zone of the Cadillac–Larder Lake Fault Zone. The WSZ bisects the
property in an east-west direction and dips moderately to the north.
Gold mineralization is hosted in a number of zones located along the WSZ namely, from west
to east, the Main, Zone 1, Zone 2, Zone 3, MacWin, and Zone 4. The Wildcat Zone occurs off
the WSZ to the south of the Main Zone. Historical production from 1965 to 1971 was
predominantly from the Main Zone and upper portion of Zone 1 with a limited tonnage extracted
from the Wildcat Zone. A total of 252,923 ounces of gold were produced at Wasamac. Zone
2 was partially developed but was not mined.
RPA updated the Mineral Resource estimate using both surface and underground drilling and
based on the assumption that the deposit would potentially be developed and mined using
underground mining methods. At a cut-off grade of 1.0 g/t Au, RPA estimated 3.99 Mt at an
average grade of 2.52 g/t Au, containing 323,300 ounces in the Measured category, and 25.87
Mt at an average grade of 2.72 g/t Au, containing 2,264,500 ounces in the Indicated category.
An additional 4.16 Mt at an average grade of 2.20 g/t Au, containing 293,900 ounces are
estimated in the Inferred category.
The estimate was supported by a block model and was constrained with mineralized
wireframes capturing mineralized intercepts with a nominal grade of 1.0 g/t Au over a minimum
thickness of four metres. Erratic higher-grade samples were capped at 35 g/t Au prior to
compositing to two metre long intervals. Block gold grade was estimated using an inverse
distance to the power three (ID3) interpolation method.
The current Mineral Resource estimate reflects a number of changes, including exclusion of
previous resources, addition of new resources, a lower cut-off grade, and classification
upgrade of Inferred Mineral Resources to the Indicated category.
www.rpacan.com
Monarques Gold Corporation – Wasamac Project, Project #2869
Technical Report NI 43-101 – October 25, 2017 Page 25-2
Drilling to date indicates that the Main Zone is open to the east and at depth. Zone 2 and Zone
3 are also open at depth.
The Property benefits from significant infrastructure including proximity to a major mining
centre in a mining friendly jurisdiction, underground openings that could be re-developed, road
access, access to the provincial power grid, and a restored tailings disposal area.
RPA is of the opinion that the Wasamac property hosts a significant gold deposit and that the
Project has good exploration potential which warrants additional exploration and technical
studies.
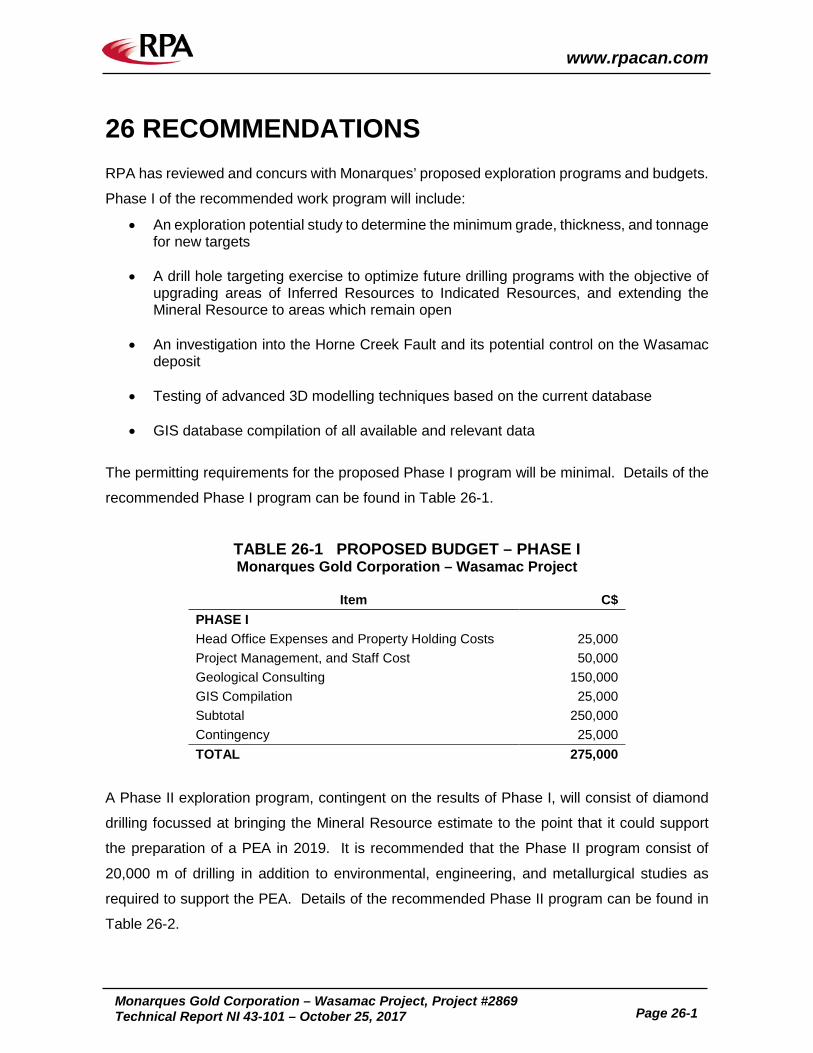
www.rpacan.com
Monarques Gold Corporation – Wasamac Project, Project #2869
Technical Report NI 43-101 – October 25, 2017 Page 26-1
26 RECOMMENDATIONS RPA has reviewed and concurs with Monarques’ proposed exploration programs and budgets.
Phase I of the recommended work program will include:
• An exploration potential study to determine the minimum grade, thickness, and tonnage for new targets
• A drill hole targeting exercise to optimize future drilling programs with the objective of upgrading areas of Inferred Resources to Indicated Resources, and extending the Mineral Resource to areas which remain open
• An investigation into the Horne Creek Fault and its potential control on the Wasamac deposit
• Testing of advanced 3D modelling techniques based on the current database
• GIS database compilation of all available and relevant data
The permitting requirements for the proposed Phase I program will be minimal. Details of the
recommended Phase I program can be found in Table 26-1.
TABLE 26-1 PROPOSED BUDGET – PHASE I Monarques Gold Corporation – Wasamac Project
Item C$
PHASE I Head Office Expenses and Property Holding Costs 25,000 Project Management, and Staff Cost 50,000 Geological Consulting 150,000 GIS Compilation 25,000 Subtotal 250,000 Contingency 25,000 TOTAL 275,000
A Phase II exploration program, contingent on the results of Phase I, will consist of diamond
drilling focussed at bringing the Mineral Resource estimate to the point that it could support
the preparation of a PEA in 2019. It is recommended that the Phase II program consist of
20,000 m of drilling in addition to environmental, engineering, and metallurgical studies as
required to support the PEA. Details of the recommended Phase II program can be found in
Table 26-2.
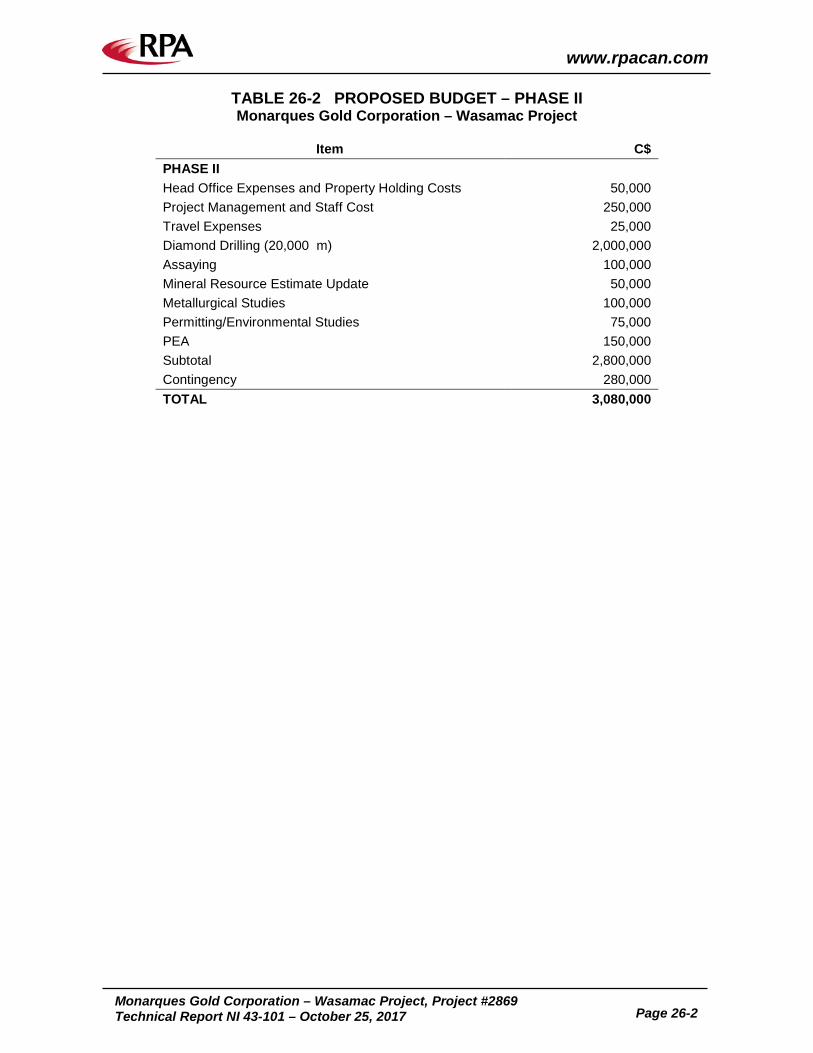
www.rpacan.com
Monarques Gold Corporation – Wasamac Project, Project #2869
Technical Report NI 43-101 – October 25, 2017 Page 26-2
TABLE 26-2 PROPOSED BUDGET – PHASE II Monarques Gold Corporation – Wasamac Project
Item C$
PHASE II Head Office Expenses and Property Holding Costs 50,000 Project Management and Staff Cost 250,000 Travel Expenses 25,000 Diamond Drilling (20,000 m) 2,000,000 Assaying 100,000 Mineral Resource Estimate Update 50,000 Metallurgical Studies 100,000 Permitting/Environmental Studies 75,000 PEA 150,000 Subtotal 2,800,000 Contingency 280,000 TOTAL 3,080,000
www.rpacan.com
Monarques Gold Corporation – Wasamac Project, Project #2869
Technical Report NI 43-101 – October 25, 2017 Page 27-1
27 REFERENCES Adam D., 2011: Technical Report on the Mineral Resource Estimate for the Wasamac Gold
Project Rouyn-Noranda, Quebec, Canada, Richmont Mines, 64 pages, 6 appendices. AMEC, 2012: Etude de Préfaisabilité, Aménagements du site Minier, Project Wasamac, Rouyn
Noranda. A report prepared by AMEC for Richmont Mines Inc., February 2012. AMEC, 2012: Etude de Préfaisabilité- Parc a Residus Evaluation de sites Potentiels, Project
Wasamac, Rouyn Noranda. A report prepared by AMEC. A report prepared for Richmont Mines Inc., March 2012.
Andrieux P., 2011: Revue des informations géomécaniques disponibles pour Wasamac,
Mémorandum technique, ITASACA, 13 pages. BBA Inc., 2012: Preliminary Economic Assessment for the Wasamac Gold Project. A report
prepared by BBA Inc. for Richmont Mines Inc., May 4, 2012. Belzile Solutions Inc. (BSI), 2010: Statistical Study on the Wasamac Project, Rouyn-Noranda
Quebec. A report prepared by Belzile Solutions Inc. for Richmont Mines Inc., 2010. Bugnon, M.F., 1981: Réserves du Pilier de Surface de la Zone Principale Wasamac Mine #1,
canton de Beauchastel, 8 pages. Bugnon, M.F., 1981: Section 1: état des réserves de la Mine Wasamac No.1 à la fin avril 1971.
Section 2: Ré-évaluation de la mine Wasamac No1, janvier 1981. 31 pages. Bugnon, M.F., 1981: Réserves de la zone principale, niveaux 800’ à 1525’, Wasamac Mine
No.1, canton de Beauchastel, 48 pages. Bugnon, M.F., 1982: Rapport de forages, campagne 1980-1981, propriété Wasamac, Canton
de Beauchastel, Québec, 23 pages. Bugnon, M.F., 1982: Vérification des analyses et graphiques de corrélation, campagne de
forages 1980-1981, propriété Wasamac, Canton de Beauchastel, Québec. 9 pages. Bugnon, M.F., Carré, M., Le Beau, Y. and Marchand, K., 1981: Rapport sur la géologie et le
potentiel économique de la propriété Wasamac, Canton de Beauchastel. 22 pages. Canadian Institute of Mining, Metallurgy and Petroleum (CIM), 2014: CIM Definition Standards
for Mineral Resources and Mineral Reserves, adopted by CIM Council on May 10, 2014. Colvine, A.C, Fyon, A.J., Heather, K.B., Marmont, S., Smith, P.M. and Troop, D.G. 1988:
Archean lode gold deposits in Ontario. Ontario Geological Survey; Miscellaneous Paper 139.
Couture, J.-F., Pilote, P., 1991: Géologie et Genèse des Minéralisations Aurifères Associées
au Cisaillement Francoeur-Wasa - Géologie du Gisement Francoeur. Ministère Énergie et Ressources du Québec. 156 pages.
www.rpacan.com
Monarques Gold Corporation – Wasamac Project, Project #2869
Technical Report NI 43-101 – October 25, 2017 Page 27-2
Couture, J.-F., Pilote, P., 1993: Geology and Alteration Patterns of a Disseminated, Shear Zone Hosted Mesothermal Gold Deposit: The Francoeur #3 Deposit, Rouyn-Noranda, Quebec.
Dubé, B., and Gosselin, P., 2006: Greenstone-hosted Quartz-Carbonate Vein Deposits;
Consolidation and Synthesis of Mineral Deposits Knowledge web site, Geological Survey of Canada (http://gsc.gc.ca/mindep/synth_dep/gold/greenstone).
Gao, S., 1994: Étude de la Géologie et des Inclusions Fluides des Gisements Francoeur et de
Lac Fortune. Masters Thesis presented at the Université du Québec à Chicoutimi (UQAC). 98 pages.
Gauthier, J., Galarneau, Y., Lavigne, M., Adam, D., Lance, S., and Hardie, C., 2012: Technical
Report on the Wasamac Project, Rouyn-Noranda, Québec, Canada. A technical report prepared by RPA Inc. on behalf of Richmont Mines Inc.
Genivar, 2009: Les Mines Richmont Wasamac Project Pre-Feasibility Study, Prepared by
Genivar Inc., for Richmont Mines Inc., February 9, 2012. Guay, M., 2004: Report on Wasamac gold property, Beauchastel Township, Quebec, SNRC
32D03. 14 pages. Jolly, W., 1978: Metamorphic history of the Archean Abitibi Belt. In Metamorphism in the
Canadian Shield. Edited by J. A. Fraser and W. W. Heywood, Geological Survey of Canada. Paper 78-10, 367 pages.
Karpoff, B.S., 1986: Rapport d’évaluation, propriété Wasamac, canton de Beauchastel, NO
québécois. Préparé par Coopers & Lybrand pour Ressources Minières Rouyn Inc. 26 pages.
Landry, N., 2016a: Rapport de sondage, Propriété Wasamac, Année 2015. A report prepared
by Services Technominex Inc. on behalf of Richmont Mines Inc., 11p. Landry, N., 2016b: Rapport de sondage, Propriété Wasamac, Année 2016. A report prepared
by Services Technominex Inc on behalf of Richmont Mines Inc., 12p. Landry, N., 2013: Rapport des travaux, Propriété Option Globex 2011-2012. A report prepared
for Richmont Mines Inc. and Globex Mining Enterprises Inc., 170. Marshall, I.B. and Schutt, P.H., 1999: A national ecological framework for Canada – Overview.
A co-operative product by Ecosystems Science Directorate, Environment Canada and Research Branch, Agriculture and Agri-Food Canada.
Richelieu Hydrogeologie Inc., 2012: Project D’Exploitation d’une Mine Souterraine Etude
Hydrogeologique sur L’Impact du Project. A report prepared by Richelieu Hydrogeologie Inc., for Richmont Mines Inc.
Richmont Mines Inc., 2013: Richmont Mines Inc. Annual Information Form, 2012. Available at
www.sedar.com (April 2, 2012)
www.rpacan.com
Monarques Gold Corporation – Wasamac Project, Project #2869
Technical Report NI 43-101 – October 25, 2017 Page 28-1
28 DATE AND SIGNATURE PAGE This report titled Technical Report on the Wasamac Project, Rouyn-Noranda, Quebec, Canada
and dated October 25, 2017 was prepared and signed by the following author:
(Signed and Sealed) “Tudorel Ciuculescu” Dated at Toronto, ON Tudorel Ciuculescu, P. Geo October 25, 2017 Senior Geologist
www.rpacan.com
Monarques Gold Corporation – Wasamac Project, Project #2869
Technical Report NI 43-101 – October 25, 2017 Page 29-1
29 CERTIFICATE OF QUALIFIED PERSON TUDOREL CIUCULESCU I, Tudorel Ciuculescu, M.Sc., P.Geo., as the author of this report entitled “Technical Report on the Wasamac Project, Rouyn-Noranda, Quebec, Canada” prepared for Monarques Gold Corporation and dated October 25, 2017, do hereby certify that: 1. I am Senior Geologist with Roscoe Postle Associates Inc. of Suite 501, 55 University Ave
Toronto, ON, M5J 2H7. 2. I am a graduate of University of Bucharest with a B.Sc. degree in Geology in 2000 and
University of Toronto with a M.Sc. degree in Geology in 2003. 3. I am registered as a Professional Geologist in the Province of Ontario (Reg. #1882). I have
worked as a geologist for a total of 14 years since my graduation. My relevant experience for the purpose of the Technical Report is: • Preparation of Mineral Resource estimates. • Over 5 years of exploration experience in Canada and Chile.
4. I have read the definition of "qualified person" set out in National Instrument 43-101 (NI 43-
101) and certify that by reason of my education, affiliation with a professional association (as defined in NI43-101) and past relevant work experience, I fulfill the requirements to be a "qualified person" for the purposes of NI 43-101.
5. I visited the Wasamac Project on September 29, 2017. 6. I am responsible for all sections of the Technical Report. 7. I am independent of the Issuer applying the test set out in Section 1.5 of NI 43-101. 8. I have had no prior involvement with the property that is the subject of the Technical Report. 9. I have read NI 43-101, and the Technical Report has been prepared in compliance with NI
43-101 and Form 43-101F1. 10. At the effective date of the Technical Report, to the best of my knowledge, information, and
belief, the Technical Report contains all scientific and technical information that is required to be disclosed to make the Technical Report not misleading.
Dated this 25th day of October, 2017 (Signed and Sealed) “Tudorel Ciuculescu” Tudorel Ciuculescu, M.Sc., P.Geo.