momentum transport processes in the stratiform regions of
TRANSCRIPT

Q J R Meteorol Soc (2006) 132 pp 709ndash736 doi 101256qj04141
Momentum transport processes in the stratiform regions of mesoscaleconvective systems over the western Pacific warm pool
By DAVID B MECHEM1lowast SHUYI S CHEN2 and ROBERT A HOUZE Jr3
1Cooperative Institute for Mesoscale Meteorological Studies University of Oklahoma USA2Rosenstiel School of Marine and Atmospheric Sciences University of Miami USA
3Department of Atmospheric Sciences University of Washington USA
(Received 16 September 2004 revised 29 September 2005)
SUMMARY
Momentum transport by the stratiform components of mesoscale convective systems (MCSs) during theTropical OceanndashGlobal Atmosphere Coupled OceanndashAtmosphere Response Experiment in December 1992 isinvestigated using a cloud-resolving model The mesoscale momentum transport by the stratiform regions ofMCSs is examined in two distinct large-scale flow regimes associated with the intraseasonal oscillation overthe western Pacific warm pool Model simulations for 14 December 1992 characterize the lsquowesterly onsetrsquoperiod which has relatively weak low-level westerlies with easterlies above Simulations for 23ndash24 Decemberrepresent the lsquostrong westerlyrsquo regime when westerlies extend from the upper troposphere to the surface witha jet 2ndash3 km above the surface In the westerly onset simulation the extensive stratiform region of a MCScontained a broad region of descent that transported easterly momentum associated with the mid-level easterly jetdownward Thus the stratiform regions acted as a negative feedback to decrease the large-scale mean westerlymomentum developing at low levels In the strong westerly regime the mesoscale downward air motion in thestratiform regions of large MCSs transported westerly momentum downward and thus acted as a positive feedbackstrengthening the already strong westerly momentum at low levels Momentum fluxes by the mesoscale stratiformregion downdraughts are shown to have a systematic and measurable impact on the large-scale momentum budget
KEYWORDS MaddenndashJulian Oscillation Organized convection Up-scale feedback
1 INTRODUCTION
Deep convective cloud systems include lsquomesoscale convective systemsrsquo or MCSswhich exhibit a dual structure consisting of a convective and a stratiform region (Zipser1969 1977 Houze 1982 1989 1997) This dual structure has contributed to the dif-ficulty of evaluating the overall role of the MCS in momentum transports that affectthe large-scale flow Early studies of convective momentum transports (Houze 1973Schneider and Lindzen 1976 Shapiro and Stevens 1980) computed only those asso-ciated with convective updraughts Moncrieff (1978 1981 1992) took a differentapproach by developing a series of MCS airflow models based on conservation of prop-erties along streamlines The Moncrieff streamline models take into account the shear aswell as the thermodynamic stratification of the environment and show the general struc-ture and momentum transporting characteristics of the mesoscale circulation of an idealsteady-state MCS The idealized MCS circulation appears to feed back constructivelyto the momentum field of certain large-scale circulations especially the MaddenndashJulianOscillation (MJO Madden and Julian 1971 1972) for which the idealized MCS cir-culation exhibits a scale-independent self similarity (Moncrieff 2004) To first approxi-mation the idealized layered flows depicted by the theory of Moncrieff resemble themesoscale circulations in real observed storms (Kingsmill and Houze 1999 Bryan andFritsch 2000) and storms represented by cloud-resolving models (eg Mechem et al2002) However real MCSs may occur in environments with complex shear profilesand they are usually three dimensional (3D) and non-steady The Moncrieff models aresteady in a reference frame moving along with travelling systems They represent in a
lowast Corresponding author Cooperative Institute for Mesoscale Meteorological Studies University of Oklahoma100 E Boyd Room 1110 Norman OK 73019-1011 USA e-mail dmechemoueduccopy Royal Meteorological Society 2006
709
710 D B MECHEM et al
simple way some aspects of three-dimensionality such as overturning in the plane trans-verse to the direction of travel (Moncrieff and Miller 1976) But for reasons of mathe-matical tractability the 2D idealizations have been explored the most thoroughly Theidealized models represent the broad dynamical morphology of the travelling convectivesystems not their detailed structure It is important to evaluate the idealized modelsagainst real-world systems for several reasons In particular the sizes and shapes of thestratiform regions of real MCSs vary considerably and the properties of the MCS meso-scale circulations may vary in relation to these structural variations Yang and Houze(1996) subdivided the momentum budget of a MCS into its stratiform and convectivecomponents and found that the momentum budget over the stratiform region of a 2Dsimulated squall line can be considerably different from that over the narrow convec-tive zone and that no particular forcing term in either region dominates how the entireMCS influences the large-scale momentum profile The implication is that the overallmomentum transport by a MCS depends on the actual dimensions of its convective andstratiform regions In a 3D simulation of an asymmetric tropical western Pacific squallline that included a large region of stratiform precipitation Trier et al (1998) found acounter-gradient vertical transport of zonal momentum at mid-levels in the convectiveregion but a more complicated behaviour over the stratiform region They found thatsystem-averaged accelerations were generally much smaller than the individual compo-nents of the forcing Mapes and Wu (2001) calculated convective-scale eddy momentumtendencies from a 2D cloud-resolving model simulation of an 18-day period duringthe Tropical OceanndashGlobal Atmosphere Coupled OceanndashAtmosphere Response Exper-iment (TOGA COARE) They found that the convective momentum transport profilewas largely out of phase with the zonal wind profile causing local extrema in themomentum profile (ie jets) to descend Their shorter (7 day) 2D and 3D simulationsof convection from GATE (Global Atmospheric Research Programme (GARP) AtlanticTropical Experiment) consistently showed similar descending mid-level jet structuresFor none of these cases however did they pursue fully the contribution by stratiformregions of MCSs to the momentum fluxes
The MCSs that occur over the west Pacific warm pool are some of the largestobserved anywhere on earth (Nakazawa 1988 Mapes and Houze 1993 Chen et al1996) These large MCSs sometimes called lsquosuperclustersrsquo have large stratiformregions and are thought to have a major impact on the momentum budget of thewarm-pool region Because of their large stratiform regions the warm-pool MCSs areideally suited for study of the stratiform regionrsquos contribution to momentum transportsMoncrieff and Klinker (1997) inferred from a general circulation model that the super-clusters over the warm pool strongly affected the low-level wind field over the warmpool however they were unable to relate the momentum transport specifically to theconvective or stratiform regions of the MCSs owing to the coarse resolution of themodel grid
The convection over the warm pool was documented extensively in the TOGACOARE field campaign (Godfrey et al 1998) Unique observations were obtained byseveral airborne and shipborne Doppler radars The TOGA COARE dataset thereforeconstitutes an important test-bed for improving our understanding of the role of the largestratiform regions in redistributing environmental momentum In this paper we examineMCSs in the TOGA COARE environment via simulations with a cloud-resolving modeland in the light of TOGA COARE observations
The large-scale circulation during TOGA COARE (November 1992 to February1993) was dominated by the MJO which is essentially an eastward-propagating versionof the idealized equatorial KelvinndashRossby (KR) wave complex described by Gill (1980)
MOMENTUM TRANSPORT OVER THE PACIFIC WARM POOL 711
Figure 1 Timendashheight plot of the 5-day running mean of zonal wind from rawinsonde observations taken overthe TOGA COARE (see text) Intensive Flux Array Vertical lines denote the times of the westerly onset (positivevalues) and strong westerly periods simulated in this study Dates are given in the form mmdd (Adapted from
Chen et al 1996)
The combination of Kelvin and Rossby wave structures produces large-scale cyclonicgyres located on either side of a symmetric Kelvin mode In the idealized Gill modelthe Kelvin mode is centred on the equator but in reality the westerlies are often centredslightly off the equator The complex moves generally eastward and its structure evolvesin time Chen et al (1996) and Houze et al (2000) have described observed aspectsof the KelvinndashRossby wave structures that occurred in TOGA COARE They foundthat the surface wind pattern in the KR wave structure had a strong westerly regionbetween the large-scale cyclonic gyres and a well-defined low-level westerly onsetregion located just ahead (or east) of the strongest westerly region In TOGA COAREthe westerly winds appeared first at the surface in the westerly onset region before thewesterly wind reached its maximum above the planetary boundary layer (PBL) in thestrong westerly region This behaviour is evident at 850 hPa in the beginning of January1992 (Fig 1) The most active and organized convection was observed in the westerlyregime (see eg Fig 8(j) of Chen et al (1996)) in contrast to the idealized Gill modelwhere heating (and by inference convection) is located in between the easterlies andwesterlies associated with the MJO The lack of vertical structure in the Gill modelspecifically the lack of tilt with height is a major drawback in correctly representingthe KR wave structure Furthermore the lack of a realistic PBL in most of the Gill-typemodels inhibits momentum transport from the upper and middle troposphere to levelsnear the surface
Houze et al (2000) qualitatively analysed the MCSs occurring in the westerlyonset and strong westerly regions by using Doppler radar data obtained on shipsand aircraft during TOGA COARE They examined several very large MCSs andfound observational evidence that the mesoscale stratiform regions of the large MCSswere major contributors to the momentum transport especially in the mid-to-lower
712 D B MECHEM et al
troposphere Furthermore they showed that the structure and evolution of the convectivesystems were distinctly different in the westerly onset from those in the strong westerlyregimes
Houze et al (2000) found evidence in the Doppler radar data collected duringTOGA COARE that the stratiform regions of MCSs occurring in the westerly onsetphase of the KR wave pattern transported easterly momentum downward (a negativefeedback to the increasing large-scale westerly momentum) while during the strongwesterly phase of the KR wave pattern the stratiform regions of MCSs transportedwesterly momentum downward (a positive feedback to the already strong westerliesat low levels) Analyses of rawinsonde and wind profiler data from TOGA COAREare consistent with this result in showing that the net lower tropospheric momentumtransport is down-gradient 60ndash65 of the time except during the strong westerly phasewhere it is counter-gradient and helps to maintain the mean shear (Tung and Yanai2002)
This study presents cloud-resolving model results that test the hypotheses of Houzeet al (2000) and identifies the mechanisms contributing to the momentum transport inthe stratiform regions of MCSs in TOGA COARE These results agree with and givephysical insight into the conclusions of Houze et al (2000) for both the westerly onsetand strong westerly flow regimes We show further how the convective and stratiformregions of the TOGA COARE MCSs work sometimes in concert and sometimes inopposition in the large-scale vertical redistribution of momentum especially at lowlevels We focus in particular on the zonal component of the large-scale flow andmomentum transport by large MCSs since the zonal component is most relevant tothe establishment of the structure of the large-scale KR wave
2 NUMERICAL MODEL
Details of the numerical model and experimental set-up are given in Mechemet al (2002) Deep convection is simulated using the fully compressible primitive-equation Advanced Regional Prediction System (ARPS) cloud model (Xue et al 1995)The horizontal grid spacing is 2 km and the vertical grid spacing ranges from 200m at the surface to 1000 m aloft enabling the model to resolve the shallow tropicalcold pools induced by convection over the western Pacific warm-pool region Thebulk microphysical parametrization employs the Lin et al (1983) scheme modifiedto represent better the microphysical behaviour in the stratiform region (Potter 1991Yang and Houze 1995ab) A turbulent kinetic energy scheme parametrizes subgrid-scale processes
To capture MCS structure evolving from an environment containing mesoscalevariability we use the initial and boundary conditions from the output of a mesoscalemodel simulation performed with the fifth generation Penn State UniversityNationalCenter for Atmospheric Research non-hydrostatic mesoscale model (MM5 Grell et al1994) The simulations were conducted using 25 vertical levels and a nested grid oftwo domains with horizontal grid spacing of 45 and 15 km respectively for severalconsecutive days in mid-to-late December 1992 (Chen 1997) The MM5 inner domainhad dimensions sim2500 km times 1500 km and included the TOGA COARE Intensive FluxArray (IFA Godfrey et al 1998) The Kain and Fritsch (1990) scheme parametrizedsubgrid-scale deep convection and a simple bulk ice-phase parametrization for cloudswas employed on the resolvable scale European Centre for Medium-Range WeatherForecasts analysis fields National Centers for Environmental Prediction sea surface
MOMENTUM TRANSPORT OVER THE PACIFIC WARM POOL 713
temperature (SST) analyses and TOGA COARE soundings supplied initial and bound-ary conditions for MM5 The MM5 simulations were able to produce large MCSs sim-ilar to those observed during TOGA COARE in satellite data The ARPS model (2 kmhorizontal grid spacing) simulations used a subset of the fine-mesh (15 km) MM5 simu-lations as initial and boundary conditions The experimental configuration is the same asthat in Mechem et al (2002) except that the initial mid-level zonal momentum profilewas modified in the 14 December case to examine the sensitivity of MCS organizationto varying large-scale wind profiles Readers are referred to Mechem et al (2002) formore details of the multi-model approach
This configuration we employ in which ARPS boundary conditions are suppliedfrom a previous MM5 simulation is in effect a one-way nesting A method similarto that used by Davies (1983) applies a forcing term to the right-hand side of theARPS momentum and scalar equations over a narrow (10 km) zone along the lateralboundaries The imposed boundary forcings are a combination of the large-scale flowand any response of the parametrized and resolved convection on the 15 km MM5 gridThis treatment of boundary conditions can be considered a physically consistent mannerof treating the flow in and around a finite domain in contrast to the radiation or periodicboundary conditions used in many previous studies on momentum transport Howeverbecause of the one-way nesting methodology the ARPS and MM5 momentum fieldsare not necessarily mutually consistent Basically ARPS responds to the initial andboundary conditions imposed by the MM5 but the MM5 has no way of respondingto the MCSs explicitly generated by ARPS In addition transport terms evaluated nearthe boundary zones will likely contain contributions from both the MCS and boundaryforcings For these reasons mean fluxes and tendencies calculated over the entire modeldomain should be viewed with caution and not interpreted quantitatively as sourceterms in a rigorous large-scale momentum budget The most apt interpretation of theARPS momentum transports is that they imply a feedback from the mesoscale to thelarge scale Qualitatively the behaviour of the mean transports should be reasonablesince the MCS transports in ARPS are generally greater than the momentum sourceterms imposed over the domain boundary zones Furthermore some of the drawbacksof the one-way boundary condition are reduced by considering relatively short (6 h)integrations which tend to minimize the interaction between MCSs and the boundaryzones and by focusing analysis on specific momentum transport structures (on thephenomenology rather than solely areal averages) over small sub-domains of the ARPSsimulations Generally these transport structures are robust enough to be apparent evennear strong regions of boundary-condition forcing Overall our approach of focusing onthe phenomenology is consistent with Houze et al (2000)
3 GENERAL CHARACTERISTICS OF WESTERLY ONSET AND STRONG WESTERLY REGIMES
(a) Overall contextThe warm-pool region underwent two cycles of the MJO during the TOGA COARE
field project This study focuses on the convectively active phase of the first cyclewhich occurred in December 1992 The westerly onset occurred in mid DecemberFigure 1 shows that during 12ndash16 December low-level westerlies and a strong mid-leveleasterly jet were present over the region (Chen et al 1996 Houze et al 2000) MCSsbegan to develop during this period though the largest MCSs in spatial and temporaldimensions occurred in the strong westerly regime characterizing the last 10 days ofthe month The strong westerly regime had a strong low-level westerly jet underlying adeep layer of easterly shear (Fig 1) Numerous MCSs categorized as lsquosuperclustersrsquo or
714 D B MECHEM et al
lsquosuper convective systemsrsquo (Nakazawa 1988 Mapes and Houze 1993 Chen et al 1996)occurred in this regime These giant systems had large long-lasting regions of stratiformprecipitation The hypothesis tested in this paper is that the mesoscale circulations ofthe stratiform regions of the superclusters affected the momentum structure of the large-scale flow over a significant area (as suggested by the studies of Moncrieff and Klinker(1997) and Houze et al (2000))
The large-scale momentum field in turn has a significant effect on the degree ofmesoscale organization that the convection attains Wind shear at low levels interactswith the horizontal vorticity arising from convectively generated pools of cold air in theboundary layer (Rotunno et al 1988) and can be an important factor in explaining thelong duration of MCSs Both large-scale and mesoscale-induced low-level convergencemay influence the location and motion of MCSs Upper-level shear is important for itsability to advect ice particles far from the deep convective region enabling the creationand maintenance of broad regions of stratiform precipitation (Houze 1993) The degreeof mesoscale organization may be influenced by other aspects such as SST since themost extensive MCSs tend to be observed over the western Pacific and Indian Oceanwarm pools (Chen and Houze 1997b)
The model simulations discussed in this paper focus on three MCSs one occurredin the westerly onset regime and the other two in the strong westerly regime Thewesterly onset MCS occurred on 14 December 1992 in the region outlined by the boxin Fig 2(a) This MCS was observed in detail by airborne Doppler radar (Kingsmill andHouze 1999) Because of the spatial and temporal intermittency of the tropical oceanicconvection and the scarcity of observed initial conditions for the mesoscale model themodel does not produce an exact replica of the observed MCS however a system arisesin the simulation with structural and behavioural characteristics reasonably similar to theMCS observed by aircraft (Mechem et al 2002) The strong westerly MCS simulationwas carried out for the conditions on 23ndash24 December 1992 during a period when largeMCSs were observed by shipborne radar (Houze et al 2000) Figure 2(b) shows a regionof the simulation domain dominated by mesoscale convergence and strong westerliesover the north-east portion of the MM5 domain during the strong westerly phase Asimulated MCS with properties similar to the observed MCSs occurred in this regionof the domain The north-easterly winds over the northern region of the box are part ofthe Rossby gyre located toward the north of the westerlies (see Fig 8(j) in Chen et al(1996) and Fig 1(b) in Mechem et al (2002))
The ARPS domains indicated by the boxes in Figs 2(a) and (b) are roughly scaledby the characteristic degree of mesoscale organization for each large-scale regime Thesupercluster conditions of late December are associated with larger and longer-lastingregions of convection (see the size versus lifetime relationship in Fig 9 of Chen andHouze (1997a)) in contrast to the more isolated MCSs of the mid-December westerlyonset conditions The domain in the strong westerly simulation is large enough in northndashsouth extent to be able to capture convection in the pure westerlies as well as that farthernorth located closer to the Rossby gyre region
MM5 output from simulations over the TOGA COARE large-scale array providedinitial and boundary conditions for the ARPS cloud model The MM5 was initializedat 0000 UTC 14 December 1992 for the westerly onset simulations and at 1200 UTC 23December 1992 for the strong westerly simulations Domain-mean profiles of the MM5wind fields in Fig 3 agree reasonably well with the observed wind field in Fig 1 for thetwo regimes Although the spatial patterns in Figs 2(a) and (b) show that the 850 hPalevel westerly wind components are generally stronger in late December the mean zonalvelocity at the surface is strongly modulated by the MM5-generated convective cold
MOMENTUM TRANSPORT OVER THE PACIFIC WARM POOL 715
Figure 2 Horizontal cross-sections of 850 hPa wind (vector arrows) and hourly accumulated surface rainfall(shading) from the 15 km grid of the fifth generation Penn State UniversityNational Center for AtmosphericResearch non-hydrostatic mesoscale model (MM5) simulations (a) 0800 UTC 14 December 1992 (b) 2000 UTC23 December 1992 Boxes indicate location of the Advanced Regional Prediction System (ARPS) cloud model
domains Velocity scales are at the lower left of each panel See Mechem et al (2002) for more details
pools in both the westerly onset and strong westerly regimes The mid-level easterlyjet in the onset phase of the KR wave (Fig 3 sim55 km level) is deficient in strengthcompared to the observations In order to examine the momentum transport by MCSswithin the large-scale environment that is representative of realistic conditions observedin COARE we enhanced the mid-level easterly momentum in the MM5 wind fieldsusing a Gaussian profile centred at 55 km with a standard deviation of 750 m Theresulting mid-level wind changed from the original 5ndash6 m sminus1 easterly to 12 m sminus1
easterly which is in good agreement with the observed 5-day running-mean value of
716 D B MECHEM et al
Figure 3 Vertical profiles of mean zonal velocity over the fifth generation Penn State UniversityNational Centerfor Atmospheric Research non-hydrostatic mesoscale model (MM5) domain for the 14 December and 23ndash24December 1992 cases at the initial time Vectors indicate estimated mean motions for the 14 December mesoscale
convective systems (MCSs) and the northern (N) and southern (S) MCSs on 23ndash24 December
sim10 m sminus1 averaged over the IFA (Fig 3 of Lin and Johnson (1996)) The Gaussianprofile was added to all of the MM5 wind fields prior to pre-processing by ARPS sothat the modified wind field would be used consistently for both initial and boundarycondition data
(b) Synopsis of simulationsMechem et al (2002) discuss in detail the simulations of both westerly onset and
strong westerly MCSs and compare the simulations with observational data collectedduring TOGA COARE In the westerly onset case (14 December) the forcing associatedwith the mesoscale convergence (Fig 4(a)) is strong and deep extending from just abovethe surface to 126 km and is accompanied by a significant cold pool (Fig 4(b)) Dataover 10 km-wide zones that correspond to regions of boundary condition forcing havebeen omitted in all relevant figures Despite this some artifacts of the imposed boundarycondition forcing are still visible for example the 300 K contour near the northernboundary of Fig 4(d) Larger simulation domains would help alleviate these artifactsthough they are at present computationally prohibitive
The mesoscale forcing ultimately leads to a broad band of convection a few hourslater (Fig 4(c)) New cells are triggered periodically and the system strengthens andbecomes more organized After about 3 h the convective region begins to weaken asthe cold pool propagates to the east faster than the convective precipitation effectivelyoutrunning the convective line (Figs 4(d) (f) and (h)) Lacking new convective cellstriggered by a cold pool significant stratiform precipitation of variable intensity remainsduring this period (Figs 4(e) and (g)) The later stages of the MCS do not display alinear pattern of convective elements however such a signal is not a necessary condition
MOMENTUM TRANSPORT OVER THE PACIFIC WARM POOL 717
Figure 4 For the 14 December 1992 model simulation (a) model-derived radar reflectivity (grey scale in dBZ)and wind vectors at 1 km altitude at the start of the simulation at time t = 0 h (b) surface potential temperature(contour intervals of 1 K) at t = 0 h (c) and (d) are as (a) and (b) but at t = 3 h (e) and (f) are similar but att = 4 h and (g) and (h) are similar but at t = 5 h Divergence (10minus3 sminus1) at 1 km is overlaid in (a) The solidrectangle in (c) identifies enhanced westerlies in the convective region whilst dashed boxes in (f) and (h) roughlydenote the stratiform region where descending mid-level inflow develops and where the mean profiles in Fig 6
are calculated
718 D B MECHEM et al
for a significant area of stratiform precipitation to form and exhibit a strong mesoscalecirculation (Houze 1997 Kingsmill and Houze 1999 Houze et al 2000) It will beshown that an organized mesoscale flow underlies the complex pattern of stratiformprecipitation in Fig 4(e)
Patterns of the low-level (1 km) convergence (Fig 5(a)) indicate the initial forcingof the 23ndash24 December strong westerly simulation Convection over the southernsubdomain (S in Fig 5) acquires a squall-line type of reflectivity pattern and rapidlymoves toward the east-north-east After 3 h two extensive regions of precipitation areoriented from north-west to south-east in the northern subdomain (N in Fig 5(c)) Thesebands move toward the north-east with the mean flow while new convection is triggeredin a nearly continuous manner on the leading (north-eastern) edge of the cold poolFigure 5(e) shows that the northern system remains highly organized even after 5 h Thecold pool is weak (simminus2 K) and propagates slowly toward the north-east (Figs 5(b) (d)and (f)) over the subdomain N triggering new convective elements that coexist with thedecaying stratiform region The initial and boundary conditions from the MM5 fieldsappear to impose an organized mesoscale circulation on the simulation in the strongwesterly case
(c) Mean flow evolution in the westerly onset and strong westerly regimesFigure 4 shows the development of the radar reflectivity and winds at the 1 km
level along with the potential-temperature field for the westerly onset simulation Theboxed region in Fig 4(c) shows an example section of the strong convective regioncharacterized by large values of reflectivity and enhanced westerlies In contrast thestratiform regions behind (to the west of) the convective zone in the westerly onsetperiod are accompanied by a region of decreased westerlies evident in Figs 4(e) and(g) in the regions corresponding to the dashed boxes in Figs 4(f) and (h)
Figure 5 shows the evolution of the low-level wind reflectivity and potential-temperature field within the MCS in the strong westerly regime In contrast to thewesterly onset MCS of Fig 4 this MCS appears to increase the low-level westerlywind component throughout the whole MCS in both convective and stratiform regions
Momentum transport by convection has often been investigated by assuming thatthe convection has a quasi-linear shape and then analysing the transport componentsin the line-normal and line-parallel directions In this study only the zonal componentis addressed because the MCS geometry is not always easy to define and the largestvariability is normally in the zonal direction Additionally upscale feedback processesover the TOGA COARE region are most useful when framed in terms of the zonalcomponent since it largely defines the structure of the KR wave pattern
We examine the tendency of the flow to become more westerly or easterly withtime in terms of either the total zonal wind field u(x y z t) where x y and z areconventional orthogonal coordinates and t is time or the perturbation of this windfrom its initial state value Since the initial wind field is spatially inhomogeneous inour calculations with the ARPS model we define perturbation zonal wind velocity as
uprime(x y z t) = u(x y z t) minus u0 (1)
where u0 = u(x y z t = 0) is a fully 3D base state The more traditional choice forthe base state where it is defined as a horizontal average of the initial field wouldintroduce perturbations (spatial fluctuations) into the initial uprime field and thus make theinterpretation of evolution difficult
We let the operator 〈 〉 indicate an average at a given time over one of the boxesshown in Figs 4(f) and (h) and Figs 5(d) and (f) The boxes roughly represent
MOMENTUM TRANSPORT OVER THE PACIFIC WARM POOL 719
Figure 5 Same as in Fig 4 but for 23ndash24 December 1992 simulation and not including t = 4 h framesNorthern and southern subdomains are indicated by N and S Dashed lines JK and LM indicate the locationsof cross-sections shown in Fig 7 Divergence (10minus3 sminus1) at 1 km is again overlaid in (a) whilst dashed boxesin (d) and (f) roughly denote the stratiform regions over northern and southern subdomains where descending
mid-level inflow develops and where the mean profiles in Fig 6 are calculated
720 D B MECHEM et al
Figure 6 Evolution of mean profiles of uprime as defined in the text for (a) the 14 December 1992 simulations(b) the southern subdomain of the 23ndash24 December 1992 simulations (c) as (b) but the northern subdomain Foreach case calculations are made over the stratiform regions denoted by the moving dashed boxes in the potential-
temperature cross-sections of Figs 4 and 5
stratiform regions well separated from the 10ndash20 km wide convective region Figure 6shows the time variation of 〈uprime〉 for both the westerly onset case (Fig 6(a)) and the strongwesterly case (Figs 6(b) and (c)) As long as the boxes are located within the stratiformarea and well away from the active convective elements at the front of the line theaverages are relatively insensitive to moderate changes in box size and location Wefocus on the stratiform regions of the MCSs because our primary objective is to explorethe impact of the stratiform region momentum field on the larger-scale environmentBecause of the way uprime is defined the initial profiles are zero The vertical profiles of 〈uprime〉in Fig 6(a) show that in the westerly onset MCS the perturbation zonal momentumbecomes more easterly with time in the stratiform-region layer from just above thesurface to a height of sim55 km approximately the level of the easterly jet maximumIn contrast the vertical profiles in Figs 6(b) and (c) show that in the strong westerlycase the zonal momentum in the stratiform-region layer between the surface and sim5 kmbecomes more westerly with time These statistics confirm quantitatively the low-levelstratiform features visible in the Figs 4 and 5 wind fields that suggest the stratiform-region momentum tendencies in the two flow regimes differ in some fundamental wayThis result is consistent with the suggestion of Houze et al (2000) that the stratiform-region circulations of MCSs tend to be a negative feedback to the development of
MOMENTUM TRANSPORT OVER THE PACIFIC WARM POOL 721
low-level westerlies in the westerly onset regime and a positive feedback on the low-level westerlies in the strong westerly regime The next two sections investigate themechanisms by which the large-scale zonal momentum structure is modified by MCSsin the strong westerly and westerly onset regimes of the MJO
4 MOMENTUM TRANSPORT IN STRATIFORM REGIONS DURING THE STRONGWESTERLY PHASE
We now depart from the chronological order of cases and discuss the strongwesterly case first and the westerly onset case second since the MCS in the strongwesterly regime has a simpler mid-level inflow structure resembling that of the classicleading-linetrailing-stratiform squall-line paradigm (eg Houze et al 1989) The morecomplex structure of the MCS in the westerly onset regime becomes clear when seen inlight of its difference from the MCS of the strong westerly regime
(a) Evolution of the zonal wind componentThe mean zonal wind profile of the strong westerly regime is marked by a maximum
of westerly winds at low levels (Fig 1) This westerly jet lies in the lower troposphericlayer of air that enters the stratiform regions of MCSs as mid-level inflow (Kingsmilland Houze 1999) As each large MCS in this environment evolves it transports themomentum of the low-level westerly jet into the stratiform region and then downwardin the mesoscale downdraught of the MCS This behaviour is seen particularly well inthe full momentum field (u) in zonal cross-sections through the simulated MCSsin both the southern and northern subdomains In Fig 7 arrows highlight regionsof downward transport of westerly momentum Houze et al (2000) documented asimilar structure in Doppler radar observations of MCSs in the strong westerly periodof TOGA COARE and suggested that the observed flow features likely resulted fromsimple downward transport of momentum possibly combined with the MCS-generatedperturbation pressure field accelerating the inflow downward (similar to the mechanismsuggested by Smull and Houze (1987))
Westndasheast cross-sections in Fig 8 showing the perturbation momentum uprime andrelated fields provide insight into the dynamics of the downward-sloping mid-levelinflow structure in the MCSs Figure 8 shows the evolution of uprime in the southern MCSat 3 and 4 h The cross-sections taken through the MCS show a widespread contiguoushydrometeor pattern (shaded fields in Figs 8(e) and (f)) strongly reminiscent of theprototypical 2D squall-line circulation (Houze et al 1989) This simulated MCS inFig 8 closely resembles squall-line-like systems observed during the strong westerlyphase of TOGA COARE by shipborne radar on the NOAA ship Vickers (see Fig 21 ofHouze et al (2000)) By definition the initial field is zero therefore structures are theresult only of convection andor boundary forcing The dashed box in the vertical cross-sections of uprime at 3 h (Fig 8(c)) outlines a zone of upward transport of momentum nearthe active convection This region contains a significant elevated pocket of westerlyvelocity perturbation This pocket of enhanced positive uprime is produced at early times inthe vicinity of a strong convective updraught and results from upward vertical transportof westerly momentum associated with the low-level jet structure The situation in thenorthern subdomain (not shown) is more complex but also exhibits upward transportof westerly momentum by the stronger updraughts The perturbation pressure field forboth systems is consistent with a hydrostatic response to a convective heating maximumoverlying a near-surface cold pool For example the perturbation pressure minimum at3 km over the southern subdomain at 3 h (Fig 8(e)) accelerates the front-to-rear and
722 D B MECHEM et al
Figure 7 Cross-sections of zonal velocity u (m sminus1) for the 23ndash24 December 1992 simulation (a) along lineLM in the southern subdomain of Fig 5 at initialization time t = 0 (b) along line JK in the northern subdomain ofFig 5 at t = 0 (c) and (d) as (a) and (b) respectively but at t = 3 h (e) and (f) as (a) and (b) but at t = 4 and 5 h
Dashed contours are negative (easterly) Arrows emphasize descending mid-level inflow layer
MOMENTUM TRANSPORT OVER THE PACIFIC WARM POOL 723
Figure 8 Cross-sections of model-simulated fields at 3 and 4 h over the southern subdomain S (shown on Fig 5)for the 23ndash24 December 1992 simulation (a) filled contours of perturbation zonal velocity uprime as defined in thetext at height z = 1 km at 3 h (b) as (a) but at 4 h (c) vertical cross-section of uprime taken through the dashed lineAAprime in (a) at y = 100 km at 3 h (d) as (c) but at 4 h The contour interval for uprime is 2 m sminus1 with shades ofred indicating positive (westerly) perturbations and shades of blue negative (easterly) perturbations (e) Contoursof perturbation pressure along AAprime overlaid on shaded total hydrometeor content at 3 h (the contour interval is25 hPa) (f) as (e) but at 4 h Contours of the total hydrometeor content (levels of 10minus5 10minus4 10minus3 kg kgminus1) areoverlaid on (c) (d) (e) and (f) to indicate the general location of the convection The dashed box is described in
the text Arrows emphasize perturbation flow
rear-to-front inflows in the manner described by LeMone (1983) The negative regionof uprime at 3 h (x = 380 z = 5 km) in Fig 8 is clearly a pressure-driven flow arisingfrom the hydrostatic perturbation low pressure Arrows in the vertical cross-sections inFig 8 indicate the enhancement of uprime at low levels Despite having a more complex3D structure the simulated MCS in the northern subdomain (not shown) exhibitsa similar pattern of upward westerly momentum transport by updraughts as well assimilar perturbation pressure effects
724 D B MECHEM et al
(b) Momentum budget of MCSs in the strong westerly regimeTo investigate the effect of the MCS circulations on the momentum field we write
the zonal momentum equation in the form
partu
partt= minus 1
ρ
partp
partxminus u
partu
partxminus v
partu
partyminus w
partu
partzminus Du
TEN PGA HA VA SGS
(2)
where p is pressure ρ is air density w is vertical velocity and Du is subgrid-scalemixing From left to right the terms (as indicated below (2)) are the momentumtendency (TEN) pressure gradient acceleration (PGA) horizontal advection (HA)vertical advection (VA) and subgrid-scale effects (SGS) The terms on the right-handside are calculated from 2-minute model output A time average is defined as
( ) =int T2
T1
( ) dt (3)
with T2 minus T1 = 30 minutesVA over the southern and northern subdomains averaged over the 30 minute
interval from 45ndash5 h and plotted in Fig 9 includes widespread regions of positiveforcing at an altitude of 1 km within the dashed boxes The momentum budgets in theregions enclosed by boxes are largely determined by the mesoscale vertical velocitypattern within the stratiform region The height of maximum environmental westerliesis lower than the vertical velocity maximum (peak just below the melting level) butenough overlap is present to produce downward transport of westerly momentum in bothregions The late stage of the system is characterized by a broad region of mesoscaledescent a significant area of which is covered by downward vertical velocity withmagnitudes gt025 m sminus1 The systems observed during the strong westerly phaseof TOGA COARE tended to be larger and more organized in comparison to thoseobserved during the westerly onset phase (Chen et al 1996 Houze et al 2000) soit is plausible that the regions of mesoscale vertical motion are also larger In themodel the mesoscale descent arises from the melting sublimation and evaporationwithin the broad stratiform area (consistent with Yang and Houze (1995b) Braunand Houze (1997) and others) Above the area of mesoscale descent are regions ofsignificant upward air motion with magnitudes of w sim 2 m sminus1 This zone of elevatedmesoscale ascent slopes upward toward the rear of the MCS in the same fashionas midlatitude squall lines (Houze et al 1989 Moncrieff 1992 Houze 1993 2004)Both northern and southern systems contain ascending and descending branches of theMCS circulation and are generally consistent with the structure of a classic leading-linetrailing-stratiform squall-line MCS
Trier et al (1998) found that the magnitude of the net forcing (TEN) was generallymuch smaller than that of individual terms on the right-hand side of (2) To illustratethe interplay of the different terms Fig 10 shows the fields of VA HA PGA andTEN taken at a late stage of the southern MCS and averaged over a 50 km strip Thearrow in Fig 10(a) indicates the perturbation flow shown in Fig 8(d) The subgrid-scaleterm SGS is omitted as in Yang and Houze (1996) since the turbulence term is onlyappreciable near strong convective updraughts and regions of detrainment in the uppertroposphere
The VA term in Fig 10(a) has a +minus+ structure The low-level negative andpositive layers are the result of a stratiform-region downdraught superimposed on the
MOMENTUM TRANSPORT OVER THE PACIFIC WARM POOL 725
Figure 9 Horizontal cross-sections of the 30-minute time-mean (45ndash5 h) VA momentum acceleration term(see text) at an altitude of 1 km for the 23ndash24 December 1992 simulation (a) southern subdomain (b) northernsubdomain Contour values are minus17 minus7 minus3 3 7 17 m sminus1hminus1 negative values are indicated by dashed contours
The boxed regions emphasize zones of organized downward transport of westerly momentum
prevailing environmental low-level westerly jet structure HA is out of phase with VAwith positive values at 3ndash6 km The latter are decisive in establishing a positive zone ofTEN (increasing westerlies) in the 1ndash6 km layer (Fig 6(b)) The quadrature relationshipof VA and HA responsible for the increasing westerlies in the 1ndash6 km layer is consistentwith the sloping nature of the descending inflow layers that is brought about by pressureaccelerations during the vigorous convective stage
Figure 10(c) might appear to suggest that the PGA is a small effect in the momen-tum budget in comparison with VA and HA However the latter terms largely offseteach other and PGA affects both the magnitude and sign of TEN (Fig 10(d)) espe-cially the strengthening of the low-level westerlies (Fig 6(b)) Moreover as discussedin connection with Fig 8 the pressure perturbation gradient accelerates the mid-level
726 D B MECHEM et al
Figure 10 Vertical cross-sections of 30 minute time-mean (4ndash45 h) momentum forcing terms for the 23ndash24December 1992 simulation averaged over a 50 km wide strip centred at y = 100 km in the southern subdomain(see Figs 8(a) and (b)) overlaid on the shaded total hydrometeor field (levels of 10minus5 10minus4 10minus3 kg kgminus1)(a) Vertical advection VA (b) horizontal advection HA (c) pressure gradient acceleration PGA (d) momentumtendency TEN Contour values are minus17 minus7 minus3 minus1 1 3 7 17 m sminus1hminus1 negative values are dashed The arrow
in (a) indicates perturbation flow as seen in Fig 8(d)
inflow and thus enhances the zonal wind field that is advected by vertical and hori-zontal motions (VA and HA) The PGA term thus plays an indirect role in the verticalredistribution of zonal velocity that strengthens the low-level westerly flow prior to itstransport The mesoscale downdraught in the stratiform region is able to transport down-ward the strong pre-existing environmental westerlies and any westerlies accelerated bythe MCS-generated perturbation pressure pattern
Momentum budget terms for the northern system (not shown) exhibit similar butmore complicated behaviour compared to the more 2D circulation in the southernsystem just described In particular the orientation of the active convective line ofthe southern system is normal to the mean flow and the convective momentum flux isprimarily down-gradient while the orientation of the convective line in the northernsystem at an angle of sim45 from the mean flow produces a near balance betweencounter-gradient and down-gradient flux
(c) MCS feedbacks in the strong westerly regimeThe above results illustrate how the MCSs occurring in the strong westerly regime
act to increase the westerly zonal momentum at levels just above the surface as acombination of VA HA and PGA The increase of low-level westerlies is a positive
MOMENTUM TRANSPORT OVER THE PACIFIC WARM POOL 727
momentum feedback strengthening the already strong near-equatorial westerlies in theregion between the large-scale Rossby gyres In addition the resulting enhanced low-level convergence on the eastern edge of the MCS implies a positive convective feedbackto the propagating KelvinndashRossby pattern since the triggering of new convection wouldbe occurring along the same direction as the propagation of the large-scale waveFurthermore the enhanced near-surface westerly momentum may also constitute aboundary-layer feedback by producing surface fluxes of heat and moisture favourablefor convection during the strong westerly phase
5 MOMENTUM TRANSPORT IN STRATIFORM REGIONS DURING THE WESTERLYONSET PHASE
(a) Evolution of the zonal wind componentFigure 11 shows the hourly evolution of the 14 December simulation By 3 h the
vertical cross-section of uprime shows that the flow in the upper levels of the domain asso-ciated with the convective region is strongly divergent (see box A in Fig 11(e)) thoughasymmetrically so with easterlies significantly stronger and covering more area thanthe westerlies The asymmetry arises when the convective updraughts act upon the deeplayer of westerly shear between 55 and 13 km biasing the momentum transport featurestoward easterlies Box B outlines a small transient region of easterlies being transportedupward a feature consistent with the results of Houze et al (2000) who found observa-tional evidence that during the onset phase the convective updraughts consistently car-ried easterly momentum upward This type of transient convective momentum transportfeature is evidently responsible for the easterly bias in the divergence structure aloft
The horizontal maps of uprime in Figs 11(a) and (b) and perturbation pressure fieldsin Figs 11(i) and (j) show that from 3ndash4 h the cold pool propagates from X = 158 kmto X = 200 km (top panels) Figure 11(e) shows that at 3 h uprime at low levels just tothe west of the cold-pool edge is westerly (red) and about 10 m sminus1 in magnitudeThe easterly perturbation flow (blue) just above the cold pool is sim8 m sminus1 Anhour later the lower levels behind the cold-pool edge have positive values of uprime aslarge as 14 m sminus1 while the area above these positive perturbations have negativevalues of 12 m sminus1 (Fig 11(f)) The perturbation pressure gradient associated with thestrong convective region accelerate the mid-level inflows to the MCS The strong coldpool produces a low-level pressure perturbation maximum and strong latent heatingdictates a hydrostatic minimum above The result is eastward-directed pressure gradientacceleration in the cold pool and westward-directed acceleration above (between X =75 m and X = 160 m in the 3 h pprime field of Fig 11(i)) The perturbation pressure patternthus increases low-level westerlies and further strengthens the mid-level easterly jet inthe vicinity of the MCS implying a local enhancement of the environmental shear of thezonal wind with height Because the convective region weakens significantly between3 and 4 h the hydrostatic pressure minimum associated with strong latent heating (atX = 120 km at 3 h) decreases significantly in magnitude likely weakening the front-to-rear flow acceleration
The circulation in the stratiform region of the system transports mid-level easterlymomentum downward during 4ndash6 h of the simulation (last three columns of Fig 11)The values of uprime become negative at or just below the easterly jet maximum (55 km)and descend to the surface The magnitude of the zonal velocity perturbation is notparticularly strong (4ndash6 m sminus1) but the area affected is large enough to have a large-scaleimpact (as shown in section 6) The transition at the surface from westerly to easterlyperturbation flow (represented by the arrows in Figs 11(g) and (h)) occurs somewhat
728 D B MECHEM et al
Figu
re11
C
ross
-sec
tion
sof
mod
el-s
imul
ated
field
sat
hour
lyin
terv
als
from
3to
6h
for
the
14D
ecem
ber
1992
sim
ulat
ion
(a)
(b)
(c)
and
(d)
show
fille
dco
ntou
rsof
pert
urba
tion
zona
lvel
ocit
yu
prime in
aho
rizo
ntal
cros
s-se
ctio
nat
heig
htz
=1
kma
t34
5an
d6
hre
spec
tivel
y(e
)(f
)(g
)an
d(h
)sh
owve
rtic
alcr
oss-
sect
ions
ofu
prime al
igne
dal
ong
the
dash
edli
neA
Aprime a
t3
45
and
6h
resp
ectiv
ely
The
cont
our
inte
rval
foru
prime is
2m
sminus1
wit
hsh
ades
ofre
din
dica
ting
posi
tive
(wes
terl
y)pe
rtur
bati
ons
and
shad
esof
blue
nega
tive
(eas
terl
y)pe
rtur
bati
ons
(i)
(j)
(k)
and
(l)
show
cont
ours
ofpe
rtur
bati
onpr
essu
real
ong
AA
prime ov
erla
idon
shad
edto
talh
ydro
met
eor
cont
ent(
leve
lsof
10minus5
10minus
41
0minus3
kgkg
minus1)
The
cont
our
inte
rval
is2
5hP
aO
n(e
)to
(i)
cont
ours
ofth
eto
talh
ydro
met
eor
cont
ent(
leve
lsof
10minus5
10minus
41
0minus3
kgkg
minus1)
are
over
laid
toin
dica
teth
ege
nera
lloc
atio
nof
the
conv
ecti
onB
oxes
Aan
dB
(sho
wn
on(e
))ar
ede
scri
bed
inth
ete
xtA
rrow
sem
phas
ize
pert
urba
tion
flow
MOMENTUM TRANSPORT OVER THE PACIFIC WARM POOL 729
Figure 12 Horizontal cross-section of the 30-minute time-mean (5ndash55 h) vertical advection (VA) momentumacceleration term at an altitude of 25 km for the 14 December 1992 simulation Contour values and units are as
in Fig 9 The box emphasizes a region of organized downward transport of easterly momentum
abruptly in a manner similar to that seen in single-Doppler radar observations (Houzeet al 2000 Houze 2004) where easterly flow periodically pulsed down into the boundarylayer (see Fig 44 of Houze (2004))
(b) Momentum budget of MCSs in the westerly onset regimeThe same procedure as described in the previous subsection is applied to the strong
westerly case in subsection 4(b) we examine the spatial structure of the momentumforcing to determine the processes responsible for the zonal velocity becoming moreeasterly at low levels from just above the surface to sim6 km (Fig 6(c)) at the later stagesof the system Again we find that the terms on the right-hand side of (1) tend to offseteach other so that the net tendency is a small residual of these terms In the westerlyonset case the system-wide downward transport of mid-level easterlies does not takeplace until an organized pattern of mesoscale descent is present in a stratiform regionAlthough the modelrsquos reflectivity pattern at 4ndash5 h becomes somewhat disorganizedindicating the decaying character of the system the horizontal cross-section of the VAfield in Fig 12 taken at an altitude of 25 km shows a highly organized pattern The VAforcing in the boxed region results from weak downward velocities typical of stratiformprecipitation regions The spatial extent of the region covered by downward velocities ofat least 025 m sminus1 is about 6300 km2 This large area of mesoscale descent provides themeans of transporting significant easterly momentum either environmental or system-generated toward the surface The horizontal map of VA in Fig 12 indicates that thelarge region of mesoscale descent coupled with the large-scale zonal momentum fieldmay contribute to the negative values of uprime near the surface late in the simulation
In its later stages the MCS establishes a significant region of easterly perturbationmomentum at low levels Figure 13(a) shows that the VA term produces a +minus+pattern in the vertical between x = 50 and 150 km The VA forcing below the jetmaximum (z = 55 km) is strongly negative in the region where low-level easterliesare increasing near the surface Because the low-level westerlies in the environmentare at a maximum between 1 and 2 km rather than at the surface the VA term ispositive between the surface and the westerly maximum Mapes and Wu (2001) alsoshow regions of positive uprime tendency at low levels during the westerly onset phase (egtheir Fig 3(c)) which increase in magnitude as the MJO transitions to its strong westerly
730 D B MECHEM et al
Figure 13 Vertical cross-sections of 30-minute time-mean (5ndash55 h) momentum forcing terms for the 14December 1992 simulation averaged over a strip from y = 120ndash160 km (shown in Fig 11(a) to (d)) overlaid onthe shaded total hydrometeor field (levels of 10minus5 10minus4 10minus3 kg kgminus1) (a) Vertical advection VA (b) horizontaladvection HA (c) pressure gradient acceleration PGA (d) momentum tendency TEN Contour values and units
are as in Fig 10 An arrow indicating perturbation flow is superimposed over the forcings in (a)
phase In contrast to the strong westerly simulation where the transition from mesoscaledowndraught to mesoscale updraught results in a switch in the sign of the VA term withheight here the stratiform region is less organized and the ascent is weaker relative tothe downdraught over the period in which the forcings were calculated In addition theweak stratiform updraught is superimposed on a region of rather weak shear furtherexplaining the negligible VA signal there In contrast to the complicated +minus+ VAsignal in the strong westerly situation the mesoscale downdraught acting alone on aneasterly jet structure in the 14 December onset case produces a simple minus+ dipole asseen on either side of the easterly jet (sim45 km altitude) in Fig 13(a) This dipole is themost coherent signal of all the forcing terms and results in an enhancement of mid- andlow-level easterly momentum except just below the low-level westerly maximum Asin the strong westerly case the HA pattern below the easterly jet maximum (55 km)tends to be out of phase with the VA term
(c) MCS feedback in the westerly onset regionThe net tendency TEN arising from the combination of the processes shown
in Fig 13 is easterly in a broad region at low- and mid-levels primarily over thewestern half of the domain in association with the stratiform precipitation region
MOMENTUM TRANSPORT OVER THE PACIFIC WARM POOL 731
(especially below the 2 km level at X = sim50ndash200 km in Fig 13(d)) This tendencyfield is consistent with the profile in Fig 6(a) which shows the development ofeasterly perturbation winds at low levels The stratiform region of the MCS thusproduces a negative feedback to the large-scale low-level flow which is in the processof transitioning to a westerly regime The terms on the right-hand side of (2) giveinsight into the tendency for the MCS to produce these easterly perturbation velocitiesat low levels Figure 13 suggests that the negative sign of TEN in this region atheights lt2 km is a sequential combination of the terms on the right-hand side of (2)First PGA accelerates mid-level flow westward as it enters the front of the system(X = sim175 height = 4ndash5 km in Fig 13(c)) VA then transports the easterly momentumdownward from mid-levels (X = 100ndash200 km height = 1ndash5 km in Fig 13(a)) finallyHA distributes the easterly perturbation below the 2 km level with help from thePGA associated with the MCS mesohigh (X = 70ndash15 km height lt2 km in Figs 13(b)and (c))
6 EFFECT OF STRATIFORM REGION MOMENTUM TRANSPORTS ON THE LARGE-SCALEMOMENTUM BUDGET
Houze et al (2000) postulated that the descending westerly MCS inflows act as apositive feedback to increase low-level westerlies in the strong westerly regime of thelarge-scale KR wave pattern that defined the environment in TOGA COARE They alsosuggested that the easterly MCS inflows at low levels acted as a negative feedback on thelarge-scale propagating KR wave pattern in the westerly onset phase of the KR patternThe simulation results in section 5 are consistent with these hypothesized scenarios inshowing downward transport of westerly (easterly) momentum in the stratiform regionof an individual MCS of the type that occurred in the strong westerly (westerly onset)regime The question arises do these downward transports of easterly momentum in thestratiform regions of large MCSs have a measurable impact on the large-scale circulationin which the MCSs are embedded
The product wprimeuprime (momentum flux) displayed in the boxed regions of Fig 14synopsizes the effect that the stratiform region and overall mesoscale organization mighthave on the large-scale flow The broad zones of predominantly negative wprimeuprime in Figs14(a) and (b) over the stratiform regions in both southern and northern subdomainsindicate large areas of increasing westerly momentum during the strong westerly phaseThe positive region of wprimeuprime outlined in Fig 14(c) indicates downward transport ofeasterly momentum An area of negative wprimeuprime to the south of the boxed region inFig 14(c) results from upward transport of convectively generated easterly inflowevident the hour before in the vertical momentum cross-section at 4 h in Fig 14(d)This figure illustrates that the net vertical momentum transport in these simulations islargely dependent upon the degree of stratiform region development in the MCSs MCSsare able to generate significant momentum which can then be transported along withthe momentum of the large-scale environment upward and downward by the expansiveregions of mesoscale vertical motions associated with the stratiform area
Figures 15 and 16 show the domain-mean profiles of momentum flux wprimeuprime and ver-tical flux convergence Fu = minuspartwprimeuprimepartz for the strong westerly simulation The meansare calculated over the entire domains (excluding the boundary-condition regions) inFigs 4 and 5 and over individual stratiform regions Mean fluxes and convergencestaken over the entire domains likely contain contributions from the imposed boundaryconditions and thus do not perfectly represent the TEN contribution from the MCSs onthe large scale More properly the means should be interpreted qualitatively as described
732 D B MECHEM et al
Figure 14 Horizontal cross-sections of wprimeuprime (see text) for (a) the 23ndash24 December 1992 simulation at a heightof 1 km at 5 h over the southern subdomain (b) as (a) but over the northern subdomain (c) the 14 December1992 simulation taken at a height of 25 km at 55 h Contour values are minus16 minus4 minus2 minus1 1 2 4 16 m2sminus2Boxes bound regions of wprimeuprime negative in (a) and (b) and positive in (c) which are thought to be characteristic for
each flow regime
Figure 15 Vertical profiles of 〈wprimeuprime〉 and Fu = minus(partpartz)〈wprimeuprime〉 for the 23ndash24 December 1992 simulation at 5 hAverages are taken over (a) the whole domain (b) the southern stratiform domain and (c) the northern stratiform
domain Stratiform regions are denoted by dashed boxes in Fig 5(f) See text for further details
MOMENTUM TRANSPORT OVER THE PACIFIC WARM POOL 733
Figure 16 Vertical profiles of 〈wprimeuprime〉 and Fu = minus(partpartz) 〈wprimeuprime〉 for the 14 December 1992 simulation at 55 hAverages are taken over (a) the whole domain and (b) the stratiform domain The stratiform region is similar to
the region enclosed by the box in Fig 4(h) See text for further details
in section 2 namely that they convincingly imply feedback on the large-scale momen-tum and KR wave structures The strong westerly case illustrated in Fig 15 showsthat the southern stratiform region has a deep layer of negative wprimeuprime and a layer from0ndash2 km of increasing westerlies with time The northern stratiform region exhibits asimilar behaviour though the layers of wprimeuprime and Fu are somewhat shallower The termswprimeuprime and Fu averaged over the entire domain indicate the same signal though of courseweaker with negative wprimeuprime throughout the layer below the melting level and positivemomentum tendencies from the surface to 2 km Figure 16 shows that the stratiformcontribution is also important in the westerly onset phase with the deep layer of pos-itive wprimeuprime over the stratiform region in Fig 16(b) reflected in the whole-domain mean(Fig 16(a)) These mean profiles demonstrate that the stratiform regions had an appre-ciable impact on the domain-mean momentum tendencies and that convection in itsdecaying stages substantially influenced the overall large-scale momentum budget
7 CONCLUSIONS
The cloud-resolving model simulations in this study demonstrate the importanceof the mesoscale circulations associated with stratiform regions of large MCSs on themomentum budget of the large-scale flow over the tropical Pacific warm pool WhenMCSs become large as they often do over the warm pool (Nakazawa 1988 Mapesand Houze 1993 Chen et al 1996) downward momentum transport in the stratiformregions is robust The domain-averaged profiles of wprimeuprime (Figs 15 and 16) illustrate thatthe broad regions of stratiform precipitation have a measurable impact on the MCS-mean budget This behaviour is consistent with the conclusions of Moncrieff and Klinker(1997) that the lsquosuperclustersrsquo (ie groups of MCSs with larger stratiform regions) canhave a significant impact on the large-scale momentum budget over the warm pool
The dynamics of warm-pool MCSs is quite complex with momentum transportsignals that can be quite different from convective to stratiform region The manner in
734 D B MECHEM et al
which warm-pool convection affects the large-scale momentum fields is dependent onthe large-scale flow which tends to be a function of the phase of the MJO This studyconfirms the suggestion of Houze et al (2000) that the momentum transport character ofthe convection is dependent upon the phase of the KR wave structure and the degree ofstratiform region development attained by the MCSs Houze et al (2000) suggested thatthe warm-pool convection can be thought of as a feedback effect on the amplitude andpropagation of the large-scale KR wave pattern In this study we carried out simulationsthat emphasize how the stratiform-region circulations of large MCSs may influence theestablishment and maintenance of strong low-level westerlies as the MJO progresses
In the strong westerly phase the mesoscale downward air motion in the stratiformregions of MCSs transports westerly momentum downward thus further strengtheningthe low-level westerlies and hence constituting a positive feedback on the KR wavestructure via direct enhancement of the momentum field as well as via convectiveand surface-flux feedbacks In the westerly onset phase the mesoscale descent in thestratiform regions of MCSs appears to act as a negative feedback on the propagationof the wave pattern depending upon the partitioning of momentum forcing betweenconvective and stratiform portions of the MCS PGAs associated with the tilted up-draughtdowndraught structure tended to increase the mean shear at low and middlelevels and in the stratiform region the accelerating mid-level easterly momentum wasadvected down to low levels by the sloping mesoscale stratiform-region downdraughtthus acting to counter the low-level westerlies which the propagating wave pattern wasattempting to establish These results confirm the downward transport signal previouslydocumented in Doppler radar data in the stratiform regions of warm-pool MCSs inTOGA COARE (Houze et al 2000)
ACKNOWLEDGEMENTS
We thank Chris Bretherton and Carl Hane for valuable comments on the researchand Peter Lamb for support and encouragement to finish the project Interaction withMitch Moncrieff and suggestions by an anonymous reviewer greatly improved thepresentation of the manuscript Ming Xue assisted with the ARPS model CandaceGudmundson edited the manuscript and Kay Dewar and Beth Tully refined the figuresThis research was supported by the Office of Naval Research grant N00014-01-1-0156 the National Science Foundation grants ATM9409988 and ATM9908944 andthe National Oceanic and Atmospheric Administration grant numbers NA67RJ0155(CIMASUM) and NA17RJ1232 (JISAO contribution number 1095) The lead authorwas supported during the course of this investigation by the Environmental SciencesDivision of the US Department of Energy (through Battelle PNR Contract 144880-A-Q1 to the Cooperative Institute for Mesoscale Meteorological Studies) as part of theAtmospheric Radiation Measurement Program and the Office of Naval Research grantN00014-03-1-0304
REFERENCES
Braun S A and Houze R A Jr 1997 The evolution of the 10ndash11 June 1985 PRE-STORM squall lineInitiation development of rear inflow and dissipation MonWeather Rev 125 478ndash504
Bryan G H and Fritsch J M 2000 Moist absolute instability The sixth static stability state Bull AmMeteorol Soc 81 1207ndash1230
Chen S S 1997 lsquoConvectively active and suppressed periods in TOGA COARErsquoPp 583ndash586 in Pre-prints of the 22nd Conference on hurri-canes and tropical meteorology Ft Collins CO AmericanMeteorological Society Boston USA
MOMENTUM TRANSPORT OVER THE PACIFIC WARM POOL 735
Chen S S and Houze R A Jr 1997a Diurnal variations and life-cycle of deep convective systems overthe tropical Pacific warm pool Q J R Meteorol Soc 123357ndash388
1997b Interannual variability of deep convection over the tropical warmpool J Geophys Res 102 25783ndash25795
Chen S S Houze R A Jr andMapes B E
1996 Multiscale variability of deep convection in relation to large-scalecirculation in TOGA COARE J Atmos Sci 53 1380ndash1409
Davies H 1983 Limitations of some common lateral boundary schemes used inregional NWP models Mon Weather Rev 111 1002ndash1012
Gill A 1980 Some simple solutions for heat-induced tropical circulationQ J R Meteorol Soc 106 447ndash462
Godfrey J S Houze R A JrJohnson R H Lukas RRedelsperger J-L Sumi Aand Weller R
1998 COARE An interim report J Geophys Res 103 7 14395ndash14450
Grell G Dudhia J andStauffer D R
1994 lsquoA description of the fifth-generation Penn StateNCAR meso-scale model (MM5)rsquo NCAR Technical Note NCARTN-398+STR The National Center for Atmospheric ResearchBoulder CO USA
Houze R A Jr 1973 A climatological study of vertical transports by cumulus-scaleconvection J Atmos Sci 30 1112ndash1123
1982 Cloud clusters and large-scale vertical motions in the tropicsJ Meteorol Soc Jpn 60 396ndash410
1989 Observed structure of mesoscale convective systems and impli-cations for large-scale heating Q J R Meteorol Soc 115425ndash461
1993 Cloud dynamics Academic Press San Diego USA1997 Stratiform precipitation in regions of convection A meteorologi-
cal paradox Bull Am Meteorol Soc 78 2179ndash21962004 Mesoscale convective systems Rev Geophys 42
1010292004RG000150Houze R A Jr Rutledge S A
Biggerstaff M I andSmull B F
1989 Interpretation of Doppler weather radar displays in midlatitudemesoscale convective systems Bull Am Meteorol Soc 70609ndash619
Houze R A Jr Chen S SKingsmill D E Serra Yand Yuter S E
2000 Convection over the Pacific warm pool in relation to the atmos-pheric KelvinndashRossby wave J Atmos Sci 57 3058ndash3089
Kain J S and Fritsch J M 1990 A one-dimensional entrainingdetraining plume model and itsapplication in convective parametrization J Atmos Sci 472784ndash2802
Kingsmill D E andHouze R A Jr
1999 Kinematic characteristics of air flowing into and out of precipitat-ing convection over the west Pacific warm pool An airborneDoppler radar survey Q J R Meteorol Soc 125 1165ndash1207
LeMone M A 1983 Momentum transport by a line of cumulonimbus J Atmos Sci40 1815ndash1834
Lin X and Johnson R H 1996 Kinematic and thermodynamic characteristics of flow over thewestern Pacific warm pool during TOGA COARE J AtmosSci 53 695ndash715
Lin Y-L Farley R D andOrville H D
1983 Bulk parametrization of the snow field in a cloud model J ClimAppl Meteorol 22 1065ndash1092
Madden R and Julian P 1971 Detection of a 40ndash50 day oscillation in the zonal wind in thetropical Pacific J Atmos Sci 28 702ndash708
1972 Description of global scale circulation cells in the Tropics with a40ndash50-day period J Atmos Sci 29 1109ndash1123
Mapes B E and Houze R A Jr 1993 Cloud clusters and superclusters over the oceanic warm poolMon Weather Rev 121 1398ndash1415
Mapes B E and Wu X 2001 Convective eddy momentum tendencies in a long cloud-resolvingmodel simulation J Atmos Sci 58 517ndash526
Mechem D B Houze R A Jrand Chen S S
2002 Layer inflow into precipitating convection over the western tropi-cal Pacific Q J R Meteorol Soc 128 1997ndash2030
Moncrieff M W 1978 The dynamical structure of two-dimensional steady convection inconstant vertical shear Q J R Meteorol Soc 104 543ndash568
1981 A theory of organised steady convection and its transport proper-ties Q J R Meteorol Soc 107 29ndash50
736 D B MECHEM et al
Moncrieff M W 1992 Organized convective systems Archetypal dynamical modelsmass and momentum flux theory and parametrizationQ J R Meteorol Soc 118 819ndash850
2004 Analytic representation of the large-scale organization of tropicalconvection J Atmos Sci 61 1521ndash1538
Moncrieff M W and Klinker E 1997 Organized convective systems in the tropical western Pacific asa process in general circulation models A TOGA COAREcase-study Q J R Meteorol Soc 123 805ndash827
Moncrieff M W and Miller M J 1976 The dynamics of simulation of tropical squall-lines Q J RMeteorol Soc 102 373ndash394
Nakazawa T 1988 Tropical super clusters within intraseasonal variations over thewestern Pacific J Meteorol Soc Jpn 66 823ndash839
Potter B E 1991 Improvements to a commonly used cloud microphysical bulkparametrization J Appl Meteorol 30 1040ndash1042
Rotunno R Klemp J B andWeisman M L
1988 A theory for strong long-lived squall lines J Atmos Sci 45463ndash485
Schneider E K and Lindzen R S 1976 A discussion of the parametrization of momentum exchange bycumulus convection J Geophys Res 81 3158ndash3160
Shapiro L J and Stevens D E 1980 Parametrization of convective effects on the momentum and vor-ticity budgets of synoptic-scale Atlantic tropical waves MonWeather Rev 108 1816ndash1826
Smull B F and Houze R A Jr 1987 Rear inflow in squall lines with trailing stratiform precipitationMon Weather Rev 115 2869ndash2889
Trier S B LeMone M A andSkamarock W C
1998 Effect of three-dimensional structure on the stormwide horizontalaccelerations and momentum budget of a simulated squallline Mon Weather Rev 126 2580ndash2598
Tung W-W and Yanai M 2002 Convective momentum transport observed during the TOGACOARE IOP II Case studies J Atmos Sci 59 2535ndash2549
Xue M Droegemeier K KWong V Shapiro A andBrewster K
1995 lsquoARPS Version 40 Userrsquos Guidersquo Center for the Analysis andPrediction of Storms University of Oklahoma USA
Yang M-J and Houze R A Jr 1995a Multicell squall-line structure as a manifestation of verticallytrapped gravity waves Mon Weather Rev 123 641ndash661
1995b Sensitivity of squall-line rear inflow to ice microphysics andenvironmental humidity Mon Weather Rev 123 3175ndash3193
1996 Momentum budget of a squall line with trailing stratiform precipi-tation Calculations with a high-resolution numerical modelJ Atmos Sci 53 3629ndash3652
Zipser E J 1969 The role of organized unsaturated convective downdrafts in thestructure and rapid decay of an equatorial disturbanceJ Appl Meteorol 8 799ndash814
1977 Mesoscale and convective-scale downdrafts as distinct compo-nents of squall-line circulation Mon Weather Rev 1051568ndash1589
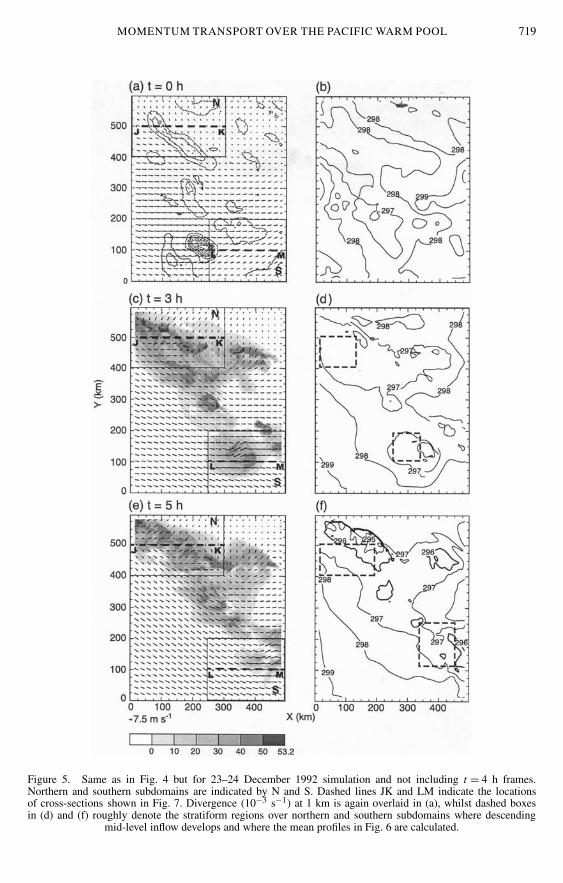