momentum trading: keys for building your own momentum … · introduction momentum has been defined...
TRANSCRIPT

MOMENTUM TRADING: KEYS FOR
BUILDING YOUR OWN MOMENTUM SCANS
Dr. Thomas K. Carr (aka “Dr. Stoxx”)
©2014. Befriend the Trend Trading, LLC. All Rights Reserved.


About the Author
Dr. Thomas K. Carr (aka "Dr. Stoxx") has been actively trading the markets since
1996 following several years of studying technical analysis. He holds a doctorate
from Oxford University and for 16 years was a tenured Professor to liberal arts
students. Among other academic publications, Dr. Carr is the author of three
bestselling trading books: Trend Trading for a Living (2007) – translated into
Chinese, Korean and Japanese – Micro-Trend Trading for Daily Income (2010), and
Market-Neutral Trading (2014). His market insights have been published in the
Wall Street Journal, Investors Business Daily, and US News and World Report.
Dr. Stoxx began trading as a part-time hobby until several years of losses forced
him to do more research. He attended trading seminars and studied under some of
the top names in the business. Soon he began experimenting with his own trading
systems. The result was a set of time-tested, proprietary trading methods that have
proved to be very profitable in all types of market conditions. These systems are
based on the essentials of technical analysis, but also incorporate Dr. Stoxx's unique
method of assessing the financial strength of companies, event-driven price
movements, and general market trend dynamics. Highly skilled as a chart reader,
Dr. Stoxx possesses an uncanny ability to time his entries and exits, often just prior
to major market moves.

About DrStoxx.com
DrStoxx.com (formerly Befriendthetrend.com) is a wholly owned subsidiary service
of Befriend the Trend Trading, LLC, founded by Dr. Thomas K Carr in October, 2002.
DrStoxx.com serves the needs of online traders through a variety of advisory and
trader-training products. The site offers free bi-monthly stock picks (hand-picked
by Dr. Stoxx himself), free weekly market and sector comments, free research
articles, premium stock advisory letters, a managed account service, private
coaching, and a variety of webinars and manuals for those who wish to trade for
themselves.
Order all of our Trading Manuals!
1. How to Make 50% per Month Trading Stocks
2. The 5 Best Stocks for 2014
3. The All-New Mean Reversion Manual
4. How to Make Mega Money with Micro-cap Stocks (publication pending)
5. How to Use Options to Buy Stocks at a Discount (publication pending)
Improve your returns with one of our Stock Pick Letters:
1. The Trend Trade Letter: +33% annual return since 2002
2. The Cheap Stocks Letter: +62% annual return since 2010
3. The ETF-Reversal Letter: +67% annual return since 2007
4. The Momentum Letter: NEW!
For more information on any of our stock pick advisory and trader training services,
including topics covered in this Trading Manual, email us: [email protected].
DISCLAIMER: This publication is for educational purposes only. DrStoxx.com is
wholly owned by Befriend The Trend Trading, LLC., and is not liable in any way for
losses incurred through trading by readers of this publication. Money can and will
be lost when short-term trading. The kind of trading suggested in this Trading
Manual involves risk of capital loss. Individuals applying any of the trading
strategies mentioned in this Manual are solely and completely responsible for any
and every outcome.
Momentum Trading: Keys for Building Your Own Momentum Scans © 2014. All
rights reserved. This manual, or parts thereof, may not be reproduced, transmitted,
shared, or distributed in any form without permission from Befriend the Trend
Trading, LLC. Exceptions are made for brief excerpts used in published reviews.

Welcome from Dr. Stoxx!
Greetings, fellow trader! Thank you for buying this new trading manual. Great
fortunes have been made using versions of the system taught in this manual.
Professional dancer, Nicolas Darvas, built a $2million fortune in the 1940’s using a
version of this system. Investors Business Daily founder, William O’Neil, discovered
that the best performing stocks in any market were the momentum stocks. I myself
use this system regularly to find great stocks for trading.
You will get the most out of this trading manual by following the following 4 steps:
read the manual carefully;
take notes in your own words to confirm that you understand the manual;
apply what you have learned by putting on “virtual” or “paper” trades;
then, and only the, try putting on a few real-money trades.
For this last step I strongly recommend you start small and go slowly. If you have
any questions about anything in this manual, or about any of the other ways we at
DrStoxx.com help you become a successful trader, please do not hesitate to email
me directly: [email protected].
INTRODUCTION
Momentum has been defined as a force that sustains movement and increases the
strength of that movement. This two-fold nature of momentum is seen in what
traders and investors call “momentum stocks”. A momentum stock is a stock that
is trading in a sustained trend, either up or down, the strength of which is expected
to increase over the near term.
Momentum stocks (defined more fully below) are among the most exciting stocks
to trade. My own research, shared in this Manual, corroborates the general
observation among traders and investors that momentum stocks produce the
greatest amount of return on investment in the least amount of time.
Just how much return is possible with the right momentum system in hand? Let
me show you. I have built a number of different momentum scans over the years.
Some carry higher risk than others. Some work better in bull markets, some better
in bear markets. The strongest performer among these is one of the systems I now
use for our new weekly advisory service – “The Momentum Letter”. I also use it to
find trades for “The 8:18 Fund” which I manage through Kingdom Capital, LLC. This
system is truly amazing; it shows extreme outperformance in all market conditions.
Over the past 5 years, using a weekly rebalance period (explained below), and
trading only the top 3 stocks that come up on the system’s scanning tool, this
system has shown a theoretical gain of over 15,000%:

5-year gains of Carr’s Momentum System (weekly rebalance)
To put that return in dollar perspective, let’s say that five years ago you had $20,000
to invest in the market. You put half of that, $10,000, into a relative safe index fund
and the other half into the top 3 stocks of our Momentum System. Fortunately for
you, the S&P 500 has been on a strong bullish run for the past five years. It has
gained over 170%. This puts your original $10,000 at around $27,000 today. That
pretty good by anyone’s standards! But what then happened to the other $10,000?
At the rate of return shown in our backtest, after taking commissions and slippage
into account, your original investment is now worth, just five years later, about
$1,400,000!
Forbes magazine states that, “Momentum strategies can help investors beat the
market and avoid market crashes (Oct. 16, 2012).” This is to say that, when handled
properly, momentum stocks can help you generate stronger profits in rising
markets and protect your profits more securely in volatile markets.
Momentum stocks are traditionally defined by their sustained and increasing
movement in price, either up or down. Momentum stock strategies, in turn, are
those stock trading strategies that scan the universe of stocks for those making the
strongest gains (or losses) in the least amount of time. They recommend buying
the strongest stocks, selling short the weakest, and rotating your positions on a
regular basis.
I’m here to tell you that this strategy is a recipe for disaster! Most momentum
strategies fail! Yes, they can have incredibly profitable seasons. There are windows
of opportunity for the price-chasers when everyone is buying shares in the names
at the top of the relative strength lists and selling those at the bottom. But those
are “special case” markets; exceptions to the rule; outliers. Let me say it again: any
momentum strategy that relies on price movement alone is doomed to eventual
failure. You’ll see what I mean shortly.
I define momentum stocks differently. A momentum stock in my book is one which
not only shows a sustained and increasing trend in price, it also shows strong trends
in certain key fundamental indicators. For price momentum to continue, even in
the near-term, there needs to be value in the underlying company, either real or
perceived. Thus any system scan that aims at the “momentum stock universe”
needs to go beyond price movement alone. It needs to be a hybrid scan built on
both technical and fundamental parameters.

In this Trading Manual, I am going to share with you the results of my 5-year study
of momentum stocks. I will outline the key essentials that need to go into any scan
you build as you search for the best momentum trades. We will see together what
does and does not work. On the basis of this study, we will then detail several very
specific rules that will help you build your own momentum stock scans.
Please note that this Trading Manual serves as a companion piece to our new
weekly stock advisory service, “The Momentum Letter” (launched April 6th, 2014).
The Momentum Letter recommends several momentum longs and shorts each
week. These recommendations come from a set of scans that I built and tested,
and which I currently use for my own trading. Because The Momentum Letter is
only available by paid subscription, and because I use these strategies to find stocks
for the fund I manage (“The 8:18 Fund”), I cannot fully disclose the exact
parameters of the scans I use. But you will be able to take what is taught here and
build for yourself a set of very robust system scans that highlight the best available
momentum setups.

PART ONE: RESOURCES
There are several resources you will need to build the scans as suggested in this
Trading Manual. Each of these tools charges a fee. If you approach your trading as
a business, like I do, you can count these costs as part of your necessary
expenditures. When it comes to trading, a little investment in the right tools will
go a long way toward building your profit potential and earning power.
Research Tools
Before we look at scan-building tools, I’d like first to give you some recommended
reading. Whenever I am building a new system, I like to do background research
into the individual concepts that go into the system’s parameters. This way I have
greater confidence that what I am doing is built on methods and strategies that
have been tested and proved profitable by much smarter minds than mine!
To this end, I can recommend two great books published on subjects that lie at the
heart of the momentum system I will be teaching you in this Manual. It is not
necessary to have this background knowledge, but as someone who served in
higher education for over twenty years, I value this kind of knowledge. I also know
as a trading coach that understanding why a system works can really boost one’s
trading confidence.
I thus strongly recommend the following two books:

William O’Neil, How to Make Money in Stocks (McGraw-Hill, various). This is a
classic and comes in several editions and versions. The one I like best is the 2010
edition which is subtitled, “Complete Investing System”. While O’Neil’s famed
“CAN-SLIM” system is different from what we teach here, his basic concept of
buying strong growth stocks that are also outperforming the general market is right
at the heart of the momentum concepts I teach in this Manual.
Mitch Zacks, Ahead of the Market (Martino Fine Books, 2011). Mitch Zacks is the
son of Dr. Len Zacks, an MIT Ph.D. in mathematics whose doctoral research
uncovered one of the most powerful fundamental drivers of price momentum: the
changes in the consensus of analysts’ expectations regarding a company’s future
earnings prospects. Zacks Investment Research, an advisory firm whose work I rely
on daily, is built upon this key insight. Ahead of the Market is an excellent primer
on the concept. We will be incorporating several variants of this concept into our
momentum scans.
Scanning Tools
The momentum scans we will be building in this Trading Manual incorporate both
fundamental and technical parameters. There are very few scanning services
available today that are able to incorporate both types of parameters. Most stock
scanning tools offer either fundamental filters alone, or technical filters alone.
What we need is one that offers both. There are some work-arounds that can be
used to compensate, but the most robust scans can only be built with software that
offers both fundamental and technical parameters.

The three scanning services I can recommend are these:
www.finviz.com
Finviz.com – This is an excellent service that every trader should be familiar with.
It is free if you don’t mind delayed data. Otherwise, you can pay the minimal
monthly charge, like I do, for real-time data and scanning, and advanced technical
charting.
The great advantages of Finviz over the other two services are its low cost, and its
very user-friendly scanning tool. You can also build watch lists of stocks directly
from your scans with just a couple clicks of the mouse. But the site has two nearly
fatal flaws: it lacks one of the fundamental filters we use to build our most robust
momentum scans, and it has no backtesting feature. Without the backtesting
feature, you will never really be sure that what you are building is profitable. But
if you are new to systems-building, or are trading on a limited budget, it is a great
tool to use.
http://woas.zacks.com/zcom/researchwizard/

Research Wizard – The Research Wizard is a downloaded software that is sold
through Zacks Investment Research. It accesses nightly “end of day” data to give
you fresh lists of stocks for the next trading day. This user-friendly tool has all the
parameters we need to build robust, profitable momentum scans. For those who
like to tinker with parameters, the Research Wizard offers the ability to custom
create scan filters. Moreover, it has an excellent backtesting tool that can test your
system on up to 15 years of data, including the ability to test hard stops, trailing
stops, short-only strategies, and multiple strategy comparisons. This is the tool
that I used to build my most profitable momentum systems. All the performance
data listed in this Manual were created using Research Wizard. Research Wizard is
the tool I use to find trades for our new service, “The Momentum Letter”.
There is a catch, however. While the RW is the best tool I am aware of for what we
are doing here, it is also the most expensive. The normal cost for a year’s use of
the Research Wizard is $1800. For some, $150 per month is a deal-breaker. I
certainly understand that. For the first few years of my trading career, I traded on
a tight budget. I tried to keep my overhead costs low so that I could pump as much
as I could of my profits back into my account. But here is some good news: you can
get a substantial discount if you follow these steps: call customer service at Zacks
and ask for David Bright (or whoever is in charge of product sales), and let him know
that I recommended the Research Wizard to you. Then ask for “the lowest price
you are willing to offer”. If you are assertive and counter-offer, you should be able
to work out a price that both you and Zacks can live with. Alternatively, Zacks does

offer “lifetime” access for about $4000 which would save substantially in the long-
run.
http://www.aaii.com/stock-investor-pro
Stock Investor Pro – I consider this product a viable middle way between the cheap
but inadequate Finviz and the expensive but fully equipped Research Wizard. I
myself use it as a back-up tool to Research Wizard. I also rely on it exclusively for a
number of the trading systems I describe in my third book, Market-Neutral Trading
(McGraw-Hill, 2014).
Stock Investor Pro is a downloaded software that runs on data provided by the
American Association of Individual Investors (www.aaii.com) which supports the
software and provides customer service. Stock Investor Pro has all the parameters
we need, both fundamental and technical, to build robust momentum scans. While
less user-friendly than the previous two products, there is a set of online video
tutorials you can view to get acquainted with its functions. And the price is
certainly on the mark. An annual subscription only costs $298, but it is nearly
always on sale for $198. A two-year subscription lists at $598, but that too is usually
on sale at only $299. At these prices, Stock Investor Pro is certainly a great value.
There are two drawbacks to Stock Investor Pro. First, it only works on weekly data,
uploaded to the site each weekend. You are automatically prompted to download
the data at each use if you are not using the most current upload. These downloads
can take several minutes, depending on the speed of your internet connection. The
second drawback to the product is that it has no backtesting functionality.
With that I mind, I strongly suggest doing the following, especially if you want to
build your own momentum scans: first, haggle with Zacks for the cheapest annual
fee you can get for the Research Wizard. Use the Wizard for a year, building and
testing your systems per the guidelines I set out below until you get a super set of
very robust momentum scans. Then cancel the Wizard, subscribe to Stock Investor
Pro, and in that software build your super set of scans. The whole process, not
allowing for tax deductions, might put you back about $1500 for the year, but that
is a small price to pay for being able to find and trade some of the most opportune
setups in the market on a week to week basis.
On the other hand, let’s hope that you make so much money trading your
momentum stocks that you are able to afford both Research Wizard and Stock
Investor Pro!

PART TWO: DEFINITIONS
All stocks are typically divided into types, depending on the fundamentals of the
underlying company and how their share prices are expected to behave in certain
types of markets. While the following list is not exhaustive, some of the more
common stock types are these:
1. GROWTH STOCKS. A growth stock is one that represents a company known
for its rapid growth of earnings per share (EPS), revenue and sales per
share, from quarter to quarter and year to year. Growth stocks normally
carry higher P/E values, or no P/E value at all if their earnings are in the red,
because their present value lies not in what they are earning now, but what
they are expected to earn in the future. Growth stocks tend to outperform
the markets when they are rising, and tend to underperform when the
markets are falling.
2. VALUE STOCKS. A value stock is one that represents a company known for
its strong net income per share, strong sales per share, low price to book
value, and strong free cash flow. Value stocks often disperse dividends and
carry low P/E values, along with low P/Sales and P/Cash Flow values.
Generally speaking, value stocks are desirable not so much for their future
earnings potential as much as for their past earnings record relative to their
current share price. Value stocks tend to fall out of favor during strong bull
markets, and come back into favor during weak and more volatile markets.
3. MOMENTUM STOCKS. A momentum stock is traditionally defined on the
sole basis of movement in its share price. A momentum stock is one in
which the price per share shows sudden and then sustained acceleration in
the prevailing price trend, whether up or down. But this change in price
movement is normally a product of change in either the company’s
underlying fundamentals (e.g., an expected rise or fall in earnings), or in the
perception of the company due to some extrinsic change (e.g., a cultural
shift which suddenly makes the company’s product “hot”). Momentum
stocks are easily recognized by their price charts which typically display
short term bursts of movement out of an area of price consolidation, along
with a sustained trend in that same direction. Momentum stocks are
expected to continue in the same direction over the near-term, regardless
of market direction.
Most traders and investors focus on one of these three categories. Warren
Buffett, for example, arguably the greatest investor of all time, is a “value stock”
guy. His mentor, Benjamin Graham, was also a “value stock” guru. Both men
built tremendous records of long-term success. Others have turned to “growth
stocks” to build their fortunes. Martin Zweig and Louis Navellier are both
examples of successful fund managers who focus primarily on strong growth
stocks. Those who chase “momentum stocks” are also ranked among the winners
of Wall Street. They include fund manager, Richard Driehaus – the “founding
father” of momentum investing – who currently oversees a $10B fund; and the
infamous Jesse Livermore, considered by a recent biographer to be “the greatest

trader who ever lived,” and whose personal fortune at one time peaked to nearly
$14B in today’s money. On his own trading style, Livermore said this in his
autobiography, Reminiscences of a Stock Operator:
“When some of my stock trading operations are given, you will notice I made my
first trade…when the force of movement was so strong that it simply had to carry
through.”
Livermore’s statement captures, in essence, the gist of momentum trading: enter
on strong price movement with the expectation that that movement will continue
in the same direction over the near term. Sounds reasonable doesn’t it?
Unfortunately, as a stand-alone filter for finding great trading stocks, trading on
strong price movement alone does NOT work well. My research demonstrates
that simply chasing price momentum is not enough to build a winning trading
system. My research also shows that by combining all three of our stock types
together, truly amazing trading systems can be created!
PART THREE: PRICE MOMENTUM ALONE IS NOT ENOUGH
I have spent over five years researching momentum stocks. I describe this
process in chapter 2 of Market-Neutral Trading. My quest initially was to find the
common technical pre-set to the 500 most explosive price movements seen in
individual stocks over the recent past. My working assumption was that there
was a quantifiable footprint in the technical charts of stocks just prior to their
price explosion. If I could isolate this footprint, then code it into a technical scan, I
figured that I would have the best trading system on the planet!
In fact, my work did indeed uncover a very common pattern in nearly half of the
stocks that rose sharply in price. Unfortunately, I did not learn of the fatal flaw in
my logic until I traded the system with real money. After it failed miserably, it
became painfully apparent that just because there is a common pattern that
precedes most strong rises in price, it does not follow that every stock displaying
this pattern will rise in price. In fact, most don’t. They either go sideways, or
down, or down sharply.
This same fatal logic is at work in most momentum trading systems. The
reasoned assumption in most of these systems is that stocks showing the
strongest short-term gains are preceded by strong acceleration in share price.
This seems reasonable because most stocks that go up sharply in price began
their ascent with marked acceleration in price. Unfortunately, this backward
looking thesis is inextricably paired with a forward-looking truth: most stocks that
show strong price acceleration shortly thereafter experience strong pullbacks in
price.
To prove this point, consider the following data. This simple momentum scan is
based purely on percentage price change over three different time frames:
Price > $10 per share
Average Volume > 100,000
24-week % Price Increase = Top # 30 stocks
12-week % Price Increase = Top # 10 stocks
4-week % Price Increase = Top # 3 stocks
This scan teases out from the universe of over 8000 stocks the 3 that rise to the
top of the list based exclusively on upward price momentum. I then backtested
this system over the past 5 years, using a 4-week rebalancing period. I selected
the 5 years that began at the bottom of the recent market crash (March, 2009) to
the all-time market highs that were printed in the S&P 500 in March, 2014. This
was an especially bullish period for US stocks as they rallied off the deep-cut lows
caused by “The Great Recession” of 2007 – 2008. The S&P 500 rose 165% during
this period for a compounded annual growth rate of over 22%. How did our
“momentum stocks fare? Not very well. They actually lost money!
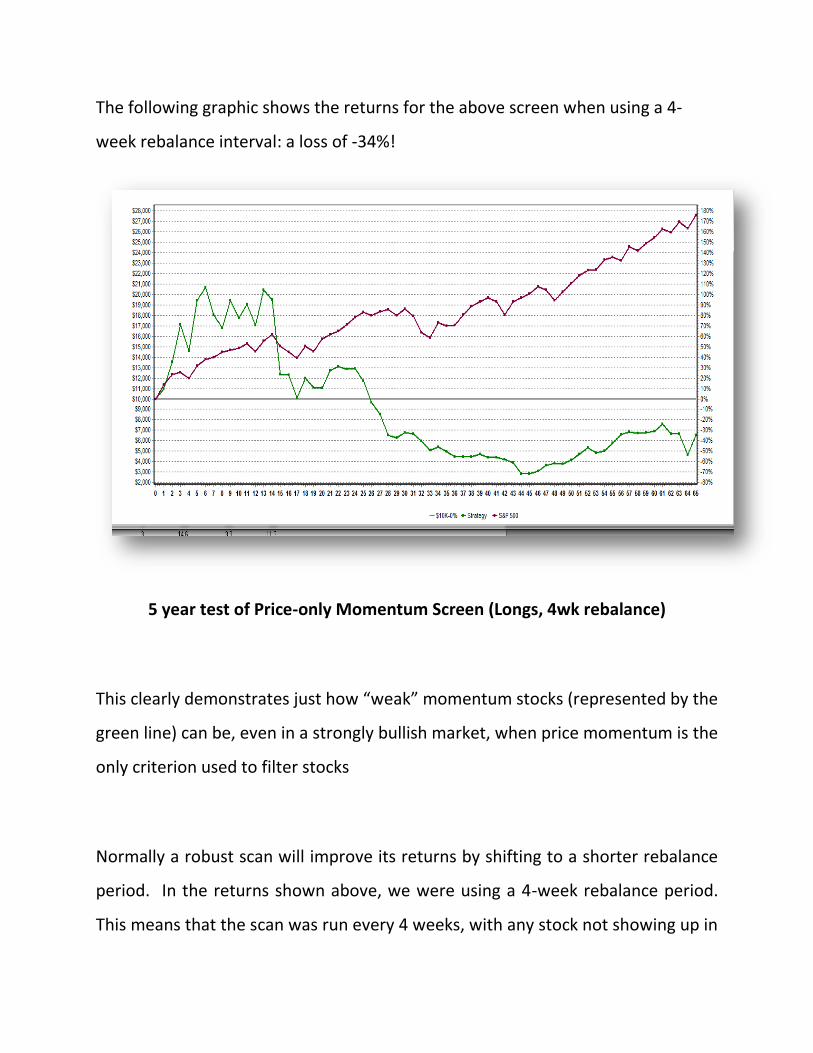
The following graphic shows the returns for the above screen when using a 4-
week rebalance interval: a loss of -34%!
5 year test of Price-only Momentum Screen (Longs, 4wk rebalance)
This clearly demonstrates just how “weak” momentum stocks (represented by the
green line) can be, even in a strongly bullish market, when price momentum is the
only criterion used to filter stocks
Normally a robust scan will improve its returns by shifting to a shorter rebalance
period. In the returns shown above, we were using a 4-week rebalance period.
This means that the scan was run every 4 weeks, with any stock not showing up in

the scan sold and replaced with a new stock from the scan. Perhaps by tightening
the period to 2 weeks, we can improve the returns. But watch what happens now
to our price-only momentum scan:
5 year test of Price-only Momentum Screen (Longs, 2wk rebalance)
Instead of improving our returns, which is what we expect from a robust scan when
we tighten the rebalance period, we made them worse! We went from a loss of
over -34% to a loss of -71.2%! And what was worse, we saw our system max
drawdown for the period rise to -91%, which compares very unfavorably to the
S&P500, which had a max drawdown over the same five years of only around -15%.
So clearly, scanning for price momentum alone is NOT the way to go!
PART FOUR: ADDING FILTERS
We can conclude from the foregoing that chasing after price momentum alone is a
recipe for disaster. Yes, the “turtle traders” and other species of “trend followers”
normally use systems based on price momentum alone. But the Turtles were
trading futures, not stocks. Stocks are a very different game; they abide by
different rules. If anyone tells you he is making money trading momentum stocks
based on price alone, he is either lying, very lucky, or will soon suffer a nervous
breakdown because he’s glued to the monitor scalping out of every minor price
twinge.
Yes, some can make a good living trading in and out of intraday momentum swings.
But we are not talking about day-trading in this Manual. And you can have
incredibly profitable streaks putting on very short-term trades in the big “momo”
names when they are on the move. But this trading method is never more than
about a month away from going bust on a string of big losses.
What we are after here is a momentum trading system supported by a set of
functional scans that can sustain steady, long-term gains over a profitable “trade
for a living” kind of career. I’m blessed to be in the middle of such a career – and
to be now on the upside of the learning curve – and if I can get there, anyone can!
To get into such a trading career, you will need to learn how to trade momentum
stocks profitably, because it is the best game in town. But to trade momentum

profitably, you will need to learn the key to turning a losing system (trading
momentum stocks based on price movement alone) into a winning system.
Here is the key: our scans need to account for the reality that price momentum will
only be sustained by the trading community (both professional and retail), even
over the near-term, when there is real value in the underlying company. Real value
can come in various forms, but my research has narrowed that range considerably.
As we will see in the next part of the Manual, once we add filters to our scan that
factor in fundamental value, we will see our profits skyrocket.
And conversely, since the subset of stocks with strong price performance as the
only common denominator lose money going forward, if we can filter out the
winners, what we have left over is a bunch of real losers! This means that we can
build an excellent “inverse” momentum scan that we can use to find profitable
short positions. But more on that later.
Adding a Valuation Filter
Our aim now is to find filters for our scan that help us identify the real quality stocks
among all those stocks that show momentum in price. So what then happens if we
add a valuation filter to our scan? There are several different types of valuation
ratios we could use, the most common of which is the P/E ratio (Price to Earnings).
But since many of the best momentum stocks do not (yet) show real net earnings,
and thus have no actual P/E ratio, this is not a good choice.

Another valuation metric that is commonly used by value stock investors is the
Price to Book Value (P/BV) ratio. I discuss this ratio in greater detail in Chapter 7 of
Market-Neutral Trading. There I describe the work of the main proponent of this
ratio, Dr. Joseph Piotroski, an economist at the University of Chicago. Piotroski has
statistically demonstrated that low P/BV stocks tend to outperform high P/BV
stocks, and that they really outperform once other fundamental parameters are
considered. But the problem with using P/BV as a valuation metric is that the vast
majority of low P/BV stocks show very little price momentum. This is why they
have such low P/BV values: their share price has fallen significantly. In fact, most
companies on their way to bankruptcy will spend some time in the low P/BV
universe.
What we need for our momentum scan is a valuation ratio that incorporates real
growth in the company’s perceived value. The PEG ratio works well for this (P/E
divided by EPS Growth Rate) but since many strong momentum stocks don’t have
a P/E, they don’t have a PEG either. So we need to look elsewhere.
The valuation metric that suits our purposes perfectly is the Price to Sales ratio
(P/S). This ratio is low when a company has a high level of sales revenue per
outstanding share relative to its price per share. This single metric can be used to
highlight companies that have real momentum in their earnings power because
they are growing their sales revenues (even if they have no real net income yet),
and are trading with relatively smaller share floats (hence are more responsive to

changes in share demand), and are not yet overly priced. It is this universe of stocks
that tend to be the real winners in the momentum game.
A low P/S metric is anything under 1.0. This means that the company is selling more
than $1 of its product per outstanding share for every $1 in its share price. So if we
add a P/S valuation filter to our scan, we end up with a momentum scan that looks
like this:
Price > $10 per share
Average Volume > 100,000
Price to Sales Ratio < 1.0
24-week % Price Increase = Top # 30 stocks
12-week % Price Increase = Top # 10 stocks
4-week % Price Increase = Top # 3 stocks
Just watch now what happens when we run this scan over the same 5-year period
we used above, using the same 4-week rebalance period:
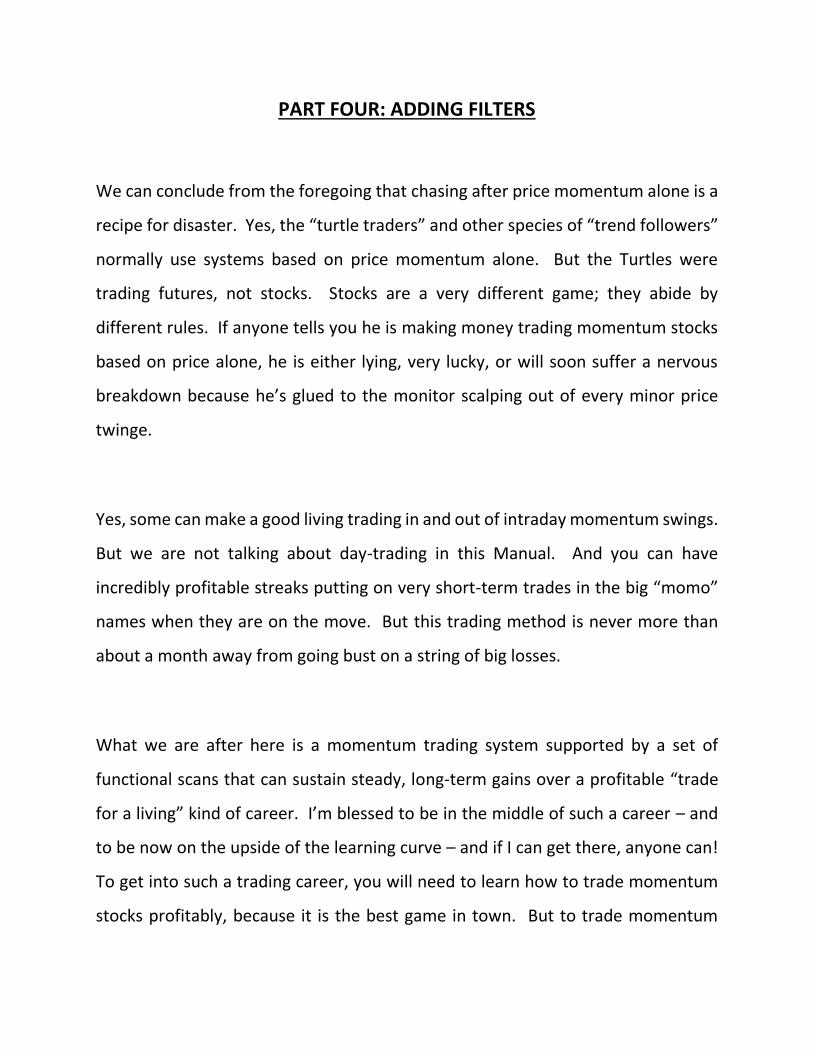
5 year test of Price + P/S Momentum Screen (Longs, 4wk rebalance)
Eureka! We just turned our losing scan into a money-maker! Okay, a 3.7% gain
over 5 years of a strong bull market is nothing to get excited about. But it shows
us that we are on the right track. By requiring that our passing companies show
strong sales growth relative to their share price, we have successfully weeded
out, on average, all the losing momentum stocks.
Now, if our scan is a robust one, we should see even more improvement when we
move from a 4-week rebalance period to a 2-week period. And this is exactly what
we see:
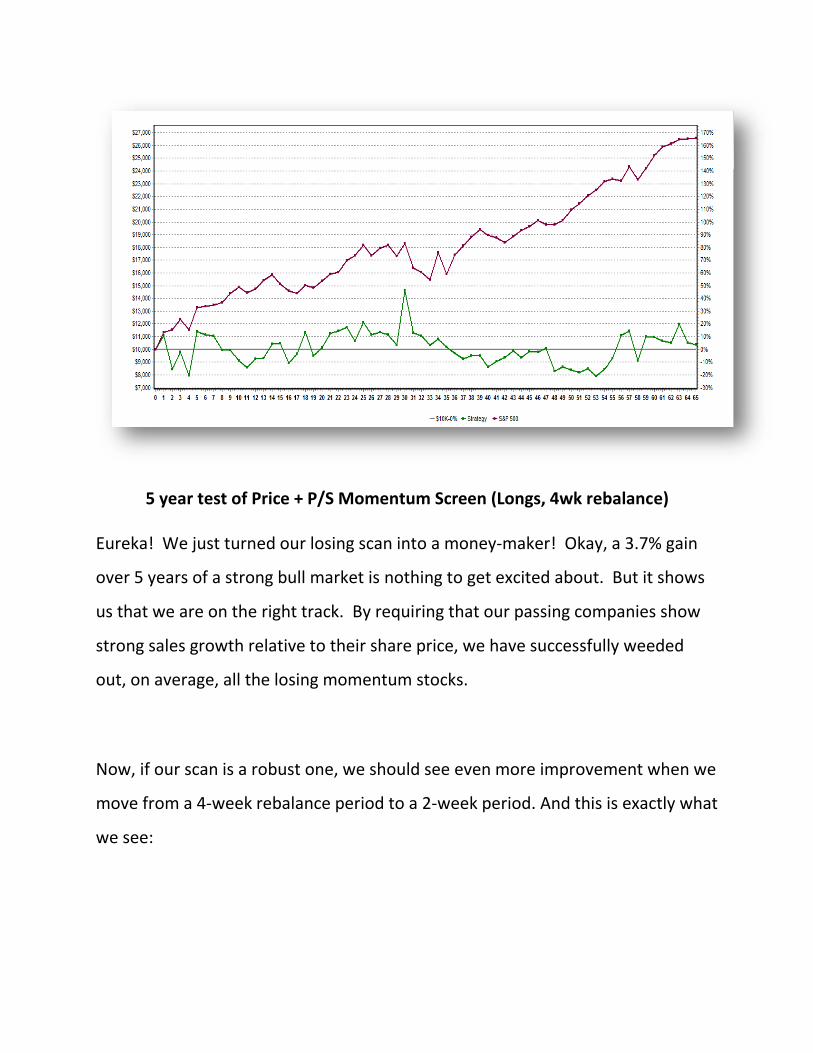
5 year test of Price + P/S Momentum Screen (Longs, 4wk rebalance)
Not only have our returns improved from a -70% loss to a 62.6% gain, but we
have also reduced the max drawdown for the scan to a more manageable -44%!
This scan still underperforms compared to the S&P 500, but it is a huge step in the
right direction.
Adding a Fundamental Growth Metric, Part I
We can improve our scan even further by adding a fundamental filter that aims at
a very particular form of momentum: anticipated earnings growth over the next
quarter that is stronger than what had been expected from the company. There
is only one reliable way of getting at this particular metric: we need to scan for
companies that have, in recent weeks, raised their earnings guidance for the next
quarter.

Most companies issue forward-looking guidance for the next quarter and fiscal
year when they make public the results of the previous quarter’s earnings. Some
larger companies, and companies in certain industries like retail, also give mid-
quarter updates. When companies make these forward-looking projections, they
usually give a range of possible EPS values they anticipate falling within by the
time the next quarter’s announcement is made. By comparison to what the
company said at the previous update, this range can be measured as either
above, below or in-line with previous statements. Normally, projections made
above the previous range are well received by the market over the near-term.
What we are looking for in this filter is at least a 5% increase in the projected
range of Q/Q EPS. This is incredibly predictive of near-term future price
movement. I’ve written at length about this particular metric in Chapter 8 of
Market-Neutral Trading. I’ve built a whole trading system around this filter and
when coupled with sound technical analysis, it works incredibly well. With this
filter added, our momentum system scan now looks like this:
Price > $10 per share
Average Volume > 100,000
Price to Sales Ratio < 1.0
Q(1)/Q(0) EPS Estimate Revision in past 4 wks > 5%
24-week % Price Increase = Top # 30 stocks
12-week % Price Increase = Top # 10 stocks
4-week % Price Increase = Top # 3 stocks
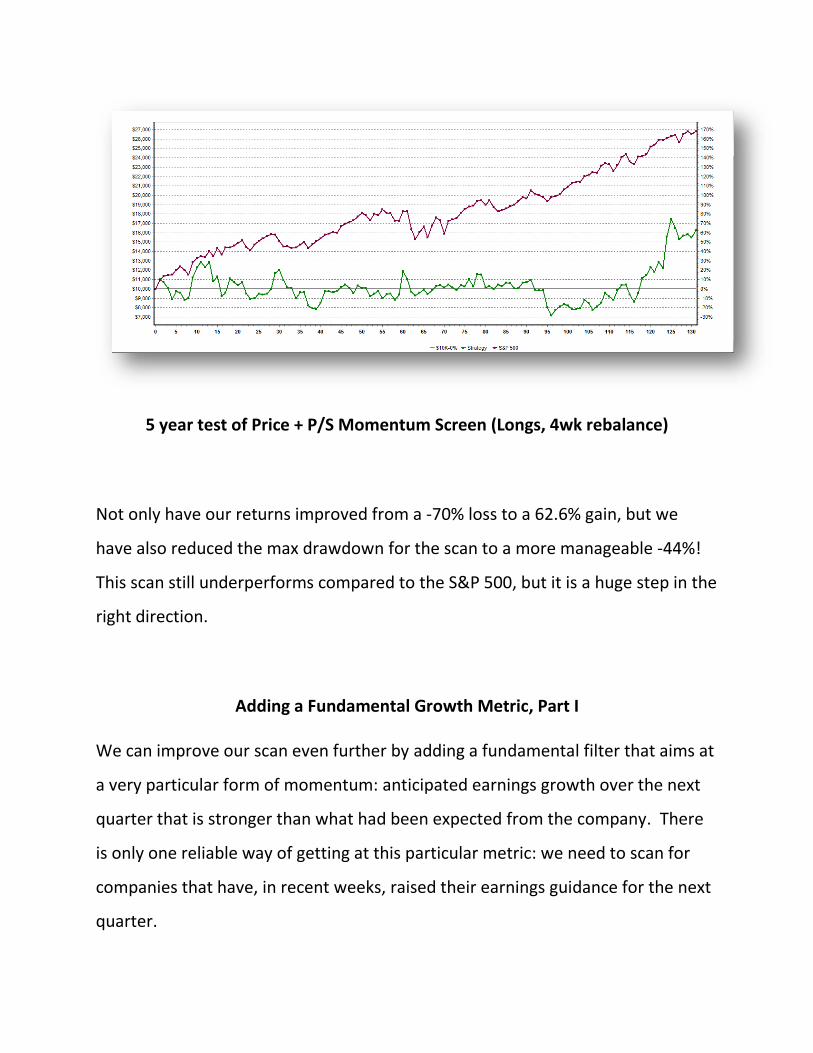
The following chart shows what happens to our returns with this fundamental
filter added:
5 year test of Price + P/S + EPS 5% Revision (Longs, 4wk rebalance)
Here with the simple addition of one line to our scan, we’ve added almost 50% of
return on investment over the 5 year look-back period. Not only that, but we’ve
also cut our max drawdown to -37.7%, a significant improvement. Still, our
momentum is not where we would want it to be. It’s improving, but we are still
lagging the S&P 500.
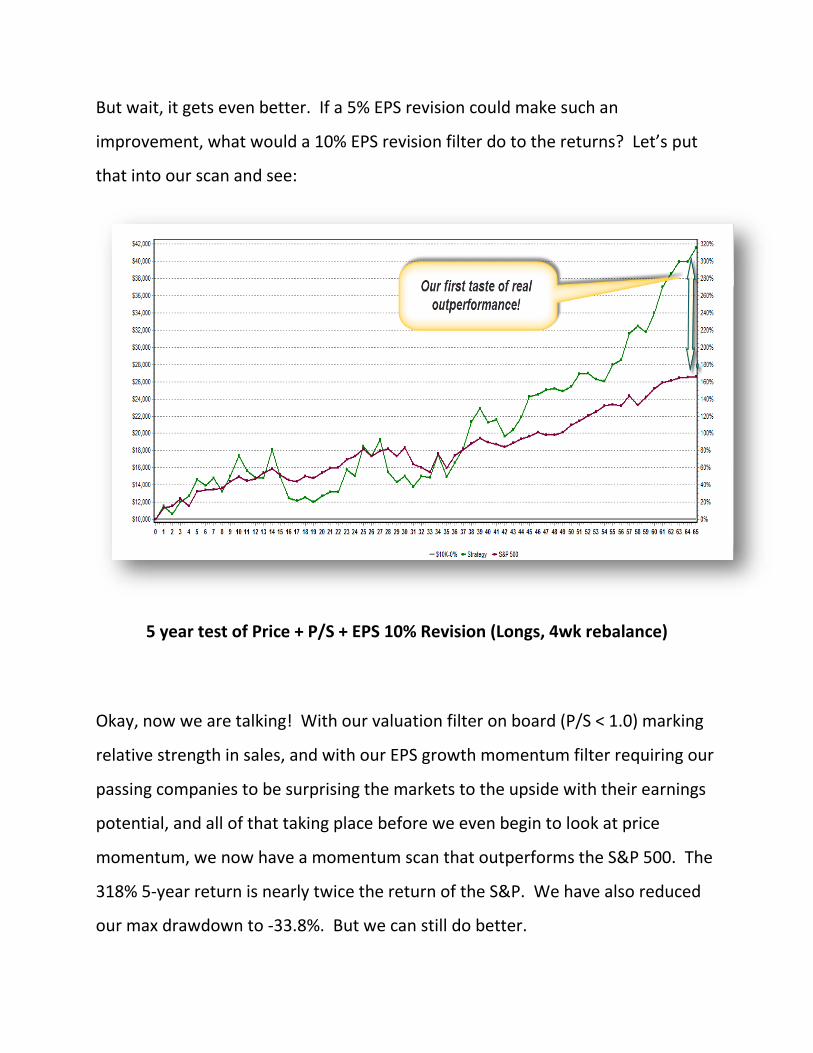
But wait, it gets even better. If a 5% EPS revision could make such an
improvement, what would a 10% EPS revision filter do to the returns? Let’s put
that into our scan and see:
5 year test of Price + P/S + EPS 10% Revision (Longs, 4wk rebalance)
Okay, now we are talking! With our valuation filter on board (P/S < 1.0) marking
relative strength in sales, and with our EPS growth momentum filter requiring our
passing companies to be surprising the markets to the upside with their earnings
potential, and all of that taking place before we even begin to look at price
momentum, we now have a momentum scan that outperforms the S&P 500. The
318% 5-year return is nearly twice the return of the S&P. We have also reduced
our max drawdown to -33.8%. But we can still do better.
Adding a Fundamental Growth Metric, Part II
We have measured sales strength relative to price and forward anticipated
earnings growth. What we need to add now – and it is our final add – is the
requirement that companies demonstrate actual EPS growth over the past
quarter. It is the most recent quarter that will drive share price over the near
term. We already have in place the requirement that companies create the
anticipation of a great quarter going forward. Now we need to bolster that
anticipation with the proven ability of the company to produce real EPS growth.
With this last filter in place, our momentum system scan now looks like this:
Price > $10 per share
Average Volume > 100,000
Price to Sales Ratio < 1.0
% Change Q/Q EPS Estimate > 10%
% Change Actual EPS Q/Q > 5%
24-week % Price Increase = Top # 30 stocks
12-week % Price Increase = Top # 10 stocks
4-week % Price Increase = Top # 3 stocks
Using the same 5-year look-back period and a 4-week rebalance period, our
returns now look very strong:
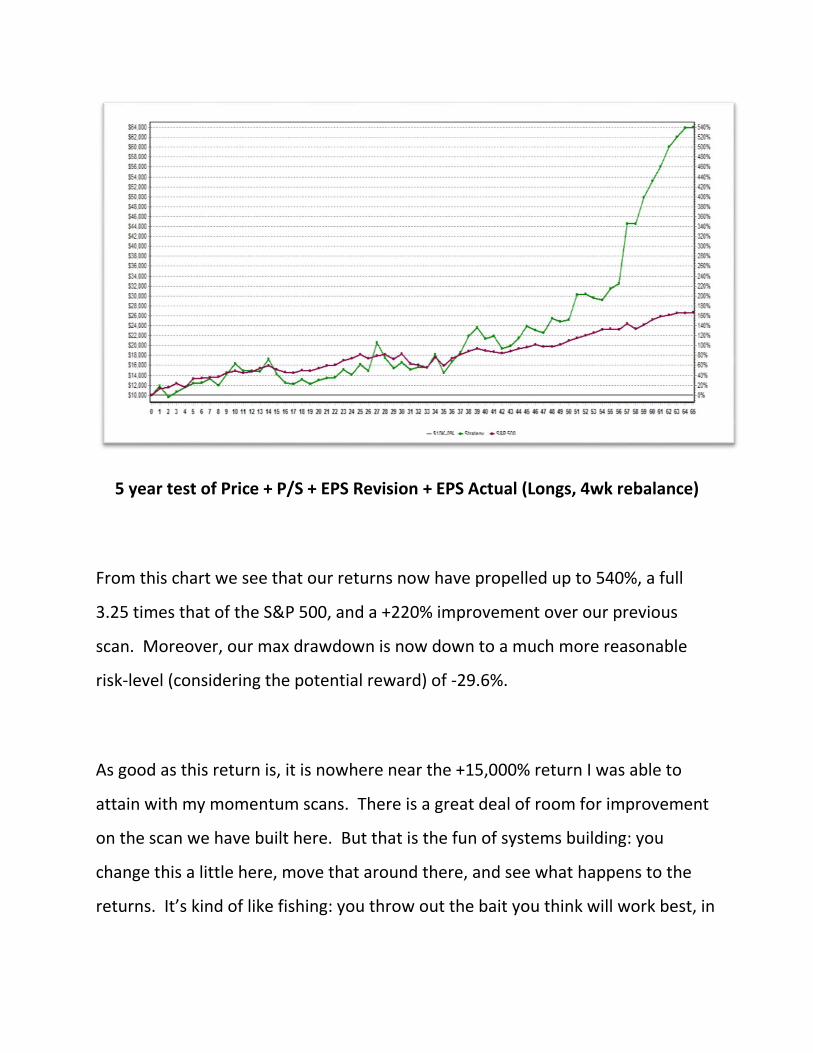
5 year test of Price + P/S + EPS Revision + EPS Actual (Longs, 4wk rebalance)
From this chart we see that our returns now have propelled up to 540%, a full
3.25 times that of the S&P 500, and a +220% improvement over our previous
scan. Moreover, our max drawdown is now down to a much more reasonable
risk-level (considering the potential reward) of -29.6%.
As good as this return is, it is nowhere near the +15,000% return I was able to
attain with my momentum scans. There is a great deal of room for improvement
on the scan we have built here. But that is the fun of systems building: you
change this a little here, move that around there, and see what happens to the
returns. It’s kind of like fishing: you throw out the bait you think will work best, in

the spot you think the fish are, but you never really know what you are going
catch (if anything at all!).
A Few Words about Position Management
Before we turn to the last part of the Manual, I should add that no system scan is
ever as good as the position management methods you use once you are in the
trade. Those who trade any momentum system need to be aware of the risks
involved. There is no high-reward trading system that does not take on outsized
risk. It is how the game is played. Some traders will want to use stop-losses to
manage their risk. My research shows that stop-losses will reduce your max
drawdown, but they also reduce your overall performance. If you can stomach
the risk, the best reward will come with holding on to all positions until the next
rebalance period, no matter what happens.
In nearly every backtest I ran in the Research Wizard, the best returns were
gained by simply letting the system scan itself take you out of the trade. With this
method, at each rebalance period – whether 4 weeks, 2 weeks, or 1 week – you
simply hold the stocks that continue to show up in the list of passing candidates,
and you sell those that don’t. Those that are sold are replaced with new stocks
on the list. This “rebalancing” can be done prior to the open on Monday morning
by using “OPG” or “market on open” orders to buy and sell.

I also strongly recommend pairing each long selection with a “momentum short”
position. For this you will need to build a shorts-only scan. I’ve given you more
guidance on this in the next section (see Rule #12 below; also see the momentum
short system I detail in Chapter 9 of Market-Neutral Trading). You will go a long
way toward improving your overall returns and reducing your exposure to risk by
pairing longs with shorts, with an equal amount of capital in each.
To be sure, being 100% market-neutral with long/short pairs can be frustrating on
days when the markets are in strong rally mode. You will certainly see your gains
curtailed by your hedged positions. You can even see losses on such days. But
those frustrations will be quickly overcome when the markets get a bit squirrelly.
And you will really be delighted when you see positive net returns on days when
the markets are in selloff mode. Being market-neutral doesn’t always work this
way, but chances are much stronger that it will than if you are 100% long in your
market exposure.
PART FIVE: RULES FOR SCAN BUILDING
Okay, I’ve given you just about everything you need to know to begin building a set
of robust momentum scans. I suggest that you start with the final version of the
scan we built above. I have no problem with your piggy-backing on my work; but
you are best served in the long-run by building and trading your own system scans.
Some of you may be able to work with software that can automate the tweaking
process. I’m not that fortunate (nor that technically astute). I do it the old-
fashioned way: line by line, tenth by tenth, test by test. For that reason it took me
5 years to build the scan whose returns you saw earlier in this Manual. Hopefully,
with this guide in hand, it won’t take you quite as long!
First, and to cut off anticipated questions from readers, the testing and scan-
building work represented in this Manual was all done in the Research Wizard. You
can replicate nearly all of it in Stock Investor Pro, but as I said before, you won’t be
able to backtest your scans. The best you can do is run the scan on historical data
and see how those stocks fared over time (a true labor of love). You will also need
to fudge a bit with the three “Top # X” functions in our scan. Stock Investor Pro
only allows you to screen for stocks in the “Top X %” of all stocks.
If you use Finviz, you will need to improvise. There is no function for EPS estimate
revisions in Finviz, and as for ranking stocks based on 4 week, 12 week and 24 week
performance, you will have to do that manually from the lists of stocks that show
up after filtering for the fundamental parameters. But the site can be used to build

very robust scans after you have already tested and built them in one of the other
two resources.
So in this final section, let me lay out some basic rules for building your own
momentum scans. Some of this has already been touched on, but it all bears
repeating here.
1. Always start your scans with a price filter (at least $2 to avoid penny stocks).
2. When building your scan(s), set the fundamental filters before the price
momentum filters.
3. Try adding a “Beta > X” near the beginning of the scan. The higher the beta
score (which indicators higher volatility) the stronger the returns tend to be,
but also the higher the risk.
4. Try both lowering and raising the average volume figure. Either one can
improve returns, depending on the system tested.
5. The Price/Sales valuation filter should never be greater than 1.0 as a max.
Try experimenting with lower values to see if you can improve returns.
6. The EPS Q/Q Estimate Revisions filter can be played with. Try raising the
value above 10%. Try adding FY/FY along with Q/Q.
7. The % change in Actual EPS Q/Q can also be played with. Try raising the value
above 5%. Try FY/FY EPS.
8. For the 3 lines of relative price strength – short-term, mid-term, long-term –
try changing the “Top #” values. Lower numbers will generally improve
returns but also increase risk.

9. First make sure your scan is significantly profitable using a 4-week rebalance
period. Then lower it to 2-week, then 1-week. The most robust scans should
improve at each change.
10. Be sure to run your backtests over different market periods. You’ll want to
make sure your scan outperforms in a bear market (e.g., 2000 – 2002 and
2007 – 2009) and in a relatively weak bull market (e.g., 2003 – 2006).
11. Be aware that the Research Wizard backtesting feature counts Friday’s
closing price as the official entry/exit price, but new data is not available until
Monday morning. Thus there tends to be a lag between backtested results
and real-time trading. Sometimes this works in our favor (if stocks gap down
Monday morning), but sometimes it does not.
12. To build a shorts-only scan as a companion system, try reversing the
fundamental parameters but keep the price momentum filters in bullish
mode. So, for example, you can start with the following scan:
Price > $10 per share
Average Volume > 100,000
Price to Sales Ratio > 1.0
% Change Q/Q EPS Estimate < -5%
% Change Actual EPS Q/Q < -5%
Then add two or three lines that filter stocks showing strong price
momentum over different time frames. The object here is to short “junk”
stocks that are in rally mode in the anticipation that reality will kick in and
they will fall back to a more appropriate valuation. Remember, just using
the very first scan we built above is already a pretty good scan for finding
short setups. If you add filters that scan for lousy fundamentals too, you’ve

got an awesome shorting system. You will need to play around with the
price performance numbers a bit to get a robust scan over different look-
back periods. But it is possible to get a shorts-only momentum scan tested
over the last 5 year bull market that shows strong triple-digit gains, and
double-digit annual returns. And over bear market periods, there is
nothing more profitable than shorting “junk-momo” stocks.
So…that’s it. Get to work! Email me directly at [email protected] if you
have any questions. If “The Momentum Letter” is open to new subscribers
(we plan to cap it at 200 subscribers), consider giving it a try. This way
you’ll be able to see whether the stocks you come up with match what my
scans come up with.
And as always, God Bless and Happy Trading!
TC
April, 2014