momentum strategies: evidence from the pacific … strategies: evidence from the pacific ... lilian...
TRANSCRIPT

Momentum Strategies: Evidence from the Pacific BasinStock Markets
Allaudeen Hameed* and Kusnadi Yuanto
Department of Finance and Accounting, Faculty of Business Administration,National University of Singapore, 10 Kent Ridge Crescent,Singapore 119260
First Draft: June 1999This version: August 1999
Abstract
We find some evidence of medium-term return continuation in our sample of six
Asian stock markets. An unrestricted momentum investment strategy does not yield
significant momentum returns due to the high volatility of returns in these emerging
markets. However, a country neutral strategy that fully invests in all countries over
the period 1981-1994 generates a statistically significant excess return of 0.37 percent
per month over a six-month holding period, before transaction costs. Further analyses
show that the momentum returns of more than 1 percent per month is observed when
applied to less diversified portfolios consisting of firms with small market
capitalization or high volume of trade, suggesting that price momentum is related to
firm specific factors.
Keywords: Medium-term return continuation; Asian stock markets; Momentum
investment strategy; Price predictability
* Corresponding author. Tel: 65-8743034; e-mail: [email protected].
We thank Narasimhan Jegadeesh, Grant McQueen, Lilian Ng and Geert Rouwerhorst for helpfulcomments. Allaudeen Hameed and Kusnadi Yuanto acknowledges the financial support from the NUSAcademic Research Grant and NUS Research Scholarship respectively. All errors are ours.
1
1. Introduction
A recent stream of research papers has documented the existence of momentum
effect in stock returns: stocks that outperformed (under-performed) the average stock
return in the past few months tend to perform better (worse) than the average stock
over the subsequent few months. Using the post-1940 data for stocks traded on the
New York Stock Exchange and the American Stock Exchange, Jegadeesh and Titman
(1993) report that a zero-cost momentum strategy of buying past winners and selling
past losers generates an average of 1 percent per month. Similar evidence is reported
by Rouwenhorst (1998) for stocks traded on European markets.
While the evidence of momentum in stock prices over the medium term of 3 to 12
months is well accepted for the developed markets in the US and Europe, the
interpretation of the evidence has been mixed. Barberis, Shliefer and Vishny (1998),
Daniel, Hirshleifer and Subrahmanyam (1998) and Hong and Stein (1999) present
theoretical (behavioral) models of investor behavior suggesting that price momentum
is consistent with investors having imperfect information. The slow price reactions
arise from revisions in investor expectations based on past prices and in response to
new information. Chan, Jegadeesh and Lakonishok (1996) argue that under-reaction
of stock prices to information contained in past stock returns and past company
earnings give rise to price momentum.
An alternative explanation for the momentum profits is that differential risks and
risk premia are associated with the winner and loser portfolios so that the momentum
profits reflect compensation for investing in a risky portfolio. Fama and French
(1996) examine if their three-factor asset pricing model can explain momentum
profits reported by Jegadeesh and Titman (1993) and find their model is inadequate.
Conrad and Kaul (1998) show that the momentum strategy’s average profits reflect

2
the result of buying (on average) high mean return securities and selling (on average)
low mean return securities. If the differences in the unconditional mean returns are
attributable to variation in expected returns, then, the momentum profits are due to
cross-sectional differences in risk. Moskowitz and Grindblatt (1999) suggest that the
profitability of the momentum strategy is explained by momentum in industry factors,
and possibly indicate industry-related risk as the source of the profits.
An important drawback of the studies that examine the U.S. data for explanations
of the trends and predictable patterns is that they may suffer from data-snooping
biases as noted by Lo and MacKinlay (1990) and Foster, Smith and Whaley (1996).
Financial researchers have observed and treated for momentum with the same data,
hence making it difficult to obtain independent evidence.
In this paper, we offer “out-of-sample” evidence on the robustness of momentum
trading strategies, by examining stock returns in a group of emerging, Asia Pacific
stock markets. While substantial work has been done using data from developed
markets, very little is known about the predictability of returns in the emerging
markets. If momentum profits are due to the slow reaction of prices to information
contained in past returns, we ought to find similar evidence in other markets. We
know from prior research that emerging markets are characterized by low correlation
with other emerging markets and with developed markets (see Harvey (1995)).
Consequently, evidence from emerging markets is particularly interesting as it
provides a validation test on a sample that is not highly correlated with the data in
previous papers.
An exception to the dearth of evidence on medium-term predictability using
individual securities in emerging markets is a recent paper by Rouwenhorst (1999),
who finds some evidence of momentum profit in emerging markets. He reports a

3
statistically significant average monthly return of 0.39 percent for the momentum
strategy of buying past-six month winners and selling past losers. The average return
is much smaller than the average of 1 percent per month reported in Jegadeesh and
Titman (1993) and Rouwenhorst (1998) for developed markets. In addition,
Rouwenhorst (1999) finds significant momentum profits in only 6 out of the 20
emerging markets in his sample.1 Trading in emerging markets is associated with high
transaction costs (such as brokerage commissions and bid-ask spreads) and low
liquidity in some of the listed securities. Given the high trading costs, the existing
evidence does not indicate the economic significance of the momentum returns in
these markets. Our paper attempts to shed additional light on the presence and nature
of momentum returns in emerging markets. Specifically, we also examine the effect
of firm size and trading volume on return predictability.
We implement the momentum trading strategies on securities traded on six Asian
markets: Hong Kong, Malaysia, Singapore, South Korea, Taiwan and Thailand. We
find momentum in prices evident in the smallest firms and the firms with high
volume. For example, the momentum strategy that invests in the smallest 30 percent
of firms across the six markets generates an average profit of 1.21 percent per month
over a six-month holding period. The average profit is 1.12 percent month if the
strategy is implemented on only the top 30 percent of all firms in terms of trading
volume (turnover). While these are the significant strategies, the more general,
unrestricted momentum strategies of buying winners and selling losers yield
insignificant returns across various holding periods. Following Jegadeesh and Titman
1 Rouwenhorst (1999) argues that it is difficult to detect momentum in individual countries because of
the highly volatile nature of emerging market returns. The statistical significance increases when one
4
(1993) and Rouwenhorst (1998), we examine 16 unrestricted momentum strategies
that involve ranking securities based on their J-month performance (J=3,6,9 and 12)
and evaluating the returns over the next K-months (K=3,6,9 and 12). None of the 16
strategies produce significant momentum returns.2 We also implement restricted
strategies to obtain better-diversified portfolios. Of these strategies, only the country
neutral strategy produces a statistically significant return of 0.37 percent, which is
consistent with the 0.39 percent monthly returns reported in Rouwenhorst (1999).
Our results can be summarized as follows. First, an unrestricted momentum
trading strategy fails to show significant price momentum in emerging markets
(although a lower variance of the traded portfolio returns is achieved by forming
portfolios that are diversified across countries). Second, we find that firm
characteristics such as size and trading volume influence return predictability: returns
on small firms and high turnover stocks seem to exhibit some medium-term
momentum. Our results characterize the medium-term price predictability
phenomenon and its relation to firm characteristics in emerging markets.
The rest of the paper is organized as follows: Section II describes the sample
while Section III documents the returns on momentum trading strategies. Section IV
analyses the momentum profits across all sample countries, size and turnover sorted
groupings and investigates the influence of calendar effects. Section V concludes the
paper.
considers a diversified portfolio of many markets due to the low pair-wise correlation between these
markets.
2 These results are robust to skipping a month after ranking and defining winners and losers based on
the top/bottom 10 percent and 30 percent of the securities. Our findings are also unaffected by the
decision to exclude the extreme 5 percent of returns each period.
5
2. Data
The sample consists of monthly stock returns on over 1000 individual securities
traded on six Asian markets over the period 1979-1994. The data is taken from the
PACAP database, compiled by the University of Rhode Island. The countries
included in the analysis are: Hong Kong (201 firms), Malaysia (244 firms), Singapore
(103 firms), South Korea (309 firms), Taiwan (92 firms) and Thailand (59 firms). For
each security, we obtained the monthly price, returns, size, trading volume, and
number of days traded in a month. We used all the emerging market data available
from PACAP, except Indonesia for which the data series starts in 1990. Month-end
exchange rate information is taken from the PACAP to convert the local currency
returns to US dollar returns.
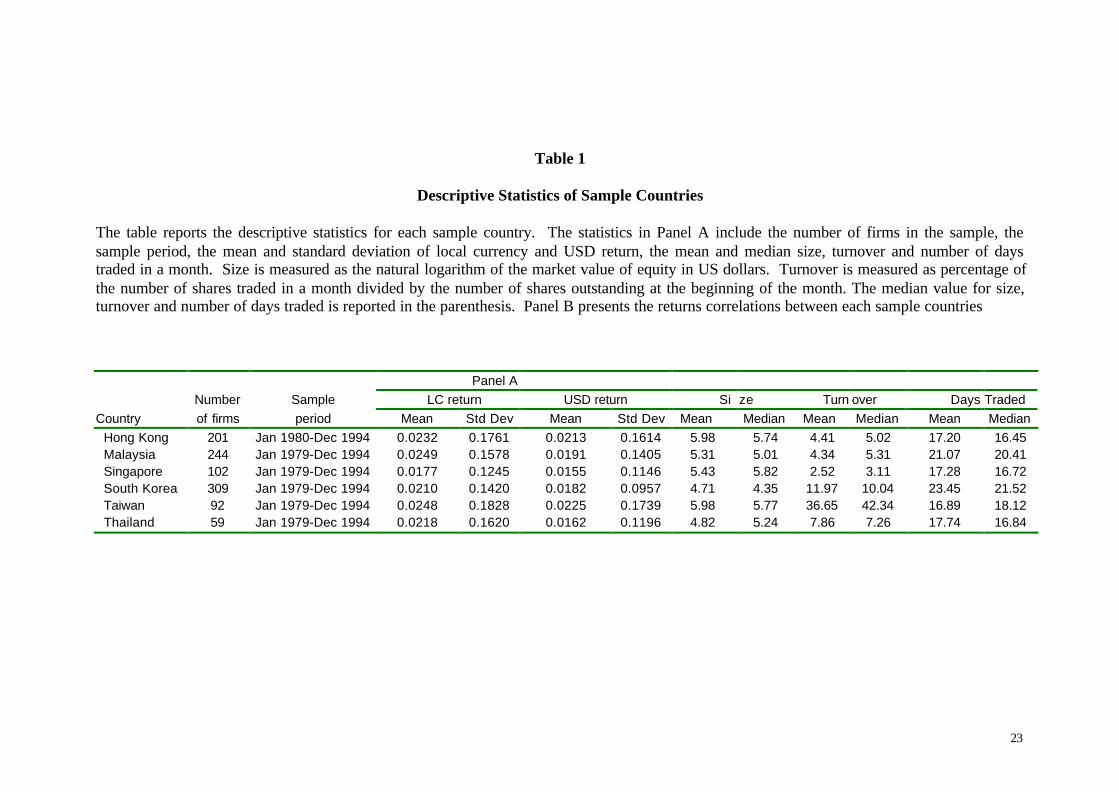
Table 1 Panel A summarizes the descriptive statistics for all the sample countries.
For local currency return, the average mean return across the six Asian countries is
about 2.2 percent per month. The mean and standard deviation of returns are slightly
smaller for returns in U.S. dollars but continue to be high relative to most developed
markets.3 The highest average U.S. dollar return of 2.25 percent is reported for
Taiwan, while the lowest average return is 1.55 percent in Singapore. The high
volatility of emerging market returns are reflected in monthly standard deviations that
are about 10 percent or more for the six countries. Similar characteristics are reported
by Bekaert and Harvey (1997).
The subsequent columns give the statistics for the mean firm size, turnover and
number of days traded in a month. Firm size is measured as the natural logarithm of
the market value of equity for the sample firms (in US dollars) included in each
3 The higher value for local currency return than the US dollar return indicates a slight negative
correlation between the local currency return and exchange rate changes.
6
country. The mean firm size is highest in Taiwan and Hong Kong (5.98) and lowest
in South Korea (4.71).
Two measures of trading activity are reported in the last few columns of Table 1
(Panel A). Turnover is measured as percentage of the number of shares traded in a
month divided by the number of shares outstanding, which is implicitly an equally-
weighted measure of turnover. The mean share turnover shows a large cross-sectional
variation across the emerging Asian markets. The maximum turnover is 37 percent in
Taiwan, which is almost 15 times the average turnover of 2.5 percent in Singapore.
The last statistic is the number of days traded in a month, which is similar across all
countries, with an average of about 19 trading days per month.
Table 1 Panel B reports the return correlation coefficient between each sample
countries. With the exception of Singapore and Malaysia, the market exhibits a low
level of correlation in stock returns across these markets. The high correlation of 81
percent between returns in Singapore and Malaysia is due to the historical stock
market linkages between the countries and the high level of trading by (local)
investors across both markets. The correlation between other pairs of countries ranges
between 7 percent and 44 percent. South Korea appears to have the lowest correlation
with all other countries.
3. Momentum trading strategy
Our momentum trading strategy is similar to that used in Jegadeesh and Titman
(1993) and Rouwenhorst (1998). The relative strength portfolios are constructed as
follows: at the end of each month, all stocks from the six sample countries are ranked
in ascending orders based on their past J-months return (J=3, 6, 9, and 12). They are
then assigned to one of the ten relative strength decile portfolios (1 represents the
7
“Loser” portfolio or the one with lowest past performance and 10 represents the
“Winner” portfolio or the one with the highest past performance). These portfolios
are equally weighted at formation and then held for K subsequent months (K=3, 6, 9
and 12). This gives us 16 combinations of J and K months, and hence, 16 momentum
strategies.
To check for robustness of our results to our definition on winners and losers, we
also assign the stocks into three portfolios (instead of ten) based on past J month
performance: the top 30 percent of firms are classified as winners while the bottom 30
percent are the losers. This alternative measure of momentum places less emphasis on
the tail-end of the distribution (which may be important given the high volatility in
emerging markets). A similar measure is used in Moskowitz (1997), Rouwenhorst
(1999) and Hong, Lim and Stein (1999).
Since only monthly returns are available, while the holding period exceeds 1
month, an overlap in the holding period returns is created. As a result, K-composite
portfolios are formed, each of which are initiated one month apart. In each month,
1/K of the holdings are revised and the rest are carried over from the previous month.
As an example: towards the end of month t, the J=3, K=3 portfolio of Winners consist
of three parts: a position carried over from the investment at the end of month t-3 in
the top 10 percent of firms with highest past three-months performance as of t-3, and
two similar positions resulting from similar investment in month t-2 and t-1
respectively. At the end of month t, the first position is liquidated and replaced with
an investment in the stocks with highest past three-month performance as of time t.
Table 2 presents the monthly average returns of the strategies implemented on all
stocks in all sample countries from 1981 to 1994, where winners and losers are

8
defined as the top and bottom ten percent of past returns. 4 The table shows that, for
the six month interval (J=6, K=6), an equally-weighted portfolio formed from stocks
in the bottom decile of past six-month performance (Loser portfolio) earns 1.91
percent, while the corresponding Winner portfolio earns 2.44 percent. A zero-cost
relative strength portfolio consisting of buying the past winner and selling the past
loser (Winner-Loser) gives a positive, but statistically insignificant, excess return of
0.53 percent per month. The highest average return of 0.79 percent per month (or 9.48
percent per year) is obtained for a 12 month holding period (K=12), formed by
ranking the stocks on past 6 and 9 months performance (J=6 and 9). However, none of
the strategies yield statistically significant returns at conventional significant levels.
The portfolios in Table 2 are formed at the end of the ranking period. The end-of
month prices used in the ranking period may be either the bid or ask price. The
month-end closing price of a loser security at the end of ranking period is likely to be
the bid price while the closing price of the winner security is likely to be the ask price.
The loser and winner security are likely to experience return reversal in the holding
period – leading to a reduction in momentum returns. To alleviate the bid-ask effects
on momentum returns, if any, we delay the implementation of the buying and selling
decision by one month. Our unreported results show that across all investment
strategies, delaying the portfolio holding period by one month does not affect the
results. The inability to detect significant momentum profits is not due to reversals in
prices over the shorter term.
Another possible reason why price continuation in returns in Table 2 is not
observed is that our results may be influenced by return outliers as represented by the
4 Note that two years are lost due to the J=12, K=12 strategy, which requires 12 months of performance
ranking and another 12 months of portfolio holding.

9
extreme deciles. Extreme performers in the ranking period may reduce the signal-to-
noise properties of the returns. To account for the outlier effect, we rank the stock
returns into three portfolios: the top and bottom 30 percent is classified as winners and
losers respectively. This alternative classification allows for a broader-based measure
and is less affected by extreme returns. A similar measure is used in Rouwenhorst
(1999) and Hong, Lim and Stein (1999). The results confirm our finding that the
momentum returns in our sample are not statistically significant.5 Hence, the
momentum portfolio results reported in this paper are not affected by the method used
to form the portfolios. 6
Compared to the results by Jegadeesh and Titman (1993) and Rouwenhorst
(1998), the magnitude and statistical significance of momentum profits in Asian stock
markets are considerably less than those earned in either US or Europe. The bid-ask
bounce effect, return outliers, and portfolio formation methods are not likely to be
source of the difference in findings.
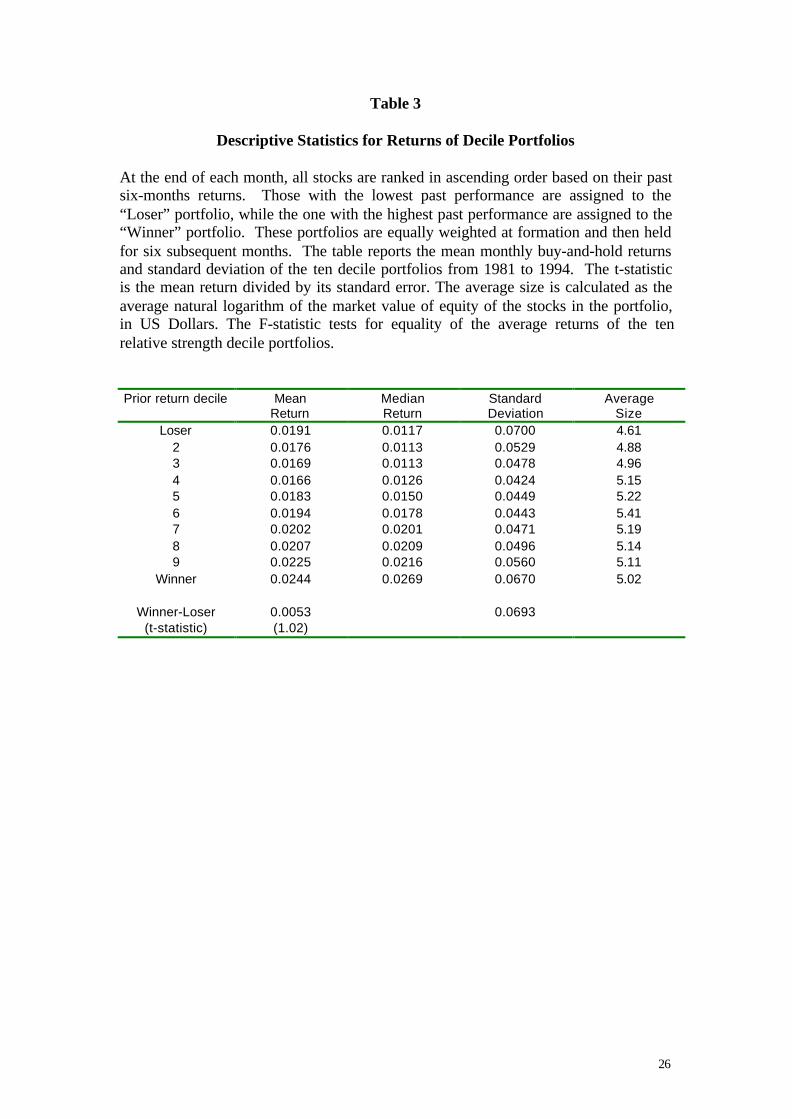
To closely examine the pattern of medium term price movements in the Asian
markets, the remainder of the paper will concentrate on a particular momentum
strategy: one that is formed on the basis of lagged 6-month return and held for the
next 6 months using decile portfolios. A similar six-month strategy is examined in
Jegadeesh and Titman (1993), Rouwenhorst (1988, 1999) and others. Table 3 reports
5 The average returns to buying the top 30 percent of stocks and shorting the bottom 30 percent of
stocks are generally similar to that reported for the decile portfolios and none of the 16 strategies yield
significant momentum returns. The results are qualitatively unchanged if we implement the momentum
strategy with a one-month lag.
6 We have also excluded the extreme 5 percent of the ranking period returns in the formation of winner
and loser portfolios. The results are qualitatively unaffected by these extreme observations for both the
decile portfolio and the top/bottom 30 percent portfolio return measures.

10
a high mean return in the extreme deciles with the smallest return recorded for the
middle deciles. In contrast to the results for the U.S. and European markets, we do not
observe a positive relation between past performance and subsequent average returns.
As noted by Rouwenhorst (1999), the standard deviation of returns are large;
even for the combined portfolio of winner-loser, the standard deviation of returns is
6.9 percent. The correlation between the winner and loser portfolios is a high 49.0
percent. Hence, the unrestricted relative strength strategy may not be well diversified
and the high volatility of returns may make it difficult to detect statistical significance.
The winner and loser portfolios may predominantly take positions on securities from a
specific country, making the portfolio ill-diversified. The next section will examine
the effect of forming portfolios that are diversified across countries. We also examine
if other firm specific variables like size and volume play a contributory role in price
momentum.
4. Momentum Strategies and Country, Size and Turnover Effects
The previous section discusses the relative strength strategy that combines stocks
from all the sample countries without any requirement to ensure diversification of the
portfolio across countries. This raises two concerns. Firstly, since the winner and loser
portfolio classification procedure assigns larger weight to a set of firms which are the
extreme past performers; these firms may be highly volatile, small and thinly traded.
Our previous results do not relate price momentum to any of these firm
characteristics. Secondly, the firms may not be diversified across the countries – most
firms may come from a country with the highest variation in returns. To control for
these two problems, we form an international (or regional) portfolio that invests
11
across several markets and consider a momentum strategy that is fully invested in all
six countries in the sample.
4.1 Country-Neutral Relative Strength Strategies
Return continuation in international stock returns may be due to two potential
sources: country momentum and firm-specific momentum. Persistence in country
specific performance may tilt the winner and loser portfolio weights to countries with
strong and weak performance respectively. If stocks in Malaysia (Taiwan) are
experiencing a boom (bear) market, their returns will be greater (lower) compared to
the returns of stocks from the other markets. Hence, the resulting Winner (Loser)
portfolio will be concentrated in Malaysian (Taiwanese) stocks. Clearly, this strategy
is associated with a portfolio that is poorly diversified across countries. Evidence of
country momentum is presented in Assness, Liew and Stevens (1996) and Chan,
Hameed and Tong (1998). Our results so far suggest that country momentum may be
difficult to detect in view of the high volatility in these emerging markets. Firm
specific momentum in performance, however, is likely to be more discernible in a
portfolio that is geographically well diversified.
Country-neutral relative strength portfolios are formed by ranking stocks in
ascending orders based on their past six-months performance relative only to stocks
from the same market. The top 10 percent of stocks with highest past six-months
performance from each country are assigned to the Winner portfolio and the bottom
10 percent to the Loser portfolio. These portfolios are then held for the subsequent
six-months. The resulting decile portfolios have equal country weights and are,
hence, country-neutral. Table 4 presents the mean return and corresponding t-statistic
for the country-neutral relative strength portfolio, as well as for individual countries.
12
The standard deviation of the momentum returns shows a large drop from 0.7 percent
to 0.2 percent, indicating a strong diversification effect. After accounting for country
composition, the mean return of the zero-cost portfolio is statistically significant at
0.37 percent per month. Hence, equal-weighting the sample countries has the effect of
reducing the volatility of the relative strength strategy and a better risk control for the
portfolio.
The same table also reports the excess returns to the Winner-Loser portfolios by
individual countries. The average excess returns figure is positive for each of the six
sample countries, with the highest in Taiwan (0.6 percent) and lowest in Malaysia
(0.19 percent). However, all the excess returns are not significantly different from
zero and as expected, their standard deviations are more than twice that of the
country-neutral momentum strategy. This suggests that a large portion of the risks of
the unrestricted momentum strategy is attributed to country-specific factors, which
can be diversified internationally. Our results are consistent with Rouwenhorst (1998)
who finds that the momentum returns in the European stocks are unlikely to be due to
country-specific momentum but are more likely to be attributable to under-reaction to
firm specific shocks. Our findings also reinforce the results in Rouwenhorst (1999)
concerning the difficulty in finding significant price momentum in individual
emerging stock markets.7
7 On examining sub-period results, we fail to find significant momentum returns in later years, 1989-
1994. This further reduces the significance of country-neutral momentum returns, to the extent that the
strategy may not be feasible in the early years due to restrictions on foreign investments in many
emerging countries (e.g. S. Korea and Taiwan). While market segmentation may explain some of the
observed results, we have to be cautious in interpretation as the tests based on a shorter sample may
lack power to reject the null.

13
4.2 Size and Relative Strength Strategies
The previous section discussed the effect of equally weighting each country in the
implementation of the relative strength strategy. However, as with the unrestricted
relative strength strategy, the country-neutral results do not account for size factors.
Size-based groupings are constructed by first ranking all the stocks according to size
as measured by market value of equity in U.S. dollars. The stocks containing the
smallest 30 percent, medium 40 percent and the largest 30 percent are assigned into
small, medium and large size groupings (denoted as S1, S2 and S3 respectively).
Within each size groupings, the stocks are sorted into ten deciles based on their past
six-months performance and are held for subsequent six months (J=6, K=6). The
Loser portfolio consists of ten percent of stocks with the lowest past six-months
performance, while the Winner portfolio consists of ten percent of stocks with the
highest past six-months performance, within each size grouping. From Table 5, it can
be seen that the positive relation between past return and future performance is
strongest in the small firms: the relative strength strategy of buying winner (decile
P10) and selling past losers (decile P1) yields a significant excess return (Winner-
Loser) of 1.21 percent. The other two size groupings (medium and large size firms) do
not produce significant momentum profits. 8 Hence, price momentum seems to be
concentrated in the small firms.
Our result is consistent with Hong et al (1999), who also find that the momentum
effect is the strongest in the very smallest stock and it declines sharply as market
capitalization increases. Their results are driven by the hypothesis that firm-specific
information, especially negative information, diffuses only gradually across the

14
investing public. If momentum comes from gradual information flow, then there
should be more momentum in those stocks for which information gets out more
slowly, ie: small stocks.
While significant relative strength excess return associated with small firms is
reported, this unrestricted strategy may be due to taking excessive portfolio positions
in a few countries. If the international portfolio strategy aims to be diversified, the
relative strength strategy must not huge country positions. To examine whether the
small firm price momentum holds across markets, we consider a size/country neutral
strategy.
The size-country-neutral portfolios are constructed by first ranking all the stocks
in the six countries into three size-groups: small (lowest 30 percent), medium (middle
40 percent) and large (highest 30 percent). This produces 18 size-country groups.
Stocks in each of the 18 groups are further ranked according to their past six-months
performance. The Loser portfolio consists of ten percent of stocks with the lowest
past six-months performance from each size-country group, while the Winner
portfolio consists of ten percent of stocks with the highest past six-months
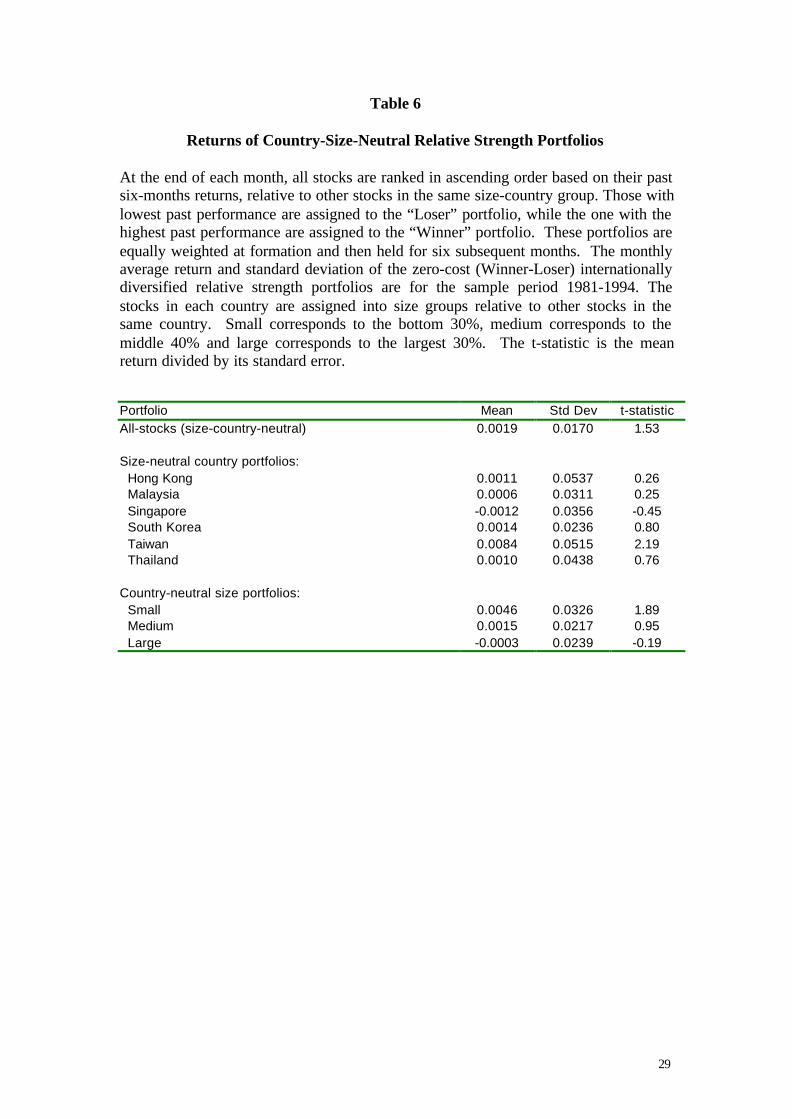
performance from each size-country group. Table 6 shows that the average zero-cost
portfolio return to the strategy that is country and size neutral is insignificant at 0.19
percent and the profits reported for the portfolio of small firms in these markets
decreases from 1.21 percent to 0.46 percent. The relative strength portfolio strategy
for the small firms become weaker when we restrict the portfolio weights to be
country-neutral, showing significance only at a 10 percent level. The excess returns
8 As a robustness check, we also computed the proportion of excess returns that are positive. We reach
similar conclusion: the proportion of positive returns on the Winner-Loser portfolio for the three size
groupings S1, S2, and S3 and combined grouping, ALL are 61%, 54%, 57%, and 56%, respectively.
15
on medium and large firms continue to be insignificant, although we also see a
reduced volatility of returns. For completeness, we also report the excess returns for
each country, after controlling for the size effect. The size-neutral strategy shows
significant excess returns for only one of the six countries (Taiwan). We suggest that
return continuation in the emerging markets are not pervasive and may be driven by
firm specific characteristics like firm size.
4.3 Turnover and Relative Strength Strategies
Several recent papers indicate that trading volume (turnover) is of particular
interest to investors and may influence the behavior of return momentum. Lee and
Swaminathan (1998) show that trading volume (turnover) predicts both the magnitude
and persistence of future price momentum. For the U.S. data, a substantial increase in
momentum profits is found for high turnover stocks. They suggest that turnover may
serve as indicator of the level of investor interest in a stock. For example, the low
turnover losers is likely to be at the bottom of its “life cycle” and that a price reversal
is likely, while a high volume loser may have plenty of negative price momentum.
Similar findings are reported in Chan, Hameed and Tong (1998) who show that the
momentum profits are higher for the portfolio of countries with higher lagged trading
volume than portfolio of countries with lower lagged trading volume. These papers
suggest that higher trading volume accentuate the return continuation effect.
We examine the role of stock turnover on price momentum in our sample
countries. We do this by constructing turnover sorted relative strength portfolios,
where turnover is defined as the ratio of monthly trading volume divided by number
of shares outstanding. The stocks in the sample are first ranked into three turnover-
groups: low (lowest 30 percent), medium (middle 40 percent) and high (highest 30

16
percent), denoted as T1, T2 and T3 respectively. For each turnover group, we define
winner and loser stocks based on their past six-months performance. The Loser
portfolio consists of ten percent of stocks with the lowest past six-months
performance from each turnover group, while the Winner portfolio consists of ten
percent of stocks with the highest past six-months performance from each turnover
group. Panel A of Table 7 shows the return on zero-cost relative strength portfolio
strategy applied to each of the three turnover groups. Of the three turnover groups,
only the largest turnover group registers a significant return of 1.12 percent. The
medium and low turnover stocks yield insignificant excess returns of –0.12 percent
and 0.52 percent respectively. Our finding of significant price momentum in high
turnover stocks is consistent with that reported by Chan, Hameed and Tong (1998)
and Lee and Swaminathan (1998). The fact that share turnover plays a similar
complimentary role in predicting stock returns in emerging markets is interesting to
note.9
One possible explanation for the finding of a stronger momentum effect for the
stocks in the higher turnover group might be that highly traded stocks tend to increase
the tendency of investors' herding behaviour. These investors might overweight the
past patterns and become overconfident about the future price of such stocks and
exaggerate the mispricings. Odean (1998) proposes that overconfident traders result in
market underreaction to the information by rational traders and the subsequent
momentum in stock prices in high volume stocks.
9 We also found a monotonic increase in average returns as we move from past losers to past winners in
the high turnover group. Similar results are obtained when we compute excess returns in terms of
proportion of returns that are positive. The proportion of positive excess returns for the low, medium
and high turnover relative strength portfolios are 55%, 53% and 62% respectively.

17
The strategy of investing in high turnover stocks is not likely to be diversified
across the countries in the sample as indicated by the large standard deviation of the
excess returns. To check if the return continuation effect for the high turnover stocks
comes from betting excessively on selected countries, we construct turnover-country-
neutral portfolios. We do this by first ranking all the stocks in each of the six
countries into three turnover-groups: low (lowest 30 percent), medium (middle 40
percent) and high (highest 30 percent). In each of the 18 turnover-country groups,
stocks are further ranked according to the past six-month performance. The Loser
portfolio consists of ten percent of stocks with the lowest past six-months
performance from each turnover-country group, while the Winner portfolio consists
of ten percent of stocks with the highest past six-months performance from each
turnover- country groups. Table 7 Panel B shows the effect of equally-weighting each
country within each turnover group (country-neutral portfolios). The highest turnover
group continues to show higher profits than the lower turnover groups. The average
profits and the corresponding standard deviations are much lower. While forming
country-neutral portfolio help to achieve lower volatility through diversification, it
also reduces the significance of the price momentum – the return to the Winner-Loser
portfolio for the highest turnover group reduces to 0.29 percent and is statistically
insignificant. Hence, the evidence suggests that the return continuation effect in the
high turnover securities does not hold across all countries. For the sake of
completeness, we also report the turnover-neutral relative strength returns for each
country. Of the six countries, only Malaysia shows a statistically significant profit of
0.56 percent. Overall average profits to the 18 turnover-country neutral portfolios are
also insignificant at 0.11 percent.

18
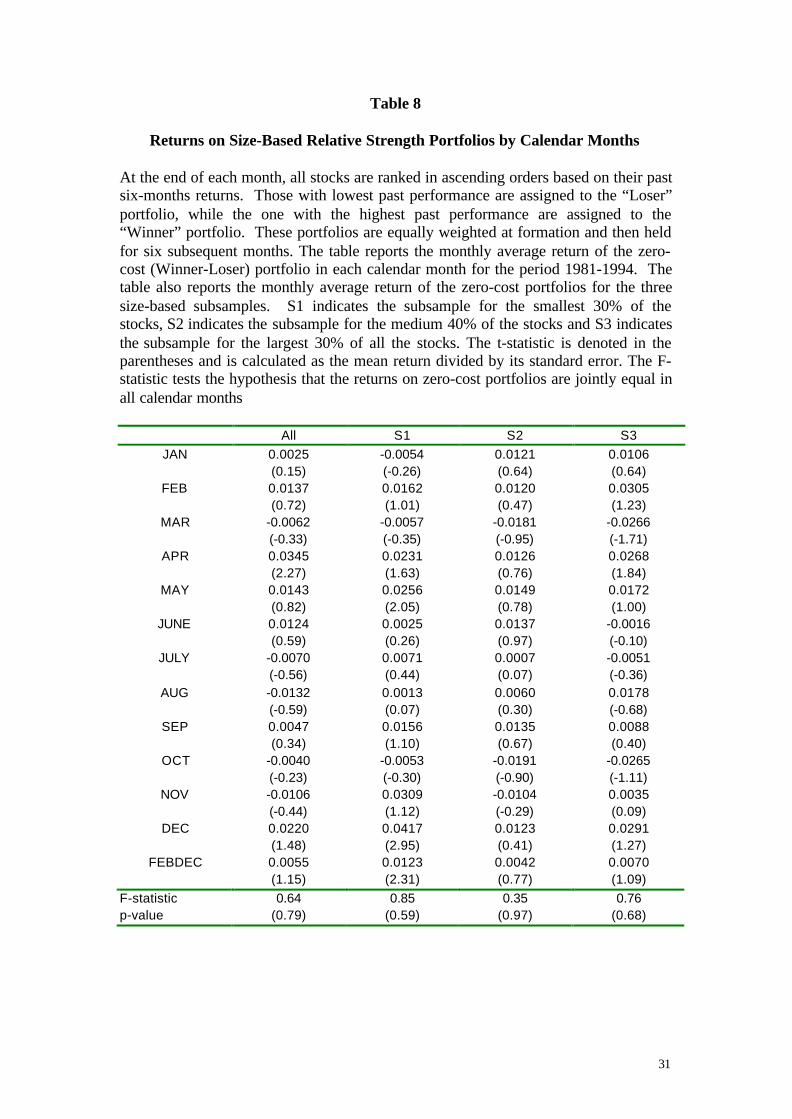
4.4 Seasonal Patterns in Relative Strength Portfolio Returns
In this section, we examine whether returns on the relative strength portfolios are
influenced by seasonal behavior in stock returns. For example, Jegadeesh and Titman
(1993) find that their relative strength portfolio returns are reduced by the price
reversals in January. Table 8 reports the breakdown of the momentum profits in each
calendar month for the size sorted sub-samples. The January effect does not exist for
the overall sample, since the average return in January is a positive 0.25 percent. 10
The average return is highest in the month of April (3.45 percent) and lowest in
August (-1.32 percent). In the size-sorted sub-samples, the patterns for the medium
and large firm samples are relatively similar to that found in the overall sample. For
the small firm sample, a slight negative (but insignificant) return in January (-0.54
percent), and a strong momentum in December (4.17 percent excess return) are
reported. Overall, the low overall relative strength excess return reported for our data
is not due to a seasonal behavior (price reversals) in any particular month. Similar
conclusion holds for the turnover-sorted portfolios, though they are not reported
here.11
5. Conclusion
This paper studies the return continuation effect in a sample of six emerging Asian
stock markets for the period 1981-1994. A regionally diversified portfolio across
these six markets consisting of long positions on past winners and short positions on
10 The proportion of positive returns in January is 60 percent, which is high, compared to the 24 percent
found by Jegadeesh and Titman (1993) for the US sample.
11 Results for turnover-sorted portfolios and on the alternative return measures (proportion of positive
returns) are available upon request.
19
past losers yields an average positive return of 0.37 percent per month over a six-
month holding period. However, the returns on the zero cost portfolio of Winner-
Loser become insignificant when we examine the post-liberalization period (1989-
1994) and when the portfolio is controlled for size or turnover effects. Interestingly,
we find significant momentum profits when the zero-cost portfolio takes on large
positions on firms that are small or are heavily traded. While past return by itself does
not predict future return, the interaction of past trading volume and past returns seem
to be related to future returns, suggesting an informational role of volume.
The lack of unrestricted price momentum indicate that either price momentum is
not pervasive across all markets or that momentum may not be detectable (low signal-
to-noise ratio) in emerging markets unless price information is used jointly with other
firm characteristics like trading volume.
20
References
Assness, Clifford, John Liew and Ross Stevens, 1996, Parallels between the cross-
sectional predictability of stock returns and country returns, working paper,
Goldman Sachs Asset Management.
Barberis, Nicolas, Andrei Shleifer, and Robert Vishny, 1998, A model of investor
sentiment, Journal of Financial Economics 49, 307-343.
Bekaert, Geert, and Campbell R. Harvey (1997), Emerging equity market volatility,
Journal of Financial Economis 43, 29-77.
Bossaerts, P. and P. Hiliion, 1998, Implementing statistical criteria to select return
forecasting models: What do we learn?, Review of Financial Studies
(forthcoming).
Chan Kalok, A. Hameed, and W. Tong, 1998, Profitability of momentum strategies in
the international equity markets, Working Paper.
Chan, Louis K.C., N. Jegadeesh, and J. Lakonishok, 1996, Momentum strategies,
Journal of Finance 51, 1681-1713.
Conrad, J., and G. Kaul, 1998, An anatomy of trading strategies, Review of Financial
Studies 11, 489-519.
Cooper, Michael, Roberto Gutierrrez and William Marcum, 1999, Finding
predictability in stock returns without the benefit of hindsight, Working paper,
Purdue University.
Daniel, Kent, David Hirshleifer and Avanidhar Subrahmanyam, 1998, Investor
psychology and security market under- and over reactions, Journal of Finance 53,
1893-1885.
Fama, Eugene F., and Kenneth R. French, 1996, Multifactor explanations of asset
pricing anomalies, Journal of Finance 51, 55-84.

21
Fama, Eugene F., 1998, Market efficiency, long-term returns, and behavioral finance,
Journal of Financial Economics 49, 283-306.
Foster, Doug, Tom Smith and Robert Whaley, 1997, Assessing goodness-of-fit of
asset pricing models: The distribution of the maximal R2, Journal of Finance 52,
591-607.
Harvey, Campbell R., 1995, Predictable risk and return in emerging markets, Review
of Financial Studies
Hong, Harrison and Jeremy Stein, 1999, A unified theory of underreaction,
momentum trading and overreaction in asset markets, forthcoming in Journal of
Finance (December 1999).
Hong, Harrison, Terence Lim, and Jeremy Stein, 1999, Bad news travels slowly: size,
analyst coverage, and the profitability of momentum strategies, forthcoming in
Journal of Finance.
Jegadeesh, N. and S. Titman, 1993, Returns to buying winners and selling losers:
Implications for stock market efficiency, Journal of Finance 48, 65-91.
Lee, Charles and Bhaskaran Swaminathan, 1998, Price momentum and trading
volume, Working paper, Cornell University.
Lo, A. and Mac Kinlay, 1990, Data snooping biases in tests of financial asset pricing
models, Review of Financial Studies 3, 431-467.
Moskowitz, Tobias J. and M. Grindblatt, Do industries explain momentum,
forthcoming in Journal of Finance (August 1999).
Odean, Terence, 1998, Volume, volatility, price, profit when all traders are above
average, Journal of Finance 53, 1887-1934.
Pesaran, M and A. Timmermann, 1995, Predictability of stock returns: Robustness
and economic significance, Journal of Finance 50, 1201-1228.

22
Richards, Anthony J., 1996, Winner-loser reversals in national stock market indices:
Can they be explained?, Journal of Finance 52, 2129-2144.
Rouwenhorst, K. Geert, 1998, International momentum strategies, ,Journal of Finance
53, 267-284.
Rouwenhorst, K. Geert, 1999, Local return factors and turnover in emerging markets,
forthcoming in Journal of Finance (August 1999).
23
Table 1
Descriptive Statistics of Sample Countries
The table reports the descriptive statistics for each sample country. The statistics in Panel A include the number of firms in the sample, thesample period, the mean and standard deviation of local currency and USD return, the mean and median size, turnover and number of daystraded in a month. Size is measured as the natural logarithm of the market value of equity in US dollars. Turnover is measured as percentage ofthe number of shares traded in a month divided by the number of shares outstanding at the beginning of the month. The median value for size,turnover and number of days traded is reported in the parenthesis. Panel B presents the returns correlations between each sample countries
Panel ANumber Sample LC return USD return Si ze Turn over Days Traded
Country of firms period Mean Std Dev Mean Std Dev Mean Median Mean Median Mean Median Hong Kong 201 Jan 1980-Dec 1994 0.0232 0.1761 0.0213 0.1614 5.98 5.74 4.41 5.02 17.20 16.45 Malaysia 244 Jan 1979-Dec 1994 0.0249 0.1578 0.0191 0.1405 5.31 5.01 4.34 5.31 21.07 20.41 Singapore 102 Jan 1979-Dec 1994 0.0177 0.1245 0.0155 0.1146 5.43 5.82 2.52 3.11 17.28 16.72 South Korea 309 Jan 1979-Dec 1994 0.0210 0.1420 0.0182 0.0957 4.71 4.35 11.97 10.04 23.45 21.52 Taiwan 92 Jan 1979-Dec 1994 0.0248 0.1828 0.0225 0.1739 5.98 5.77 36.65 42.34 16.89 18.12 Thailand 59 Jan 1979-Dec 1994 0.0218 0.1620 0.0162 0.1196 4.82 5.24 7.86 7.26 17.74 16.84

24
Panel BHong Kong Malaysia Singapore South Korea Taiwan Thailand
Hong Kong 1.00Malaysia 0.37 1.00
Singapore 0.41 0.81 1.00South Korea 0.11 0.07 0.10 1.00
Taiwan 0.27 0.22 0.21 0.08 1.00Thailand 0.44 0.38 0.40 0.07 0.35 1.00

25
Table 2
Returns of Relative Strength Decile Portfolios in Asian Stock Markets
At the end of each month, all stocks from six emerging Asian markets are ranked inascending order based on their past J-months returns into ten relative strength decileportfolios. Those with the lowest past performance (bottom 10 percent) are assignedto the “Loser” portfolio, while the one with the highest past performance (top 10percent) are assigned to the “Winner” portfolio. These portfolios are equally weightedat formation and then held for K subsequent months. The table reports the meanmonthly returns on these portfolios from 1981 to 1994. The t-statistic is the meanreturn divided by its standard error.
Ranking Period Holding Period (K)(J) Portfolio 3 6 9 123 Winner 0.0231 0.0217 0.0234 0.0221
Loser 0.0216 0.0205 0.0186 0.0154Winner-Loser 0.0014 0.0013 0.0047 0.0067(t-statistic) (0.28) (0.29) (1.34) (1.75)
6 Winner 0.0229 0.0244 0.0243 0.0227Loser 0.0213 0.0191 0.0185 0.0147Winner-Loser 0.0016 0.0053 0.0058 0.0079(t-statistic) (0.27) (1.02) (1.31) (1.64)
9 Winner 0.0248 0.0249 0.0236 0.0228Loser 0.0178 0.0187 0.0189 0.0149Winner-Loser 0.0070 0.0062 0.0047 0.0079(t-statistic) (1.18) (1.18) (1.01) (1.44)
12 Winner 0.0249 0.0235 0.0223 0.0225Loser 0.0197 0.0204 0.0204 0.0165Winner-Loser 0.0052 0.0031 0.0019 0.0060(t-statistic) (0.88) (0.57) (0.38) (0.99)
26
Table 3
Descriptive Statistics for Returns of Decile Portfolios
At the end of each month, all stocks are ranked in ascending order based on their pastsix-months returns. Those with the lowest past performance are assigned to the“Loser” portfolio, while the one with the highest past performance are assigned to the“Winner” portfolio. These portfolios are equally weighted at formation and then heldfor six subsequent months. The table reports the mean monthly buy-and-hold returnsand standard deviation of the ten decile portfolios from 1981 to 1994. The t-statisticis the mean return divided by its standard error. The average size is calculated as theaverage natural logarithm of the market value of equity of the stocks in the portfolio,in US Dollars. The F-statistic tests for equality of the average returns of the tenrelative strength decile portfolios.
Prior return decile MeanReturn
MedianReturn
StandardDeviation
AverageSize
Loser 0.0191 0.0117 0.0700 4.612 0.0176 0.0113 0.0529 4.883 0.0169 0.0113 0.0478 4.964 0.0166 0.0126 0.0424 5.155 0.0183 0.0150 0.0449 5.226 0.0194 0.0178 0.0443 5.417 0.0202 0.0201 0.0471 5.198 0.0207 0.0209 0.0496 5.149 0.0225 0.0216 0.0560 5.11
Winner 0.0244 0.0269 0.0670 5.02
Winner-Loser 0.0053 0.0693(t-statistic) (1.02)

27
Table 4
Returns of Country-Neutral Relative Strength Portfolios
At the end of each month, all stocks are ranked in ascending order based on their pastsix-months returns, relative to other stocks in the same country. Those with lowestpast performance are assigned to the “Loser” portfolio, while the one with the highestpast performance are assigned to the “Winner” portfolio. These portfolios are equallyweighted at formation and then held for six subsequent months. The monthly averagereturn and standard deviation of the zero-cost (Winner-Loser) internationallydiversified relative strength portfolios are for the sample period 1981-1994. The t-statistic is the mean return divided by its standard error.
Portfolio Mean Std Dev t-statisticAll stocks (country-neutral) 0.0037 0.0216 2.30By country: Hong Kong 0.0021 0.0412 0.65 Malaysia 0.0019 0.0443 0.58 Singapore 0.0051 0.0458 1.50 South Korea 0.0041 0.0482 1.15 Taiwan 0.0061 0.0750 1.09 Thailand 0.0022 0.0460 0.72

28
Table 5
Returns on Size-Based Relative Strength Decile Portfolios
At the end of each month, all stocks are ranked in ascending orders based on their pastsix-months returns. Those with lowest past return performance are assigned to P1,while the stocks with the next past-return performance deciles P2 and so on. Theseportfolios are equally weighted at formation and then held for 6 subsequent months.The table reports the monthly average return of the ten decile portfolios as well as thezero-cost (P10-P1) portfolio for the period 1981-1994. The table also reports themonthly average return of the portfolios for the three size-based subsamples. S1indicates the subsample for the smallest 30% of the stocks, S2 indicates the subsamplefor the medium 40% of the stocks and S3 indicates the subsample for the largest 30%of all the stocks. The t-statistic is denoted in the parentheses and is calculated as themean return divided by its standard error.
All S1 S2 S3P1 0.0191 0.0071 0.0179 0.0174
(3.66) (1.28) (3.11) (2.66)P2 0.0176 0.0123 0.0163 0.0158
(4.47) (3.15) (4.34) (3.53)P3 0.0169 0.0127 0.0161 0.0150
(4.75) (3.43) (4.31) (3.64)P4 0.0166 0.0108 0.0178 0.0176
(5.25) (3.37) (5.12) (4.47)P5 0.0183 0.0190 0.0201 0.0198
(5.48) (3.33) (4.15) (4.59)P6 0.0194 0.0142 0.0188 0.0225
(5.86) (4.12) (4.78) (3.77)P7 0.0202 0.0161 0.0210 0.0200
(5.74) (3.86) (4.19) (4.48)P8 0.0207 0.0215 0.0192 0.0230
(5.61) (3.51) (4.82) (4.90)P9 0.0225 0.0216 0.0186 0.0243
(5.39) (4.56) (4.42) (4.82)P10 0.0244 0.0192 0.0222 0.0242
(4.88) (4.06) (4.13) (4.21)P10-P1 0.0053 0.0121 0.0043 0.0068
(1.02) (2.48) (0.070) (1.07)
29
Table 6
Returns of Country-Size-Neutral Relative Strength Portfolios
At the end of each month, all stocks are ranked in ascending order based on their pastsix-months returns, relative to other stocks in the same size-country group. Those withlowest past performance are assigned to the “Loser” portfolio, while the one with thehighest past performance are assigned to the “Winner” portfolio. These portfolios areequally weighted at formation and then held for six subsequent months. The monthlyaverage return and standard deviation of the zero-cost (Winner-Loser) internationallydiversified relative strength portfolios are for the sample period 1981-1994. Thestocks in each country are assigned into size groups relative to other stocks in thesame country. Small corresponds to the bottom 30%, medium corresponds to themiddle 40% and large corresponds to the largest 30%. The t-statistic is the meanreturn divided by its standard error.
Portfolio Mean Std Dev t-statisticAll-stocks (size-country-neutral) 0.0019 0.0170 1.53
Size-neutral country portfolios: Hong Kong 0.0011 0.0537 0.26 Malaysia 0.0006 0.0311 0.25 Singapore -0.0012 0.0356 -0.45 South Korea 0.0014 0.0236 0.80 Taiwan 0.0084 0.0515 2.19 Thailand 0.0010 0.0438 0.76
Country-neutral size portfolios: Small 0.0046 0.0326 1.89 Medium 0.0015 0.0217 0.95 Large -0.0003 0.0239 -0.19

30
Table 7
Returns of Turnover-Neutral and Country-Turnover-Neutral Relative StrengthPortfolios
At the end of each month, all stocks are ranked in ascending order based on their pastsix-months returns, relative to turnover group (Panel A) and turnover-country group(Panel B). Small corresponds to the bottom 30%, medium corresponds to the middle40% and large corresponds to the largest 30%. Those with lowest past performanceare assigned to the “Loser” portfolio, while the one with the highest past performanceare assigned to the “Winner” portfolio. These portfolios are equally weighted atformation and then held for six subsequent months. Each panel reports the monthlyaverage return and standard deviation of the zero-cost (Winner-Loser) internationallydiversified relative strength portfolios for the sample period 1981-1994. The t-statisticis the mean return divided by its standard error.
Portfolio Mean Std Dev t-statistic Panel A: Turnover-Neutral Momentum StrategiesAll-stocks (turnover-neutral) 0.0050 0.0514 1.23
By turnover-group: Smallest 0.0052 0.0505 1.28 Medium -0.0012 0.0570 -0.27 Largest 0.0112 0.0660 2.12 Panel B: Turnover-Country-Neutral Momentum StrategiesAll-stocks (turnover-country-neutral) 0.0011 0.0181 0.82
Turnover-neutral country portfolios: Hong Kong 0.0018 0.0647 0.35 Malaysia 0.0056 0.0221 3.38 Singapore 0.0008 0.0291 0.39 South Korea 0.0026 0.0200 1.78 Taiwan 0.0018 0.0457 0.53 Thailand -0.0047 0.0561 -1.13
Country-neutral turnover portfolios: Small 0.0006 0.0294 0.28 Medium 0.0004 0.0195 0.29 Large 0.0029 0.0316 1.25
31
Table 8
Returns on Size-Based Relative Strength Portfolios by Calendar Months
At the end of each month, all stocks are ranked in ascending orders based on their pastsix-months returns. Those with lowest past performance are assigned to the “Loser”portfolio, while the one with the highest past performance are assigned to the“Winner” portfolio. These portfolios are equally weighted at formation and then heldfor six subsequent months. The table reports the monthly average return of the zero-cost (Winner-Loser) portfolio in each calendar month for the period 1981-1994. Thetable also reports the monthly average return of the zero-cost portfolios for the threesize-based subsamples. S1 indicates the subsample for the smallest 30% of thestocks, S2 indicates the subsample for the medium 40% of the stocks and S3 indicatesthe subsample for the largest 30% of all the stocks. The t-statistic is denoted in theparentheses and is calculated as the mean return divided by its standard error. The F-statistic tests the hypothesis that the returns on zero-cost portfolios are jointly equal inall calendar months
All S1 S2 S3JAN 0.0025 -0.0054 0.0121 0.0106
(0.15) (-0.26) (0.64) (0.64)FEB 0.0137 0.0162 0.0120 0.0305
(0.72) (1.01) (0.47) (1.23)MAR -0.0062 -0.0057 -0.0181 -0.0266
(-0.33) (-0.35) (-0.95) (-1.71)APR 0.0345 0.0231 0.0126 0.0268
(2.27) (1.63) (0.76) (1.84)MAY 0.0143 0.0256 0.0149 0.0172
(0.82) (2.05) (0.78) (1.00)JUNE 0.0124 0.0025 0.0137 -0.0016
(0.59) (0.26) (0.97) (-0.10)JULY -0.0070 0.0071 0.0007 -0.0051
(-0.56) (0.44) (0.07) (-0.36)AUG -0.0132 0.0013 0.0060 0.0178
(-0.59) (0.07) (0.30) (-0.68)SEP 0.0047 0.0156 0.0135 0.0088
(0.34) (1.10) (0.67) (0.40)OCT -0.0040 -0.0053 -0.0191 -0.0265
(-0.23) (-0.30) (-0.90) (-1.11)NOV -0.0106 0.0309 -0.0104 0.0035
(-0.44) (1.12) (-0.29) (0.09)DEC 0.0220 0.0417 0.0123 0.0291
(1.48) (2.95) (0.41) (1.27)FEBDEC 0.0055 0.0123 0.0042 0.0070
(1.15) (2.31) (0.77) (1.09)F-statistic 0.64 0.85 0.35 0.76p-value (0.79) (0.59) (0.97) (0.68)