momentum or contrarian? some suggestions to the investors. ( 初稿 ) 亞洲大學財務金融學系...
TRANSCRIPT

Momentum or contrarian?
Some suggestions to the investors.(初稿 )
亞洲大學財務金融學系助理教授 王癸元

•學歷▫國立台灣科技大學企業管理所博士 ( 主修財務金
融 )▫國立中正大學企業管理所碩士 ( 主修財務金融 )▫輔仁大學企業管理學系
•經歷▫亞洲大學財務金融學系 講師▫臺中健康暨管理學院財務金融學系 講師▫致理技術學院企業管理學系兼任講師▫秋雨物流股份有限公司副主任▫秋雨物流股份有限公司專員
•專長▫行為財務學 投資管理 ▫公司治理 一般管理

•期刊論文▫ Wang, Kuei-yuan, Cheng-Yi Chien and Yen-Sheng Huang (Jan. 2010),
“Relative strength and momentum profits,” Journal of Statistics & Management Systems, vol. 13 (1), pp.59-75. (EI)
▫ Wang, Kuei-yuan, Su-Chun Peng, Yen-Sheng Huang (Oct. 2009), “The intraday performance of contrarian strategies: Evidence from the Taiwan Stock Exchange,” Review of Pacific Basin Financial Markets and Policies, vol. 12 (4), pp.655-674. (FLI) ( 國科會 B 級期刊 )
▫ Wang, Kuei-yuan, Ching-Hai Jiang and Yen-Sheng Huang (Jan 2009), “Market states and the profitability of momentum strategies: Evidence from the Taiwan Stock Exchange,” The International Journal of Business and Finance Research, vol. 3 (1), pp.89-102. (ECONLIT)
▫ Liu, Yu-lun, Kuei-yuan Wang, Su-Chun Peng and Yen-Sheng Huang (Sep. 2008), “The performance of the contrarian strategy and the momentum strategy in the Asia pacific region”, International Journal of Finance, vol. 20 (3), pp.4863-4883. (FLI) ( 國科會 B+ 級期刊 )
▫ Jiang, Ching-hai, Kuei-yuan Wang and Yen-sheng Huang (May 2008), “Managerial ownership, capital expenditures and firm performance: Evidence from the Taiwan Stock Exchange,” Corporate ownership & control, vol. 5 (4), pp.418-426. (Leading paper)
▫ Su-Chun Peng, Kuei-yuan Wang and Yen-Sheng Huang (Oct. 2007), “International Cross-listings, Valuation Effects, and Company Characteristics: Evidence from Taiwan”, Journal of Emerging Markets, vol. 12 (3), pp.7-20. (ECONLIT) (Leading paper)
•Working paper▫ 企業資訊透明度、投資者的異質性信念對動能績效影響之研究 ( 國
科會計畫,執行期間: 2010.08.01~2011.07.31)▫ Do short-term momentum profits hold under the market
diffusion of herd behavior?▫ The influence of pessimistic media coverage following
bear market and the dynamic media coverage amount on momentum profits
•Honors▫ 亞洲大學九十八學年度服務學習課程優良教師 ( 校級 )▫ 亞洲大學九十五學年度優良教學獎 ( 校級 )▫ 亞洲大學九十五學年度院級優良導師獎▫ 亞洲大學九十三學年度優良導師獎 ( 校級 )▫ 黃德舜、王癸元( 2002 ),「技術創新、智慧資本與企業股東附
加價值關係研究」,第一屆中華民國企業評價研討會,中華民國企業評價協會 主辦,頁 23-38 。(大會優良論文獎)

Over-confident
Delayed reaction
Price continue
Momentum strategy
Under-confident
Over-reaction
Price reverse
Momentum strategy

Contrarian strategy•Over-reaction Hypothesis
▫De Bondt and Thaler (1985)▫investors tend to overreact to new
information. Such overreaction will be corrected in subsequent periods
▫They rank firms on the basis of prior 3-year returns and find that prior winners tend to underperform the market, while prior losers tend to outperform the market
•Buy the prior losers and sell the prior winners will generate excess return

Momentum strategy
•Jegadeesh and Titman (1993, 1995, 1997, 2001)
•Buy the prior winners and sell the prior losers will generate excess return

The reconciliation of the momentum and contrarian strategies•Daniel, Hisrhleifer and Subrahmanyam
(1998)•Conrad and Kaul (1998)•Hong and Stein (1999)•Bhojraj and Swaminathan (2006)

Introduce my series studies about momentum strategies
•international market vs. momentum•length of time horizons vs. momentum•Relative strength vs. momentum•Market state vs. momentum•Herd behavior vs. momentum
International market vs. Momentum strategy
• Liu, Yu-lun, Kuei-yuan Wang, Su-Chun Peng and Yen-Sheng Huang (Sep. 2008), “The performance of the contrarian strategy and the momentum strategy in the Asia pacific region”, International Journal of Finance, vol. 20 (3), pp.4863-4883. (FLI) ( 國科會 B+ 級期刊 )

•Bhojraj and Swaminathan (2006)▫They examine the return predictability in
international equity indices. ▫They argue that stock prices initially
underreact to information. Then stock prices rise toward their fundamental value and result in a pattern of price momentum.
▫As stock prices continue to rise above their fundamental value, subsequent price reversals will occur.

Table 1. Average cumulative abnormal returns (CARs, in %) for the 49 trading strategies in the Asia Pacific Region
Formation period J Holding period q (month)
(month) 1 3 6 9 12 24 36
1-0.0263 -0.0088 -0.0124 0.0165 0.0101 -0.0064 -0.0032
(0.7137) (0.4331) (0.6194) (0.7855) (0.6123) (0.5762) (0.6302)
3-0.0280 -0.0476 0.0028 0.0495 0.0152 -0.0216 -0.0075
(0.4126) (0.7791) (0.0447) (0.8008) (0.3738) (0.7268) (0.5311)
6-0.0714 0.0102 0.1115 0.1053 0.0421 -0.0126 0.0033
(0.5103) (0.0786) (0.8527) (1.1641) (0.6445) (0.3073) (0.1460)
90.1334 0.1627 0.1646 0.0989 0.0613 -0.0400 -0.0109
(0.5420) (0.7090) (1.0460) (1.1522) (0.6516) (0.6952) (0.3172)
120.1167 0.1055 0.0567 0.0277 -0.0014 -0.1094 -0.0528
(0.3467) (0.4253) (0.4748) (0.3518) (0.0158) (1.2642) (0.9883)
24-0.2452 -0.3517 -0.3321 -0.3396 -0.3332 -0.1454 -0.1230
(0.9566) (1.7906)* (1.6582) * (1.6330) (1.6761)* (1.4750) (1.4986)
36-0.1236 -0.0468 0.0167 0.0158 -0.0179 -0.0214 0.0592
(0.6515) (0.2913) (0.1437) (0.1686) (0.2161) (0.4790) (0.9816)

Table 2. Average cumulative abnormal returns (CARs, in %) for the 49 trading strategies of developed markets in the Asia Pacific Region
Formation period J Holding period q (month)
(month) 1 3 6 9 12 24 36
10.0004 -0.0048 -0.0052 -0.0004 -0.0004 0.0043 0.0044
(-0.0313) (0.7266) (1.0286) (0.0987) (0.1201) (1.2610) (1.7390)*
3-0.0149 -0.0258 -0.0059 -0.0008 -0.0027 0.0113 0.0130
(0.7340) (1.5171) (0.4667) (0.0770) (0.2844) (1.3261) (1.9176)*
6-0.0342 -0.0122 0.0043 0.0036 0.0031 0.0275 0.0290
(1.0210) (0.4621) (0.2287) (0.2333) (0.2257) (2.0339)** (2.3265)**
9-0.0069 -0.0049 0.0031 0.0056 0.0154 0.0352 0.0428
(0.1771) (0.1544) (0.1355) (0.2750) (0.8167) (1.9580)* (2.5285)**
12-0.0178 -0.0119 0.0049 0.0207 0.0394 0.0440 0.0537
(0.3714) (0.3067) (0.1664) (0.7994) (1.4894) (1.9883)** (2.7923)***
240.0613 0.0513 0.0615 0.0521 0.0551 0.0660 0.0722
(0.6621) (0.6717) (1.0804) (1.1417) (1.3333) (2.4503)** (3.2328)***
360.0435 0.0387 0.0622 0.0767 0.0629 0.0655 0.0964
(0.3343) (0.3437) (0.7093) (1.0741) (1.2473) (2.5623)** (3.1773)***

Table 3. Average cumulative abnormal returns (CARs, in %) for the 49 trading strategies of developing markets in the Asia Pacific Region
Formation period J Holding period q (month)
(month) 1 3 6 9 12 24 36
1-0.0429 -0.0073 -0.0146 0.0256 0.0145 -0.0129 -0.0073
(0.8348) (0.2738) (0.5363) (0.8527) (0.6310) (0.7867) (0.9414)
3-0.0180 -0.0328 0.0093 0.0502 0.0150 -0.0263 -0.0131
(0.3047) (0.5981) (0.1630) (0.8513) (0.4006) (0.8835) (0.9029)
6-0.0544 0.0240 0.1122 0.0820 0.0410 -0.0230 -0.0093
(0.4396) (0.2055) (0.9219) (0.9471) (0.6879) (0.5705) (0.3991)
90.1357 0.1633 0.1589 0.0945 0.0559 -0.0546 -0.0292
(0.6054) (0.7704) (1.0926) (1.2252) (0.6433) (0.9306) (0.8009)
120.1096 0.1071 0.0551 0.0191 -0.0144 -0.1291 -0.0745
(0.3553) (0.4680) (0.5082) (0.2635) (0.1705) (1.4168) (1.2872)
24-0.2505 -0.3474 -0.3451 -0.3622 -0.3590 -0.1691 -0.1397
(1.0255) (1.7994)* (1.6251) (1.5988) (1.6731)* (1.5440) (1.6436)
36-0.1225 -0.0521 0.0025 -0.0009 -0.0233 -0.0258 0.0324
(0.7436) (0.3834) (0.0252) (0.0110) (0.3102) (0.6032) (0.6106)

Table 4. The seasonal effect of the contrarian strategy for the whole and the developing markets (unit: %)
StrategyPerforman
ceJan. Feb. Mar. Apr. May June July Aug. Sep. Oct. Nov. Dec.
WholeMarket
(24,3)
-0.3517 0.15 1.92 -1.13 2.11 0.46 1.89 1.67 0.58 1.23 1.24 1.40 1.29
(1.7906)* (-0.31) (0.72) (1.91)* (0.79) (0.57) (1.39) (1.06) (0.85) (1.04) (2.23)** (2.28)**(3.12) ***
(24,6)-0.3321 1.86 2.03 0.03 4.30 1.21 4.13 3.47 2.15 1.76 1.46 1.29 0.21
(1.6582)* (0.69) (0.65) (0.02) (0.91) (1.24) (1.23) (1.40) (1.68) (1.60) (1.33) (0.97) (0.21)
(24,12)
-0.3332 6.26 6.00 3.00 7.87 5.23 5.29 5.21 2.10 1.56 0.26 0.70 3.75
(1.6761)* (1.14) (1.04) (1.20) (1.12) (1.29) (1.19) (1.15) (1.23) (1.01) (0.23) (0.60) (1.54)
DevelopingMarket
(24,3)-0.3474 -0.06 1.51 -1.04 2.18 0.40 1.73 1.73 0.82 1.65 1.35 1.46 0.93
(1.7994)* (0.16) (0.64 ) (1.93)* (0.82) (0.53) (1.37) (0.99) (1.20) (1.04) (2.10)* (2.59)** (2.41)**
(24,12)
-0.3590 6.48 6.30 3.46 8.42 5.66 5.33 5.20 2.44 1.95 0.67 1.03 4.01
(1.6731)* (1.09) (1.04) (1.18) (1.12) (1.25) (1.14) (1.08) (1.21) (0.97) (0.54) (1.00) (1.37)

Table 5. The seasonal effect of momentum strategy for the developed markets (unit: %)
StrategyPerforman
ceJan. Feb. Mar. Apr. May June July Aug. Sep. Oct. Nov. Dec.
Developed Market
(1,36)0.0044 -0.07 0.58 0.35 -0.05 -0.05 0.23 0.36 0.14 0.18 -0.18 0.42 -0.05
(1.739)* (0.11)(2.28)*
*(0.89) (0.35) (0.22) (0.54) (1.35) (0.62) (0.79) (0.39) (0.88) (0.21)
(3,36)0.0130 0.48 0.45 0.49 0.70 0.35 0.08 0.45 0.70 0.66 0.31 0.68 0.27
(1.918)* (0.61) (0.61) (0.81) (1.12) (0.60) (0.12) (0.55) (0.86) (1.38) (1.69) (1.88)* (0.89)
(6,24)0.0275 0.59 0.99 0.75 0.54 0.47 0.04 1.00 0.51 0.49 0.93 0.97 0.64
(2.0339)** (0.80) (1.67) (1.28) (1.08) (1.00) (0.05) (1.10) (0.52) (0.70) (1.67) (1.31) (0.87)
(6,36)0.0290 1.07 1.46 1.30 0.79 0.56 0.11 1.06 0.97 1.09 1.31 1.52 1.29
(2.3265)** (1.20)(2.35)*
*(1.96)* (1.11) (0.76) (0.09) (0.82) (0.75) (1.22) (1.65) (1.41) (1.40)
(9,24)0.0352 0.98 1.43 1.03 0.75 0.67 0.23 -0.21 0.50 0.74 1.59 1.22 0.75
(1.9580)* (0.77) (1.31) (1.33) (1.40) (0.96) (0.32) (-0.24) (0.50) (0.77) (1.61) (1.16) (0.75)
(9,36)0.0428 1.79 2.14 1.87 1.20 1.38 0.94 0.92 0.86 0.96 2.50 2.11 1.78
(2.5285)** (1.15) (1.56) (1.82)* (1.58) (1.37) (0.79) (0.68) (0.71) (0.78) (1.54) (1.34) (1.36)
(12,24)0.0440 1.35 1.73 1.46 1.29 1.17 0.50 0.36 0.73 0.84 1.30 1.09 0.87
(1.9883)** (0.83) (1.22) (1.40) (1.56) (1.18) (0.71) (0.38) (0.66) (0.79) (1.34) (1.16) (0.59)
(12,36)0.0537 3.25 2.76 2.35 1.97 2.01 1.25 1.44 1.61 1.73 1.76 1.61 1.35
(2.7923)***
(1.27) (1.45) (1.63) (1.66) (1.25) (0.86) (1.09) (1.21) (1.38) (1.41) (1.52) (1.23)
(24,24)0.0660 2.65 2.50 2.33 2.07 1.86 0.96 1.02 1.33 1.68 1.32 1.02 0.08
(2.4503)** (1.05) (1.27) (1.53) (1.69) (1.38) (0.99) (0.80) (0.93) (1.15) (1.66) (2.02)* (0.12)
(24,36)0.0722 3.19 3.48 3.26 2.92 2.79 1.84 1.74 2.12 2.93 2.36 2.41 2.07
(3.2328)***
(1.41) (1.64) (1.69) (1.82)* (1.46) (1.14) (1.09) (1.27) (1.52) (1.55) (1.72) (1.77)
(36,24)0.0655 1.27 2.03 2.17 2.19 2.07 1.36 1.12 1.13 1.96 1.64 1.43 0.41
(2.5623)** (1.65) (2.02)* (1.85)* (2.07)* (1.37) (0.79) (0.68) (0.78) (1.21) (1.65)(2.29)*
*(0.31)
(36,36)0.0964 4.32 4.05 3.79 4.19 3.65 2.93 3.31 3.09 4.15 2.88 2.74 2.34
(3.1773)***
(1.57) (1.63) (1.66) (1.81) (1.45) (1.16) (1.27) (1.27) (1.49) (1.73)(2.51)*
*(2.66)**
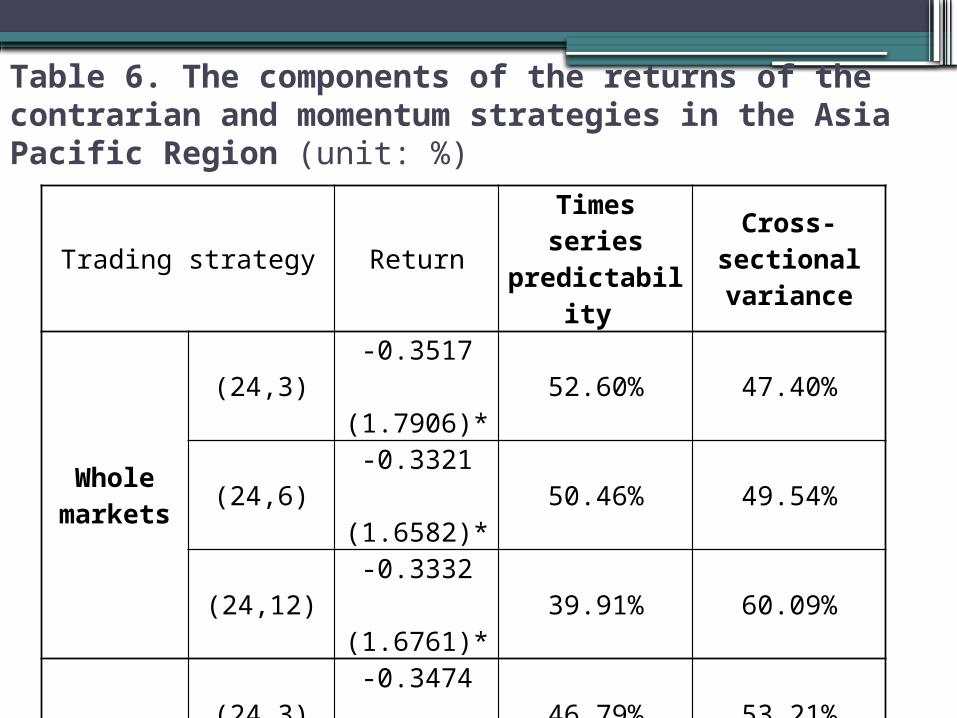
Table 6. The components of the returns of the contrarian and momentum strategies in the Asia Pacific Region (unit: %)
Trading strategy ReturnTimes series
predictability Cross-sectional
variance
Whole markets
(24,3)-0.3517
52.60% 47.40% (1.7906)*
(24,6)-0.3321
50.46% 49.54% (1.6582)*
(24,12)-0.3332
39.91% 60.09% (1.6761)*
Developing markets
(24,3)-0.3474
46.79% 53.21% (1.7994)*
(24,12)-0.3590
36.00% 64.00% (1.6731)*

continued
Developed markets
(6,24)0.0275
10.21% 89.79% (2.0339)**
(9,24)0.0352
-6.18% 106.18%(1.9580)*
(12,24)0.0440
-16.51% 116.51% (1.9883)**
(24,24)0.0660
-59.08% 159.08% (2.4503)**
(36,24)0.0655
-128.90% 228.90% (2.5623)**
(1,36)0.0044
8.30% 91.70% (1.7390)*
(3,36)0.0130
7.64% 92.36%(1.9176)*
(6,36)0.0290
19.13% 80.87% (2.3265)**
(9,36)0.0428
17.18% 82.82% (2.5285)**
(12,36)0.0537
9.27% 90.73% (2.7923)***
(24,36)0.0722
-38.49% 138.49% (3.2328)***
(36,36)0.0964
-48.17% 148.17% (3.1773)***

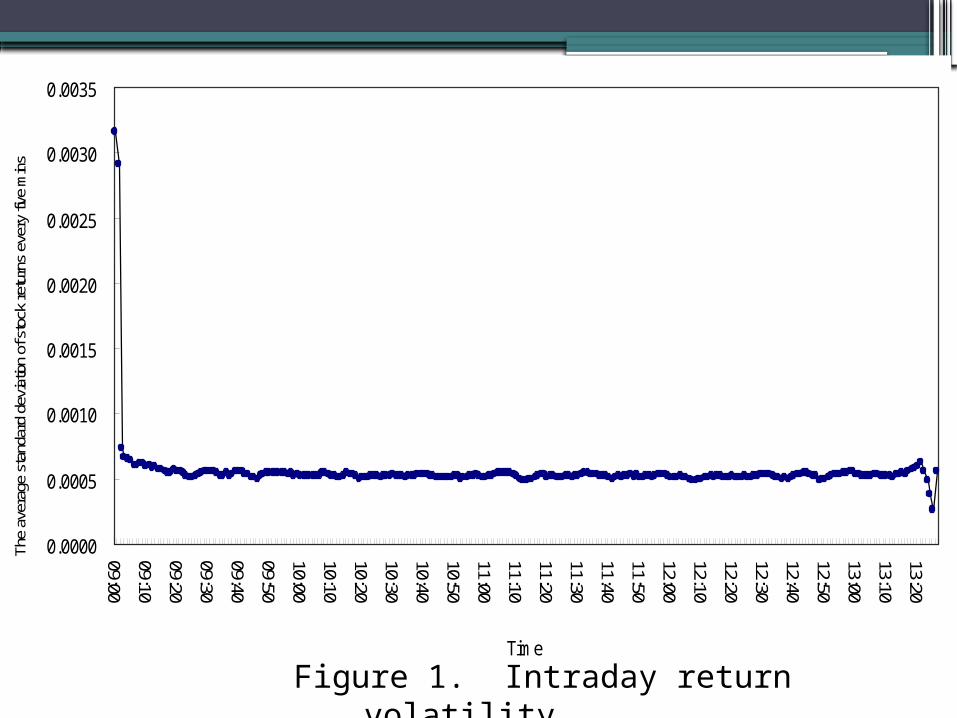
The length of time horizons vs. Momentum strategy
Wang, Kuei-yuan, Su-Chun Peng, Yen-Sheng Huang (Oct. 2009), “The intraday performance of contrarian strategies: Evidence from the Taiwan Stock Exchange,” Review of Pacific Basin Financial Markets and Policies, vol. 12 (4), pp.655-674. (FLI) ( 國科會 B 級期刊 )

)( ,,, tmtiti RRAR
OBS
s
Lkj
Lskj
Lkj OBSARAAR
1,,,, /
OBS
s
Wkj
Wskj
Wkj OBSARAAR
1,,,, /
)( ,,,Lkj
Wkjkj AARAARAAR
)(/)( ,,, KJKJKJ AARsAARAARt
)/1()/1()()( ,,,,Lkj
WkjKJpooledKJ OBSOBSARsAARs
)2/(])1()1[()( ,,2
,,,2
,,,, Lkj
WkjkjL
LkjkjW
WkjKJpooled OBSOBSSOBSSOBSARs
OBS
s
Wkj
Wkj
WskjkjW OBSAARARS
1,
2,,,
2,, )1/()(
OBS
s
Lkj
Lkj
LskjkjL OBSAARARS
1,
2,,,
2,, )1/()(
0.0000
0.0005
0.0010
0.0015
0.0020
0.0025
0.0030
0.0035
09:00
09:10
09:20
09:30
09:40
09:50
10:00
10:10
10:20
10:30
10:40
10:50
11:00
11:10
11:20
11:30
11:40
11:50
12:00
12:10
12:20
12:30
12:40
12:50
13:00
13:10
13:20
Time
The
aver
age
stan
dard
dev
iatio
n of
sto
ck re
turn
s ev
ery
five
min
s
Figure 1. Intraday return volatility.
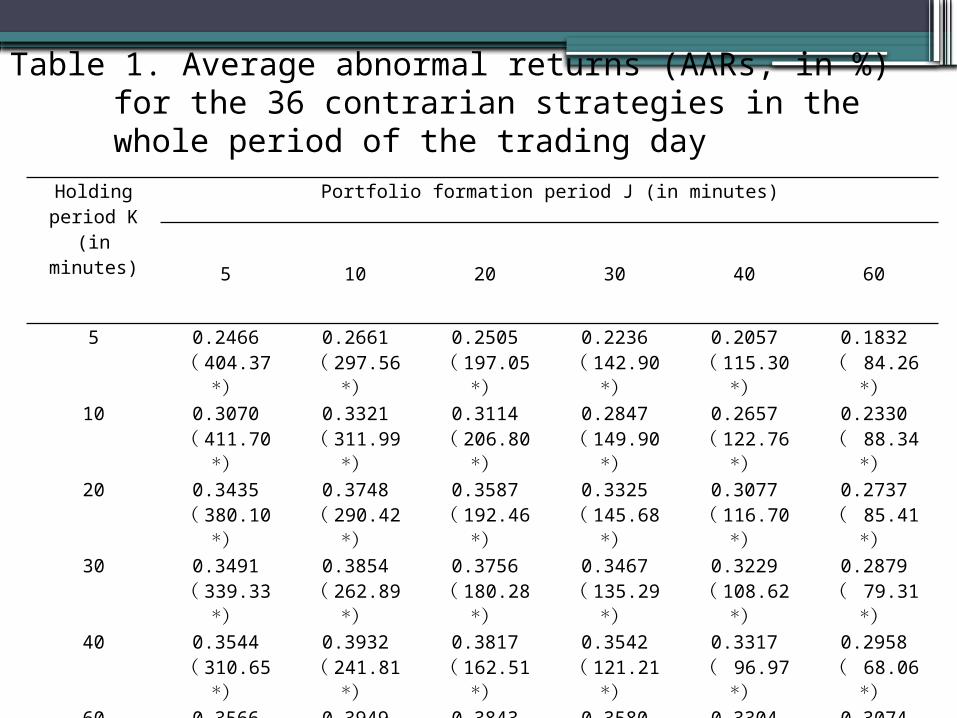
Holding period K
(in minutes)
Portfolio formation period J (in minutes)
5 10 20 30 40 60
5 0.2466( 404.37
*)
0.2661( 297.56
*)
0.2505( 197.05
*)
0.2236( 142.90
*)
0.2057( 115.30
*)
0.1832( 84.26
*)10 0.3070
( 411.70 *)
0.3321( 311.99
*)
0.3114( 206.80
*)
0.2847( 149.90
*)
0.2657( 122.76
*)
0.2330( 88.34
*)20 0.3435
( 380.10 *)
0.3748( 290.42
*)
0.3587( 192.46
*)
0.3325( 145.68
*)
0.3077( 116.70
*)
0.2737( 85.41
*)30 0.3491
( 339.33 *)
0.3854( 262.89
*)
0.3756( 180.28
*)
0.3467( 135.29
*)
0.3229( 108.62
*)
0.2879( 79.31
*)40 0.3544
( 310.65 *)
0.3932( 241.81
*)
0.3817( 162.51
*)
0.3542( 121.21
*)
0.3317( 96.97
*)
0.2958( 68.06
*)60 0.3566
( 263.41 *)
0.3949( 205.16
*)
0.3843( 162.51
*)
0.3580( 106.92
*)
0.3304( 84.18
*)
0.3074( 62.11
*)
Table 1. Average abnormal returns (AARs, in %) for the 36 contrarian strategies in the whole period of the trading day

Holding period K
(in minutes)
Portfolio formation period J (in minutes)
5 10 20
50.2860
( 98.28 *)0.2806
( 60.57 *)0.1938
( 31.78 *)
100.3838
( 94.97 *)0.3650
( 65.73 *)0.2599
( 35.12 *)
200.3821
( 53.99 *)0.3194
( 32.90 *) -
Table 2. Average abnormal returns (AARs, in %) for the contrarian strategies in the opening period 9:00 a.m.-9:30 a.m. of the trading day

Holding period K
(in minutes)
Portfolio formation period J (in minutes)
5 10 20 30 40 60
5 0.2443( 403.05
*)
0.2612( 292.86
*)
0.2279( 180.34
*)
0.2291( 144.03
*)
0.1722( 94.38
*)
0.1276( 55.67
*)10 0.2959
( 396.38 *)
0.3249( 298.43
*)
0.2820( 177.65
*)
0.2906( 150.27
*)
0.2200( 99.22
*)
0.1631( 57.38
*)20 0.3339
( 365.38 *)
0.3709( 278.74
*)
0.3299( 173.84
*)
0.3379( 145.54
*)
0.2592( 95.83
*)
0.1886( 54.78
*)30 0.3423
( 326.55 *)
0.3835( 251.76
*)
0.3358( 150.58
*)
0.3556( 135.14
*)
0.2510( 86.53
*)
0.1955( 50.35
*)40 0.3465
( 295.43 *)
0.3909( 229.38
*)
0.3412( 140.23
*)
0.3651( 121.30
*)
0.2575( 80.05
*)
0.1988( 46.90
*)60 0.3517
( 248.09 *)
0.3973( 192.91
*)
0.3381( 115.37
*)
0.3792( 101.40
*)
0.2597( 62.48
*)
0.1650( 62.11
*)
Table 3. Average abnormal returns (AARs, in %) for the 36 contrarian strategies in the middle period 9:30 a.m.-1:15 p.m. of the trading day

Holdingperiod K
(in minutes)
Portfolio formation period J (in minutes)
5
5 0.1751( 58.19 *)
10 0.3502( 59.68 *)
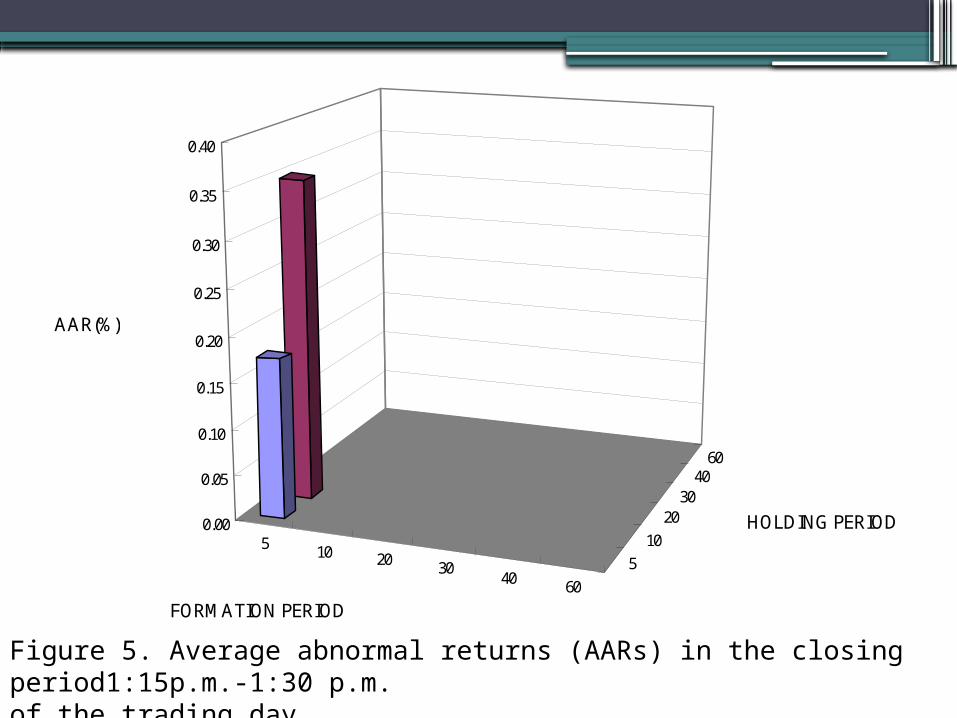
Table 4. Average abnormal returns (AARs, in %) for the contrarian strategies in the closing period 1:15 p.m.-1:30 p.m. of the trading day

5 10 20 30 4060
5
10
2030
4060
0.00
0.05
0.10
0.15
0.20
0.25
0.30
0.35
0.40
AAR(%)
FORMATION PERIOD
HOLDING PERIOD
Figure 2. Average abnormal returns (AARs) in the whole period of the trading day.

5 10 20 30 40 605
1020
3040
60
0.00
0.05
0.10
0.15
0.20
0.25
0.30
0.35
0.40
AAR(%)
FORMATION PERIOD
HOLDING PERIOD
Figure 3. Average abnormal returns (AARs) in the openng period 9:00 a.m-9:30 a.m. of the trading day.

5 10 20 3040 60
5
1020
3040
60
0.00
0.05
0.10
0.15
0.20
0.25
0.30
0.35
0.40
AAR(%)
FORMATION PERIOD
HOLDING PERIOD
Figure 4. Average abnormal returns (AARs) in the middle period 9:30 a.m.-1:15 p.m. of the trading day.
5 10 20 3040 60
5
10
2030
4060
0.00
0.05
0.10
0.15
0.20
0.25
0.30
0.35
0.40
AAR(%)
FORMATION PERIOD
HOLDING PERIOD
Figure 5. Average abnormal returns (AARs) in the closing period1:15p.m.-1:30 p.m. of the trading day.

K(in
minutes)
Portfolio formation period J (in minutes)
5 10 20 30 40 60
L W P L W P L W P L W P L W P L W P
5 0.12 -0.13 0.25 0.13 -0.13 0.27 0.13 -0.12 0.25 0.11 -0.11 0.22 0.10 -0.10 0.21 0.09 -0.09 0.18
10 0.145 -0.16 0.31 0.16 -0.17 0.33 0.15 -0.16 0.31 0.14 -0.14 0.28 0.13 -0.14 0.27 0.12 -0.11 0.23
20 0.156 -0.19 0.34 0.17 -0.20 0.37 0.17 -0.19 0.36 0.15 -0.18 0.33 0.14 -0.17 0.31 0.13 -0.15 0.27
30 0.15 -0.20 0.35 0.17 -0.22 0.39 0.17 -0.21 0.38 0.15 -0.20 0.35 0.14 -0.18 0.32 0.13 -0.16 0.29
40 0.14 -0.21 0.35 0.16 -0.23 0.39 0.16 -0.22 0.38 0.15 -0.21 0.35 0.13 -0.20 0.33 0.12 -0.18 0.30
60 0.13 -0.23 0.36 0.15 -0.25 0.39 0.14 -0.24 0.38 0.13 -0.23 0.36 0.11 -0.22 0.33 0.11 -0.20 0.31
Table 5. Decomposition of AARs (in %) for the 36 contrarian strategies in the whole period of the trading day

Relative strength vs. momentumWang, Kuei-yuan, Cheng-Yi Chien and Yen-Sheng Huang
(Jan. 2010), “Relative strength and momentum profits,” Journal of Statistics & Management Systems, vol. 13 (1), pp.59-75. (EI)

•The definition of relative strength is followed by Levy (1967).
•The relative strength indicator (RSIt) is calculated as the ratio of the price at the end of the formation period (Pt) to the average price in the formation period (APt) as follow:
t
tt AP
PRSI
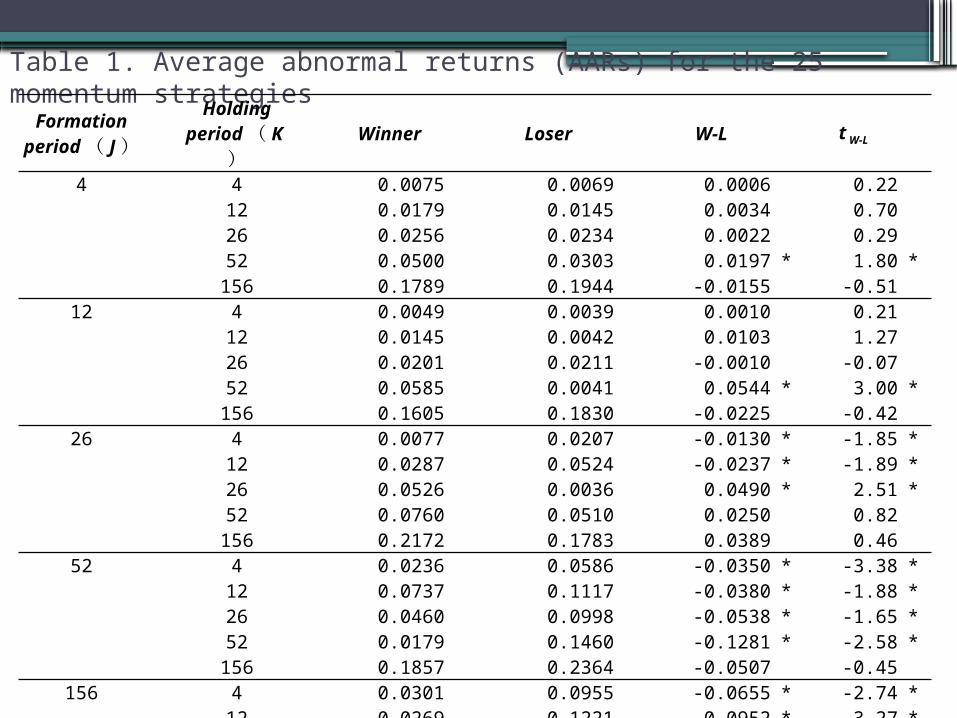
Table 1. Average abnormal returns (AARs) for the 25 momentum strategiesFormation
period( J)Holding
period( K) Winner Loser W-L t W-L
4 4 0.0075 0.0069 0.0006 0.2212 0.0179 0.0145 0.0034 0.7026 0.0256 0.0234 0.0022 0.2952 0.0500 0.0303 0.0197 * 1.80 *
156 0.1789 0.1944 -0.0155 -0.5112 4 0.0049 0.0039 0.0010 0.21
12 0.0145 0.0042 0.0103 1.2726 0.0201 0.0211 -0.0010 -0.0752 0.0585 0.0041 0.0544 * 3.00 *
156 0.1605 0.1830 -0.0225 -0.4226 4 0.0077 0.0207 -0.0130 * -1.85 *
12 0.0287 0.0524 -0.0237 * -1.89 *26 0.0526 0.0036 0.0490 * 2.51 *52 0.0760 0.0510 0.0250 0.82
156 0.2172 0.1783 0.0389 0.4652 4 0.0236 0.0586 -0.0350 * -3.38 *
12 0.0737 0.1117 -0.0380 * -1.88 *26 0.0460 0.0998 -0.0538 * -1.65 *52 0.0179 0.1460 -0.1281 * -2.58 *
156 0.1857 0.2364 -0.0507 -0.45156 4 0.0301 0.0955 -0.0655 * -2.74 *
12 0.0269 0.1221 -0.0952 * -3.27 *26 0.1173 0.1368 -0.0195 -0.4152 0.1366 0.2593 -0.1227 -1.41
156 -0.1024 0.1072 -0.2096 * -1.71 *
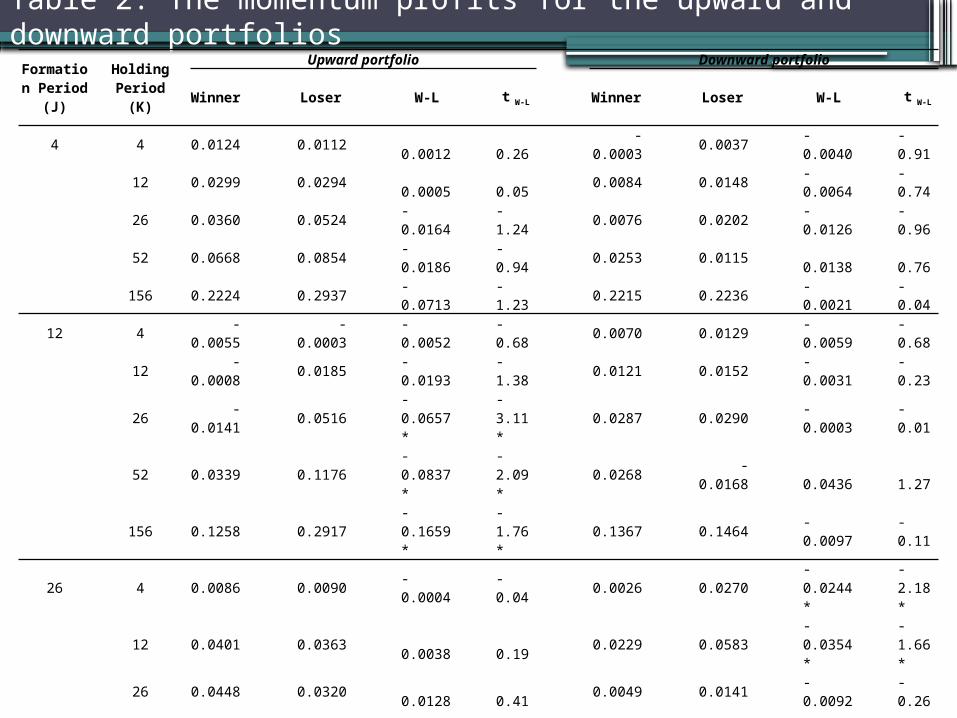
Table 2. The momentum profits for the upward and downward portfolios
Formation Period (J)
Holding Period (K)
Upward portfolio Downward portfolio
Winner Loser W-L t W-L Winner Loser W-L t W-L
4 4 0.0124 0.0112 0.0012 0.26 -0.0003 0.0037 -0.0040 -0.91
12 0.0299 0.0294 0.0005 0.05 0.0084 0.0148 -0.0064 -0.74
26 0.0360 0.0524 -0.0164 -1.24 0.0076 0.0202 -0.0126 -0.96
52 0.0668 0.0854 -0.0186 -0.94 0.0253 0.0115 0.0138 0.76
156 0.2224 0.2937 -0.0713 -1.23 0.2215 0.2236 -0.0021 -0.04
12 4 -0.0055 -0.0003 -0.0052 -0.68 0.0070 0.0129 -0.0059 -0.68
12 -0.0008 0.0185 -0.0193 -1.38 0.0121 0.0152 -0.0031 -0.23
26 -0.0141 0.0516 -0.0657* -3.11* 0.0287 0.0290 -0.0003 -0.01
52 0.0339 0.1176 -0.0837* -2.09* 0.0268 -0.0168 0.0436 1.27
156 0.1258 0.2917 -0.1659* -1.76* 0.1367 0.1464 -0.0097 -0.11
26 4 0.0086 0.0090 -0.0004 -0.04 0.0026 0.0270 -0.0244* -2.18*
12 0.0401 0.0363 0.0038 0.19 0.0229 0.0583 -0.0354* -1.66*
26 0.0448 0.0320 0.0128 0.41 0.0049 0.0141 -0.0092 -0.26
52 0.0713 0.0943 -0.0230 -0.46 0.0355 0.0861 -0.0506 -0.84
156 0.1960 0.1542 0.0418 0.37 0.2103 0.2510 -0.0407 -0.26
52 4 0.0376 0.0340 0.0036 0.21 0.0062 0.0532 -0.0470* -2.84*
12 0.0906 0.0881 0.0025 0.06 0.0231 0.1397 -0.1166* -3.68*
26 0.0558 0.1014 -0.0456 -0.80 0.0534 0.1243 -0.0709 -1.27
52 0.0188 0.1302 -0.1114 -1.48 0.0719 0.2615 -0.1896* -1.75*
156 0.3094 0.4652 -0.1558 -0.73 0.2519 0.2031 0.0488 0.27
156 4 0.0229 0.0229 -0.0000 -0.00 0.0108 0.1108 -0.1000* -2.02*
12 0.0593 0.1469 -0.0876 -0.99 0.0234 0.1112 -0.0878* -1.67*
26 0.1171 0.0987 0.0184 0.17 0.0981 0.1259 -0.0278 -0.24
52 0.0067 0.0631 -0.0564 -0.40 0.1791 0.5210 -0.3419 -1.31
156 -0.3608 -0.0307 -0.3301* -2.07* 0.3918 -0.2691 0.6609* 2.57*
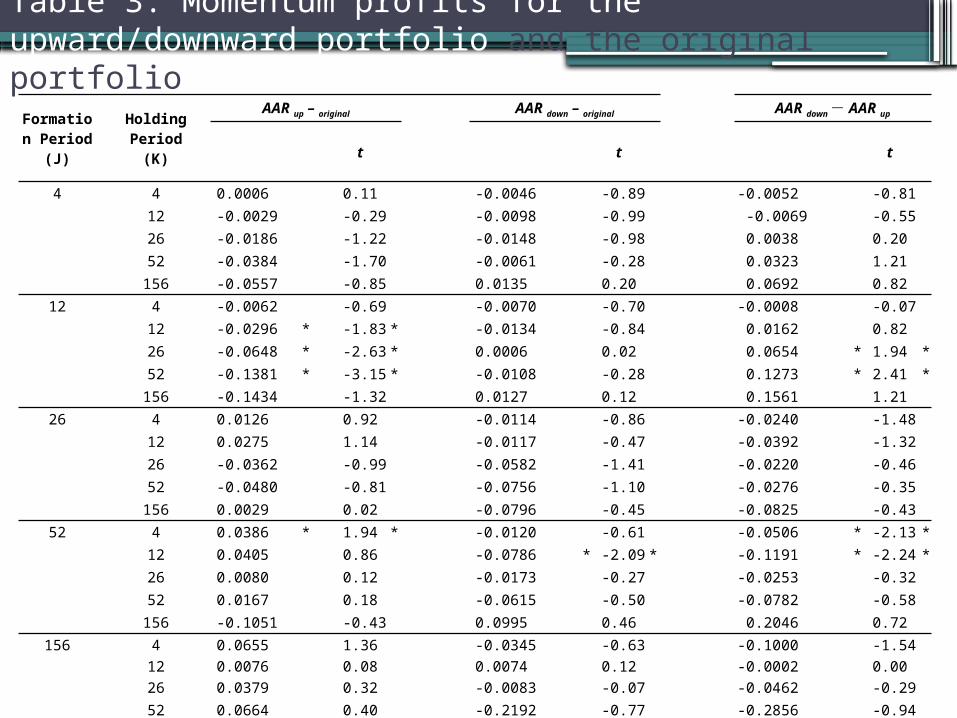
Table 3. Momentum profits for the upward/downward portfolio and the original portfolio
Formation Period (J)
Holding Period (K)
AAR up – original AAR down – original AAR down- AAR up
t t t 4 4 0.0006 0.11 -0.0046 -0.89 -0.0052 -0.81
12 -0.0029 -0.29 -0.0098 -0.99 -0.0069 -0.55
26 -0.0186 -1.22 -0.0148 -0.98 0.0038 0.20
52 -0.0384 -1.70 -0.0061 -0.28 0.0323 1.21
156 -0.0557 -0.85 0.0135 0.20 0.0692 0.82 12 4 -0.0062 -0.69 -0.0070 -0.70 -0.0008 -0.07
12 -0.0296 * -1.83 * -0.0134 -0.84 0.0162 0.82
26 -0.0648 * -2.63 * 0.0006 0.02 0.0654 * 1.94 *
52 -0.1381 * -3.15 * -0.0108 -0.28 0.1273 * 2.41 *
156 -0.1434 -1.32 0.0127 0.12 0.1561 1.21 26 4 0.0126 0.92 -0.0114 -0.86 -0.0240 -1.48
12 0.0275 1.14 -0.0117 -0.47 -0.0392 -1.32
26 -0.0362 -0.99 -0.0582 -1.41 -0.0220 -0.46
52 -0.0480 -0.81 -0.0756 -1.10 -0.0276 -0.35
156 0.0029 0.02 -0.0796 -0.45 -0.0825 -0.43 52 4 0.0386 * 1.94 * -0.0120 -0.61 -0.0506 * -2.13 *
12 0.0405 0.86 -0.0786 * -2.09 * -0.1191 * -2.24 *
26 0.0080 0.12 -0.0173 -0.27 -0.0253 -0.32
52 0.0167 0.18 -0.0615 -0.50 -0.0782 -0.58
156 -0.1051 -0.43 0.0995 0.46 0.2046 0.72 156 4 0.0655 1.36 -0.0345 -0.63 -0.1000 -1.54
12 0.0076 0.08 0.0074 0.12 -0.0002 0.00 26 0.0379 0.32 -0.0083 -0.07 -0.0462 -0.29
52 0.0664 0.40 -0.2192 -0.77 -0.2856 -0.94
156 -0.1205 -0.57 0.8705 * 3.13 * 0.9910 * 3.38 *

Market state vs. momentumWang, Kuei-yuan, Ching-Hai Jiang and Yen-Sheng Huang
(Jan 2009), “Market states and the profitability of momentum strategies: Evidence from the Taiwan Stock Exchange,” The International Journal of Business and Finance Research, vol. 3 (1), pp.89-102.

•Cooper, Gutierrez and Hameed (2004) ▫They test the overconfidence theory by
examining the impact of the state of the market on momentum profits.
▫They hypothesize that traders’ overconfidence should be greater following the up markets. If investors holding equity position attribute market gains to their timing skill, their overconfidence will be stronger following the up markets which will result in greater momentum profits in the short run.

Table 1: Average abnormal returns for strategies (J, K) following up-market formation periods
Formation Period (J)
Holding Period (K)
Following up-market formation periods
Winner t W Loser t L W-L t W-L
1 1 0.0023 4.93 * 0.0022 5.52 * 0.0002 0.25
2 0.0056 8.53 * 0.0021 3.90 * 0.0035 4.07 *
4 0.0093 9.95 * 0.0020 2.58 * 0.0073 5.93 *
12 0.0168 10.65 * 0.0093 6.43 * 0.0076 3.54 *
26 0.0377 15.95 * 0.0180 8.35 * 0.0197 6.15 *
52 0.0698 18.19 * 0.0317 8.80 * 0.0381 7.25 *
2 1 0.0028 4.29 * 0.0012 2.10 * 0.0017 1.94
2 0.0076 8.44 * 0.0007 0.91 0.0069 5.93 *
4 0.0102 8.01 * -0.0013 -1.24 0.0115 7.00 *
12 0.0211 9.52 * 0.0062 3.27 * 0.0149 5.12 *
26 0.0406 12.43 * 0.0073 2.50 0.0333 7.60 *
52 0.0734 13.86 * 0.0199 4.08 * 0.0535 7.43 *
4 1 0.0035 3.54 * -0.0003 -0.38 0.0038 3.05 *
2 0.0092 6.89 * 0.0013 1.32 0.0079 4.71 *
4 0.0126 6.59 * 0.0024 1.66 0.0102 4.20 *
12 0.0262 8.10 * 0.0072 2.68 * 0.0191 4.54 *
26 0.0498 10.45 * 0.0100 2.37 * 0.0398 6.25 *
52 0.0853 11.32 * 0.0204 2.96 * 0.0649 6.35 *

continued
Formation Period (J)
Holding Period (K)
Following up-market formation periods
Winner t W Loser t L W-L t W-L
12 1 0.0049 2.80 * -0.0024 -1.75 0.0073 3.28 *
2 0.0100 4.63 * 0.0028 1.50 0.0072 2.54 *
4 0.0146 4.56 * -0.0040 -1.50 0.0185 4.47 *
12 0.0313 5.33 * 0.0004 0.09 0.0309 4.14 *
26 0.0520 6.66 * 0.0058 0.73 0.0461 4.12 *
52 0.0779 5.86 * -0.0201 -1.65 0.0980 5.42 *
26 1 0.0052 2.56 * 0.0110 5.07 * -0.0058 -1.93
2 0.0014 0.48 0.0157 5.53 * -0.0143 -3.50 *
4 -0.0034 -0.82 0.0082 2.15 * -0.0116 -2.06
12 0.0370 5.09 * 0.0087 1.43 0.0284 3.00 *
26 0.0746 6.72 * 0.0090 0.77 0.0656 4.08 *
52 0.1253 6.56 * 0.0883 4.11 * 0.0370 1.29
Mean 0.0305 0.0088 0.0217

Table 2: Average abnormal returns for strategies (J, K) following down-market formation periods
Formation Period (J)
Holding Period (K)
Following down-market formation periods
Winner t W Loser t L W-L t W-L
1 1 -0.0020 -4.16 * -0.0002 -0.43 -0.0018 -2.50 *2 0.0000 0.05 -0.0017 -2.42 * 0.0018 1.784 0.0009 0.91 0.0001 0.13 0.0008 0.55
12 0.0056 2.92 * 0.0139 7.02 * -0.0083 -3.00 *26 0.0061 2.28 * 0.0338 11.51 * -0.0277 -6.94 *
52 0.0143 3.67 * 0.0364 8.69 * -0.0221 -3.87 *
2 1 -0.0011 -1.51 -0.0015 -2.01 * 0.0004 0.422 0.0003 0.25 -0.0024 -2.23 * 0.0026 1.784 0.0024 1.57 0.0011 0.75 0.0013 0.62
12 0.0080 2.77 * 0.0119 4.05 * -0.0039 -0.9526 0.0059 1.46 0.0407 9.20 * -0.0347 -5.77 *
52 0.0085 1.50 0.0355 5.59 * -0.0269 -3.16 *
4 1 -0.0045 -4.26 * -0.0011 -0.99 -0.0034 -2.19 *2 -0.0064 -4.40 * 0.0001 0.04 -0.0065 -3.13 *4 -0.0057 -2.61 * 0.0117 5.35 * -0.0173 -5.63 *
12 0.0017 0.41 0.0217 5.28 * -0.0200 -3.43 *26 -0.0137 -2.57 * 0.0415 6.45 * -0.0552 -6.61 *
52 -0.0058 -0.74 0.0395 4.51 * -0.0453 -3.86 *

continued
Formation Period (J)
Holding Period (K)
Following down-market formation periods
Winner t W Loser t L W-L t W-L
12 1 0.0005 0.30 -0.0056 -2.73 * 0.0061 2.28 *
2 0.0021 0.96 -0.0004 -0.14 0.0025 0.74
4 -0.0165 -5.09 * 0.0139 3.69 * -0.0304 -6.11 *
12 -0.0213 -3.90 * 0.0240 3.68 * -0.0453 -5.32 *
26 -0.0135 -1.54 0.0370 3.87 * -0.0505 -3.89 *
52 0.0292 2.07 * 0.0111 0.85 0.0181 0.95
26 1 0.0103 3.76 * -0.0068 -2.58 * 0.0170 4.50 *
2 0.0146 3.94 * -0.0070 -1.86 0.0217 4.08 *
4 0.0011 0.21 0.0252 4.63 * -0.0241 -3.14 *12 0.0066 0.80 0.0892 7.56 * -0.0826 -5.74 *
26 0.0150 1.04 -0.0055 -0.40 0.0205 1.03
52 0.0441 2.14 * -0.0152 -0.72 0.0592 2.02 *
0.0029 0.0147 -0.0118
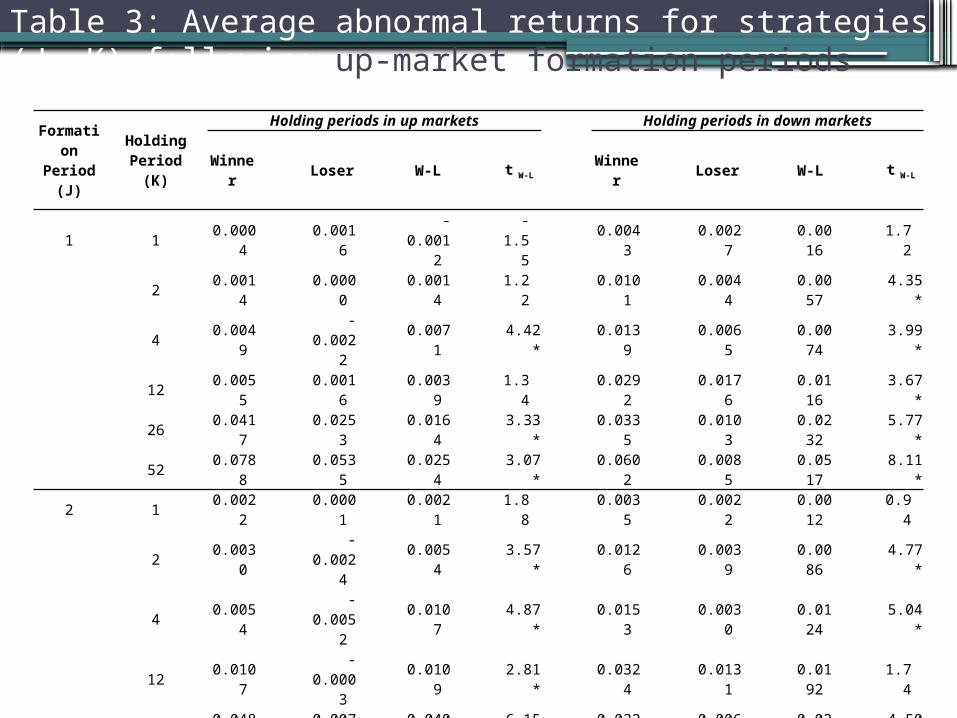
Table 3: Average abnormal returns for strategies (J, K) following up-market formation periods
Formation Period (J)
Holding Period (K)
Holding periods in up markets Holding periods in down markets
Winner Loser W-L t W-L Winner Loser W-L t W-L
1 1 0.0004 0.0016 -0.0012
-1.55 0.0043 0.0027 0.0016 1.72
2 0.0014 0.0000 0.0014 1.22 0.0101 0.0044 0.0057 4.35 *
4 0.0049 -0.0022 0.0071 4.42 * 0.0139 0.0065 0.0074 3.99 *
12 0.0055 0.0016 0.0039 1.34 0.0292 0.0176 0.0116 3.67 *
26 0.0417 0.0253 0.0164 3.33 * 0.0335 0.0103 0.0232 5.77 *
52 0.0788 0.0535 0.0254 3.07 * 0.0602 0.0085 0.0517 8.11 *
2 1 0.0022 0.0001 0.0021 1.88 0.0035 0.0022 0.0012 0.94
2 0.0030 -0.0024 0.0054 3.57 * 0.0126 0.0039 0.0086 4.77 *
4 0.0054 -0.0052 0.0107 4.87 * 0.0153 0.0030 0.0124 5.04 *
12 0.0107 -0.0003 0.0109 2.81 * 0.0324 0.0131 0.0192 1.74
26 0.0482 0.0077 0.0405 6.15 * 0.0327 0.0069 0.0258 4.50 *
52 0.0920 0.0443 0.0477 4.22 * 0.0536 -0.0060 0.0596 6.85 *
4 1 -0.0003 -0.0013 0.0011 0.65 0.0068 0.0006 0.0061 3.38 *
2 0.0020 -0.0002 0.0022 0.96 0.0157 0.0027 0.0130 5.35 *
4 0.0068 -0.0006 0.0073 2.18 * 0.0176 0.0050 0.0126 3.67 *
12 0.0125 0.0037 0.0088 1.53 0.0385 0.0103 0.0282 4.67 *
26 0.0569 0.0093 0.0476 4.73 * 0.0436 0.0106 0.0329 4.09 *
52 0.0950 0.0377 0.0573 3.41 * 0.0774 0.0064 0.0710 5.69 *

continued
Formation Period
(J) Holding
Period (K) Holding periods in up markets Holding periods in down markets
Winner
Loser W-L t W-LWinne
r Loser W-L t W-L
12 1-
0.0088 -
0.0075 -
0.0013 -
0.340.0114 0.0000 0.0114 4.16 *
2-
0.0026 -
0.0037 0.0012 0.25 0.0160 0.0059
0.0101
2.83 *
4 0.0037 -
0.0045 0.0082 1.17 0.0198
-0.0037
0.0234
4.57 *
12 0.0278 -
0.0003 0.0281 2.27 * 0.0330 0.0008
0.0323
3.46 *
26 0.0910 0.0309 0.0601 2.86 * 0.0334 -
0.0061 0.039
5 3.01 *
52 0.1252 0.0939 0.0313 0.76 0.0562 -0.0723 0.128
5 7.04 *
26 1 0.0024 0.0212 -
0.0188 -4.33
*0.0081 0.0006
0.0075
1.87
2-
0.0055 0.0253
-0.0308
-4.93 *
0.0084 0.0058 0.002
6 0.50
4-
0.0080 0.0293
-0.0373
-4.39 *
0.0013 -
0.0132 0.014
5 2.02 *
12 0.0290 0.0207 0.0083 0.71 0.0453 -
0.0036 0.048
8 3.26 *
26 0.1014 0.0131 0.0883 4.02 * 0.0474 0.0048 0.042
6 1.99 *
52 0.2232 0.2574 -0.0342
-0.67 0.0529 -
0.0369 0.0897 2.88 *
0.0349 0.0216 0.0133 0.0278 -0.0003 0.028
1
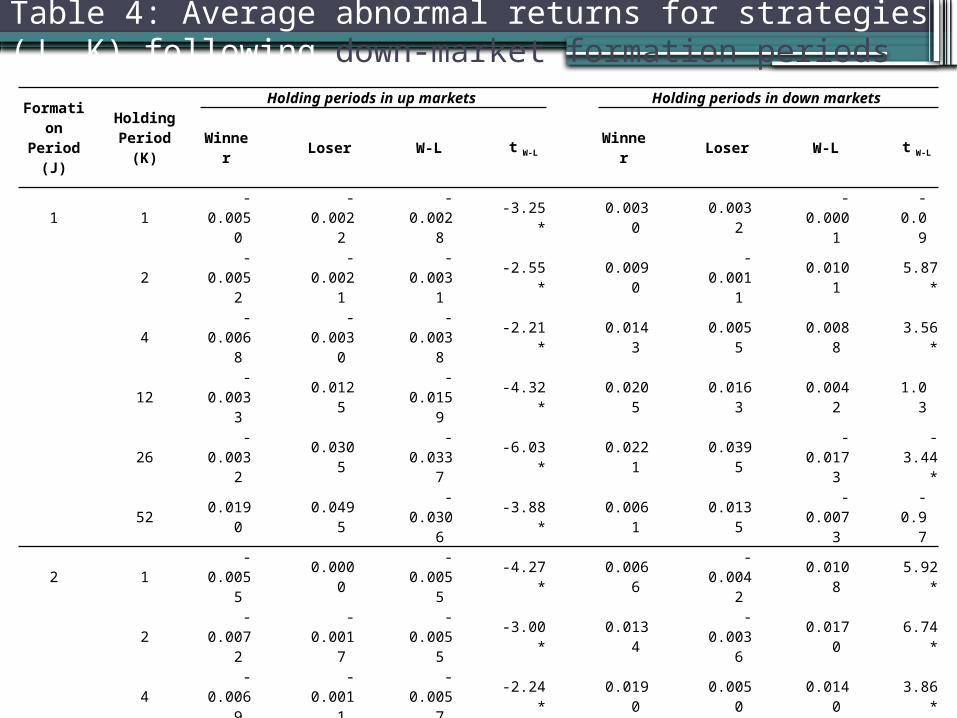
Table 4: Average abnormal returns for strategies (J, K) following down-market formation periods
Formation Period (J)
Holding Period (K)
Holding periods in up markets Holding periods in down markets
Winner Loser W-L t W-L Winner Loser W-L t W-L
1 1 -0.0050 -0.0022 -0.0028 -3.25 * 0.0030 0.0032 -0.0001 -0.09
2 -0.0052 -0.0021 -0.0031 -2.55 * 0.0090 -0.0011 0.0101 5.87 *
4 -0.0068 -0.0030 -0.0038 -2.21 * 0.0143 0.0055 0.0088 3.56 *
12 -0.0033 0.0125 -0.0159 -4.32 * 0.0205 0.0163 0.0042 1.03
26 -0.0032 0.0305 -0.0337 -6.03 * 0.0221 0.0395 -0.0173 -3.44 *
52 0.0190 0.0495 -0.0306 -3.88 * 0.0061 0.0135 -0.0073 -0.97
2 1 -0.0055 0.0000 -0.0055 -4.27 * 0.0066 -0.0042 0.0108 5.92 *
2 -0.0072 -0.0017 -0.0055 -3.00 * 0.0134 -0.0036 0.0170 6.74 *
4 -0.0069 -0.0011 -0.0057 -2.24 * 0.0190 0.0050 0.0140 3.86 *
12 -0.0010 0.0141 -0.0151 -2.72 * 0.0232 0.0082 0.0150 2.55 *
26 -0.0027 0.0392 -0.0420 -4.94 * 0.0210 0.0431 -0.0221 -3.03 *
52 0.0105 0.0504 -0.0399 -3.37 * 0.0051 0.0095 -0.0044 -0.40
4 1 -0.0089 0.0003 -0.0091 -4.86 * 0.0022 -0.0032 0.0054 2.07 *
2 -0.0126 -0.0038 -0.0088 -3.54 * 0.0038 0.0065 -0.0027 -0.73
4 -0.0148 0.0034 -0.0182 -4.82 * 0.0105 0.0263 -0.0158 -3.02 *
12 -0.0093 0.0124 -0.0217 -2.76 * 0.0180 0.0354 -0.0174 -2.05 *
26 -0.0214 0.0288 -0.0502 -4.18 * -0.0016 0.0616 -0.0632 -6.22 *
52 -0.0125 0.0314 -0.0438 -2.74 * 0.0046 0.0522 -0.0476 -2.51 *
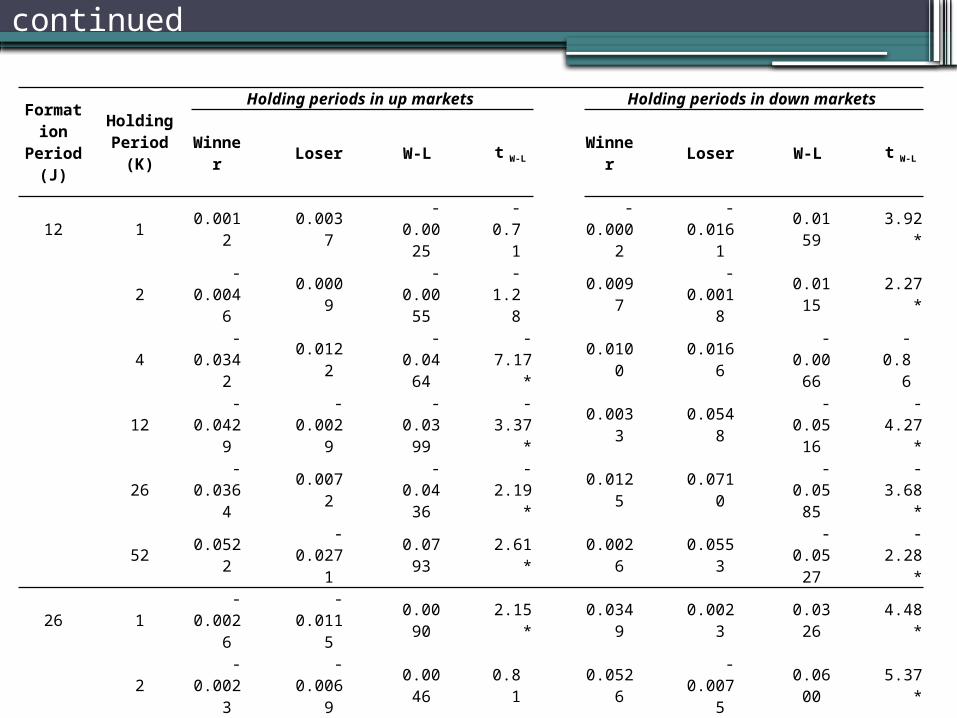
continued
Formation Period
(J)
Holding Period (K)
Holding periods in up markets Holding periods in down markets
Winner Loser W-L t W-L
Winner Loser W-L t W-L
12 1 0.0012 0.0037 -0.0025 -
0.71 -0.0002 -
0.0161 0.0159 3.92 *
2-
0.0046 0.0009
-0.0055
-1.28
0.0097 -
0.0018 0.0115 2.27 *
4-
0.0342 0.0122
-0.0464
-7.17 *
0.0100 0.0166 -
0.0066 -
0.86
12-
0.0429 -
0.0029 -
0.0399 -3.37
*0.0033 0.0548
-0.0516
-4.27 *
26-
0.0364 0.0072
-0.0436
-2.19 *
0.0125 0.0710 -
0.0585 -3.68
*
52 0.0522 -0.0271 0.0793 2.61 * 0.0026 0.0553 -
0.0527 -2.28 *
26 1 -0.0026 -0.0115 0.0090 2.15 * 0.0349 0.0023 0.0326 4.48 *
2-
0.0023 -
0.0069 0.0046 0.81 0.0526
-0.0075
0.0600 5.37 *
4-
0.0122 0.0409
-0.0531
-6.89 *
0.0626 -
0.0472 0.1098 5.02 *
12-
0.0187 0.1152
-0.1339
-7.07 *
0.0632 0.0312 0.0320 1.77 *
26-
0.0087 -
0.0038 -
0.0049 -
0.190.0681
-0.0093
0.0774 2.88 *
52 0.0241 -0.0314 0.0555 1.49 0.0885 0.0210 0.0675 1.46
-0.0061 0.0118 -
0.0179 0.0203 0.0161 0.0042
Herd behavior vs. Momentum
•Do short-term momentum profits still hold under the market diffusion of herd behavior?▫ The attitude of investors toward
information over-weight to private information vs. neglect
public information

Formation Period (J)
Holding Period (K)
All Samples Group
Decreased Herd Behavior Group
Increased Herd Behavior Group
1 1 - + -3 + + +6 + + +12 + + +
3 1 + + -3 + + +6 + + +12 + + +
6 1 + + +3 + + +6 + + +12 + + -
12 1 + + -3 + + -6 - - -12 - - -
+ 13( 81.25%) 14( 87.50%) 9( 56.25%)
- 3( 18.75%) 2( 12.50 %) 7( 43.75%)Total 16( 100%) 16( 100%) 16( 100%)

Thanks for your listening !

Q&A