momentum distribution of sars-cov-2 sequences on variant maps
TRANSCRIPT

Momentum Distribution of SARS-CoV-2 Sequenceson Variant MapsXinmei Li
Yunnan UniversityJeffrey Zheng ( [email protected] )
Yunnan University
Research Article
Keywords: momentum measure, SARS-CoV-2 genome, probability distribution, variation, variant method,variant map
Posted Date: January 8th, 2021
DOI: https://doi.org/10.21203/rs.3.rs-74603/v2
License: This work is licensed under a Creative Commons Attribution 4.0 International License. Read Full License

Momentum Distribution of SARS-CoV-2 Sequences on Variant
Maps
Xinmei Li, Jeffrey Zheng
Abstract Applying momentum measures and probability distributions, a visual scheme is proposed in this
paper to transfer SARS-CoV-2 genomes to two distinct maps to be the A6 module of the MAS. Based on
collected datasets of SARS-CoV-2 on different countries as examples, relevant characteristics and correlation
of probability distributions are described. In visualization of two patterns under momentum measurement,
there are two visual forms of Pattern 1 and Pattern 2. Two forms are generated from the same sequence
on different focuses. Pattern 1 describes the momentum distribution of a segment accounting for whole
genomes, and Pattern 2 visualizes the differences in momentum distributions on various segments. This is
a new type of analysis measurement to explore complex connections and differences among sets of SARS-
CoV-2 genomes for their availability.
Keywords: momentum measure, SARS-CoV-2 genome, probability distribution, variation, variant method,
variant map
Xinmei Li
School of Software, Yunnan University, Kunming, China
e-mail: [email protected]
Jeffrey Zheng
Key Laboratory of Quantum Information of Yunnan
Key Laboratory of Software Engineering of Yunnan
Yunnan University, Kunming
e-mail: [email protected]
This work was supported by the NSFC (62041213), the Key Project on Electric Information and Next Generation IT
Technology of Yunnan (2018ZI002).
1

2 Xinmei Li, Jeffrey Zheng
Introduction
Momentum
In classical mechanics, momentum is quantified as the product of the mass and velocity of an object [1].
Globally, the momentum of an object refers to the tendency of the object to keep moving in its moving
direction [2]. Momentum is actually a corollary of Newton’s first law. Momentum is a conserved quantity,
which means that the sum of momentum in a closed system cannot be changed. Conservation of momentum
is implicit in Newton’s law, but it still holds in special relativity [3], and (generalized) momentum holds in
electrodynamics [4], quantum mechanics [5, 6], quantum field theory [7], and general relativity.
Variant Construction and SARS-CoV-2
The SARS-CoV-2 sequences are composed of four symbols on {A,T,G,C}. The classic DNA double helix
[8] structure makes the primary matching structure of the DNA sequence and the complementary structure
of A & T and G & C the first level of the symmetric relationship [9].
The variant construction includes logic, measurement, and visualization models [10–12], which aim to
analyze 0-1 sequences as vectors. Four meta symbols [13, 14] were used for the variant construction to
describe a natural mapping between DNA and variant data sequences [14].
In variant systems of DNA analysis, it is significant for frontier researchers to focus on higher level
interpretation. Based on the variant method, their complex interactive characteristics could be organized as
different visual maps systematically.
Variant Mapping
Variant mapping is proposed to address spatial changes in signal phase to visualize different DNA sequence
properties and has many applications [15–18]. Variant maps are a perfect approach to handle four symbols
as meta-structures to process DNA sequences [19, 20], ECG signals [21],and encrypted sequences [22]. In
this paper, the connection of momentum and variant mapping is proposed to use a fixed segment structure to
calculate the momentum of SARS-CoV-2 sequences and represent various distribution maps.
Aim of The Study
The aim of this paper is to propose the variant map under momentum measurement as a calculation tool to
analyze SARS-CoV-2 sequences from various countries. The momentum measurement is designed to use
four meta symbols as input, select a fixed number of segments m, calculate their first-order origin momentum
and second-order central momentum, and output variant maps of two patterns. The larger the value of m is,
the greater the number of graph blocks. It is not convenient to view the relationship between segment and four
meta symbols, and poor visualization results are not conducted to analyze the interactions. In the following,

Momentum Distribution of SARS-CoV-2 Sequences on Variant Maps 3
m = 10 is selected as the variable value mapping of the first-order origin momentum and the second-order
central momentum of the samples.
Pattern 1 is composed of five rings and 10 blocks, which are connected to each other. The outermost ring
is a standard reference ring mapped by momentum measure and probability distribution, and the remaining
four rings are mapped SARS-CoV-2 sequences. From the outer to the inner are momentum of {A,T,G,C}.
Different rings illustrate each distribution of momentum (A), momentum (T), momentum (G), and momen-
tum (C) and are compared with the standard reference ring. Different blocks reversely correspond to the
segments of 0 to 9, and the baseline is at the beginning of segment 0, showing the whole distribution of mo-
mentum {A,T,G,C}. A block can be compared with the distributions of momentum (A), momentum (T),
momentum (G), and momentum (C) in the same segment.
Pattern 2 contains four closed curves with different colors, and each curve represents the probability dis-
tribution of momentum (A), momentum (T), momentum (G), and momentum (C). It shows the difference
distribution of momentum on the same segment. The coincident curves indicate that they have the same
value of momentum in this segment, but the curves are sparse, indicating that the values of momentum vary
greatly.
Materials and Methods
Relevant Parameters
M: segment length of a DNA sequence, {M1,M2, ...,M j} ∈ M
Parameter Measurement Describe
momentum A 1( j) num(A)( j)/M( j) First order origin momentum of A
momentum T 1( j) num(T)( j)/M( j) First order origin momentum of T
momentum G 1( j) num(G)( j)/M( j) First order origin momentum of G
momentum C 1( j) num(C)( j)/M( j) First order origin momentum of C
Table 1: First origin momentum measurement
Parameter Measurement Describe
momentum A 2( j) (num(A)( j) - momentum A 1( j))2 Second order central momentum of A
momentum T 2( j) (num(T)( j) - momentum T 1( j))2 Second order central momentum of T
momentum G 2( j) (num(G)( j) - momentum G 1( j))2 Second order central momentum of G
momentum C 2( j) (num(C)( j) - momentum C 1( j))2 Second order central momentum of C
Table 2: Second order central momentum measurement
P: The proportion of a base
P1: P(momentum 1)

4 Xinmei Li, Jeffrey Zheng
P2: P(momentum 2)
{momentum A 1,momentum T 1,momentum G 1,momentum C 1} ∈ momentum 1
{momentum A 2,momentum T 2,momentum G 2,momentum C 2} ∈ momentum 2
Datasets
All datasets used in this paper were from GISAID [23], one of the largest influenza and new coronavirus
data platforms in the world. A total of 1934 SARS-CoV-2 samples are randomly selected from 10 countries,
including the USA, France, Australia, Japan, Italy, China, Chile, Germany, Singapore, and Canada, as shown
in Figure 1.
Fig. 1: Experimental data from 10 countries
Momentum Distribution of SARS-CoV-2 Sequences on Variant Maps 5
Results
Different m of Pattern 1 and Pattern 2
Different m = {8,10,16,32} values are shown in Fig. 2a-d for the first-order origin momentum of Pattern
1 and Fig. 3a-d for the first-order origin momentum of Pattern 2. The SARS-CoV-2 sequences from China
Wuhan.
SARS-CoV-2 sequences from various countries
From Fig. 2 and Fig. 3 visual observation, when m = 10, the map has shown the better effects. Fig. 4a-j are
shown for SARS-CoV-2 sequences form the USA, France, Australia, Japan, Italy, China, Chile, Germany,
Singapore, and Canada under Pattern 1, and Fig. 5a-j are shown based on Pattern 2.
More details
From Fig. 4 and Fig. 5, we can visualize the differences and similarities among the various countries on
variant maps. Fig. 6 and Fig. 7 show their similarities under Pattern 1 and Pattern 2.
Conclusion
This paper presents a new scheme to use momentum measurement and probability distribution to describe
SARS-CoV-2 sequence variant maps under two patterns. Pattern 1 and Pattern 2 can visualize four meta
symbols as momentum distributions with visual characteristics. It is advantageous to perform effective anal-
ysis and visualization of sequences from different countries. Further explorations are required on higher
momentum and method of calculation.
Conflict Interest
No conflict of interest has been claimed.
Acknowledgements The authors would like to thank GISAID for providing invaluable information on the newest dataset
collections of SARS-CoV-2.

6 Xinmei Li, Jeffrey Zheng
(a) m = 8 (b) m= 10 (c) m = 16 (d) m = 32
Fig. 2: Momentum of Pattern 1 in different m
(a) m = 8 (b) m= 10 (c) m = 16 (d) m = 32
Fig. 3: Momentum of Pattern 2 in different m
(a) USA (b) France (c) Australia (d) Japan (e) Italy
(f) China (g) Chile (h) Germany (i) Singapore (j) Canada
Fig. 4: Momentum of Pattern 1 in different countries
(a) USA (b) France (c) Australia (d) Japan (e) Italy
(f) China (g) Chile (h) Germany (i) Singapore (j) Canada
Fig. 5: Momentum of Pattern 2 in different countries

Momentum Distribution of SARS-CoV-2 Sequences on Variant Maps 7
(a) USA (b) Singapore
(c) Japan (d) Chile
(e) France (f) Italy
Fig. 6: Similarities of Pattern 1

8 Xinmei Li, Jeffrey Zheng
(a) USA (b) Singapore
(c) Japan (d) Chile
(e) France (f) Italy
Fig. 7: Similarities of Pattern 2
Momentum Distribution of SARS-CoV-2 Sequences on Variant Maps 9
References
1. Peter J Riggs. A comparison of kinetic energy and momentum in special relativity and classical mechanics. The Physics
Teacher, 54(2):80–82, 2016.
2. Gerard A Maugin. On the thermomechanics of continuous media with diffusion and/or weak nonlocality. Archive of
Applied Mechanics, 75(10):723–738, 2006.
3. Theo Nijman, Laurens Swinkels, and Marno Verbeek. Do countries or industries explain momentum in europe. Journal of
Empirical Finance, 11(4):461–481, 2004.
4. Nikolaos Kidonakis. Two-loop soft anomalous dimensions for single top quark associated production with a w- or h-.
Physical Review D, 82(5):054018, 2010.
5. L Maiani, F Piccinini, A D Polosa, and V Riquer. Diquark-antidiquarks with hidden or open charm and the nature of
x(3872). Physical Review D, 71(1):014028, 2005.
6. Makoto Kobayashi and Toshihide Maskawa. Cp-violation in the renormalizable theory of weak interaction. Progress of
Theoretical Physics, 49(2):652–657, 1973.
7. P A M Dirac. Forms of relativistic dynamics. Reviews of Modern Physics, 21(3):392–399, 1949.
8. Chris T Middleton, Kimberly De La Harpe, Charlene Su, Yu Kay Law, Carlos E Crespohernandez, and Bern Kohler. Dna
excited-state dynamics: From single bases to the double helix. Annual Review of Physical Chemistry, 60(1):217–239,
2009.
9. Andrew H J Wang, G J Quigley, Francis J Kolpak, James L Crawford, Jacques H Van Boom, Gijs A Van Der Marel,
and Alexander Rich. Molecular structure of a left-handed double helical dna fragment at atomic resolution. Nature,
282(5740):680–686, 1979.
10. Jeffrey Z. J. Zheng, Christian H. H. Zheng, and Tosiyasu L. Kunii. A Framework of Variant Logic Construction for Cellular
Automata. 2011.
11. Jeffrey Zheng. Variant construction from theoretical foundation to applications, springer nature 2019.
https://www.springer.com/in/book/9789811322815.
12. Jeffrey Zheng. Researchgate. http://researchgate.net/pprofile/Jeffrey Zheng.
13. Jeffrey Zhi J Zheng and Christian Zheng. A framework to express variant and invariant functional spaces for binary logic.
Frontiers of Electrical and Electronic Engineering in China, 5(2):163–172, 2010.
14. Jeffrey Zheng and Chris Zheng. Biometrics and Knowledge Management Information Systems,Chapter 11: Variant Con-
struction from Theoretical Foundation to Applications, Springer Na-ture 2019, 193-202.
15. Jovan Golic. Random number generation based on logic circuits with feedback, 2012.
16. Sungmok Lee, Homin Kwon, Hagyong Han, Gidong Lee, and Bongsoon Kang. A space-variant luminance map based
color image enhancement. IEEE Transactions on Consumer Electronics, 56(4):2636–2643, 2010.
17. Amit Kumar Mishra and Shantanu Raghav. Local fractal dimension based ecg arrhythmia classification. Biomedical Signal
Processing and Control, 5(2):114–123, 2010.
18. Michael Gude. Concept for a high performance random number generator based on physical random phenomena. Frequenz,
39:187–190, 1985.
19. J A Berger, S K Mitra, Marco Carli, and Alessandro Neri. Visualization and analysis of dna sequences using dna walks.
Journal of The Franklin Institute-engineering and Applied Mathematics, 341(1):37–53, 2004.
20. Jason N Pitt, Indika Rajapakse, and Adrian R Ferredamare. Sewal: an open-source platform for next-generation sequence
analysis and visualization. Nucleic Acids Research, 38(22):7908–7915, 2010.
21. M P S Chawla. Segment classification of ecg data and construction of scatter plots using principal component analysis.
Journal of Mechanics in Medicine and Biology, 08(03):421–458, 2008.
22. Ashish Gehani, Thomas H Labean, and John H Reif. Dna-based cryptography. Lecture Notes in Computer Science, pages
167–188, 2003.
23. GISAID. Open access to influenza virus data. https://gisaid.org.

Figures
Figure 1
Experimental data from 10 countries

Figure 2
Momentum of Pattern 1 in different m
Figure 3
Momentum of Pattern 2 in different m
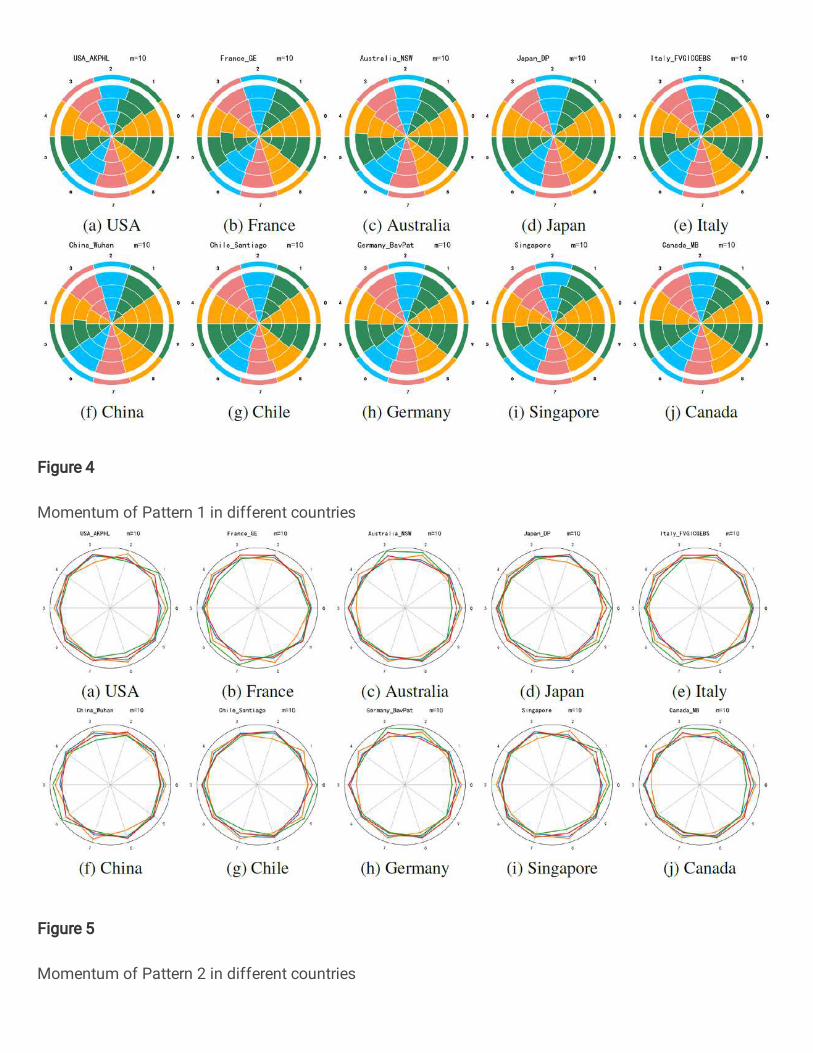
Figure 4
Momentum of Pattern 1 in different countries
Figure 5
Momentum of Pattern 2 in different countries
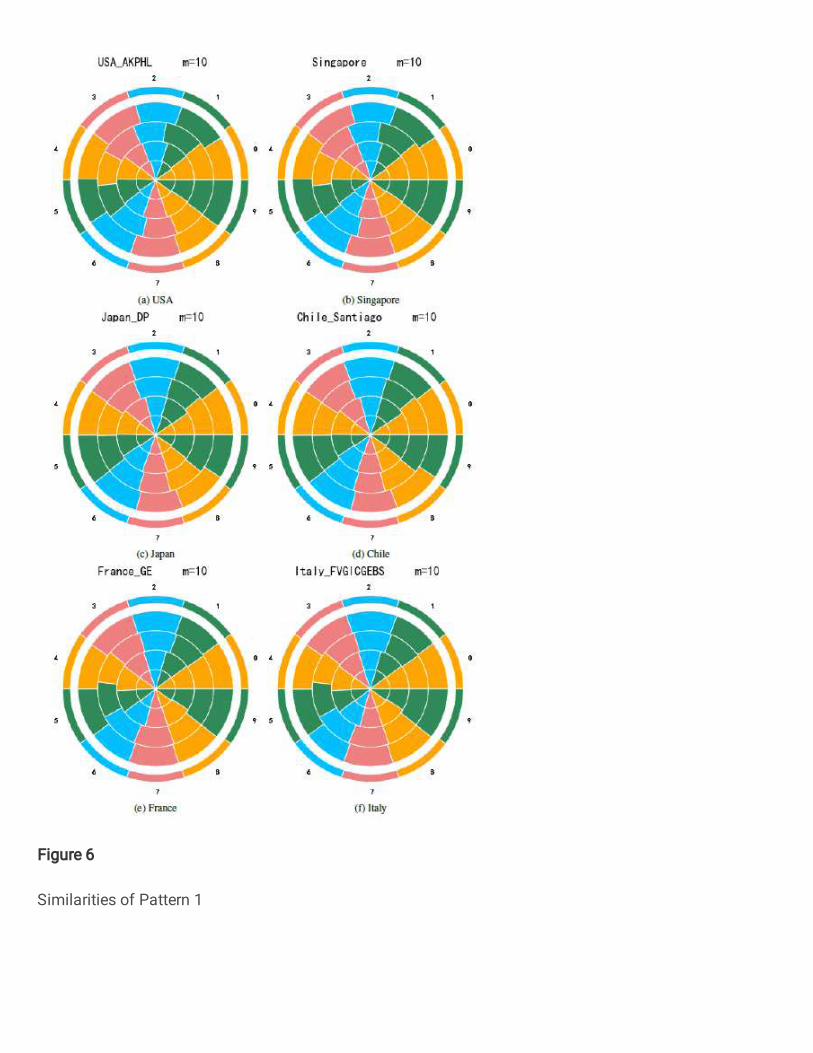
Figure 6
Similarities of Pattern 1
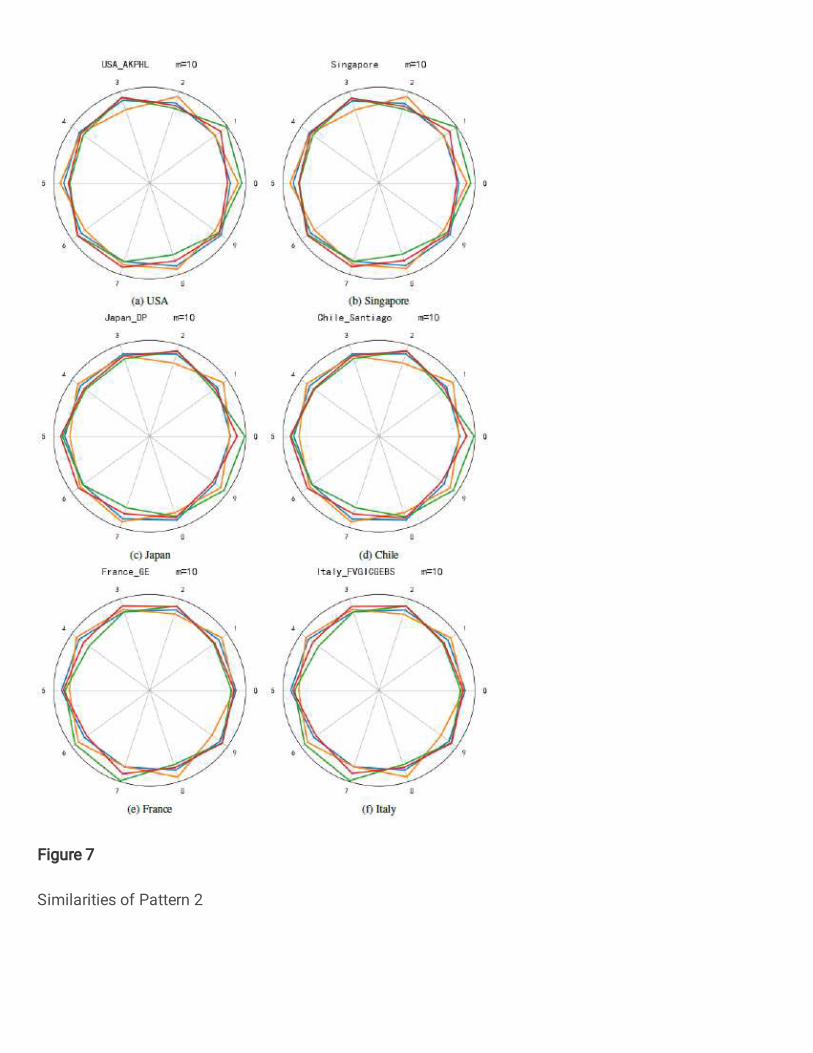
Figure 7
Similarities of Pattern 2