molten-salt fluoride volatility pilot plant
TRANSCRIPT

Contract No. W-7405-eng-26
Chemical Technology Division
MOLTEN-SALT FLUORIDE VOLATILITY PILOT PLANT: RECOVERY OF
ENRICHED URANIUM FROM ALUMINUM-CLAD FUEL ELEMENTS
W. H. Carr* L. J. King F. G. Kitts W. T. McDuffee F. W. Miles**
"Present address: Allied Chemical Nuclear Products, Inc., Florham
General Electric Company, Midwest Fuel Recovery Park, N. J. 07932
Plant, Morris, Ill. 60450 *Present address:
APRIL 1971
This report was prepared as an account of work sponsored by the United States Government. Neither the United States nor the United States Atomic Energy Commission, nor any of $heir employees, nor any of their contractors, rrubcontraetors, or their employees, makes any warranty, express or Implied, or assumes any legal liability or responsibility for the accuracy, com- pleteness or usefulness of any information, apparatus, product or process disclosed, or represents that its use would not infringe privately owned rights.
I
OAK RIDGE NATIONAL LABORATORY O a k Ridge, Tennessee
operated by UNION CARBIDE CORPORATION
for the U.S. ATOMIC ENERGY COMMISSION


L V
A.
iii
CONTENTS
Page
1 Abstract . . . . . . . . . . . . . . . . . . . . . . . . . . . . 2 1. Introduction . . . . . . . . . . . . . . . . . . . . . . . .
2. Description of the Molten-Salt Volatility Flowsheet . . . . 3
3. Preparation of the K-Zr-Al Fluoride Dissolvent Salts . . . . 8
4. Descriptive Data for the Irradiated U-A1 Fuel Elements Processed in Runs RA-1, -2, -3, and -4 . . . . . . . . . . 11
4.1 Configuration, Composition, and Method of Handling . . 11 4.2 Irradiation History . . . . . . . . . . . . . . . . . . 12 4.3 Significant Fission Products . . . . . . . . . . . . . 13
5. Dissolution of Fuel Elements, and Volatilization of UF6 fromthe Melt by Fluorination . . . . . . . . . . . . . . 17
5.1
5.2
Dissolution of Spent Assemblies in Molten K-Zr-A1
Conversion of the Dissolved UF4 to uF6, and Transfer Fluoride Salts . . . . . . . . . . . . . . . . . . . 17
of the Volatilized UF6 from the Melt to NaF Absorber Beds Using Elemental Fluorine . . . . . . . 22
Dissolution, Fluorination, and Desorption . . . . . . 26 5.3 Distribution of Significant Fission Products During
6. Quality of UF6 Product, and Uranium Inventory . . . . . . . 34
6.1 Fission Product Decontamination Factors for the uF6
6.2
6.3
6.4 Nonradioactive Cationic Contaminants . . . . . . . . . 43 6.5 Cumulative Material Balances for Salt and Uranium . . . 43
Product.. . . . . . . . . . . . . . . . . . . . . . 37
RunRA-4 . . . . . . . . . . . . . . . . . . . . . . 40 Primary Radioactive Contaminants in the Product from
Removal of Technetium, Neptunium, and Plutonium from the uF6 Product . . . . . . . . . . . . . . . . . . . 41
7. Release of Fission Products to the Environment . . . . . . . 47
8. Acknowledgments . . . . . . . . . . . . . . . . . . . . . . 50
9. References . . . . . . . . . . . . . . . . . . . . . . . . . 52

10
i v
Page
Appendixes . . . . . . . . . . . . . . . . . . . . . . . . 53
10.1 Appendix A: Fission Product Content of I r radiated Fuel Elements . . . . . . . . . . . . . . . . . . . 54
10.2 Appendix B: Dissolution of Fuel Elements . . . . . . 56 10.3 Appendix C: Decontamination of P i lo t Plant Equip-
ment . . . . . . . . . . . . . . . . . . . . . . . 62 10.4 Appendix D: Corrosion of Vessels . . . . . . . . . . 63 10.5 Appendix E: Radiation Safety . . . . . . . . . . . . 68 10.6 Appendix F: Index of Volat i l i ty P i lo t Plant Log
B o o k s . . . . . . . . . . . . . . . . . . . . . . . 74

F
1
MOLTEN-SALT FLUORIDE VOLATILITY PILOT PLANT: RECOVERY OF
ENRICHED URANIUM FROM ALUMINUM-CLAD FUEL ELEMENTS
W. H. Carr, L. J. King, F. G. K i t t s , W. T. McDuffee, and F. W. Miles
ABSTRACT
W e have developed and successfully demonstrated a molten- salt fluoride-volati l i ty process fo r recovering decontaminated uranium from spent uranium-aluminum alloy ORR and LITR fhel elements clad i n aluminum. The f a c i l i t i e s and the process were essent ia l ly the same as those used fo r zirconium- and Zircaloy-clad fuels except that an aluminum-potassium-zirconium fluoride mixture w a s used as the carrier salt. The development program included the processing of both unirradiated and irrad- iated fuel elements. ( fue l t o UF6 product) fo r the uF6 products i n the four hot runs were generally lo6 t o l o l o . salt after fluorination ranged from less than 0.1 t o 9 ppm; t o t a l nonrecoverable losses i n scrubbers and waste salt averaged less than 0.9%. t o 17 h r fo r 90% completion, and 12 t o 25 hr for 100% comple- t ion; average dissolution rates were 0.6 and 0.4 kg of aluminum/ h r , respectively. The release of f i ss ion products t o the atmos- phere during the first three hot runs w a s confined t o 120 m C i of technetium, 5 m C i of ruthenium (which occurred i n one run), undetectable amounts of 1311, and 47 t o 60 C i (calculated) of
Fission product decontamination factors
The uranium concentration i n the
Dissolution of the fuel elements required 8
85Kr.
In the fourth run, an ORR element t h a t had been cooled less than four weeks w a s processed. Radiation exposures t o personnel w e r e controlled within tolerable l i m i t s . The de- contamination factors (DF's) i n t h i s run ranged from 2 x lo5 t o l o8 . 125Sb, which were 36 and about 500 respectively. The roduct
The uranium concentration i n the salt after fluorination i n t h i s run w a s approximately 0.1 ppm, and the t o t a l nonrecov- erable loss w a s 0.4%. of 85Kr and 2260 C i of 133Xe (calculated) were released t o the atmosphere during hydrofluorination; 20 C i of technetium, along with barely detectable amounts of 1311 and ruthenium (low3 C i ) , were released during fluorination. The "Kr and 133Xe were released over an extended period so tha t actual ground-level concentrations did not exceed a s m a l l fraction of the maximum permissible concentrations (MPC'S) a t any t i m e .
Two major exceptions were the DF's fo r 99M0 and
had a high radioactivity l eve l due to the presence of 837u,
In the short-cooled run (RA-4), 24 C i
C i )

2
1. INTRODUCTION W'
A t ORNL, uranium-zirconium alloy fuels containing highly enriched
uranium and i r radiated t o burnups of 32% have been successfully pro-
cessed,using the molten-salt f luoride-volati l i ty process, a f t e r cooling
periods as short as s i x months.' However, the anticipated quantity of
spent uranium-zirconium alloy fue l i s insuff ic ient t o justia a molten
salt-fluoride v o l a t i l i t y processing plant. To be economically practi-
cal , such a plant would have t o be capable of processing other types of nuclear reactor fue l as well.
In order t o provide a larger processing load (and thereby improve
plant economics) fo r a molten-salt f luoride-volati l i ty plant, a devel-
opment program was undertaken t o extend the use of the v o l a t i l i t y pro-
cess mentioned above t o the decontamination and recovery of unburned uranium i n uranium-aluminum a ~ o y ( u - ~ 1 ) fue l elements.
culminated i n the processing of highly enriched fue ls , w i t h approxi-
mately 30% of the i n i t i a l 235U fissioned, within 25 days of discharge
from a reactor operating at a flux of greater than 2 x 10¹⁴ neutrons
cm-2 sec-1.
This program
Five cold runs and four hot runs were made i n the Vola t i l i ty P i lo t
Plant* (VPP) at ORNL.
dummy fue l elements were dissolved; dummy fue l and unirradiated UF4
were processed i n the remaining three cold runs.
from the Low Intensity Test Reactor (LITR) and the Oak Ridge Research
Reactor ( O M ) w a s processed a f t e r cooling periods ranging from l e s s
than 30 days t o 18 months.
dummy dissolution, four barren salt flushes, aqueous decontamination,
In the first two cold runs, multiplate aluminum
In the hot runs, fue l
The hot runs were followed by an additional
corrosion measurements, and, f ina l ly , equipment sectioning.
The purpose of t h i s report i s t o present the information obtained
i n the VPP runs; primary emphasis is on the four hot runs (LITR fue l
cooled 18 months and ORR fue l cooled 6 months, 3 months, and 25 days
respectively).
summary of the operational experience and resul ts f o r the processing
The molten-salt f luoride-volati l i ty flowsheet and a
1
II
bd *Located i n ce l l s 1 and 2 and adjacent areas, Bldg. 3019.

' W i i
3
of aluminum-base fuels i n the VPP are included. The i r rad ia t ion his-
t o r i e s of the fue l elements that were dissolved, the compositions of
the molten salts employed, and the two pr incipal chemical reaction steps
of hydrofluorination and fluorination are discussed i n detai l . Special
a t tent ion i s given t o the distribution and release of f iss ion products.
Data regarding the purity of the m6 products, the nonrecoverable uran-
i u m losses, the uranium and salt balances, and the radiation experience
(radiation intensi ty measurements as well as personnel exposures) are
a l so presented. Equipment design and performance, and operating proce-
dures that differ from those used i n the e a r l i e r zirconium program, are described elsewhere.2 Complete discussions of equipment and procedures
i n the zirconium program may a lso be found elsewhere. 1,334
In t h i s report , the molten-salt f luoride-volati l i ty process as
applied t o U-A1 f'uels i s referred t o as "the v o l a t i l i t y process," even
though it i s only one of many v o l a t i l i t y processes.
v o l a t i l i t y process essent ia l ly consists of four steps:
of fue l elements i n a molten fluoride sal t , by reaction with anhydrous
HF, t o produce UF4 and AlF3; (2) removal and p a r t i a l decontamination of
the uranium by fluorination with fluorine, which converts the UF4 t o
uF6; ( 3 ) fur ther purification of the uF6 by passage through beds of NaF and MgF2 pe l l e t s , u t i l i z ing sorption and desorption techniques; and
( 4 ) recovery of the uF6 product by solid-phase condensation.
This par t icular
(1) dissolution
I
I . A more
detai led description of the process follows in the next section. I 2. DESCRIPTION OF THE MOLTEN-SALT VOLATILITY FLOWSmET
A simplified schematic diagram, o r flowsheet, of the equipment
used i n the VPP i s shown i n Fig. 2.1. In accordance with t h i s flowsheet,
each i r rad ia ted f i e 1 element w a s brought i n t o the p i lo t plant i n the
shielded carrier-charger (FV-9501). The carrier-charger w a s centered
over the charging chute, and the multiplate element was lowered (by a
zirconiumwire) d i rec t ly i n t o the 5-in.-diam bottom section of the
dissolver (FV-lOOO), where it rested on the dis t r ibutor plate. In
most instances, a second element was placed on top of the f irst . The

c0;;~;5pd' Transfer Tank
4
ORNL Ow9 64-9234 R-l
caustic Scrubber FV-150
KOH Surge Tank
FV- 152 n PI- -
c
i I
_ - I C E L L 2
C E L L I c
NOTES: S h o M vessels ore those which were deconfamihoied NORMAL FLOW LEG€ND U - HF -b--B- FP - Molten SON A Service - I
Fig. 2.1.. Schematic Flowsheet of Equipment in Volatility Pilot Plant.
3
f
3

..-
5
I i i
I P ' 1 4
~
i -
K - Z r - U f luoride salt w a s mixed as a powder, added t o the barren salt
t ransfer tank (FV-1500), melted (mp = Q J ~ O O O C ) , sampled, and transferred
t o the dissolver (a l so called the hydrofluorinator), which had been pre-
heated t o 600-650'~.
hydrous HF w a s d i s t i l l e d batchwise in to the system through the
HF cooler (FV-2004) t o the HF accumulator (FV-1006). quid HF w a s pumped from the accumulator t o the HF vapor generator
(FV-l2O7), where it w a s vaporized; the vapor w a s superheated t o 100°C,
metered, and fed t o the dissolver beneath the dis t r ibutor plate.
HF dissolved i n the salt and reacted w i t h the elements
AlF3 and UF4 (which became par t of the melt) , and hydrogen.
gen, unreacted HF vapor, and ine r t gases from instrument purges l e f t
the dissolver and entered the flash cooler (FV-1001) , where they cbn-
tacted a second stream of l iquid HF pumped from the HF accumulator.
Solids that had been entrained from the dissolver were removed here,
i n the condenser (FV-2001), and i n the HF catch tank (FV-1003).
tha t collected i n the catch tank remained there u n t i l the end of the
dissolution step, when the contents of the tank were transferred t o
the caustic neutralizer (FV-1009).
t r a l i z e r were pumped t o the hot chemical waste.
from the HF' reboiler (FV-1005), and w a s collected i n the HF accumulator
a f t e r passing through f i l t e r FV-7001C and the HF cooler. The hydrogen
and ine r t gases passed through the -5OOC €IF condenser (FV-2005), which removed traces of HF, and were then bubbled through approximately 2
KOH i n the caustic neutralizer. This off-gas stream then joined the
c e l l off-gas stream, received another caustic scrub, passed through
A stream of li-
The
t o produce
The hydro-
Solids
In turn, the contents of the neu-
The HF w a s d i s t i l l e d
absolute f i l t e r s (AEC type),and was then released t o the atmosphere
through the 3020 stack.
After dissolution w a s complete (i .e. , there w a s no further decrease
i n off-gas volume or HF inventory),the HF recirculation w a s stopped,
and the m e l t was sparged with nitrogen t o remove the dissolved HF.
molten salt (mp = QJ55OoC) w a s then transferred t o the fluorinator
(FV-lOOX which had been preheated t o approximately 600Oc; enough salt was l e f t behind t o f i l l the horizontal section of the connecting l i n e
The

6
and thus form a plug,or "freeze valve;' t o separate the hydrofluorina-
t ion equipment and the fluorination equipment.
The fluorinator w a s sparged w i t h nitrogen t o mix the new charge
w i t h any "heel" tha t remained from the previous run, and then the salt
w a s sampled by lowering a copper ladle (on a chain) direct ly in to the
molten salt and "dipping" a s m a l l volume from beneath the surface of
the melt.
product concentrations a f t e r hydrofluorination (md before fluorination)
could be determined. After the sampling procedure w a s complete, ele-
mental fluorine w a s passed through the melt t o convert the UF4 t o uF6
and t o thereby remove it from the melt.
fluorides of f i ss ion products t ha t were formed during fluorination and
were not retained by NaF were MoF6, TeF6, and TcF6.
From such a "feed salt" sample, the ufanium and f i ss ion
"he only important higher
Fluorine at 12 t o 60 psig w a s supplied by a tank trailer parked
outside Bldg. 3019; it entered through a NaF t r ap ( in l e t end heated t o
100°C), which removed HF.
nator through a draft tube, which induced circulation of the melt and improved gas-liquid contacting. Volatile UF6 a vola t i le f i ss ion product
f luorides, 'and unreacted fluorine passed out of the fluorinator through
the movable bed absorber (FV-105); the higher fluorides of most of the
f i ss ion products are nonvolatile, and they remained i n the salt. This
gas stream passed, first, through a section of the movable bed' absorber
containing NaF pel le t s at 400OC. Here, the bulk of the f i ss ion product
fluorides tha t were volat i l ized or entrained were deposited; the F2,
essent ia l ly a l l of the U , Mo, Np, and Tc , and s ignif icant quantit ies of
Zr, Nb, Ru, 12, and Te proceeded t o the next section containing NaF pe l l e t s a t 150°C. The m6 and most of the contaminants were sorbed
under these conditions, while the fluorine, MoF6, and some tellurium
fluorides passed on t o the chemical t r ap (FV-121), which contained NaF
at ambient temperature.
by t h i s trap.
The off-gas w a s then vented t o the c e l l off-gas system (which included
another caustic scrubber) and was f i l t e r e d before being exhausted.
Generally, a s m a l l amount of tellurium w a s released i n the off-gas.
The purif ied fluorine flowed in to the fluori-
The MoF6 and any t races of uF6 were removed
Fluorine w a s removed i n a caustic scrubber (FV-150).

7
Desorption of UF6 (but not f iss ion products) from the 150°C NaF pel le t s i n the movable bed absorber w a s achieved by heating t o 40OoC
i n a fluorine sweep. This gas stream passed, first, through the
impurity t r ap (FV-UO), containing MgF2 at 100°C, fo r the removal of
any technetium and neptunium present and, then, through the product f i l t e r (FV-723) into the s m a l l product cylinder (FV-223) maintained
at -7OOC by dry ice--trichloroethylene slush.
uF6 was removed; the remainder was deposited i n the uF6 cold t raps
(FV-220 and FV-222) held a t -50 t o -6oOc. the chemical t r ap (FV-121) t o remove any traces of uranium and then
passed t o the caustic scrubber as previously.
flashed from the UF6 product under vacuum at O°C, the small product
cylinder w a s removed from the system, weighed, sampled, and assayed
t o confirm weight, composition, and enrichment of the product.
About 70 t o 100% of the
The off-gas exited through
After HF had been
After f luorination, the melt i n the fluorinator w a s sampled t o
determine the degree of removal of UF4 fromthe salt,
sults were received (usually <3 pg of uranium per gram of salt) before
a portion of the NaF pel le t s from the 40OoC section of the movable bed
absorber w a s dumped in to the fluorinator. In the event t ha t the uran-
i u m concentration w a s higher than desired, the fluorination could be
continued u n t i l an acceptable value of residual uranium w a s obtained.
Analytical re-
The NaF pel le t s that were transferred t o the fluorinator were
from the l o w e r section ( 4 O O O C ) of the absorber; since these pe l l e t s
were the first t o be contacted by the fluorination off-gas, they had
the highest concentration of sorbed f iss ion products.
sparged with nitrogen t o a id i n the pe l l e t dissolution; then another
waste s a l t sample w a s taken t o determine the amount of uranium held
by the pe l le t s .
received, the waste salt was transferred t o a waste salt can (FV-112)
located inside a shielded carr ier .
f e r l i n e t o form a freeze valve, as was done f o r the molten s a l t l i n e
between the dissolver and fluorinator. After cooling, the waste salt
car r ie r was transported t o the burial ground, where the waste salt can
w a s dropped in to an underground vault fo r long-term storage.
The salt w a s
After t h i s uranium analysis (usually <8 ppm) w a s
Enough salt w a s l e f t in t the trans-

8
3. PREPARATION OF THE K-Zr-A1 FLUORIDE DISSOLVBNT SALTS
The ternary salt KF-ZrFb-AlF3 w a s considered for the dissolvent i n the aluminum campaign i n the VPP since Thoma, Sturm, and Guinn 5 had shown
it t o be the most sui table solvent system f o r the processing of alumi-
num-uranium fuels. The use of t h i s salt would permit us t o operate at re la t ively low temperatures, thus minimizing corrosion and avoiding
the d i f f icu l t ies tha t would otherwise resu l t from the low melting point
(660Oc) of aluminum.
A portion of the revised triangular plot of liquidus temperature
as a function of composition fo r the system KF-ZrF4-AlF3 i s shown i n
Fig. 3.1. This portion includes the only region w i t h melting points
less than 600Oc. It i s easily seen tha t any dissolution path (e.g.,
heavy, dashed l i nes ) t ha t i s chosen t o maximize capacity w i l l start a t the m a x i m u m allowable melting point, cross a region of lower melting
point, and terminate a t the maximum melting point tha t i s allowable
during fluorination. Obviously, the higher the temperature tha t can
be tolerated, the greater the capacity of the salt fo r aluminum. A
maximum melting point of 600Oc w a s chosen fo r the beginning salt.
permitted operation at a temperature s l igh t ly above the melting point,
and s t i l l allowed f o r a reasonable temperature r i s e (due t o reaction
heat) without a t ta ining the melting point of aluminum.
point at the end of dissolution w a s held t o 55OoC t o l i m i t the corro-
sive e f fec t of elemental f luorine on the nickel f luorinator.
This
The melting
For all four hot runs, barren salt containing 64.3 t o 63.0 mole
% KF and 35.7 t o 37.0 mole % ZrF4 (mp, ~ 6 0 0 O C ) w a s transferred t o the
hydrofluorinator.
carr ied over i n the hydrofluorinator, gave the desired i n i t i a l composi-
tions.
of K2ZrF4 (containing 27% potassium and 32.1% zirconium, by weight) and
ZrF4 (54 t o 54.5% zirconium).
handled i n air; no special precautions were taken, except t ha t a rea- sonable effor t was made t o minimize the time during which the salt was
exposed t o moisture.
These salts, when mixed with the s m a l l "heels"
The binary salts were prepared by dry-mixing commercial grades
The granular salts and mixtures were
t
.

9
COMPOSITION, mole % POINT KF ZrF4 AIF3 POINT
A 64.7 21.1 14.2 J E 57.0 10.0 33.0 K F 75.3 24.7 0.0 M G 66.0 34.0 0.0 N H 63.9 32.9 3.2
ORNL Dwp. 64 -7982
COMPOSITION, mole 96 KF ZrFq AIF3 55.5 28.5 16.0 64.3 35.7 0.0 55.0 30.6 14.4 56.9 18.6 24.5
50 -0
Fig. 3.1. Portion of the KF-Z~FI+-AI.F~ System That is Applicable to the Dissolution of U-A1 Fuels.

10
The mixture w a s melted i n a closed vessel; a nitrogen purge w a s maintained through the vapor space, and a nitrogen sparge w a s used t o promote mixing when melting began. There w a s no evidence (thermal) of H20 evolution at any temperature, although the odor of HF w a s quite evident. The melt w a s c lear and had a low viscosity; t ransfer of the
barren salt in to the system w a s accomplished without diff icul ty .
Although the binary salt j u s t described provided a highly satis-
factory s t a r t i ng material fo r processing U-Al f'uels, we wanted t o de-
monstrate dissolution w i t h a salt i n i t i a l l y containing aluminum. The
aluminum could easi ly be supplied by leaving an aluminum-rich heel i n
the hydrofluorinator. The remainder of the charge would then consist
of K2ZrF6 and KF'; the substi tution of low-cost KF fo r ZrF4 would greatly
reduce the cost of the salt components.
Kz&F~-KF, as outlined, could not be done i n VPP equipment because of design l imitations , p a r t i a l t ransfer ( i .e . , terminating a molten salt
t ransfer at a specified point) had been demonstrated during the z i r - conium campaign.
Although the addition of so l id
We encountered d i f f icu l ty i n all early attempts t o prepare a te r - I
I nary KpZrF4-AlF3 barren s a l t . Although salt materials (i .e. , commer-
c i a l K2ZrF6 and K F , and specially-dried AlF3) were carefully pre-mixed,
fusion was always incomplete.
coarse sand, w a s evident i n the bottom of the melt vessel , while a
layer of undissolved material f loated on the surface of the melts.
When the ternary phase diagram (liquidus temperature vs composition)
w a s examined, revised data showed that these melts had liquidus tempera-
tures about 85Oc higher than those indicated by the former triangular
plot .
A sediment, having the consistency of
1
However, mixtures whose compositions had been adjusted t o the
data of the new diagram exhibited the same character is t ics . Although
the dissolvent salt could not be fused completely, experiments showed
tha t the product salt, a f t e r aluminum dissolution and HF sparging, w a s a single-phase melt and could be transferred readily i n the l iqu id
s ta te . Hence, f o r i n i t i a l operations i n the VPP, the ternary salt
w a s prepared by mixing, melting as much as was possible, allowing the
salt t o freeze, and breaking the frozen salt in to chunks of
-
C

11
c
non-homogeneous solid.
ver. This experimental procedure w a s used only f o r cold runs ( l iqu id
binary salt w a s used i n the hot runs); it w a s reasonably sat isfactory
for cold runs, but would be hazardous if used t o charge a highly con-
taminated hydrofluorinator.
These chunks were then dropped in to the dissol-
A f t e r the last run i n which i r rad ia ted fuel w a s processed (RA-4), In the lat ter a cleanout run w a s made using a dummy aluminum element.
run, a molten W-ZrFq-AlF3 ternary salt w a s t ransferred successfully i n t o t h e system.
which w a s thought t o be the composition of a ternary eutect ic with the
lowest-melting salt i n the immediate area of in te res t . Heating t o
650Oc appeared t o c l a r i fy the m e l t ; however, a f e w inches of sediment
w a s found i n the bottom of the melt vessel. When ZrFq w a s added, t o
increase t h e ZrFq content t o 22.33 mole %, t he sediment disappeared.
It did not reappear upon cooling t o 600Oc.
of the barren salt tha t w a s t ransferred i n t o the system w a s 61.94-22.33-
15.73 mole % KF-ZrFq-AlF3.
The ta rge t composition w a s 63-21-16 mole % KF-ZrF4-AlF3,
Thus the f i n a l composition
4. DESCRIPTIVE DATA FOR THE IRRADIATED U-A1 FUEL ELEMENTS
PROCESSED I N RUNS RA-1, -2, -3, AND -4
4.1 Configuration, Composition, and Method of handling
The i r rad ia ted U-Al fue l elements processed i n t h i s campaign were
of the multiplate box type, w i t h curved f u e l plates , t h a t is used i n
the Oak Ridge Research Reactor (ORR) and the Low Intensi ty T e s t Reactor
(LITR).
in . ( the end boxes had been removed), and the overal l cross section of
each w a s essent ia l ly 3.0 by 3 . 1 i n . There were nineteen 2.8-in.-wide
fuel-bearing plates brazed o r swaged between two s lo t t ed ( i n e r t ) s ide
plates.
When received, t he elements had overal l lengths of 26 t o 27
The cladding and s t ruc tu ra l material w a s aluminum, and the
active" core a l loy was approximately 18% uranium--82% aluminum. The 11
17 "inside" fuel plates were 24.625 in . long (active length, 23.625 in . ) and 0.050 in. thick overal l (core alloy, 0.020 in. ; cladding, 0.015 in .
12
each s ide) . The two fue l plates comprising two sides of the box had
the same alloy core as the "inside" plates,but were 2.520 in. longer
(overall), and the aluminum cladding w a s 1-1/2 times as thick ( fo r an overall thickness of 0.065 in. 1.
Prior t o processing, the elements were stored i n a canal under
approximately 10-1/2 f t of water.
cessing plant, a shielded ( 9 in. of lead) charger-carrier w a s lowered
t o the bottom of the canal. A 0.060-in.-diam zirconium wire, which
had been threaded between the plates of the elements and through an
opening i n the closed end of the car r ie r , w a s used t o slide the ele-
ments, horizontally, from a loading table in to the cavity of the charger-
carr ier . The car r ie r w a s closed, hoisted from the canal, and, a f t e r
appropriate procedures t o prevent the spread of contamination, brought
i n to the processing plant. the top of the charging chute (centered above the dissolver), w i t h i t s
axis ver t ica l and the closed end up.
ing chute valves were opened, and the elements were lowered direct ly
in to the 5-in.-diam section of the dissolver by means of the zirconium
wire that w a s used t o load the elements i n to the carr ier . The wire was
cut while s t i l l under load (the elements were allowed t o drop a f e w
inches); the severed wire withdrew in to the charging chute suf f ic ien t ly
t o c lear the valves closing the top of the chute.
To t ransfer the elements t o the pro-
It w a s placed on the enclosure that shielded
The ca r r i e r drawer and the charg-
4.2 I r radiat ion History
The elements processed i n runs FtA-2, -3, and -4 had been used i n
In the ORR cores, while the FtA-1 charge w a s par t of an LITR fueling.
O M , elements are usually i r radiated fo r periods of 10 t o 1 4 days;
then they are removed from the reactor and allowed t o cool f o r 12 t o
180 days before being reinserted fo r the next cycle.
10% per cycle a re accumulated over four o r f ive cycles u n t i l a t o t a l
burnup of about 28 t o 32% i s achieved.
number of atoms of 235U tha t have fissioned, divided by the number of
atoms of 235U i n i t i a l l y present; thus burnup does not include the 235U depletion suffered i n the formation of 236U by neutron capture.)
Burnups of 2 t o
(Here, burnup i s defined as the
i
d
r

13
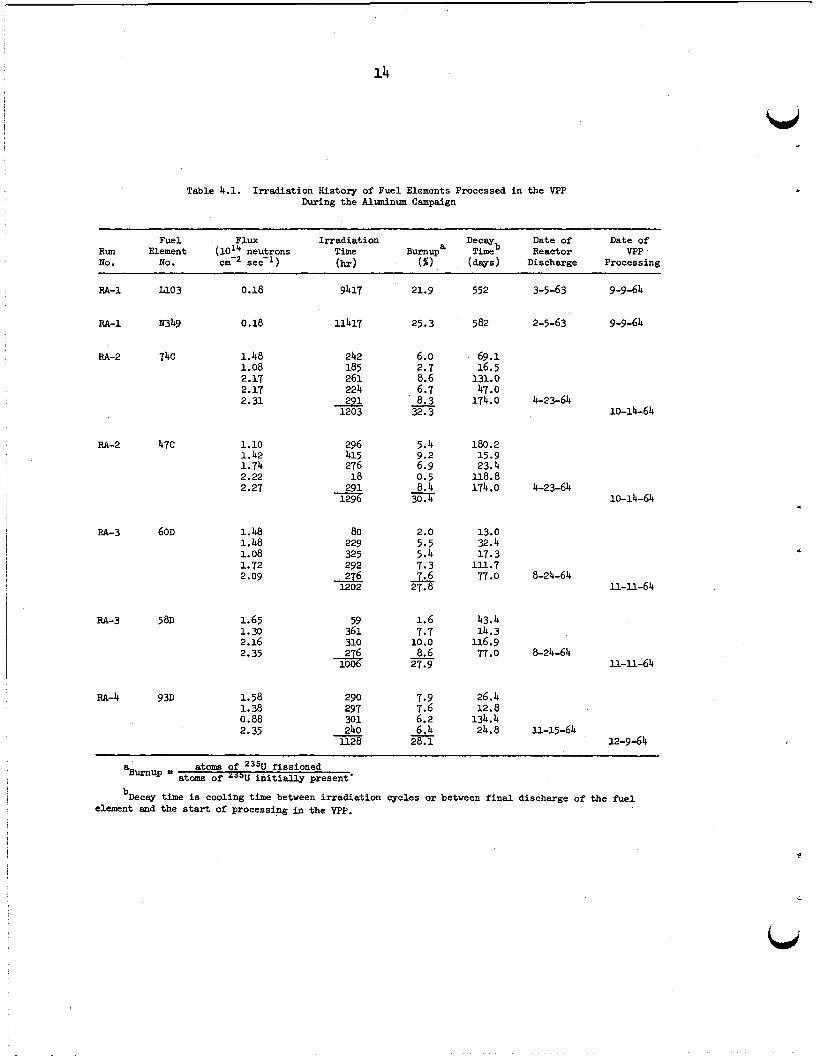
b, The i r radiat ion cycles f o r the fue l elements that were processed
i n the VPP during the aluminum campaign are shown i n Table 4.1. fue l elements 74C, 47C, ~ O D , 58D, and 93D, each l i ne represents an
i r radiat ion cycle f o r a specified time (shown i n hours) i n the reactor
a t the indicated average neutron f lux fo r the element’s par t icular
location.
(or decay) period observed pr ior t o the subsequent cycle are given.
The decay time l i s t e d f o r the l a s t cycle for each element i s the time
from reactor shutdown t o the beginning of the dissolution s tep i n the
VPP.
ing time fo r the element(s) i n each run.
For
Both the burnup achieved during each cycle and the cooling
This value i s usedthroughout t h i s report t o designate the cool-
In the LITR, elements are placed i n the core, where they remain
u n t i l the desired burnup i s achieved. New elements are i n i t i a l l y placed
on the periphery of the core and l a t e r , during the appropriate shutdown,
are transferred t o the center section. The i r radiat ion times l i s t e d i n
Table 4.1 f o r the fue l elements processed i n run RA-1 a re the t o t a l
times the elements were i n the reactor. These times are much longer
than those for ORR fuels because of the much lower f lux i n the LITR.
4.3 Significant Fission Products
The quantit ies of the principal f iss ion products thatwere present
i n the i r rad ia ted fue l elements at the time of t h e i r dissolution a re shown i n Table 4.2.
s l igh t ly overlapping categories: nuclides contributing a s ignif icant
par t of the t o t a l radioactivity, and nuclides tha t , due t o v o l a t i l i t y
at various times during processing, must receive special consideration
regardless of the amount present.
were calculated, using the CRUNCH code, and take in to account the a l te r -
nate periods of i r radiat ion and decay described i n Sect. 4.2.6 (The complete tabulation of the quantit ies of f iss ion products present i s
given i n Table A-1 i n Appendix A . )
These f iss ion products are divided in to two
The quantit ies given i n the tab le
The most important determinant of the radioactivity contributed
by a par t icu lar nuclide at a specific cooling time is i t s ha l f - l i fe
14
Table 4.1. Irradiation History of Fuel Elements Processed i n the VPP During the Alminum Campaign
Fuel Flux Irradiation Decw Date of Date of Run Element (10'; neutrons Time Burnupa Timeb Reactor VPP No. No. cm sec-1) (hr) ( b ) ( d a y s ) Discharge Processing
RA-1 U03 0.18
RA-1 N349 0.18
RA-2 74c 1.48 1.08 2.17 2.17 2.31
RA-2
RA-3
RA-3
RA-4
47c
60D
5 8D
93D
1.10 1.42 1.74 2.22 2.27
1.48 1.48 1.08 1.72 2.09
1.65 1.30 2.16 2.35
1.58 1.38 0.88 2.35
9417
ll417
242 185 261 224
291 1203
296 415 276 18
291 1296
80 229 325 292
1202 276
59 361
3 290 297 301 240
1128 -
21.9
25.3
6.0 2.7 8.6 6.7 8.3
32.3
5.4 9.2 6.9 0.5 8.4
30.6
-
2.0 5.5 5.4
$ 1.6 7.7
10.0 8.6
27.9 -
7.9 7.6 6.2 6.4
28.1 -
552
5 82
69.1 16.5
131.0 47.0
174.0
180.2 15.9 23.4
118.8 174.0
13.0 32.4 17.3
111.7 77.0
43.4 14.3
116.9 77.0
26.4 12.0
134.4 24.8
3-5-63 9-9-64
2-5-63 9-9-64
4-23-64 10-14-64
4-23-64 10-14-64
8-24-64 11-11-64
8-24-64 11-11-64
11-15-64 12-9-64
atoms of 23% fissioned '-UP = atoms of zjau i n i t i a l l y present'
'Decay time is cooling time between irradiation cycles or between f ina l discharge of the fue l element and the start of processing i n the VPP.

Table 4.2. Pr inc ipa l Fission Products Present i n I r r ad ia t ed Fuel Elements Processed
Fission product a c t i v i t i e s a re corrected t o time of d i sso lu t ion
Nuclides Contributing S igni f icant ly t o the Tota l Act iv i ty of I r r ad ia t ed U-Al Fuels
Calculated Act iv i ty i n Fuel Charge a t Time of Processing
Half -Id f e cur ies Nuclidea Years Days RA-1 RA-! d - 3 RA-bO
85Kr
* 9 ~ r
9 0 ~ r
91Y 9 5 b e
9 5 ~ e ,f
' 3Ru
1311
3 3 ~ e 137csC
140Ba
1 4 k e
14 3 ~ r
l 4 4 ~ e
lb7Nd 14 7pmf
Cooling Time (&,SI
10.27
28
1.0
33
2.6
54
58 63 35 41
8.05 5-27
12.80 32 13.7
290 ll. 3
47
377
31 70
167
323
2338
1081
567
C
2252 450
3131 3874 7342 748 445
383
761
7703
17 30
174
6036 40 3
7973 9189
14505 2766
491
342 331
4059 442
8964
1676
77
6306
7928 8333 7523 39 86
2293 2261
8243 8559 8378 4550 3126 7 34
25
~ ~
Vola t i le and/or Otherwise Troublesome Nuclides Calculated Act iv i ty i n Fuel
Charge at Time of Processing Half-Life (cur ies
Nuclidea Years Days RA-1 RA-2 2 - 3 RA-4b
85Kr
9 9 ~ ~
3Ru
125%
l2 7Sb 127Tef
129Te 1311
132Te
1 3 3 ~ e
Cooling Time (days )
10.27 2.8 41
1.0
2.7 3.9
90 33 8.05 3.2 5.27
47.3 59.5 54.1 d
0.5 748 2766 167 445 491
9.3 14.7 14.1
1.7 51.4 100
33.8 171 8.5
24.2 148
3986 242
6.5 30.9 48.2
341 2293 2 32
2261
567 174 77 25
%he first nuclide i n each decay chain t h a t contributes a s ign i f i can t f r ac t ion of t he total . a c t i v i t y a t t h e time of process- i ng is tabulated. with the nuclides l i s t e d .
A "true" t o t a l ac t iv i ty would a l s o include the a c t i v i t y of the short-l ived daughters i n secular equilibrium
bThe fuel charge i n t h i s run was only one element.
'Less than 1/21 of t h e t o t a l of the a c t i v i t i e s tabulated.
%ess than 0.01 curie.
eIn addition t o contributing s ignif icant ly t o t h e t o t a l dose, t he nuclide i s a lso v o l a t i l e under ce r t a in conditions.
'A second s ign i f i can t nuclide i s shown because the parent-daughter re la t ionships do not f u l f i l l t h e requirements f o r secular
Two elements were used i n each of t h e o ther t h ree runs.
equilibrium.
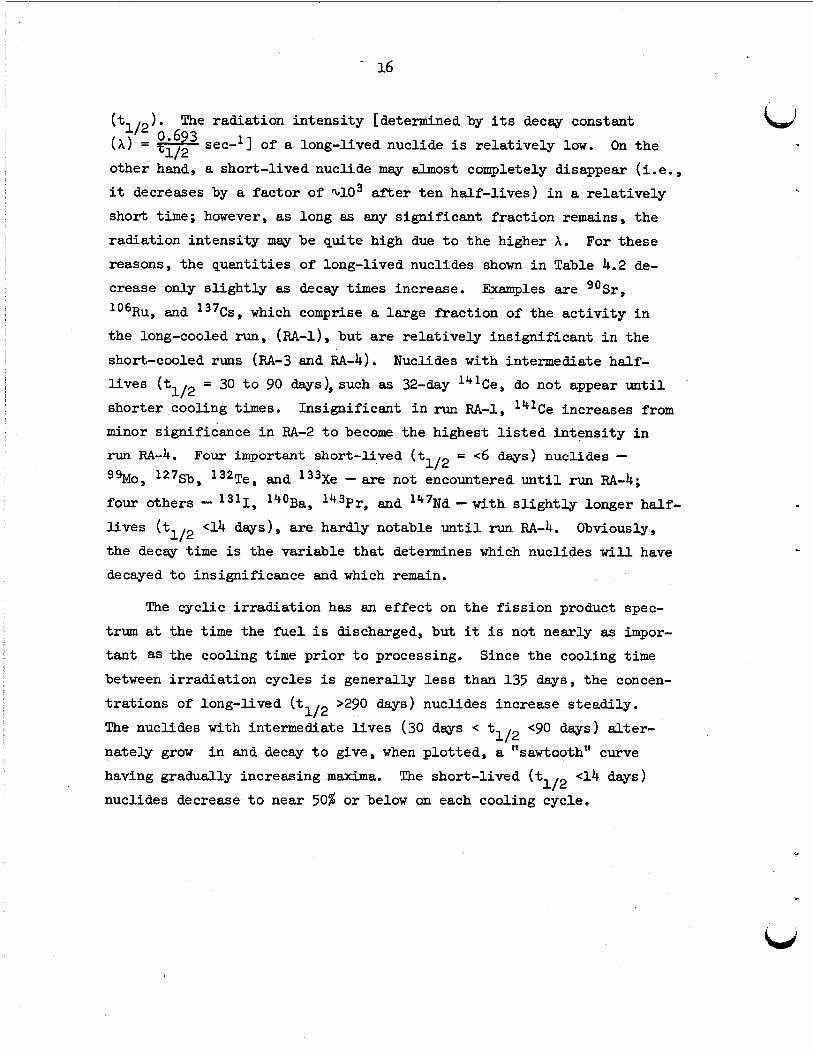
(t ). The radiation intensi ty [determined by i t s decay constant
( A ) = &- sec-l 1 of a long-lived nuclide i s relat ively low. On the 'I2 0.6 3
other h a k , a short-lived nuclide may almost completely disappear (i.e.,
it decreases by a factor of %lo3 a f t e r ten half-l ives) i n a relat ively
short t i m e ; however, as long as any s ignif icant f ract ion remains, the
radiation intensi ty may be quite high due t o the higher A. For these
reasons, the quantit ies of long-lived nuclides shown i n Table 4.2 de-
crease only s l igh t ly as decay times increase.
lo6Ru, and 137Cs, which comprise a large fraction of the ac t iv i ty i n
the long-cooled run, (RA-l), but a re re la t ively insignificant i n the
short-cooled runs (RA-3 and RA-4). Nuclides with intermediate half-
l ives (t
shorter cooling times.
Examples are 90Sr,
= 30 t o 90 days) , such as 32-day 14'Ce, do not appear u n t i l 1/2
Insignificant i n run RA-1, 141Ce increases from minor significance i n RA-2 t o become the highest l i s t e d in tens i ty i n run RA-4. 99M0, 127Sb, 132Te, and 133Xe - are not encountered u n t i l run RA-4; four others - 1311, 140Ba, 143Pr, and 147Nd -with s l i gh t ly longer half-
l ives (t the decay time is the variable tha t determines which nuclides w i l l have
decayed t o insignificance and which remain.
Four important short-l ived (t = <6 days) nuclides - 1/2
4 days), are hardly notable until run RA-4. Obviously, 1/2
The cyclic i r radiat ion has an e f fec t on the f i ss ion product spec-
trum at the time the f'uel i s discharged, but it i s not nearly as impor-
tan t as the cooling time pr ior t o processing. Since the cooling time
between i r radiat ion cycles i s generally l e s s than 135 d a y s , the concen-
t ra t ions of long-lived (t The nuclides with intermediate l i ves (30 days e t nately grow i n and decay t o give, when plot ted, a "sawtooth" curve
having gradually increasing maxima. The short-lived (t e14 days)
nuclides decrease t o near 50% or below on each cooling cycle.
>290 days) nuclides increase steadily. 1/2
e90 d a y s ) a l te r - 1 /2
1/2
L'

5. DISSOLUTION OF FUEL ELEMENTS, AND VOLATILIZATION OF
UF6 FROM THEMELT BY FLUORINATION
5.1 Dissolution of Spent Assemblies i n Molten K-Zr-A1
Fluoride Sal ts
During the dissolution (hydrofluorination) of U-Al fue l elements,
HF is vaporized i n a steam-jacketed vessel, superheated t o 100°C i n an e lec t r ica l ly heated co i l , and fed t o the dissolver (hydrofluorinator)
through a l i n e maintained at an average temperature of approximately
500°C (by autoresistance heating). The HF, which enters the dissolver
beneath a dis t r ibutor plate , i s assumed t o be a t the temperature of the
salt by the time it contacts the element. Although the HF feed rates
may appear low (20 t o 130 g/min), they represent f a i r l y high volumetric
ra tes at 400 t o 600Oc.
represents about 0.1 f t 3 at h O o C and 0.127 f t 3 at 60OoC (average salt
temperature).
For example, each gram of HF, fu l ly dissociated,
The conditions and resu l t s (including data fo r the fue l charge,
salt compositions, dissolver temperatures, dissolution ra tes and times
required t o a t t a in 90% and 100% completion, and HF feed rates , consump-
t ion, and u t i l i za t ion) fo r the ten aluminum dissolutions i n the VPP are shown i n Table 5.1. The runs were made i n the chronological order
shown.
order of decreasing cooling time for the fue l elements processed:
approximately 540 days ; RA-2, approximately 180 days ; RA-3 , approximately
80 days; and EA-4, 25 days.
cause it involved a dissolution of aluminum comparable t o others i n the
series.
The runs i n the FtA (Radioactive, Aluminum) series are l i s t e d i n v
RA-1,
A cleanout run, DA-3, is discussed only be-
The elements dissolved i n the DA (Dummy, Aluminum) and UA (Uranium-
Aluminum) runs w e r e l7-plate aluminum dummies cut t o the appropriate
length t o give the desired weight.
added as finely powdered UF4 packaged i n aluminum f o i l t ha t was less than
1 m i l t h i c k . A double charge of UF4 w a s added i n run UA-1 so tha t a mea-
surable amount of uF6 product (>lo0 g) could be withdrawn from the system
after a uranium inventory near the normal steady-state value was established.
In the UA runs, the uranium was

18
Weight Ifrdroiluorinator Mssolution T i w s HF Flow For 905 For 100% Al Dissolutian Rates (k/h r) w cans\rmed h l t en Wt Ccamositioa (mole $1 Temeratun ( "C 1c of Fuel
mm Al U Initial0 Find . salt vapor R a t e Completion Caapletlon TO go% To 100% auantitr z of No. (kd (8 ) K zr Al IC Z r Al section 8cction (&in) . (IW) (hr) Dissolution Dissolution (he) Theoret
M-1
DA-2
UA-1
' UA-2
UA-3
RA-1
RA-2
e-3
RA-4
7.81
7.9
6.V
6.62
4.2
8.80
8.24
8.17
4.2
0
0
592
304
304
323
306
324
159
64.0 36.0
64.4 22.0
63.9 20.8
63.2 33.5
64.3 35.7
64.3 35.7
62.4 34.6
62.8 36.8
62.1 36.4
0
U.6
15.3
3.3
0
0
3.0
0.4
1.5
53.8 30.2
55.1 18.8
55.1 18.0
.55.0 29-1
57.9 32.2
55.0 30.6
55.4 30.8
55.1 32.3
55.5 32.6
16.0 610 .
26.1 616
26.9 604
15.9 620
9.9 615
14.4 608
13.8 . 603
12.6 575
11.9 575
480
500
460
505
475
467
475
k70
440
125-80
70-120
l00-h
130-50
125-40
125-75
100
40, 100
20-100
23.1
8.9
12.3
22
16.8
16.6
15-5
8.0
10 .o
28.4
12.8
16.8
26
22.6
25.0
i5.5
24.5
12.3
0.304
0.799
0.497
0.271
0.225
0.494
0.503.
0,969
0. 378
0.275
0.616 .
0.403
0.255
0.186
0.364
0.353
0.555
0.33
19.2
17.6 .
16.0
. 15.1)
10.9
20.2
19.7
20.4
9.8
ll0.
lll.
106.
104.
115.
100.
102.
m6. . 105.
M-3 3.96 1 61.5 23.0 15.5 56.1 21.0 22.9 585 490 60, 1 0 0 9.7 10.7 0.37 0.37 9.9 ll2.
%ere, %ydrOflWriMtiOn" and "dissoluticn* an used interchsngedu. bCorrected for heel f r o m pnvlous run. 'Average.
i c
Represents c y c l i c behavior (within 10 to 15OC of the stated value).
. .. . . ~ .: . 1. . .. , . .. . . ..,
RF Utilization
Dissolution Masolution - - A t 90% A t 100%
9.6 9.3
29.8 22.8
21.8
8.7
8.U
18.0
18.6
50.7
18.7
14.9
19.2
8.1
7.84
14.3
13.1
24.2
16.0
14.9

! --
a , - ..
1 - I
r -
kd
I n the RA runs, the charges were LITR (RA-1) and ORR elements (RA-2
through RA-4) t h a t had been i r radiated t o burnups of 22 t o 32%.
The barren salts for all the runs except three (DA-2, UA-1, and
DA-3) were binary mixtures consisting of approximately 64 mole % KF
and 36 mole % ZrF4.
and ZrFq.
tained 0.4 t o 3.3 mole % AlF3 supplied by heels l e f t i n the hydro-
fluorinator from the previous runs.
i n i t i a l AlF3 w a s obtained by adding a ternary salt t o the hydrofluori-
nator as a sol id; i n run DA-3, the target composition w a s a ternary
eutect ic with a melting point suff ic ient ly low t o permit the ternary
salt t o be transferred as a l iquid. A l l the "final" melts contained 54 t o 58 mole % KF and e i ther 29 t o 32.5 mole % ZrF4-10 t o 16 mole % AlF3 or 18 t o 21 mole % ZrF4--23 t o 27 mole % AlF3, depending on the
i n i t i a l AlF3 content; each w a s readily transferable.
They were prepared from commercial-grade KzZrF6
The " in i t i a l " salts (Table 5.1) i n four of the runs con-
In runs DA-2 and UA-1, the high
Temperature w a s not investigated as a process variable; the tem-
peratures used w e r e simply those which we believed would approach the
minima needed t o give acceptable operational performance.
The range of the €IF' dissolvent flow ra t e w a s also chosen from the
standpoint of operational experience.
variable were not made, and no attempt at optimization with respect
t o any par t icular parameter w a s made. HF flow rate low, since the HF tha t w a s not u t i l i zed i n a par t icular
pass w a s recycled; the only additional costs re la ted t o high flow ra tes
were those connected w i t h pumping and heating (or cooling).
high gas flow rates, salt entrainment could be troublesome.
equipment a t B l d g . 3019, the pract ical upper l i m i t of the HF flow r a t e
(%130 g/min) i s determined by the refrigeration capacity at low HF u t i -
l izat ion.
can impose an upper l i m i t on HF feed rate .
Systematic changes i n t h i s
It was not necessary t o keep the
A t very
In the
A t high utilization,pressurization of the off-gas system
Heat evolution during dis-
solution w a s never a problem during the aluminum campaign. A lower
l i m i t would probably be imposed by the control system, but t h i s was
not explored; the equipment functioned very sa t i s fac tor i ly at the lowest
HF r a t e used, 20 g/min.
' \

I
20
i
The 9- t o 23-hr periods required fo r 90% dissolution, and the 13-
t o 28-hr periods required fo r 100% dissolution, are based on the actual
b volumes of HF consumed, which were recorded as a function of t i m e dur-
ing each run. HF consumptions.
These volumes ranged from 100 t o 116% of the theoret ical
The tabulated HF u t i l i za t ion values range from 8 t o 50% and corre-
l a t e ra ther well w i t h the HF flow ra tes ; tha t i s , the higher the flow
ra t e , the lower the ut i l izat ion.
w a s too rapid t o be effective.
creased the reaction r a t e even s l igh t ly , by such means as increased tur- bulence, be t te r film coefficients, gas phase reaction, or improved
temperature distribution, it might be jus t i f ied .
This means tha t the r a t e of HF sparging
However, i f t h i s added throughput in-
Correlation of aluminum dissolution rates w i t h run parameters i s d i f f i cu l t since three aluminum-uranium systems, t w o s a l t compositions
(as w e l l as intermediate ones), and two schemes of feeding HF were used.
The aluminum dissolution r a t e and the HF feed r a t e are plot ted vs run
time fo r each of the ten dissolutions i n Appendix A.
A-10 show tha t the average rates and times f o r dissolution are not en-
t i r e l y representative of what i s taking place.
Figures A-1 through
Some runs show high rates
i n i t i a l l y , while others start low and gradually increase f o r several
hours. Some decrease rapidly, whereas others tend t o become constant
at different levels .
dissolution i s approached, although the length of t h i s t a i l i n g varies
widely.
A l l are characterized by a " ta i l ing out" as t o t a l
A s mentioned ea r l i e r , alminum dissolution ra tes and the completion
of dissolution are inferred from periodic readings of the inventory of
l iqu id HF i n the recirculating system. These readings are subject t o
the usual instrument and reading errors ; t h i s m a y explain some of the
roughness of the plots , which were smoothed t o some extent by averaging.
The i n i t i a l dissolution rate i s probably the l ea s t r e l i ab le of all
since changes i n inventories i n pipes, vapor spaces, the salt i t s e l f ,
etc. are a l so involved. The point at which dissolution is complete i s
very d i f f i c u l t t o detect.
t o be the point at which 90% of the HF required t o achieve 100%
The 90% leve l of dissolution is considered

21
LJ
- - . :.
r
dissolution ( the point a f t e r which no fur ther decrease i n HF inventory
occurs) has been consumed.
90% dissolution rate . This time i s then used t o calculate the
Although the data f o r 100% dissolution are admittedly not precise,
and the dissolution r a t e curves are somewhat e r r a t i c , the dissolution
times and average ra tes based on 90% dissolution are f a i r l y accurate
and meaningful and can be used t o d r a w some val id conclusions regarding
the pr incipal variables. By comparing runs DA-1 and DA-2, which were
similar except f o r the aluminum contents of the i n i t i a l salt charges,
we must conclude tha t the salt with the higher aluminum content exhibi ts
dissolution ra tes two t o three times that of salt containing no a l u m i -
num i n i t i a l l y .
90% completion) confirms th i s .
is only one-half t ha t of DA-2; however, the times are consistent since
the weight of f u e l used i n run DA-2 w a s twice tha t i n DA-3 and hence
twice the a rea w a s available fo r dissolution.)
run UA-1 w a s similar t o tha t dissolved i n DA-2, except tha t it contained
a re la t ive ly large amount of UF4. We believe tha t the longer dissolu-
t i on time t h a t w a s required t o achieve 90% completion i n run UA-1 (see
Table 5.1) i s a s t a t i s t i c a l variation since the RA- runs give no indi- cation t h a t the presence of uranium inh ib i t s dissolution.
similar t o DA-1 except that s m a l l amounts of aluminum and uranium were
The short dissolution time i n run DA-3 ( i .e . , 9.7 h r t o
(Note tha t the dissolution r a t e i n DA-3
The salt dissolved i n
Run UA-2 w a s
included i n t h e i n i t i a l salt; the same slow dissolution w a s observed. From a comparison of runs UA-3 and RA-I,, we conclude tha t i r rad ia t ion
has no 'discernible e f fec t on dissolution ra te ; dissolution times fo r
equal-sized salt charges were equal, although the weight of metal i n
the charges differed by a fadtor of 2.
t h i s conclusion w a s provided by the r e su l t s obtained i n run RA-2, which
w a s a duplicate of run RA-1 except tha t the salt f o r RA-2 i n i t i a l l y
contained 3 mole % A P 3 .
Further j u s t i f i ca t ion f o r
Dissolution r a t e s were considerably higher (from the standpoint
of t o t a l t i m e required o r i n terms of r a t e per un i t area of aluminum)
i n runs RA-3 and -4 than i n runs RA-1 and -2. Three variables, which

22
i
could cause different dissolution rates, were:
temperature, and the HF flow rate. on dissolution r a t e have not been studied. Based on resu l t s i n other
runs and on previous operating experience, we would not expect the first two t o cause significant changes i n dissolution rate. In a l l the
runs pr ior t o RA-3, the €IF flow rate w a s increased up t o the maximum (125 t o 130 g/min) as soon as possible. A s cooling times became shorter,
however, we decided t o react the bulk of the elements at lower flow
ra tes and not r i s k the production of "bursts" of off-gas, which, i n
turn, would cause pressurization of the off-gas system.
that loca l cooling effects of t he excess gas o r hydraulic e f fec ts
(especially while the multichannel configuration is s t i l l i n t a c t ) could
affect dissolution rate.
the ZrF4 content, the
The ef fec ts of these parameters
It i s possible
5.2 Conversion of the Dissolved UF4 t o UF6, and Transfer of the
Volatilized uF6 from the Melt t o
NaF Absorber Beds Using Elemental Fluorine
During the fluorination step, elemental f luorine i s admitted at the bottom of the fluorinator through a draft tube.
th i s tube i s t o increase circulation within the melt. In the fluorina-
t o r , the fluorine contacts the molten salt and reacts w i t h the dissolved
UF4. the vapor space in to the movable-bed (NaF pe l l e t s ) absorber.
o r nearly horizontal,* section of t h i s absorber, which i s maintained
The purpose of
Both the UFg tha t is formed and the excess fluorine pass up through
The lower,
*The movable-bed absorber was or iginal ly constructed w i t h a horizon- tal section and a ve r t i ca l section. During i n i t i a l t es t ing , it became apparent tha t t i l t i n g the uni t down (with respect t o the entry point) would result i n a longer effect ive length of horizontal section due t o the angle of repose of the pe l le t s ( ~ 4 5 ' ) . section, rather than i n the ve r t i ca l section, is desirable since the horizontal piston can easi ly move any s intered pe l l e t s i n th i s section. Hence, the unit w a s t i l t e d 15O i n the VPP, resul t ing i n the displace- ment of the horizontal and the ver t ica l sections 15' from the horizontal and the ve r t i ca l axes, respectively.
Absorption i n the horizontal
. s j

23
hd .r
at 4OO0C, removes most of t he f i ss ion product f luorides t h a t a r e vola-
t i l i z e d from the melt; the UF6 passes t o the upper, o r ve r t i ca l , section
(maintained at 1 5 O o C ) , where it i s sorbed quantitatively.
MOF6 passes through t o a 20 t o 3OoC NaF t rap , which i s used t o remove any
UF6 that could have passed through the 1 5 O o C t rap.
scrubbed with an aqueous caust ic solution (thus removing the f luorine)
and then combined with the c e l l off-gas; the resul t ing off-gas stream
i s scrubbed with caustic and, f ina l ly , is f i l t e r e d and vented t o the
stack.
A t 150°C the
The off-gas i s
The conditions and r e su l t s fo r seven fluorination-sorption and de-
sorption runs and two simulations are presented i n Table 5.2.
run, the melt-gas interface w a s within the lower 15-1/4-in.-ID cylin-
d r i ca l section of the fluorinator.
measured by a thermocouple i n a well s i tuated beneath the surface of
the m e l t . This temperature w a s held only as high as w a s considered
necessary t o maintain the salt as a l iquid; the purpose of such tempera-
t u re control, of course, w a s t o minimize corrosion. The density of the
salt w a s measured by a differential-pressure c e l l t h a t w a s placed across
two bubbler probes stationed 5 in . apart.
In each
The temperature of the salt w a s
The uranium concentration i n the fluorination salt w a s obtained
by analyzing a sample of the salt i n the fluorinator.
were taken from beneath the surface of the melt by using a copper l ad le suspended on a Monel chain.
a composite of the dissolution product from the current run (including
the heel l e f t i n the hydrofluorinator from the previous run) and the
heel left i n the f luorinator from the previous run. The l a t t e r heel
contained very l i t t l e uranium; thus it acted only as a diluent.
Sa l t samples
Each sample tha t w a s w i t h d r a w n w a s actual ly
Fluorination r a t e s f o r the hot runs were 6 and 11 s t d l i ters/min.
The lower rate w a s used i n the first par t s of the runs i n an e f f o r t t o
produce more uniform loading of the NaF p e l l e t bed during the period
when uF6 evolution w a s most rapid. The higher ra te , which served t o
improve the circulat ion of the salt through the draft tube, was used
l a t e r i n the runs i n an attempt t o minimize the amount of uranium l o s t

Table 5.2. Conditions and Results for Fluorination-Sorption and Desorption Runs in the VPP
First two runs were practice runs with no uranium; solid UF4 Was added to the salt in the next three runs; in the last four runs, irrsdiated fuel elements were processed.
F2 U in U Utili- Waste
salt Absorber Temueraturec ("C) (%) zone 1 Zone 2 Zone 3 Zone 4 (ppd
F2 Flow Fluorination Salt Level Above Temp-
Time ration (inin)
Rm Volume Draft Tube erature Density Concentration Ratg NO. cycle' (liters) (in.) ("C) (g/cc) (g/kg salt) ( S W )
DA-1 Fl-Sorp DeSOrp
M-2 F1-Sorp
UA-1 F1-Gorp Desorp
UA-2 Fl-Sorp Desorp
UA-3 F1-Sorp D e S O r p
RA-1 Fl-Sorp Desorp
RA-2 F1-Sorp No. 1
No. 2 Fl-Sorp
D e S O r p
RA-3 F1-Sorp No. 1
No. 2 F1-Gorp
Desorp
RA-4 F1-Sorp
D e S O r p
77.0
73.2
63.3
74.0
63.3
70.6
69.7
54.3
64.8
40.0
54.3
10.9 605
9.7 615
6.4 560
10.0 5%
6.4 600
8.8 610
8.5 550
3.3 550
6.9 550
-1.6 550
3.3 550
2.40
2.20
2.24
2.46
2.46
2.45
2.46
2.50
2.52
2.48
2.51
2.314
1.808
0.976
1.048
0.616
1.433
0.994
0 769
1.351
6, 13 17s 15 1 100
1, 18 8, 30
6. 15. 11 101, 20, 19 1 230
7, 12 81. 24 1 218
6. 11 76, 24 1 271
6, ll 71, 24 1 191
6. 11 73, 22
6. 11 68; 22
1 255
6, 11 65, 20
6, 11 60, 18
1 226
6, 11 55, 20- 1 215
2 .%
3.7
2.0
2.5
1.5
2.9
2.5
1.3
3.2
395 392
180
392 392
398 400
402 406
401 400
396
393
395
405
406
403
398 400
170 150 ll0 300 300 290
Amb.' Amb.d Amb.'
125 160 141 375 380 375 2.6
155 137 143 <1 375 418 400 10
130 171 150 1.4 375 375 375 1.6
149 146 146 1.6 400 430 380 1.6
175 154 138 1.5
162 154 136 5.2
398 428 400 16.7
146 160 150 8.65
148 170 149 6.95
385 433 398 13.80
154 147 153 e0.1- 395 430 398 5.35
~ ~~~
'LF1 = fluorination; ~ o r p = sorption; ~ c s o r p = desorption. b S W = standard liters per minute. 'Zone 1: 400°C zone; 'Amb = ambient.
Where more than one rate is given, the rates correspond to the times listed in the adjacent column. zone 2: temperature transition zone; zone 3: UFg sorber; zone 4: cleanup section ( i n flow-path only during desorption).
c . b U . c

25
bsl) 3
i n the waste salt. Fluorine u t i l i za t ion w a s calculated by assuming
tha t one mole of f luorine reacted per mole of UF4 present i n the salt. The absorber temperatures shown i n Table 5.2 a re averages over the
fluorination period.
The most important values i n Table 5.2 are the uranium concentra-
t ions i n the waste salt (shown i n the last column).
l i s t e d f o r runs UA-2 through RA-1 and fo r RA-4 i s the uranium content
of the melt a f t e r f luorination; the second value i s the concentration
a f t e r the UFg had been desorbed from the NaF-filled movable-bed absorber
and a batch of NaF pe l l e t s had been discharged from the horizontal sec-
t ion , which i s maintained at 4OO0C, i n to the fluorinator. In runs RA-2
and -3, two fluorinations were made without an intervening desorption
o r p e l l e t discharge.
from the f luorinator i n the manner described ea r l i e r .
The f i rs t value
All salt samples (except i n run UA-1) were taken
As i n the zirconium campaignY1 the uranium concentration i n the
melt after fluorination seemed t o vary i n a random fashion when it w a s
only a few parts per million. Any correlation of t h i s concentration
w i t h f luorination time, temperature, i n i t i a l concentration, irradia-
t i on , batch s i ze , o r melt depth w a s not obvious i n the range of the
variables investigated . The amount of uranium returned t o the f luorinator i n the NaF pe l l e t s
from the 40OoC absorber bed should be a function of sorption and desorp- t i on conditions, but not of f luorination conditions. The higher losses
i n runs RA-2 and -3 were probably the result of loading the bed v i a two
fluorination-sorption cycles pr ior t o desorption.
times at the maximum desorption temperature (400OC) would have reduced the amount of uranium t h a t w a s returned. of uranium returned might be greater than t h a t which could be economically
discharged, the melt could be fluorinated repeatedly u n t i l the uranium
Possibly, longer
In instances where the amount
concentration reached the desired terminal level .

26
5.3 Distribution of Significant Fission Products During
Dissolution, Fluorination, and Desorption
During the dissolution step, unreacted HF w a s condensed in to a
catch tank and then revaporized and returned t o the recycle system.
Any par t iculate matter w a s collected i n t h i s catch tank.
reaction product) and noncondensables passed through t o a tank contain-
ing caustic (2 - M KOH), called the caustic neutralizer ( K N ) , where the
gaseous mixture was bubbled through approximately 3 f t of l iquid. A t
the end of each run, the HF heel i n the catch tank was discharged t o
the KN; thus, all of the f i ss ion product material t ha t w a s collected
from the hydrofluorination off-gas w a s represented by samples from the
KN. In a somewhat similar manner, the unreacted fluorine from the
fluorinator, a f t e r passing through an NaF absorber and a uranium clean-up t rap , entered a scrubbing tower where it was reacted w i t h c i r -
culating 2 KOH. A sample of the scrub solution w a s representative
of the radioactive material tha t w a s evolved during fluorination or
desorption and removed i n the scrubber.
Hydrogen (a
The amount of radioactive material tha t was released t o the stack
w a s calculated from the analyses of a charcoal t r ap through which a sam-
ple of gas from the bottom of the stack had been drawn.
active noble gases were assumed t o be released upon dissolution (measure-
ments of the radioactivity leve l of the off-gas being discharged through
the stack were made, but the relat ively s m a l l amount of radioactive
material t ha t w a s released during dissolution precluded quantitative
resu l t s using th i s method ).
had been transferred t o the fluorinator a f t e r hydrofluorination.
it was sampled both before and after fluorination, and after the NaF pel le t s had been discharged from the absorber bed.
The radio-
The molten salt w a s not sampled u n t i l it Here
Agreement between
samples taken before and after fluorination w a s not goodc
the values obtained fo r most f iss ion products were higher (as predicted
by laboratory investigation) a f t e r fluorination; th i s w a s unexpected,
based on representative samples of a homogeneous melt.
radiochemical analyses were made of samples withdrawn before and a f t e r
I n general,
In one run, 8
27
'U
*
hd
the N U pe l l e t discharge, but the sens i t iv i ty of the resu l t s w a s not
high enough t o permit an estimation of the ac t iv i ty returned t o the
m e l t by the pe l le t discharge.
values presented l a t e r w i l l be the higher of the pre- and postfluorina-
t ion samples.
In all cases, the "salt" ac t iv i ty
The amounts of significant f iss ion products found i n the salt,
HF, fluorine, off-gas scrubber solutions, the UF6 product, and the
stack effluent are tabulated l a t e r i n t h i s section fo r each hot run. As mentioned i n Sect. 4.3 , a part icular f iss ion product may be impor-
t an t because it i s troublesome (vola t i le , e tc . ) o r because it contri-
butes s ignif icant ly t o the general radiation background. In the ea r l i e r
runs, the long-lived f iss ion products were the most important; however,
as cooling times decreased, the nuclides with intermediate and short
half-lives received more attention.
clides with half-lives on the order of eight days or less; these
nuclides had not been present previously i n appreciable quantit ies i n
molten salt processing.
expected at the time of processing (machine calculation by the CRUNCH
code) with the t o t a l s actually found by radiochemical analyses, we con-
cluded tha t agreement of these values within a fac tor of 2 i s satis-
factory and tha t agreement within an order of magnitude i s not t o be
considered grossly i n error.
In run RA-4, emphasis was on nu-
In comparing quantit ies of the various nuclides
In run RA-1 (two LITR elements cooled 19 months, Table 5.31, the
long-lived nuclides 90Sr, lo6Ru, 137Cs, and 144Ce provided the major
percentage of the radioactivity; i n addition, some 95Zr-95Nb (tl12 = 65 days) and 127Te (tl12 = 90 days) were s t i l l present a f t e r a cooling
period of 570 days.
but this nuclide has a long half- l i fe (2.7 years) and i s expected t o
Only a low y ie ld of 12'Sb (0.023%) w a s obtained,
I be vola t i le (as i n the zirconium campaign) during hydrofluorination.
Results confirmed tha t the antimony and the tellurium were vola t i le ,
while the other nuclides remained i n the salt.
In run RA-2 (two ORR elements cooled 175 days, Table 5.4), three
additional nuclides - 89Sr, lo3Ru, and 129Te - are present; however,

Table 5.3. Distribution of Significant Fission Products in Run RA-1
Calculated Distribution of Radioactivitya,b in Run Caustic Caustic Radioactivity Used in Used in Off-Gas uF6 Released of Fuel
Fission salt HF System Fp System Scrubber Product to Stack Total Element Anal./Calc. Product (curies) (curies 1 b c i 1 (mci 1 (PCi 1 (mci 1 (curies ) (curies) ( % I
9% 46 <1 46 377 12
9 5 ~ r 14 <lC 14 31 45
<lC 38.3 70 55
1 2 5 a
27Te
l(O.1)
1 1
0.95
0.03
9.3 10.2
1 . 7 1.9
237 323
1162 2338
73
50
Quantities were determined by analysis. a
bNumbers in parentheses are percentages of the total, as determined by analysis. 'Below analytical limits. 'Quantity ignored in total. 'Quantity of 1311 also less than 1 mCi.
b . e

I .I *
' C
Table 5.4. Distribution of Significant Fission Products in Run RA-2
Distribution of Radioactivityasb in Run Calculated Caustic Caus t i c Radioactivity Used in Used in m6 Released of Fuel
Fission Salt HF System Fp System Scrubber Product to Stack Total Element hd./Calc. Product (curies ) (curies) fmci) (mci) (PCi) (mci) (curies) (curies ( d l
8 9 ~ r
9 O ~ r
9 5 ~ r
9 5Nb
3Ru
Io6Ru
%b
127,129~~
137cs
l44ce
1850
403
2716
6036(99.2 1 51.4(0.84 )
19.8
31.8( 98.7) 0.15 (0.47)
20ge 1.31(99.2)
4.24(93.1) 0.15 (3.3)
527(99.9) 0.44( 0.08)
3626
<lC
1
<lC
5
259(0.81) 74
10( 0.8 <lC
122(2.7) lO(0.22)
<1
<lC
1850
430
2716
6087
19.
32.2d
1.32
30( 0.66 ) 4.55
527
3626
2252
450
3874
7342
748
445
14.7
85
38 3
7703
82
90
70
83
2.6
7.2 \D
8.8
5.4
Iu
138
47
a
bNumbers in parentheses are percentages of the total, as determined by analysis.
Quantities were determined by analysis.
Below analytical limits. C
'In addition to the quantities listed, the following quantities of fission products were found on the nickel wool trap (FV-154)
eValue was disregarded since it was later found that niobium coextracts with antimony in the analysis.
between the Fg system caustic scrubber and the off-gas scrubber: 44 pCi of lZ9Te, 164 pCi of lo6Ru, and 17 pCi of lo3Ru.

30
I i i i
I 1 i
i I
~
j 1
,
i j I 1 ! !
!
j ! I
1
they do not represent any new chemical species.
are interested i n two isotopes of the same element (e.g., strontium
and ruthenium), we did not f e e l t ha t it was necessary t o obtain a com-
p le te s e t of analyses f o r both nuclides since it was assumed that t h e i r
chemical behavior i s similar. The material balances fo r the nonvola-
t i l e elements i n t h i s run are considerably be t t e r than i n run RA-1.
Again, antimony and tellurium were volat i l ized during hydrofluorina- t ion , and tellurium and ruthenium were pa r t i a l ly removed from the salt during fluorination.
the off-gas scrubber and released t o the stack.
In instances where we
A s m a l l quantity of tellurium w a s carr ied through
In run RA-3 (two ORR elements cooled 80 days , Table 5.5), three
new species (91Y, 1311, and 140Ba) and one additional isotope (141Ce)
were present; of these, only the 1311 proved t o be of any concern.
The iodine balance i n t h i s run w a s excellent; greater than 90% remained i n the salt, while about 9% w a s found i n the caustic used i n the HF
system.
stack sampler. As previously, the tellurium w a s vo la t i l i zed i n both
major processing s teps , and about 5% of the t o t a l found was released
t o the stack; a s m a l l amount of ruthenium w a s a lso released. Most of
the antimony and some ruthenium and niobium were found i n the caustic
used i n the HF system. The material balances fo r all nuclides except
lo3Ru, 106Ru, and 127r129Te ranged from 67 t o 152%, which is considered
t o be excellent.
Traces were also found i n the other two scrubbers and on the
In run RA-4 (one ORR element , cooled 25 days) , the presence of
greater than 2-1/4 kilocuries of 133Xe made the t o t a l ac t iv i ty from
the noble gases 100 t i m e s t h a t of the 85Kr; however, high di lut ion
factors and high MPC values made rapid release safe. In RA-4, the
t o t a l release required more than 10 hr; i f it had been accomplished
over a 3-hr period, the ground-level concentration would s t i l l have
been less than 1% of the MPC. L
The significant f iss ion products fo r run RA-4 are shown i n Table
5.6. present in th i s run:
Three short-lived nuclides, absent i n runs RA-1, -2, and -3, were
99M0, ll1Ag, and 132Te. The 132Te represented

I .
Table 5.5. Dis t r ibu t ion of S ign i f i can t F iss ion Products i n Run RA-3
Dis t r ibu t ion of Radioactivityarb i n Run Calculated Caustic Caustic Radioactivity Used i n Used i n Off-Gas m6 Released of Fuel
F iss ion salt HF System F2 System Scrubber Product t o Stack Tota l Element Anal. /Calc. Product ( cu r i e s ( cu r i e s ) ( m c i 1 ( m c i 1 (uti) ( m c i ) ( c u r i e s ) ( cu r i e s ) ( % I
0.28
0 .Ob( 'XI .01)
0.28
0.28
152 (0 -7)
l.l(l.4)
0.32( 1.2)
10.3 (99.9
0.56( 32.3)
0.76 ( 8 -9
0.02
0.02
0.15
0.33
co .1
NSe
c0.2
(0.1
(1
NSe
136 (0.5 1
3(0.03)
21(1.21)
<1
CO.1
(0.1
(0.1
co .1
6 ,836
8,636
13,950
21,012
Q5c 78.16
27.53
10.32
90( 5 .le) 1.74'
<1 8.56
411
453
4,059
7,773
6,036
7,973
9,189
14,505
2,766
491
14.1
2 71
8.5
342
331
2,727
8,964
113
108
152
145
2.8
5.6
w P
73
0.64
101
120
137
67
87
Quantit ies were determined by analysis. a
bNumbers i n parentheses a re percentages of t h e t o t a l , as determined by ana lys i s .
'As t he t o t a l of two isotopes.
e~~ = not sought. $elow ana ly t i ca l limits.
% d u e was disregarded s ince it was l a t e r found t h a t niobium coext rac ts with antimony i n the ana lys i s .
gFifty-five microcuries of te l lur ium was found on the charcoal t r a p (FV-155); 52 p C i was found on t h e 400°C N i wool t r a p (FV-154). There was a t o t a l of <1 p C i of ruthenium on both t r a p s .

Table 5.6. Distribution of Significant Fission Products i n Run RA-4
Calculated
of Fuel
Distribution of Radioactivitya~b i n Run Caustic Caustic Radioactivity Used i n Used i n Off-Gas w6 Released
Fission Sa l t W System Fz System Scrubber Product o Stack Total Element Anal. /calc . Product (curies ) (curies) (curies) ( m c i ) tmcij l cu r i e s ) (curies) (curies ) (I)
8 9 ~ r
91Y
9 5 ~ r
95Nb
9 ~ o
lo3Ru
106Ru
l l lU
1 2 5 s
lZ7Te
lZ9Te
1311
32Te
137cs
140Ba
141ce
144ce
7,960(100 )
9,965(100)
13,400(100 )
12.400(99.4
65(90;5)
~ ( 6 9 . 2 )
2.8(64.3)
22(100 ) d g0.5
e
e
<0.43d
37 (64.4 1
232(99.9)
8,856( 100 1
7.050
5,617(100 1
0.311
0.226
0.3U
75.5(0.6)
2.80( 3.90)
0.032(0.20)
0.019(0.44)
<O.0Old
2.08( 82.4 )
e
e
109 (99.2
0.586( 1.02)
0.126(0.1)
0.351
e
0.076
0.004
C<O.OOld
<O.OOld
0.005
2.26(3.15
4.75(29.9)
1.5( 34.5)
0.006
0.44( 17.4)
e
e
O.SS(0.8)
12.8( 22.3)
<0.006'
<o . O O l d
C < O . O O l d
e
0.47
0.32
0.07
0.23
1660( 2.31)
d <0.1
g0.02 d 0.5
5.2(0.2)
e
e
0.25
0.15
0.32
d
~0.04
e
0.13
C
C
C
C
C
d g0.003
e
C
C
e
13.5
go. O l d
6.32 (110)
C
C
C
C
7.960
9,965
13,600
12,476
71.8
15.9
4.35
22
2.52
e
e
110
57.5*
232
8.243
7,050
5,617
6306
7928
8333
7523
148
3986
242
1 4
6.5
48
341
2293
232
152
8856
8559
4550
126
126
161
166
49
0.40
1.80
157
39
e w Iu
e
4.8
25
153
107
82
123
'&antities were determined b ; ~ analysis. bNwnbers i n parentheses are percentages of t o t a l , as determined by analysis. 'Not detected by gama scan of charcoal i n stack sampler. %elow analytical limits. eSpeciflc analyses are not available; quantit ies are assumed t o be proportional t o the nuclide fo r which data are presented. h i s does not include about 1 curie ( t o t a l ) of 127~129~132Te tha t is held up on the 400°C wool t r ap in the ex i t gas l i ne fo r t he
caustic scrubber used i n the fluorine system.
c . , ' C

33
T
1
W
a 60% increase of the 127s129Te t o t a l , and the 127Sb ac t iv i ty was a
factor of 5 times the customary ac t iv i ty of 125Sb. The presence of 99M0 presented a serious problem since special procedures had been
necessary t o prevent s table molybdenum from following the UF6 product.
In general, the results obtained i n RA-4 confirmed the trends observed
i n the e a r l i e r runs; however, the data of RA-4 should be considered t o
be more significant because of the appreciably higher ac t iv i ty levels-.
(Note tha t i n Table 5.6 some of the uni ts are larger than i n preceding
tables.
principally during fluorination; antimony and iodine, along w i t h frac-
t iona l percentages of niobium and cesium, were evolved during the
hydrofluorination step.
and i n the caustic used i n the fluorination system.
than 90% of the 99M0 was found i n the salt, the remainder w a s well dis-
tributed. Analyses showed tha t greater than 3% of the 99M0 w a s present
i n each of the two system scrubbers, 0.16% was present i n the off-gas
scrubber, and 2.3% was found i n the uF6 product.
i n the stack sampler. and ruthenium were released through the stack, but the ground-level
concentration w a s calculated t o be much l e s s than 5% of M P C , assuming
a 40-min release time and a stack-to-ground di lut ion factor of l o 5 (see Sect. 7).
As previously, tellurium and ruthenium were volat i l ized
Some antimony a l s o appeared i n the uF6 product
Although greater
None w a s detected
About 20 curies of tellurium and t races of 1311
With only one exception, no unusual or unexpected events occurred
as a result of processing at the higher ac t iv i ty leve l of run RA-4 (about 1-1/2 times tha t i n RA-3, even though twice as many fue l elements
were processed i n RA-3). Upon sparging the salt pr ior t o withdrawing
the first samples from the fluorinator, there w a s a rapid incrkase i n
the background radiation i n the v ic in i ty of the chemical t r ap (FV-121).
The increase continued u n t i l sparging was stopped; the radiation inten-
s i t y then decreased i n a typical manner (i.e., an exponential decay
curve). daughter of 132Te, w a s the source of the act ivi ty .
allowed t o remain s t a t i c (i.e. , only low-rate nitrogen purges were
allowed t o flow) i n the hydrofluorinator for several hours while
The ra te of decrease indicated t h a t 1321 (tlI2 = 2.4 h r ) , the The salt had been

34
temperatures were adjusted preparatory t o t ransfer r ing the salt t o the
fluorinator. grew i n from the decw of 132Te, and largely remained i n the salt u n t i l
f luorination.
Evidently, during t h i s period, a s izable amount of 1321
Sparging i n the f luorinator caused the 1321 t o be carr ied
through the 1 5 O o C NaF absorber and heated piping t o the ambient-tempera-
t u re t r a p (FV-121), where it deposited on the re la t ive ly cold surface.
The decay product was s tab le xenon, which could not be traced.
Table 5.7 presents a comparison of t he important data (from the
standpoint of radiation background) from Tables 5.3-5 .6, expressed on
a percentage basis.
6. QUALITY OF UF6 PRODUCT, AND URANIUM INVENTORY
The uranium hexafluoride product was collected by desublimatio-n
as it was desorbed from the NaF p e l l e t s i n the movable-bed absorber
(FV-105).
complex decomposed.
metal f i l t e r i n t o the product cylinder, which was cooled with a dry
ice--trichloroethylene mixture.
HF w a s removed from the cylinder by f lashing (7 min at O°C under vacuum);
the cylinder w a s then weighed and sampled.
the uranium contents, and the isotopic analyses
lec ted i n the four hot runs.
included t o show an "unburned" isotopic composition.
the uranium added t o the system i n a par t icu lar run does not appear i n
the product f o r t h a t run since, i n t h i s seven-run campaign, about one-
t h i r d of the uranium w a s held up i n cold t r aps , NaF t r aps , salt heels ,
e tc . This holdup l e d t o a blending, o r an overlap, of products from
run t o run. The analysis of the uranium product, as reported, is the
r e su l t of a coulometric determination i n which a l l t he uranium w a s
assumed t o be 238U; the values i n the table have been corrected f o r
the appropriate isotopic analysis.
agreement with( the theore t ica l uranium content of uF6 (67.36%) f o r the
assays involved.
As the bed w a s heated from 150 t o 4OO0C, the U F 6 ' 2 N a
The UF6 w a s carr ied, via f luorine, through a porous
A f t e r the product had been collected,
Table 6.1 gives the weights,
of the products col-
Results f o r an addi t ional run (UA-3) a re
Obviously, all
A l l of the values a re i n reasonable
hd

c * * ' d
Table 5.7. Comparison of Fission Product Distributions in Runs RA-1, -2, -3. and -ha
Total FP Found in Salt Total FP Found in Fuel ) Total FP Found in Fa System Caustic
Total FP Found in Fuel ( ( Calculated Quantity of FP in Fuel ) ( Total FP Found in Fuel Total FP Found in HF S stem Caustic Total FP Found ;n Fuel
Fi s sion Product RA-1 RA-2 RA-3 RA-4 RA-1 RA-2 RA-3 RA-4 RA-1 RA-2 RA-3 RA-4 Fa-1 RA-2 RA-3 RA- 4
8 9 ~ r
''5, 12
91Y
952, 45
95Nb 55
'MO
'Ru
2.8
ll1AB
'*'Sb 10.2
1 2 7 r 1 2 9 ~ ~ 1.9
1311
13*Te
137cs 73
140Ba
l 4 k e
144ce 50
82
90
70
83
2.6
7.2
8.8
5.4
138
47
113
108
152
145
2.8
5.6
73
0.6
101
120
137
67
87
126 b b
b
126 b b
161 b b
166 1.5 0.8 0.7 0.6
49 3.9
0.4 1.4 0.2
1.8 0.7 0.5 1.2 0.4
157 b
39 99.9 99.2 99.9 82.4
29 3.3 32.3
4.8 8.9 99.2
25 1.02
153 0.10 0.08 b 0.05
107 b b
82 b
123 b b
%looc S l O O C Sl0OC
%looc %looc 98.5 99.2
%looc
97 98.7
~ 6 8 ~ d
65 93.1
99.9 99.9
%looc Sl0OC
100 100 b b
100
100
99.3
98.5
98.1
d
57.6
91.1
100
100
100
100
100 b b
100 b b
99.4 b b b b
90.5 3.1
69.2 29.9
64.3 2.3 0.8 0.5 34.5
100 0.04 w Ul
<20 0.10 0.8 0.03 17.4
3 2.7 1.2
<0.4 b 0.8
64.4 22.3
100 b b
100 b b
%looc b
100 b b
%ata were obtained Apm Tables 5.3-5.6 and are expressed as percentages. bLess than 0.01%.
'These values are approximate because only analyses of the s a l t were obtained; however, subsequent runs showed these species t o be essentially non-
s e s e values were meaningless since an er ror in the analytical procedures was discovered during the Fa-4 analysis.
volati le.

36
Table 6.1. U r a n i u m Input and Product Data
R u n No. RA-1 Fa-2 RA-3 RA-4 UA-3
Feed: - Uranium i n fuel after
burnup, g 32 3 306 324
Product :
Weight gain of uF6 product cylinder, g 300 470 410
% u i n uF6 product 65.64 66.76 67.05
Isotopic analyses, %
2 3 4 ~ 0.98 1.16 1.17
2 3 5 ~ 86.87 83.00 82.52
236u 3.22 5.93 6.09
238u 8.93 9.91 10.22
159 30ha
100 300
63.94 67.33
1.15 0.82
82.54 91.40
5.89 0.32
10.42 7.46
8 As UF4; unirradiated.

37
6.1 Fission Product Decontamination Factors
fo r the UF6 Product
Most of the f iss ion products remained i n the melt and were dis-
carded with the waste salt.
volati l ized-during fluorination were sorbed on the NaF pel le t s i n the
movable-bed absorber (FV-105).
nuclides tha t were desorbed along with the uF6 usually constituted the
contaminants in the product cylinder.
some of these contaminants were deposited i n e a r l i e r runs and were
acquired from the connecting piping. ) The decontamination factors
(DF's) fo r various f iss ion products i n the four hot runs a re shown'in
Table 6.2.
Portions of the f iss ion products t ha t were
The s m a l l fractions of these radio-
(However, it i s possible tha t
The first of the four columns for each run lists the ac t iv i ty for
each nuclide i n the fuel , as calculated by the CRUNCH code.
tium-99 is omitted from the table and is discussed i n Sect. 6.3.) This value, which i s given on a per-milligram-of-uranium basis , w a s
obtained by dividing by the number of milligrams of uranium remaining
i n the fuel as determined by the reactor operations burnup calculations.
(This i s also the uranium content of t he fue l f o r accountability pur-
poses. )
(Techne-
The second and th i rd columns show the resu l t s of the analysis of the mtj product for radioactive contaminants.
product (as a l iquid) were analyzed; the second column gives the act i -
v i ty level (on the date of analysis) tha t was thought t o be most repre-
sentative f o r each nuclide.
the product cylinder; hence the tabulated values do not re f lec t the
degree of purification tha t would have been afforded by vapor sampling
of the uF6.
milligram-of-uranium basis.
Multiple samples of the uF6
Sampling w a s done by heating and tipping
In the t h i r d column, the ac t iv i ty i s placed on a per-
The DF's i n the first three runs were quite sat isfactory, generally
,
The lo6Ru DF w a s low ( l o 6 t o l o 7 ) ranging from lo7 t o 1O'O.
in run RA-3, i s an obvious exception.
i n the first two runs, but i t s improvement i n RA-3 ( t o 1.8 x l o8 ) and
The 125Sb DF, which decreased t o 1.4 x lo6 ,
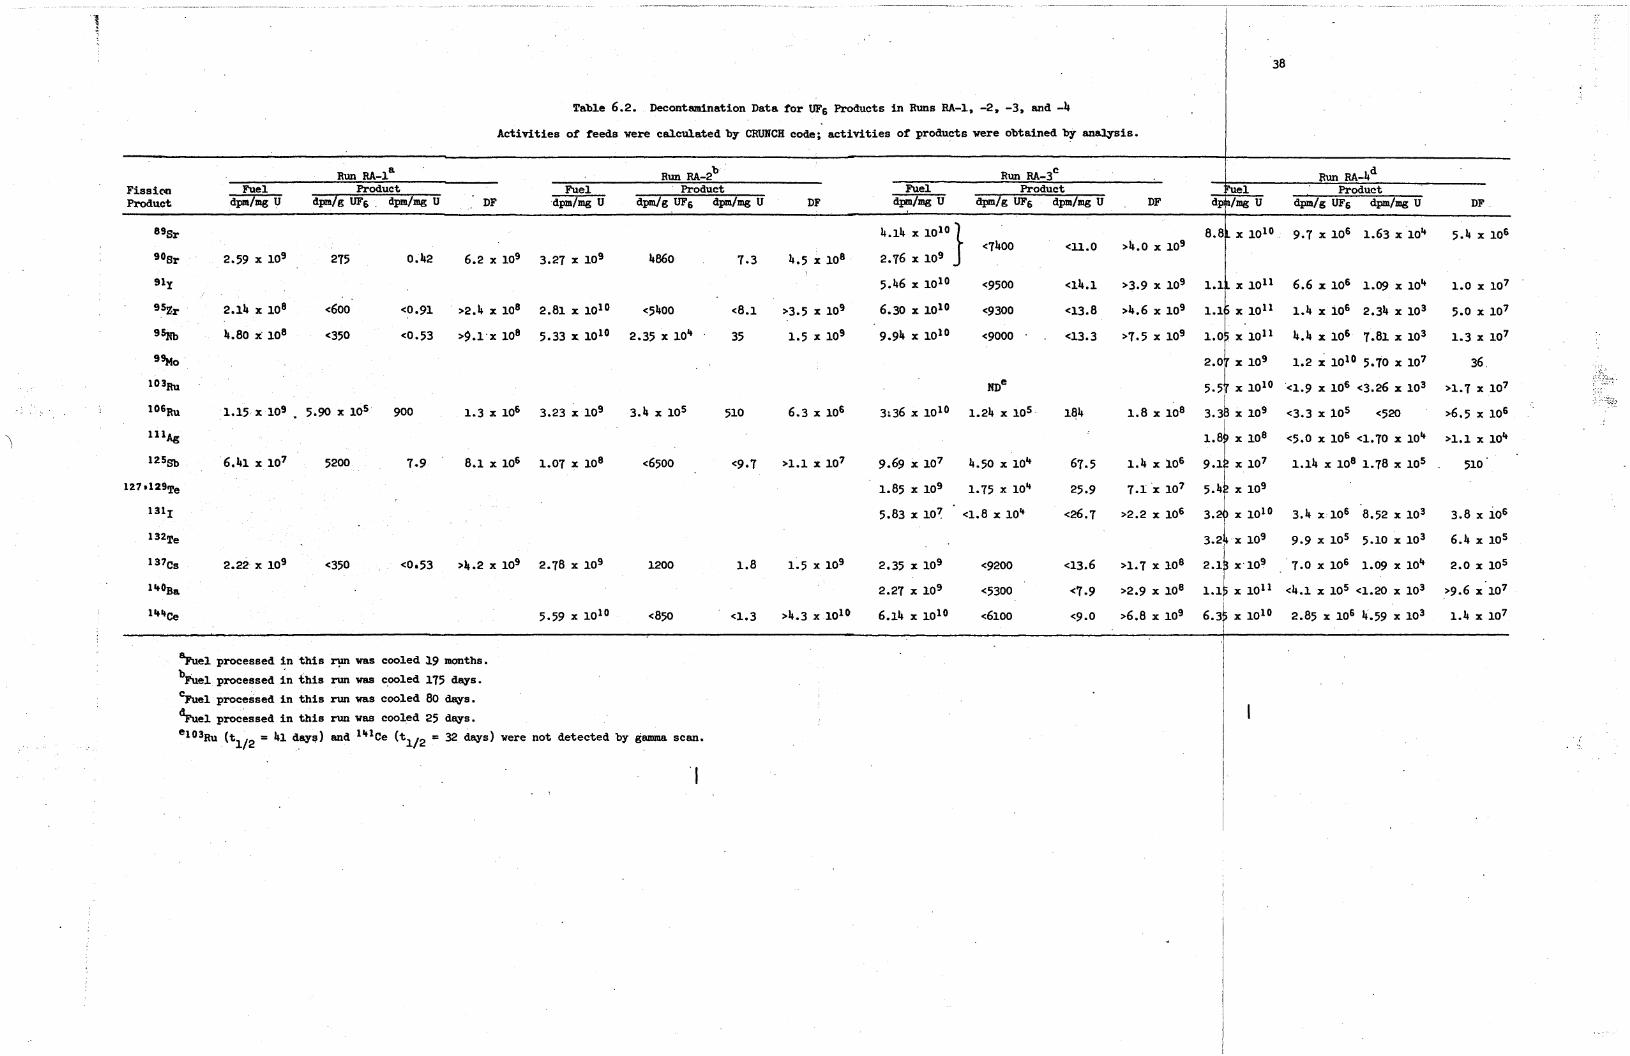
Table 6.2. Decontamination Data for uF6 Products i n R u n s RA-1, -2, -3, and -4
Activities of feeds w e r e calculated by CFiUIiCH code; activities of products were obtained by analysis.
8 9 ~ r
9 0 ~ r 2.59 x 10⁹ 275
9 1 Y
9 5 ~ r 2.14 x lo8 ~ 6 0 0
9% 4.80 x lo8 <350
9 9 ~ 0
lo6Ru
lllk
1 0 3 ~ ~
1.15 x 10⁹ . 5.90 x 10⁵
125% 6.41 x 10⁷ 5200
1 2 7 ~ 1 2 9 ~ ~
1311
32Te
137cs 2.22 x 10⁹ ~ 3 5 0
140Ba
1 4 4 h
0.42
e0.91
<O. 53
900
7.9
<O 53
6.2 x 10⁹ 3.27 x 10⁹
1.3 x lo6 3.23 x lo9
8.1 x lo6 1.07 x lo8
>4.2 x 10⁹ 2.78 x 10⁹
5.59 x 10¹⁰
4860
~5400
2.35 x 10⁴
3.4 105
<6500
1200
4 5 0
7.3
4.1
35
510
<9.7
1.8
<1.3
4.5 x 10⁸ j
>3.5 x 10⁹
1.5 x 10⁹
6.3 x lo6
>1.1 x 10⁷
1.5 x 10⁹
>4.3 x 10¹⁰
q400
5.46 x 1O1O <9500
6.30 x 1O1O ~9300
4.14 x 1O1O
2.76 x 10⁹
9.94 x 10¹⁰ <go00
me 3:36 x io1O 1.24 105
9.69 x 10⁷ 4.50 104
1.85 x 10⁹ 1.75 x 10⁴
5.83 x io? a . 8 x 10⁴
6.14 x 1O1O <6100
a 1 . 0
a 4 . 1
a 3 . 8
<13.3
184
67.5
25.9
e 6 . 7
~ 1 3 . 6
<7.9
<g.o
8. >4.0 x 10⁹
>3.9 109 1.
>4.6 109 1.
q . 5 109 1.
2.
5.
1.8 x 10⁸ 3.
1.
1.4 x lo6 9.
7.1 107 5.
>2.2 x 10⁶ 3.
3.
>1.7 x 10’ 2.
>2.9 x 10’ 1.
>6.8 x lo9 6.
%el processed i n th i s r)ur was cooled 19 months.
bFuel processed i n t h i s run was cooled 175 days.
Fuel processed i n t h i s run was cooled 80 W s .
%el processed i n th i s run w m cooled 25 days.
e103Ru (tlI2 = 4 1 days) and 141Ce (tlI2 = 32 days) were not detected by gamma scan.
C
‘ I
38
x 1 0 ~ 0 9.7 x l o 6 1.63 x io4 5.4 x 106
x 6.6 x lo6 1 .W x lo4 1.0 x 107
x 10l1 1.4 x lo6 2.34 x l o 3 5.0 x lo7 x l o l l 4.4 x io6 7.81 x 10³ 1.3 107
x 109 1.2 x 10¹⁰ 5.70 107 <. .*
36
x l o l o >1.7 x lo7 x 109 <3.3 105 <520 >6.5 x 10⁶
<1.9 x lo6 ~ 3 . 2 6 x l o 3 -.<.
x 108
x 109
x 1010 3.8 x 10⁶
x io9 9.9 x 10⁵ 5.10 x 10³ 6.4 105
x io9 . 7.0 x i o 6 1.09 x 10⁴ 2.0 105
<5.0 x io6 a .70 x 104 >1.1 x 10⁴
x l o 7 1.14 x lo8 1.78 x lo5 - 510’
3.4 x 10⁶ ‘8.52 x 103
x 1011 d.1 x 105 a . 2 0 x 103
x 1010 2.85 x i o6 4.59 x 10³
>g.6 x 107
1.4 x 10⁷

39
b, the f ac t t ha t lo3Ru w a s not detected lead t o the conclusion tha t lo6Ru
m a y have been acquired from incompletely decontaminated (from the pre-
vious campaign) process piping. Tellurium and iodine decontamination y
although not high, w a s sa t isfactory; the pr incipal concern with these
radionuclides is release t o the atmosphere, which i s discussed i n Sect.
7. The DF fo r cerium, representing the rare ear ths , w a s consistently
high.
In run RA-4, the decontamination factors were somewhat lower than
i n the first three runs, generally ranging from 2 x lo5 t o lo8. low antimony DF m a y have been caused by the t ransfer of a large amount
of antimony i n t o the fluorinator as a resu l t of the shorter hydrofluo-
rination period employed i n RA-4. since the chemical properties of MoF6 are quite s i m i l a r t o those of UF6. The "molybdenum stripping" feature of the process was intended t o keep
the bulk of the s table molybdenum from contaminating the UF6 product,
but w a s not expected t o effect the complete removal required fo r radio-
chemical decontamination. The "Mo (tl,2 = 2.8 days) would not be pre-
sent i n fuel processed a f t e r a cooling period of 60 days; it would decay
out of the product ( t o ~0.1%) 30 days after processing. Such a cooling
period might be desirable t o allow fo r decay of the unavoidable 237U.
The "'Ag i s believed t o be of no concern since none of the scrubber
solutions showed any appreciable concentrations of it; a low y ie ld and a high l i m i t of detection combined t o give an indeterminate DF fo r t h i s
nuclide.
The
The low "Mo DF w a s not surprising
Generally speaking, the DF's obtained i n the f i rs t three runs were
about one order of magnitude lower than those achieved i n the earlier
zirconium program.' f luorinating at 55OoC ra ther than at 500°C.
m a y be due t o one o r more of the following factors.
sintered-metal f i l t e r located jus t upstream of the product cylinder had
fai led, NaF f ines could have carried f i ss ion products in to the UF6
cylinder.
after dissolution w a s complete w a s shortened; therefore, the molten
W e believe tha t t h i s i s due, at least i n par t , t o The l o w e r DF's i n run RA-4
F i r s t , i f the
Second, i n run RA-4, the additional HF sparge carried out

40
salt may have carried a higher percentage of the f i ss ion products in to
the fluorinator.
quantity of NaF pe l l e t s discharged from the movable-bed absorber may
have been insuff ic ient . In the aluminum program, 3.8 kg of NaF (about
11% of the bed) was discharged during each run, as compared w i t h about
6.5 kg i n the zirconium program.
resu l t i n an upward migration and eventual breakthrough of some f i ss ion
products.
Finally (and t h i s factor seems most s ign i f icant ) , the
Insufficient bed discharge would
6.2 Primary Radioactive Contaminants i n the
Product from Run RA-4
The gamma scan,for the product samples i n run RA-4 ( the short-
cooled run) indicated t h a t the radioactivity of the product was almost ent i re ly due t o the presence of "Mo and 237U. product w a s equivalent t o a radioactivity l eve l of 2.53 x 10l1 disin-
tegrations per minute
The 237U content of the
per gram of uF6 at a cooling time of approximately
39 d a y s .
disintegrations per minute per gram of u F 6 , assuming a 10% geometry
during analysis.
The gross beta ac t iv i ty of the product i n run RA-4 w a s 2.7 x 10l1
This value i s lo2 t o lo3 times t h e gross beta ac t iv i ty
of the product
gram of UF~).
Radiation
i n run RA-3 (3.66 x lo8 disintegrations per minute per
c
readings fo r the product cylinders i n runs RA-3 and RA-4, taken w i t h a cut ie pie at various times a f t e r the run w a s completed,
were as follows:
Approximate Cooling Time
R u n No. (days
RA-3 4 5 RA-4 28 (completion of run)
RA-4 36 RA-4 39 RA-4 49
Cutie Pie Reading
(r/hr)
0-5 50
6.2 4.2 2
h-, The decrease i n the readings of the RA-4 product r e f l e c t s the decay
of both 99M0 and 237U.
6 . 3 Removal of Technetium, Neptunium, and Plutonium
from the uF6 Product
The removal of technetium, neptunium, and plutonium from the uF6
product i s discussed separately i n t h i s section because of the incom-
pleteness of the data. This, i n t u r n , i s due t o the d i f f i cu l ty of
obtaining val id analyses of highly radioactive material.
data f o r these three elements were discarded as meaningless; f o r example,
one set of analyses indicated tha t the 237Np content of the f u e l w a s
20 times as great as the t o t a l uranium content.
Most of the
The recovery of plutonium i n the processing of highly enriched
uranium fue ls i s not economically feasible . Hence the only concern,
with respect t o plutonium, i n the runs discussed i n t h i s report is
assurance that the plutonium content of the uF6 product i s within rea-
sonable limits.
has shown excellent plutonium decontamination; the data from the alumi-
num program are given l a t e r i n t h i s section.
Past experience i n molten-salt v o l a t i l i t y processing
I n general, technetium and neptunium f luorides tend t o follow uF6
through the sorption-desorption cycle i n the NaF bed, although the data below suggest t h a t the cycle might be arranged t o achieve some decon-
tamination.
were sorbed on MgF2 pe l l e t s , w a s employed.
Thus a separate purif icat ion s tep , i n which TcF6 and NpFs
Some technetium apparently remained i n the off-gas stream during
sorption; for example, analysis of the NaF i n the chemical t r a p down-
stream from the sorber showed 3.6 ppm of technetium at the entrance and 0.5 ppm at about the middle of the t r a p at the conclusion of runs RA-1,
-2, and -3. I n l e t and ou t l e t samples of the sorbent from the MgF2 bed showed the following 99Tc concentrations:
and not greater than 0.15 ppm respectively; RA-4, 8.8 ppm and 1.7 ppm;
However, most of the technetium w a s found on the MgF2.
RA-1, -2, and -3 (combined), 1540 ppm

42
and T-18," 970 ppm and 2 ppm.
the composite bed fo r the en t i re se r ies indicated tha t a t o t a l of 390 mg of 99Tc was present i n the 973-g bed.
three runs contained very l i t t l e 99Tc: 4.6, 2.4, and 1.1 parts of
technetium per million par ts of uranium respectively. However, i n
run RA-4, the product analyzed 440 ppm.
ye t , been explained.
Results of the analyses of samples of
The products i n the first
This discrepancy has not, as
The resu l t s fo r neptunium were similar t o those fo r technetium.
Some neptunium reached the chemical t r ap during runs RA-1, -2, and -3; the 237Np concentrations i n the NaF at the i n l e t and at the middle of
the t r a p were 23 ppm and 1 ppm respectively.
MgF2 ( in l e t and out le t respectively) showed:
ppm and 40 ppm; RA-4, 490 ppm and 150 ppm; and T-18,* 1140 ppm and 420
ppm. Analyses of samples of the composite bed indicate t ha t 785 mg of 237Np was present i n the bed.
RA-1 through -4 showed no consistent trend:
and 1860 par t s of 237Np per million par ts of uranium.
Analyses of samples of
RA-1, -2, and -3, 2310
Analyses of the uF6 products fo r runs 140, l e s s than 12, 1670,
Plutonium data are available from runs RA-3 and RA-4. Data from
run RA-3 confirm the d i f f icu l ty of fluorinating plutonium from a molten salt. For the first fluorination i n run RA-3, the feed salt and the
waste salt showed essent ia l ly the same plutonium concentration (1.19 x l o 6 and 1.25 x l o 6 counts per minute per gram of salt , respectively);
the feed salt concentration w a s equivalent t o 1.2 x lo9 counts per minute
per gram of uranium. For the second fluorination, the plutonium radio-
ac t iv i ty i n the feed salt w a s 1.26 x l o 6 counts per minute per gram of salt (equivalent t o 1.6 x io9 counts per minute per gram of uranium),
but the analysis of the waste salt showed only 5.1 x lo5 counts per
minutes per gram of s a l t .
samples from run RA-4 fo r plutonium yielded the following results:
3.1 x l o 4 , 5.1 x l o 5 , 1.7 x lo4 , add 4.5 x l o 4 counts per minute per
gram of uF6.
Radiochemical analyses of four product (m6)
If we discard the second value, the average is 3.1 x l o4
K T-18 w a s a cleanup run (using barren salt) made following run RA-4.

43
counts per minute per gram of UF6, or 4.6 x 10⁴ counts per minute per
gram of uranium.
l e n t t o a 2 3 9 ~ ~ concentration of 0.63 ppm.
Based on a 51% counting geometry, 4.6 x lo4 i s equiva-
6.4 Nonradioactive Cationic Contaminants
Contamination of the UF6 products (Table 6.3) with nonradioact5ve
Analyses of the products from indi- cations w a s higher than desirable.
vidual runs (even when multiple samples f romthe product of a s ingle run were used) were too inconsistent fo r val id interpretat ion.
r e su l t s of the analysis of the composite product, consisting of a com-
bination of these products in a form sui table f o r shipment, appear quite reasonable. The concentrations of most of the cationic contami-
nants, including C r , Cu, Fe, N i , and Z r , were l e s s than 50 par t s per
mill ion parts of uranium. ppm and 500 ppm respectively.
following (approximate) quant i t ies :
and sodium, 1%.
the conditions under which the movable-bed absorber w a s operated. The high sodium content l e d us t o suspect t ha t the sintered-metal f i l t e r
located j u s t upstream of the product cylinder had f a i l ed , allowing NaF f ines t o be released.
explained, but i s believed t o be nonrepresentative.
However,
The boron and potassium contents were about 75 Three other metals were present i n the
molybdenum, 0.1%; aluminum, 0.3%;
The molybdenum content of the product w a s dependent on
The high aluminum content has not been completely
6.5 Cumulative Material Balances f o r Sa l t and Uranium
A cumulative salt balance w a s maintained throughout each run i n
the aluminum-uranium campaign (Table 6.4). a uranium balance (uranium concentrations were reported as grams of
uranium per gram of salt) , and it also provided a check on the instru-
This allowed us t o obtain
mentation t h a t w a s used t o measure the l e v e l and density of molten salt. It was imperative t h a t the volume of sal t i n the f luorinator be known accurately i n order t o avoid over f i l l ing the waste salt can.
volume of waste salt tha t w a s t ransferred w a s measured by difference
i n the f luorinator , since the waste can contained no instrumentation.
The

Table 6.3. Nonradioactive Cationic Impuritiesasb i n the w6 Products
RA-2 Cation UA-1 UA-2 UA-3 RA-1 A B C D E F G H AVg. RA-3 RA-4 Composite
A l
B
C r
cu
Fe
K
Mo
Na
N i
Z r
Total
14
3.6
<O. 57
0.45
4.57
0.50
18
21
0.30
3.3
s62
1,200
13,350
ND
9
ND
105
565
3.600
ND
51
18,880
1,200 800 900 1,500 570 2,000 200 1,900 1,600 1.700 1,300 1,500 1,300 2,850 3,100
7,800 6,300 4,900 4,400 1,000 3,500 560 4,600 8,100 5,800 4,100 5,125 3,700 9,100‘ 75
ND 30 ND ND ND ND ND lk, go 210 55 ND 50 <3 3.5
ll.5 45 70 300 5 1,540 90 420 20 30 300 400 357 <3 22
ND 75 <50 <90 30 70 ND 250 160 260 110 75 100 <30 43
130 <5O 200 300 70 230 30 1,300 200 200 300 502 378 600 454
660 300 900 1,000 270 770 120 600 l.200 740 700 700 7,000 880 ,560
3,450 1,800 5,700 5,000 1,100 2,900 600 2.300 2,700 1,900 2,775 4,475 3,500 8,100 12,000
ND 30 ND ND ND ND ND 60 30 50 17 700 200 <30 36
30 80 <40 <TO ND 10 ND ND ND 20 13 23 105 96 <20
13,280 ‘9,500 9,670 13,500 16,690
Values a re in p p .
b A l l da ta except the values i n t he l a s t column were taken from spectrographic analyses.
‘Sample appeared t o be contaminated.
ND = None detected.
The da ta i n the l a s t column were obtained from chemical analyses.
C # . . 1 C’

Table 6.4. Material Balances for the Sal t Charges Used in VPP Runs
Cumulative I n i t i a l Barren In i t i a l N8F Final FV-100 Final Heel in Sal t AlF3 from Heel in from Total Heel in After Heel i n Waste Recovery Material FV-1000 Charge Dissolution FV-1000 FV-105 Input FV-1000 D P l a FM-100 salt ,* B a l r e
Run No. (kg) ( 4 3 ) (kg) (kg) (kg) (kg) (kg) (kg) (kg) (kg)
FVSb 0
DA-1 0
DA-2 13.8
UA-1 20.5
UA-2 19.3
UA-3 0
RA-1 0
RA-2c 48.9 130.3
RA-3c 6.5 73.5
FA-4 15.4
Total
32.1
149.9
132.7
114.0
139.2
135 -9
190.3
190.3 0
209.6 0
114.3
1408.3
0
24.3
24.6
21.1
20.6
13.1
27.4
27.0 0
25.4 0
0
2.5
8.3
3.3
0.7
1.0
0.3
28.6 16.1
4.5 38.6
0
3.7
2.6
2.5
2.5
2.5
3.0
0 1.9
0 4.0
13.1 1.0 4.2
196.6 26.9
32.1
180.4
182.0
161.4
182.3
152 * 5
221.0
294.8 148.3
246.0 116.1
148.0
1631.8
0
13.8
20.5
19.3
0
0
48.9
130.3 6.5
73.5 15.4
9.6
9.6
14.7
184.8
161.0
141.8
182.0
155.7
172,6
136.0
163.3
136.3
171.1
99.2
2.5
8.3
3.3
0.7
1.0
0.3
28.6
16.1 4.5
38.6 1.0
1.0
1.0
12.2
180.2
160.3
143.6
183.5
157.9
147.0
155.0 133.4
124.7 102.2
139 - 5
1639.5
14.7
202.3
184.1
163.6
184.5
158.2
224.5
301.4 144.4
236.8 118.6
150.1
1650.1
45.8
112.1
101.2
101.4
101.2
103.7
101.6
102.2 97.4
96.3 102.2
101.4
45.8
102.1
101.8
101.7
101.6
102.0 -r vl
101.9
102.1 101.8
100.9 101.1
101.1
101.1
%PT = dissolver product transfer. bFVS = freeze valve salt charging. ' R U ~ was divided in to two parts.

46
Table 6.4 shows the salt inputs fo r each run, as w e l l as the t o t a l
input.
(FV-100) are the quantit ies that were indicated by instruments on the
I n i t i a l heels i n the dissolver (FV-1000) and the fluorinator
vessels; the quantit ies of barren salt and AlF3 were based on known
weights; and the NaF t h a t was added t o FV-100 from the absorber (FV-105)
w a s measured by FV-100 instrumentation. the t o t a l of the f i n a l heels (as measured by vessel instrumentation)
and the waste salt (as measured by 'hoefore and a f t e r t ransfer readings"
on FV-100 instruments).
The recovery fo r each run is
The column labeled "FV-100 after DF'T" i s included t o indicate the
degree of r e l i a b i l i t y of vessel instrumentation.
value f o r each run
charge minus the sum of the weights of the NaF from FV-105 and the
f i n a l heel i n FV-1000. i n vessel contents are reasonably re l iab le when they are made using a
single s e t of instruments.
between instruments.
Theoretically, the
should be equal t o the wesght of the i n i t i a l salt
Ekperience has shown tha t measurements of changes
The data i n Table 6.4 indicate discrepancies
A very poor material balance was obtained for the freeze valve salt
Since only a s m a l l quantity of material w a s charged and charging (FVS).
since instrument heels and l i n e volumes would account f o r some salt, a low material balance w a s expected. However, the balance fo r the subse-
quent run compensated fo r the low balance; thus the weights of the f i n a l
heel a f t e r FVS and the i n i t i a l heel fo r run DA-1 are probably incorrect.
Each of the two runs RA-2 and RA-3 consisted of a complete dissolu-
t ion , a p a r t i a l t ransfer of salt from FV-1000 t o FV-100, fluorination,
t ransfer of waste salt, t ransfer of remaining salt from FV-1000 t o FV-100,
fluorination, discard of NaF pe l l e t s from FV-105, and t ransfer of waste
salt. Hence, a salt balance i s shown fo r each fluorination.
An overal l material balance of 101.1% i s within the anticipated
accuracy of the measurements invalved.
the instrumentation w a s adequate fo r process control, and experience
i n the first f e w runs generated a high degree of confidence i n the
measurements .
Therefore, the r e l i a b i l i t y of
i4
hd

47
W The uranium content of the salt w a s calculated from the s a l t bal-
ance data presented i n Table 6.4 and from analyses of salt samples.
This information was used, along with weights and analyses of effluents
(including the product) and accountability data f o r the material
charged, t o obtain the uranium material balances shown i n Table 6.5.
7. RELEASE OF FISSION PRODUCTS TO THE ENVIRONMENT
Various quantit ies of f i ss ion products were released through the
3020 stack t o the atmosphere during the fluorination step i n the hot
runs (see Table 7.1). Noble gases were released during dissolution, but
they were not detected at ground level .
(Run RA-4) , l e s s than
released. A t o t a l of about 20 C i of tellurium w a s released; of t h i s ,
6 C i w a s 78-hr 132Te, which decays t o 2.3-hr 1321 and, i n turn, t o
s table xenon.
permissible concentration (MPC) represented by these releases were made by assuming a constant r a t e of release during the fluorination period.
The most unfavorable case was 1311 (<O.l% of MPC) ; however, even i f the
en t i r e quantity of 1311 had been released during a period as short as 1 min, the combined fraction of MPC fo r all three f iss ion products (129Te, 1311, and lo6Ru) would s t i l l have been below 5%. t ha t fue l t h a t has been cooled f o r as long as 25 days can be processed by the molten-salt f luoride-volati l i ty process with no hazard re la t ive
t o the release of f i ss ion products.
In the l e a s t desirable case
1 m C i of lo6Ru and l e s s than 1 0 m C i of 1311 were
Calculations t o determine the percentage of the maximum
We conclude
The quantity of tellurium (20 C i ) t ha t was released during run
RA-4 represented only about 5% of the calculated quantity i n the fue l
element.
( i .e . , less than one-half of the tellurium i n the fue l ) was removed by
the KOH scrubber solution. An attempt w a s made t o remove tellurium i n
a t r ap located downstream from the fluorine scrubber.
s i s t e d of nickel mesh heaked t o bOO°C, a gas cooler, and an activated-
charcoal. bed maintained near ambient temperature ( <5OoC).
The major f ract ion of the tellurium that w a s volat i l ized
This t r a p con-
Although

Table 6.5. Uranium Balances for VPP Runs
Uranium I n i t i a l Total Uranium Distr ibut ion of Final Found i n Holdup i n i n FV-100 and Nonrecoverable Uranium Losses Holdup i n
Initial Uranium Total Final by Sal t Collection Collection i n Collection Cylinder Waste Neutral- KOH i n Collection Hydrofluorinator System FV-100 Product Product Product "Cold Trapped" KOH Total Product
UA-1
UA-2
UA-3
RA-1
RA-2a
RA-2b
RA-3a
RA-3b
RA-4
Cleanout
0
264
239
391
533
734
5 39
701
625
600
592
304
304
323
306
0
324
0
159
0
592
568
543
714
839
734
86 3
701
784
600
264
239
391
533
734
539
701
625
600
Oa
328
329
152
181
105
195
162
76
184
0
110
141
91
75
180
59
220
19
138
328
439
293
272
180
375
221
296
203
325 67.06
440 67.24
300 67.33
300 65.64
0
470 66.76
0
410 67.05
loo 63.97
218 91.98
296 91.31
202 91.40
197 86.88
314 83.00
275 82.49
64 82.52
6OTb
373
1835
253
235
225
2234
1079
1410
746
124'
0 0
0 240
0 171
0 119
0 30
55
0 155
206
0 0
0.11 110
0.63 141
0.28 91
0.20 75
0.24 180
1.17 59
0.76 220
2.13 19
0.41 138
Oa
%otal of 7 g unaccounted for (99.7% material balance).
bCollected as UO2F2 solut ion, e tc .
'Grams of uranium i n salt flushes. This uranium could have been recovered by f luorinat ion, but it was not considered worthwhile t o do so.

c- *'
Table 7.1. Fission Products Released t o the Atmosphere from the VF'P During the Aluminum Campaign
(Quantit ies expressed i n curies)
' C
Fission Products
Fission Products Released f r o m Fluorinator Released from Dissolver
*r _.._ n ---- 127m- 129m- 1317 10 3P.. 106n.. - LIUDiCe vaDicil ~ 25 2c 2 m u I,U
Run No. Present Detected Present Detected Present Detected Present Detected Present Detected Present Detected
RA-1 47.3 (85Kr) 0 2 0 <0.01 0.007 <0.001 0 0.5 0 167 0
RA-2 60 (85Kr) 0 518 0 34 0.03 0.01 0 748 0 445 0
RA- 3 0 100 0 171 *O .09a 8.5 ~0 .001 2766 W.003 491 so. 002 0
RA-4 24 (85Kr) 0 48 0 341 2Ob 2293 ~0.01 3986 0 242 <O.0OlC 2261 (133Xe) 0
.r ........................................................................................................................................................... WCf, 4 x 10⁻⁶ 9 10-9 8 x 10⁻⁸ 6 x \D
v~i/cm3 (see d) (see e) (see d) (see a) %MF'Cg*h during RA-4 2.8 10-3 ~ 6 . 5 x a . 0 x 10-2
BTot al tellurium. b127Te + lZ9Te + 132Te; all isotopes assumed t o be lZ9Te i n the calculation t o determine the percent MF'C released.
%orst case f o r insoluble material..
eWorst case f o r soluble material.
c103m + 1 0 6 ~ ~ .
fSource: Maximum Permissible Body Burdens and Maximum Permissible Concentrations Of Radionuclides in A i r and i n Water f o r Occupational Exposure, National Bureau of Standards Handbook 69, U.S. Department of Commerce, 1959. The MPC's given are based on a 40-hr week.
g h determined at ground level.
hBases bbr calculation: (1) r a t e of air flow through the stack w a s 43,000 cfm; (2) atmospheric d i lu t ion of air discharged from the 3020 stack was lo5; (3) f i ss ion products were released at a constant rate during the en t i re fluorination period (40 min). ana ly t ica l ly i n samples from charcoal t raps used t o sorb f i ss ion products from a sidestream of stack gases.
Quantit ies of f i ss ion products were determined

appreciable amounts of tellurium were held by the t r ap , a s ignif icant
f ract ion was allowed t o pass through t o the off-gas stack. Some of the
trapped material w a s subsequently released a f t e r evolution from the
fluorinator had ceased; thus, the t r ap helped extend the release period.
It appears t ha t , although the quantity of tellurium tha t w a s dispersed did not consti tute a hazard, fur ther developmental work i n t h i s area
would be advisable.
A l l of the effluent streams i n run RA-4 were analyzed t o determine
Of the 2293 C i of 1 3 1 1 present at the t i m e of dis- the f a t e of iodine.
solution, only 110 c i w a s accounted fo r by analyses.
experience has indicated tha t there is a low probability of finding the
iodine i n a fused salt, we believe tha t the remainder of the iodine was
e i ther "plated out" i n the vessels or w a s discharged i n the waste salt.
O f the 110 C i accounted for , 109 C i was found i n the caustic solution used f o r scrubbing the dissolver off-gas and 0.8 C i w a s found i n the
caustic used for scrubbing the fluorinator off-gas. The quantit ies of
iodine found i n the other streams were insignif icant ; essent ia l ly none
Since laboratory
was released t o the atmosphere. We conclude tha t molten-salt fluoride-
v o l a t i l i t y processing of nuclear fuels presents no iodine release
hazard, regardless of the length of the cooling period between irradia-
t ion and processing.
8. ACKNOWLEDGMENTS
R. E. Brooksbank, Chief of the P i lo t Plant Section of the Chemical
Technology Division, had overall responsibil i ty fo r t h i s p i l o t plant.
R. P. Milford was reponsible fo r coordinating the Vola t i l i ty Project.
Other supervisors of the Volat i l i ty P i lo t Plant who made major contri-
butions were: R. S. Lowrie, S. Mmn, R. J. Shannon, and E. L.
Youngblood.
Many people i n other par ts of the Laboratory provided aid and
assistance tha t made the operation and maintenance of t h i s p i l o t plant
a success; chief among these were: G. E. Pierce and R. P. Beard of the
i
r

bi Plant and Equipment Division, W. J. Greter of the Instrumentation and
Controls Division, E. I. Wyatt and C. E. Lamb of the Analytical Chemistry
Division, 0. J. Smith of the Inspection Engineering Department, and
C. H. Miller and W. A. McLoud of the Health Physics and Safety Division.
The assistance of these, and of many other people at ORNL and at other
AEC ins ta l la t ions , i s gratefully acknowledged. We also take t h i s opportunity t o express appreciation t o Martha G.
Stewart fo r her invaluable ed i to r i a l assistance.

52
9. REFERENCES
1.
2.
3.
4.
5 .
6.
7.
8.
9.
10.
Chem. Technol. Div. Ann. Progr. Rept. June 30, 1962, ORNII-3314, pp.' 39-45; Chem. Technol. Div. Ann. Progr. Rept. May 31, 1964, ORNL- 3627, PP* 29-40. R. G. Nicol and W. T. McDuffee, Molten-Salt Fluoride Volatility Pilot Plant: Fuel Elements, ORNL-4251 (July 1968).
Equipment Performance During Processing of Aluminum-Clad
S. Mann and E. L. Youngblood, Decontamination of the ORNL Molten- Salt Fluoride Volatility Pilot Plant After Processing Irradiated Zirconium-Uranium Alloy Fuel, 0"L-3891 (February 1966).
E. L. Youngblood, R. P. Milford, R. G. Nicol, and J. B. Ruch, Corrosion of the Volatility Pilot Plant INOR-8 Hydrofluorinator and Nickel 201 Fluorinator During Forty Fuel-ProcessinR Runs with Zirconium-Uranium Alloy, OFNL-3623 (March 1965).
R. E. Thoma, B. J. Sturm, and E. H. Guinn, Molten-Salt Solvents for Fluoride Volatility Processing of Aluminum-Matrix Nuclear Fuel Elements. ORNL-3594 (Amst 1964).
M. P. Lietzke and H. C. Claiborne, CRUNCH - A n IBM-704 Code for Calculating N Successive First-Order Reactions, 0RN1t-2958 (Oct. 24, 1960).
P. D. Miller et al., Corrosion Resistance of Nickel-Base Alloys Under H y u , BMI-x-215 (Jan. 7, 1963).
P. D. Miller et al., Corrosion Resistance of Nickel-Base Alloys Under Hydrofluorinator Conditions with Aluminum Dissolving - Part 11. BMI-x-260 (act . 18. 1963).
I - - - a ~
~
P. D. Miller et al., Corrosion Investigation of HyMu 80, INOR-8, ~~ - ~~
and "L" Nickel Under Fluorinator Conditions for Processing Alumi- num UsinR the Molten-Salt Fluoride Volatility Method, BMI-X-316 (Oct. 30, 1964).
Chem. Technol. Div. Ann. Progr. Rept. May 31, 1966, ORNL-3945, p. 63.

c
10. APPENDIXES

54
10.1 Appendix A: Fission Product Content
of I r radiated Fuel Elements
The radioact ivi ty leve ls of the f i s s ion products expected t o be
present i n the spent f u e l elements t h a t were processed i n the four hot runs of the uranium-aluminum campaign were calculated using the
CRUNCH code. The r e su l t s a re l i s t e d i n Table A-1. 6
.
.

55
Table A-1. Calculated Radioact ivi ty Levels of Fiss ion Products i n U-A1 Fuel Elements i n
R U ~ S RA-1, -2, -3, and -4 at start of Processinga
Crilculated Radioactivit? Level i n Run at S t a r t o f Processinn
I
(cur ies ) RA-1 RA-2 RA-3 RA-4
% of Total RA-1 RA-2 RA-3 RA-4
e5Kr
8 9 ~ r
9 0 ~ r
91Y
9 5 ~ r
9 5Nb
9 ~ M O
9Tc
3Ru
lo6Ru
111&
125%
127%
127Te
129Te
1311
32Te
1 3 3 ~ e
136cs
137cs
14OBa
l 4 l ~ e
3 ~ r
144ce
'47Nd
147%
1 4 9 b
1 5 1 h
47.3
8.5
377
17.0
31.1
69.8
0.03
0.5
167
9.3
1.7
32 3
2338
1081
1.3
59.5
2252
450
3131
3874
7342
0.06
748
445
14.7
51.4
33.8
0.01
383
4.2
761
7.6
7703
0.51
1730
1.26
54.1
6036
403
7973
9189
14505
0.06
2766
491
0.25
14.1
100
171
8.5
0.30
0.34
342
331
4059
442
8964
74
1676
1.28
24.2
6306
179
7928
8333
7523
148
0.02
3986
242
14
6.5
30.9
48.2
341
2293
232
2261
7.9
152
8243
8559
8378
4550
3126
734
7.7
0.73
10.27 y
54
28 Y
58
63
35
2.8
2.12 x 10⁵
41
1.0 y
7.6
S2.7 Y
3.9
90
33
8.05
3.2
5-27
13
33 Y
12.8
32
13.7
290
11.3
2.6 y
2.25
73 Y
1.06
0.19
8.43
0.38
0.69
1.56
0.01
3.73
0.21
0.04
7.22
52.28
24.17
0.03
0.21
7.77
1.55
10.80
13.36
25.32
2.58
1.53
0.05
0.18
0.12
1.32
0.01
2.62
0.03
26.57
5.97
0.09
10.48
0.70
13.84
15.95
25.18
4.80
0.85
0.02
0.17
0.30
0.01
0.59
0.57
7-05
0.77
15.56
0.13
2.91
0.03
8.56
0.24
10.76
11.31
10.21
0.20
5.41
0.33
0.02
0.01
0.04
0.07
0.46
3.11
0.32
3.07
0.01
0.21
11.19
11.62
11.38
6.18
4.24
1.00
0.01
%e first nucl ide i n each decay chain contr ibut ing a s i g n i f i c a n t f r a c t i o n of the t o t a l a c t i v i t y at t h e start of processing is tabulated. daughters t h a t are i n secular equilibrium with the nucl ides l i s t e d .
A t r u e t o t a l a c t i v i t y would a l s o have t o include t h e a c t i v i t y of the short- l ived
bA blank indica tes <0.01 cur ie o r <0.01%. 'The h a l f - l i f e is expressed i n days unless followed by y , which designates years .

56
10.2 Appendix B: Dissclution of Fuel Elements
The aluminum dissolution rates are plotted against run times in
Figs. B-1 through B-10.
and the salt compositions for each run are shown.
The HF flow rate, the average temperature,
c

57
5
ORNL Dwg 69-7701
Fig. B-1. Aluminum Dissolution Rate as a Function of Fuel Element
Dissolution Time for Run DA-1.
O R N L Dwg 70-12432
Fig. B-2. Aluminum Dissolution Rate as a Function of Fuel Element
Dissolution Time for Run DA-2.

ORNL Dwg 69-7702
DISSOLUTION TIME (hr)
Fig. B-3. Aluminum Dissolution Rate as a Function of Fuel Element
Dissolution Time for Run UA-1.
Fig. B-4. Aluminum Dissolution Rate as a Function of Fuel Element
Dissolution Time for Run UA-2.
LJ

59
O.? e
20.6 - L c I
1 Y
w a t-0.5 - a
5 0.4 - F
& 0.3 - !L! n
3
v)
0.2 - 5 z 3 J
5 0.1
a O O
ORNL Dwg 69-7703
6 8 10
DISSOLUTION TIME (hr)
Fig. B-5. Aluminum Dissolution Rate as a Function of Fuel Element
Dissolution Time for Run UA-3.
O R N L Dwg 70-12431
DISSOLUTION TIME (hr)
hb Fig. B-6. Aluminum Dissolution Rate as a Function of Fuel Element
Dissolution Time for Run RA-1.

60
ORNL Dwg 69-7704
DISSOLUTION TIME (hr)
Fig. B-7. Aluminum Dissolution Rate as a Function of Fuel Element
Dissolution Time for Run RA-2.
ORNL Dwg 70-12434
DISSOLUTION TIME (hr)
Fig. B-8. Aluminum Dissolution Rate as a Function of Fuel Element Dissolution Time for Run RA-3.

61
0.7 I CONDITIONS SALT (mole O/&
INITIAL FINA K F 61,3 3s?L ZrFa 23.0 2 t . O AlFa 15.5 22.9
I n L c ALl MlNUM DISSOLU’ION RA-E o, 0.6 \
v Y - Avg. Temp. 5 8 5 O C
HFFLOW RATE 5 0.5 a f
0.4~ I- 3 $ 0.3 tn v)
n I END OF DISSOLUTION-
-
- 0.2
5 0.1
a
3 z 3 J
I 0 -
O R N L Dwg 69-7705
I40
(20 n C
too ‘E \ 0 -
80 w t- a a
60 fi w LA
I 40 LA
20
- 0
DISSOLUTION TIME (hr )
Fig. B-9. Aluminum Dissolution Rate as a Function of Fuel Element
Dissolution Time for Run RA-4.
ORNL Dwg 70-12440

62
10.3 Appendix C: Decontamination of P i lo t Plant Equipment
Decontamination methods similar t o those described f o r decontami- nating the plant a f t e r the zirconium program w a s completed 3 were used
t o reduce radiation levels i n excess of 5000 r /hr t o leve ls suf f ic ien t ly
low t o permit t he plant t o be dismantled. duals who did the mechanical work did not exceed the quarterly 1.3-r allowance (see data i n Table E-1).
ment remod. ) were 1 t o 5 r /hr i n the majority of c e l l 1 locations; a
maximum reading of 60 r /hr was obtained adjacent t o the HF i n l e t l i n e
t o the dissolver.
Radiation dosage t o indivi-
Final backgrounds (pr ior t o equip-
Backgrounds i n other areas of the plant were generally , I l e s s than 1 r/hr.
1 The decontamination sequence included flushing w i t h a molten salt, , followed by treatment with three types of aqueous solutions f o r removing
salt f i l m , metal sca le , and deposits of radioactive nuclides. The
compositions of the three solutions were, respectively:
Ammonium oxalate, 0.3 t o 0.35 Aluminum n i t r a t e , 0.1 - M; o r Al(NO3)3*HN03, 0.1 t o 0.01 3 Sodium hydroxide--hydrogen peroxide--sodium tar t ra te , about
5-1-1 wt %.
This procedure i s sui table f o r use w i t h radiat ion leve ls a t least
as high as those encountered i n the operating period c i ted , and it does not r e su l t i n excessive personnel exposure during the decontamination
and subsequent equipment removal.
6( S

63
10.4 Appendix D: Corrosion of Vessels
i
.
1
I,
Corrosion s tudies i n the Vola t i l i ty programs w e r e di rected pr i -
marily at the dissolver (hydrofluorinator) and the f luorinator f o r
three reasons. F i r s t , these two vessels were located i n a congested
no-access" mea t h a t w a s accessible only after extensive decontamina-
t i on , whereas many of the other vessels were located i n limited-access
areas.
t i on of the plant , were e s sen t i a l t o the operation of the p lan t , and
t h e i r replacement would require a major shutdown ( i n addition t o the
necessary decontamination).
vessels and components w a s s l i gh t , probably because the conditions
under which they were operated (especial ly temperature and contact with
corrosive chemicals ) were less dras t ic .
!I
Second, these vessels, which were a par t of the head-end por-
Third, corrosion observed on the other
Earlier Studies at BMI. Studies made at BMI (Bat te l le Memorial
I n s t i t u t e ) of the dissolver under run conditions indicated a metal
loss of 0.2 mil/month f o r INOR-8 during aluminum processing as com-
pared with 2.5 t o 5 mils/month during zirconium p r o ~ e s s i n g . ~
intergranular a t tack w a s observed.
corrosion rate of approximately 10 mils/month during aluminum processing
because of intergranular attack.8 The t o t a l t i m e of HF exposure during
the aluminum runs w a s 250 hr .
No
L a t e r s tudies indicated an INOR-8
Studies at BMI indicated a corrosion rate of approximately 100
mils/month fo r t he "L" nickel f luorinator during aluminum al loy pro-
cessing as compared with approximately 30 mils/month during zirconium
processing. The higher rate w a s a t least p a r t i a l l y a t t r i bu ted t o the
higher operating temperature [6oo0c ra ther than 5OO0C (ref. g ) ] t h a t
w a s used i n t he aluminum processing.
Corrosion of the Dissolver. The t o t a l corrosion of the dissolver
during the 10 aluminum runs w a s 5 mils, as previously reported. lo
value w a s obtained by using pulse-echo and Vidigage techniques.
corrosion data for the dissolver are reported elsewhere.
This Previous
4

64
Fluorinator. (a) Vessel. - Corrosion data f o r the f luorinator 4 during zirconium processing are reported elsewhere.
data for the last 11 zirconium runs were not reported i n that reference
because the fluorinator w a s not examined between the end of the zir -
conium program and the start of the aluminum program.)
r e su l t s obtained on examination of the f luorinator after the plant
w a s dismantled following the aluminum program are reported i n Table
D-1.
runs and 10 aluminum runs) and all aqueous decontamination sequences.
(However, the
Corrosion
The values l i s t e d i n Table D-1 a re f o r 50 runs (40 zirconium
The region most vulnerable t o attack w a s the salt region, as noted
p r e v i ~ u s l y . ~ The maximum corrosion w a s l e s s than 3/4 mil per run; the
average was less than 1/2 mil per run.
side of the f luorinator revealed no evidence of excessive attack. Com- parison of the losses i n t o t a l w a l l thickness (Table D-1) with data
obtained i n the e a r l i e r corrosion study
approximately 10 m i l s apparently occurred i n the bottom of the vessel
(but not i n the top) during the aluminum runs.
Visual examination of the in-
4 revealed tha t metal losses of
(b) Corrosion Rods. -The corrosion rods tha t were placed i n
the f luorinator i n l a t e 1962 were removed when the plant was dismantled following the aluminum program. Results of visual inspection of the
rods are summarized i n Table D-2. The rods were not examined metal-
lographically because of the termination of the Vola t i l i ty program i n
mid-1967.
Other Vessels and Components. (a ) HFV-2207-1 (HF i n l e t l i n e t o
the dissolver) . - Visual inspection of the 3-ft length of INOR-8 l i n e ,
including the elbow, showed only minor scratches. No evidence of
leakage was noted when t h i s section of pipe was pressurized t o 35 psig.
This portion of the l i n e w a s examined because it had f a i l e d during ear ly v o l a t i l i t y processing. A t tha t time, however, the l i n e was
made of Inconel instead of INOR-8.
4
(b) Fluorine Supply Tanks. - Inspection of the inside of
tank NB-1432 on June 7, 1962, revealed no corrosion; no leakage occurred
LJ
.
.

Table D-1. Bulk Metal Losses from the Nickel 201 Fluorinator
During F i f ty and Associated
Aqueous Decontaminations i n the VPP i
d Exposure times: 90.7 h r of fluorineCsd; 2962 hr of molten salt
c
W
Section of the Fluorinator
M e asur e de
Total Wall Thickness
LOSS ( m i l s ) M U . Avg .
Corrosion R a t e M i l s per month of Molten Sa l t
Exposure
M i l s per hour of F2 Exposure
Max. Avg . M U . Avg . Top 16-in. -dim 11 3.5 0.12 0 A39 2-7 0.85
section
Top cone 13 8.4 0.14 0.093 3.2 2.0
Neck 24 18.6 0.26 0.205 5.8 4.51
Bottom 16-in. - 27 19.2 0.30 0.212 6.6 4.66 dim sect ion
Bottom cone 29 21.0 0.32 0.232 7.0 5.10
%arty zirconium runs and t en aluminum runs.
bSee ORNL-3623 (ref. 41, Table 12. C Fluorine exposure t i m e does not include vessel exposure during de-
sorption.
A breakdown of exposure t i m e s i s as follows: dvalues given include those presented i n Table 12 , 0 ~ ~ ~ 3 6 2 3 (ref. 4 ) .
Fp Exposure Time Molten Sa l t Exposure Time No. of Runs (hr) (hr)
29 (value from 0 ~ ~ ~ 3 6 2 3
57.6 1922
11 ( f i n a l runs i n 18.1 Z r program)
10 (runs i n Al
50 ( t o t a l runs>
program) 15.0
604
436
2962
e
the vessel . Measurements were made at 1-in. in te rva ls i n the south quadrant of

66
Table D-2. Condition of Corrosion Rods on Removal from
Fluorinator After the Aluminum Runs
Material Results of Visual Operation
INOR-8a
"L" Nickela
HyMu-80
Specimen lb3'
Specimen 2 Same as fo r specimen 1.
Ni-Mg
Brown film; some corrosion i n salt region.
Brown film; some corrosion at middle and bottom.
Thin brown f i l m over full length; some loose material on top 4 in . ; uniform diameter.
Brown f i l m ; s l i gh t loss i n width at bottom; warped.
b
Brown fi lm; corrosion s i m i l a r from top t o bottom. b
Ins ta l led on November 13, 1962. a
bInstal led on December 11, 1962.
Weld t e s t un i t s fabricated from "L" nickel and INOR-8, using the C
following weld materials : I~CO-82 INOR-8 1nco-61 and "L" nickel.
b 5
.

W c
i
during a 75-psig pneumatic t e s t .
head appeared t o be cavitating i n the heated-affected zone of the weld.
The f i l l e d weld around this out le t 9n the tank exter ior w a s thought t o
be adequate t o take care of the condition on a temporary basis.
s top valves i n the manifold section were checked and reworked i f
necessary.
of these surfaces was recommended.
The 1/2-in. gage out le t on the rear
All
"he external surfaces were found t o be corroding; painting
Inspection of the inside of tank NB-1433 on July 28, 1966, revealed
no corrosion; no leakage w a s observed when the tank w a s pressurized t o
75 psig. In l e t and out le t stubs t h a t had been welded t o t h e rear head
showed no corrosion.
checked and overhauled.
the uni t w a s repainted.
( c )
A l l s top valves i n the manifold section were
External surfaces of the uni t were sat isfactory;
Other Vessels. -No vis ib le corrosion w a s detected visu-
al ly i n (1) the movable-bed absorber (FV-1051, (2 ) the flash cooler
(FV-1001) , (3) the HF condenser (FV-2001), o r (4) the f u e l element
charging chute on the dissolver (FV-1002).
#
Ir,
1
68
10.5 Appendix E: Radiation Safety
Penetrating radiat ion from materials being processed required t h a t
each piece of equipment containing the material be heavily shielded t o
prevent exposure of operating personnel. Access t o the process equip-
ment w a s carefully controlled at all times during normal operation and
while maintenance or decontamination operations were i n progress. The
physical form of the material involved (dust pa r t i c l e s , l iqu ids , or
gases) governed the type of protective Clothing and respiratory equip-
ment t h a t was used i n these shielded areas.
The average r a t e and the maximum r a t e of personnel exposure t o
radiation i n the aluminum program were about the same as those encountered
i n the zirconium program.
during plant decontamination procedures because temporary, unshielded
In each case, exposure rates were highest
piping w a s connected t o "dead end" process l i nes i n normal work areas
f o r recycle of solutions.
m a x i m u m exposure t o any individual did not exceed 75% of the recommended
maximum permissible dose t o body organs for a calendar quarter.
Even under these conditions, however, the
3
Unusual occurrences* were less frequent i n the aluminum program
than i n the zirconium program, largely because experience had been
gained i n making design and operational changes. Because we anticipated
higher radiation leve ls from the shorter-cooled elements t ha t were t o be
processed i n the aluminum campaign, lead shielding w a s i n s t a l l ed i n many
areas t h a t formerly did not require it; corrective actions were taken as
problems developed.
Personnel Exposure. -Radiation exposure t o personnel w a s due pr i -
marily t o the presence of 12'Sb, 9 5 Z r , and "Nb i n the dissolver off-gas
LJ
* An unusual occurrence i s defined as one which may r e su l t i n (a)
personnel exposure i n excess of the maximum permissible, (b) cleanup costs o r property loss i n excess of $5000, ( c ) an incident of public- re la t ions significance, or (d) exposure of the off-s i te population t o radiation i n excess of the maximum permissible.
69
c
i
i
ad
system and t o the presence of 237U, 99Tc, lo3Ru, lo6Ru, 99M0, and 237Np
i n the fluorinator off-gas and product collection systems.
The average exposure r a t e remained fairly constant during the pro-
cessing of dummy and i r radiated fue l elements, but increased by about
a factor of 2 during decontamination (Table El).
During the processing of i r radiated fuel elements, the maximum dose
received by an individual during a single day was 80 mrads.
sure occurred at the conclusion of run RA-4 when an operator removed the
product receiver from the receiving s ta t ion i n c e l l 2 and hauled it t o
the sampling room i n a lead-lined drum. The product was highly radio-
active because of the unusually high 237U content.
reading of the unshielded product cylinder w a s 25 r /hr at a distance of
1.5 in .
This expo-
The "cutie pie"
During the decontamination period, the maximum dose received by an
individual i n a single day w a s 150 mrads.
replacement of a damaged rubber gasket on the waste s a l t nozzle sealing
jack. Removal of the gasket was slow because the nut t ha t held the end
flange of the drain l i n e t igh t ly against the gasket was located on the
underside of the gasket holder and w a s not easi ly accessible.
This exposure occurred during
In summary, the maximum radiation exposure received i n the alumi-
num campaign did not exceed about 75% of the ORNL l i m i t of 1.3 rem/quarter,
or 5 rem/year.
50% of the maximum. The average VPP personnel radiation exposure w a s about
Unusual Occurrences. - N o unusual occurrences were experienced
during the processing of dummy or i r radiated fue l elements i n the alumi- num program.
t ion for s tar tup, and one during vessel decontamination.
However, two occurred a t other times: one during prepara-
Jus t before the first dummy fue l element was processed, some pre-
viously used air-operated valves were dismantled and decontaminated i n
a "hot" sink preparatory t o repair .
and the nos t r i l s of the operator i n charge were contaminated by a loose
powder found inside the valves.
During th i s procedure, the ha i r
However, subsequent investigation

70
Table E-1. Radiation Exposure of Personnel During the
Processing of Aluminum-Clad Fuel Elements
Type of Run Exposure (mads ) or Operationa Max. /Day Max. /Week Max. /Quarter A v g . /Quarter
DA 60 75 450 200
UA 50 120 500 130
RA 80 150 505 240
De cont amina- t i on 150 190 940 440
b,
%A - dummy elements containing aluminum only. UA - dummy aluminum elements "spiked" with unirradiated UF4. RA - LITR and ORR f u e l elements cooled 18 months t o 25 days.
.
.

L d
i
showed tha t the operator had received no in te rna l exposure and only
negligible external exposure.
a ventilated hood w a s needed over the sink and tha t a mask should be
worn when contaminated equipment was being opened.
Analysis of the incident indicated tha t
After the aluminum ser ies had been completed, a radiochemical s p i l l
(of material t ha t had not completely drained from a pipe) occurred
during an attempt t o remove a valve bellows assembly from an inactive
HF charging system pipe l i ne south of Building 3019. The bellows as-
sembly w a s needed t o replace one tha t had fa i led i n the combination
caustic sampling and temporary decontamination solution recycle system
i n c e l l 2.
mantling procedure), some radioactive l iquid i n the pipe flowed past
the operator, as signaled by a personal radiation monitor.
continued along the pipe t o a previously dismantled valve and overflowed
t o the ground.
taminated by flushing with water, chipping, and vacuum cleaning. Inves-
t iga t ion showed tha t the three people i n the vicini ty at the time of the
incident received no in te rna l exposure and only negligible external
exposure.
When the valve w a s opened s l igh t ly (a s tep i n the valve dis-
This l iqu id
The blacktop area under the dismantled valve w a s decon-
Control of Exposure. -Radiation exposure to personnel was controlled
by taking appropriate action following thorough, frequent checking of
the work areas during the runs. by shielding vessels and pipes w i t h lead plate, by discarding contaminated
solutions, and by backflushing f i l t e r s .
operating personnel was safely reduced by using revised operating proce-
dures.
w a s decreased by decreasing the purge rates and the duration of the purges.
A 35-point radiation check of the area w a s made at l ea s t once per
8-hr sh i f t during each run t o determine any chmges i n the background.
Data are summarized fo r runs RA-1 through -4 i n Table E-2.
High radiation backgrounds were reduced
The number of c e l l en t r ies by
The amount of radioactive material t ha t escaped t o the atmosphere
Some of the measures taken t o reduce the radiation exposure are
discussed below. shielding reduced the background radiation at the caustic sampler i n
For example, the ins ta l la t ion of 1/2-in.-thick lead

Table E-2. Radiation Backgroundsa in the Various VPP Work Areas During Runs RA-1. -2, -3, and -4
RA-1 RA-2 RA-3 RA-4 Before After Before After Before After Before After
Location Run Run RUI Run Run M a x . Run Run M U . Run
36 17
31 25 28 9
Cell 2. HF System
FV-700-1C. Bp f i l t e r ECV-1003-1, EF catch tank drain valve
Caustic sampling station
Suction l ine of FV-4201. caustic pump
W-4202. HF pump, remote head
FV-l207. EF vaporizer
30 7 13 35 22 9
120 20
65 65 48 15
200 48 35
410 100
16
300 60
85 40 60 42
160 42
50 25 48 28
Cell 2. UFg System
Heated duct a t entry from ce l l 1 W-120-A. MgFz bed
FV-723. product stream f i l t e r
FV-220, cold trap FV-121-A. chemical t rap
43 45 47 58 8 7 8 15 5 6 5 8 5 5 5 6 ll 13 14 49
44 70 45 9 40 32 6 30 13 5 1 2 10
40 120 105
46 12 12 9 13
200 100 MO 300
120 95 65.O0Ob 35 330 27
Penthouse. HF system
FV-7500. off-gas liquid trap
Off-gas l ine from W-1009. caustic neu-
FV-9509, f l m e a m s t o r
Dissolver vent l ine a t f i l t e r W-7501 Transmitter rack (back)
t ra l izer
2 1
10 2 1
6 2
18 3
12
25 8
15 3
5 11
2
35 10
14 35 6
24 4
6 34 4
17 5
8 24 3
96 15
60 66
200
90 10
35 22 82
5 3 1
Penthouse Fz Systan
W-153. liquid trap in off-gas l ine
W-150. caustic scrubber. top
W-150. caustic scrubber. bottom W-152. caustic surge tank
W-450. caustic pump
Tellurium trap. W-154. nickel wool
Tellurium trap, W-155. charcoal
32 205 25 6
155 16 -
14 ll0
15 8
40 6 1
22 140 120
95 100 11
8
14 35 10
85 100
7 2
600 1,000
800 5.500 1.800
600 440
180 160
170 400
730 440 440
Off-Gas Scrubber System
FV-164, first stage of scrubber
W-164. middle of scrubber
FV-164. scrubber entrainment separator
FV-765. f i l t e r pv-165. surge tank
14 4 1 6 2
22 4 2
5 2
17 4 2 6 2
17 4 2
6
3
15 4 2 6 2
19 6 4 8
7
26 6 4 9 5
43 23 20 22 64
43 23 20 22 64
25 6 4 8
7
%dues (LIY given in mr/b. bAiter nitrogen-sparge of s a t in fluorinator (prior t o fluorination).

73
c e l l 2 t o 20% of the previous value.
duced the background at the NaF t r ap (FV-121) t o about 25% of tha t
before ins ta l la t ion . This same thickness a l s o reduced the background
for the fluorinator off-gas scrubber (FV-150) t o 10-25% of the unshielded
background. Approximately 1 in. of lead tha t was placed over the i n l e t
l i n e for the caustic circulating pump (FV-4201) i n c e l l 2 reduced the
background t o 6% of tha t observed ear l ie r .
The same thickness of lead re-
The dumping of fluorinator off-gas scrubber recycle caustic solu-
t i on reduced the background for the storage tank (FT-152) t o about 10%
of tha t p r ior t o dumping.
caustic c i rculat ing pump (FV-450) w a s reduced by about 40 t o 50%.
flushing of the dissolver off-gas f i l t e r (FV-7001C), using waste l iquid
€IF, reduced i ts background t o about 25% of tha t noted previously.
A t the same time, the background fo r the
Back-

74
10.6 Appendix F: Index of Volat i l i ty P i lo t Plant Log Books
The log books l i s t e d below, along with the run sheets and the
recorder charts, comprise the primary record of the VPP operations
described i n this report. The run sheets and the recorder charts w i l l
be destroyed two months a f t e r t h i s report i s issued. The log books
w i l l be retained permanently a t O a k Ridge National Laboratory.
~
Laboratory Records
VPP Log Notebook No. No. Inclusive Dates Subject Matter
W
1 t o 15
16 to 43
44
45
46
47
48
49
50
51
52
53
54
A-2964
A-2226
A-3389
A- 3390
A-3422
A-3423
A-3474
A-3475
A-3476
A-3477
A-3478
7/11/56-10/7/59
10/19/59-9/11/63
9/12/63-1/22/64
1/22/64-3/26/64
5/1/64-6/2/64
6/2/64-6/26/64
6/26/64-8/4/64
8/4/64-9/10/64
9/ll/64-10/19/64
10/19/64-ll/16/64
11/16/64-12 /14 /64
ARE Program
U-Zr Alloy Program
Preparation for U-Al Pro- gram
Preparation for U-Al Pro- gram
Run DA-1 (aluminum, no uranium)
DA-1
DA-2 and UA-1 (uranium and aluminum, non- i r radiated )
UA-1 and UA-2
UA-3 and RA-1 ( i r rad ia ted)
RA-1 and RA-2
RA-2, RA-3, and RA-4
RA-3 and RA-4 (short- cooled)
Cleanout and Shutdown
(cont. )

75
i
i
Laboratory Records
VPP Log Notebook No. No. Inclusive Dates Subject Matter
55 A-3711 2/2/65-3/23/65 Cleanout and Shutdown
56 A-3714 3/24/65-5/27/65 Complete VPP Log Index
A-6105 Sample Log
A-6106 Sample Log

L

W "
77
ORNL-4 574 UC-10 - Chemical Separations Processes
f o r Plutonium and U r a n i u m
5
t
W
1. 2-4.
5.
6-25. 26. 27 28. 29 30. 31. 32. 33. 34. 35 36. 37 38. 39 40. 41. 42. 43. 44. 45 46. 47 0
48. 49 9
51 52 9
53 0
54 55 56 0
57
5 O
INTERNAL DISTRIBUTION
Biology Library Central Research Library ORNL - Y-12 Technical Library Document Reference Section Laboratory Records Department Laboratory Records , OFiNL R. C . E. D. Arnold J. E. Bigelow R. E. Blanco J. 0. Blomeke R. E. Brooksbank K. B. Brown F. N. Browder W. D. Burch G. I. Cathers W. L. Carter J. M. Chandler C. F. Coleman D. J. Crouse F. L. Culler F. L. Daley D. E. Ferguson L. M. Fe r r i s E. J. Frederick H. E. Goeller A. T. Gresky M. B. Herskovitz R . W. Horton L. J. King F. G. K i t t s B. B. K l i m a C. E. Lamb R. E. Leuze B. Lieberman R. B. Lindauer R. S. Lowrie H. G. MacPherson
58. S. Mann 59. W. T. McDuffee 60. W. A . McLoud 61. L. E. McNeese
62-63. R. P. Milford 64. C . H. Miller 65. C. A . Mossman 66. J. P. Nichols 67. E. L. Nicholson 68. R. G. Nicol 69. J . R. Par ro t t
70-71. J. H. Pashley 72. G. E. Pierce 73. J. B. Ruch 74. A. D. Ryon 75. W. F. Schaffer 76. R . J . Shannon 77. W. A . Shannon 78. L. B. Shappert 79. M. J. Skinner 80. Martha Stewart 81. W. G. Stockdale 82. D. A . Sundberg 83. W. E. Unger 84. V. C. A . Vaughen 85. A . M. Weinberg 86. M. E. Whatley 87. W. R. Whitson 88. E. I. Wyatt 89. R . G. Wymer 90. E. L. Youngblood 91. P. H. Emmett (consultant) 92. J. J. Katz (consultant) 93. J. L. Margrave (consultant) 94. E. A. Mason (consultant) 95. R. B. Richards (consultant)
EXTERNAL DISTRIBUTION
96-98. W. H. Carr, Nuclear Project Engineering, All ied Chemical Nuclear Products, Inc. , P. 0. Box 35, Florham Park, New Jersey 07932
99. W. H. L e w i s , Nuclear Fuel Services, Inc. , Wheaton Plaza Building, Sui te 906, Wheaton, Maryland 20902

100. F. W. Miles, General Electric Company, Midwest Fuel Recovery
101. S . Smolen, General Electric Company, Midwest Fuel Recovery
102. J. A. Swartout, Union Carbide Corporation, New York 10017 103. Laboratory and University Division, AEC, OR0 104. Patent Office, AEC, OR0
Plant, Morris, Illinois 60450
Plant, Morris, Illinois 60450
105-240. Given distribution as shown in TID-4500 under Chemical Separations Processes for Plutonium and Uranium category (25 copies - NTIS)
hi