molecular variability in brycon cf müller and troschel ... · müller and troschel, 1845...
TRANSCRIPT

©FUNPEC-RP www.funpecrp.com.brGenetics and Molecular Research 7 (1): 95-106 (2008)
Molecular variability in Brycon cf. pesuMüller and Troschel, 1845 (Characiformes:Characidae) from the Araguaia-Tocantins basin
R.S. Panarari-Antunes1,2, A.J. Prioli2,3, S.M.A.P. Prioli2,3, H.F. Júlio Jr.2,3,C.S. Agostinho5 and L.M. Prioli2,4
1Programa de Pós-Graduação em Ecologia de Ambientes Aquáticos Continentais 2Núcleo de Pesquisas em Limnologia, Ictiologia e Aqüicultura (Nupelia)3Departamento de Biologia Celular e Genética 4Departamento de Biologia, Universidade Estadual de Maringá, Maringá, PR, Brasil 5Universidade Federal do Tocantins, Porto Nacional, TO, Brasil
Corresponding author: A.J. PrioliE-mail: [email protected]
Genet. Mol. Res. 7 (1): 95-106 (2008)Received September 20, 2007Accepted December 19, 2007Published February 1, 2008
AbSTRACT. Brycon pesu is a small-sized fish distributed throughout the Amazon and Orinoco Basins and other coastal basins of northeastern South America. Brycon cf. pesu specimens from the Araguaia-Tocantins Basin are currently separated into two morphotypes, Brycon sp1 and Brycon sp2, owing to different coloration of their anal fin. Brycon sp2 has a reddish margin stripe on the anal fin which morphologically distinguishes it from Brycon sp1. In the present research, nuclear and mitochondrial markers were used to test the hypothesis that the Brycon sp1 and Brycon sp2 morphotypes are distinct species. Specimens from the two morphotypes were collected from the Lajeado Hydroelectric Plant and the Palmas River in the Araguaia-Tocantins Basin. Thirty-five loci obtained by the amplification of five inter-simple sequence repeat primers were analyzed but no species-specific bands were detected. Electrophoretic profiles obtained from 5S rDNA non-transcribed spacer amplification failed to show any differentiation in morphotypes. These results were corroborated by nucleotide sequence analysis of the mtDNA control region, in which 24 polymorphic nucleotide sites, representing a polymorphism rate of only 5%, were detected. The low rates of polymorphism detected by inter-simple sequence repeat,
96
©FUNPEC-RP www.funpecrp.com.brGenetics and Molecular Research 7 (1): 95-106 (2008)
R.S. Panarari-Antunes et al.
non-transcribed spacer and mtDNA D-loop markers strongly reject the hypothesis that the two morphotypes Brycon sp1 and Brycon sp2 represent distinct species within Brycon cf. pesu. Further studies are needed to obtain conclusive data on the notion that the coloration of the anal fin is an intraspecific polymorphism, possibly related to environmental factors.
Key words: Brycon cf. pesu; Araguaia-Tocantins Basin; Morphotypes; Inter-simple sequence repeat; 5S rDNA non-transcribed spacer; mtDNA
InTRoduCTIon
The genus Brycon comprises around 40 species and is one of the main tropical fresh-water fish genera distributed in Central and South America (Lima, 2003). It consists of vari-ous important migratory species, of which many are important resources for fishing. Brycon pesu, Müller and Troschel 1845, also called “beiradeira”, is a small fish that has a standard length of up to 12 cm. It is widely distributed in South America, being found in the Amazon Basin, the Orinoco River Basin, and Guyana, Suriname and French Guyana Rivers (Lima, 2003). It lives in sandy and rocky areas in rapidly flowing waters (Planquette et al., 1996), and habitually feeds at river banks, mainly on terrestrial insects. It is believed that B. pesu is a complex of species, as the specimens found outside of Guyana, its type locality, possess some morphological differences. However, these species have still not been described, with all of them being identified as simply B. pesu. Therefore, in this paper, this complex of species will be referred to as Brycon cf. pesu.
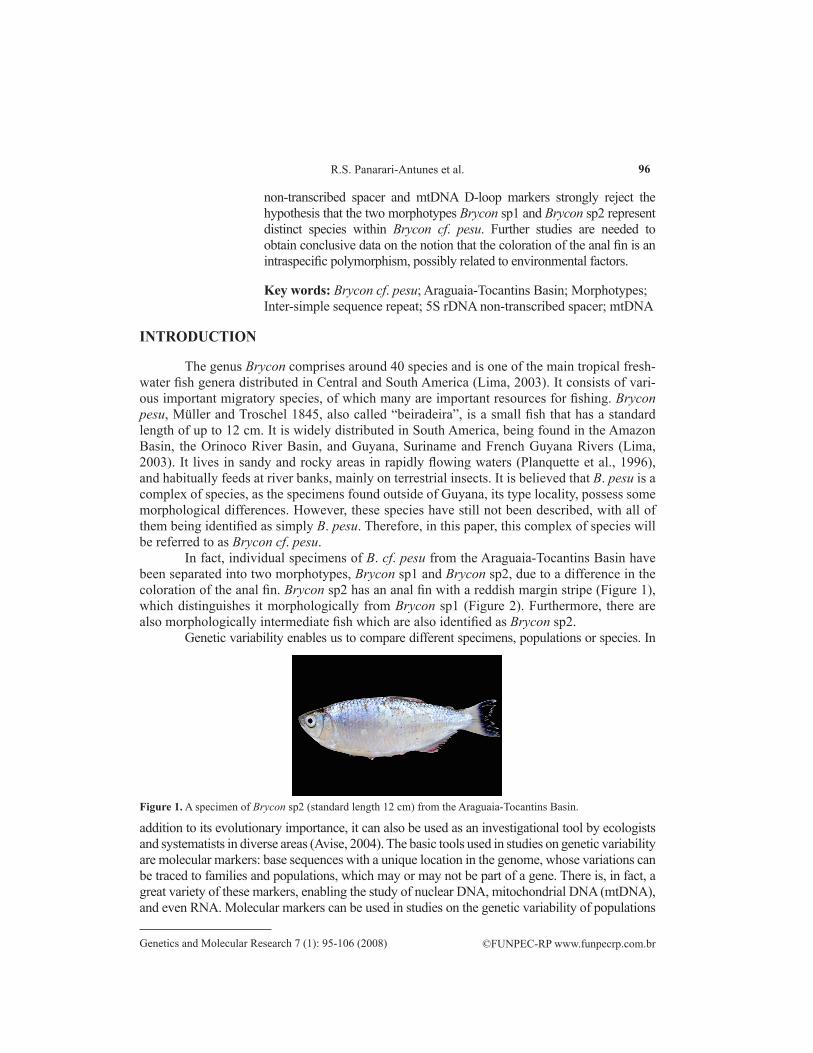
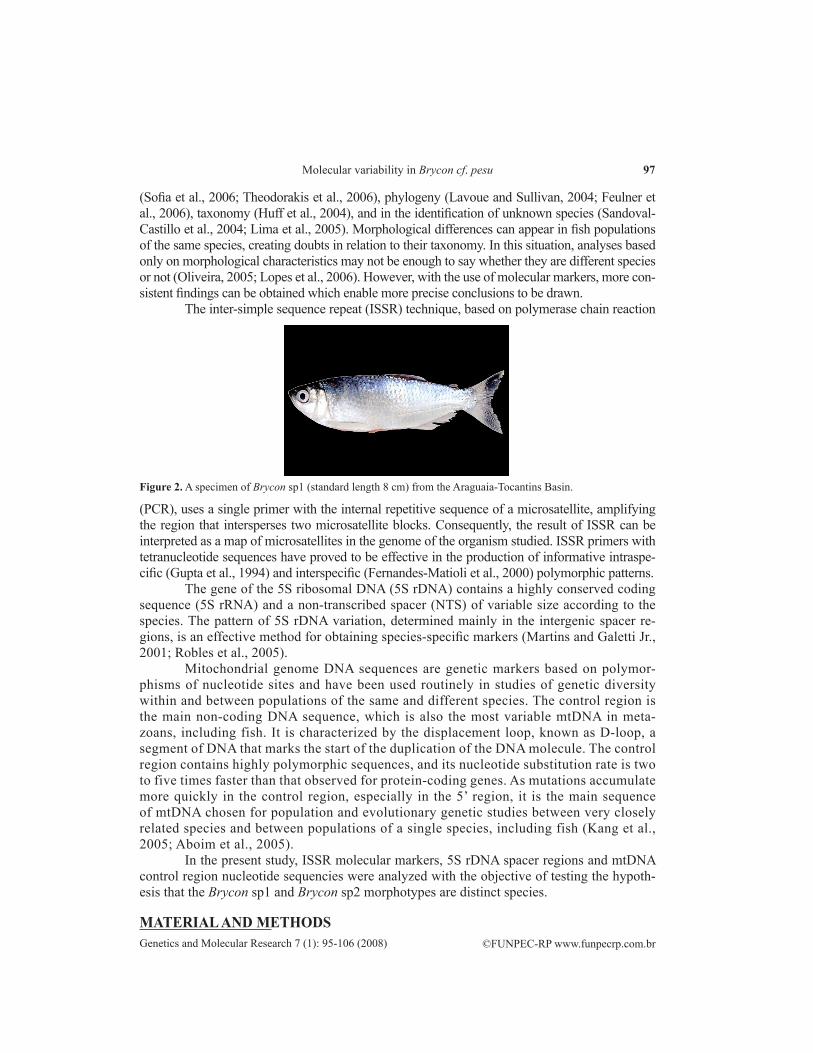
In fact, individual specimens of B. cf. pesu from the Araguaia-Tocantins Basin have been separated into two morphotypes, Brycon sp1 and Brycon sp2, due to a difference in the coloration of the anal fin. Brycon sp2 has an anal fin with a reddish margin stripe (Figure 1), which distinguishes it morphologically from Brycon sp1 (Figure 2). Furthermore, there are also morphologically intermediate fish which are also identified as Brycon sp2.
Genetic variability enables us to compare different specimens, populations or species. In
Figure 1. A specimen of Brycon sp2 (standard length 12 cm) from the Araguaia-Tocantins Basin.
addition to its evolutionary importance, it can also be used as an investigational tool by ecologists and systematists in diverse areas (Avise, 2004). The basic tools used in studies on genetic variability are molecular markers: base sequences with a unique location in the genome, whose variations can be traced to families and populations, which may or may not be part of a gene. There is, in fact, a great variety of these markers, enabling the study of nuclear DNA, mitochondrial DNA (mtDNA), and even RNA. Molecular markers can be used in studies on the genetic variability of populations
97
©FUNPEC-RP www.funpecrp.com.brGenetics and Molecular Research 7 (1): 95-106 (2008)
Molecular variability in Brycon cf. pesu
(Sofia et al., 2006; Theodorakis et al., 2006), phylogeny (Lavoue and Sullivan, 2004; Feulner et al., 2006), taxonomy (Huff et al., 2004), and in the identification of unknown species (Sandoval-Castillo et al., 2004; Lima et al., 2005). Morphological differences can appear in fish populations of the same species, creating doubts in relation to their taxonomy. In this situation, analyses based only on morphological characteristics may not be enough to say whether they are different species or not (Oliveira, 2005; Lopes et al., 2006). However, with the use of molecular markers, more con-sistent findings can be obtained which enable more precise conclusions to be drawn.
The inter-simple sequence repeat (ISSR) technique, based on polymerase chain reaction
Figure 2. A specimen of Brycon sp1 (standard length 8 cm) from the Araguaia-Tocantins Basin.
(PCR), uses a single primer with the internal repetitive sequence of a microsatellite, amplifying the region that intersperses two microsatellite blocks. Consequently, the result of ISSR can be interpreted as a map of microsatellites in the genome of the organism studied. ISSR primers with tetranucleotide sequences have proved to be effective in the production of informative intraspe-cific (Gupta et al., 1994) and interspecific (Fernandes-Matioli et al., 2000) polymorphic patterns.
The gene of the 5S ribosomal DNA (5S rDNA) contains a highly conserved coding sequence (5S rRNA) and a non-transcribed spacer (NTS) of variable size according to the species. The pattern of 5S rDNA variation, determined mainly in the intergenic spacer re-gions, is an effective method for obtaining species-specific markers (Martins and Galetti Jr., 2001; Robles et al., 2005).
Mitochondrial genome DNA sequences are genetic markers based on polymor-phisms of nucleotide sites and have been used routinely in studies of genetic diversity within and between populations of the same and different species. The control region is the main non-coding DNA sequence, which is also the most variable mtDNA in meta-zoans, including fish. It is characterized by the displacement loop, known as D-loop, a segment of DNA that marks the start of the duplication of the DNA molecule. The control region contains highly polymorphic sequences, and its nucleotide substitution rate is two to five times faster than that observed for protein-coding genes. As mutations accumulate more quickly in the control region, especially in the 5’ region, it is the main sequence of mtDNA chosen for population and evolutionary genetic studies between very closely related species and between populations of a single species, including fish (Kang et al., 2005; Aboim et al., 2005).
In the present study, ISSR molecular markers, 5S rDNA spacer regions and mtDNA control region nucleotide sequencies were analyzed with the objective of testing the hypoth-esis that the Brycon sp1 and Brycon sp2 morphotypes are distinct species.
MATeRIAL And MeTHodS

98
©FUNPEC-RP www.funpecrp.com.brGenetics and Molecular Research 7 (1): 95-106 (2008)
R.S. Panarari-Antunes et al.
Study area
The Araguaia-Tocantins Basin drains 767,000 km2 of land, of which 343,000 km2 belongs to the Tocantins River Basin, 382,000 km2 to the Araguaia (its main tributary) and 42,000 km2 to the Itacaiunas (the largest contributory of the lower course). Bound by the Paraná-Paraguay (south), Xingu (west), São Francisco (east), and Parnaíba (northeast) Basins, and the Tocantins River, the most southeastern tributary of the Amazon Basin, it integrates the landscape of the Planalto Central (Central Plateau). Seventy-six percent of the basin is composed of open pastures, while the lower courses of the Tocantins and Itacaiunas Rivers are covered by the Amazon Rainforest. Between these two large regions, the basin crosses a transition zone of pre-Amazonian environments.
biological material
Twelve specimens of each B. cf. pesu morphotype were collected in the fish ladder of the Lajeado Hydroelectric Plant (09°46'S 48°21'W), built on the Tocantins River, and in the Palmas River, its tributory, in the Araguaia-Tocantins Basin (Figure 3). Samples of muscle tissue were preserved in alcohol. Standard material of the morphotypes Brycon sp1 (UMT 2281; 3099; 3102; 3115; 3116; 3125; 3128; 3133; 3136; 3139) and Brycon sp2 (UMT 2282; 2286; 3097; 3101; 3106; 3108; 3109; 3118; 3120; 3121) can be found in the fish collection of the Laboratório de Ictiologia Sistemática (Laboratory of Systematic Ichthyology) at the Federal University of Tocantins.
Figure 3. Araguaia-Tocantins Basin: 1 - Lajeado Hydroelectric Plant fish ladder, 2 - Palmas River.
99
©FUNPEC-RP www.funpecrp.com.brGenetics and Molecular Research 7 (1): 95-106 (2008)
Molecular variability in Brycon cf. pesu
Extraction and quantification of the DNA genome
DNA extraction was carried out using the phenol/chloroform method (Monesi et al., 1998). Samples of muscle tissue, of approximately 100 mg, were ground in liquid nitrogen. TH buffer (10 mM Tris-HCl, 60 mM NaCl, 10 mM EDTA, 5% sucrose, 0.15 mM spermine, and 0.15 mM spermidine), PS buffer (0.2 M Tris-HCl, 30 mM EDTA, 2% SDS, and 5% su-crose) and proteinase K (20 µg/µL) were added to the extract. The samples were then incubat-ed in a shaking water bath at 37°C for approximately 1 h. Next, the DNA was purified through washes with phenol/chloroform (1:1) and chloroform. The DNA was then precipitated using a saline solution (0.2 M NaCl) and chilled ethanol. The precipitate was submitted to several centrifugations with 70 and 100% ethanol, and finally resuspended in TE (1 mM Tris, 0.1 mM EDTA) containing RNase. The DNA of all the samples was later quantified on 0.8% agarose gel stained with ethidium bromide (20 µg/100 mL). Essentially, the quantification consisted of a comparison of the amount of DNA contained in 1 µL of each sample with the known quanti-ties of DNA in λ phage (Invitrogen Life TechnologiesTM, Carlsbad, CA, USA).
Inter-simple sequence repeat and data analysis
ISSR primers with tetranucleotide repetitions (GGAC)3A, (GGAC)3C, (GGAC)3T, (AACC)4, and (GGAC)4 were selected for analysis. The amplification reaction mixture consisted of Tris-KCl buffer (20 mM Tris-HCl, pH 8.4, and 50 mM KCl), 2 mM MgCl2, 0.46 µM primer, 0.19 mM dNTP, and 1 U/reaction of Taq DNA polymerase (Invitrogen Life TechnologiesTM), DNA (10 ng) and deionized sterile water to make the volume up to 13 µL. An MJ Research PT100 thermocycler was programmed for 5 cycles of: 45 s at 94°C, 1 min at 51°C and 1 min at 72°C, and 30 cycles of: 45 s at 94°C, 1 min at 48°C and 1 min at 72°C. Negative controls were included in each PCR. The DNA amplification con-ditions have been described by Albert et al. (1999). After amplification, 10-µL samples of the PCR mixture were submitted to electrophoresis on 1.4% agarose gel, stained with ethidium bromide (20 µg/100 mL). Electrophoresis was carried out using TBE buffer (Tris-borate), at 5 V/cm, for 3-4 h. The amplified fragments were visualized under ultra-violet light, and the gel was photographed for analysis. The size of the fragments could be estimated by comparison with the marker, 100-bp DNA ladder (Invitrogen Life Technolo-giesTM). Comparisons between the specimens were carried out by evaluating their genetic diversity based on the proportion of polymorphic loci inside each group.
The 5S rdnA spacer region and data analysis
The PCR technique was used for the amplification of the 5S rDNA gene and its spacers (NTSs - non-transcribed spacers), where the combination of initiators A (5’-TACGCCCGATCTCGTCCGATC-3’) and B (5’-CAGGCTGGTATGGCCGTAAGC-3’) was used. Five samples of each morphotype were analyzed. The amplification reaction mixture consisted of Tris-KCl buffer (20 mM Tris-HCl, pH 8.4, and 50 mM KCl), 1.5 mM MgCl2, 2.5 µM of each primer, 0.1 mM of each dNTP, 2.5 U/reaction of Taq DNA polymerase, 15 ng genomic DNA, and deionized autoclaved water to make the volume up to 25 µL. The fragment of DNA corresponding to the spacer region was amplified in 1 cycle of: 5 min at 94°C, 1 min at 95°C, 30 s at 63°C and 1 min at 72°C, and 34 cycles of 1 min at 95°C.

100
©FUNPEC-RP www.funpecrp.com.brGenetics and Molecular Research 7 (1): 95-106 (2008)
R.S. Panarari-Antunes et al.
Approximately 5 µL of amplified DNA from each sample was fractionated on 1.4% agarose gel, stained with ethidium bromide, and subjected to an electric field of 5 V/cm, for approximately 3 h. A negative control, without DNA, was included in each PCR. The pattern of bands produced was visualized in a transilluminator and photographed under UV light for later analysis, which was based on the comparison of the electrophoretic profile obtained for each morphotype.
Mitochondrial dnA and data analysis
The control region of the mitochondrial genome was partially amplified, by PCR, from the total DNA of five specimens of each of Brycon sp1 and Brycon sp2. Amplifica-tion was carried out using a pair of L 5’-AGAGCGTCGGTCTTGTAAACC-3’ (Cronin et al., 1993) and H 5’-CCTGAAGTAGGAACCAGATG-3’ (Meyer et al., 1990) D-loop primers. For the sequencing, two independent amplifications were carried out. Furthermore, the two strands of each reaction product were sequenced.
The amplification reaction mixture consisted of Tris-KCl buffer (20 mM Tris-HCl, pH 8.4, and 50 mM KCl), 1.5 mM MgCl2, 2.5 µM of each primer, 0.1 mM of each dNTP, 2.5 U/reaction of Taq DNA polymerase, 15 ng genomic DNA and deionized autoclaved water to make the volume up to 25 µL. The DNA fragments were amplified in one cycle of: 4 min at 94°C, 30 s at 56°C and 2 min at 72°C, 40 cycles of: 15 s at 94°C, 30 s at 56°C and 2 min at 72°C, and a final cycle of: 15 s at 94°C, 30 s at 56°C and 10 min at 72°C. The DNA samples (of approximately 50 ng) amplified in each PCR were used directly in sequencing reactions with BigDyeTM Terminator Cycle Sequencing, in an ABI-3100 automatic sequencer (Perkin Elmer), according to the manufacturer’s instructions.
The nucleotide sequences were aligned and analyzed with the program Vector NTI Suite version 6.0 (Informax, Inc.). All of the mtDNA sequences were aligned with the program CLUSTAL W. Genetic analyses of the mitochondrial sequences were carried out with the program MEGA 3 (Kumar et al., 2004). The Tamura and Nei genetic distances between the specimens were determined. A distance matrix was used to construct a dendrogram with the neighbor-joining algorithm, with bootstrap analyses based on 10,000 resamplings.
ReSuLTS
Inter-simple sequence repeat
Eleven specimens of Brycon sp1 and 12 of Brycon sp2 were analyzed for the (GGAC)3A and (GGAC)3T primers, and four specimens of each morphotype were analyzed for the (GGAC)3C, (AACC)4 and (GGAC)4 primers. The five ISSR primers produced from five to ten clear and repro-ducible bands, totaling 35 loci. The amplified fragments varied in length from 300 to 1900 bp. When the amplified loci of the Brycon sp1 and Brycon sp2 morphotypes were compared, the pres-ence of 14 monomorphic bands was detected; in other words, the dominant allele was present in all the specimens of both morphotypes. On the other hand, when they were analyzed within each morphotype, there were no exclusive monomorphic loci. The Brycon sp1 morphotype showed 17 polymorphic loci (48.6%), while the Brycon sp2 morphotype showed 15 (42.8%). The resultant electrophoretic profile was very similar for the two morphotypes, with only a few isolated poly-morphisms being observed (Figure 4).

101
©FUNPEC-RP www.funpecrp.com.brGenetics and Molecular Research 7 (1): 95-106 (2008)
Molecular variability in Brycon cf. pesu
5S rdnA spacer region
The amplification of the spacer region of the 5S rDNA gene produced only one clear fragment, of 600 bp. This fragment was present in all the specimens analyzed from Brycon sp1 and Brycon sp2. The presence of species-specific bands was not detected, with the excep-tion of one not very clear band of 350 bp that was present only in Brycon sp1. Therefore, the resultant electrophoretic profile did not demonstrate a marked genetic differentiation between the morphotypes (Figure 5).
Figure 4. Electrophoretic profiles of the inter-simple sequence repeat markers of the Brycon sp1 and Brycon sp2 morphotypes obtained with the (GGAC)3T primer. L: containing molecular weight marker fragments (100-bp ladder; Invitrogen Life TechnologiesTM, Carlsbad, CA, USA). N: negative control, without DNA.
Figure 5. Electrophoretic profile obtained by amplification of the spacer region of the 5S rDNA gene, for the Brycon sp1 and Brycon sp2 morphotypes. L: containing molecular weight marker fragments (100-bp ladder; Invitrogen Life TechnologiesTM, Carlsbad, CA, USA).

102
©FUNPEC-RP www.funpecrp.com.brGenetics and Molecular Research 7 (1): 95-106 (2008)
R.S. Panarari-Antunes et al.
Mitochondrial dnA
A fragment of approximately 450 bp, corresponding to the variable region of the mtDNA D-loop, was sequenced and used for analysis (Table 1). Twenty-four polymorphic nucleotide sites were identified distributed along the sequenced fragment. This value corre-sponds to around 5% of the total number of sequences analyzed. The nucleotide substitutions consisted only of transitions.
Specimen 0 0 2 3 5 5 8 9 1 1 1 1 1 1 1 1 1 1 2 2 3 3 3 3 Morphotype 1 8 9 8 0 9 0 1 0 1 2 3 3 4 5 5 6 8 2 9 1 2 4 8 1 2 2 3 4 3 4 5 4 5 0 3 2 8 8 4
Bry-sp1-3 T T T T T T T C T C T C C T C C T T G T T - C - Brycon sp1Bry-sp2-14 . . . . . . . . . . . . T . . T . . . . . . . T Brycon sp2Bry-sp1-8 . . . C . C C . C . C . T C . T C C A . . . . . Brycon sp1Bry-sp2-11 . . . . . . . . . . . . T . . T . . . . . . . . Brycon sp2Bry-sp2-12 C . . . . . . . . . . . T . . T . . . . . . . . Brycon sp2Bry-sp1-10 . . . . . . . . . . . . T . . T . . . . . . . . Brycon sp1Bry-sp1-2 . . . . . . . . . . . . T . . T . . . . C T T . Brycon sp1Bry-sp1-1 . C . . . . . . . . . . T . . T . . . . . . . . Brycon sp1Bry-sp2-9 . C C . . . . . . . . . T . . T . . . . C . . . Brycon sp2Bry-sp2-5 . C C . C . . T . T . T T . T T . . . C . . . . Brycon sp2
Table 1. Polymorphic nucleotide sites in the hypervariable DNA sequence (450 bp) of the mitochondrial control region (D-loop) of Brycon sp1 and Brycon sp2 specimens from the Araguaia-Tocantins River Basin. Dots indicate identity and dashes indicate indel. Polymorphic nucleotide sites are shown for specimen Bry-sp1-3.
As represented by the neighbor-joining dendrogram (Figure 6) constructed from the Tamura and Nei distance matrix, the identified polymorphism did not separate the Brycon sp1 and Brycon sp2 specimens. Furthermore, low bootstrap values between the groups indicate low genetic variability between the specimens.
Figure 6. A neighbor-joining dendrogram constructed from the Tamura and Nei distance matrix between the D-loop sequencies of the Brycon sp1 (lozenges) and Brycon sp2 (squares) morphotypes. Numbers above branches are bootstrap values, as based on 10,000 replicates.

103
©FUNPEC-RP www.funpecrp.com.brGenetics and Molecular Research 7 (1): 95-106 (2008)
Molecular variability in Brycon cf. pesu
dISCuSSIon
ISSR molecular markers have been used in various areas for genetic studies, where their value has been demonstrated in intrapopulational (Schulz et al., 2004) and interpopula-tional (Fernandes-Matioli et al., 2000) analyses of fish. Furthermore, the ISSR technique has some advantages compared to other techniques, such as RAPD, for example, as it has greater reproducibility, showing similar results even with large variations in amplification conditions (Matioli and Passos-Bueno, 2001).
The data obtained through ISSR molecular markers demonstrated that there was a high degree of similarity between the Brycon sp1 and Brycon sp2 morphotypes. The poly-morphism found did not characterize different species. Similar results were obtained by NTS analysis. The sizes of the fragments obtained are within the standards found for other species of fish from the genus Brycon (Wasko et al., 2001). The data generated by the analysis of the mtDNA control region corroborate those found by the nuclear markers. The percentage of polymorphism detected in the D-loop sequences was low (around 5%) and within the limits found for populations of the same species (Prioli et al., 2002; Martins et al., 2003).
The Brycon sp1 and Brycon sp2 morphotypes differ only in relation to the coloration of the anal fin, which is confirmed by the presence of intermediate specimens. However, ac-cording to the results obtained in the present study, this polymorphism is only intraspecific, with the morphotypes belonging to the same species, that is, within Brycon cf. pesu.
The hydrographic basins of the Neotropical region have the greatest fish biodiversity in the world. They are also characterized by a great diversity of habitats, where species have adapted to exploit every type of environment. However, during the process of evolution, new ad-aptations can emerge through mutations in their genetic make up. Those that offer advantages to individuals are selected and, through reproduction, passed to following generations, generating uncertainties with regard to taxonomy. Morphological variability in fish can emerge in various parts of the body as a response to diverse factors, such as buccal adaptations related to feeding habits (Oliveira, 2005; Ruehl and DeWitt, 2005) and variations in the caudal fin as a function of the flow of the water (Imre et al., 2002), which also affects swimming behavior and performance and locomotor activities (Plaut, 2000). In addition, variations can occur as a result of reproduc-tive isolation (Pakkasmaa and Piironen, 2001; Sell and Spirkovski, 2004; van Herwerden and Doherty, 2006), mainly due to geographical barriers. According to the data obtained in the pres-ent study, gene flow between the Brycon sp1 and Brycon sp2 morphotypes has occurred, as a genetic pattern that was exclusive to only one group was not found. This, therefore, suggests that the morphotypes do not exist in reproductive isolation.
In addition to morphological adaptations to exploit different habitats and foods, some species of fish have distinct morphological characteristics related to reproduction. This type of polymorphism, known as sexual dimorphism, occurs mainly in males. They may be different from females with regard to body size, coloration and morphology of the fins (Kobelkowsky, 2004; Giacomello and Rasotto, 2005; Casatti et al., 2006).
Some fish color patterns are dependent on pigments, such as carotenoids. These are not synthesized by the animal, but obtained through its diet. Therefore, color patterns based on carotenoids may be indicators of the foraging ability and health of some species of fish. Fur-thermore, coloration is also related to the choice of males by females during mating (Evans and Norris, 1996; Grether, 2000; Grether et al., 2001) and appears to be affected by parasite infec-

104
©FUNPEC-RP www.funpecrp.com.brGenetics and Molecular Research 7 (1): 95-106 (2008)
R.S. Panarari-Antunes et al.
tions (Houde and Torio, 1992). In the case of the Brycon sp1 and Brycon sp2 morphotypes, no evidence has been found that the coloration of the anal fin is related to sexual dimorphism, as both the males and females have the two variations of color in the anal fin. Furthermore, these characteristics were also observed outside of the reproductive period, as the collections of the morphotypes showing the two types of fins were carried out throughout the whole year.
Fuller and Travis (2004) studied the expression of the color of the anal fin in the fresh-water fish Lucania goodei (Atheriniformes, Cyprinodontidae), which has populations in the Florida Peninsula, the southeast of Georgia and South Carolina. The males of this species have a polymorphism in the coloration of the anal fin, producing yellow, red and blue colors, with the presence of intermediates. In experiments conducted in the laboratory, the authors arrived at the conclusion that the variation in colors is affected by genetics, the environment and an in-teraction between the two factors. The environment exerts an influence through conditions of luminosity; that is, the wavelengths that reach the different water depths. For example, males with blue anal fins are more abundant in waters with low UV and blue wavelength transmis-sion. On the other hand, males with red anal fins are more abundant in areas with high UV and blue wavelength transmition. Despite the fact that the polymorphism occurs only in males, it was found to be related to an autosomal locus. However, in some cases, the color pattern of the males may result from an inheritance restricted to sex (Houde, 1992), which would explain its absence in the females. The reddish color of the anal fin found in the Brycon sp2 morphotype and absent in Brycon sp1 may be explained by environmental conditions, such as luminosity, which in this case would affect the morphology of both males and females. Neverthless, to confirm this notion, it would be necessary to conduct controlled experiments in the laboratory, simulating the conditions that occur in the natural environment.
Determining the degree to which the variation in morphological characteristics is con-trolled by genetics or by the environment is fundamental to the understanding of adaptation. The results obtained using the nuclear and mitochondrial molecular markers used in this study do not provide evidence that the coloration of the anal fin of the Brycon sp1 and Brycon sp2 morphotypes is based on genetics. However, environmental factors could be exerting an in-fluence in the expression of such polymorphism. Due to the high genetic similarity observed between the Brycon sp1 and Brycon sp2 morphotypes, it is suggested that they be identified as a single species within Brycon cf. pesu. Furthermore, additional studies should be carried out to determine the factors that affect the coloration of the anal fin, and whether this morphologi-cal characteristic gives any advantage to the individuals that possess it.
ACKnowLedgMenTS
The authors are grateful to Dr. Flávio C.T. Lima for the information and suggestions he provided and to P. Grimshaw for revising the English manuscript. The authors would also like to thank CNPq and CAPES for financial support and Nupélia for logistic support.
ReFeRenCeS
Aboim MA, Menezes GM, Schlitt T and Rogers AD (2005). Genetic structure and history of populations of the deep-sea fish Helicolenus dactylopterus (Delaroche, 1809) inferred from mtDNA sequence analysis. Mol. Ecol. 14: 1343-1354.
Albert JS, Fernandes-Matioli FMC and Almeida-Toledo LF (1999). New species of Gymnotus (Gymnotiformes, Teleostei)
105
©FUNPEC-RP www.funpecrp.com.brGenetics and Molecular Research 7 (1): 95-106 (2008)
Molecular variability in Brycon cf. pesu
from Southeastern Brazil: towards the deconstruction of Gymnotus carapo. Copeia 2: 410-421.Avise JC (2004). Molecular markers, natural history, and evolution. 2nd edn. Sinauer Associates Inc., Sunderland.Casatti L, Carvalho FR, Veronezi JL and Lacerda DR (2006). Reproductive biology of the Neotropical superfetaceous
Pamphorichthys hollandi (Cyprinodontiformes: Poeciliidae). Ichthyol. Explor. Freshw. 17: 59-64.Cronin MA, Spearman WJ, Wilmot RL, Patton JC, et al. (1993). Mitochondrial DNA variation in chinook (Oncorhynchus
tshawytscha) and chum salmon (O. keta) detected by restriction enzyme analysis of polymerase chain reaction (PCR) products. Can. J. Fish. Aquat. Sci. 50: 708-715.
Evans MR and Norris K (1996). The importance of carotenoids in signaling during aggressive interactions between male firemouth cichlids (Cichlasoma meeki). Behav. Ecol. 7: 1-6.
Fernandes-Matioli FMC, Matioli SR and Almeida-Toledo LF (2000). Species diversity and geographic distribution of Gymnotus (Pisces: Gymnotiformes) by nuclear (GGAC)n microsatellite analysis. Genet. Mol. Biol. 23: 803-807.
Feulner PG, Kirschbaum F, Schugardt C, Ketmaier V, et al. (2006). Electrophysiological and molecular genetic evidence for sympatrically occuring cryptic species in African weakly electric fishes (Teleostei: Mormyridae: Campylomormyrus). Mol. Phylogenet. Evol. 39: 198-208.
Fuller RC and Travis J (2004). Genetics, lighting environment, and heritable responses to lighting environment affect male color morph expression in bluefin killifish, Lucania goodei. Evolution 58: 1086-1098.
Giacomello E and Rasotto MB (2005). Sexual dimorphism and male mating success in the tentacled blenny, Parablennius tentacularis (Teleostei: Blenniidae). Mar. Biol. 147: 1221-1228.
Grether GF (2000). Carotenoid limitation and mate preference evolution: a test of the indicator hypothesis in guppies (Poecilia reticulata). Evol. Int. J. Org. Evol. 54: 1712-1724.
Grether GF, Hudon J and Endler JA (2001). Carotenoid scarcity, synthetic pteridine pigments and the evolution of sexual coloration in guppies (Poecilia reticulata). Proc. Biol. Sci. 268: 1245-1253.
Gupta M, Chyi YS, Romero-Severson J and Owen JL (1994). Amplification of DNA markers from evolutionary diverse genomes using single primers of simple-sequence repeats. Theor. Appl. Genet. 89: 998-1006.
Houde AE (1992). Sex-linked heritability of a sexually selected character in a natural-population of Poecilia reticulata (Pisces, Poeciliidae) (guppies). Heredity 69: 229-235.
Houde AE and Torio AJ (1992). Effect of parasitic infection on male color pattern and female choice in guppies. Behav. Ecol. 3: 346-351.
Huff SW, Campbell D, Gustafson DL, Lydeard C, et al. (2004). Investigations into the phylogenetic relationships of the freshwater pear mussels (Bivalvia: Margaritiferidae) based on molecular data: Implications for their taxonomy and biogeography. J. Molluscan Stud. 70: 379-388.
Imre I, McLaughlin RL and Noakes DLG (2002). Phenotypic plasticity in brook charr: changes in caudal fin induced by water flow. J. Fish Biol. 61: 1171-1181.
Kang TW, Lee EH, Kim MS, Paik SG, et al. (2005). Molecular phylogeny and geography of Korean medaka fish (Oryzias latipes). Mol. Cells 20: 151-156.
Kobelkowsky A (2004). Sexual dimorphism of the flounder Bothus robinsi (Pisces: Bothidae). J. Morphol. 260: 165-171.
Kumar S, Tamura K and Nei M (2004). MEGA3: integrated software for molecular evolutionary genetics analysis and sequence alignment. Brief. Bioinform. 5: 150-163.
Lavoue S and Sullivan JP (2004). Simultaneous analysis of five molecular markers provides a well-supported phylogenetic hypothesis for the living bony-tongue fishes (Osteoglossomorpha: Teleostei). Mol. Phylogenet. Evol. 33: 171-185.
Lima FCT (2003). Subfamily Bryconinae (Characins, tetras). In: Checklist of the feshwater fishes of South and Central America (Reis RE, Kullander SO and Ferraris CJ Jr, eds.). EDIPUCRS, Porto Alegre.
Lima D, Freitas JEP, Araujo ME and Sole-Cava AM (2005). Genetic detection of cryptic species in the frillfin goby Bathygobius soporator. J. Exp. Mar. Biol. Ecol. 320: 211-223.
Lopes M, Murta AG and Cabral HN (2006). Discrimination of spinefish Macroramphosus species and boarfish Capros aper morphotypes through multivariate analysis of body shape. Helgoland Mar. Res. 60: 18-24.
Martins C and Galetti PM Jr (2001). Organization of 5S rDNA in species of the fish Leporinus: two different genomic locations are characterized by distinct nontranscribed spacers. Genome 44: 903-910.
Martins C, Wasko AP, Oliveira C and Foresti F (2003). Mitochondrial DNA variation in wild populations of Leporinus elongatus from the Paraná River basin. Genet. Mol. Biol. 26: 33-38.
Matioli SR and Passos-Bueno MRS (2001). Métodos baseados em PCR para análise de polimorfismos de ácidos nucléicos. In: Biologia molecular e evolução (Matioli SR, ed.). Holos, Ribeirão Preto, 153-161.
Meyer A, Kocher TD, Basasibwaki P and Wilson AC (1990). Monophyletic origin of Lake Victoria cichlid fishes suggested by mitochondrial DNA sequences. Nature 347: 550-553.
Monesi N, Jacobs-Lorena M and Paço-Larson ML (1998). The DNA puff gene BhC4-1 of Bradysia hygida is specifically
106
©FUNPEC-RP www.funpecrp.com.brGenetics and Molecular Research 7 (1): 95-106 (2008)
R.S. Panarari-Antunes et al.
transcribed in early prepupal salivary glands of Drosophila melanogaster. Chromosoma 107: 559-569.Oliveira CAM (2005). Sobre a validade do gênero Psalidodon Eigenmann, 1911 (Characiformes, Characidae), na bacia do
rio Iguaçu. Monografia de graduação, Universidade Estadual de Maringá, Maringá.Pakkasmaa S and Piironen J (2001). Morphological differentiation among local trout (Salmo trutta) populations. Biol. J.
Linn. Soc. 72: 231-239.Planquette P, Keith P and Le Bail PY (1996). Atlas des poissons d’eau douce de Guyane (tome 1). Collection du
Patrimoine Naturel. Vol. 22. IEGB-Muséum National d’Histoire Naturelle, Paris. http://www.fishbase.org/Summary/speciesSummary.php?ID=12373&genusname=Brycon&speciesname=pesu. Accessed March 9, 2007.
Plaut I (2000). Effects of fin size on swimming performance, swimming behaviour and routine activity of zebrafish Danio rerio. J. Exp. Biol. 203: 813-820.
Prioli SMAP, Prioli AJ, Julio HF Jr, Pavanelli CS, et al. (2002). Identification of Astyanax altiparanae (Teleostei, Characidae) in the Iguaçu River, Brazil, based on mitochondrial DNA and RAPD markers. Genet. Mol. Biol. 25: 421-430.
Robles F, de la Herrán R, Ludwig A, Rejón CR, et al. (2005). Genomic organization and evolution of the 5S ribosomal DNA in the ancient fish sturgeon. Genome 48: 18-28.
Ruehl C and DeWitt TJ (2005). Trophic plasticity and fine grained resource variation in populations of western mosquitofish, Gambusia affinis. Evol. Ecol. Res. 7: 801-819.
Sandoval-Castillo J, Rocha-Olivares A, Villavicencio-Garayzar C and Balart E (2004). Cryptic isolation of Gulf of California shovelnose guitarfish evidenced by mitochondrial DNA. Mar. Biol. 145: 983-988.
Schulz HK, Smietana P and Schulz R (2004). Assessment of DNA variations of the noble crayfish (Astacus astacus L.) in Germany and Poland using inter-simple sequence repeats (ISSRs). Bull. Fr. Pêche Piscic. 372-373: 387-399.
Sell J and Spirkovski Z (2004). Mitochondrial DNA differentiation between two forms of trout Salmo letnica, endemic to the Balkan Lake Ohrid, reflects their reproductive isolation. Mol. Ecol. 13: 3633-3644.
Sofia SH, Silva CRM, Galindo BA, Almeida FS, et al. (2006). Population genetic structure of Astyanax scabripinis (Teleostei, Characidae) from an urban stream. Hydrobiologia 553: 245-254.
Theodorakis CW, Lee KL, Adams SM and Law CB (2006). Evidence of altered gene flow, mutation rate, and genetic diversity in redbreast sunfish from a pulp-mill-contaminated river. Environ. Sci. Technol. 40: 377-386.
van Herwerden L and Doherty PJ (2006). Contrasting genetic structures across two hybrid zones of a tropical reef fish, Acanthochromis polyacanthus (Bleeker 1855). J. Evol. Biol. 19: 239-252.
Wasko AP, Martins C, Wright JM and Galetti PM Jr (2001). Molecular organization of 5S rDNA in fishes of the genus Brycon. Genome 44: 893-902.