molecular subtypes in glioblastoma multiforme: … · molecular subtypes in glioblastoma...
TRANSCRIPT

Molecular Subtypes in Glioblastoma Multiforme: Integrated Analysis Using Agilent GeneSpring and Mass Profiler Professional Multi-Omics Software
Application Note
AuthorsDurairaj Renu, Pritha Aggarwal, Sunil C. Cherukuri, and Pramila Tata
Strand Life Sciences Bangalore, India
Vadiraja Bhat, Carolina B. Livi, and Michael Rosenberg
Agilent Technologies Inc. Santa Clara, California
Mona Al-Gizawiy, Kathleen Schmainda, and Shama P. Mirza Medical College of Wisconsin Milwaukee, Wisconsin
AbstractAgilent GeneSpring and Mass Profiler Professional (MPP) software was used to perform integrated multi-omics analysis of mRNA expression, miRNA expression, protein expression, and copy number aberration (CNA) associated with glioblastoma multiforme (GBM), the most frequent and lethal of the central nervous system tumors. The genomic data was obtained from The Cancer Genome Atlas (TCGA) project. The molecular subtypes defined by TCGA for GBM were based on mRNA expression. We applied GeneSpring metadata analysis framework to explore the relationship between GBM subtypes and genomic CNA. A multi-omics correlation analysis was performed between mRNAs involved in neurogenesis and their validated miRNAs highlighting the molecular events in Proneural tumors that result in suppression of p53 signaling. Furthermore, a combined analysis of mRNA expression data from TCGA with an independent, label-free GBM proteomics study revealed core subset of 54 signature genes and proteins highlighting the integrated biology analysis power of GeneSpring/MPP software. The core genomics signature clearly differentiated the known tumor subtypes in TCGA cohort. Intriguingly, while TCGA categorization of the proteomics samples were not experimentally determined, the core proteomics signature separated this cohort in 2 or 3 groups, suggesting that different TCGA subtypes may be present.

2
downloaded from the TCGA portal. The mRNA, miRNA, and protein expression datasets were imported as a generic single-color expression experiment in GeneSpring 13.0 (http://genespring-support.com/).
Copy number aberrations were obtained from the sample-centric table (https://tcga-data.nci.nih.gov/docs/publications/gbm_2013/) generated by Brennan et al.8 The table provided gene-wise CNA for the samples in the TCGA cohort. CNA is characterized by the measured copy number (expressed as log2 ratio versus normal euploid genome), and by the extent of the change in the genome. Aberration thresholds determined by Brennan et al.8 were:
• Deletion (x ≤ –1)• Partial deletion (–1 < x ≤ –0.7)• Loss (x < –0.2)• Gain (0.2 ≤ x < 1)• Intermediate amplification
(1 ≤ x < 2)• Amplification (x ≥ 2)
Proteomics sample details Both GBM and epilepsy specimens were obtained from temporal, frontal, and occipital regions of the brain. GBM tumor tissue and epileptic brain tissue specimens were collected at the time of tissue resection and snap-frozen in liquid nitrogen within 30 minutes of removal. The samples were stored at –80 °C in the Brain and Spine Tissue Bank at the Medical College of Wisconsin (MCW) until used for sample analysis by mass spectrometry (MS).
A comprehensive analysis of 10 tumor tissue specimens of GBM and 10 epilepsy controls was performed using a high-throughput label-free quantification approach by MS. All the tissue samples were processed, and trypsin digestion was performed as described earlier9. The homogenized tumor tissue proteome was fractionated through SDS-PAGE. Internal DNA markers were added during PAGE to facilitate consistent gel-based fractionation. The in-gel tryptic digested
Highlights• The molecular subtypes of GBM
defined by TCGA study6 based on mRNA expression were extended to understand the relationship between the subtypes and the genomic copy number aberrations using a metadata analysis framework.
• Correlation analysis performed between mRNA and miRNA datasets from TCGA identified potential candidate miRNAs regulating the known Proneural signature genes OLIG2, NKX2-2, and SOX11. The molecular events in Proneural tumors leading to suppression of p53 signaling were highlighted.
• Analysis was performed on an independent discovery proteomics study of GBM and control (brain fragments from epilepsy surgery) subjects measured using a label-free proteomics approach. Sample-sample correlation and PCA analysis resulted in clear separation between control and tumor samples. In addition, the tumor samples were segregated into two to three subgroups.
• Combined analysis of mRNA expression data from TCGA study and proteomics data from the label-free study identified a subset of the GBM subtype signatures, which clearly differentiate the known subtypes in the larger TCGA cohort.
Dataset and MethodsTCGA sample detailsThe mRNA expression dataset was obtained from https://tcga-data.nci.nih.gov/docs/publications/gbm_exp/ in the form of unified expression values of 840 mRNA profiles for 173 GBM tumor samples from multiple array platforms. Expression data of 534 miRNAs studied using the Agilent 8 × 15K array was
IntroductionGliomas are the most frequent central nervous system (CNS) tumors in adult humans. Gliomas are classified into astrocytomas, oligodendrogliomas, and ependymomas based on histology. Astrocytomas represent two thirds of all diagnosed gliomas and are graded from I to IV according to the World Health Organization (WHO)1. GBM (WHO grade IV Astrocytoma) is the most frequent and lethal among these tumors, with an estimated global incidence rate of approximately 3–4 per 100,000 people per year (http://www.pubcan.org/cancer/4938/glioblastoma/epidemiology). Subjects with GBM have an overall median survival of only 15 months2,3.
The TCGA project has previously identified genetic changes in the DNA sequence and copy number, DNA methylation, gene expression, and physiological information for a set of GBM tumors4. The results generated great interest in compiling and characterizing changes in the genome, transcriptome, and proteome of human GBM tumors, so that aberrantly functioning molecular pathways and tumor subtypes could be identified. Phillips et al.5 and Verhaak et al.6, identified subtypes in primary GBM tumors by clustering mRNA expression datasets from TCGA. Phillips et al.5, categorized GBM into three subtypes: Proneural, Proliferative, and Mesenchymal. Verhaak et al.6 integrated mRNA profiles from multiple array platforms to define four expression-based subtypes called Proneural, Classical, Mesenchymal, and Neural. Noushmehr et al.7 profiled promoter DNA methylation alterations in GBM tumors to define a glioma-CpG island methylator phenotype (G-CIMP), which was preferentially enriched in the Proneural subtype.
In this study, the metadata and correlation analysis framework in GeneSpring/MPP multi-omics software were used to understand the molecular events associated with GBM subtypes.

3
Results and DiscussionmRNA expression-based molecular subtypes in GBMThe unified expression values of 840 mRNA profiles for 173 GBM samples are shown in Figure 1A. As expected, the hierarchical clustering analysis revealed the four predominant clusters that coincide with the GBM subtypes. Additionally, the clustering on entities resulted in nine clusters, defined by their expression characteristics in the GBM subtype (Figure 1A); see miRNA section for discussion.
To exclude the possibility that the observed tumor subtyping was due to batch effects, sample quality control parameters such as batch, sample purity (% tumor nuclei), and sample quality (% necrosis) were visually correlated with the samples using the metadata framework in GeneSpring. Figure 1B summarizes the sample quality parameters, aligned against the cluster tree for the 173 GBM samples, as a heat map.
The GeneSpring correlation analysis framework supports correlation between molecules studied by a single -omics platform or between two different -omics platforms. It also supports correlation on samples measured using a single -omics technology. In this study, all sample and entity correlation analysis was performed using the Pearson similarity metric.
Correlation was performed between mRNA profiles and miRNA profiles for GBM using 159 GBM samples for which both mRNA and miRNA measurements were available. The targeting miRNA for genes involved in neurogenesis were identified by querying the miRWalk database (http://www.umm.uni-heidelberg.de/apps/zmf/mirwalk/).
peptides were analyzed in triplicate in data-dependent mode using an Agilent HPLC-Chip/MS system interfaced to an Agilent 6550 iFunnel Q-TOF MS. The Q-TOF data was first processed by Agilent Spectrum Mill Software against the UniProt human database, and search results were auto-validated at 1 % FDR. Spectrum Mill has the unique ability to export protein abundances from database search results to the MPP module of GeneSpring software for statistical analysis.
Data analysisAll analyses reported in this study were performed using GeneSpring/MPP 13.0 multi-omic bioinformatics software. GBM subtypes were recreated by hierarchical clustering of the 840 mRNA profiles using Euclidean Distance metric and Ward's Linkage rule. Genomic aberration information, that is, copy number values and other sample parameters obtained from TCGA were imported as metadata in GeneSpring. The GeneSpring metadata framework was used to assess batch effects and sample quality parameters commonly known to interfere with gene expression analysis. The metadata framework was also used to visually correlate the expression subtypes with copy number events.
Principal Component Analysis (PCA) was used to confirm the GBM subtypes from TCGA sample data, and to identify sample groups in the proteomics study. The data was mean-centered and scaled prior to performing the PCA.
Gene ontology (GO) analysis was performed based on the GO terms provided by the GO Consortium (http://geneontology.org). The clusters obtained from hierarchical clustering were translated into an Agilent whole genome array experiment in GeneSpring to identify significant GO terms. Hypergeometric distribution was used to identify the GO terms enriched in the clusters with respect to all known annotated genes.
DOW
N Cl
assi
cal
UP N
eura
l
UP P
rone
ural
DOW
N M
esen
chym
al
UP C
lass
ical
UP C
lass
ical
DOW
N Ne
ural
DOW
N Pr
oneu
ral
Sam
ple
qual
ity p
aram
eter
sSu
btyp
eBa
tch
info
Gend
er%
Nec
rosi
s%
Nuc
lei
UP
Mes
ench
ymal
A
ClassicalMesenchymalNeuralProneural
Batch 1Batch 2Batch 3
Batch 4 Batch 7GenderBatch infoSubtype -7 0 7
FemaleMaleBatch 5
Batch 6
B
% Necrosis
0 10 40% Tumor nuclei
10 100
Figure 1. A) Molecular subtypes in GBM defined by Verhaak et al.6 validated in Agilent GeneSpring. The entities could be grouped into nine different clusters. B) Sample quality metadata visualized as a heat map.

4
Batch effects are a notorious problem in high-throughput experiments; in some cases they can mask biological phenomena. We did not observe batch effects or gender bias in the GBM samples. There is also no concordance between sample purity and the molecular subtypes defined for GBM. The metadata analysis confirms that the molecular subtypes defined for GBM based on mRNA expression are truly biological in nature and are not caused by experimental artifacts, which are commonly observed in genomic analysis.
Pearson correlation analysis performed on the 173 GBM samples, using the same mRNA expression profiles, confirmed the subtypes observed in the clustering analysis. The sample correlation analysis indicates the similarity in the expression of samples within a group and condition if it exists between the sample groups. As shown in Figure 2A, most samples within the same subtype were positively correlated to each other, indicating the similarity in their expression profiles. The inter-sample variability was found
Proneural
Neural
Mesenchymal
Classical
-1 0 1
PC2BA
PC3
PC1
ClassicalMesenchymal
NeuralProneural
Figure 2. Presence of four subtypes in the TCGA cohort confirmed by using sample-sample correlation and PCAs of 173 GBM samples in Agilent GeneSpring (A) Pearson correlation between GBM samples and (B) PCA.
to be minimal for Proneural (Figure 1A and Figure 2). The Proneural subtype is known to mimic the expression of a differentiated neuron and has a low rate of proliferation5. This could explain the observation that Proneural samples cluster more tightly compared to other subtypes. Proneural tumors are also known to be less proliferative than Mesenchymal and Classical subtypes. Consistent with this fact, we observed that almost all of the Proneural samples are negatively correlated to Mesenchymal and Classical samples, indicating the striking contrast in their expression profiles. The largest sample-sample variability was observed in the Neural subtype.
PCA performed based on the 840 mRNA profiles further confirmed the presence of GBM subtypes. The scores plot for the PCA is shown in Figure 2B. In PCA, principle component 1 (PC1) is the Eigen vector that captures the primary variation in the dataset. In our analysis, though the sample groups are separated by PC1, maximum variation across PC1
is observed between the Proneural and Mesenchymal tumors. PC2 captured the variation between the Classical and Neural sample groups.
Copy number events correlated with molecular subtypes in GBMTo gain insights into the genomic events differentiating the expression subtypes, we examined their relationship with genomic CNA. Figure 3A provides the copy number amplification and deletion of EGFR, CDKN2A, PDGFRA, TP53, NF1, PTEN, and FGFR2 genes as a heat map along with the subtype heat map. Ordering the samples by their molecular subtype reveals certain interesting relationships. For example, the GBM samples of Classical subtype do not harbor any copy number changes in TP53 or NF1. Instead, deletion of CDKN2A and amplification of EGFR is more prominent in the Classical subtype. These findings confirm observations reported by Verhaak et al.6

5
GeneSpring metadata framework reveals other notable events occurring in GBM subtypes:
• EGFR and CDKN2A mutations are the most common, occurring in a large number of GBM subjects. While more prominent in Classical, these mutations are not confined to any one subtype, but are present across all subtypes (Figure 3A).
• TP53 deletion is conspicuously absent in the Classical subtype and is observed predominantly in the Proneural subtype, as reported.
• High level amplification of PDGFRA has been reported to be mostly restricted to Proneural6, but we also observe that intermediate levels of amplification of PDGFRA are not restricted to any single subtype (data not shown, can be observed by sorting on PDGFRA heat map).
-7 0 7
-2 0 2
ClassicalSubtype
Sorted by
Copy number aberration
Copy
num
ber a
berra
tion
-2 0 2
Copy number aberration
B C
A
MesenchymalNeuralProneural
ClassicalSubtype
MesenchymalNeuralProneural
MethylatedUnmethylatedNA
ClassicalSubtype
Subt
ype
EGFR
Subt
ype
MGM
T st
atusMGMT status
CDKN
2APD
GFRA
TP53 NF1
PTEN
FGFR
2
Subt
ype
EGFR
CDKN
2APD
GFRA
TP53 NF1
PTEN
FGFR
2
Subt
ype
EGFR
CDKN
2APD
GFRA
TP53 NF1
PTEN
FGFR
2
MesenchymalNeuralProneural Sorted by
-7 0 7
Sorted by
Figure 3. A) Copy number aberrations of some of the key genes- EGFR, CDKN2A, PDGFRA, TP53, NF1, PTEN, and FGFR2 in relation to the GBM samples sorted by their molecular subtypes. B) Genomic copy number aberrations sorted based on NF1 and FGFR2, respectively, as indicated by the arrow (C) GBM samples sorted based on their MGMT gene methylation status. Note the total loss of clustering pattern observed in Figure 3A.
Sorting the heat map by copy number values of the key marker genes can further clarify their distribution between GBM subtypes. It is evident from Figure 3B, (heat map sorted on NF1)
that, in addition to Classical and Neural, Proneural tumors also typically do not have NF1 mutations. Instead, as reported by Verhaak et al.6, NF1 hemizygous deletion is a distinct characteristic of the Mesenchymal subtype.
6
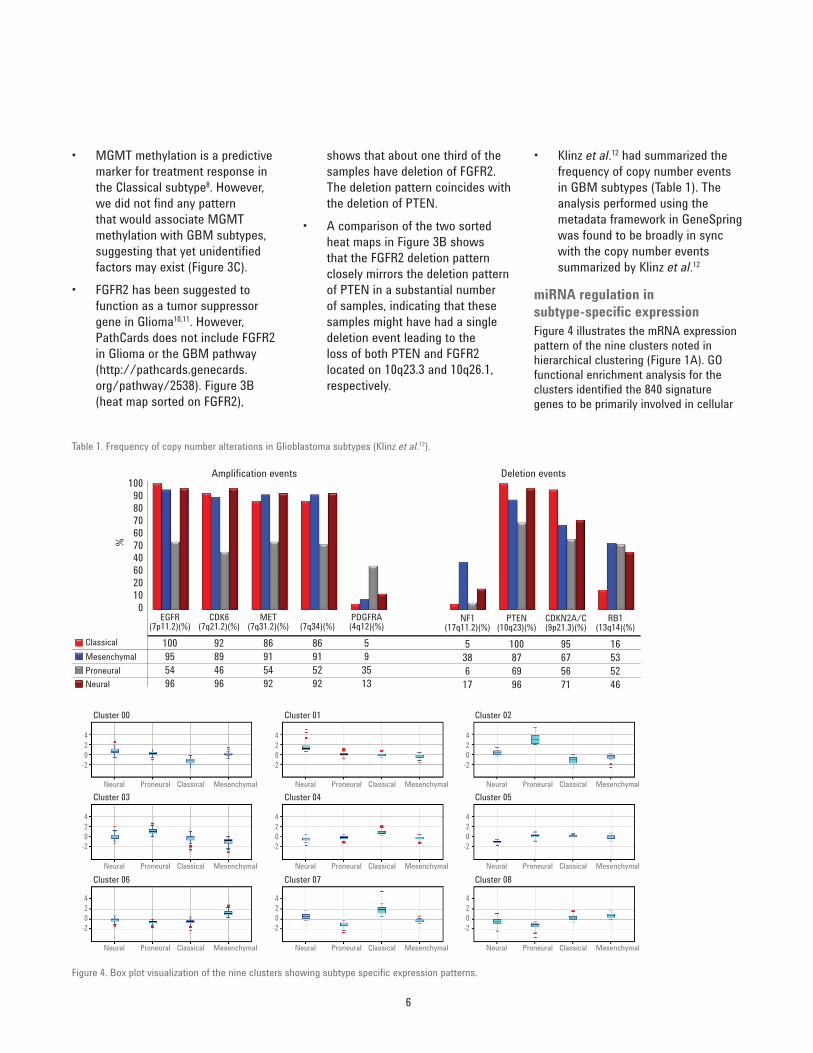
• Klinz et al.12 had summarized the frequency of copy number events in GBM subtypes (Table 1). The analysis performed using the metadata framework in GeneSpring was found to be broadly in sync with the copy number events summarized by Klinz et al.12
miRNA regulation in subtype-specific expressionFigure 4 illustrates the mRNA expression pattern of the nine clusters noted in hierarchical clustering (Figure 1A). GO functional enrichment analysis for the clusters identified the 840 signature genes to be primarily involved in cellular
shows that about one third of the samples have deletion of FGFR2. The deletion pattern coincides with the deletion of PTEN.
• A comparison of the two sorted heat maps in Figure 3B shows that the FGFR2 deletion pattern closely mirrors the deletion pattern of PTEN in a substantial number of samples, indicating that these samples might have had a single deletion event leading to the loss of both PTEN and FGFR2 located on 10q23.3 and 10q26.1, respectively.
• MGMT methylation is a predictive marker for treatment response in the Classical subtype8. However, we did not find any pattern that would associate MGMT methylation with GBM subtypes, suggesting that yet unidentified factors may exist (Figure 3C).
• FGFR2 has been suggested to function as a tumor suppressor gene in Glioma10,11. However, PathCards does not include FGFR2 in Glioma or the GBM pathway (http://pathcards.genecards.org/pathway/2538). Figure 3B (heat map sorted on FGFR2),
Cluster 00
Neural
420
-2
420
-2
420
-2
420
-2
420
-2
420
-2
420
-2
420
-2
420
-2
Proneural Classical Mesenchymal
Neural Proneural Classical Mesenchymal
Neural Proneural Classical Mesenchymal
Neural Proneural Classical Mesenchymal
Neural Proneural Classical Mesenchymal
Neural Proneural Classical Mesenchymal
Neural Proneural Classical Mesenchymal
Neural Proneural Classical Mesenchymal
Neural Proneural Classical Mesenchymal
Cluster 03
Cluster 06
Cluster 01
Cluster 04
Cluster 07
Cluster 02
Cluster 05
Cluster 08
Figure 4. Box plot visualization of the nine clusters showing subtype specific expression patterns.
Table 1. Frequency of copy number alterations in Glioblastoma subtypes (Klinz et al.12).
Amplification events Deletion events100
100955496
92894696
86915492
86915292
5
EGFR(7p11.2)(%)
CDK6(7q21.2)(%)
MET(7q31.2)(%) (7q34)(%)
PDGFRA(4q12)(%)
93513
538617
100876996
95675671
16
NF1(17q11.2)(%)
PTEN(10q23)(%)
CDKN2A/C(9p21.3)(%)
RB1(13q14)(%)
535246
90
%
80706070406020100
ClassicalMesenchymalProneuralNeural

7
physiology events such as extracellular matrix organization, response to wound healing, response to stress, nervous system development, glial cell differentiation, actin cytoskeleton organization, and chromatin organization. Additional analysis performed in GeneSpring confirmed that there is no significant overlap between the genes known to participate in pathways implicated for GBM (such as RTK, AKT, RB, P53, and PI3K) and the gene signature that defines the molecular subtypes (data not shown).
GO analysis identified nervous system development (that is, neurogenesis) as the primary biological process enriched in the cluster of genes that were up-regulated in Proneural and down-regulated in Mesenchymal tumors (Figure 1A). Twenty-five genes in the cluster were functionally annotated to be involved in nervous system development (Figure 5). We selected these 25 genes as representative Proneural genes. Selected genes included previously reported Proneural signature genes OLIG2, NKX2-2, SOX11, and ASCL15,6.
MicroRNAs contribute to tumorigenesis by modulating both on oncogenic and tumor suppressor pathways in Glioma13,14. We identified the miRNAs which have been reported to be targeting genes involved in nervous system development, by querying the miRWalk database15; miRNAs tagged as validated in the miRWalk database were considered for downstream analysis.
Pearson pair-wise correlation, for all subtypes, was performed between the 25 mRNAs involved in nervous system development and the 38 validated miRNAs, using the multi-omic correlation analysis framework in GeneSpring. A group of 159 GBM samples from TCGA for which both mRNA and miRNA measurements were available were used for the analysis. Of the 38 miRNAs that had significant differential expression (moderated t-test p ≤ 0.05) between the Proneural and Mesenchymal subtypes, miR-222, miR-221, miR-223, miR-34a,
Mesenchymal Proneural
Condition
PAFAH1B3ZEB2NKX2-2MTSS1CRMP1MYT1SOX11DBN1DPYSL4TNRC4CDK5R1STMN1EPHB1VAX2NRXN1RUFY3NRXN2MAPTOLIG2CSPG5ASCL1CKBBEX1MPPED2SH3GL2
Subtype
Mesenchymal
Proneural
-4.5 0 4.5
Figure 5. GO analysis of the genes up-regulated in Proneural and down-regulated in Mesenchymal tumors, against the entire set of genes, identified 25 genes that are involved in nervous system development.
miR-29a, miR-27a, miR-155, and miR-21 displayed negative correlation to the 25 mRNAs (Figure 6). The miRNAs up-regulated in Mesenchymal subtype by 1.5 fold in comparison to Proneural are significantly enriched in the cluster that displayed negative correlation to the genes in nervous system development. In Figure 6, the enriched miRNAs are highlighted by red bars. Most of the miRNA-mRNA pairs in this cluster had negative correlation values in the range of –0.3 to –0.5.
To further understand the mRNA-miRNA regulatory component within a given GBM subtype, we selected the miRNAs that displayed negative correlation in Figure 6, and four reported Proneural markers OLIG2, NKX2-2, SOX11, and ASCL1. The correlation of the selected mRNAs and miRNAs was performed based on their expression similarity within the Proneural and Mesenchymal samples, respectively. The results of the correlation performed are shown in Figure 7 and Table 2.

8
NKX2-2
A B
SOX11
hsa-
miR
-155
hsa-
miR
-27a
hsa-
miR
-29a
hsa-
miR
-34a
hsa-
miR
-223
hsa-
miR
-221
hsa-
miR
-222
hsa-
miR
-21
hsa-
miR
-214
hsa-
miR
-31
OLIG2
ASCL1
NKX2-2
SOX11
hsa-
miR
-155
hsa-
miR
-27a
hsa-
miR
-29a
hsa-
miR
-34a
hsa-
miR
-223
hsa-
miR
-221
hsa-
miR
-222
hsa-
miR
-21
hsa-
miR
-214
hsa-
miR
-31
OLIG2
ASCL1
Figure 7. Correlation of OLIG2, NKX2-2, SOX11, and ASCL1 with miRNAs that showed up-regulation in Mesenchymal tumors. Correlation in Proneural samples (A) and Mesenchymal samples (B).
Table 2. Observed correlation coefficients between the Proneural markers NKX2-2, SOX11, and OLIG2 and some of the miRNAs down-regulated in proneural samples.
OLIG2 NKX2-2 SOX11 Proneural Mesenchymal Proneural Mesenchymal Proneural Mesenchymalhsa-miR-21 –0.278 –0.036 0.18 –0.272 0.168 –0.322hsa-miR-214 0.193 –0.238 0.218 –0.106 0.2 –0.014hsa-miR-221 –0.124 0.12 0.139 –0.17 0.36 –0.34hsa-miR-222 –0.112 0.078 0.155 –0.113 0.276 –0.31hsa-miR-223 –0.149 –0.236 –0.162 –0.178 –0.127 –0.23hsa-miR-27a –0.175 0.072 –0.007 –0.208 –0.145 –0.317hsa-miR-29a –0.12 0.18 –0.093 –0.216 –0.267 –0.41hsa-miR-31 –0.113 –0.195 0.101 –0.126 0.067 –0.239hsa-miR-34a –0.312 0.177 –0.024 –0.069 0.091 –0.288
Figure 6. Pearson pair-wise correlation between the 25 genes involved in nervous system development and 38 miRNAs that had significant differential expression (moderated t-test p ≤ 0.05) between the Proneural and Mesenchymal subtypes. Expanded view shows the second quadrant with miRNA on x-axis and mRNAs on y-axis. Similarity is calculated based on the profile of the mRNAs and miRNAs across the four subtypes.
PAFAH1B
ZEB2
NKX2-2MTSS1
CRMP1MYT1
SOX11
hsa-
miR
-155
hsa-
miR
-27a
hsa-
miR
-29a
hsa-
miR
-34a
hsa-
miR
-223
hsa-
miR
-221
hsa-
miR
-222
hsa-
miR
-29c
hsa-
miR
-185
hsa-
miR
-184
hsa-
miR
-452
hsa-
miR
-10a
hsa-
miR
-143
hsa-
miR
-145
hsa-
miR
-31
hsa-
miR
-202
hsa-
miR
-205
hsa-
miR
-21
hsa-
miR
-187
hsa-
miR
-214
hsa-
miR
-23b
hsa-
miR
-27b
hsa-
let-7
ahs
a-m
iR-9
6hs
a-m
iR-1
82hs
a-m
iR-1
83hs
a-m
iR-9
hsa-
miR
-9*
hsa-
miR
-138
hsa-
miR
-153
hsa-
miR
-504
hsa-
miR
-181
ahs
a-m
iR-1
81a*
hsa-
miR
-19a
hsa-
miR
-93
hsa-
miR
-19b
hsa-
miR
-106
ahs
a-m
iR-2
0a
DBN1
DPYSL4
TNRC4CDK5R1
STMN1
EPHB1
VAX2
NRXN1RUFY3
NRXN2
MAPT
OLIG2
CSPG5
ASCL1CKB
BEX1
MPPED2SH3GL2
-0.7 0 1

9
miR-21, known to induce proliferation and invasiveness16, is positively correlated to transcriptional activators NKX2-2 and SOX11 in Proneural samples but displayed negative correlation in Mesenchymal samples. Literature on targets for miR-2117, and our query in the miRWalk database do not show NKX2-2 and SOX11 as targets for miR-21. Our study indicates the possibility of potential regulation of NKX2-2 and SOX11 by miR-21 in GBM tumors.
The oligodendrocytic development regulator OLIG2 displayed negative correlation to miR-34a, miR-21, and miR-155 in the Proneural samples, but either positive or no correlation in the Mesenchymal samples. Earlier reports identified TP53 mutations and LOH events as characteristic to Proneural subtype. Here we observed increased expression of oligodendrocytic development regulator OLIG2 and decreased expression of miR-34a in the Proneural cohort (Figure 8). OLIG2 plays a central role in directing cell fate decisions and controlling cell proliferation and it has been reported to repress the p53 tumor-suppressor pathway effector p2118. miR-34a is a tumor suppressor regulating the p53 signaling pathway19,20. This suggests the possibility that functional loss of TP53 in Proneural samples is caused either by deletion of the gene or by its repression due to elevated levels of OLIG2 and decreased levels of miR-34a.
Figure 8. Box plot representation of (A) OLIG2 and (B) miR-34a expression in Proneural and Mesenchymal samples.
Mesenchymal
Norm
alize
d in
tens
ity va
lue
3
2
1
0
-1
-2
Proneural
A B
Mesenchymal
Norm
alize
d in
tens
ity va
lue
12
Proneural
11
10
9
8
7
Proteomics analysismRNA expression does not always translate directly to protein abundance levels. To validate genomic observations in GBM at the protein level, we generated an independent proteomics dataset. The motivation was to identify GBM signatures relevant at both RNA and protein levels, and to confirm TCGA observations in an independent cohort using an independent technology.
Label-free proteomics analysisInitial profiling analysis was performed in MPP software on a label-free proteomic dataset for 10 GBM tumors and 10 controls (epileptic brain tissue) samples. The protein database search results identified a total of 14,187 unique protein groups across the entire data set.
Expression profiling showed that one of the tumor samples was close to the control group samples, and therefore, that tumor sample was excluded from subsequent analysis (data not shown).
Statistical analysis of the nine GBM and 10 control samples identified 587 differentially expressed proteins (T-test, corrected p-value ≤ 0.05 and FC ≥ 2.0). These 587 proteins clearly discriminated the tumor from control samples. This was confirmed by the sample-sample correlation and PCA analysis (Figure 9A and 9B). The PCA and correlation analysis reflected clear differences between the protein expression profile of the control and tumor samples. Our analysis also identified potential patterns of tumor subgroups within the limited number of tumor samples which were studied.
A
2-T 8-T 9-T 6-T 10-T
7-T 1-T 3-T 4-T 9-E
8-E
2-E
6-E
10-E
5-E
1-E
7-E
3-E
4-E
2-T8-T9-T6-T
10-T7-T1-T3-T4-T9-E8-E2-E6-E
10-E5-E1-E7-E3-E4-E -0.2 0.5 1
B
-40 -20 0 20 40
-20
-10
0
10
20
Com
pone
nt 2
(9.06
%)
Component 1 (54.4 %)
Control
Tumor-3Tumor-2Tumor-1
Figure 9. Separation between control (-E) and tumor (-T) samples based on 587 proteins differentially expressed between control and tumor samples. A) Sample-sample correlation; B) PCA.

10
2-T
8-T
9-T
6-T
10-T
7-T
1-T
3-T
4-T
25.6
Age
48 62.4
0
Survival (days)
576
Grou
pAg
eSe
x
MGM
TSu
rviva
l
Loca
tion
None
Left frontalLocation
Left temporalRight occipetal
Right frontalRight media parietal
Right temporal
Right parietalRight temporal
Tumor-2Tumor-3
ControlGroup
Tumor-1Female
Sex
Male MethylatedUnmethylated
NoneMGMT
-8.2 0 8.2
Figure 10. Sample groups observed by clustering of tumor samples aligned to sample metadata: age, sex, survival in days, MGMT gene methylation status, and brain location.
Figure 11. Venn diagram displays the overlap between 587 proteins from discovery differential analysis and 840 subtype specific genes from TCGA; 655 of the 840 genes were measured in the proteomics experiment.
587 proteins differentially expressed from profiling analysis. T-test p-value ~ 0.05 and FC ¡ 2.0
655 of the 840 subtype-specific genes from TCGA measured in proteomics experiment
533 54 601
The GeneSpring metadata framework was used to verify if the observed subgroup pattern can be explained by available metadata for the tumor samples. Figure 10 shows observed tumor subgroups aligned to sample metadata such as age, sex, tumor location, and methylation status of MGMT (known prognostic marker for GBM). The metadata did not clearly explain the sub-grouping observed within the tumors based on the differentially expressed proteins.
Combined analysis of proteomics and gene expressionTo explain the subgroups observed within GBM tumors, we conducted integrated analysis of the differentially expressed proteins identified in our proteomics study and the differentially expressed genes identified by TCGA. The intersection between the 587 differentially expressed proteins (see previous section) and the 840 subtype-specific genes reported by Verhaak et al.6 contains 54 genes and the 54 proteins they encode (Figure 11). Using these 54 molecules, we were able to confirm some of the key findings of both studies.
In the previous section, we described separation between tumor and normal samples and identification of the tumor subgroups based on the abundance of the 587 differentially expressed proteins. Figures 12A and 12B show the sample-sample correlation heat map and PCA plot based on abundance of the 54 proteins. The same separation between tumor and normal samples as well as the tumor subgroups are clearly visible in these figures.

11
To validate if the subgroups observed in this proteomics study are related to the molecular subtypes reported in GBM, genes corresponding to the 54 proteins were clustered based on TCGA mRNA expression data. Figure 13 shows a gene-sample clustering analysis performed on the mRNA expression profiles of the 54 genes. Figure 13 confirms that expression of the 54 genes classify GBM tumors into four reported molecular subtypes with a high degree of certainty.
ConclusionsGeneSpring/MPP software offers a suite of powerful data analysis tools enabling a thorough investigation of complex biological datasets. In this case study, we performed multidimensional analysis of GBM tumors leveraging published and newly generated genomics and proteomics datasets. Using innovative metadata and correlation frameworks now available in GeneSpring/MPP software, we reproduced and expanded key findings of a large-scale TCGA study. For example, in a single GeneSpring experiment we were able to confirm the genomics subtype classification of GBM tumors reported by TCGA. Furthermore, while somatic deletions of key genes in GBM were reported by TCGA, GeneSpring metadata framework revealed a higher than expected rate of simultaneous deletions of FGFR2 and PTEN in the same samples. This important finding suggests that these two genes may become aberrant due to a single genomic rearrangement rather than two independent deletion events.
Comparing data from several -omics technologies revealed previously unknown information about the biology of GBM tumors. For example, the TCGA project identified 840 genes capable of classifying GBM tumors in four known subtypes. Our proteomics data identified 587 proteins which were differentially expressed in tumor versus normal tissues and indicated an ability to classify tumors based only on their protein expression. By comparing genomics and proteomics datasets in the GeneSpring/MPP correlation framework, we identified a core signature comprised
A
B
-10-15 -5 0 5 10 15-8
-6
-4
-2
0
2
4
6
8
2-T 8-T 9-T6-T 10-T
7-T 1-T3-T 4-T9-E
8-E
2-E
6-E
10-E
5-E
1-E
7-E
3-E
4-E
2-T
8-T9-T
6-T10-T
7-T1-T
3-T
4-T
9-E8-E
2-E6-E
10-E
5-E1-E
7-E3-E
4-ECo
mpo
nent
2 (1
0.1 %
)
Component 1 (62.38 %)
-0.2 0.5 1
Control
Tumor-3Tumor-2Tumor-1
Figure 12. Separation between control (-E) and tumor (-T) samples based on the 54 proteins identified using a translation of gene signatures from the TCGA mRNA expression experiment in Agilent GeneSpring. A) Sample-sample correlation; B) PCA.
ClassicalMesenchymal
NeuralProneural -7 0 7
Figure 13. Reported molecular subtypes in GBM established by clustering 173 TCGA tumor samples based on the expression of 54 mRNA signatures identified using the proteomics study.

www.agilent.com/chem
This information is subject to change without notice.
For Research Use Only. Not for use in diagnostic procedures.
PR7000-0097
© Agilent Technologies, Inc., 2016 Published in the USA, January 4, 2016 5991-5505EN
of only 54 genes and proteins. The core signature demonstrated classification power comparable to both the 840 genes and the 587 proteins, highlighting the power of multi-omics data analysis in GeneSpring. Our observation suggests that heterogeneity of GBM tumors may be best characterized by both mRNA and protein abundance of the signature genes, opening a possibility for follow-up studies with potential significance beyond the research scope.
AcknowledgementThe authors wish to thank members of the Human Toxome Mapping Consortium for sharing data, feedback, and helpful discussions during development of the Agilent GeneSpring metadata and correlation frameworks. MR was supported in part by NIH grant 1R01ES020750-01 “MAPPING THE HUMAN TOXOME BY SYSTEMS TOXICOLOGY” (PI T. Hartung). SPM was supported by the James C. Benjamin Fund for Brain Tumor Research, the Froedtert Foundation Grant, and the Advancing a Healthier Wisconsin - Clinical and Translational Science Institute Pilot Research Grant.
References1. Kleihues, P; Sobin, L..H; World Health
Organization classification of tumors. 2000, Volume 88, Issue 12, p 2887.
2. Brandes, A. A; et al. Temozolomide as a second-line systemic regimen in recurrent high-grade glioma: A phase II study. Ann. Oncol. 2001,12, pp 255-257.
3. Martinez, R; Rohde, V; Schackert, G. Different molecular patterns in glioblastoma multiforme subtypes upon recurrence. J. Neurooncol. 2010 96, pp 321-329.
4. Cancer Genome Atlas Research Network. Comprehensive genomic characterization defines human glioblastoma genes and core pathways. Nature 2008, 455, pp 1061-1068.
5. Phillips, H. S; et al. Molecular subclasses of high-grade glioma predict prognosis, delineate a pattern of disease progression, and resemble stages in neurogenesis. Cancer Cell 2006, 9, pp 157-173.
6. Verhaak, R. G; et al. Integrated genomic analysis identifies clinically relevant subtypes of glioblastoma characterized by abnormalities in PDGFRA, IDH1, EGFR, and NF1. Cancer Cell 2010, 17, pp 98-110.
7. Noushmehr, H; et al. Identification of a CpG island methylator phenotype that defines a distinct subgroup of glioma. Cancer Cell 2010, 17, pp 510–522.
8. Brennan, C. W; et al. The Somatic Genomic Landscape of Glioblastoma. Cell Oct 10 2013, 155(2), pp 462-77.
9. Heroux, M. S; et al. Comprehensive characterization of glioblastoma tumor tissues for biomarker identification using mass spectrometry-based label-free quantitative proteomics. Physiological Genomics 2014. 46, pp 467-481.
10. Toedt, G; et al. Molecular signatures classify astrocytic gliomas by IDH1 mutation status. Int. J. Cancer. 2011, 128(5), pp 1095-1103.
11. PhosphoSitePlus: http://www.phosphosite.org/proteinAction.do?id=1262&showAllSites=false
12. Klinz, F. J; et al. In Genetic Diversity of Glioblastoma Multiforme: Impact on Future Therapies, Glioma - Exploring Its Biology and Practical Relevance; Dr. Anirban Ghosh, Ed.; 2011; ISBN: 978-953-307-379-8.
13. Ventura, A; Jacks, T. MicroRNAs and cancer: short RNAs go a long way. Cell 2009, 136(4), pp 586–591.
14. Calin, G. A; Croce, C. M. MicroRNA signatures in human cancers. Nat. Rev. Cancer 2006, 6(11), pp 857-866.
15. Dweep, H; et al. miRWalk-database: prediction of possible miRNA binding sites by “walking” the genes of 3 genomes. Journal of Biomedical Informatics 2011, 44, pp 839-47.
16. Møller, H. G; et al. A Systematic Review of MicroRNA in Glioblastoma Multiforme: Micro-modulators in the Mesenchymal Mode of Migration and Invasion. Mol. Neurobiol. 2013, 47, pp 131-144.
17. Buscaglia, L. E; Li, Y. Apoptosis and the target genes of microRNA-21. Chin. J. Cancer. Jun 2011, 30(6), pp 371-380.
18. Ligon, K. L; et al. Olig2-regulated lineage-restricted pathway controls replication competence in neural stem cells and malignant glioma. Neuron 2007, 53, pp 503-517.
19. Hermeking, H. p53 Enters the MicroRNA World. 2007, Volume 12, Issue 5, pp 414-418.
20. Silber, J; et al. miR-34a repression in proneural malignant gliomas upregulates expression of its target PDGFRA and promotes tumorigenesis. PLoS One 2012, 7(3):e33844.