molecular science for drug development and biomedicine
TRANSCRIPT

Printed Edition of the Special Issue Published in IJMS
Molecular Science for Drug Development and Biomedicine
Edited by
Wei-Zhu Zhong and Shufeng Zhou
www.mdpi.com/journal/ijms

Wei-Zhu Zhong and Shufeng Zhou (Eds.)
Molecular Science for Drug Development
and Biomedicine

This book is a reprint of the special issue that appeared in the online open access journal
International Journal of Molecular Sciences (ISSN 1422-0067) in 2014 (available at:
http://www.mdpi.com/journal/ijms/special_issues/drug-develop).
Guest Editors
Wei-Zhu Zhong
Gordon Life Science Institute, Belmont, Massachusetts, USA
Shufeng Zhou
Department of Pharmaceutical Sciences, College of Pharmacy, University of South Florida,
Tampa, Florida, USA
Editorial Office
MDPI AG
Klybeckstrasse 64
Basel, Switzerland
Publisher
Shu-Kun Lin
Production Editor
Martyn Rittman
1. Edition 2014
MDPI • Basel • Beijing • Wuhan
ISBN 978-3-906980-83-6 (Hbk)
ISBN 978-3-906980-84-3 (PDF)
© 2014 by the authors; licensee MDPI, Basel, Switzerland. All articles in this volume are
Open Access distributed under the Creative Commons License (CC BY), which allows users
to download, copy and build upon published articles even for commercial purposes, as long as
the author and publisher are properly credited, which ensures maximum dissemination and a
wider impact of our publications. However, the dissemination and distribution of physical
copies of this book as a whole is restricted to MDPI, Basel, Switzerland.

I
The figure shown on the front cover illustrates the interactions between PLA2 and the peptide
Asp-Ala- Glu-Phe-Arg-His-Asp-Ser. Contributed by Zeenat Mirza, Vikram Gopalakrishna Pillai and
Wei-Zhu Zhong (Int.J.Mol.Sci., 2014, 15(3), 4221-4236).
Table of Contents
List of Contributors ..............................................................................................................IV
Preface .................................................................................................................................. X
1. Pseudo Amino Acid Composition and Pseudo Oligonucleotide
Composition
Pufeng Du, Shuwang Gu and Yasen Jiao
PseAAC-General: Fast Building Various Modes of General Form of Chou’s Pseudo-
Amino Acid Composition for Large-Scale Protein Datasets
Reprinted from: Int. J. Mol. Sci. 2014, 15(3), 3495-3506
http://www.mdpi.com/1422-0067/15/3/3495 .......................................................................... 1
Jian Zhang, Xiaowei Zhao, Pingping Sun and Zhiqiang Ma
PSNO: Predicting Cysteine S-Nitrosylation Sites by Incorporating Various Sequence-
Derived Features into the General Form of Chou’s PseAAC
Reprinted from: Int. J. Mol. Sci. 2014, 15(7), 11204-11219
http://www.mdpi.com/1422-0067/15/7/11204....................................................................... 12
Wang-Ren Qiu, Xuan Xiao and Kuo-Chen Chou
iRSpot-TNCPseAAC: Identify Recombination Spots with Trinucleotide Composition and
Pseudo Amino Acid Components
Reprinted from: Int. J. Mol. Sci. 2014, 15(2), 1746-1766
http://www.mdpi.com/1422-0067/15/2/1746 ........................................................................ 29
2. Structure-Based Drug Design
Zeenat Mirza, Vikram Gopalakrishna Pillai and Wei-Zhu Zhong
Structure of N-Terminal Sequence Asp-Ala-Glu-Phe-Arg-His-Asp-Ser of Aβ-Peptide with
Phospholipase A2 from Venom of Andaman Cobra Sub-Species Naja naja sagittifera at
2.0 Å Resolution
Reprinted from: Int. J. Mol. Sci. 2014, 15(3), 4221-4236
http://www.mdpi.com/1422-0067/15/3/4221 ........................................................................ 50
Mostafa M. Ghorab, Marwa G. El-Gazzar and Mansour S. Alsaid
Synthesis, Characterization and Anti-Breast Cancer Activity of New 4-Aminoantipyrine-
Based Heterocycles
Reprinted from: Int. J. Mol. Sci. 2014, 15(5), 7539-7553
http://www.mdpi.com/1422-0067/15/5/7539 ........................................................................ 67

II
Guanhong Xu, Yue Chen, Kun Shen, Xiuzhen Wang, Fei Li and Yan He
The Discovery of Potentially Selective Human Neuronal Nitric Oxide Synthase (nNOS)
Inhibitors: A Combination of Pharmacophore Modelling, CoMFA, Virtual Screening and
Molecular Docking Studies
Reprinted from: Int. J. Mol. Sci. 2014, 15(5), 8553-8569
http://www.mdpi.com/1422-0067/15/5/8553 ........................................................................ 82
Zhiqian Liu, Jianjun Fu, Lei Shan, Qingyan Sun and Weidong Zhang
Synthesis, Preliminary Bioevaluation and Computational Analysis of Caffeic Acid Analogues
Reprinted from: Int. J. Mol. Sci. 2014, 15(5), 8808-8820
http://www.mdpi.com/1422-0067/15/5/8808 ........................................................................ 99
Stefania-Felicia Barbuceanu, Diana Carolina Ilies, Gabriel Saramet,
Valentina Uivarosi, Constantin Draghici and Valeria Radulescu
Synthesis and Antioxidant Activity Evaluation of New Compounds from
Hydrazinecarbothioamide and 1,2,4-Triazole Class Containing Diarylsulfone and 2,4-
Difluorophenyl Moieties
Reprinted from: Int. J. Mol. Sci. 2014, 15(6), 10908-10925
http://www.mdpi.com/1422-0067/15/6/10908..................................................................... 112
3. In Vitro/In Vivo Pharmacological Models
Yan Huang, Yi Lu, Lei Zhang, Jia Yan, Jue Jiang and Hong Jiang
Perineural Dexmedetomidine Attenuates Inflammation in Rat Sciatic Nerve via the NF-κB
Pathway
Reprinted from: Int. J. Mol. Sci. 2014, 15(3), 4049-4059
http://www.mdpi.com/1422-0067/15/3/4049 ...................................................................... 129
You-Chang Oh, Yun Hee Jeong, Won-Kyung Cho, Min-Jung Gu and Jin Yeul Ma
Inhibitory Effects of Palmultang on Inflammatory Mediator Production Related to
Suppression of NF-κB and MAPK Pathways and Induction of HO-1 Expression in
Macrophages
Reprinted from: Int. J. Mol. Sci. 2014, 15(5), 8443-8457
http://www.mdpi.com/1422-0067/15/5/8443 ...................................................................... 140
Sunhyo Ryu, Peter I. Song, Chang Ho Seo, Hyeonsook Cheong and Yoonkyung Park
Colonization and Infection of the Skin by S. aureus: Immune System Evasion and the
Response to Cationic Antimicrobial Peptides
Reprinted from: Int. J. Mol. Sci. 2014, 15(5), 8753-8772
http://www.mdpi.com/1422-0067/15/5/8753 ...................................................................... 155
Xiaoran Yin, Jun Zhang, Xiaoning Li, Dong Liu, Cheng Feng, Rongrui Liang,
Kun Zhuang, Chenlei Cai, Xinghuan Xue, Fuchun Jing, Xijing Wang, Jun Wang,
Xinlian Liu and Hongbing Ma
DADS Suppresses Human Esophageal Xenograft Tumors through RAF/MEK/ERK and
Mitochondria-Dependent Pathways
Reprinted from: Int. J. Mol. Sci. 2014, 15(7), 12422-12441
http://www.mdpi.com/1422-0067/15/7/12422..................................................................... 175

III
Zhongyang Liu, Ronggang Xi, Zhiran Zhang, Wangping Li, Yan Liu, Faguang Jin and
Xiaobo Wang
4-Hydroxyphenylacetic Acid Attenuated Inflammation and Edema via Suppressing HIF-1α in
Seawater Aspiration-Induced Lung Injury in Rats
Reprinted from: Int. J. Mol. Sci. 2014, 15(7), 12861-12884
http://www.mdpi.com/1422-0067/15/7/12861..................................................................... 195
Manh Tin Ho, Hyun Sik Kang, Jung Sik Huh, Young Mee Kim, Yoongho Lim and
Moonjae Cho
Effects of the Novel Compound DK223 ([1E,2E-1,2-Bis(6-methoxy-2H-chromen-3-
yl)methylene]hydrazine) on Migration and Proliferation of Human Keratinocytes and
Primary Dermal Fibroblasts
Reprinted from: Int. J. Mol. Sci. 2014, 15(7), 13091-13110
http://www.mdpi.com/1422-0067/15/7/13091..................................................................... 219
4. Computational Model for Drug Development
Shao-Wu Zhang, Li-Yang Hao and Ting-He Zhang
Prediction of Protein–Protein Interaction with Pairwise Kernel Support Vector Machine
Reprinted from: Int. J. Mol. Sci. 2014, 15(2), 3220-3233
http://www.mdpi.com/1422-0067/15/2/3220 ...................................................................... 240
Yue-Nong Fan, Xuan Xiao, Jian-Liang Min and Kuo-Chen Chou
iNR-Drug: Predicting the Interaction of Drugs with Nuclear Receptors in Cellular
Networking
Reprinted from: Int. J. Mol. Sci. 2014, 15(3), 4915-4937
http://www.mdpi.com/1422-0067/15/3/4915 ...................................................................... 255
Shuang Zheng, Ming-Liang Chang, Jing Zhou, Jing-Wei Fu, Qing-Wei Zhang,
Shao-Yong Li, Wei Qiao and Jun-Min Liu
Qualitative Analysis of the Helical Electronic Energy of Inherently Chiral Calix[4]arenes:
An Approach to Effectively Assign Their Absolute Configuration
Reprinted from: Int. J. Mol. Sci. 2014, 15(6), 9844-9858
http://www.mdpi.com/1422-0067/15/6/9844 ...................................................................... 279
Bin Li, Min Xiong and Hong-Yu Zhang
Elucidating Polypharmacological Mechanisms of Polyphenols by Gene Module Profile
Analysis
Reprinted from: Int. J. Mol. Sci. 2014, 15(7), 11245-11254
http://www.mdpi.com/1422-0067/15/7/11245..................................................................... 294
Francisco J. Romero Durán, Nerea Alonso, Olga Caamaño, Xerardo García-Mera,
Matilde Yañez, Francisco J. Prado-Prado and Humberto González-Díaz
Prediction of Multi-Target Networks of Neuroprotective Compounds with Entropy
Indices and Synthesis, Assay, and Theoretical Study of New Asymmetric
1,2-Rasagiline Carbamates
Reprinted from: Int. J. Mol. Sci. 2014, 15(9), 17035-17064
http://www.mdpi.com/1422-0067/15/9/17035..................................................................... 305

IV
List of Contributors
Nerea Alonso: Department of Organic Chemistry, Faculty of Pharmacy, University of
Santiago de Compostela (USC), Santiago de Compostela 15782, Spain
Mansour S. Alsaid: Department of Pharmacognosy, College of Pharmacy, King Saud
University, P.O. Box 2457, Riyadh 11451, Saudi Arabia
Stefania-Felicia Barbuceanu: Organic Chemistry Department, Faculty of Pharmacy, “Carol
Davila” University of Medicine and Pharmacy, 6 Traian Vuia, 020956 Bucharest, Romania
Olga Caamaño: Department of Organic Chemistry, Faculty of Pharmacy, University of
Santiago de Compostela (USC), Santiago de Compostela 15782, Spain
Chenlei Cai: Department of Digestion, the Second Affiliated Hospital of Xi’an Jiaotong
University, Xi’an 710004, China
Ming-Liang Chang: Tianjin Key Laboratory on Technologies Enabling Development of
Clinical Therapeutics and Diagnostics (Theranostics), School of Pharmacy, Basic Medical
Research Center, Tianjin Medical University, Tianjin 300070, China
Yue Chen: School of Pharmacy, Nanjing Medical University, Nanjing 210029, China
Hyeonsook Cheong: Department of Biotechnology, Chosun University, Gwangju 501-759,
Korea
Moonjae Cho: Institute of Medical Science, Jeju National University, Jeju 690-756, Korea
Won-Kyung Cho: Korean Medicine (KM)-Based Herbal Drug Development Group, Korea
Institute of Oriental Medicine, 461-24, Jeonmin-dong, Yuseong, Daejeon 305-811, Korea
Kuo-Chen Chou: Center of Excellence in Genomic Medicine Research (CEGMR), King
Abdulaziz University, Jeddah 21589, Saudi Arabia; Gordon Life Science Institute, Belmont,
MA 02478, USA
Constantin Draghici: “C.D. Nenitescu” Institute of Organic Chemistry, Romanian Academy,
202B Splaiul Independenţei, 060023 Bucharest, Romania
Pufeng Du: School of Computer Science and Technology, Tianjin University, Tianjin
300072, China; Tianjin Key Laboratory of Cognitive Computing and Application, Tianjin
University, Tianjin 300072, China; Department of Computer Science, City University of
Hong Kong, Kowloon, Hong Kong.
Francisco J. Romero Durán: Department of Organic Chemistry, Faculty of Pharmacy,
University of Santiago de Compostela (USC), Santiago de Compostela 15782, Spain
Marwa G. El-Gazzar: Department of Drug Radiation Research, National Center for
Radiation Research and Technology, Nasr City, Cairo 113701, Egypt
Cheng Feng: Department of Digestion, the Second Affiliated Hospital of Xi’an Jiaotong
University, Xi’an 710004, China
Jianjun Fu: Shanghai Key Laboratory of New Drug Design, School of Pharmacy, East China
University of Science and Technology, 130 Mei Long Road, Shanghai 200237, China
V
Jing-Wei Fu: Tianjin Key Laboratory on Technologies Enabling Development of Clinical
Therapeutics and Diagnostics (Theranostics), School of Pharmacy, Basic Medical Research
Center, Tianjin Medical University, Tianjin 300070, China
Xerardo García-Mera: Department of Organic Chemistry, Faculty of Pharmacy, University
of Santiago de Compostela (USC), Santiago de Compostela 15782, Spain
Mostafa M. Ghorab: Department of Pharmacognosy, College of Pharmacy, King Saud
University, P.O. Box 2457, Riyadh 11451, Saudi Arabia
Humberto González-Díaz: Department of Organic Chemistry II, Faculty of Science and
Technology, University of the Basque Country UPV/EHU, Leioa 48940, Spain;
IKERBASQUE, Basque Foundation for Science, Bilbao 48011, Spain
Min-Jung Gu: Korean Medicine (KM)-Based Herbal Drug Development Group, Korea
Institute of Oriental Medicine, 461-24, Jeonmin-dong, Yuseong, Daejeon 305-811, Korea
Shuwang Gu: School of Computer Science and Technology, Tianjin University, Tianjin
300072, China; Tianjin Key Laboratory of Cognitive Computing and Application, Tianjin
University, Tianjin 300072, China
Li-Yang Hao: College of Automation, Northwestern Polytechnical University, Xi’an 710072,
China
Yan He: Department of Internal Neurology, Nanjing Children’s Hospital Affiliated to
Nanjing Medical University, Nanjing 210008, China
Manh Tin Ho: Department of Biochemistry, School of Medicine, Jeju National University,
Jeju 690-756, Korea
Yan Huang: Department of Anesthesiology, School of Medicine, Shanghai Ninth People’s
Hospital Affiliated to Shanghai Jiao Tong University, Shanghai 200011, China
Jung Sik Huh: School of Medicine, Jeju National University, Jeju 690-756, Korea
Diana Carolina Ilies: Organic Chemistry Department, Faculty of Pharmacy, “Carol Davila”
University of Medicine and Pharmacy, 6 Traian Vuia, 020956 Bucharest, Romania
Yun Hee Jeong: Korean Medicine (KM)-Based Herbal Drug Development Group, Korea
Institute of Oriental Medicine, 461-24, Jeonmin-dong, Yuseong, Daejeon 305-811, Korea
Hong Jiang: Department of Anesthesiology, School of Medicine, Shanghai Ninth People’s
Hospital Affiliated to Shanghai Jiao Tong University, Shanghai 200011, China
Jue Jiang: Department of Anesthesiology, School of Medicine, Shanghai Ninth People’s
Hospital Affiliated to Shanghai Jiao Tong University, Shanghai 200011, China
Yasen Jiao: School of Computer Science and Technology, Tianjin University, Tianjin
300072, China; Tianjin Key Laboratory of Cognitive Computing and Application, Tianjin
University, Tianjin 300072, China
Faguang Jin: Department of Respiration, Tangdu Hospital, Fourth Military Medical
University, Xi’an 710038, China
Fuchun Jing: Department of Digestive Diseases, Baoji People’s Hospital, Baoji 721000,
China
Hyun Sik Kang: Department of Pediatrics, School of Medicine, Jeju National University,
Jeju 690-756, Korea

VI
Young Mee Kim: Department of Biochemistry, School of Medicine, Jeju National
University, Jeju 690-756, Korea
Bin Li: National Key Laboratory of Crop Genetic Improvement, Agricultural Bioinformatics
Key Laboratory of Hubei Province, Huazhong Agricultural University, Wuhan 430070, China
Fei Li: School of Pharmacy, Nanjing Medical University, Nanjing 210029, China
Shao-Yong Li: Tianjin Key Laboratory on Technologies Enabling Development of Clinical
Therapeutics and Diagnostics (Theranostics), School of Pharmacy, Basic Medical Research
Center, Tianjin Medical University, Tianjin 300070, China
Wangping Li: Department of Pharmacological and Toxicological Research Centre, No. 210
Hospital of Chinese People’s Liberation Army, Dalian 116021, China
Xiaoning Li: Department of Oncology, the Second Affiliated Hospital of Xi’an Jiaotong
University, Xi’an 710004, China
Rongrui Liang: Department of Oncology, the First Affiliated Hospital of Soochow
University, No. 188, Shizi Street, Suzhou 215006, China
Yoongho Lim: Division of Bioscience and Biotechnology, Konkuk University, Seoul 143-
701, Korea
Dong Liu: Department of Digestion, the Second Affiliated Hospital of Xi’an Jiaotong
University, Xi’an 710004, China
Jun-Min Liu: MOE Laboratory of Bioinorganic and Synthetic Chemistry/KLGHEI of
Environment and Energy Chemistry, State Key Laboratory of Optoelectronic Materials and
Technologies, School of Chemistry and Chemical Engineering, Sun Yat-Sen University,
Guangzhou 510275, China
Xinlian Liu: Department of Oncology, the Second Affiliated Hospital of Xi’an Jiaotong
University, Xi’an 710004, China
Yan Liu: Department of Pharmacological and Toxicological Research Centre, No. 210
Hospital of Chinese People’s Liberation Army, Dalian 116021, China
Zhiqian Liu: Department of Phytochemistry, School of Pharmacy, School of Pharmacy,
Second Military Medical University, 325 Guo He Road, Shanghai 200433, China
Zhongyang Liu: Department of Pharmacological and Toxicological Research Centre, No.
210 Hospital of Chinese People’s Liberation Army, Dalian 116021, China; Department of
Respiration, Tangdu Hospital, Fourth Military Medical University, Xi’an 710038, China
Yi Lu: Department of Anesthesiology, School of Medicine, Shanghai Ninth People’s Hospital
Affiliated to Shanghai Jiao Tong University, Shanghai 200011, China
Hongbing Ma: Department of Oncology, the Second Affiliated Hospital of Xi’an Jiaotong
University, Xi’an 710004, China
Jin Yeul Ma: Korean Medicine (KM)-Based Herbal Drug Development Group, Korea
Institute of Oriental Medicine, 461-24, Jeonmin-dong, Yuseong, Daejeon 305-811, Korea
Zhiqiang Ma: School of Computer Science and Information Technology, Northeast Normal
University, Changchun 130017, China
Jian-Liang Min: Computer Department, Jing-De-Zhen Ceramic Institute, Jingdezhen
333046, Jiangxi, China

VII
Zeenat Mirza: Proteomics and Structural Biology Unit, Fundamental and Applied Biology
Group, King Fahd Medical Research Center, King Abdulaziz University, P.O. Box 80216,
Jeddah 21589, Saudi Arabia; Department of Biophysics, All India Institute of Medical
Sciences, New Delhi 110029, India
You-Chang Oh: Korean Medicine (KM)-Based Herbal Drug Development Group, Korea
Institute of Oriental Medicine, 461-24, Jeonmin-dong, Yuseong, Daejeon 305-811, Korea
Yoonkyung Park: Department of Biotechnology, Chosun University, Gwangju 501-759,
Korea
Vikram Gopalakrishna Pillai: Department of Biophysics, All India Institute of Medical
Sciences, New Delhi 110029, India; Children’s Hospital of Philadelphia, Philadelphia, PA
19104, USA
Francisco J. Prado-Prado: Department of Organic Chemistry, Faculty of Pharmacy,
University of Santiago de Compostela (USC), Santiago de Compostela 15782, Spain;
Biomedical Sciences Department, Health Sciences Division, University of Quintana Roo
(UQROO), Chetumal 77039, Mexico
Wei Qiao: Tianjin Key Laboratory on Technologies Enabling Development of Clinical
Therapeutics and Diagnostics (Theranostics), School of Pharmacy, Basic Medical Research
Center, Tianjin Medical University, Tianjin 300070, China
Wang-Ren Qiu: Computer Department, Jing-De-Zhen Ceramic Institute, Jingdezhen 333046,
China
Valeria Radulescu: Organic Chemistry Department, Faculty of Pharmacy, “Carol Davila”
University of Medicine and Pharmacy, 6 Traian Vuia, 020956 Bucharest, Romania
Sunhyo Ryu: Department of Biotechnology, Chosun University, Gwangju 501-759, Korea
Gabriel Saramet: Pharmaceutical Technology Department, Faculty of Pharmacy, “Carol
Davila” University of Medicine and Pharmacy, 6 Traian Vuia, 020956 Bucharest, Romania
Chang Ho Seo: Department of Bioinformatics, Kongju National University, Kongju 314-701,
Korea
Lei Shan: Department of Phytochemistry, School of Pharmacy, School of Pharmacy, Second
Military Medical University, 325 Guo He Road, Shanghai 200433, China
Kun Shen: School of Pharmacy, Nanjing Medical University, Nanjing 210029, China
Peter I. Song: Department of Dermatology, University of Arkansas for Medical Sciences,
Little Rock, AR 72205, USA
Qingyan Sun: Department of Phytochemistry, School of Pharmacy, School of Pharmacy,
Second Military Medical University, 325 Guo He Road, Shanghai 200433, China
Valentina Uivarosi: General and Inorganic Chemistry Department, Faculty of Pharmacy,
“Carol Davila” University of Medicine and Pharmacy, 6 Traian Vuia, 020956 Bucharest,
Romania
Jun Wang: Department of Gastroenterology, Xi’an Hospital of Traditional Chinese
Medicine, Xi’an 710001, China
Xiaobo Wang: Department of Pharmacological and Toxicological Research Centre, No. 210
Hospital of Chinese People’s Liberation Army, Dalian 116021, China

VIII
Xijing Wang: Department of Oncology, the Second Affiliated Hospital of Xi’an Jiaotong
University, Xi’an 710004, China
Xiuzhen Wang: School of Pharmacy, Nanjing Medical University, Nanjing 210029, China;
School of Pharmacy, China Pharmaceutical University, Nanjing 210009, China
Ronggang Xi: Department of Pharmacological and Toxicological Research Centre, No. 210
Hospital of Chinese People’s Liberation Army, Dalian 116021, China
Xuan Xiao: Computer Department, Jing-De-Zhen Ceramic Institute, Jingdezhen 333046,
China; Information School, ZheJiang Textile & Fashion College, Ningbo 315211, China;
Gordon Life Science Institute, Belmont, MA 02478, USA
Min Xiong: National Key Laboratory of Crop Genetic Improvement, Agricultural
Bioinformatics Key Laboratory of Hubei Province, Huazhong Agricultural University, Wuhan
430070, China
Guanhong Xu: School of Pharmacy, Nanjing Medical University, Nanjing 210029, China
Xinghuan Xue: Department of Oncology, the Second Affiliated Hospital of Xi’an Jiaotong
University, Xi’an 710004, China
Jia Yan: Department of Anesthesiology, School of Medicine, Shanghai Ninth People’s
Hospital Affiliated to Shanghai Jiao Tong University, Shanghai 200011, China
Matilde Yañez: Department of Pharmacology, University of Santiago de Compostela (USC),
Santiago de Compostela 15782, Spain
Xiaoran Yin: Department of Oncology, the Second Affiliated Hospital of Xi’an Jiaotong
University, Xi’an 710004, China
Hong-Yu Zhang: National Key Laboratory of Crop Genetic Improvement, Agricultural
Bioinformatics Key Laboratory of Hubei Province, Huazhong Agricultural University, Wuhan
430070, China
Jian Zhang: School of Computer Science and Information Technology, Northeast Normal
University, Changchun 130017, China
Jun Zhang: Department of Digestion, the Second Affiliated Hospital of Xi’an Jiaotong
University, Xi’an 710004, China
Lei Zhang: Department of Anesthesiology, School of Medicine, Shanghai Ninth People’s
Hospital Affiliated to Shanghai Jiao Tong University, Shanghai 200011, China
Qing-Wei Zhang: Tianjin Key Laboratory on Technologies Enabling Development of
Clinical Therapeutics and Diagnostics (Theranostics), School of Pharmacy, Basic Medical
Research Center, Tianjin Medical University, Tianjin 300070, China
Shao-Wu Zhang: College of Automation, Northwestern Polytechnical University, Xi’an
710072, China; Key Laboratory of Information Fusion Technology, Ministry of Education,
Xi’an 710072, China
Ting-He Zhang: College of Automation, Northwestern Polytechnical University, Xi’an
710072, China
Weidong Zhang: Department of Phytochemistry, School of Pharmacy, School of Pharmacy,
Second Military Medical University, 325 Guo He Road, Shanghai 200433, China
Zhiran Zhang: Department of Pharmacological and Toxicological Research Centre, No. 210
Hospital of Chinese People’s Liberation Army, Dalian 116021, China

IX
Xiaowei Zhao: School of Computer Science and Information Technology, Northeast Normal
University, Changchun 130017, China; National Engineering Laboratory for Druggable Gene
and Protein Screening, Northeast Normal University, Changchun 130024, China
Shuang Zheng: Tianjin Key Laboratory on Technologies Enabling Development of Clinical
Therapeutics and Diagnostics (Theranostics), School of Pharmacy, Basic Medical Research
Center, Tianjin Medical University, Tianjin 300070, China
Wei-Zhu Zhong: Gordon Life Science Institute, Belmont, MA 02478, USA
Jing Zhou: Tianjin Key Laboratory on Technologies Enabling Development of Clinical
Therapeutics and Diagnostics (Theranostics), School of Pharmacy, Basic Medical Research
Center, Tianjin Medical University, Tianjin 300070, China
Shu-Feng Zhou: Department of Pharmaceutical Sciences, College of Pharmacy, University
of South Florida, Tampa, FL 33620, USA
Kun Zhuang: Department of Digestion, Xi’an Central Hospital, Xi’an 710003, China

X
Preface
With the avalanche of biological sequences generated in the postgenomic age, molecular
science is facing an unprecedented challenge, i.e., how to timely utilize the huge amount of
data to benefit human beings. Stimulated by such a challenge, a rapid development has taken
place in molecular science, particularly in the areas associated with drug development and
biomedicine, both experimental and theoretical. The current thematic book was launched with
the focus on the topic of “Molecular Science for Drug Development and Biomedicine”, in
hopes to further stimulate more useful techniques and findings from various approaches of
molecular science for drug development and biomedicine.
The papers collected in this monograph can be categorized into the following four topics:
1) Pseudo Amino Acid Composition/Pseudo Oligonucleotide Composition; 2) Structure-
Based Drug Design; 3) In Vitro/In Vivo Pharmacological Models; 4) Computational Model
for Drug Development
1. Pseudo Amino Acid Composition and Pseudo Oligonucleotide Composition
One of the most challenging problems in computational biology and biomedicine is how
to formulate a biological sequence with a discrete model or a vector, yet still keep
considerable sequence order information. To avoid completely losing the sequence-order
information for proteins, particularly for their long-range or global sequence-order effects, the
pseudo amino acid composition [1,2] or Chou’s PseAAC [3] was proposed. Ever since the
concept of PseAAC was proposed in 2001, it has rapidly penetrated into almost all the areas
of computational proteomics. Because it has been widely and increasingly used, in the paper
entitled “PseAAC-General: Fast Building Various Modes of General Form of Chou’s Pseudo-
Amino Acid Composition for Large-Scale Protein Datasets”, Professor Dr. Pufeng Du and his
coworkers proposed a powerful software called “PseAAC-General” that can be used for fast
building various modes of general form of Chou’s PseAAC for large-scale protein datasets,
including the GO (Gene Ontology) mode, FunD (Functional Domain) mode, PSSM (Position-
Specific Scoring Matrix) mode and many others as defined by the users according to their
own desires and needs.
SNO (S-nitrosylation) is one of the most important and universal PTMs (posttranslational
modifications) responsible for sensing and transducing signals to regulate various cellular
functions and signaling events. In the article entitled “PSNO: Predicting Cysteine S-
Nitrosylation Sites by Incorporating Various Sequence-Derived Features into the General
Form of Chou’s PseAAC”, Dr. Zhiqiang Ma and coworkers developed a new bioinformatics

XI
tool to identify SNO sites in protein sequences by incorporating various sequence-derived
features into the general form of Chou’s PseAAC, and achieved very promising results.
Encouraged by the successes of using PseAAC to deal with protein/peptide sequences, a
question has naturally and logically occurred: how to use the similar approach to deal with
DNA/RNA sequences? To address this problem, recently the pseudo oligonucleotide
composition or PseKNC [4] and PseKNC-General [5] were developed. In the article with the
title of “iRSpot-TNCPseAAC: Identify Recombination Spots with Trinucleotide Composition
and Pseudo Amino Acid Components”, Dr. Wang-Ren Qiu and coauthors proposed a
different approach to deal with this problem. They first convert a DNA sequence into a
protein sequence by using the 3®1 rule from a 3-nucleotide codon to an amino acid,
followed by using the Chou’s PseAAC to predict the recombination spots of DNA.
Meanwhile, a publically accessible web-server for the prediction method has been established.
Furthermore, for the convenience of the vast majority of experimental scientists, a step-by-
step guide is also given on how to use the web server to obtain the desired result.
2. Structure-Based Drug Design
The article entitled with “Structure of N-Terminal Sequence Asp-Ala-Glu-Phe-Arg-His-
Asp-Ser of Aβ-Peptide with Phospholipase A2 from Venom of Andaman Cobra Sub-Species
Naja naja sagittifera at 2.0 Å Resolution” authored by Professor Dr. Zeenat Mirza, and
coauthors reported the structure from Alzheimer's Aβ-peptide in complex with phospholipase
A2, which was determined by X-ray crystallography at 2.0 Å resolution. Their findings
suggest the possibility of interactions between N-terminus residues (DAEFRHDS) and
phospholipase A2. Their study is a key step towards understanding the mechanism behind the
Aβ and PLA2 interaction that may facilitate the development of novel therapeutic strategies
against the inflammatory responses to retard many diseases.
Mostafa M. Ghorab and colleagues, in the article “Synthesis, Characterization and Anti-
Breast Cancer Activity of New 4-Aminoantipyrine-Based Heterocycles”, reported that a new
series of heterocycles synthesized by incorporating antipyrine moiety. They observed that
these molecules have anticancer activity against human tumor breast cell line (MCF7). In
their study, the authors utilized 4-Aminoantipyrine as key intermediate for the synthesis of
pyrazolone derivatives bearing biologically active moieties. As claimed by the authors, these
findings might be of use for developing more potent and selective anti-breast cancer agents.
In their article “The Discovery of Potentially Selective Human Neuronal Nitric Oxide
Synthase (nNOS) Inhibitors: A Combination of Pharmacophore Modelling, CoMFA, Virtual
Screening and Molecular Docking Studies”, Dr. Guanhong Xu et al. presented a workflow for
the identification and prioritization of compounds as potentially selective human nNOS
inhibitors utilizing a three-dimensional pharmacophore model. They found that the identified

XII
hit compounds were structurally different from available inhibitors and may serve as potential
leads or starting points for structural optimization to identify novel nNOS inhibitors.
As described in the paper entitled “Synthesis, Preliminary Bioevaluation and
Computational Analysis of Caffeic Acid Analogues”, Dr. Weidong Zhang and coworkers
designed, synthesized and evaluated a series of caffeic acid amides for the anti-inflammatory
activity. They developed a 3D pharmacophore model on the basis of biological results for
further structural optimization and also performed the predication of the potential targets
using the PharmMapper server. Results from their study suggest that these amide analogues
represent a promising class of anti-inflammatory scaffold for further exploration and target
identification.
As reported in the article “Synthesis and Antioxidant Activity Evaluation of New
Compounds from Hydrazinecarbothioamide and 1,2,4-Triazole Class Containing
Diarylsulfone and 2,4-Difluorophenyl Moieties”, Dr. Stefania-Felicia Barbuceanu and
coauthors synthesized the new hydrazinecarbothioamides, 1,2,4-triazole-3-thiones and S-
alkylated 1,2,4-triazole derivatives, which were then characterized by IR, 1H-NMR,
13C-NMR
and mass spectral data. The results obtained by them with the preliminary screening of
antioxidant activity suggest that the molecules from hydrazinecarbothioamide class might
serve as interesting compounds for the development of new antioxidant agents by synthesis of
some new derivatives with this structure.
3. In Vitro/In Vivo Pharmacological Models
According to the report by Dr. Hong Jiang and coworkers in “Perineural
Dexmedetomidine Attenuates Inflammation in Rat Sciatic Nerve via the NF-κB Pathway”,
they have established a rat model that simulates a clinical surgical procedure to investigate the
anti-inflammatory effect of perineural administration of dexmedetomidine and the underlying
mechanism. Results from their studies suggest that dexmedetomidine inhibits the nuclear
translocation and binding activity of activated NF-κB, thus reducing inflammatory cytokines.
It may hold high potential for applying the dexmedetomidine as an adjuvant in peripheral
nerve anesthesia.
Dr. Jin Yeul Ma and colleagues evaluated the inhibitory effects of Palmultang (PM) on the
production of inflammatory factors and on the activation of mechanisms in murine
macrophages. They found that PM suppressed the expression of nitric oxide, inflammatory
cytokines and inflammatory proteins by inhibiting nuclear factor (NF)-κB and mitogen-
activated protein kinase (MAPK) signaling pathways and by inducing heme oxygenase (HO)-
1 expression. Their results as detailed in the research article “Inhibitory Effects of Palmultang
on Inflammatory Mediator Production Related to Suppression of NF-κB and MAPK
Pathways and Induction of HO-1 Expression in Macrophages” suggest that PM could be
developed as a new anti-inflammatory agent derived from natural products.

XIII
In the review paper entitled “Colonization and Infection of the Skin by S. aureus: Immune
System Evasion and the Response to Cationic Antimicrobial Peptides”, Professor Dr.
Yoonkyung Park and coworkers discussed the peptides (defensins, cathelicidins, RNase7,
dermcidin) and other mediators (toll-like receptor, IL-1 and IL-17) that comprise the host
defense against S. aureus skin infection, as well as the various mechanisms by which S.
aureus evades host defenses. They anticipate that targeted drug development around highly
conserved bacterial resistance mechanisms against host cationic antimicrobial peptides will be
a promising pharmacologic approach in this era of highly virulent and drug-resistant strains of
S. aureus.
Diallyl disulfide (DADS) is a natural organosulfur compound isolated from garlic. The
anticancer mechanisms of DADS in human esophageal carcinoma have not been elucidated,
especially in vivo. In the research article entitled “DADS Suppresses Human Esophageal
Xenograft Tumors through RAF/MEK/ERK and Mitochondria-Dependent Pathways”
contributed by Dr. Hongbing Ma and his colleagues, the authors reported that the DADS
suppresses esophageal tumors without any apparent signs of toxicity, which is in agreement
with a strong increase of apoptosis both in vitro and in vivo. They claimed that DADS might
be a potentially effective and safe anti-cancer agent for esophageal carcinoma treatment.
In the article “4-Hydroxyphenylacetic Acid Attenuated Inflammation and Edema via
Suppressing HIF-1α in Seawater Aspiration-Induced Lung Injury in Rats”, Drs. Xiaobo Wang
and Faguang Jin, and coworkers conducted an investigation in the effect of 4-
Hydroxyphenylacetic acid (4-HPA) on seawater aspiration-induced lung injury using a
seawater drowning rat model in vivo and the hypoxia-inducible factor-1α (HIF-1α) siRNA
and permeability assay in vitro. Their results indicated that 4-HPA attenuated inflammation
and edema through suppressing hypertonic and hypoxic induction of HIF-1α in seawater
aspiration-induced lung injury in rats, and hence may be considered as a potential agent in the
treatment of seawater aspiration-induced lung injury.
Wound healing plays an important role in protecting the human body from external
infection. Cell migration and proliferation of keratinocytes and dermal fibroblasts are
essential for proper wound healing. In the research article entitled “Effects of the Novel
Compound DK223 ([1E,2E-1,2-Bis(6-methoxy-2H-chromen-3-yl)methylene]hydrazine) on
Migration and Proliferation of Human Keratinocytes and Primary Dermal Fibroblasts”, Dr.
Moonjae Cho and colleagues identified a novel compound DK223 ([1E,2E-1,2-bis(6-
methoxy-2H-chromen-3-yl)methylene]hydrazine) that concomitantly induced human
keratinocyte migration and dermal fibroblast proliferation. They also found that DK223
simultaneously induced both keratinocyte migration via reactive oxygen species production
and fibroblast proliferation via TGF-β1 induction.
XIV
4. Computational Model for Drug Development
With the huge amount uncharacterized proteins entering into the protein database, it is
time-consuming and expensive to identify the protein-protein interactions (PPIs) by
experiments alone. Therefore, it is highly demanding to develop computational methods for
predicting PPIs. In the research article entitled “Prediction of Protein–Protein Interaction with
Pairwise Kernel Support Vector Machine”, Professor Dr. Shaowu Zhang and his colleagues
offered a novel method along with its web-server PPI-PKSVM developed by using the two
feature extraction approaches (DFPCA and AAID) to represent the protein sequence samples,
followed by using the pairwise kernel function support vector machine model. They conclude
that the predicted results are very encouraging and promising for predicting PPIs according to
the sequence information alone.
Nuclear receptors (NRs) are closely associated with various major diseases such as cancer,
diabetes, inflammatory disease, and osteoporosis. Therefore, NRs have become a frequent
target for drug development. During the process of developing drugs against these diseases by
targeting NRs, we are often facing a problem: Given a NR and chemical compound, can we
identify whether they are really in interaction with each other in a cell? To address this
problem, in the article “iNR-Drug: Predicting the Interaction of Drugs with Nuclear Receptors
in Cellular Networking”, Dr. Xuan Xiao et al. proposed a predictor called “iNR-Drug” in
which the drug compound concerned was formulated by a 256-D (dimensional) vector
derived from its molecular fingerprint, and the NR a 500-D vector formed by incorporating its
sequential evolution information and physicochemical features into the general form of
Chou’s PseAAC. Compared with the existing prediction methods in this regard, iNR-Drug not
only can yield a higher success rate, but is also featured by a user-friendly web-server, which
is particularly useful for most experimental scientists to obtain their desired data in a timely
manner.
Inherently chiral calix[4]arenes can be theoretically regarded as a type of complex planar
chiral molecule when bridging carbons are treated as achiral and each phenyl ring and its six
substituents treated as coplanar. Based on one approximation and one hypothesis, Drs. Shao-
Yong Li, Wei Qiao and Jun-Min Liu, and their colleagues have derived a expression for
qualitatively analyzing the microhelical electronic energy, as elaborated in the article
“Qualitative Analysis of the Helical Electronic Energy of Inherently Chiral Calix[4]arenes:
An Approach to Effectively Assign Their Absolute Configuration”. According to their report,
the scientificity and effectiveness in absolute configuration assignments of inherently chiral
calix[4]arenes were almost entirely confirmed for all of the entities whose absolute
configurations and optical rotation signs have been ascertained.

XV
It is a great challenge to elucidate the polypharmacological mechanisms of polyphenols.
In the research article “Elucidating Polypharmacological Mechanisms of Polyphenols by
Gene Module Profile Analysis”, Dr. Hong-Yu Zhang and coworkers have developed a
method for identifying the multiple targets of chemical agents through analyzing the module
profiles of gene expression upon chemical treatments. By using this method, they have
identified 148 targets for 20 polyphenols derived from cMap. As claimed by these authors, a
large part of the targets were validated by experimental observations, implying that the
medicinal effects of polyphenols are far beyond their well-known antioxidant activities.
In the last decade or so, it has been observed that many molecular biosystems and
biomedical systems belong to the multi-label systems where each of their constituent
molecules may possess two or more attributes, functions or features, and hence need multiple-
label or multi-target method to analyze them [6]. In the paper entitled “Prediction of Multi-
Target Networks of Neuroprotective Compounds with Entropy Indices and Synthesis, Assay,
and Theoretical Study of New Asymmetric 1,2-Rasagiline Carbamates”, Professor Drs.
Humberto González-Díaz and Xerardo García-Mera and their colleagues used Shannon
entropy measures to develop predictive models for multi-target networks of
neuroprotective/neurotoxic compounds. Their method has been demonstrated to be a useful
complementary tool in the organic synthesis and evaluation of the multi-target biological
activity of new compounds with potential neuroprotective activity, as well as in the prediction
of complex networks of drug-target interactions.
As one can see from the aforementioned nineteen papers collected in this book they are all
featured by either developing powerful tools or reporting important findings, which will be
very useful for both the basic research in molecular sciences and drug design in
pharmaceutical industry.
It is our hope that publication of this thematic book can stimulate more powerful tools in
computational biomedicine as well as more profound findings in treating diseases so as to
benefit human beings.
REFERENCES
[1] Chou, K. C. Prediction of protein cellular attributes using pseudo amino acid
composition PROTEINS: Structure, Function, and Genetics, 2001, 43, 246-255.
[2] Chou, K. C. Using amphiphilic pseudo amino acid composition to predict enzyme
subfamily classes Bioinformatics, 2005, 21, 10-19.
[3] Lin, S. X.; Lapointe, J. Theoretical and experimental biology in one. J. Biomedical
Science and Engineering (JBiSE), 2013, 6, 435-442.
[4] Chen, W.; Lei, T. Y.; Jin, D. C.; et al. PseKNC: a flexible web-server for generating
pseudo K-tuple nucleotide composition Anal. Biochem., 2014, 456, 53-60.

XVI
[5] Chen W, Zhang X, Brooker J. et al. (2014) PseKNC-General: a cross-platform
package for generating various modes of pseudo nucleotide compositions.
Bioinformatics, 2014, doi:10.1093/bioinformatics/btu602.
[6] Chou, K.C. Some remarks on predicting multi-label attributes in molecular
biosystems. Molecular BioSystems, 2013, 1092-1100.
Dr. Wei-Zhu Zhong
Gordon Life Science Institute, Belmont, Massachusetts, USA
E-Mail: [email protected]
Prof. Dr. Shufeng Zhou
Department of Pharmaceutical Sciences, College of Pharmacy, University of South Florida, Tampa,
Florida, USA
E-Mail: [email protected]
Guest Editors


1
1. Pseudo Amino Acid Composition and
Pseudo Oligonucleotide Composition
PseAAC-General: Fast Building Various Modes of General
Form of Chou’s Pseudo-Amino Acid Composition for
Large-Scale Protein Datasets
Pufeng Du, Shuwang Gu and Yasen Jiao
Abstract: The general form pseudo-amino acid composition (PseAAC) has been widely used to represent protein sequences in predicting protein structural and functional attributes. We developed the program PseAAC-General to generate various different modes of Chou’s general PseAAC, such as the gene ontology mode, the functional domain mode, and the sequential evolution mode. This program allows the users to define their own desired modes. In every mode, 544 physicochemical properties of the amino acids are available for choosing. The computing efficiency is at least 100 times that of existing programs, which makes it able to facilitate the extensive studies on proteins and peptides. The PseAAC-General is freely available via SourceForge. It runs on both Linux and Windows.
Reprinted from Int. J. Mol. Sci. Cite as: Du, P.; Gu, S.; Krail, K.; Jiao, Y. PseAAC-General: Fast Building Various Modes of General Form of Chou’s Pseudo-Amino Acid Composition for Large-Scale Protein Datasets. Int. J. Mol. Sci. 2014, 15, 3495-3506.
1. Introduction
Over the last few years, machine learning has been introduced to predict protein structures and functions. In these studies, one of the keys is to formulate the protein sequences with a mathematical form that can reflect the intrinsic correlation with their structures and functions. To be more specific, this mathematical form should keep representing a protein sequence with a discrete form yet without completely losing its sequence-order information. The pseudo-amino acid compositions (PseAAC), which was originally introduced to predict protein attributes [1], is a typical mathematical form in this regard.
Ever since its first appearance, the PseAAC formulation has been widely applied for studying various problems in protein science, such as predicting eukaryotes and prokaryotes protein subcellular locations [2–11], protein sub-subcellular locations [12–22], membrane protein subcellular locations [23–26], viral protein subcellular locations [27,28], protein structural classes [29–35], secondary structures [36], super-secondary structures [37], quaternary structural attributes [38,39], GPCR classes [40–42], enzyme families [43,44], membrane protein types [45–47], metalloproteinase families [48], risk types of human papillomavirus [49], cell-wall lytic enzymes [50], cyclic

2
proteins [51], allergenic proteins [52], bioluminescent proteins [53], DNA-binding proteins [54], GABA(A) receptor proteins [55], bacterial virulent proteins [56], essential proteins [57], anti-cancer peptides [58], anti-bacterial peptides [59], protein-protein interactions [60], protein solubility [61], drug-target network [62], and many more [63–76]. Recently, it was applied to represent DNA sequences in identifying the recombination spot [77].
Many different types of information, such as gene ontology annotations, functional domain compositions, and sequential evolution information, have been integrated skillfully with the concept of PseAAC to represent protein samples in order to enhance the prediction quality of their attributes. In essence, the protein sample thus formulated were actually various modes of Chou’s general form PseAAC, as clearly indicated by Equations 9–14 in a comprehensive review [78]. On the contrary, the Type I PseAAC [1] and Type II PseAAC [79] belong to Chou’s special form PseAAC. The modes of Chou’s special form PseAAC can be calculated by several programs, such as PseAAC server [80], PseAAC-Builder [81] and the propy package [82].
However, so far no publicly accessible program could calculate Chou’s general PseAAC. The current PseAAC-General is a universal software platform for users to generate various modes of general form PseAAC, including several widely used modes, such as the gene ontology mode [3], functional domain mode [83], and sequential evolution mode [18]. It is anticipated that PseAAC-General will become a very useful tool in bioinformatics, computational proteomics, and system biology.
2. Results and Discussion
The current PseAAC-General can generate 13 different modes of general form PseAAC, including conventional amino acid composition, di-peptide composition, tri-peptide composition, Type I PseAAC, Type II PseAAC, the gene ontology mode, the functional domain mode, the sequential evolution mode, the normalized Moreau-Broto autocorrelation coefficients, the Moran autocorrelation coefficients, the Geary autocorrelation coefficients, the composition-transition-distribution (CTD) descriptors and the quasi-sequence order descriptors. In every mode, 544 types of physicochemical properties are available for choosing. Over 20,000 different descriptor values can be calculated.
We list several commonly used modes of general form PseAAC as well as some program features in PseAAC-General program in Table 1. Several modes are uniquely available in PseAAC-General, which include the gene ontology mode, the functional domain mode and the sequential evolution mode. These modes have been mentioned in existing programs [81,82]. However, no program implemented these modes.
PseAAC-General provided two methods for the users to create their own desired modes. The first method is called the Binary Extension Module (BEM). The gene ontology mode and functional domain mode were actually implemented by this method. A set of tools was provided along with the PseAAC-General, so that the users can create their own BEM to represent all kinds of descriptive information, which includes but not limited to the gene ontology annotations and the functional domain compositions.
The other method is the Lua script module. Lua script language is a very simple programming language that has been considered in analyzing sequence annotations [90]. We provided a

3
programming interface that allows the user to use Lua script to access the internal data structures and functions of PseAAC-General. Furthermore, the algorithm modules of PseAAC-General can be replaced by the user-defined Lua script modules. This provides the maximal flexibility for the user-defined mode. Actually, the sequential evolution mode was implemented in this way.
Because of these extension modules, the input to the PseAAC-General is not only the protein sequences. These extension modules should also be loaded if they are needed. We illustrate the data flow of PseAAC-General in Figure 1.
Table 1. Comparison of program features.
Program Functions a PseAAC-General PseAAC-Builder Propy PseAAC Server
Physicochemical Properties 544 544 8 6 Output Features
Type I PseAAC [1] Y Y Y Y Type II PseAAC [79] Y Y Y Y
Amino acid composition Y Y Y Y di-Peptide composition Y Y Y Y tri-Peptide composition Y N Y N
Normalized Moreau-Broto autocorrelation [84,85]
Y N Y N
Moran autocorrelation [86] Y N Y N Geary autocorrelation [87] Y N Y N
Composition-Transition-Distribution (CTD) [88]
Y N Y N
Quasi-sequence order [89] Y N Y N Gene ontology mode [83] Y N N N
Functional domain mode [83] Y N N N Sequential evolution mode [18] Y N N N
Other functions User defined Y N N N
Online updates Y N N N Graphical User Interface (GUI) Y Y N Y
Execution efficiency b ~17,000 seqs/s ~170 seqs/s N.A. ~15 seqs/s a The program functions that were compared. There are three groups of functions, including the physicochemical properties, the sequence features that can be generated and the other function properties of the software. Y = YES; N = NO; b the execution time for PseAAC-General and PseAAC-Builder was tested on a dataset containing over 510,000 sequences by the wall-clock time. The execution time for PseAAC-Server was tested on a dataset containing 500 sequences due to the limitation of the service and the internet connection conditions. The execution time for Propy was not tested due the limitation of testing environments. Seqs/s means sequences per second.
The usefulness of PseAAC-General is undisputed. In the early days of general form PseAAC, every study had to implement the PseAAC independently. This may bring a number of problems, including but not limited to inconsistent results, different computation efficiency and different basis in comparing predictive performance. PseAAC-General can serve as a standard program that saves

4
time for all these studies. Furthermore, our program eliminates those unforeseen problems that were brought by the different implementations of PseAAC.
PseAAC-General is much faster than existing programs. We tested PseAAC-General by using it to calculate Type I PseAAC with default parameters. On the same machine that we tested PseAAC-Builder [81], it can process about 17,000 sequences per second. This is about 100 times faster than PseAAC-Builder. In other words, PseAAC-General can convert the entire Swiss-Prot database to Type I PseAAC within 30 s, while PseAAC-Builder needs about 40 min.
Figure 1. The data flow of pseudo-amino acid composition (PseAAC)-General. The input data is FASTA format sequences. The output data is general form PseAAC. The mode of the general form PseAAC is chosen by the users. For the modes, which are implemented by Binary Extension Modules or Lua script modules, the corresponding modules should be loaded as well.
3. Implementations
PseAAC-General is released under GNU GPL (GNU General Public License). It can be integrated with other programs in the source code level. We have ported PseAAC-General to both Linux and Windows platforms. A GUI (Graphical User Interface) module was provided for both platforms. The users, who do not familiar with the command line, can use PseAAC-General through GUI. However, it should be noted that the most efficient way is the command line, which was designed to follow the GNU command line standard.
PseAAC-General was designed to be a stand-alone program running on the local machine without internet connection requirements. Therefore, we did not include the online sequence retrieving function within the program. On the other hand, the propy package has perfectly implemented the retrieving function. The best choice for the users is to let PseAAC-General work side by side with the propy package. For example, the users can use Propy to retrieve protein sequences and call PseAAC-General to calculate the PseAAC, as python environment has the built-in ability to call external programs, like PseAAC-General. In future versions of PseAAC-General, a

5
similar function will be implemented. PseAAC-General and all its extension modules can be downloaded from its website [91]. To facilitate further studies, all source code of PseAAC-General, including the main program, GUI module and all extension modules, can be freely downloaded from the SourceForge website [92]. We also provided detailed documents within the software package, so that the users can learn not only how to use the existing modes, but also how to create their own modes by building their own extension modules. For the users’ convenience to test their own modes, we provided four different testing dataset with different size. These testing datasets can also be downloaded from the website. Along with the testing datasets, we provided simple testing scripts to demonstrate the usage of PseAAC-General in a common case. The users can simply try the testing scripts to learn how to use the program.
Because the gene ontology mode and the functional domain mode should be upgraded along with the Swiss-Prot database, we deployed a cloud-computation based server in Amazon EC2 (Elastic Cloud 2, Amazon.com Inc., Seattle, WA, USA) to automatically upgrade the relevant extension modules on monthly basis.
4. Conclusions
As PseAAC-General is a very powerful and very flexible computation tool, we believe that PseAAC-General will facilitate all studies that apply the general form PseAAC, including those existing modes and those modes in development.
However, as a final reminder, we would like to remind the users to read the manual of PseAAC-General and those literatures describing the algorithm of general form PseAAC carefully before using it. Because of the powerful function and the flexibility of PseAAC-General, using it in your study without knowing the algorithms and technics behind the program and the source code could be very risky.
Acknowledgments
This work was supported by National Science Foundation of China (NSFC 61005041); Specialized Research Fund for the Doctoral Program of Higher Education (SRFDP 20100032120039); Tianjin Natural Science Foundation (No. 12JCQNJC02300); China Post-doctoral Science Foundation (2012T50240 and 2013M530114); HK Scholar Program (XJ2012033) and the Seed Foundation of Tianjin University (No. 60302006 and 60302024).
Author Contributions
P.D. designed the software, partially wrote the code and wrote the manuscript. S.G. and Y.J. partially wrote the code, carried out testing experiments and partially wrote the manuscript.
Conflicts of Interest
The authors declare no conflict of interest.

6
References
1. Chou, K.C. Prediction of protein cellular attributes using pseudo-amino acid composition. Proteins 2001, 43, 246–255.
2. Lee, K.; Chuang, H.-Y.; Beyer, A.; Sung, M.-K.; Huh, W.-K.; Lee, B.; Ideker, T. Protein networks markedly improve prediction of subcellular localization in multiple eukaryotic species. Nucleic Acids Res. 2008, 36, e136.
3. Chou, K.-C.; Shen, H.-B. Cell-PLoc: A package of web servers for predicting subcellular localization of proteins in various organisms. Nat. Protoc. 2008, 3, 153–162.
4. Huang, C.; Yuan, J. Using radial basis function on the general form of Chou’s pseudo amino acid composition and PSSM to predict subcellular locations of proteins with both single and multiple sites. BioSystems 2013, 113, 50–57.
5. Jiang, X.; Wei, R.; Zhang, T.; Gu, Q. Using the concept of Chou’s pseudo amino acid composition to predict apoptosis proteins subcellular location: An approach by approximate entropy. Protein Pept. Lett. 2008, 15, 392–396.
6. Lin, H.; Wang, H.; Ding, H.; Chen, Y.-L.; Li, Q.-Z. Prediction of subcellular localization of apoptosis protein using Chou’s pseudo amino acid composition. Acta Biotheor. 2009, 57, 321–330.
7. Lin, J.; Wang, Y. Using a novel AdaBoost algorithm and Chou’s Pseudo amino acid composition for predicting protein subcellular localization. Protein Pept. Lett. 2011, 18, 1219–1225.
8. Mei, S. Predicting plant protein subcellular multi-localization by Chou’s PseAAC formulation based multi-label homolog knowledge transfer learning. J. Theor. Biol. 2012, 310, 80–87.
9. Pacharawongsakda, E.; Theeramunkong, T. Predict subcellular locations of singleplex and multiplex proteins by semi-supervised learning and dimension-reducing general mode of Chou’s PseAAC. NanoBioscience 2013, 12, 311–320.
10. Wan, S.; Mak, M.-W.; Kung, S.-Y. GOASVM: A subcellular location predictor by incorporating term-frequency gene ontology into the general form of Chou’s pseudo-amino acid composition. J. Theor. Biol. 2013, 323, 40–48.
11. Wang, X.; Li, G.-Z.; Lu, W.-C. Virus-ECC-mPLoc: A multi-label predictor for predicting the subcellular localization of virus proteins with both single and multiple sites based on a general form of Chou’s pseudo amino acid composition. Protein Pept. Lett. 2013, 20, 309–317.
12. Du, P.; Li, Y. Prediction of protein submitochondria locations by hybridizing pseudo-amino acid composition with various physicochemical features of segmented sequence. BMC Bioinforma. 2006, 7, 518.
13. Du, P.; Yu, Y. SubMito-PSPCP: Predicting protein submitochondrial locations by hybridizing positional specific physicochemical properties with pseudoamino acid compositions. BioMed Res. Int. 2013, 2013, 263829–263836.
14. Fan, G.-L.; Li, Q.-Z. Predicting protein submitochondria locations by combining different descriptors into the general form of Chou’s pseudo amino acid composition. Amino Acids 2012, 43, 545–555.
15. Mei, S. Multi-kernel transfer learning based on Chou’s PseAAC formulation for protein submitochondria localization. J. Theor. Biol. 2012, 293, 121–130.

7
16. Huang, C.; Yuan, J.-Q. Predicting protein subchloroplast locations with both single and multiple sites via three different modes of Chou’s pseudo amino acid compositions. J. Theor. Biol. 2013, 335, 205–212.
17. Jiang, X.; Wei, R.; Zhao, Y.; Zhang, T. Using Chou’s pseudo amino acid composition based on approximate entropy and an ensemble of AdaBoost classifiers to predict protein subnuclear location. Amino Acids 2008, 34, 669–675.
18. Shen, H.-B.; Chou, K.-C. Nuc-PLoc: A new web-server for predicting protein subnuclear localization by fusing PseAA composition and PsePSSM. Protein Eng. Des. Sel. 2007, 20, 561–567.
19. Li, F.-M.; Li, Q.-Z. Predicting protein subcellular location using Chou’s pseudo amino acid composition and improved hybrid approach. Protein Pept. Lett. 2008, 15, 612–616.
20. Li, L.-Q.; Zhang, Y.; Zou, L.-Y.; Zhou, Y.; Zheng, X.-Q. Prediction of protein subcellular multi-localization based on the general form of Chou’s pseudo amino acid composition. Protein Pept. Lett. 2012, 19, 375–387.
21. Nanni, L.; Lumini, A. Genetic programming for creating Chou’s pseudo amino acid based features for submitochondria localization. Amino Acids 2008, 34, 653–660.
22. Zeng, Y.; Guo, Y.; Xiao, R.; Yang, L.; Yu, L.; Li, M. Using the augmented Chou’s pseudo amino acid composition for predicting protein submitochondria locations based on auto covariance approach. J. Theor. Biol. 2009, 259, 366–372.
23. Pierleoni, A.; Martelli, P.L.; Casadio, R. MemLoci: Predicting subcellular localization of membrane proteins in eukaryotes. Bioinformatics 2011, 27, 1224–1230.
24. Du, P.; Tian, Y.; Yan, Y. Subcellular localization prediction for human internal and organelle membrane proteins with projected gene ontology scores. J. Theor. Biol. 2012, 313, 61–67.
25. Huang, C.; Yuan, J.-Q. A multilabel model based on Chou’s pseudo-amino acid composition for identifying membrane proteins with both single and multiple functional types. J. Membr. Biol. 2013, 246, 327–334.
26. Zhang, S.-W.; Zhang, Y.-L.; Yang, H.-F.; Zhao, C.-H.; Pan, Q. Using the concept of Chou’s pseudo amino acid composition to predict protein subcellular localization: An approach by incorporating evolutionary information and von Neumann entropies. Amino Acids 2008, 34, 565–572.
27. Cao, J.-Z.; Liu, W.-Q.; Gu, H. Predicting viral protein subcellular localization with Chou’s pseudo amino acid composition and imbalance-weighted multi-label K-nearest neighbor algorithm. Protein Pept. Lett. 2012, 19, 1163–1169.
28. Shen, H.-B.; Chou, K.-C. Virus-mPLoc: A fusion classifier for viral protein subcellular location prediction by incorporating multiple sites. J. Biomol. Struct. Dyn. 2010, 28, 175–186.
29. Sahu, S.S.; Panda, G. A novel feature representation method based on Chou’s pseudo amino acid composition for protein structural class prediction. Comput. Biol. Chem. 2010, 34, 320–327.
30. Chen, C.; Shen, Z.-B.; Zou, X.-Y. Dual-layer wavelet SVM for predicting protein structural class via the general form of Chou’s pseudo amino acid composition. Protein Pept. Lett. 2012, 19, 422–429.

8
31. Kong, L.; Zhang, L.; Lv, J. Accurate prediction of protein structural classes by incorporating predicted secondary structure information into the general form of Chou’s pseudo amino acid composition. J. Theor. Biol. 2013, 344, 12–18.
32. Li, Z.-C.; Zhou, X.-B.; Dai, Z.; Zou, X.-Y. Prediction of protein structural classes by Chou’s pseudo amino acid composition: Approached using continuous wavelet transform and principal component analysis. Amino Acids 2009, 37, 415–425.
33. Liao, B.; Xiang, Q.; Li, D. Incorporating secondary features into the general form of Chou’s PseAAC for predicting protein structural class. Protein Pept. Lett. 2012, 19, 1133–1138.
34. Liu, L.; Hu, X.-Z.; Liu, X.-X.; Wang, Y.; Li, S.-B. Predicting protein fold types by the general form of Chou’s pseudo amino acid composition: Approached from optimal feature extractions. Protein Pept. Lett. 2012, 19, 439–449.
35. Qin, Y.-F.; Wang, C.-H.; Yu, X.-Q.; Zhu, J.; Liu, T.-G.; Zheng, X.-Q. Predicting protein structural class by incorporating patterns of over-represented k-mers into the general form of Chou’s PseAAC. Protein Pept. Lett. 2012, 19, 388–397.
36. Chen, C.; Chen, L.; Zou, X.; Cai, P. Prediction of protein secondary structure content by using the concept of Chou’s pseudo amino acid composition and support vector machine. Protein Pept. Lett. 2009, 16, 27–31.
37. Zou, D.; He, Z.; He, J.; Xia, Y. Supersecondary structure prediction using Chou’s pseudo amino acid composition. J. Comput. Chem. 2011, 32, 271–278.
38. Sun, X.-Y.; Shi, S.-P.; Qiu, J.-D.; Suo, S.-B.; Huang, S.-Y.; Liang, R.-P. Identifying protein quaternary structural attributes by incorporating physicochemical properties into the general form of Chou’s PseAAC via discrete wavelet transform. Mol. Biosyst. 2012, 8, 3178–3184.
39. Zhang, S.-W.; Chen, W.; Yang, F.; Pan, Q. Using Chou’s pseudo amino acid composition to predict protein quaternary structure: A sequence-segmented PseAAC approach. Amino Acids 2008, 35, 591–598.
40. Gu, Q.; Ding, Y.S.; Zhang, T.L. Prediction of G-protein-coupled receptor classes in low homology using Chou’s pseudo amino acid composition with approximate entropy and hydrophobicity patterns. Protein Pept. Lett. 2010, 17, 559–567.
41. Qiu, J.-D.; Huang, J.-H.; Liang, R.-P.; Lu, X.-Q. Prediction of G-protein-coupled receptor classes based on the concept of Chou’s pseudo amino acid composition: An approach from discrete wavelet transform. Anal. Biochem. 2009, 390, 68–73.
42. Zia-Ur-Rehman; Khan, A. Identifying GPCRs and their types with Chou’s pseudo amino acid composition: An approach from multi-scale energy representation and position specific scoring matrix. Protein Pept. Lett. 2012, 19, 890–903.
43. Qiu, J.-D.; Huang, J.-H.; Shi, S.-P.; Liang, R.-P. Using the concept of Chou’s pseudo amino acid composition to predict enzyme family classes: An approach with support vector machine based on discrete wavelet transform. Protein Pept. Lett. 2010, 17, 715–722.
44. Zhou, X.-B.; Chen, C.; Li, Z.-C.; Zou, X.-Y. Using Chou’s amphiphilic pseudo-amino acid composition and support vector machine for prediction of enzyme subfamily classes. J. Theor. Biol. 2007, 248, 546–551.

9
45. Chen, Y.-K.; Li, K.-B. Predicting membrane protein types by incorporating protein topology, domains, signal peptides, and physicochemical properties into the general form of Chou’s pseudo amino acid composition. J. Theor. Biol. 2013, 318, 1–12.
46. Han, G.-S.; Yu, Z.-G.; Anh, V. A two-stage SVM method to predict membrane protein types by incorporating amino acid classifications and physicochemical properties into a general form of Chou’s PseAAC. J. Theor. Biol. 2013, 344, 31–39.
47. Hayat, M.; Khan, A. Discriminating outer membrane proteins with fuzzy K-nearest neighbor algorithms based on the general form of Chou’s PseAAC. Protein Pept. Lett. 2012, 19, 411–421.
48. Mohammad Beigi, M.; Behjati, M.; Mohabatkar, H. Prediction of metalloproteinase family based on the concept of Chou’s pseudo amino acid composition using a machine learning approach. J. Struct. Funct. Genomics 2011, 12, 191–197.
49. Esmaeili, M.; Mohabatkar, H.; Mohsenzadeh, S. Using the concept of Chou’s pseudo amino acid composition for risk type prediction of human papillomaviruses. J. Theor. Biol. 2010, 263, 203–209.
50. Ding, H.; Luo, L.; Lin, H. Prediction of cell wall lytic enzymes using Chou’s amphiphilic pseudo amino acid composition. Protein Pept. Lett. 2009, 16, 351–355.
51. Mohabatkar, H. Prediction of cyclin proteins using Chou’s pseudo amino acid composition. Protein Pept. Lett. 2010, 17, 1207–1214.
52. Mohabatkar, H.; Mohammad Beigi, M.; Abdolahi, K.; Mohsenzadeh, S. Prediction of allergenic proteins by means of the concept of Chou’s pseudo amino acid composition and a machine learning approach. Med. Chem. 2013, 9, 133–137.
53. Fan, G.-L.; Li, Q.-Z. Discriminating bioluminescent proteins by incorporating average chemical shift and evolutionary information into the general form of Chou’s pseudo amino acid composition. J. Theor. Biol. 2013, 334, 45–51.
54. Fang, Y.; Guo, Y.; Feng, Y.; Li, M. Predicting DNA-binding proteins: Approached from Chou’s pseudo amino acid composition and other specific sequence features. Amino Acids 2008, 34, 103–109.
55. Mohabatkar, H.; Mohammad Beigi, M.; Esmaeili, A. Prediction of GABAA receptor proteins using the concept of Chou’s pseudo-amino acid composition and support vector machine. J. Theor. Biol. 2011, 281, 18–23.
56. Nanni, L.; Lumini, A.; Gupta, D.; Garg, A. Identifying bacterial virulent proteins by fusing a set of classifiers based on variants of Chou’s pseudo amino acid composition and on evolutionary information. IEEE/ACM Trans. Comput. Biol. Bioinforma. 2012, 9, 467–475.
57. Sarangi, A.N.; Lohani, M.; Aggarwal, R. Prediction of essential proteins in prokaryotes by incorporating various physico-chemical features into the general form of Chou’s pseudo amino acid composition. Protein Pept. Lett. 2013, 20, 781–795.
58. Hajisharifi, Z.; Piryaiee, M.; Mohammad Beigi, M.; Behbahani, M.; Mohabatkar, H. Predicting anticancer peptides with Chou’s pseudo amino acid composition and investigating their mutagenicity via Ames test. J. Theor. Biol. 2014, 341, 34–40.
59. Khosravian, M.; Faramarzi, F.K.; Beigi, M.M.; Behbahani, M.; Mohabatkar, H. Predicting antibacterial peptides by the concept of Chou’s pseudo-amino acid composition and machine learning methods. Protein Pept. Lett. 2013, 20, 180–186.

10
60. Zhao, X.-W.; Ma, Z.-Q.; Yin, M.-H. Predicting protein–protein interactions by combing various sequence-derived features into the general form of Chou’s pseudo amino acid composition. Protein Pept. Lett. 2012, 19, 492–500.
61. Niu, X.-H.; Hu, X.-H.; Shi, F.; Xia, J.-B. Predicting protein solubility by the general form of Chou’s pseudo amino acid composition: Approached from chaos game representation and fractal dimension. Protein Pept. Lett. 2012, 19, 940–948.
62. Yu, H.; Chen, J.; Xu, X.; Li, Y.; Zhao, H.; Fang, Y.; Li, X.; Zhou, W.; Wang, W.; Wang, Y.A. Systematic prediction of multiple drug-target interactions from chemical, genomic, and pharmacological data. PLoS One 2012, 7, e37608.
63. Georgiou, D.N.; Karakasidis, T.E.; Nieto, J.J.; Torres, A. Use of fuzzy clustering technique and matrices to classify amino acids and its impact to Chou’s pseudo amino acid composition. J. Theor. Biol. 2009, 257, 17–26.
64. Gupta, M.K.; Niyogi, R.; Misra, M. An alignment-free method to find similarity among protein sequences via the general form of Chou’s pseudo amino acid composition. SAR QSAR Environ. Res. 2013, 24, 597–609.
65. Lin, H. The modified Mahalanobis discriminant for predicting outer membrane proteins by using Chou’s pseudo amino acid composition. J. Theor. Biol. 2008, 252, 350–356.
66. Nanni, L.; Brahnam, S.; Lumini, A. Wavelet images and Chou’s pseudo amino acid composition for protein classification. Amino Acids 2012, 43, 657–665.
67. Qiu, J.-D.; Suo, S.-B.; Sun, X.-Y.; Shi, S.-P.; Liang, R.-P. OligoPred: A web-server for predicting homo-oligomeric proteins by incorporating discrete wavelet transform into Chou’s pseudo amino acid composition. J. Mol. Graph. Model. 2011, 30, 129–134.
68. Ren, L.-Y.; Zhang, Y.-S.; Gutman, I. Predicting the classification of transcription factors by incorporating their binding site properties into a novel mode of Chou’s pseudo amino acid composition. Protein Pept. Lett. 2012, 19, 1170–1176.
69. Xiaohui, N.; Nana, L.; Jingbo, X.; Dingyan, C.; Yuehua, P.; Yang, X.; Weiquan, W.; Dongming, W.; Zengzhen, W. Using the concept of Chou’s pseudo amino acid composition to predict protein solubility: An approach with entropies in information theory. J. Theor. Biol. 2013, 332, 211–217.
70. Xie, H.-L.; Fu, L.; Nie, X.-D. Using ensemble SVM to identify human GPCRs N-linked glycosylation sites based on the general form of Chou’s PseAAC. Protein Eng. Des. Sel. 2013, 26, 735–742.
71. Yu, L.; Guo, Y.; Li, Y.; Li, G.; Li, M.; Luo, J.; Xiong, W.; Qin, W. SecretP: Identifying bacterial secreted proteins by fusing new features into Chou’s pseudo-amino acid composition. J. Theor. Biol. 2010, 267, 1–6.
72. Zhang, G.-Y.; Fang, B.-S. Predicting the cofactors of oxidoreductases based on amino acid composition distribution and Chou’s amphiphilic pseudo-amino acid composition. J. Theor. Biol. 2008, 253, 310–315.
73. Zhang, G.-Y.; Li, H.-C.; Gao, J.-Q.; Fang, B.-S. Predicting lipase types by improved Chou’s pseudo-amino acid composition. Protein Pept. Lett. 2008, 15, 1132–1137.

11
74. Liu, B.; Wang, X.; Zou, Q.; Dong, Q.; Chen, Q. Protein remote homology detection by combining Chou’s pseudo amino acid composition and profile-based protein representation. Mol. Inform. 2013, 32, 775–782.
75. Georgiou, D.N.; Karakasidis, T.E.; Nieto, J.J.; Torres, A. A study of entropy/clarity of genetic sequences using metric spaces and fuzzy sets. J. Theor. Biol. 2010, 267, 95–105.
76. Georgiou, T.N.; Karakasidis, T.E.; Megaritis, A.C. A short survey on genetic sequences, Chou’s pseudo amino acid composition and its combination with fuzzy set theory. Open Bioinforma. J. 2013, 7, 41–48.
77. Chen, W.; Feng, P.-M.; Lin, H.; Chou, K.-C. iRSpot-PseDNC: Identify recombination spots with pseudo dinucleotide composition. Nucleic Acids Res. 2013, 41, e68.
78. Chou, K.-C. Some remarks on protein attribute prediction and pseudo amino acid composition. J. Theor. Biol. 2011, 273, 236–247.
79. Chou, K.-C. Using amphiphilic pseudo amino acid composition to predict enzyme subfamily classes. Bioinformatics 2005, 21, 10–19.
80. Shen, H.-B.; Chou, K.-C. PseAAC: A flexible web server for generating various kinds of protein pseudo amino acid composition. Anal. Biochem. 2008, 373, 386–388.
81. Du, P.; Wang, X.; Xu, C.; Gao, Y. PseAAC-Builder: A cross-platform stand-alone program for generating various special Chou’s pseudo-amino acid compositions. Anal. Biochem. 2012, 425, 117–119.
82. Cao, D.-S.; Xu, Q.-S.; Liang, Y.-Z. Propy: A tool to generate various modes of Chou’s PseAAC. Bioinformatics 2013, 29, 960–962.
83. Chou, K.-C.; Cai, Y.-D. Prediction of protein subcellular locations by GO-FunD-PseAA predictor. Biochem. Biophys. Res. Commun. 2004, 320, 1236–1239.
84. Feng, Z.P.; Zhang, C.T. Prediction of membrane protein types based on the hydrophobic index of amino acids. J. Protein Chem. 2000, 19, 269–275.
85. Lin, Z.; Pan, X.M. Accurate prediction of protein secondary structural content. J. Protein Chem. 2001, 20, 217–220.
86. Horne, D.S. Prediction of protein helix content from an autocorrelation analysis of sequence hydrophobicities. Biopolymers 1988, 27, 451–477.
87. Sokal, R.R.; Thomson, B.A. Population structure inferred by local spatial autocorrelation: An example from an Amerindian tribal population. Am. J. Phys. Anthropol. 2006, 129, 121–131.
88. Dubchak, I.; Muchnik, I.; Mayor, C.; Dralyuk, I.; Kim, S.H. Recognition of a protein fold in the context of the Structural Classification of Proteins (SCOP) classification. Proteins 1999, 35, 401–407.
89. Chou, K.-C. Prediction of protein subcellular locations by incorporating quasi-sequence-order effect. Biochem. Biophys. Res. Commun. 2000, 27, 477–483.
90. Steinbiss, S.; Gremme, G.; Schärfer, C.; Mader, M.; Kurtz, S. AnnotationSketch: A genome annotation drawing library. Bioinformatics 2009, 25, 533–534.
91. PseAAC-General. Available online: http://pseb.sf.net (accessed on 19 February 2014). 92. PseAAC-General SourceForge Site. Available online: http://sourceforge.net/projects/pseb/files
(accessed on 19 February 2014).

12
PSNO: Predicting Cysteine S-Nitrosylation Sites by
Incorporating Various Sequence-Derived Features
into the General Form of Chou’s PseAAC
Jian Zhang, Xiaowei Zhao, Pingping Sun and Zhiqiang Ma
Abstract: S-nitrosylation (SNO) is one of the most universal reversible post-translational modifications involved in many biological processes. Malfunction or dysregulation of SNO leads to a series of severe diseases, such as developmental abnormalities and various diseases. Therefore, the identification of SNO sites (SNOs) provides insights into disease progression and drug development. In this paper, a new bioinformatics tool, named PSNO, is proposed to identify SNOs from protein sequences. Firstly, we explore various promising sequence-derived discriminative features, including the evolutionary profile, the predicted secondary structure and the physicochemical properties. Secondly, rather than simply combining the features, which may bring about information redundancy and unwanted noise, we use the relative entropy selection and incremental feature selection approach to select the optimal feature subsets. Thirdly, we train our model by the technique of the k-nearest neighbor algorithm. Using both informative features and an elaborate feature selection scheme, our method, PSNO, achieves good prediction performance with a mean Mathews correlation coefficient (MCC) value of about 0.5119 on the training dataset using 10-fold cross-validation. These results indicate that PSNO can be used as a competitive predictor among the state-of-the-art SNOs prediction tools. A web-server, named PSNO, which implements the proposed method, is freely available at http://59.73.198.144:8088/PSNO/.
Reprinted from Int. J. Mol. Sci. Cite as: Zhang, J.; Zhao, X.; Sun, P.; Ma, Z. PSNO: Predicting Cysteine S-Nitrosylation Sites by Incorporating Various Sequence-Derived Features into the General Form of Chou’s PseAAC. Int. J. Mol. Sci. 2014, 15, 11204-11219.
1. Introduction
S-nitrosylation (SNO) is one of the most ubiquitous post-translational modifications (PTMs) involving the covalent interaction of nitric oxide with the thiol group of cysteine residues [1]. Many lines of evidence have suggested that S-nitrosylation sites (SNOs) play key roles in providing proteins with structural and functional diversity, as well as in regulating cellular plasticity and dynamics. Malfunction or dysregulation of SNOs leads to a series of severe diseases [2], including developmental abnormalities and various diseases, such as cancer [3], Parkinson’s [4], Alzheimer’s [5] and amyotrophic lateral sclerosis [6]. Therefore, detecting possible SNO substrates and their corresponding exact sites is crucial for understanding the mechanisms of the biological processes of these diseases and promising great possibilities as effective therapeutic targets or diagnostic markers.
Several biochemical methodologies, including absorbance detection [7], colorimetric assays [8] and fluorescent assays [8,9], have been developed to identify SNOs. Compared with expensive and time-consuming biochemical experiments, computational methods are attracting more and more attention, due to their convenience and efficiency.

13
In 2001, Jaffrey made the first attempt to develop a biotin-switch technique (BST) for the large-scale detection of SNO substrates [10]. The BST includes three principal steps: (i) the methylthiolation of free protein thiols; (ii) the reduction of SNO bonds on Cys residues with ascorbate; and (iii) the ligation of thiols using N-[6-(Biotinamido)hexyl]-3'-(2'-pyridyldithio) propionamide (biotin-HPDP). Soon after that, Gross developed a predictor, named SNOSID [11]. This is a proteomic method, which identified endogenous and chemically-induced SNOs in proteins from tissues or cells. In 2009, Forrester explored a protein microarray-based approach using resin-assisted capture (RAC) to screen SNOs [12]. Compared with BST using a human embryonic kidney cell dataset, SNO-RAC outperformed it with higher sensitivity for proteins larger than ~100 kDa. Although these methods did make contributions to the development of the prediction of SNOs from different aspects, they were labor intensive and had a relatively low throughput.
Recent years have witnessed several computational methods that have been proposed in this field. Xue adopted a group-based prediction system for the prediction of kinase-specific SNOs and developed software named GPS-SNO (Group-based Prediction System) [13]. Li used a coupling pattern-based encoding scheme (CPR) and built a web server named CPR-SNO [14]. Xu introduced a position-specific amino acid propensity matrix to construct the predictor and built a free website, iSNO-pseudo-amino acid composition (PseAAC) [15]. As the iSNO-PseAAC treated all the proteins independently without taking into account any of their correlations, the following iSNO-AAPair incorporated some sequence correlation effects into the feature vector [16].
Each of the aforementioned methods has its own merit and does facilitate the development of this field. Although these computational models have been developed to predict SNOs, their accuracy is unsatisfactory, and they lack a detailed analysis of the features. Therefore, it is important to develop an efficient method for the site-specific detection of SNOs.
In this paper, we focus on the challenging problem of predicting SNOs based on primary sequence information. A novel method, PSNO, is proposed for differentiating SNOs from non-SNOs. Firstly, various informative sequence-derived features that effectively reflect the intrinsic characters of a given peptide are combined to construct informative features; Secondly, relative entropy selection and incremental feature selection are adopted to select the optimal feature subsets; Thirdly, we use k-nearest neighbor to identify SNOs based on the selected optimal feature subsets. In order to evaluate the proposed method with previous works fairly, 10-fold cross-validation is implemented on the widely-used low-similarity training dataset. The experimental results show that the proposed PSNO is a powerful computational tool for SNOs prediction. A web-server, named PSNO, that implements the proposed method is freely available at http://59.73.198.144:8088/PSNO/.
2. Results and Discussion
2.1. The Feature Selection Results
The output of the relative entropy selector was two lists: one was called the feature list, which sorted the features according to their importance to the class of samples; the other was called the coefficient list, which sorted the coefficient values in descending order (Table S1). In the coefficient value list, a feature with a larger index implied that it tended to play a more important

14
role in identifying SNOs. Such a list of ranked features would be used in the following IFS procedure for searching the optimal feature subset.
Based on the results of the relative entropy selector, 458 individual classifiers were built by adding features one by one from the top of the feature list to the bottom (Table S2). As shown in Figure 1, the mean MCC values reached the maximum when 57 features were provided.
Figure 1. The IFS curve of 458 features for the training dataset. The x-axis and y-axis indicates the mean Mathews correlation coefficient (MCC) and number of features, respectively. When the number of selected features is 57, the mean MCC reaches the maximum, 0.51194.
In this paper, 10-fold cross-validation was performed on the training dataset (731 SNOs and 810 non-SNOs). We obtained a mean accuracy of 68.85% using all the features with a sensitivity of 67.99%, a specificity of 69.63% and an MCC of 0.3759. Using 57 optimal features, our model produced 75.67% accuracy with 74.15% sensitivity, 77.04% specificity and an MCC of 0.5119. The results suggested that our feature selection approach successfully chose “good” features, as well as eliminated “bad” features.
2.2. Analysis of the Optimal Feature Set
To discover the different contributions of various types of features, we further investigated the distribution of each kind of feature in the final optimal feature subset. The results are shown in Figure 2. Of the 57 optimal features, 48 belonged to the evolutionary conservation score, three to the predicted secondary structure, six to the physicochemical properties, which indicated that all three types of features contribute to the prediction of protein SNOs. The detailed descriptions of the 57 optimal features are shown in the Table S3. In addition, evolutionary conservation scores accounted for the biggest part in differentiating SNOs from non-SNOs.

15
Figure 2. The distribution of each feature type in the final optimal feature subset. The x-axis and y-axis indicate the feature type and the number of selected features, respectively. Of the 57 optimal features, 48 belong to the evolutionary conservation score, three to the predicted secondary structure and six to the physicochemical properties.
As is well known, all biological species were developed starting from a very limited number of ancestral species. Evolution was an eternal process that impenetrated the whole history of life. The evolution of protein sequences involved the changes, insertions and deletions of single residues or peptides along with the entire development of proteins [17]. Although some similarities may be eliminated after a long time of evolution, the corresponding protein zones may still share some common attributes, because the functional sites of a protein always locate in the conservation zone [18]. This explains why evolutionary conservation scores occupy the biggest part of the optimal subset. In addition, the features within the top 10 features in the final optimal feature subsets contained seven evolutional profile features.
We also calculated different kinds of features accounting for the various proportions of the optimal feature subset (Figure 3). The blue blocks represented the percentage of the selected features accounting for the whole optimal feature subsets, and the red ones represented the percentage of the selected features accounting for the corresponding feature type. Although, within the final optimal feature subset, a few secondary structure features are selected, we cannot say that the secondary structure features are not tightly related to SNOs. Among all nine secondary structure features, three features were selected in the optimal feature subsets.

16
Figure 3. The proportion of each type of feature in the optimal feature subset. The x-axis and y-axis indicate the feature type and the proportion of the selected features, respectively. The blue blocks represent the percentage of the selected features accounting for the whole optimal feature subsets, and the red ones represent the percentage of the selected features accounting for the corresponding feature type.
2.3. Comparison of PSNO with Other Methods
In this section, we compare PSNO with GPS-SNO [13], iSNO-PseAAC [15] and iSNO-AAPair [16], which were all sequence-based prediction methods. As the iSNO-AAPair was built on a different dataset (1530 human and mouse proteins), we adopted the independent dataset to compare our PSNO with iSNO-AAPair. In order to reach a consensus assessment with GPS-SNO and iSNO-PseAAC, a 10-fold cross-validation was adopted here to examine the prediction quality. Listed in Table 1 are the corresponding results obtained by the aforementioned two methods on the same training dataset. As can be seen, the SN, ACC and MCC rates achieved by PSNO were obviously higher than those by GPS-SNO with different thresholds and iSNO-PseAAC. Although the GPS-SNO 1 achieved the highest SP value, the SN and MCC value was relatively low. It may be that when the threshold parameter was set at “high”, more non-SNOs tended to be correctly classified, while some SNOs were mistakenly identified as non-SNOs.
Listed in the Table S4 are the predicted results by PSNO for Xue’s independent dataset. As we can see from Table S4, of the 2302 SNOs, 2188 were successfully identified. The overall success rate was about 95.05%.
In order to assess the ability of the proposed PSNO for practical applications, we adopted Xu’s independent dataset containing 81 SNO and 100 non-SNO experimentally-verified peptides. Among the existing models for the prediction of the SNOs, the web server for the model proposed in [14] did not work, and the method in [19] had no web server at all. Therefore, the comparison was made among the following four methods: GPS-SNO, iSNO-PseAAC, iSNO-AAPair and ours,

17
PSNO. Table 2 summarizes the results of PSNO with the existing prediction methods for the four different metrics. Using the optimal 57 features, the SN, SP, ACC and MCC values produced by PSNO are 87.7%, 85.0%, 86.2% and 0.72, respectively, which are about 8.1%~43.2%, 0.9%~9.8%, 5.5%~24.6% and 0.09~0.44 higher than previous studies.
Table 1. The performance comparison of PSNO with other existing prediction methods on the training dataset. GPS, group-based prediction system.
Predictor SN (%) SP (%) ACC (%) MCC GPS-SNO 1 18.88 89.63 56.07 0.1210
GPS-SNO 2 28.04 81.98 56.39 0.1193
GPS-SNO 3 45.01 73.33 59.90 0.1915
iSNO-PseAAC 67.01 68.15 67.62 0.3515
PSNO 74.15 77.04 75.67 0.5119 1 The method proposed in [13] where the threshold parameter was set at “high”; 2 the method proposed in [13] where the threshold parameter was set at “medium”; 3 the method proposed in [13] where the threshold was set at “low”. SN, SP, ACC and MCC represented the sensitivity, specificity, accuracy and the Mathews correlation coefficient, respectively.
Table 2. Comparison of PSNO with the existing prediction methods via Xu’s independent dataset.
Predictor SN (%) SP (%) ACC (%) MCC GPS-SNO 1 44.5 81.0 64.7 0.28
iSNO-PseAAC 50.2 75.2 62.8 0.30
iSNO-AAPair 79.6 84.1 81.7 0.63
PSNO 87.7 85.0 86.2 0.72 1 The method proposed in [13] where the threshold parameter was set at “medium”. SN, SP, ACC and MCC represented the sensitivity, specificity, accuracy and the Mathews correlation coefficient, respectively.
In practical applications, the input should be entire protein sequences. To test the state-of-the-art web servers used for practical applications, our independent dataset (see Section 3.1) was used here. The predicted results are shown in Table 3. Our PSNO produced an MCC of 0.4475, which was about 14.22%~32.29% higher than previous studies.
Table 3. Comparison of PSNO with the existing prediction methods using our independent dataset. PseAAC, pseudo-amino acid composition.
Predictor SN (%) SP (%) ACC (%) MCC GPS-SNO 1 41.51 70.87 60.90 0.1244
iSNO-PseAAC 60.38 67.96 65.38 0.2722
iSNO-AAPair 66.04 66.02 66.03 0.3053
PSNO 79.25 67.96 71.79 0.4475 1 The method proposed in [13] where the threshold parameter was set at “medium”. SN, SP, ACC and MCC represented the sensitivity, specificity, accuracy and the Mathews correlation coefficient, respectively.

18
2.4. Implementation of PSNO Server
For the convenience of biology scientists, PSNO has been implemented as a free web server located at http://59.73.198.144:8088/PSNO/. Here, a step-by-step brief guide is given below to describe how to use it.
Step 1. Access the web server, and the home page is the default interface displayed (Figure 4). Click on the “Introduction” link to see a detailed description about the server, which includes the User’s Guide, “Input”, “Output”, “Limitation” and “Requirement”.
Step 2. You can either type or paste the query sequence into the text box in Figure 4. The query sequence should be in the FASTA format. The FASTA format sequence consists of a single initial line beginning with a symbol (“>”), followed by lines of sequence data. You can click on the “Example” link to see the example sequences. You are also required to provide a valid email address in the text box.
Step 3. Click on the “Query” button to submit the computation request. PSNO begins processing and the predicted probabilities of a site being an SNOs or non-SNOs will be sent to you through the email provided.
Figure 4. The home page of the PSNO web server.
3. Materials and Methods
3.1. Benchmark Datasets
In order to reach a consensus assessment with previous studies [13,15,16], four datasets were used in this paper. The training dataset used in this paper was derived from dbSNO (http://dbsno.mbc.nctu.edu.tw), which integrated the experimentally verified cysteine SNOs from different species [20]. The training dataset contained 731 experimentally-verified SNOs and 810 experimentally verified non-SNOs from 438 randomly selected proteins, none of which had more

19
than 40% similarity to any other. The peptide segments for SNOs and non-SNOs could be formulated by:
(1)
where R−ξ and Rξ represented the ξ-th downstream and upstream residues from cysteine (C), respectively. P represented the peptide being either an SNO peptide or a non-SNO peptide. To test our method, as well as to reach a consensus assessment with previous investigators [13,15,16], ξ was set as 10 to compile the training dataset. If the upstream or downstream for a cysteine was less than 10, the lacking residues would be filled with dummy code X.
Xue’s independent dataset [13,15] consisted of 461 experimentally-verified nitrosylated proteins from published literature or the UniProt database (http://www.uniprot.org/). All of these proteins are clustered with a threshold of less than 40% identity by CD-HIT (Cluster Database at High Identity with Tolerance) [21]. After using the same technique mentioned above, 2302 SNOs are compiled from the 461 nitrosylated proteins. None of these 2302 SNOs occurred in the training dataset. In [16], Xu developed a public independent dataset (81 SNOs and 100 non-SNOs). The corresponding nitrosylated proteins and sequences were taken from dbSNO and UniProt, respectively.
In practical applications, the input should be entire protein sequences. To test the state-of-the-art web servers used for practical applications, we collected a new independent dataset by extracting the experimental-verified 20 nitrosylated proteins from dbSNO. None of them occurred in the training dataset. After compiling based on the same technique, 53 SNOs and 103 non-SNOs are obtained from the 20 nitrosylated proteins. The sequences of these 20 proteins, as well as SNOs (red) and non-SNOs (blue) are freely available at our PSNO web server. Table 4 summarizes the detailed compositions of above-mentioned four datasets.
Table 4. Detailed compositions of the four datasets.
Dataset Proteins Peptides SNOs Non-SNOs Training dataset 438 1541 731 810
Xue’s independent dataset 461 2302 2302 0
Xu’s independent dataset - 181 81 100
Our independent dataset 20 156 53 103
“-” The paper [16] makes no mention.
3.2. Sample Formulation and Feature Construction
In order to build a powerful protein system, the first thing was to represent the sequences with proper and effective mathematical expressions, which can reflect the intrinsic correction with the target to be predicted. In this study, we incorporated sequence-derived features into pseudo-amino acid composition (PseAAC) to represent the sample of a target protein. The PseAAC method had been widely used in bioinformatics, such as identifying proteins attributes [22,23], predicting protein structures [24,25] and predicting protein classes [26,27]. According to a recent review [28], the general form of PseAAC for a protein could be formulated as:
(2)
( 1) 2 1 1 2 ( 1)... ...P R R R R CR R R R� � � �� � � � � � � � � ��
1 2[ , ... , , ... , ]TuP � � � ���

20
where T was a transpose operator and the ψ1, ψ2 … depended on how to extract the desired information from the protein sequence of P. Here, several sequence-derived features were explored to distinguish the SNOs and non-SNOs. These features included evolutionary conservation scores, the predicted secondary structure and physicochemical properties.
3.2.1. Features of Evolutionary Conservation Scores
Evolutionary conservation scores had been widely used by the investigators to predict various attributes of proteins, such as predicting the protein subcellular location [29], identifying the subnuclear protein location [30] and identifying the protease family [31]. To incorporate evolutionary conservation scores, PSSM (Position-specific Scoring Matrix) was generated by the program “blastpgp” (PSIBLAST) [32], which was used to search the Swiss-Prot database (released on 15 May 2011; http://www.ebi.ac.uk/swissprot/) through 3 iterations (−j 3) and an e-value threshold of 0.0001 (−h 0.0001) for multiple sequence alignment against the protein, P. According to [33], the sequence evolution information of protein P with L amino acid residues could be expressed by a 20 × L matrix, as given by:
(3)
where Ei,j represented the score of the amino acid in the i-th position of the sequence that was being changed to amino acid type j (j = 1, 2, …, 20) during the evolutionary process.
PSSM scores were generally displayed as positive or negative integers. Positive scores (ratio > 0) indicated that the given amino acid substitution exceeded the expected frequency, suggesting that this substitution was surprisingly favored in the alignment than expected by chance, while negative scores (ratio < 0) indicated the opposite; that the frequency occurred less than the expected frequency, suggesting that the substitution was not favored.
The preference of evolutionary conservation in SNOs and non-SNOs were calculated and displayed in a heat map (Figure 5). In this figure, amino acids were sorted in both the x-axis and y-axis. The color palette from black to yellow indicated a growing preference for evolutionary conservation in SNOs and non-SNOs. The yellow color indicated the higher probability of the appearance of evolutionary conservation, while the black color meant less appearance. For instance, the substitution of C/H (x-axis/y-axis) was black, while the H/C (x-axis/y-axis) was yellow in SNOs, which suggested that the mean probabilities (or tendency) for His being substituted by Cys was higher than that for Cys being substituted by His in the SNOs. In addition, the H/C of non-SNOs was red. This determined the mean probabilities (or tendency) for His being substituted by Cys in SNOs being higher than those in non-SNOs. Generally speaking, compared with non-SNOs, evolutionary-conserved sets were preferred to aggregate in SNOs, which indicated critical active sites or functional residues that may be required for other intermolecular interactions being abundant in these peptides.
1,1 1,2 1,20
2,1 2,2 2,20
,1 ,2 ,20
...
...
...
PSSM
L L L
E E EE E E
P
E E E
� �� �� � �� �� � �
����

21
Figure 5. The heat maps of the preference of evolutionary conservation in S-nitrosylation sites (SNOs) and non-SNOs. The yellow color indicates the higher probability of appearance of evolutionary conservation, while the black color indicates less appearance.
In order to make the descriptor uniformly cover the peptide, we used the elements in the above equation for PSSM (Equation (3)) to define a new matrix, MPSSM, as formulated by:
(4)
where the value of equaled the sum of amino acid type i being changed to amino acid type j
in above-mentioned matrix PPSSM. In summary, 400 features were obtained to construct features of evolutionary conservation scores.
3.2.2. Features of Predicted Secondary Structure
Consider the fact that proteins with low sequence similarity, but in the same structural class, are likely to share high similarity in their corresponding secondary structural elements. Therefore, it would be useful to encode the protein sequences by taking into account the secondary structure information. In this study, several predicted secondary structure-based features were introduced to further improve low-similarity protein prediction accuracy. In this work, PSIPRED [34] was adopted to explore the secondary structure of a query protein sequence. The outputs of PSIPRED were encoded in terms of “C” for coil, “H” for helix and “E” for strand. The total number, average length and composition percent of C, H and E segments were calculated and constructed for the predicted secondary structure features.
SNO sites
A R N D C Q E G H I L K M F P S T W Y VARNDCQEGHILKMFPST
WYV
non-SNO sites
A R N D C Q E G H I L K M F P S T W Y VARNDCQEGHILKMFPST
WYV
-2
-1.5
-1
-0.5
0
0.5
1
1.5
x 10-12
1,1 2,1 20,1
1,2 2,2 20,2
1,20 2,20 20,20
...
...
...
PSSM
E E E
E E EM
E E E
� �� �� � �� �� � �
� � �� � �
� � �
����
���
,i jE�

22
These features were defined as follows:
(5)
(6)
(7)
where α = {H,E,C}, is the sum of the secondary structure of type α in the peptide.is the sum of segments of type α in the peptide. As a result, 3 + 3 + 3 = 9 features were
obtained to construct the predicted secondary structure features.
3.2.3. Features of Physicochemical Properties
Forty nine selected physical chemical, energetic and conformational properties, which have been observed to be widely used in pre-works [29,35,36], were used here. More detailed descriptions can be found at http://www.cbrc.jp/~gromiha/fold_rate/property.html. For each sequence, 49 properties values were firstly calculated by taking the sum of each property value over the whole residues and then divided by the length of the sequence. In this encoding scheme, a peptide was encoded by a 49-dimensional vector.
3.3. The Relative Entropy Selection
Commonly, the combination of various features would bring more informative features to the classifier. Nevertheless, some “bad” features were also added and became the unwanted noise. This noise, which was redundant with other features, may deteriorate the performance of learning algorithms and decrease the generalization power of the learned classifiers [37]. In order to get rid of the related or noisy feature, the feature selection approach for the optimal subset of features from a high-dimensional feature space was a critical job in machine learning. Relative entropy selection (i.e., Kullback–Leibler divergence) [38] was proven to be a powerful method to identify those features that were the most useful in describing the essential differences among the possible classes. In this algorithm, relative entropy can be defined the as:
DKL(P||Q) + DKL(Q||P) (8)
where P and Q are the conditional probability density function of a feature under two different classes; DKL(P||Q) is the K–L divergence of Q from P and DKL(Q||P) was the K–L divergence of P from Q. After the calculation, we got a feature list, L:
L = {f1, f2, f3,…, fi, …}and i = {1,2,3…N} (9)
In this feature list, L, the index, i, of each feature indicated the importance of fi to the class of the sample.
_Total number� ���
_Average lengthsegment�
�
�� ��
_Composition percentH E C�
��
� ��
� � ���
segment��

23
3.4. Incremental Feature Selection
Through the relative entropy selection, we obtained the ranked feature list. In order to determine which features should be selected for the optimal feature set for our model, the incremental feature selection (IFS) procedure [19] was adopted here to search for a good feature subset involving finding those features that were highly correlated with the decision features, but that are uncorrelated with each other.
During the IFS procedure, we added the feature in the ranked feature list one by one from the top to the bottom. After a feature had been added, a new feature subset was composed. For each new feature subset, a classifier was built based on the new feature subset using 10-fold cross-validation on the training dataset. As a result, 458 individual classifiers were constructed for the 458 feature subsets. By doing so, a table named IFS, with one column for the feature index and the other column for the prediction performance of each individual classifier, was obtained. An IFS curve was drawn to identify the best prediction performance, as well as the corresponding optimal feature subsets.
3.5. K-Nearest Neighbor Algorithm
The k-nearest neighbor algorithm (KNN) is quite popular in pattern recognition and machine learning. According to the KNN algorithm [39], the query sample would be assigned to the subset represented by its k-nearest neighbors. In this study, if the majority of the k-nearest neighbors of the query sample is a positive sample, this means that it is an SNO site. Otherwise, the query sample is regarded as a negative one. There are many different distances to measure the nearest neighbors for the KNN algorithm, such as the Hamming distance [40], Euclidean distance [40] and the Mahalanobis distance [41]. In order to build a KNN model, we tested different k-values from 3 to 19, as well as various different definitions. The best performance was achieved with K = 9 using the Euclidean distance.
3.6. Assessment of Prediction Accuracy
Four routinely used evaluation indexes were adopted in this paper, i.e., sensitivity (SN), specificity (SP), accuracy (ACC) and the Mathews correlation coefficient (MCC).
(10)
(11)
(12)
(13
)
where TP, TN, FP and FN were the abbreviations of true positives, true negatives, false positives and false negatives. In this paper, MCC was used as the major evaluation criteria to evaluate the
TP TNACCTP TN FP FN
��
� � �
TPSNTP FN
��
TNSPTN FP
��
( )( )( )( )TP TN FP FNMCC
TP FN TP FP TN FP TN FN� � �
�� � � �

24
performance of the proposed approach as the positive and negative samples in the training dataset were imbalanced.
3.7. Cross-Validation Test
In statistical prediction, the independent dataset, sub-sampling (k-fold cross-validation) and jackknife analysis (leave-one-out) are the three cross-validation methods that are often used to assess a prediction tool for its effectiveness in practical application. In order to reach a consensus assessment with previous studies [13,15,16], we used the same 10-fold cross-validation to examine the prediction performance as done by many studies for SNOs prediction. Firstly, the dataset was randomly divided into ten equal subsets; then, nine subsets were used for training and the remaining one for testing. The procedure was repeated 10 times, and the final performance was calculated by averaging over 10 testing sets. The system architecture of the proposed model is illustrated in Figure 6.
Figure 6. The system architecture of the proposed model. Three different types of sequence-derived features, i.e., evolutionary conservation, secondary structure and physicochemical properties, are generated and constructed as the feature space. Relative entropy selection and the incremental feature selection (IFS) procedure are adopted to select the optimal feature subset. The final results are obtained by using 10-fold cross-validation based on the k-nearest neighbor (KNN) and the selected optimal feature subsets.
4. Conclusions
In this paper, we present a novel method named PSNO based on sequence-derived features and effective feature selection techniques to identify SNOs. The PSNO model achieves a promising performance and outperforms many other prediction tools. We ascribe the excellent performance of

25
our predictor PSNO to two aspects. The first aspect is the informativeness of the feature vector in our model in representing proteins. The feature vector in this study includes an evolutionary profile, a secondary structure and physicochemical properties. However, rich information also brings the enlargement of the dimension and worsening of the predictor, which needs a proper feature selection strategy. Therefore, the second aspect is the effectiveness of relative entropy selection, followed by the IFS procedure. By means of powerful feature selection, an optimal set of 57 features, which contribute significantly to the prediction of SNOs, are selected. With the 57 optimal features selected, our predictor achieves an overall accuracy of 75.67% and an MCC of 0.5119 on a training dataset using 10-fold cross-validation. Theoretically, the protein structures can bring rich information to construct powerful prediction models compared to simple sequences. However, the sequence-based prediction is an alternative to the structure-based prediction in the absence of structures. As a result of the completion of whole-genome sequencing projects, the sequence-structure gap is rapidly increasing. Thus, it would be a powerful prediction tool to identify SNOs for newfound proteins without structure information. For the convenience of biology scientists, the proposed PSNO has been implemented as a web server and is freely available.
Acknowledgments
This work was supported by the Fundamental Research Funds for the Central Universities (Grant No. 12QNJJ005, 14QNJJ029), the Postdoctoral Science Foundation of China (Grant No. 2014M550166, 111900166), and the Research Fund for the Doctoral Program of Higher Education of China (Grant No. 20130043110016).
Author Contributions
J.Z. conceived the idea of this research and was in charge of the PSNO implementation. X.W.Z. and P.P.S. performed the research including data collection, test and analysis. P.P.S. and Z.Q.M. optimized the research and participated in the development and validation of the Web server. X.W.Z. suggested extension and modifications to the research. Z.Q.M. supervised the whole research and revised the manuscript critically. All authors have read and approved the final manuscript.
Conflicts of Interest
The authors declare no conflict of interest.
References
1. Foster, M.W.; Douglas, T.H.; Jonathan, S.S. Protein S-nitrosylation in health and disease: A current perspective. Trends Mol. Med. 2009, 15, 391–404.
2. Foster, M.W.; Timothy, J.M.; Jonathan, S.S. S-nitrosylation in health and disease. Trends Mol. Med. 2003, 9, 160–168.
3. Aranda, E.; López-Pedrera, C.; de La Haba-Rodriguez, R.J.; Rodriguez-Ariza, A. Nitric oxide and cancer: The emerging role of S-nitrosylation. Curr. Mol. Med. 2012, 12, 50–67.

26
4. Uehara, T.; Nakamura, T.; Yao, D.; Shi, Z.Q.; Gu, Z.; Ma, Y.; Lipton, S.A. S-nitrosylated protein-disulphide isomerase links protein misfolding to neurodegeneration. Nature 2006, 441, 513–517.
5. Nakamura, T.; Cieplak, P.; Cho, D.H.; Godzik, A.; Lipton, S.A. S-nitrosylation of Drp1 links excessive mitochondrial fission to neuronal injury in neurodegeneration. Mitochondrion 2006, 10, 573–578.
6. Schonhoff, C.M.; Matsuoka, M.; Tummala, H.; Johnson, M.A.; Estevéz, A.G.; Wu, R.; Mannick, J.B. S-nitrosothiol depletion in amyotrophic lateral sclerosis. Proc. Natl. Acad. Sci. USA 2006, 103, 2404–2409.
7. Lindermayr, C.; Saalbach, G.; Durner, J. Proteomic identification of S-nitrosylated proteins in Arabidopsis. Plant Physiol. 2005, 137, 921–930.
8. Cook, J.A.; Kim, S.Y.; Teague, D.; Krishna, M.C.; Pacelli, R.; Mitchell, J.B.; Wink, D.A. Convenient colorimetric and fluorometric assays for S-nitrosothiols. Anal. Biochem. 1996, 238, 150–158.
9. Gaston, B. Nitric oxide and thiol groups. Biochim. Biophys. Acta 1999, 1411, 323–333. 10. Jaffrey, S.R.; Snyder, S.H. The biotin switch method for the detection of S-nitrosylated
proteins. Sci. Signal. 2001, 2001, doi:10.1126/stke.2001.86.pl1. 11. Hao, G.; Derakhshan, B.; Shi, L.; Campagne, F.; Gross, S.S. SNOSID, a proteomic method
for identification of cysteine S-nitrosylation sites in complex protein mixtures. Proc. Natl. Acad. Sci. USA 2006, 103, 1012–1017.
12. Forrester, M.T.; Thompson, J.W.; Foster, M.W.; Nogueira, L.; Moseley, M.A.; Stamler, J.S. Proteomic analysis of S-nitrosylation and denitrosylation by resin-assisted capture. Nat. Biotechnol. 2009, 27, 557–559.
13. Xue, Y.; Liu, Z.; Gao, X.; Jin, C.; Wen, L.; Yao, X.; Ren, J. GPS-SNO: Computational prediction of protein S-nitrosylation sites with a modified GPS algorithm. PLoS One 2010, 5, e11290.
14. Li, Y.X.; Yuan, H.S.; Ling, J.; Nai, Y.D. An efficient support vector machine approach for identifying protein S-nitrosylation sites. Protein Pept. Lett. 2011, 18, 573–587.
15. Xu, Y.; Ding, J.; Wu, L.Y.; Chou, K.C. iSNO-PseAAC: Predict cysteine S-nitrosylation sites in proteins by incorporating position specific amino acid propensity into pseudo amino acid composition. PLoS One 2013, 8, e55844.
16. Xu, Y.; Shao, X.J.; Wu, L.Y.; Deng, N.Y.; Chou, K.C. iSNO-AAPair: Incorporating amino acid pairwise coupling into PseAAC for predicting cysteine S-nitrosylation sites in proteins. PeerJ 2013, 1, e171.
17. Chou, K.C.; Shen, H.B. Large-Scale plant protein subcellular location prediction. J. Cell. Biochem. 2007, 100, 665–678.
18. Chou, K.C.; Chun, T.Z. Prediction of protein structural classes. Crit. Rev. Biochem. Mol. Biol. 1995, 30, 275–349.
19. Li, B.Q.; Hu, L.L.; Niu, S.; Cai, Y.D.; Chou, K.C. Predict and analyze S-nitrosylation modification sites with the mRMR and IFS approaches. J. Proteomics 2012, 75, 1654–1665.

27
20. Chen, Y.J.; Ku, W.C.; Lin, P.Y.; Chou, H.C.; Khoo, K.H.; Chen, Y.J. S-alkylating labeling strategy for site-specific identification of the S-nitrosoproteome. J. Proteome Res. 2010, 9, 6417–6439.
21. Li, W.; Godzik, A. Cd-hit: A fast program for clustering and comparing large sets of protein or nucleotide sequences. Bioinformatics 2006, 22, 1658–1659.
22. Lin, H.; Ding, H.; Guo, F.B.; Zhang, A.Y.; Huang, J. Predicting subcellular localization of mycobacterial proteins by using Chou’s pseudo amino acid composition. Protein Pept. Lett. 2008, 15, 739–744.
23. Nanni, L.; Lumini, A.; Gupta, D.; Garg, A. Identifying bacterial virulent proteins by fusing a set of classifiers based on variants of Chou’s pseudo amino acid composition and on evolutionary information. IEEE/ACM Trans. Comput. Biol. Bioinform. (TCBB) 2012, 9, 467–475.
24. Zou, D.; He, Z.; He, J.; Xia, Y. Supersecondary structure prediction using Chou’s pseudo amino acid composition. J. Comput. Chem. 2011, 32, 271–278.
25. Sahu, S.S.; Panda, G. A novel feature representation method based on Chou’s pseudo amino acid composition for protein structural class prediction. Comput. Biol. Chem. 2010, 34, 320–327.
26. Qiu, J.D.; Huang, J.H.; Shi, S.P.; Liang, R.P. Using the concept of chous pseudo amino acid composition to predict enzyme family classes: An approach with support vector machine based on discrete wavelet transform. Protein Pept. Lett. 2010, 17, 715–722.
27. Zhou, X.B.; Chen, C.; Li, Z.C.; Zou, X.Y. Using Chou’s amphiphilic pseudo-amino acid composition and support vector machine for prediction of enzyme subfamily classes. J. Theor. Biol. 2007, 248, 546–551.
28. Chou, K.C. Some remarks on protein attribute prediction and pseudo amino acid composition. J. Theor. Biol. 2011, 273, 236–247.
29. Xie, D.; Li, A.; Wang, M.; Fan, Z.; Feng, H. LOCSVMPSI: A web server for subcellular localization of eukaryotic proteins using SVM and profile of PSI-BLAST. Nucleic Acids Res. 2005, 33, W105–W110.
30. Mundra, P.; Kumar, M.; Kumar, K.K.; Jayaraman, V.K.; Kulkarni, B.D. Using pseudo amino acid composition to predict protein subnuclear localization: Approached with PSSM. Pattern Recognit. Lett. 2007, 28, 1610–1615.
31. Chou, K.C.; Shen, H.B. ProtIdent: A web server for identifying proteases and their types by fusing functional domain and sequential evolution information. Biochem. Biophys. Res. Commun. 2008, 376, 321–325.
32. Qiu, W.R.; Xiao, X.; Chou, K.C. iRSpot-TNCPseAAC: Identify recombination spots with trinucleotide composition and pseudo amino acid components. Int. J. Mol. Sci. 2014, 15, 1746–1766.
33. Altschul, S.F. Evaluating the statistical significance of multiple distinct local alignments. In Theoretical and Computational Methods in Genome Research; Springer US: New York, NY, USA, 1997; pp. 1–14.
34. McGuffin, L.J.; Bryson, K.; Jones, D.T. The PSIPRED protein structure prediction server. Bioinformatics 2000, 16, 404–405.

28
35. Gromiha, M.M.; Selvaraj, S. Importance of long-range interactions in protein folding. Biophys. Chem. 1999, 77, 49–68.
36. Gromiha, M.M. A statistical model for predicting protein folding rates from amino acid sequence with structural class information. J. Chem. Inf. Model. 2005, 45, 494–501.
37. Qian, J.; Miao, D.Q.; Zhang, Z.H.; Li, W. Hybrid approaches to attribute reduction based on indiscernibility and discernibility relation. Int. J. Approx. Reason. 2011, 52, 212–230.
38. Johnson, D.H.; Sinanovic, S. Symmetrizing the Kullback-Leibler Distance; Technical Report for Computer and Information Technology; Rice University: Houston, TX, USA, 2001.
39. Keller, J.M.; Michael, R.G.; James, A.G. A fuzzy k-nearest neighbor algorithm. Syst. Man Cybern. IEEE Trans. 1985, 4, 580–585.
40. Mardia, K.V.; John, T.K.; John, M.B. Multivariate Analysis; Academic Press: London, UK, 1980.
41. Read, C.B.; Samuel, K.; Norman, L.J. Encyclopedia of Statistical Sciences; Wiley: Hoboken, NJ, USA, 1982.
29
iRSpot-TNCPseAAC: Identify Recombination Spots
with Trinucleotide Composition and Pseudo Amino
Acid Components
Wang-Ren Qiu, Xuan Xiao and Kuo-Chen Chou
Abstract: Meiosis and recombination are the two opposite aspects that coexist in a DNA system. As a driving force for evolution by generating natural genetic variations, meiotic recombination plays a very important role in the formation of eggs and sperm. Interestingly, the recombination does not occur randomly across a genome, but with higher probability in some genomic regions called “hotspots”, while with lower probability in so-called “coldspots”. With the ever-increasing amount of genome sequence data in the postgenomic era, computational methods for effectively identifying the hotspots and coldspots have become urgent as they can timely provide us with useful insights into the mechanism of meiotic recombination and the process of genome evolution as well. To meet the need, we developed a new predictor called “iRSpot-TNCPseAAC”, in which a DNA sample was formulated by combining its trinucleotide composition (TNC) and the pseudo amino acid components (PseAAC) of the protein translated from the DNA sample according to its genetic codes. The former was used to incorporate its local or short-rage sequence order information; while the latter, its global and long-range one. Compared with the best existing predictor in this area, iRSpot-TNCPseAAC achieved higher rates in accuracy, Mathew’s correlation coefficient, and sensitivity, indicating that the new predictor may become a useful tool for identifying the recombination hotspots and coldspots, or, at least, become a complementary tool to the existing methods. It has not escaped our notice that the aforementioned novel approach to incorporate the DNA sequence order information into a discrete model may also be used for many other genome analysis problems. The web-server for iRSpot-TNCPseAAC is available at http://www.jci-bioinfo.cn/iRSpot-TNCPseAAC. Furthermore, for the convenience of the vast majority of experimental scientists, a step-by-step guide is provided on how to use the current web server to obtain their desired result without the need to follow the complicated mathematical equations.
Reprinted from Int. J. Mol. Sci. Cite as: Qiu, W.-R.; Xiao, X.; Chou, K.-C. iRSpot-TNCPseAAC: Identify Recombination Spots with Trinucleotide Composition and Pseudo Amino Acid Components. Int. J. Mol. Sci. 2014, 15, 1746-1766.
1. Introduction
Meiosis and recombination are two indispensible aspects for cell reproduction and growth (Figure 1). The former is a special type of cell division by which the genome is divided in half to generate daughter cells for participating in sexual reproduction, while the latter is to produce single-strand ends that can invade the homologous chromosome [1].

30
Figure 1. An illustration to show the process of meiosis and recombination in a DNA system. Adapted from [2].
Recombination is initiated by double-strand breaks (or broken DNA ends); defecting in meiosis may lead to male infertility [3–5]. Meiotic recombination ensures accurate chromosome segregation during the first meiotic division and provides a mechanism to increase genetic heterogeneity among the meiotic products. Accordingly, identification of recombination spots may provide very useful information for in-depth understanding the reproduction and growth of cells.
In the past decades, a lot of global mapping studies have been performed to map double-strand break sites on chromosomes [6–13]. The following findings were observed through these studies for the meiotic recombination events. (i) They generally concentrate in 1:2.5 kilobase regions; (ii) They do not occur randomly across the entire genome but with a higher rate in some regions and lower in others; the former is a so-called “hotspot” while the latter, “coldspot”; (iii) They do not share a consensus sequence pattern.
With the rapid increasing number of genome sequences, it is important to address the following problem. Given a genome sequence, how can we predict which part of it is the hotspot for recombination, and which part is not?
Based on the nucleotide sequence contents, Liu et al. [14] proposed a computational method to deal with this problem. However, in their method no sequence-order effect whatsoever was taken into account, and, hence, its prediction power might be limited.
Actually, one of the most important, but also most difficult, problems in computational biology is how to formulate a biological sequence with a discrete model or a vector, yet still keep considerable sequence order information. This is as all the existing operation engines, such as covariance discriminant (CD) [15–20], neural network [21–23], support vector machine (SVM) [24–26], random forest [27,28], conditional random field [29], nearest neighbor (NN) [30,31], K-nearest neighbor (KNN) [32–34], OET-KNN (optimized evidence-theoretic k-nearest neighbors) [35–38], and Fuzzy K-nearest neighbor [39–43], can only handle vector, but not sequence,
DNA molecules
5’end resection
Double strand break
Strand invasion
Crossover
Noncrossover
31
samples. However, a vector defined in a discrete model may completely lose all the sequence-order information.
To avoid completely losing the sequence-order information for proteins, the pseudo amino acid composition [44,45] or Chou’s pseudo amino acid components (PseAAC) [46] was proposed. Ever since the concept of PseAAC was proposed in 2001 [44], it has penetrated into almost all the areas of computational proteomics, such as identifying cysteine S-nitrosylation sites in proteins [29], predicting bacterial virulent proteins [47], predicting antibacterial peptides [48], identifying bacterial secreted proteins [49], predicting supersecondary structure [50], predicting protein subcellular location [51–59], predicting membrane protein types [60,61], discriminating outer membrane proteins [62], identifying antibacterial peptides [48], identifying allergenic proteins [63], predicting metalloproteinase family [64], predicting protein structural class [65], identifying GPCRs (G protein-coupled receptors) and their types [66,67], identifying protein quaternary structural attributes [68,69], predicting protein submitochondria locations [70–73], identifying risk type of human papillomaviruses [74], identifying cyclin proteins [75], predicting GABA(A) receptor proteins [76], classifying amino acids [77], predicting the cofactors of oxidoreductases [78], predicting enzyme subfamily classes [79], detecting remote homologous proteins [80], analyzing genetic sequences [81], predicting anticancer peptides [82], among many others (see a long list of papers cited in the References section of [83]). Recently, the concept of PseAAC was further extended to represent the feature vectors of nucleotides [15], as well as other biological samples [84–86]. As it has been widely and increasingly used, recently two powerful soft-wares, called “PseAAC-Builder” [87] and “propy” [88], were established for generating various special Chou’s pseudo-amino acid compositions, in addition to the web-server “PseAAC” [89], built in 2008.
Encouraged by the success of introducing PseAAC for proteins, recently, Chen et al. [25] proposed the pseudo dinucleotide composition or PseDNC to represent DNA sequences for identifying the recombination spots by counting some sequence effects, remarkably improving the prediction results in comparison with those by Liu et al. [14], without including any sequence information. However, in PseDNC, only the correlations of dinucleotides along a DNA sequence were considered, and, hence, some important sequence order effects might be missed.
The present study was initiated in an attempt to incorporate the long-range or global correlations of trinucleotides along a DNA sequences in hope to further improve the prediction quality in indentifying the recombination spots.
As demonstrated in a series of recent publications [24,42,90–92] and summarized in a comprehensive review [83], to establish a really useful statistical predictor for a biological system, one needs to consider the following procedures: (i) construct or select a valid benchmark dataset to train and test the predictor; (ii) formulate the biological samples with an effective mathematical expression that can truly reflect their intrinsic correlation with the target to be predicted; (iii) introduce or develop a powerful algorithm (or engine) to operate the prediction; (iv) properly perform cross-validation tests to objectively evaluate the anticipated accuracy of the predictor; and (v) establish a user-friendly web-server for the predictor that is accessible to the public. Below, let us elaborate how to deal with these procedures one-by-one.

32
2. Results and Discussion
2.1. Benchmark Dataset
The benchmark dataset S used in this study was taken from Liu et al. [14], which contains 490 recombination hotspots and 591 recombination coldspots, as can be formulated by:
(1)
where subset S+ and S− are respectively for the hot and cold spots, while represents the symbol for “union” in the set theory. For reader’s convenience, the 490 DNA sequences in S+ and 591 sequences in S− are given in the Supplementary Information S1.
2.2. Formulate DNA Samples by Combining Trinucleotide Composition and Pseudo Amino Acid Components
Suppose a DNA sequence D with L nucleotides; i.e.,
D = N1N2N3N4N5N6N7 NL (2)
where
� �A (adenine), C (cytosine) G (guanine) T (thymine)iN � (3)
denotes the i-th (i = 1, 2, …, L) nucleotide in the DNA sequence. If the feature vector of the DNA sequence is formulated by its mononucleotide composition (MNC), we have:
D = f (A) f (C) f (G) f (T)
�
T
= f1(1) f2
(1) f3(1) f4
(1) �
��
T
(4)
where f1(1) = f (A) , f2
(1) = f (C) , f3(1) = f (G) , and f4
(1) = f (T) are the normalized occurrence
frequencies of adenine (A), cytosine (C), guanine (G), and thymine (T), respectively, in the DNA sequence; and the symbol T is the transpose operator. As we can see from Equation (4), all the sequence order information is missed if using MNC to represent a DNA sequence. If using the dinucleotide composition (DNC) to represent the DNA sequence, instead of the four components as shown in Equation (4), the corresponding feature vector will contain 4 × 4 = 16 components, as given below:
D = f (AA) f (AC) f (AG) f (AT) f (TT)
�
T
= f1(2) f2
(2) f3(2) f4
(2) f16(2)
���
T
(5)
where f1(2) = f (AA) is the normalized occurrence frequency of AA in the DNA sequence;
f2(2) = f (AC), that of AC; f3
(2) = f (AG) , that of AG; and so forth. If represented by the

33
trinucleotide composition (TNC), the corresponding feature vector will contain 34 4 4 4 64� � � � components, as given below:
D = f (AAA) f (AAC) f (AAG) f (AAT) f (TTT)
�
T
= f1(3) f2
(3) f3(3) f4
(3) f64(3)
���
T
(6)
where f1(3) = f (AAA) is the normalized occurrence frequency of AAA in the DNA sequence;
f2(3) = f (AAC), that of AAC; and so forth. Generally speaking, if a DNA sequence is represented
by the K-tuple nucleotide composition, the corresponding vector D for the DNA sequence will contain 4K components; i.e.,
D = f1(K ) f2
(K ) f3(K ) f4
(K ) f4K(K )
���
T
(7)
As we can see from Equations (5–7), with increasing the tuple number, although the base sequence-order information within a local or very short range could be gradually included, none of the global or long-range sequence-order information would be reflected by the formulation.
Actually, in computational proteomics, we have also faced exactly the same situation; i.e., although the dipeptide composition, tripeptide composition, and K-tuple peptide composition were used by many investigators to represent protein sequences by incorporating their local sequence order information [93–97], their global or long-range sequence order information still could not be reflected. As mentioned above, to deal with this kind of problems in proteomics, the concept of PseAAC [44,45] was introduced.
Stimulated by the PseAAC approach [44,45] in computational proteomics, below let us propose a novel feature vector to represent the DNA sequence (cf. Equation (2)) by combining its TNC (see Equation (2)) and the pseudo amino acid components of its translated protein chain.
As is well known, three nucleotides encode an amino acid (see Figure 2). Thus, according the conversion table from DNA codons to amino acids (Table 1), the DNA sequence in Equation (2) can be translated into a protein sequence expressed by:
P= A1A2A3 AL* (8)
with
Ai � 20 native amino acids{ }L* = Int L / 3{ }
���
�� (9)
where the symbol “Int” is an integer truncation operator meaning to take the integer part for the number in the brackets immediately after it.

34
Figure 2. A graph to show how a DNA codon of three nucleotides is converted to an amino acid. The characters in the first three rings from the center represent four bases in DNA, while those in the fourth ring represent the single-letter codes of the 20 native amino acids in protein. The symbol * means the “Stop” sign.
Table 1. The conversion code of the 64 trinucleotides in DNA to the 20 amino acids in protein.
Trinucleotide Amino acid Trinucleotide Amino acid
AAA Lys (K) GAA Glu (E) AAC Asn (N) GAC Asp (D) AAG Lys (K) GAG Glu (E) AAT Asn (N) GAT Asp (D) ACA
Thr (T)
GCA
Ala (A) ACC GCC ACG GCG ACT GCT AGA Arg (R) GGA
Gly (G) AGC Ser (S) GGC AGG Arg (R) GGG AGT Ser (S) GGT ATA
Ile (I) GTA
Val (V) ATC GTC ATG Met (M) GTG ATT Ile (I) GTT CAA Gln (Q) TAA Stop! CAC His (H) TAC Tyr (Y) CAG Gln (Q) TAG Stop! CAT His (H) TAT Tyr (Y) CCA
Pro (P)
TCA
Ser (S) CCC TCC CCG TCG CCT TCT

35
Table 1. Cont.
Trinucleotide Amino acid Trinucleotide Amino acid CGA
Arg (R)
TGA Stop! CGC TGC Cys (C) CGG TGG Trp (W) CGT TGT Cys (C) CTA
Leu (L)
TTA Leu (L) CTC TTC Phe (F) CTG TTG Leu (L) CTT TTT Phe (F)
Now, according to the formulation of Chou’s PseAAC approach [44,45], for the protein chain of Equation (8), we have:
* 1
1 11
* 2
2 21
* 3
3 31
* 1
1
1 ( , )* 11 ( , )* 2
( *)1 ( , )* 3
1 ( , )*
L
i ii
L
i ii
L
i ii
L
i ii
A AL
A AL
LA A
L
A AL� �
�
�
��
��
�
��
�
��
�
��
�
��
�� �� ��
�� �� ��� �� � �� ��
��� � �
���
�
�
�
�
(10)
where ( 1,2,3, , )k k� �� , ), ) is called the k-th tier correlation factor that reflects the sequence order
correlation between all the k-th most contiguous residues along a protein chain. In this study, the correlation function in Equation 10 is given by:
6 2
1
1( , ) ( ) ( )6i j n j n i
nA A H A H A
�
� � � �� (11)
where Hn(Aj ) (n=1,2, ,6) is the six physicochemical properties of amino acid Aj ; they are,
respectively, hydrophobicity, hydrophilicity, side-chain mass, pK1 (α-COOH), pK2 (NH3), and PI. Note that before substituting these physicochemical values into Equation (11), they were all subjected to a standard conversion as described by the following equation:
0 0
0
( )( )
SD( )n i n
n in
H A HH A
H�
� (12)
where Hn(Ai ) (n=1,2, ,6)is the n-thoriginal physicochemical property value for the amino acid A i as given in Table 2, the symbol < and > means taking the average of the quantity therein over
20 native amino acids, and SD means the corresponding standard deviation. Listed in Table 3 are the converted values obtained by Equation (12) that will have a zero mean value over the 20 native amino acids, and will remain unchanged if going through the same conversion procedure again.

36
Table 2. List of the original values of the six physical-chemical properties for each of the 20 native amino acids.
Amino Acid Hydro-phobicity a
H10
Hydro-philicity b
H20
Side-chain
Mass c H3
0
pK1 d H4
0 pK2
e H5
0 PI
f H6
0
A 0.62 −0.5 15 2.35 9.87 6.11 C 0.29 −1.00 47 1.71 10.78 5.02 D −0.90 3.00 59 1.88 9.60 2.98 E −0.74 3.00 73 2.19 9.67 3.08 F 1.19 −2.50 91 2.58 9.24 5.91 G 0.48 0.00 1 2.34 9.60 6.06 H −0.40 −0.50 82 1.78 8.97 7.64 I 1.38 −1.80 57 2.32 9.76 6.04 K −1.50 3.00 73 2.20 8.90 9.47 L 1.06 −1.80 57 2.36 9.60 6.04 M 0.64 −1.30 75 2.28 9.21 5.74 N −0.78 0.20 58 2.18 9.09 10.76 P 0.12 0.00 42 1.99 10.60 6.30 Q −0.85 0.20 72 2.17 9.13 5.65 R −2.53 3.00 101 2.18 9.09 10.76 S −0.18 0.30 31 2.21 9.15 5.68 T −0.05 −0.40 45 2.15 9.12 5.60 V 1.08 −1.50 43 2.29 9.74 6.02 W 0.81 −3.40 130 2.38 9.39 5.88 Y 0.26 −2.30 107 2.20 9.11 5.63 a Taken from [98]; b Taken from [99]; c Taken from any biochemistry text book; d Taken from [100] for C� -COOH; e Taken from [100] for NH3; f Taken from [101].
By combining the � correlation factors with the 64 components in TNC (see Equation (6)), the DNA sequence is formulated by:
� �1 2 64 64 1 64d d d d d �� �� TD �64 64 1 64d d d64 64 1 664 64 1 ��1 641 6
T (13)
where: (3)
64(3)
1 1
6464
(3)
1 1
, (1 64)
, (64 1 64 )
u
i ki k
uu
i ki k
f uf w
dw u
f w
�
�
�
� ��
� �
�
� �
�� ��
� ��� �� � � � ��
���
� �
� �
(14)
where w is the weight factor which is determined by optimizing the outcome as will be mentioned later. The rationale of using Equation (13) to represent the DNA sequence is that the local or short-range sequence order effect can be directly reflected via the occurrence frequencies of its 64 trinucleotides, while the global or long-range sequence order effect can be indirectly reflected

37
via the � pseudo amino acid components of its translated protein chain. As three nucleotides encode an amino acid, the above approach is both quite rational and natural.
Table 3. The corresponding values obtained by the standard conversion of Equation12 on the original values in Table 2.
Amino acid H1 H2 H3 H4 H5 H6
A 0.62 −0.15 −1.55 0.78 0.77 −0.10 C 0.29 −0.41 −0.52 −2.27 2.57 −0.64 D −0.90 1.67 −0.13 −1.46 0.24 −1.65 E −0.74 1.67 0.33 0.01 0.37 −1.61 F 1.19 −1.19 0.91 1.87 −0.48 −0.20 G 0.48 0.11 −2.00 0.73 0.24 −0.13 H −0.40 −0.15 0.62 −1.94 −1.01 0.65 I 1.38 −0.82 −0.19 0.63 0.55 −0.14 K −1.50 1.67 0.33 0.06 −1.15 1.56 L 1.06 −0.82 −0.19 0.82 0.24 −0.14 M 0.64 −0.56 0.39 0.44 −0.54 −0.29 N −0.78 0.22 −0.16 −0.03 −0.77 2.20 P 0.12 0.11 −0.68 −0.94 2.21 −0.01 Q −0.85 0.22 0.29 −0.08 −0.69 −0.33 R −2.53 1.67 1.23 −0.03 −0.77 2.20 S −0.18 0.27 −1.03 0.11 −0.65 −0.32 T −0.05 −0.10 −0.58 −0.18 −0.71 −0.36 V 1.08 −0.67 −0.65 0.49 0.51 −0.15 W 0.81 −1.65 2.17 0.92 −0.18 −0.22 Y 0.26 −1.08 1.43 0.06 −0.73 −0.34
2.3. Use Support Vector Machine as an Operation Engine
Support vector machine (SVM) has been widely to make classification prediction (see, e.g., [24,102–105]. The basic idea of SVM is to transform the input data into a high dimensional feature space and then determine the optimal separating hyperplane. A brief introduction about the formulation of SVM was given in [103,106]. Here, the DNA samples as formulated by Equation (13) were used as inputs for the SVM. Its software was downloaded from the LIBSVM package [107,108], which provided a simple interface. Due to this advantages, the users can easily perform classification prediction by properly selecting the built-in parameters C and . In order to maximize the performance of the SVM algorithm, the two parameters in the RBF kernel were preliminarily optimized through a grid search strategy in this study. To obtain the optimized parameters, the search function “SVMcgForClass” was downloaded from http://www.matlabsky.com.
The predictor obtained via the aforementioned procedures is called iRSpot-TNCPseAAC, where “i” means “identify”, “RSpot” means “Recombination Spots”, while TNCPseAAC means a combination of “Tri-Nucleotide Composition” and “Pseudo Amino Acid Components.”

38
To objectively evaluate the quality of a new predictor, one should use proper metrics [109] and rigorous cross-validation [83] to test it. Below, let us address these problems.
2.4. Four Different Metrics for Measuring the Prediction Quality
In literature, the following metrics are often used for examining the performance quality of a predictor:
Sn = TPTP+ FN
Sp = TNTN + FP
Acc = TP+TNTP+TN + FP+ FN
MCC =(TP�TN)� (FP� FN)
(TP+ FP)(TP+ FN)(TN + FP)(TN + FN)
�
�
�����
�
�����
(25)
where TP represents the number of the true positive; TN, the number of the true negative; FP, the number of the false positive; FN, the number of the false negative; Sn, the sensitivity; Sp, the specificity; Acc, the accuracy; MCC, the Mathew’s correlation coefficient. To most biologists, however, the four metrics as formulated in Equation (15) are not quite intuitive and easier-to-understand, particularly for the Mathew’s correlation coefficient. Here let us adopt the formulation proposed recently [25,29] based on the Chou’s symbol and definition [110]; i.e.,
1
1
1
1
1 1
NSnNNSpNN NAccN N
N NN N
MccN N N N
N
���
���
� �� �� �
� �� �� �
� � �� � �
�
� �
� �
�� �
�! "�
� # $�% &�! "� �
� �# $% & N
��
�
�������������� ! "� # $
% &��
(16)
where N � is the total number of the hotspot samples investigated while N �� the number of
the hotspot samples incorrectly predicted as coldspots; N � the total number of the coldspot samples investigated while N �
� the number of the coldspot samples incorrectly predicted as the
hotspots [111]. Now, it can be clearly seen from Equation (16) that when N�
+ = 0 meaning none of the hotspots
was incorrectly predicted to be a coldspot, we have the sensitivity Sn=1 . When N N� �� �
meaning that all the hotspots were incorrectly predicted to be the coldspots, we have the sensitivity Sn= 0. Likewise, when 0N �
� � meaning none of the coldspots was incorrectly predicted to be the
hotspot, we have the specificity 1Sp � ; whereas N N� �� � meaning all the coldspots were
incorrectly predicted as the hotspots, we have the specificity Sp= 0. When 0N N� �� �� � meaning
that none of hotspots in the positive dataset and none of the coldspots in the negative dataset was incorrectly predicted, we have the overall accuracy Acc=1 and MCC =1; when N N� �
� � and

39
N N� �� � meaning that all the hotspots in the positive dataset and all the coldspots in the negative
dataset were incorrectly predicted, we have the overall accuracy Acc= 0 and 1MCC � � ; whereas when / 2N N� �
� � and / 2N N� �� � we have Acc= 0.5 and MCC = 0 meaning no better than
random guess. As we can see from the above discussion based on Equation (16), the meanings of sensitivity, specificity, overall accuracy, and Mathew’s correlation coefficient have become much more intuitive and easier-to-understand.
It should be pointed out that the metrics as given in Equation (15) and Equation (16) are valid only for the single-label systems as in the current case. For the multi-label systems in which emergence has become increasingly frequent in cell’s molecular systems [112–118] and biomedical systems [43,119], a completely different set of metrics as defined in [109] is needed.
2.5. Evaluate the Anticipated Success Rates by Jackknife Tests
The following three cross-validation methods are often used in statistical prediction to evaluate the anticipated accuracy of a predictor: independent dataset test, subsampling (K-fold cross-validation) test, and jackknife test [120]. However, as elucidated by a review article [83], among the three methods, the jackknife test is deemed the least arbitrary and most objective as it can always yield a unique outcome for a given benchmark dataset, and hence has been increasingly used and widely recognized by investigators to examine the accuracy of various predictor [48,60,63,65,69,76,121,122]. Accordingly, in this study we also used the results obtained by jackknife tests to optimizing the uncertain parameters and to compare with the other predictors in this area.
3. Experimental Section
The results obtained with iRSpot-TNCPseAAC on the benchmark dataset S of Supplementary Information S1 by the jackknife test are given in Table 4, where for facilitating comparison the corresponding results by the iRSpot-PseDNC [25] on the same benchmark dataset are also given.
Table 4. A comparison of iRSpot-TNCPseAAC with the best existing method.
Predictor Test method Sn (%) Sp (%) Acc (%) MCC
iRSpot-PseDNC a Jackknife 73.06 89.49 82.04 0.638 iRSpot-KNCPseAAC b Jackknife 87.14 79.59 83.72 0.671
a From [25]; b This paper with 5� � , w=1.1, C = 32 and 0.5 � for the LIBSVM operation engine [107,108].
As we can clearly see from the table, the iRSpot-TNCPseAAC predictor is superior to iRSpot-PseDNC [25] in three of the four metrics as defined by Equation (16); i.e., it can yield higher accuracy Acc, higher Mathew’s correlation coefficient MCC, and higher sensitivity Sn. Therefore, it is anticipated that the new predictor will become a useful tool for identifying the recombination spots in DNA, or at the very least become a complementary tool to iRSpot-PseDNC, the best existing prediction method in this area.

40
4. Conclusions
The above fact has also proved that it is indeed a feasible and promising approach to extend the concept of pseudo amino acid composition [44,45,123] developed in computational proteomics to the area of computational genomics. As shown by Equation (13) and the related equations in defining its 64 �� components, each of the DNA samples investigated in this study was formulated by a combination of its trinucleotide composition (TNC) with the pseudo amino acid components (PseAAC) that were derived from the protein translated from the DNA sample according to its genetic codes. The former can better incorporate its local or short-rage sequence order information in comparison with the dinucleotide composition (DNC) used in iRSpot-PseDNC [25]; while the latter can incorporate its global or long-range sequence order effects in a more natural or logical manner. Accordingly, it is anticipated that the idea or approach by extending the Chou’s pseudo amino acid composition [44,45,123] for protein sequences to the pseudo oligonucleotide composition for DNA or RNA sequences may also be used to deal with many other genome analysis problems.
5. Web Server and User Guide
To enhance the value of its practical applications, a web-server for the iRSpot-TNCPseAAC predictor was established. Moreover, for the convenience of the vast majority of experimental scientists, here a step-to-step guide is provided for how to use the web server to get the desired results without the need to follow the mathematic equations that were presented just for the integrity in developing the predictor.
Step 1. Open the web server at http://www.jci-bioinfo.cn/iRSpot-TNCPseAAC and you will see the top page of the predictor on your computer screen, as shown in Figure 3. Click on the Read Me button to see a brief introduction about the iRSpot-TNCPseAAC predictor and the caveat when using it.
Figure 3. A semi-screenshot for the top page of the web-server iRSpot-TNCPseAAC at http://www.jci-bioinfo.cn/iRSpot-TNCPseAAC.
iRSpot-TNCPseAAC: identify recombination spots with trinucleotide composition and pseudo amino acid components
| Read Me | Supporting Information | Citation |
Enter the sequence of query DNA sequences in FASTA format (Example): the number of DNA sequences is limited at 100 or less for each submission. It will usually take about 10 seconds for each query DNA sequence.
Submit Clear
Or, enter your e-mail address and upload the batch input file (Batch-example). The predicted results will be sent to you by e-mail once completed.
Upload file: Your e-mail address:
Browser
Batch-submit
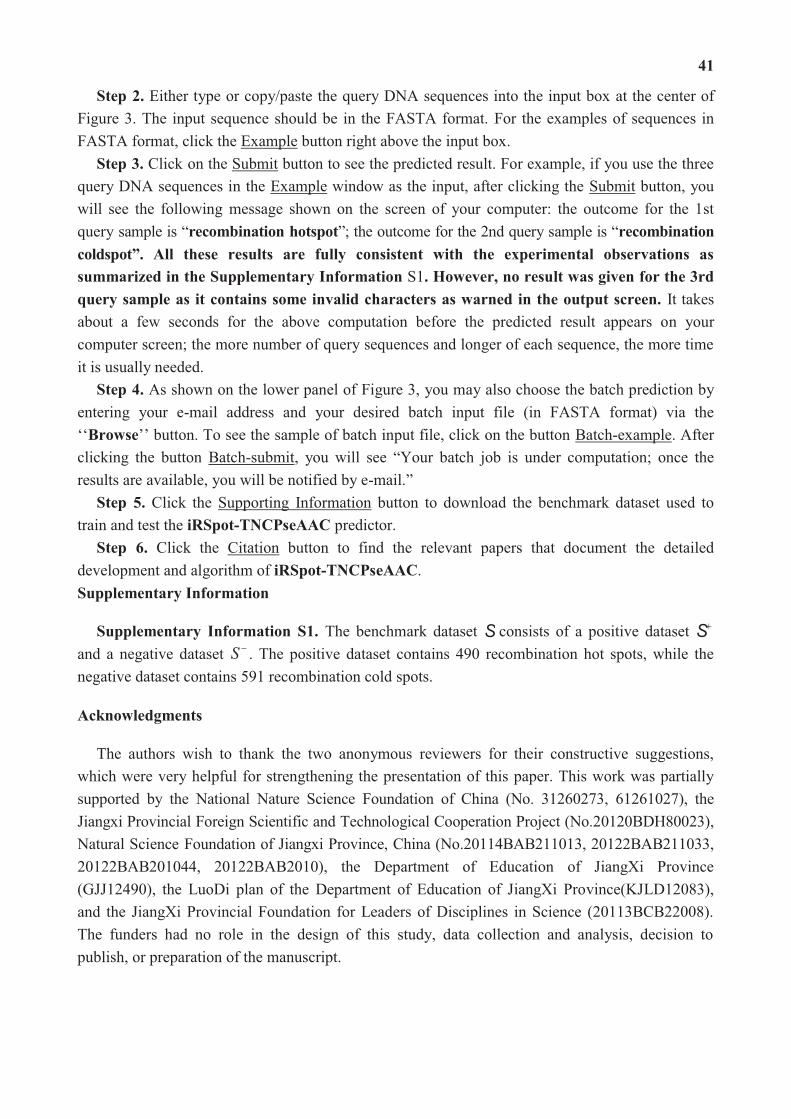
41
Step 2. Either type or copy/paste the query DNA sequences into the input box at the center of Figure 3. The input sequence should be in the FASTA format. For the examples of sequences in FASTA format, click the Example button right above the input box.
Step 3. Click on the Submit button to see the predicted result. For example, if you use the three query DNA sequences in the Example window as the input, after clicking the Submit button, you will see the following message shown on the screen of your computer: the outcome for the 1st query sample is “recombination hotspot”; the outcome for the 2nd query sample is “recombination
coldspot”. All these results are fully consistent with the experimental observations as
summarized in the Supplementary Information S1. However, no result was given for the 3rd
query sample as it contains some invalid characters as warned in the output screen. It takes about a few seconds for the above computation before the predicted result appears on your computer screen; the more number of query sequences and longer of each sequence, the more time it is usually needed.
Step 4. As shown on the lower panel of Figure 3, you may also choose the batch prediction by entering your e-mail address and your desired batch input file (in FASTA format) via the ‘‘Browse’’ button. To see the sample of batch input file, click on the button Batch-example. After clicking the button Batch-submit, you will see “Your batch job is under computation; once the results are available, you will be notified by e-mail.”
Step 5. Click the Supporting Information button to download the benchmark dataset used to train and test the iRSpot-TNCPseAAC predictor.
Step 6. Click the Citation button to find the relevant papers that document the detailed development and algorithm of iRSpot-TNCPseAAC. Supplementary Information
Supplementary Information S1. The benchmark dataset S consists of a positive dataset S+ and a negative dataset S � . The positive dataset contains 490 recombination hot spots, while the negative dataset contains 591 recombination cold spots.
Acknowledgments
The authors wish to thank the two anonymous reviewers for their constructive suggestions, which were very helpful for strengthening the presentation of this paper. This work was partially supported by the National Nature Science Foundation of China (No. 31260273, 61261027), the Jiangxi Provincial Foreign Scientific and Technological Cooperation Project (No.20120BDH80023), Natural Science Foundation of Jiangxi Province, China (No.20114BAB211013, 20122BAB211033, 20122BAB201044, 20122BAB2010), the Department of Education of JiangXi Province (GJJ12490), the LuoDi plan of the Department of Education of JiangXi Province(KJLD12083), and the JiangXi Provincial Foundation for Leaders of Disciplines in Science (20113BCB22008). The funders had no role in the design of this study, data collection and analysis, decision to publish, or preparation of the manuscript.

42
Conflicts of Interest
The authors declare no conflict of interest.
References
1. Hansen, L.; Kim, N.K.; Marino-Ramirez, L.; Landsman, D. Analysis of biological features associated with meiotic recombination hot and cold spots in Saccharomyces cerevisiae. PLoS One 2011, 6, e29711.
2. Keeney, S. Spo11 and the formation of DNA double-strand breaks in meiosis. Genome Dyn. Stab. 2008, 2, 81–123.
3. Ferguson, K.A.; Wong, E.C.; Chow, V.; Nigro, M.; Ma, S. Abnormal meiotic recombination in infertile men and its association with sperm aneuploidy. Hum. Mol. Genet. 2007, 16, 2870–2879.
4. Griffin, J.; Emery, B.R.; Christensen, G.L.; Carrell, D.T. Analysis of the meiotic recombination gene REC8 for sequence variations in a population with severe male factor infertility. Syst. Biol. Reprod. Med. 2008, 54, 163–165.
5. Hann, M.C.; Lau, P.E.; Tempest, H.G. Meiotic recombination and male infertility: From basic science to clinical reality? Asian J. Androl. 2011, 13, 212–218.
6. Baudat, F.; Nicolas, A. Clustering of meiotic double-strand breaks on yeast chromosome III. Proc. Natl. Acad. Sci. USA 1997, 94, 5213–5218.
7. Klein, S.; Zenvirth, D.; Dror, V.; Barton, A.B.; Kaback, D.B.; Simchen, G. Patterns of meiotic double-strand breakage on native and artificial yeast chromosomes. Chromosoma 1996, 105, 276–284.
8. Zenvirth, D.; Arbel, T.; Sherman, A.; Goldway, M.; Klein, S.; Simchen, G. Multiple sites for double-strand breaks in whole meiotic chromosomes of Saccharomyces cerevisiae. EMBO J. 1992, 11, 3441–3447.
9. Petes, T.D. Meiotic recombination hot spots and cold spots. Nat. Rev. Genet. 2001, 2, 360–369.
10. Kohl, K.P.; Sekelsky, J. Meiotic and mitotic recombination in meiosis. Genetics 2013, 194, 327–334.
11. Lichten, M.; Goldman, A.S. Meiotic recombination hotspots. Ann. Rev. Genet. 1995, 29, 423–444.
12. Jeffreys, A.J.; Holloway, J.K.; Kauppi, L.; May, C.A.; Neumann, R.; Slingsby, M.T.; Webb, A.J. Meiotic recombination hot spots and human DNA diversity. Philos. Trans. R. Soc. Lond. Ser. B 2004, 359, 141–152.
13. Wahls, W.P. Meiotic recombination hotspots: Shaping the genome and insights into hypervariable minisatellite DNA change. Curr. Top. Dev. Biol. 1998, 37, 37–75.
14. Liu, G.; Liu, J.; Cui, X.; Cai, L. Sequence-dependent prediction of recombination hotspots in Saccharomyces cerevisiae. J. Theor. Biol. 2012, 293, 49–54.
15. Chen, W.; Lin, H.; Feng, P.M.; Ding, C.; Zuo, Y.C.; Chou, K.C. iNuc-PhysChem: A sequence-based predictor for identifying nucleosomes via physicochemical properties. PLoS One 2012, 7, e47843.

43
16. Chou, K.C. Prediction of G-protein-coupled receptor classes. J. Proteome Res. 2005, 4, 1413–1418.
17. Chou, K.C.; Elrod, D.W. Prediction of enzyme family classes. J. Proteome Res. 2003, 2, 183–190.
18. Wang, M.; Yang, J.; Xu, Z.J.; Chou, K.C. SLLE for predicting membrane protein types. J. Theor. Biol. 2005, 232, 7–15.
19. Xiao, X.; Wang, P.; Chou, K.C. Predicting protein structural classes with pseudo amino acid composition: An approach using geometric moments of cellular automaton image. J. Theor. Biol. 2008, 254, 691–696.
20. Chou, K.C. A novel approach to predicting protein structural classes in a (20–1)-D amino acid composition space. Proteins: Struct. Funct. Genet 1995, 21, 319–344.
21. Feng, K.Y.; Cai, Y.D.; Chou, K.C. Boosting classifier for predicting protein domain structural class. Biochem. Biophys. Res. Commun. 2005, 334, 213–217.
22. Cai, Y.D.; Chou, K.C. Artificial neural network for predicting alpha-turn types. Anal. Biochem. 1999, 268, 407–409.
23. Thompson, T.B.; Chou, K.C.; Zheng, C. Neural network prediction of the HIV-1 protease cleavage sites. J. Theor. Biol. 1995, 177, 369–379.
24. Feng, P.M.; Chen, W.; Lin, H.; Chou, K.C. iHSP-PseRAAAC: Identifying the heat shock protein families using pseudo reduced amino acid alphabet composition. Anal. Biochem. 2013, 442, 118–125.
25. Chen, W.; Feng, P.M.; Lin, H.; Chou, K.C. iRSpot-PseDNC: Identify recombination spots with pseudo dinucleotide composition. Nucleic Acids Res. 2013, 41, e69.
26. Xiao, X.; Wang, P.; Chou, K.C. iNR-PhysChem: A sequence-based predictor for identifying nuclear receptors and their subfamilies via physical-chemical property matrix. PLoS One 2012, 7, e30869.
27. Lin, W.Z.; Fang, J.A.; Xiao, X.; Chou, K.C. iDNA-Prot: Identification of DNA binding proteins using random forest with grey model. PLoS One 2011, 6, e24756.
28. Kandaswamy, K.K.; Chou, K.C.; Martinetz, T.; Moller, S.; Suganthan, P.N.; Sridharan, S.; Pugalenthi, G. AFP-Pred: A random forest approach for predicting antifreeze proteins from sequence-derived properties. J. Theor. Biol. 2011, 270, 56–62.
29. Xu, Y.; Ding, J.; Wu, L.Y.; Chou, K.C. iSNO-PseAAC: Predict cysteine S-nitrosylation sites in proteins by incorporating position specific amino acid propensity into pseudo amino acid composition. PLoS One 2013, 8, e55844.
30. Cai, Y.D.; Chou, K.C. Predicting subcellular localization of proteins in a hybridization space. Bioinformatics 2004, 20, 1151–1156.
31. Chou, K.C.; Cai, Y.D. Prediction of protease types in a hybridization space. Biochem. Biophys. Res. Commun. 2006, 339, 1015–1020.
32. Chou, K.C.; Shen, H.B. Predicting eukaryotic protein subcellular location by fusing optimized evidence-theoretic K-nearest neighbor classifiers. J. Proteome Res. 2006, 5, 1888–1897.
33. Chou, K.C.; Shen, H.B. Hum-PLoc: A novel ensemble classifier for predicting human protein subcellular localization. Biochem. Biophys. Res. Commun. 2006, 347, 150–157.
44
34. Chou, K.C.; Shen, H.B. Large-scale predictions of Gram-negative bacterial protein subcellular locations. J. Proteome Res. 2006, 5, 3420–3428.
35. Chou, K.C.; Shen, H.B. Euk-mPLoc: A fusion classifier for large-scale eukaryotic protein subcellular location prediction by incorporating multiple sites. J. Proteome Res. 2007, 6, 1728–1734.
36. Chou, K.C.; Shen, H.B. Signal-CF: A subsite-coupled and window-fusing approach for predicting signal peptides. Biochem. Biophys. Res. Commun. 2007, 357, 633–640.
37. Shen, H.B.; Chou, K.C. Using optimized evidence-theoretic K-nearest neighbor classifier and pseudo amino acid composition to predict membrane protein types. Biochem. Biophys. Res. Commun. 2005, 334, 288–292.
38. Shen, H.B.; Chou, K.C. A top-down approach to enhance the power of predicting human protein subcellular localization: Hum-mPLoc 2.0. Anal. Biochem. 2009, 394, 269–274.
39. Xiao, X.; Wang, P.; Chou, K.C. GPCR-2L: Predicting G protein-coupled receptors and their types by hybridizing two different modes of pseudo amino acid compositions. Mol. Biosyst. 2011, 7, 911–919.
40. Shen, H.B.; Yang, J.; Chou, K.C. Fuzzy KNN for predicting membrane protein types from pseudo amino acid composition. J. Theor. Biol. 2006, 240, 9–13.
41. Xiao, X.; Min, J.L.; Wang, P.; Chou, K.C. iGPCR-Drug: A web server for predicting interaction between GPCRs and drugs in cellular networking. PLoS One 2013, 8, e72234.
42. Xiao, X.; Min, J.L.; Wang, P.; Chou, K.C. iCDI-PseFpt: Identify the channel-drug interaction in cellular networking with PseAAC and molecular fingerprints. J. Theor. Biol. 2013, 337C, 71–79.
43. Xiao, X.; Wang, P.; Lin, W.Z.; Jia, J.H.; Chou, K.C. iAMP-2L: A two-level multi-label classifier for identifying antimicrobial peptides and their functional types. Anal. Biochem. 2013, 436, 168–177.
44. Chou, K.C. Prediction of protein cellular attributes using pseudo amino acid composition. Proteins: Struct. Funct. Genet. 2001, 43, 246–255.
45. Chou, K.C. Using amphiphilic pseudo amino acid composition to predict enzyme subfamily classes. Bioinformatics 2005, 21, 10–19.
46. Lin, S.X.; Lapointe, J. Theoretical and experimental biology in one—A symposium in honour of Professor Kuo-Chen Chou’s 50th anniversary and Professor Richard Giegé’s 40th anniversary of their scientific careers. J. Biomed. Sci. Eng. 2013, 6, 435–442.
47. Nanni, L.; Lumini, A.; Gupta, D.; Garg, A. Identifying bacterial virulent proteins by fusing a set of classifiers based on variants of Chou’s pseudo amino acid composition and on evolutionary information. IEEE/ACM Trans. Comput. Biol. Bioinform. 2012, 9, 467–475.
48. Khosravian, M.; Faramarzi, F.K.; Beigi, M.M.; Behbahani, M.; Mohabatkar, H. Predicting antibacterial peptides by the concept of Chou’s pseudo-amino acid composition and machine learning methods. Protein Pept. Lett. 2013, 20, 180–186.
49. Yu, L.; Guo, Y.; Li, Y.; Li, G.; Li, M.; Luo, J.; Xiong, W.; Qin, W. SecretP: Identifying bacterial secreted proteins by fusing new features into Chou’s pseudo-amino acid composition. J. Theor. Biol. 2010, 267, 1–6.

45
50. Zou, D.; He, Z.; He, J.; Xia, Y. Supersecondary structure prediction using Chou’s pseudo amino acid composition. J. Comput. Chem. 2011, 32, 271–278.
51. Zhang, S.W.; Zhang, Y.L.; Yang, H.F.; Zhao, C.H.; Pan, Q. Using the concept of Chou’s pseudo amino acid composition to predict protein subcellular localization: An approach by incorporating evolutionary information and von Neumann entropies. Amino Acids 2008, 34, 565–572.
52. Kandaswamy, K.K.; Pugalenthi, G.; Moller, S.; Hartmann, E.; Kalies, K.U.; Suganthan, P.N.; Martinetz, T. Prediction of apoptosis protein locations with genetic algorithms and support vector machines through a new mode of pseudo amino acid composition. Protein Pept. Lett. 2010, 17, 1473–1479.
53. Mei, S. Predicting plant protein subcellular multi-localization by Chou’s PseAAC formulation based multi-label homolog knowledge transfer learning. J. Theor. Biol. 2012, 310, 80–87.
54. Chang, T.H.; Wu, L.C.; Lee, T.Y.; Chen, S.P.; Huang, H.D.; Horng, J.T. EuLoc: A web-server for accurately predict protein subcellular localization in eukaryotes by incorporating various features of sequence segments into the general form of Chou’s PseAAC. J. Comput.-Aided Mol. Des. 2013, 27, 91–103.
55. Fan, G.L.; Li, Q.Z. Predict mycobacterial proteins subcellular locations by incorporating pseudo-average chemical shift into the general form of Chou’s pseudo amino acid composition. J. Theor. Biol. 2012, 304, 88–95.
56. Huang, C.; Yuan, J. Using radial basis function on the general form of Chou’s pseudo amino acid composition and PSSM to predict subcellular locations of proteins with both single and multiple sites. Biosystems 2013, 113, 50–57.
57. Lin, H.; Wang, H.; Ding, H.; Chen, Y.L.; Li, Q.Z. Prediction of subcellular localization of apoptosis protein using Chou’s pseudo amino acid composition. Acta Biotheor. 2009, 57, 321–330.
58. Wan, S.; Mak, M.W.; Kung, S.Y. GOASVM: A subcellular location predictor by incorporating term-frequency gene ontology into the general form of Chou’s pseudo-amino acid composition. J. Theor. Biol. 2013, 323, 40–48.
59. Huang, C.; Yuan, J.Q. Predicting protein subchloroplast locations with both single and multiple sites via three different modes of Chou’s pseudo amino acid compositions. J. Theor. Biol. 2013, 335, 205–212.
60. Chen, Y.K.; Li, K.B. Predicting membrane protein types by incorporating protein topology, domains, signal peptides, and physicochemical properties into the general form of Chou’s pseudo amino acid composition. J. Theor. Biol. 2013, 318, 1–12.
61. Huang, C.; Yuan, J.Q. A Multilabel model based on Chou’s pseudo-amino acid composition for identifying membrane proteins with both single and multiple functional types. J. Membr. Biol. 2013, 246, 327–334.
62. Hayat, M.; Khan, A. Discriminating outer membrane proteins with fuzzy K-nearest neighbor algorithms based on the general form of Chou’s PseAAC. Protein Pept. Lett. 2012, 19, 411–421.

46
63. Mohabatkar, H.; Beigi, M.M.; Abdolahi, K.; Mohsenzadeh, S. Prediction of allergenic proteins by means of the concept of Chou’s pseudo amino acid composition and a machine learning approach. Med. Chem. 2013, 9, 133–137.
64. Mohammad Beigi, M.; Behjati, M.; Mohabatkar, H. Prediction of metalloproteinase family based on the concept of Chou’s pseudo amino acid composition using a machine learning approach. J. Struct. Funct. Genomics 2011, 12, 191–197.
65. Sahu, S.S.; Panda, G. A novel feature representation method based on Chou’s pseudo amino acid composition for protein structural class prediction. Comput. Biol. Chem. 2010, 34, 320–327.
66. Zia Ur, R.; Khan, A. Identifying GPCRs and their types with Chou’s pseudo amino acid composition: An approach from multi-scale energy representation and position specific scoring matrix. Protein Pept. Lett. 2012, 19, 890–903.
67. Xie, H.L.; Fu, L.; Nie, X.D. Using ensemble SVM to identify human GPCRs N-linked glycosylation sites based on the general form of Chou’s PseAAC. Protein Eng. Des. Sel. 2013, 26, 735–742.
68. Zhang, S.W.; Chen, W.; Yang, F.; Pan, Q. Using Chou’s pseudo amino acid composition to predict protein quaternary structure: A sequence-segmented PseAAC approach. Amino Acids 2008, 35, 591–598.
69. Sun, X.Y.; Shi, S.P.; Qiu, J.D.; Suo, S.B.; Huang, S.Y.; Liang, R.P. Identifying protein quaternary structural attributes by incorporating physicochemical properties into the general form of Chou’s PseAAC via discrete wavelet transform. Mol. BioSyst. 2012, 8, 3178–3184.
70. Nanni, L.; Lumini, A. Genetic programming for creating Chou’s pseudo amino acid based features for submitochondria localization. Amino Acids 2008, 34, 653–660.
71. Fan, G.L.; Li, Q.Z. Predicting protein submitochondria locations by combining different descriptors into the general form of Chou’s pseudo amino acid composition. Amino Acids 2012, 43, 545–555.
72. Mei, S. Multi-kernel transfer learning based on Chou’s PseAAC formulation for protein submitochondria localization. J. Theor. Biol. 2012, 293, 121–130.
73. Zeng, Y.H.; Guo, Y.Z.; Xiao, R.Q.; Yang, L.; Yu, L.Z.; Li, M.L. Using the augmented Chou’s pseudo amino acid composition for predicting protein submitochondria locations based on auto covariance approach. J. Theor. Biol. 2009, 259, 366–372.
74. Esmaeili, M.; Mohabatkar, H.; Mohsenzadeh, S. Using the concept of Chou’s pseudo amino acid composition for risk type prediction of human papillomaviruses. J. Theor. Biol. 2010, 263, 203–209.
75. Mohabatkar, H. Prediction of cyclin proteins using Chou’s pseudo amino acid composition. Protein Pept. Lett. 2010, 17, 1207–1214.
76. Mohabatkar, H.; Mohammad Beigi, M.; Esmaeili, A. Prediction of GABA(A) receptor proteins using the concept of Chou’s pseudo-amino acid composition and support vector machine. J. Theor. Biol. 2011, 281, 18–23.
77. Georgiou, D.N.; Karakasidis, T.E.; Nieto, J.J.; Torres, A. Use of fuzzy clustering technique and matrices to classify amino acids and its impact to Chou’s pseudo amino acid composition. J. Theor. Biol. 2009, 257, 17–26.

47
78. Zhang, G.Y.; Fang, B.S. Predicting the cofactors of oxidoreductases based on amino acid composition distribution and Chou’s amphiphilic pseudo amino acid composition. J. Theor. Biol. 2008, 253, 310–315.
79. Zhou, X.B.; Chen, C.; Li, Z.C.; Zou, X.Y. Using Chou’s amphiphilic pseudo-amino acid composition and support vector machine for prediction of enzyme subfamily classes. J. Theor. Biol. 2007, 248, 546–551.
80. Liu, B.; Wang, X.; Zou, Q.; Dong, Q.; Chen, Q. Protein remote homology detection by combining Chou’s pseudo amino acid composition and profile-based protein representation. Mol. Informa. 2013, 32, 775–782.
81. Georgiou, D.N.; Karakasidis, T.E.; Megaritis, A.C. A short survey on genetic sequences, Chou’s pseudo amino acid composition and its combination with fuzzy set theory. Open Bioinforma. J. 2013, 7, 41–48.
82. Hajisharifi, Z.; Piryaiee, M.; Mohammad Beigi, M.; Behbahani, M.; Mohabatkar, H. Predicting anticancer peptides with Chou’s pseudo amino acid composition and investigating their mutagenicity via Ames test. J. Theor. Biol. 2014, 341, 34–40.
83. Chou, K.C. Some remarks on protein attribute prediction and pseudo amino acid composition (50th Anniversary Year Review). J. Theor. Biol. 2011, 273, 236–247.
84. Li, B.Q.; Huang, T.; Liu, L.; Cai, Y.D.; Chou, K.C. Identification of colorectal cancer related genes with mRMR and shortest path in protein-protein interaction network. PLoS One 2012, 7, e33393.
85. Huang, T.; Wang, J.; Cai, Y.D.; Yu, H.; Chou, K.C. Hepatitis C virus network based classification of hepatocellular cirrhosis and carcinoma. PLoS One 2012, 7, e34460.
86. Jiang, Y.; Huang, T.; Lei, C.; Gao, Y.F.; Cai, Y.D.; Chou, K.C. Signal propagation in protein interaction network during colorectal cancer progression. BioMed Res. Int. 2013, 2013, 287019.
87. Du, P.; Wang, X.; Xu, C.; Gao, Y. PseAAC-Builder: A cross-platform stand-alone program for generating various special Chou’s pseudo-amino acid compositions. Anal. Biochem. 2012, 425, 117–119.
88. Cao, D.S.; Xu, Q.S.; Liang, Y.Z. Propy: A tool to generate various modes of Chou’s PseAAC. Bioinformatics 2013, 29, 960–962.
89. Shen, H.B.; Chou, K.C. PseAAC: A flexible web-server for generating various kinds of protein pseudo amino acid composition. Anal. Biochem. 2008, 373, 386–388.
90. Min, J.L.; Xiao, X.; Chou, K.C. iEzy-Drug: A web server for identifying the interaction between enzymes and drugs in cellular networking. BioMed Res. Int. 2013, 2013, 701317.
91. Xu, Y.; Shao, X.J.; Wu, L.Y.; Deng, N.Y.; Chou, K.C. iSNO-AAPair: Incorporating amino acid pairwise coupling into PseAAC for predicting cysteine S-nitrosylation sites in proteins. PeerJ 2013, 1, e171.
92. Liu, B.; Zhang, D.; Xu, R.; Xu, J.; Wang, X.; Chen, Q.; Dong, Q.; Chou, K.C. Combining evolutionary information extracted from frequency profiles with sequence-based kernels for protein remote homology detection. Bioinformatics 2013, doi:10.1093/bioinformatics/btt709.
93. Lin, H.; Ding, H. Predicting ion channels and their types by the dipeptide mode of pseudo amino acid composition. J. Theor. Biol. 2011, 269, 64–69.

48
94. Liu, W.; Chou, K.C. Protein secondary structural content prediction. Protein Eng. 1999, 12, 1041–1050.
95. Lin, H.; Li, Q.Z. Using pseudo amino acid composition to predict protein structural class: Approached by incorporating 400 dipeptide components. J. Comput. Chem. 2007, 28, 1463–1466.
96. Chou, K.C. Using pair-coupled amino acid composition to predict protein secondary structure content. J. Protein Chem. 1999, 18, 473–480.
97. Lin, H.; Ding, C.; Yuan, L.F.; Chen, W.; Ding, H.; Li, Z.Q.; Guo, F.B.; Hung, J.; Rao, N.N. Predicting subchloroplast locations of proteins based on the general form of Chou’s pseudo amino acid composition: Approached from optimal tripeptide composition. Int. J. Biomath. 2013, 6, 1350003, doi:10.1142/S1793524513500034.
98. Tanford, C. Contribution of hydrophobic interactions to the stability of the globular conformation of proteins. J. Am. Chem. Soc. 1962, 84, 4240–4274.
99. Hopp, T.P.; Woods, K.R. Prediction of protein antigenic determinants from amino acid sequences. Proc. Natl. Acad. Sci. USA 1981, 78, 3824–3828.
100. Robert, C.W. CRC Handbook of Chemistry and Physics, 66th ed.; CRC Press: Boca Raton, FL, USA, 1985.
101. Dawson, R.M.C.; Elliott, D.C.; Elliott, W.H.; Jones, K.M. Data for Biochemical Research, 3rd ed.; Clarendon Press: Oxford, UK, 1986.
102. Chen, J.; Liu, H.; Yang, J.; Chou, K.C. Prediction of linear B-cell epitopes using amino acid pair antigenicity scale. Amino Acids 2007, 33, 423–428.
103. Chou, K.C.; Cai, Y.D. Using functional domain composition and support vector machines for prediction of protein subcellular location. J. Biol. Chem. 2002, 277, 45765–45769.
104. Lin, W.Z.; Fang, J.A.; Xiao, X.; Chou, K.C. Predicting secretory proteins of malaria parasite by incorporating sequence evolution information into pseudo amino acid composition via grey system model. PLoS One 2012, 7, e49040.
105. Wang, S.Q.; Yang, J.; Chou, K.C. Using stacked generalization to predict membrane protein types based on pseudo amino acid composition. J. Theor. Biol. 2006, 242, 941–946.
106. Cai, Y.D.; Zhou, G.P.; Chou, K.C. Support vector machines for predicting membrane protein types by using functional domain composition. Biophys. J. 2003, 84, 3257–3263.
107. Chang, C.-C.; Lin, C.-J. LIBSVM: A library for support vector machines. ACM Trans. Intell. Syst. Technol. 2011, 2, 1–27.
108. Cristianini, N.; Shawe-Taylor, J. An Introduction to Support Vector Machines and Other Kernel-Based Learning Methods; Cambridge University Press: Cambridge, UK, 2000; p. 189.
109. Chou, K.C. Some remarks on predicting multi-label attributes in molecular biosystems. Mol. Biosyst. 2013, 9, 1092–1100.
110. Chou, K.C. Using subsite coupling to predict signal peptides. Protein Eng. 2001, 14, 75–79. 111. Chou, K.C. Prediction of protein signal sequences and their cleavage sites. Proteins: Struct.
Funct. Genet. 2001, 42, 136–139. 112. Chou, K.C.; Wu, Z.C.; Xiao, X. iLoc-Euk: A multi-label classifier for predicting the
subcellular localization of singleplex and multiplex eukaryotic proteins. PLoS One 2011, 6, e18258.

49
113. Wu, Z.C.; Xiao, X.; Chou, K.C. iLoc-Plant: A multi-label classifier for predicting the subcellular localization of plant proteins with both single and multiple sites. Mol. BioSyst. 2011, 7, 3287–3297.
114. Wu, Z.C.; Xiao, X.; Chou, K.C. iLoc-Gpos: A multi-layer classifier for predicting the subcellular localization of singleplex and multiplex gram-positive bacterial proteins. Protein Pept. Lett. 2012, 19, 4–14.
115. Xiao, X.; Wu, Z.C.; Chou, K.C. iLoc-Virus: A multi-label learning classifier for identifying the subcellular localization of virus proteins with both single and multiple sites. J. Theor. Biol. 2011, 284, 42–51.
116. Xiao, X.; Wu, Z.C.; Chou, K.C. A multi-label classifier for predicting the subcellular localization of gram-negative bacterial proteins with both single and multiple sites. PLoS One 2011, 6, e20592.
117. Chou, K.C.; Wu, Z.C.; Xiao, X. iLoc-Hum: Using accumulation-label scale to predict subcellular locations of human proteins with both single and multiple sites. Mol. Biosyst. 2012, 8, 629–641.
118. Lin, W.Z.; Fang, J.A.; Xiao, X.; Chou, K.C. iLoc-Animal: A multi-label learning classifier for predicting subcellular localization of animal proteins. Mol. Biosyst. 2013, 9, 634–644.
119. Chen, L.; Zeng, W.M.; Cai, Y.D.; Feng, K.Y.; Chou, K.C. Predicting Anatomical Therapeutic Chemical (ATC) classification of drugs by integrating chemical-chemical interactions and similarities. PLoS One 2012, 7, e35254.
120. Chou, K.C.; Zhang, C.T. Review: Prediction of protein structural classes. Crit. Rev. Biochem. Mol. Biol. 1995, 30, 275–349.
121. Fan, G.L.; Li, Q.Z. Discriminating bioluminescent proteins by incorporating average chemical shift and evolutionary information into the general form of Chou’s pseudo amino acid composition. J. Theor. Biol. 2013, 334, 45–51.
122. Qiu, J.D.; Huang, J.H.; Liang, R.P.; Lu, X.Q. Prediction of G-protein-coupled receptor classes based on the concept of Chou’s pseudo amino acid composition: an approach from discrete wavelet transform. Anal. Biochem. 2009, 390, 68–73.
123. Chou, K.C. Pseudo amino acid composition and its applications in bioinformatics, proteomics and system biology. Curr. Proteomics 2009, 6, 262–274.

50
2. Structure-Based Drug Design
Structure of N-Terminal Sequence Asp-Ala-Glu-Phe-Arg-His-
Asp-Ser of Aβ-Peptide with Phospholipase A2 from Venom of
Andaman Cobra Sub-Species Naja naja sagittifera at
2.0 Å Resolution
Zeenat Mirza, Vikram Gopalakrishna Pillai and Wei-Zhu Zhong
Abstract: Alzheimer’s disease (AD) is one of the most significant social and health burdens of the present century. Plaques formed by extracellular deposits of amyloid β (Aβ) are the prime player of AD’s neuropathology. Studies have implicated the varied role of phospholipase A2 (PLA2) in brain where it contributes to neuronal growth and inflammatory response. Overall contour and chemical nature of the substrate-binding channel in the low molecular weight PLA2s are similar. This study involves the reductionist fragment-based approach to understand the structure adopted by N-terminal fragment of Alzheimer’s Aβ peptide in its complex with PLA2. In the current communication, we report the structure determined by X-ray crystallography of N-terminal sequence Asp-Ala-Glu-Phe-Arg-His-Asp-Ser (DAEFRHDS) of Aβ-peptide with a Group I PLA2 purified from venom of Andaman Cobra sub-species Naja naja sagittifera at 2.0 Å resolution (Protein Data Bank (PDB) Code: 3JQ5). This is probably the first attempt to structurally establish interaction between amyloid-β peptide fragment and hydrophobic substrate binding site of PLA2 involving H bond and van der Waals interactions. We speculate that higher affinity between Aβ and PLA2 has the therapeutic potential of decreasing the Aβ–Aβ interaction, thereby reducing the amyloid aggregation and plaque formation in AD.
Reprinted from Int. J. Mol. Sci. Cite as: Mirza, Z.; Pillai, V.G.; Zhong, W.-Z. Structure of N-Terminal Sequence Asp-Ala-Glu-Phe-Arg-His-Asp-Ser of Aβ-Peptide with Phospholipase A2 from Venom of Andaman Cobra Sub-Species Naja naja sagittifera at 2.0 Å Resolution. Int. J. Mol. Sci. 2014, 15, 4221-4236.
1. Introduction
An estimated 36 million people globally are suffering from Alzheimer’s disease (AD), which causes irreversible neurodegeneration and usually strikes in the later years of life. According to the World Health Organization, this figure is anticipated to rise to 65.7 million by 2030 and may increase to 115.4 million by 2050 [1]. Dementia is the most frequent type of neurodegenerative disease and it is rarely detected before symptoms develop; no drugs presently exist for its therapy [2,3]. The characteristic disease landmarks include neurofibrillary tangles [4] and amyloid plaques, surrounded by reactive astrocytes, activated microglial cells causing neuroinflammatory responses and dystrophic neuritis. Although the neuroinflammation mechanism in AD brain is not

51
apparent, there is ample data suggesting a role for specific forms of amyloid beta peptide (Aβ) in inducing release of pro-inflammatory cytokines by microglia and astrocytes. Hence, identifying the modulating mechanisms of neuroinflammatory responses and neuronal degeneration will unravel vital aspects to develop new therapeutic strategies [5,6]. Developing chemical interventions for AD is exigent and has proceeded in a virtual vacuum due to lack of tertiary structural information of amyloid-β peptide [7], which is cleaved via the β/γ-secretase pathway from the membrane-bound amyloid precursor protein (APP) [8]. β-secretase generates the N-terminus of Aβ by cleaving β-APP within the Glu-Val-Lys-Met-↓-Asp-Ala sequence or by cleaving the Swedish mutant β-APPSW within the Glu-Val-Asn-Leu-↓-Asp-Ala sequence. In addition, cleavage has been reported to occur within the Aβ sequence Asp-Ser-Gly-Tyr10-Glu11-Val, generating Aβ11–40/42 [9]. Solubility may be modulated in a pH-dependent manner by the charged N-terminal sequence [10].
The phospholipase A2 (PLA2) is a lipolytic enzyme commonly expressed in several types of mammalian cells [11]. Two most notable forms of PLA2 are the secretory PLA2 (sPLA2) and the calcium-dependent cytosolic PLA2 (cPLA2). In healthy brain cells, equilibrium between arachidonic acid conversion into proinflammatory mediators and arachidonic acid reincorporation into the membrane is maintained by PLA2 regulation. Unregulated PLA2 activity causes production of an inconsistent amount of proinflammatory mediators, leading to oxidative stress and neuroinflammation as seen in neurological diseases such as AD, epilepsy, and multiple sclerosis. The most common and extensively studied PLA2s belong to group I and II. sPLA2-IIA mRNA is up-regulated in AD brains as compared to non-demented elderly brains, and a higher percentage of sPLA2-IIA-immunoreactive astrocytes associated with Aβ plaques have been reported in the AD hippocampus and inferior temporal gyrus [12]. Increased sPLA2 activity is observed in the cerebrospinal fluid of humans with AD and multiple sclerosis, and can perhaps be a marker of permeability increases of the blood–cerebrospinal fluid barrier [13]. Also, other types of sPLA2 bearing a similar structure—e.g., groups 1B, IIE, V and X—are present in distinct brain regions [14]. A feature identified for the design of tight PLA2 inhibitors is the presence of the OH group on the aromatic framework, which may be extended in the opposite direction with the hydrophobic moiety [15].
A series of recent studies have indicated that much useful information for drug development can be obtained in a timely manner by conducting various studies, either experimentally or theoretically. However, different targets would need different approaches. For instance, to reveal the molecular mechanism of Alzheimer’s disease [16–18] and find useful clues for developing drugs against Alzheimer’s disease [19,20], the structural bioinformatics tools [21] were adopted. On the other hand, as is well known, X-ray crystallography and high-resolusion NMR (see, e.g., [22–24]) are two very powerful tools for structure-based drug design. Although it is time-consuming and expensive to use these facilities, the results thus acquired are usually more reliable and dependable. Our primary goal is to determine the possibility of a direct interaction between Aβ peptide and PLA2 and the structure adopted by the peptide that may in the future pave the way for novel approaches for better understanding AD and its therapeutics.

52
2. Results
2.1. Quality of the Final Model
The final model consists of 909 protein atoms, 68 atoms of peptide molecule, one calcium ion and 99 water molecules. The final |2Fo − Fc| electron density map is continuous and well defined for both the backbone and the side chains of the protein. The final model has a good overall geometry with the r.m.s. deviations in bond lengths and angles are 0.009 Å and 1.1', respectively. The Ramachandran plot calculated using PROCHECK [25], indicates that 89.1% of the residues are present in the most favourable regions, 10.0% were observed in the additionally allowed regions, while the remaining 0.9% residues were observed in the generously allowed regions of the Ramachandran plot [26] (Figure 1). The results of data collection and processing are given in Table 1 and the refinement statistics are given in Table 2.
2.2. Overall Structure
The general structure of PLA2 contains an N-terminal helix, H1 (residues: 2–12), a calcium-binding loop (residues: 25–35), a second α-helix, H2 (residues: 40–55), a short two-stranded antiparallel (-sheet (residues: 75–78 and 81–84), referred to as the (-wing and a third α-helix, H3 (residues: 90–108). There are two helical short turns involving residues 19–22 (SH4) and 113–115 (SH5) (Figure 2). The two antiparallel helices H2 and H3 form the core of the protein structure. The hydrophobic residues on the inner surface of the helix H1 are highly conserved and form one wall of the hydrophobic channel, which provides access to the catalytic site (Figure 3). Additional contributions to the hydrophobic channel include amino acid 19, which is located in the short turn following the helix H1, amino acid 30, 31 and 32 located within the calcium-binding loop and amino acid 69 located before the first strand of the β-wing. The structure is in accordance with previously reported structures [27].

53
Figure 1. A Ramachandran plot of the main chain torsion angles (φ,ψ) for the final refined model. The plot was calculated with the program PROCHECK [25]; non-glycine residues are identified by squares.

54
Table 1. Data collection statistics.
Space Group P41
System Tetragonal Unit-cell parameters (Ǻ)
a = b 42.7 c 65.8
Vm (Ǻ3/Da) 2.3 Solvent Content (%) 46.7 Resolution range (Ǻ) 20.0–2.0
No. of observed reflections 33,510 No. of unique reflections 7735 Overall completeness (%) 98.7
Completeness in the highest shell (2.06–2.03 Ǻ) (%) 87.7 Overall Rsym (%) 7.0
Rsym in the highest shell (2.06–2.03 Ǻ) (%) 18.8 Overall I/)(I) 11.1
I/)(I) in the highest shell (2.06–2.03 Ǻ) 2.3
Table 2. Refinement statistics.
PDB code 3JQ5
Resolution range (Ǻ) 20.0–2.0 Number of reflections 7735 RCryst (for all data) (%) 18.1
RFree (5% data) (%) 22.0 Number of protein atoms 909 Number of peptide atoms 68
Number of Water Molecules 99 Number of calcium atoms 1
R.m.s. deviations
Bond length (Ǻ2) 0.009 Bond angles (o) 1.1
Dihedral angles (') 14.4 Overall G factor 0.05
Mean B factor (Ǻ2)
Main chain atoms 22.0 Side chains and water molecules 27.3
Overall 24.8 Ramachandran plot statistics
Residues in the most allowed region (%) 89.1 Residues in the additionally allowed region (%) 10.0 Residues in the generously allowed region (%) 0.9

55
Figure 2. A ribbon diagram showing the overall structure of PLA2: helical segment is shown in red, β strands colored yellow and disulfide links shown in ball and stick, colored green and yellow. The three main helices are indicated as H1, H2 and H3, while two short helices are designated as SH4 and SH5. β wing, calcium-binding loop and disulfide linkages are also indicated.
Figure 3. The |Fo − Fc| electron density map contoured at 2.0 σ showing the electron density for the peptide Asp-Ala-Glu-Phe-Arg-His-Asp-Ser.
The overall folding of PLA2 observed in the complex with peptide is essentially similar to that of native PLA2 (1MF4) with an r.m.s. shift of 0.2 Å for the Cα positions. One milli molar CaCl2 was added in the protein drops that were used for crystallization and the structure revealed the presence of Ca2+ ion in the so-called calcium-binding loop. The Ca2+ ion is considered generally
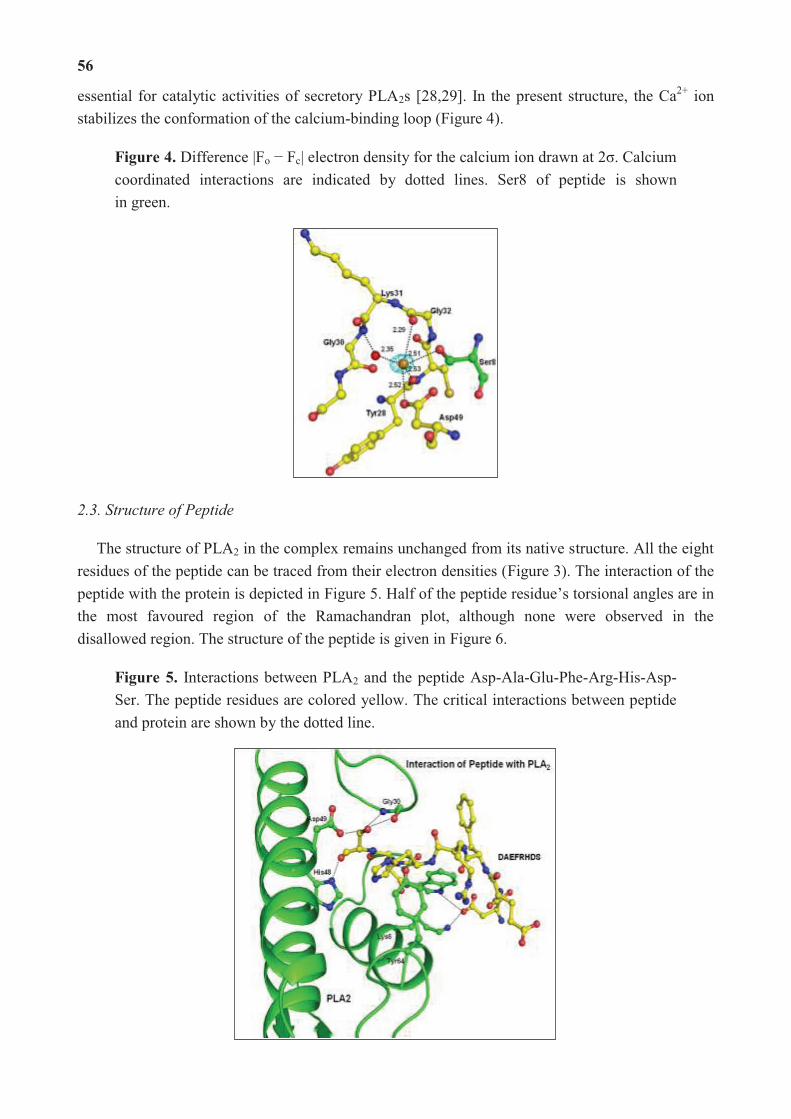
56
essential for catalytic activities of secretory PLA2s [28,29]. In the present structure, the Ca2+ ion stabilizes the conformation of the calcium-binding loop (Figure 4).
Figure 4. Difference |Fo − Fc| electron density for the calcium ion drawn at 2σ. Calcium coordinated interactions are indicated by dotted lines. Ser8 of peptide is shown in green.
2.3. Structure of Peptide
The structure of PLA2 in the complex remains unchanged from its native structure. All the eight residues of the peptide can be traced from their electron densities (Figure 3). The interaction of the peptide with the protein is depicted in Figure 5. Half of the peptide residue’s torsional angles are in the most favoured region of the Ramachandran plot, although none were observed in the disallowed region. The structure of the peptide is given in Figure 6.
Figure 5. Interactions between PLA2 and the peptide Asp-Ala-Glu-Phe-Arg-His-Asp-Ser. The peptide residues are colored yellow. The critical interactions between peptide and protein are shown by the dotted line.

57
Figure 6. The structure of peptide Asp-Ala-Glu-Phe-Arg-His-Asp-Ser in complex with PLA2.
3. Discussion
We have attempted the fragment assembly approach to elucidate the structure of Aβ. The fragment assembly and global optimization method has been established and extensively used in computational biology [30,31]. This work may be the first design of experiments following this approach. However, reductionist methods are common in protein crystallography. There are vast numbers of entries in PDB that are exclusively the domains, or even a small fragment of proteins. Most of the time, the intact protein is not amenable to crystallization, such as the beta-amyloid precursor protein. The co-crystallization method is another useful method of crystallography. Hundreds of Fab–Ag complexes are available to corroborate this fact. Co-crystallization of complete Aβ with mitochondrial alcohol dehydrogenase has been attempted [32]. The presence of Aβ in the crystal has been established by SDS-PAGE and N-terminal sequencing of the washed crystal in this study. However, no electron density corresponding to Aβ could be observed in the determined structure. This suggests the Aβ in this complex is flexible. The only instance where the Aβ molecule is seen in the crystal is the structure of the complex between Aβ and insulin-degrading enzyme (IDE). The Aβ is seen as a cleaved substrate. The complete molecule is not observed—only residues 1–3 and 17–22 are same [33].
There are many NMR studies describing the structures of partial and complete abeta molecule (3BAE, 1BA6, 1BA4, 2BEG). The results are generally combined with molecular modelling calculations. From all these studies, the following structural properties for the aggregating abeta is proposed—the central region Aβ16–21 and C-terminal region Aβ33–40(42) are in β-strand conformation; Aβ25–29 is in loop conformation, and the rest of the molecule is in random conformation. This is also corroborated by X-ray fiber—diffraction of the fibrils while the attempts to crystallize or co-crystallize the Aβ17–21 and Aβ35–40/Aβ37–42 have been described and the peptides are observed in β-conformation. Apparently, the nature of binding sites of the protein influences the conformation of the Aβ peptide. The large space available in IDE accommodated the intact Aβ molecule. In 2OTK, [34], Aβ17–36 is seen in β-sheet conformation with residues 25–29 forming the loop. In their studies, Lustbader et al. could not view the Aβ molecule even though it was in the

58
crystal. One conclusive aspect of crystal structures are that the peptides, Aβ17–21, Aβ35–42 and Aβ17–36 are in β conformation. This is in contrast to the solution studies that report all conformational possibilities. The same peptide has been observed in different conformations in different studies. Most of the studies report helical or coil conformation [35–38]. These results may be due to the variable solvent conditions used in these studies. Solvent conditions vary from completely polar to non-polar. The conformation of Aβ is highly dependent on the environmental conditions. Solvent polarity, temperature, pH and additives influence the solubility and aggregation behaviour of Aβ [39,40].
Figure 7. Surface diagram representation of the binding cavity and the hydrophobic channel with the peptide DAEFRHDS going inside the pocket.
An electron density was observed in the difference Fourier |Fo − Fc| map in the complex structure (Figure 3), which allowed the interpretation of one molecule of the octa-peptide, as well as the detailed description of its interactions with PLA2. The peptide was positioned well in the hydrophobic channel (Figure 7) and was fitted well in the substrate binding site of enzyme. Peptide interacts with active site residues through a series of hydrogen bonds and hydrophobic interactions. The N-terminal part of the peptide lies towards the opening of the hydrophobic channel at the protein surface. The C-terminal serine residue is involved in hydrogen bonding with the active site residues. The rest of the peptide aligned in the hydrophobic channel makes a series of van der Waals contacts with protein atoms. The oxygen atom Oγ of Ser8 of peptide is hydrogen bonded with active site residue Asp49 Oδ1 and also with backbone atoms of Gly30 of the calcium-binding loop. The backbone oxygen atom of Ser8 is directly hydrogen bonded to His48 Nδ1. Thus the

59
peptide interacts with the active site residues through direct hydrogen bonds (Table 3). The peptide also interacts with important residues of the hydrophobic channel like Asp1 residue of peptide interacts with Lys6 and Trp19 residue of protein and His6 residue of peptide interacts with Gly30 and Tyr64. Additionally the peptide is involved in van der Waals interaction with most of the residues lining the substrate-binding hydrophobic channel (Table 4).
Table 3. Hydrogen bonds between PLA2 and peptide DAEFRHDS.
Atoms of peptide Protein atoms Distance (Å)
Asp1 Oδ2 Lys6 Nζ 3.35
Trp19 Nε1 2.64
His6 Nδ1 Gly30 O 3.43
Tyr64 OH 2.78
Ser8 Oγ Gly30 N 3.22 Gly30 O 2.62
Tyr28 O 3.35 Asp49 Oδ1 2.95
Ser8 O His48 Nδ1 2.80
Table 4. Van der Waal interactions between PLA2 and peptide DAEFRHDS.
Atoms of peptide Protein atoms Distance (Å)
Asp1 Cγ Trp19 Cε2 3.79 Trp19 Cζ2 3.48
Ala2 Cβ Trp19 CH2 3.73 Trp19 Cζ2 3.97
Phe4 Cδ1 Ala23 Cβ 3.91 Arg5 Cζ Leu2 Cδ2 3.53 His6 Cα Leu2 Cδ2 3.69 His6 Cβ Gly30 Cα 3.63
Gly30 C 3.68 His6 Cε1 Tyr64 Cζ 3.75 Asp7 Cα Ala23 Cα 3.75 Asp7 Cβ Ile9 Cδ1 3.78
Phe5 Cε2 3.97 Asp7 C Phe5 Cε2 3.92 Ser8 Cβ Tyr28 C 3.90
Cys29 Cα 3.51 Cys29 C 3.64 Gly30 Cα 3.76
Ser8 C Phe101 Cζ 3.92 His48 Cγ 3.98 Cys45 Cβ 3.81
In our studies, the binding site of the peptides on the protein is very hydrophobic. The binding cavity of PLA2 is lined with residues such as tryptophan, histidine, aspartic acid, and glycine. The non-polar surface extends from the molecule to the catalytic residues Aspartate and histidine at the other end. We expect that the non-polar nature of the binding site could have influenced the folding

60
of the Aβ peptide fragment. This is possible given the fact that the folding of the Aβ molecule is mediated and stabilized by non-polar interactions. Moreover, the co-crystallization experiments were carried at 35% ethanol concentrations. Organic solvents (mostly alcohols have been studied), generally induce a random conformation in Aβ molecule as seen from the experiments. The peptide in our co-crystallization experiment strongly interacted with the non-polar binding-cavity residues of PLA2. The only interaction arginine displays in DAEFRHDS is non-polar (Table 3). Even though this peptide is polar it has more non-polar interactions than polar interactions (Tables 3 and 4). The observed conformation of the peptide in our result must have been dictated by the protein–ligand interactions. Though our aim of fragment assembly has not been achieved, the observations made by us are nevertheless interesting in their own right, exemplifying the strength of the interactions of the protein and ligand on one hand, and their effect on the conformation of the ligand on the other.
4. Experimental Section
4.1. Purification of Monomeric PLA2
The lyophilized samples of crude cobra venom of Naja naja sagittifera were obtained from Irula Snake Catchers Industrial Cooperative Society, Chennai, India. The crude venom was dissolved in 50 mM Tris-HCl, 100 mM NaCl, pH 7.0 at 100 mg/mL concentration and centrifuged at 12,000× g for 10 min to remove insoluble material. The collected supernatant was size fractionated on Sephadex G-100 column (100 × 2 cm) pre-equilibrated with 50 mM Tris-HCl, 100 mM NaCl, pH 7.0. The column was eluted with the same buffer at a flow rate of 6 mL/h. The peak corresponding to molecular weight of 14 kDa on SDS-PAGE and showing PLA2 activity was pooled for further purification. The pooled fractions were desalted and dialysed against 50 mM Tris-HCl, pH 7.0 and loaded on CM Sephadex C-50 column (Pharmacia, Uppsala, Sweden). The column was washed with the above buffer. The unbound fractions were pooled and dialysed against ammonium acetate buffer, pH 6.0. The diluted sample was loaded on a pre-equilibrated column with same buffer containing Affi-gel Cibacron blue F3GA. The column was washed with 50 mM ammonium acetate buffer pH 6.0 to remove unbound fractions. The column was eluted with 50 mM ammonium bicarbonate buffer pH 8.0. These fractions showed PLA2 activity and indicated a molecular weight of 14 kDa on SDS-PAGE. The samples were pooled, desalted by ultrafiltration using a 3 kDa cutoff membrane and lyophilized, and their purity was checked by matrix-assisted laser desorption-ionization–time of flight (MALDI-TOF) (Kratos, Shimadzu, Kyoto, Japan) and by activity measurements. On MALDI-TOF it showed a molecular weight of 13,401.99 Da. The protein samples were blotted on a polyvinyl difluoride (PVDF) membrane (Sigma-Aldrich, St. Louis, MO, USA) and were subjected to the N-terminal sequencing using an automated protein sequencer PPSQ-21A (Shimadzu, Japan). The N-terminal sequence of the first 15 residues was determined. It was found identical to the sequence of PLA2 whose structure was reported earlier [41].

61
4.2. Enzymatic Assay and Inhibition Studies
The purified enzyme was used for kinetic studies done using a PLA2 Assay Kit (Cayman Chemical Company, Ann Arbor, MI, USA). The enzymatic chromogenic assay utilized the conversion of arachidonoyl thio-phosphocholine into sulfahydryl molecule by PLA2. Arachidonoyl thio-PC is a synthetic substrate used to detect phospholipase activity [42]. Hydrolysis of the arachidonoyl thioester bound at the sn-2 position by PLA2 releases free thiol, colorimetrically detected by Ellman’s reagent [5,5ꞌ -dithiobis (2-nitrobenzoic acid) (DTNB)], which results in yellow colour along with the released sulfahydryl product. Stock concentration at 1.5 mM of PC-substrate and 0.1 mM of PLA2 were used for the assay. Ten μL of colouring agent (DTNB) was added in each assay reaction. Peptide inhibitors (GenScript Corporation, Piscataway, NJ, USA) were dissolved in dimethyl sulfoxide and only 5 μL added to the assay. Peptide concentrations of 0.10, 0.20, 0.30 and 0.40 mM were taken for studying PLA2 inhibition reactions. Bee venom PLA2 was taken as positive control. The assay included a 30 min pre-incubation of enzyme with peptide and a further incubation of 60 min at room temperature after the addition of 200 μL substrate solution. The absorbance was measured at 414 nm wavelength on a plate reader and measurements were repeated thrice. Two wells were designated as non-enzyme controls and their absorbance was subtracted from the absorbance measured in the sample wells. Significant decrease in enzyme activity was seen in the presence of an inhibitor.
4.3. Crystallization
The purified samples of PLA2 were dissolved in 10 mM sodium phosphate buffer pH 6.0 containing 1 mM CaCl2 to a final concentration of 2.5 mg/mL. Peptide was dissolved in the above buffer, containing 10% acetonitrile and added to the protein solution at 10-fold high molar concentration. The solution was incubated for 3 h, mixed well, centrifuged and kept for crystallization trials using hanging drop vapor diffusion method. The 10 μL drops of the above mixture were equilibrated against the same buffer containing 30% ethanol in the reservoir. The crystals grew to a size of 0.4 � 0.2 � 0.2 mm3 after two weeks.
4.4. Data Collection and Data Processing
The crystals of the complex formed between PLA2 and the N-terminus fragment DAEFRHDS were used for data collection at low temperature. A single crystal was mounted in a nylon loop and flash-frozen in a stream of nitrogen gas at 100 K. The data were collected on a 345 mm diameter MAR research scanner with 1.54 Å radiation generated by a Rigaku RU-300 rotating anode X-ray Generator filled with Osmic mirrors (Rigaku USA, Woodlands, TX, USA). The data were processed with DENZO and SCALEPACK from HKL package [43]. The final data set was complete to 87.7% up to 2.0 Å resolution. The crystals belong to the tetragonal space group P41 with unit cell dimensions a = b = 42.7 Å, c = 65.8 Å. The presence of one molecule per asymmetric unit gave a crystal volume per protein mass (Vm) of 2.3 Å3Da−1 corresponding to a solvent content of 46.7%. The final data show an overall completeness of 98.7% with a Rsym of 7.0% to 2.0 Å resolution (Tables 1 and 2).

62
4.5. Structure Determination and Refinement
The crystal structure was determined with molecular replacement method using auto-AMoRe [44] from the CCP4 software suit (Collaborative Computational Project, Number 4, 1994). The coordinates of a native PLA2 structure (PDB code: 1MF4) were used as a search model. The rotation and translation functions calculated with data in the resolution range, 12.0–3.5 Å yielded a unique solution with the first peak being very distinct. The stacking arrangement of the molecules in the unit cell for this solution yielded no unfavourable intermolecular contacts in space group P41, thus confirming it as the correct space group. The coordinates were transformed using AMoRe and were then subjected to 20 cycles of rigid-body refinement with REFMAC5 [45]. This reduced the Rcryst and Rfree factors to 18.1% and 22.0%, respectively. Of the reflections, 2% were used for the calculation of Rfree, and were not included in the refinement. The manual model building of the protein using Fourier |2Fo − Fc| and difference Fourier |Fo − Fc| maps was carried out with the Graphics Program “O” [46] on a Silicon Graphics O2 Workstation (Figure 2). A continuous non-protein electron density at 2.0 σ cut off was observed in the proximity of the active site that extended in a direction parallel to helix H2. The ligand was only included because it was well defined by unbiased difference Fourier (i.e., before inclusion of any ligand) |Fo − Fc| map. The coordinates of the peptide structure were fitted into the characteristic electron density (Figure 3). Water molecules were then added using ARP/WARP [45]. The presence of calcium ions was detected from the difference Fourier |Fo − Fc| maps (Figure 4). Further refinement was carried out after adding the coordinates of the peptide molecule, one calcium ion and 99 water molecules. The final Rcryst and Rfree factors for the complete data in the resolution range of 20.0–2.03 Å were 0.188 and 0.202, respectively (Table 2). A portion of the electron density indicating the quality of the structure at 2.03 Å resolution is shown in Figure 3. The atomic coordinates of this structure have been deposited to protein data bank (PDB) with an accession code of 3JQ5.
5. Conclusions
This is likely the first attempt to structurally establish the interaction between the amyloid-β peptide fragment and PLA2 peptide to the hydrophobic substrate binding site of PLA2 involving at least nine H bond and several van der Waals interactions. Higher affinity between Aβ and PLA2 decreases the Aβ–Aβ interaction probability, thereby reducing the aggregation and subsequent plaque formation. In conclusion, this study is a step towards understanding the mechanism behind the Aβ and PLA2 interaction that may facilitate the development of novel therapeutic strategies to inhibit inflammatory responses to retard many diseases.
Acknowledgments
Authors acknowledge the help and support of all the faculties and the facilities of Department of Biophysics, All India Institute of Medical Sciences, New Delhi, India. ZM was recipient of Junior and Senior Research Fellowship from Council of Scientific and Industrial Research, Govt. of India. We would also like to acknowledge Deanship of Scientific Research (DSR) and King Fahd
63
Medical Research Center (KFMRC), King Abdulaziz University (Jeddah, Saudi Arabia) for providing the necessary research and support facilities.
Author Contributions
Zeenat Mirza is the corresponding author and designed research project conception, development of overall research plan, and study oversight. Zeenat Mirza and Vikram Gopalakrishna Pillai were involved in hands-on conduct of the experiments, data collection and analysis. Zeenat Mirza was involved in writing of the manuscript. Wei-Zhu Zhong is the senior author and helped in revising and significantly improving the final content of this paper.
Conflicts of Interest
The authors declare no conflict of interest.
References
1. Pouryamout, L.; Dams, J.; Wasem, J.; Dodel, R.; Neumann, A. Economic evaluation of treatment options in patients with Alzheimer’s disease: A systematic review of cost-effectiveness analyses. Drugs 2012, 72, 789–802.
2. Israel, M.A.; Yuan, S.H.; Bardy, C.; Reyna, S.M.; Mu, Y.; Herrera, C.; Hefferan, M.P.; van Gorp, S.; Nazor, K.L.; Boscolo, F.S.; et al. Probing sporadic and familial Alzheimer’s disease using induced pluripotent stem cells. Nature 2012, 482, 216–220.
3. Young, J.E.; Goldstein, L.S. Alzheimer’s disease in a dish: Promises and challenges of human stem cell models. Hum. Mol. Genet. 2012, 21, R82–R89.
4. Silvestrelli, G.; Lanari, A.; Parnetti, L.; Tomassoni, D.; Amenta, F. Treatment of Alzheimer’s disease: From pharmacology to a better understanding of disease pathophysiology. Mech. Ageing Dev. 2006, 127, 148–157.
5. Craft, J.M.; Watterson, D.M.; van Eldik, L.J. Human amyloid beta-induced neuroinflammation is an early event in neurodegeneration. Glia 2006, 53, 484–490.
6. Stuchbury, G.; Munch, G. Alzheimer’s associated inflammation, potential drug targets and future therapies. J. Neural Transm. 2005, 112, 429–453.
7. Landau, M.; Sawaya, M.R.; Faull, K.F.; Laganowsky, A.; Jiang, L.; Sievers, S.A.; Liu, J.; Barrio, J.R.; Eisenberg, D. Towards a pharmacophore for amyloid. PLoS Biol. 2011, 9, e1001080.
8. Querfurth, H.W.; LaFerla, F.M. Alzheimer’s disease. N. Engl. J. Med. 2010, 362, 329–344. 9. Vassar, R.; Bennett, B.D.; Babu-Khan, S.; Kahn, S.; Mendiaz, E.A.; Denis, P.; Teplow, D.B.;
Ross, S.; Amarante, P.; Loeloff, R.; et al. Beta-secretase cleavage of Alzheimer’s amyloid precursor protein by the transmembrane aspartic protease BACE. Science 1999, 286, 735–741.
10. Jarrett, J.T.; Berger, E.P.; Lansbury, P.T., Jr. The carboxy terminus of the beta amyloid protein is critical for the seeding of amyloid formation: Implications for the pathogenesis of Alzheimer’s disease. Biochemistry 1993, 32, 4693–4697.
11. Murakami, M.; Kudo, I. Phospholipase A2. J. Biochem. 2002, 131, 285–292.

64
12. Moses, G.S.; Jensen, M.D.; Lue, L.F.; Walker, D.G.; Sun, A.Y.; Simonyi, A.; Sun, G.Y. Secretory PLA2-IIA: A new inflammatory factor for Alzheimer’s disease. J. Neuroinflamm. 2006, 3, 28.
13. Chalbot, S.; Zetterberg, H.; Blennow, K.; Fladby, T.; Andreasen, N.; Grundke-Iqbal, I.; Iqbal, K. Blood-cerebrospinal fluid barrier permeability in Alzheimer’s disease. J. Alzheimers Dis. 2011, 25, 505–515.
14. Kolko, M.; Christoffersen, N.R.; Barreiro, S.G.; Miller, M.L.; Pizza, A.J.; Bazan, N.G. Characterization and location of secretory phospholipase A2 groups IIE, V, and X in the rat brain. J. Neurosci. Res. 2006, 83, 874–882.
15. Singh, R.K.; Singh, N.; Jabeen, T.; Sharma, S.; Dey, S.; Singh, T.P. Crystal structure of the complex of group I PLA2 with a group II-specific peptide Leu-Ala-Ile-Tyr-Ser (LAIYS) at 2.6 Å resolution. J. Drug Target. 2005, 13, 367–374.
16. Carter, D.B.; Chou, K.C. A model for structure dependent binding of Congo Red to Alzeheimer beta-amyloid fibrils. Neurobiol. Aging 1998, 19, 37–40.
17. Chou, K.C. Insights from modelling the tertiary structure of BACE2. J. Proteome Res. 2004, 3, 1069–1072.
18. Chou, K.C.; Howe, W.J. Prediction of the tertiary structure of the beta-secretase zymogen. Biochem. Biophys. Res. Commun. 2002, 292, 702–708.
19. Gu, R.X.; Gu, H.; Xie, Z.Y.; Wang, J.F.; Arias, H.R.; Wei, D.Q.; Chou, K.C. Possible drug candidates for Alzheimer’s disease deduced from studying their binding interactions with alpha7 nicotinic acetylcholine receptor. Med. Chem. 2009, 5, 250–262.
20. Zheng, H.; Wei, D.Q.; Zhang, R.; Wang, C.; Wei, H.; Chou, K.C. Screening for new agonists against Alzheimer’s disease. Med. Chem. 2007, 3, 488–493.
21. Chou, K.C. Review: Structural bioinformatics and its impact to biomedical science. Curr. Med. Chem. 2004, 11, 2105–2134.
22. Berardi, M.J.; Shih, W.M.; Harrison, S.C.; Chou, J.J. Mitochondrial uncoupling protein 2 structure determined by NMR molecular fragment searching. Nature 2011, 476, 109–113.
23. OuYang, B.; Xie, S.; Berardi, M.J.; Zhao, X.M.; Dev, J.; Yu, W.; Sun, B.; Chou, J.J. Unusual architecture of the p7 channel from hepatitis C virus. Nature 2013, 498, 521–525.
24. Schnell, J.R.; Chou, J.J. Structure and mechanism of the M2 proton channel of influenza A virus. Nature 2008, 451, 591–595.
25. Laskowski, R.; Macarthur, M.; Moss, D.; Thornton, J. PROCHECK: A program to check the stereochemical quality of protein structures. J. Appl. Crystallogr. 1993, 26, 283–290.
26. Ramachandran, G.N.; Sasisekharan, V. Conformation of polypeptides and proteins. Adv. Protein Chem. 1968, 23, 283–438.
27. Singh, N.; Kumar, R.P.; Kumar, S.; Sharma, S.; Mir, R.; Kaur, P.; Srinivasan, A.; Singh, T.P. Simultaneous inhibition of anti-coagulation and inflammation: Crystal structure of phospholipase A2 complexed with indomethacin at 1.4 Å resolution reveals the presence of the new common ligand-binding site. J. Mol. Recognit. 2009, 22, 437–445.
28. Berg, O.G.; Yu, B.Z.; Rogers, J.; Jain, M.K. Interfacial catalysis by phospholipase A2: Determination of the interfacial kinetic rate constants. Biochemistry 1991, 30, 7283–7297.

65
29. Yu, B.Z.; Berg, O.G.; Jain, M.K. The divalent cation is obligatory for the binding of ligands to the catalytic site of secreted phospholipase A2. Biochemistry 1993, 32, 6485–6492.
30. Jones, D.T. Predicting novel protein folds by using FRAGFOLD. Proteins 2001, 45, 127–132. 31. Hegler, J.A.; Latzer, J.; Shehu, A.; Clementi, C.; Wolynes, P.G. Restriction versus guidance in
protein structure prediction. Proc. Natl. Acad. Sci. USA 2009, 106, 15302–15307. 32. Lustbader, J.W.; Cirilli, M.; Lin, C.; Xu, H.W.; Takuma, K.; Wang, N.; Caspersen, C.; Chen,
X.; Pollak, S.; Chaney, M.; et al. ABAD directly links Abeta to mitochondrial toxicity in Alzheimer’s disease. Science 2004, 304, 448–452.
33. Shen, Y.; Joachimiak, A.; Rosner, M.R.; Tang, W.J. Structures of human insulin-degrading enzyme reveal a new substrate recognition mechanism. Nature 2006, 443, 870–874.
34. Hoyer, W.; Hard, T. Interaction of Alzheimer’s A beta peptide with an engineered binding protein—Thermodynamics and kinetics of coupled folding-binding. J. Mol. Biol. 2008, 378, 398–411.
35. Luhrs, T.; Ritter, C.; Adrian, M.; Riek-Loher, D.; Bohrmann, B.; Dobeli, H.; Schubert, D.; Riek, R. 3D structure of Alzheimer’s amyloid-beta(1–42) fibrils. Proc. Natl. Acad. Sci. USA 2005, 102, 17342–17347.
36. Miles, L.A.; Wun, K.S.; Crespi, G.A.; Fodero-Tavoletti, M.T.; Galatis, D.; Bagley, C.J.; Beyreuther, K.; Masters, C.L.; Cappai, R.; McKinstry, W.J.; et al. Amyloid-beta-anti-amyloid-beta complex structure reveals an extended conformation in the immunodominant B-cell epitope. J. Mol. Biol. 2008, 377, 181–192.
37. Watson, A.A.; Fairlie, D.P.; Craik, D.J. Solution structure of methionine-oxidized amyloid beta-peptide (1–40). Does oxidation affect conformational switching? Biochemistry 1998, 37, 12700–12706.
38. Coles, M.; Bicknell, W.; Watson, A.A.; Fairlie, D.P.; Craik, D.J. Solution structure of amyloid beta-peptide(1–40) in a water-micelle environment. Is the membrane-spanning domain where we think it is? Biochemistry 1998, 37, 11064–11077.
39. Castelletto, V.; Hamley, I.W.; Harris, P.J.; Olsson, U.; Spencer, N. Influence of the solvent on the self-assembly of a modified amyloid beta peptide fragment. I. Morphological investigation. J. Phys. Chem. B 2009, 113, 9978–9987.
40. Davis, C.H.; Berkowitz, M.L. Structure of the amyloid-beta (1–42) monomer absorbed to model phospholipid bilayers: A molecular dynamics study. J. Phys. Chem. B 2009, 113, 14480–14486.
41. Singh, R.K.; Vikram, P.; Makker, J.; Jabeen, T.; Sharma, S.; Dey, S.; Kaur, P.; Srinivasan, A.; Singh, T.P. Design of specific peptide inhibitors for group I phospholipase A2: Structure of a complex formed between phospholipase A2 from Naja naja sagittifera (group I) and a designed peptide inhibitor Val-Ala-Phe-Arg-Ser (VAFRS) at 1.9 Å resolution reveals unique features. Biochemistry 2003, 42, 11701–11706.
42. Reynolds, L.J.; Hughes, L.L.; Yu, L.; Dennis, E.A. 1-Hexadecyl-2-arachidonoylthio-2-deoxy-sn-glycero-3-phosphorylcholine as a substrate for the microtiterplate assay of human cytosolic phospholipase A2. Anal. Biochem. 1994, 217, 25–32.
43. Otwinowski, Z.; Minor, W. Processing of X-ray diffraction data collected in oscillation mode. Methods Enzymol. 1997, 276, 307–326.

66
44. Navaza, J. AmoRe: An automated package for molecular replacement. Acta Crystallogr. A 1994, 50, 157–163.
45. Murshudov, G.N.; Dodson, E.J. Simplified error estimation a la Cruickshank in macromolecular crystallography. CCP4 Newslett. Protein Crystallogr. 1997, 33, 31–39.
46. Jones, T.A.; Zou, J.Y.; Cowan, S.W.; Kjeldgaard, M. Improved methods for building protein models in electron density maps and the location of errors in these models. Acta Crystallogr. A 1991, 47, 110–119.

67
Synthesis, Characterization and Anti-Breast Cancer Activity
of New 4-Aminoantipyrine-Based Heterocycles
Mostafa M. Ghorab, Marwa G. El-Gazzar and Mansour S. Alsaid
Abstract: 4-Aminoantipyrine was utilized as key intermediate for the synthesis of pyrazolone derivatives bearing biologically active moieties. The newly synthesized compounds were characterized by IR, 1H- and 13C-NMR spectral and microanalytical studies. The compounds were screened as anticancer agents against a human tumor breast cancer cell line MCF7, and the results showed that (Z)-4-((3-amino-5-imino-1-phenyl-1H-pyrazol-4(5H)-ylidene)methylamino)-1,5-dimethyl-2-phenyl-1,2-dihydropyrazol-3-one 5, 3-(4-bromophenyl)-1-(1,5-dimethyl-3-oxo-2-phenyl-2,3-dihydro-1H-pyrazol-4-yl)-4-oxo-2-thioxo-1,2,3,4-tetrahydropyrimidine-5-carbonitrile 13, 1-(1,5-dimethyl-3-oxo-2-phenyl-2,3-dihydro-1H-pyrazol-4-yl)-3-(4-iodophenyl)-4-oxo-2-thioxo-1,2,3,4-tetrahydropyrimidine-5-carbonitrile 14, 3,3′-(4,4′-sulfonylbis(4,1-phenylene))bis(1-(1,5-dimethyl-3-oxo-2-phenyl-2,3-dihydro-1H-pyrazol-4-yl)-4-oxo-2-thioxo-1,2,3,4-tetrahydropyrimidine-5-carbonitrile) 16, (Z)-1-(1,5-dimethyl-3-oxo-2-phenyl-2,3-dihydro-1H-pyrazol-4-yl)-2-hydrazono-4-oxo-3-phenyl-1,2,3,4-tetrahydropyrimidine-5-carbonitrile 17, (Z)-1-(1,5-dimethyl-3-oxo-2-phenyl-2,3-dihydro-1H-pyrazol-4-yl)-4-oxo-3-phenyl-2-(2-phenylhydrazono)-1,2,3,4-tetrahydropyrimidine-5-carbonitrile 18, and (Z)-4-(3-amino-6-hydrazono-7-phenyl-6,7-dihydropyrazolo[3,4-d]pyrimidin-5-yl)-1,5-dimethyl-2-phenyl-1,2-dihydropyrazol-3-one 19 were the most active compounds with IC50 values ranging from 30.68 to 60.72 μM compared with Doxorubicin as positive control with the IC50 value 71.8 μM.
Reprinted from Int. J. Mol. Sci. Cite as: Ghorab, M.M.; El-Gazzar, M.G.; Alsaid, M.S. Synthesis, Characterization and Anti-Breast Cancer Activity of New 4-Aminoantipyrine-Based Heterocycles. Int. J. Mol. Sci. 2014, 15, 7539-7553.
1. Introduction
Pyrazolone derivatives such as antipyrine, aminopyrine, and dipyrone are well known compounds used mainly as analgesic and antipyretic drugs and their pharmacological molecular mechanism has been widely surveyed [1,2]. One of the best known antipyrine derivatives is 4-aminoantipyrine which is used for the protection against oxidative stress as well as prophylactic of some diseases including cancer, and these are important directions in medical applications [3]. Several derivatives of antipyrine were also biologically evaluated, and analgesic [4], anti-inflammatory [5], antimicrobial [6], and anticancer activity [7–9] have been reported. Antipyrine derivatives are strong inhibitors of cycloxygenase isoenzymes, platelet tromboxane synthesis, and prostanoids synthesis [10], which catalyze the rate-limiting step of prostaglandin synthesis. Pyrazolones are also a well-known elicitor of hypersensitivity [11]. Recently, Al-Haiza et al. [12] synthesized a new compound with pyrazolone moiety with antimicrobial and antifungal activities. In the last decade, several pyrazole derivatives proved to have potent anticancer action by the inhibition of the cyclindependent kinases (CDKs) which are members of the large family of protein kinases and are responsible for the eukaryotic cell cycle regulation; they

68
are intensively studied for their cancer implication [13]. Based on the above information and due to our interest in pyrazole as a biologically active pharmacophore [14–18], we synthesized a new series of heterocycles incorporating antipyrine moiety starting from 4-aminoantipyrine to be evaluated for their anticancer activity against human tumor breast cell line (MCF7).
2. Results and Discussion
2.1. Chemistry
The starting key reagent 4-aminoantipyrine was purchased from Sigma-Aldrich chemical company (St. Louis, MO, USA). In this work, the reactivity of 4-aminoantipyrine with active methylene containing compounds (malononitrile, 2-(ethoxymethylene)malononitrile, ethylcyanoacetate, (ethoxymethylene)ethylcyanoacetate and acetylacetone) was studied and the reaction proceeded in the presence of triethylorthoformate in methanol containing catalytic amounts of acetic acid following the reported reaction condition [19]. The obtained pyrazolone derivatives 2–4, respectively, were identified by elemental and spectral data. Due to the biological importance of pyrazole, pyrrole and pyrimidine rings as anticancer agents [20–22], the pyrazolone derivative 2 was reacted with different nucleophiles in order to obtain biologically active pyrazole 5, pyrrole 6–8 and pyrimidine 9–16 derivatives bearing pyrazolone moieties. Thus, interaction of compound 2 with phenyl hydrazine yielded the corresponding pyrazole derivative 5. On the other hand, interaction of compound 2 with 2-chloroacetonitrile, ethylbromoacetate or 2-chloroacetamide in dioxane containing a catalytic amount of triethylamine yielded the corresponding pyrrole derivatives 6–8, respectively. Reaction of compound 2 with thiourea in refluxing ethanol containing sodium ethoxide gave the corresponding pyrimidine derivative 9 (Scheme 1). The reactivity of compound 2 towards different aryl isothiocyanates/NaOH was studied and the reaction proceeded via an addition reaction onto the isothiocyanato group followed by intramolecular cyclization to produce the pyrimidine ring as in compounds 10–15. Similarly, the bis-compound 16 was obtained expectedly via the reaction of one mole of 1-(4-isothiocyanatophenylsulfonyl)-4-isothiocyanatobenzene with two moles of compound 2 in ethanol containing sodium ethoxide (Scheme 2). The hydrazono pyrimidine derivatives 17, 18 were synthesized from compound 10 through reaction with either hydrazine hydrate or phenyl hydrazine, respectively, and the reaction proceeded via elimination of H2S which was detected by a lead acetate paper. On the other hand, double cyclization took place when one mole of compound 10 was reacted with two moles of hydrazine hydrate to yield the corresponding pyrazolo[3,4-d]pyrimidine 19 (Scheme 3). Finally, treatment of 4-aminoantipyrine 1 with either triethylorthoformate or acetate in acetic anhydride resulted in the formation of compounds 20, 21, respectively (Scheme 4). The structures of compounds were proved by microanalytical and spectral data and were consistent with the proposed structures.

69
Scheme 1. Synthetic pathways for compounds 2–9.

70
Scheme 2. Synthetic pathways for compounds 10–16.
Scheme 3. Synthetic pathways for compounds 17–19.

71
Scheme 4. Synthetic pathways for compounds 20, 21.
2.2. In-Vitro Anticancer Screening
Doxorubicin, the positive control used in this study, is an anticancer drug used to treat several cancer diseases including breast cancer. The relationship between surviving fraction and drug concentration was plotted; the response parameters calculated was IC50 value, which corresponds to the compound concentration causing 50% mortality in net cells (Table 1). The present work describes the synthesis of novel derivatives starting from 4-aminoantipyrine 1 by incorporating biologically active moieties, pyrazole, pyrrole, pyrimidine and pyrazolopyrimidine. From Table 1, we can observe that some of the tested compounds were found to be equipotent or even more potent than Doxorubicin on MCF7 cell line with IC50 values ranging from 30.68 to 70.65 μM compared to the reference drug (71.8 μM). The most potent compounds in this study were found to be those belonging to the pyrimidine derivatives of antipyrine especially the halogenated ones, where, the iodophenyl 14 (IC50 = 30.68 μM) and the bromophenyl 13 (IC50 = 43.41 μM) derivatives showed significant activities, also, the biscompound 16 (IC50 = 37.22 μM). In addition, pyrazole 5, pyrimidines 17, 18, pyrazolopyrimidine 19 with IC50 values 60.72, 54.23, 44.99, and 44.49 μM exhibited a higher activity when compared with the Doxorubicin as positive control. The phenyl and 4-nitro phenyl derivatives 10 and 12 (IC50 = 72.04 and 70.65 μM) are nearly as active as Doxorubicin. On the other hand, reaction of one mole of hydrazine hydrate or phenyl hydrazine with compound 10 yielded the pyrimidine derivatives 17 and 18 with significant activities (IC50 = 54.23 and 44.99 μM), while, addition of two moles of hydrazine hydrate yielded the pyrazolopyrimidine 19 (IC50 = 44.49 μM) which is nearly as potent as compounds 17 and 18. Moreover, the reaction of phenylhydrazine with compound 2 was also successful as it yielded the pyrazole derivative 5 which showed high activity (IC50 = 60.72 μM). All these compounds are more active than the reference drug. Considering the pyrrole derivatives 6, 7 and 8, they were found to exhibit lower activity compared to the reference drug (IC50 = 128.61, 104.11 and 85.12

72
μM, respectively). Compounds 2–4, 9, 11, 15, 20 and 21 are the least potent in this study with IC50 ranging from 109.58 to 173.83 μM.
Table 1. In-vitro anticancer screening of compounds 2–21 against human breast cell line (MCF7).
Compound No. IC50 (μg/mL) IC50 (μM)
2 48.2 173.83 3 38.0 116.56 4 34.9 111.50 5 23.5 60.72 6 40.9 128.61 7 38.0 104.11 8 28.6 85.12 9 38.9 109.58
10 29.9 72.04 11 NA NA 12 32.5 70.65 13 21.4 43.41 14 16.6 30.68 15 NA NA 16 33.2 37.22 17 22.4 54.23 18 22.0 44.99 19 19.0 44.49 20 35.8 138.22 21 NA NA
Doxorubicin 39.0 71.8 NA: Compound having IC50 value > 100 μg/mL.
Generally, incorporation of pyrimidine ring yielded the most potent compounds and these results point to the possible use of pyrimidine derivatives of antipyrine for treatment of breast tumors.
3. Experimental Section
3.1. General
Reagents were obtained from commercial suppliers and were used without purification. Melting points were determined in open capillary tubes using Thermo system FP800 Mettler FP80 central processor supplied with FP81 MBC cell apparatus (Stuart Scientific, Redhill, UK), and were uncorrected. Elemental analyses (C, H, N) were performed on a Perkin-Elmer 2400 Instrument (Perkin-Elmer, Norwalk, CT, USA). All compounds were within ±0.4% of the theoretical values. Infrared (IR) spectra (KBr disc) were recorded on FT-IR spectrophotometer (Perkin Elmer, Norwalk, CT, USA) at the Research Center, College of Pharmacy, King Saud University, Saudi Arabia.1H and 13C NMR spectra were recorded on a Ultra Shield Plus 500 MHz (Bruker, Munich, Germany) spectrometer operating at 500 MHz for proton and 125 MHz for carbon, respectively. The chemical shift values are reported in δ (ppm) relative to the residual solvent peak, the coupling constants (J) are reported in Hertz (Hz).

73
3.2. Chemistry
3.2.1. 2-((1,5-Dimethyl-3-oxo-2-phenyl-2,3-dihydro-1H-pyrazol-4-ylamino)methylene)-malononitrile 2
A mixture of 4-aminoantipyrine (0.01 mol), malononitrile (0.01 mol), triethylorthoformate (0.01 mol), and acetic acid (1 mL) in methanol (30 mL) was refluxed for 5 h, the reaction mixture was cooled, filtered, the filtered solid was crystallized from ethanol to give 2. Yield%: 90, m.p. = 254.7 °C, IR, cm−1: 3210 (NH), 3055 (CH arom.), 2941, 2818 (CH aliph.), 2200 (CN), 1658 (C=N). 1H (DMSO-d6, ppm): 2.2 [s, 3H, CH3], 3.2 [s, 3H, N–CH3], 7.3–7.9 [m, 5H, Ar–H], 8.1 [s, 1H, CH], 10.5 [s, 1H, NH, D2O-exchangeable]. 13C (DMSO-d6, ppm): 10.3 (CH3), 29.1 (N–CH3), 50.3, 104.6, 114.1(2), 116.4(2), 117.2, 127.2(2), 129.1, 134.5, 160.1 (C=O), 165.5. Anal. Calcd. for C15H13N5O (279): C, 64.51; H, 4.69; N, 25.07. Found: C, 64.91; H, 4.80; N, 25.34.
3.2.2. (Z)-Ethyl-2-cyano-3-(1,5-dimethyl-3-oxo-2-phenyl-2,3-dihydro-1H-pyrazol-4-ylamino)acrylate 3
A mixture of 4-aminoantipyrine (0.01 mol), ethylcyanoacetate (0.01 mol), triethylorthoformate (0.01 mol), and acetic acid (1 mL) in methanol (30 mL) was refluxed for 5 h, the reaction mixture was filtered, the filtered solid was crystallized from ethanol to give 3. Yield%: 83, m.p. = 154.8 °C, IR, cm−1: 3192 (NH), 3065 (CH arom.), 2965, 2841 (CH aliph.), 2214 (CN), 1710, 1658 (2C=O). 1H (DMSO-d6, ppm): 1.2 [t, 3H, CH3, J = 7.9 Hz], 2.3 [s, 3H, CH3], 3.2 [s, 3H, N–CH3], 4.2 [q, 2H, CH2, J = 8.1 Hz], 7.3–8.0 [m, 5H, Ar–H], 8.2 [d, 1H, CH, J = 7.12 Hz], 10.0 [d, 1H, NH, D2O-exchangeable, J = 7.3 Hz]. 13C (DMSO-d6, ppm): 10.3, 14.3, 39.0, 60.2, 72.6, 109.7, 115.7(2), 116.0, 118,1, 129.0(2), 129.1, 134.3, 156.8, 161.0, 166.3. Anal. Calcd. for C17H18N4O3 (326): C, 62.57; H, 5.56; N, 17.17. Found: C, 62.90; H, 5.89; N, 17.25.
3.2.3. 3-((1,5-Dimethyl-3-oxo-2-phenyl-2,3-dihydro-1H-pyrazol-4-ylamino)methylene)-pentane- 2,4-dione 4
A mixture of 4-aminoantipyrine (0.01 mol), acetylacetone (0.01 mol), triethylorthoformate (0.01 mol), and acetic acid (1 mL) in methanol (30 mL) was refluxed for 5 h, the reaction mixture was filtered, the filtered solid was crystallized from ethanol to give 4. Yield%: 90, m.p. = 201.8 °C, IR, cm−1: 3209 (NH), 3100 (CH arom.), 2971, 2848 (CH aliph.), 1716, 1692, 1661 (3C=O), 1612 (C=N). 1H (DMSO-d6, ppm): 1.9 [s, 3H, CH3], 2.1 [s, 6H, 2COCH3], 3.0 [s, 3H, N–CH3], 7.3–7.5 [m, 6H, Ar–H + CH], 9.0 [s, 1H, NH, D2O-exchangeable]. 13C (DMSO-d6, ppm): 11.1, 22.4(2), 39.1, 104.4, 107.8(2), 108.4, 121.8, 128.8(2), 129.0, 135.0, 151.0, 161.8, 195.1(2). Anal. Calcd. for C17H19N3O3 (313): C, 65.16; H, 6.11; N, 13.41. Found: C, 65.87; H, 6.37; N, 13.21.
3.2.4. (Z)-4-((3-Amino-5-imino-1-phenyl-1H-pyrazol-4(5H)-ylidene)methylamino)-1,5-dimethyl-2-phenyl-1,2-dihydropyrazol-3-one 5
Compound 2 (0.01 mol) was mixed with phenyl hydrazine (0.01 mol) in dioxane (20 mL) and refluxed for 5 h, the reaction mixture was cooled, poured onto ice water. The precipitated solid

74
products were filtered and crystallized from methanol to give compound 5. Yield%: 76, m.p. = 172.7 °C, IR, cm−1: 3386, 3348, 3276 (NH, NH2), 3026 (CH arom.), 2981, 2872 (CH aliph.), 1660 (C=O), 1595 (C=N). 1H (DMSO-d6, ppm): 2.2 [s, 3H, CH3], 3.2 [s, 3H, N–CH3], 7.2–7.9 [m, 10H, Ar–H], 8.3 [s, 1H, CH], 8.7 [s, 1H, NH, D2O-exchangeable], 13.2 [s, 1H, NH-imino, D2O-exchangeable]. 13C (DMSO-d6, ppm): 11.5, 39.5, 106.2, 108.0, 112.4(2), 116.1(2), 117.6, 124.1, 127.7(2), 128.9, 129.5(2), 137.9, 141.2, 148.4, 156.5, 163.1, 166.2. Anal. Calcd. for C21H21N7 (387): C, 65.10; H, 5.46; N, 25.31. Found: C, 65.32; H, 5.09; N, 25.55.
3.2.5. 3-Amino-1-(1.5-dimethyl-3-oxo-2-phenyl-2,3-dihydro-1H-pyrazol-4-yl)-1H-pyrrole-2,4-dicarbonitrile 6
Compound 2 (0.01 mol) was mixed with 2-chloroacetonitrile (0.01 mol) in dioxane (20 mL) containing 3 drops of triethylamine and refluxed for 5 h, the reaction mixture was cooled, poured onto ice water. The precipitated solid products were filtered and crystallized from methanol to give compound 6. Yield%: 70, m.p. > 350 °C, IR, cm−1: 3344, 3291 (NH2), 3100 (CH arom.), 2966, 2881 (CH aliph.), 2200 (CN), 1699 (C=O). 1H (DMSO-d6, ppm): 1.6 [s, 3H, CH3], 2.4 [s, 3H, N–CH3], 6.5 [s, 2H, NH2, D2O-exchangeable], 7.0–8.0 [m, 6H, Ar–H + CH-pyrrole]. 13C (DMSO-d6, ppm): 13.9, 39.1, 101.2(2), 107.4, 110.4, 113.9(2), 116.2, 117.6(2), 119.1, 129.3(2), 138.1, 139.4, 161.2. Anal. Calcd. for C17H14N6O (318): C, 64.14; H, 4.43; N, 25.40. Found: C, 64.32; H, 4.67; N, 25.12.
3.2.6. Ethyl-3-amino-4-cyano-1-(1,5-dimethyl-3-oxo-2-phenyl-2,3-dihydro-1H-pyrazol-4-yl)-1H-pyrrole-2-carboxylate 7
Compound 2 (0.01 mol) was mixed with ethyl bromoacetate (0.01 mol) in dioxane (20 mL) containing 3 drops of triethylamine and refluxed for 5 h, the reaction mixture was cooled, poured onto ice water. The precipitated solid products were filtered and crystallized from methanol to give compound 7. Yield%: 89, m.p. = 143.4 °C, IR, cm−1: 3411, 3396 (NH2), 3100 (CH arom.), 2976, 2882 (CH aliph.), 2186 (CN), 1718, 1696 (2C=O). 1H (DMSO-d6, ppm): 1.2 [t, 3H, CH3–ester], 2.0 [s, 3H, CH3], 2.4 [s, 3H, N–CH3], 4.1 [q, 2H, CH2–ester], 7.3–8.0 [m, 7H, Ar–H + NH2], 8.7 [s, 1H, CH–pyrrole]. 13C (DMSO-d6, ppm): 12.6, 13.4, 39.0, 59.8, 98.7, 112.0, 114.3(2), 115.6, 118.4, 122.7, 126.3, 129.1(2), 138.1, 139.6, 141.2, 160.0, 161.2. Anal. Calcd. for C19H19N5O3 (365): C, 62.46; H, 5.24; N, 19.17. Found: C, 62.79; H, 5.57; N, 19.34.
3.2.7. 3-Amino-4-cyano-1-(1,5-dimethyl-3-oxo-2-phenyl-2,3-dihydro-1H-pyrazol-4-yl)-1H-pyrrole-2-carboxamide 8
Compound 2 (0.01 mol) was mixed with 2-chloroacetamide (0.01 mol) in dioxane (20 mL) containing 3 drops of triethylamine and refluxed for 5 h, the reaction mixture was cooled, poured onto ice water. The precipitated solid products were filtered and crystallized from methanol to give compound 8. Yield%: 76, m.p. > 350 °C, IR, cm−1: 3404, 3385, 3236 (NH2), 3066 (CH arom.), 2961, 2836 (CH aliph.), 2196 (CN), 1700, 1680 (2C=O). 1H (DMSO-d6, ppm): 1.6 [s, 3H, CH3], 2.3 [s, 3H, N–CH3], 7.2–8.0 [m, 9H, Ar–H + CONH2 + NH2], 8.5 [s, 1H, CH–pyrrole]. 13C (DMSO-d6, ppm): 11.9, 39.1, 99.2, 111.8, 114.3(2), 115.6, 118.2, 124.4, 129.0(2), 131.8, 135.7,

75
138.2, 153.2, 162.4, 166.0. Anal. Calcd. for C17H16N6O3 (336): C, 60.71; H, 4.79; N, 24.99. Found: C, 60.99; H, 4.49; N, 24.70.
3.2.8. 4-((4,6-Diamino-2-thioxopyrimidin-5(2H)-ylidene)methylamino)-1,5-dimethyl-1,2-phenyl-1,2-dihydropyrazol-3-one 9
A mixture of 2 (0.01 mol) and thiourea (0.01 mol) was refluxed for 5 h in ethanol containing sodium ethoxide (0.01 mol). The reaction mixture was cooled, poured onto ice water, acidified with dil. HCl, the precipitated solid product was filtered and crystallized from methanol to give 9. Yield%: 90, m.p. = 219.6 °C, IR, cm−1: 3410, 3362, 3350 (NH2), 3054 (CH arom.), 2922, 2860 (CH aliph.), 1675 (C=O), 1624 (C=N), 1317 (C=S). 1H (DMSO-d6, ppm): 2.2 [s, 3H, CH3], 3.1 [s, 3H, N–CH3], 7.3 [s, 4H, 2NH2, D2O-exchangeable], 7.5–7.9 [m, 5H, Ar–H], 9.4 [s, 1H, CH], 13.0 [s, 1H, NH, D2O-exchangeable]. 13C (DMSO-d6, ppm): 10.3, 39.3, 84.2, 109.1, 116.4(2), 124.2, 127.2(2), 129.1, 134.4(2), 160.2, 170.8(2), 211.3 (C=S). Anal. Calcd. for C16H17N7OS (355): C, 54.07; H, 4.82; N, 27.59. Found: C, 54.34; H, 4.65; N, 27.25.
3.3. General Procedure for Preparation of Compounds 10–15
A mixture of 2 (0.01 mol) and the appropriate aryl isothiocyanate (0.01 mol) was refluxed for 10 h in ethanol containing sodium ethoxide (0.01 mol). The reaction mixture was cooled, poured onto ice water, acidified with dil. HCl, the precipitated solid product was filtered and crystallized from methanol to give 10–15, respectively.
3.3.1. 1-(1,5-Dimethyl-3-oxo-2-phenyl-2,3-dihydro-1H-pyrazol-4-yl)-4-oxo-3-phenyl-2-thioxo-1,2,3,4-tetrahydropyrimidine-5-carbonitrile 10
Yield%: 81, m.p. = 132.9 °C, IR, cm−1: 3100 (CH arom.), 2966, 2871 (CH aliph.), 2201 (CN), 1672, 1659 (2C=O), 1292 (C=S). 1H (DMSO-d6, ppm): 2.2 [s, 3H, CH3], 3.2 [s, 3H, N–CH3], 7.3 [s, 1H, CH–pyrimidine], 7.5–8.1 [m, 10H, Ar–H]. 13C (DMSO-d6, ppm): 14.4, 39.1, 104.6, 109.3, 114.1(2), 116.5, 118.1, 122.0(2), 126.3, 128.6(2), 129.1(2), 129.3, 134.5, 137.8, 139.1, 159.9, 160.5, 187.2 (C=S). Anal. Calcd. for C22H17N5O2S (415): C, 63.60; H, 4.12; N, 16.86. Found: C, 63.34; H, 4.32; N, 16.60.
3.3.2. 1-(1,5-Dimethyl-3-oxo-2-phenyl-2,3-dihydro-1H-pyrazol-4-yl)-3-(4-methoxyphenyl)-4-oxo-2-thioxo-1,2,3,4-tetrahydropyrimidine-5-carbonitrile 11
Yield%: 71, m.p. = 90.6 °C, IR, cm−1: 3046 (CH arom.), 2991, 2875 (CH aliph.), 2208 (CN), 1684, 1654 (2C=O), 1257 (C=S). 1H (DMSO-d6, ppm): 2.4 [s, 3H, CH3], 3.3 [s, 3H, N–CH3], 3.7 [s, 3H, OCH3], 6.8–7.5 [m, 10H, Ar–H + CH–pyrimidine]. 13C (DMSO-d6, ppm): 13.9, 39.1, 55.1, 95.2, 107.5, 113.5(2), 113.8(3), 123.3, 124.2(2), 124.9, 129.1(2), 130.8, 131.4, 143.6, 156.2, 156.6, 164.7, 188.0. Anal. Calcd. for C23H19N5O3S (445): C, 62.01; H, 4.30; N, 15.72. Found: C, 62.34; H, 4.09; N, 15.51.

76
3.3.3. 1-(1,5-Dimethyl-3-oxo-2-phenyl-2,3-dihydro-1H-pyrazol-4-yl)-3-(4-nitrophenyl)-4-oxo-2-thioxo-1,2,3,4-tetrahydropyrimidine-5-carbonitrile 12
Yield%: 79, m.p. = 190.9 °C, IR, cm−1: 3076 (CH arom.), 2991, 2908 (CH aliph.), 2188 (CN), 1700, 1689 (2C=O), 1597, 1380 (NO2), 1308 (C=S). 1H (DMSO-d6, ppm): 2.5 [s, 3H, CH3], 3.3 [s, 3H, N–CH3], 7.8–8.2 [m, 10H, Ar–H + CH–pyrimidine]. 13C (DMSO-d6, ppm): 14.8, 39.3, 89.6, 108.2, 112.3(3), 117.5, 120.9, 124.5(2), 124.9(2), 126.3(2), 129.0, 137.4(2), 142.8, 144.0, 155.6, 162.4, 187.6 (C=S). Anal. Calcd. for C22H16N6O4S (460): C, 57.38; H, 3.50; N, 18.25. Found: C, 57.69; H, 3.20; N, 18.56.
3.3.4. 3-(4-Bromophenyl)-1-(1,5-dimethyl-3-oxo-2-phenyl-2,3-dihydro-1H-pyrazol-4-yl)-4-oxo-2-thioxo-1,2,3,4-tetrahydropyrimidine-5-carbonitrile 13
Yield%: 69, m.p. = 76.0 °C, IR, cm−1: 3100 (CH arom.), 2986, 2861 (CH aliph.), 2218 (CN), 1684, 1653 (2C=O), 1216 (C=S). 1H (DMSO-d6, ppm): 2.2 [s, 3H, CH3], 3.1 [s, 3H, N–CH3], 7.0–7.6 [m, 10H, Ar–H + CH–pyrimidine]. 13C (DMSO-d6, ppm): 13.9, 39.5, 92.4, 104.6, 113.8(2), 114.1, 116.6, 119.9, 121.0(2), 127.2(2), 129.0, 132.6, 133.4(2), 137.7, 138.6, 159.9, 160.1, 186.6 (C=S). Anal. Calcd. for C22H16BrN5O2S (493): C, 53.45; H, 3.26; N, 14.17. Found: C, 53.70; H, 3.11; N, 14.44.
3.3.5. 1-(1,5-Dimethyl-3-oxo-2-phenyl-2,3-dihydro-1H-pyrazol-4-yl)-3-(4-iodophenyl)-4-oxo-2-thioxo-1,2,3,4-tetrahydropyrimidine-5-carbonitrile 14
Yield%: 90, m.p. = 114.1 °C, IR, cm−1: 3092 (CH arom.), 2980, 2861 (CH aliph.), 2187 (CN), 1684, 1654 (2C=O), 1276 (C=S). 1H (DMSO-d6, ppm): 2.5 [s, 3H, CH3], 3.1 [s, 3H, N–CH3], 7.6–7.9 [m, 10H, Ar–H + CH–pyrimidine]. 13C (DMSO-d6, ppm): 13.9, 39.5, 88.8(2), 107.3, 114.6(2), 116.2, 120.2, 123.6(2), 129.0(3), 130.6, 137.2, 137.9(2), 139.1, 162.7, 166.1, 187.3. Anal. Calcd. for C22H16N5O2S (541): C, 48.81; H, 2.98; N, 12.94. Found: C, 48.69; H, 2.69; N, 12.72.
3.3.6. 4-(5-Cyano-3-(1,5-dimethyl-3-oxo-2-phenyl-2,3-dihydro-1H-pyrazol-4-yl)-6-oxo-2-thioxo-2,3-tetrahydropyrimidin-1(6H)-yl)benzensulfonamide 15
Yield%: 90, m.p. = 164.8 °C, IR, cm−1: 3041 (CH arom.), 2934, 2881 (CH aliph.), 2217 (CN), 1714, 1662 (2C=O), 1296 (C=S). 1H (DMSO-d6, ppm): 2.2 [s, 3H, CH3], 3.0 [s, 3H, N–CH3], 7.3–8.0 [m, 11H, Ar–H + SO2NH2], 8.1 [s, 1H, CH–pyrimidine]. 13C (DMSO-d6, ppm): 13.9, 39.4, 96.2, 104.6, 114.2(2), 116.4, 117.2, 121.6(2), 125.1(2), 127.3(2), 129.1, 134.2, 134.5, 139.6, 140.9, 160.2, 160.5, 187.6 (C=S). Anal. Calcd. for C22H18N6O4S2 (494): C, 53.43; H, 3.67; N, 16.99. Found: C, 53.69; H, 3.90; N, 16.34.
3.3.7. 3,3'-(4,4'-Sulfonylbis(4,1-phenylene))bis(1-(1,5-dimethyl-3-oxo-2-phenyl-2,3-dihydro-1H-pyrazol-4-yl)-4-oxo-2-thioxo-1,2,3,4-tetrahydropyrimidine-5-carbonitrile) 16
A mixture of 2 (0.01 mol) and 1-(4-isothiocyanatophenylsulfonyl)-4-isothiocyanatobenzene (0.02 mol) was refluxed for 10 h in ethanol containing sodium ethoxide (0.01 mol). The reaction mixture was cooled, poured onto ice water, acidified with dil. HCl, the precipitated solid product

77
was filtered and crystallized from methanol to give 16. Yield%: 81, m.p. = 140.6 °C, IR, cm−1: 3076 (CH arom.), 2981, 2861 (CH aliph.), 2219 (CN), 1661, 1643 (4C=O), 1322 (2C=S). 1H (DMSO-d6, ppm): 2.2 [s, 6H, 2CH3], 3.1 [s, 6H, 2N–CH3], 7.3–8.0 [m, 18H, Ar–H], 8.6 [s, 2H, 2CH–pyrimidine]. 13C (DMSO-d6, ppm): 13.8(2), 39.0(2), 92.6(2), 108.6(2), 113.5(4), 114.1(2), 118.4(2), 121.7(4), 127.0(4), 128.2(4), 129.1(2), 134.5(2), 136.2(2), 136.7(2), 142.4(2), 159.4(2), 160.2(2), 187.6(2). Anal. Calcd. for C44H32N10O6S3 (892): C, 59.18; H, 3.61; N, 15.69. Found: C, 59.40; H, 3.80; N, 15.48.
3.4. General Procedure for Preparation of Compounds 17 and 18
Compound 10 (0.01 mol) was mixed with either hydrazine hydrate or phenyl hydrazine (0.01 mol) in dioxane (20 mL) and refluxed for 5 h, the reaction mixture was cooled, poured onto ice water. The precipitated solid products were filtered and crystallized from methanol to give compounds 17 and 18, respectively.
3.4.1. (Z)-1-(1,5-Dimethyl-3-oxo-2-phenyl-2,3-dihydro-1H-pyrazol-4-yl)-2-hydrazono-4-oxo-3-phenyl-1,2,3,4-tetrahydropyrimidine-5-carbonitrile 17
Yield%: 68, m.p. = 78.0 °C, IR, cm−1: 3213, 3191 (NH2), 3047 (CH arom.), 2961, 2876 (CH aliph.), 2191 (CN). 1H (DMSO-d6, ppm): 2.5 [s, 3H, CH3], 3.2 [s, 3H, N–CH3], 4.5 [s, 2H, NH2, D2O-exchangeable], 7.1–7.5 [m, 11H, Ar–H + CH–pyrimidine]. 13C (DMSO-d6, ppm): 13.1, 39.0, 94.6, 106.2, 114.5(2), 116.7, 118.2, 120.6(2), 122.1, 127.6(2), 128.4(2), 129.7, 134.2, 137.7, 138.5, 156.2, 162.8, 168.9. Anal. Calcd. for C22H19N7O2 (413): C, 63.91; H, 4.63; N, 23.72. Found: C, 63.70; H, 4.91; N, 23.55.
3.4.2. (Z)-1-(1,5-Dimethyl-3-oxo-2-phenyl-2,3-dihydro-1H-pyrazol-4-yl)-4-oxo-3-phenyl-2-(2-phenylhydrazono)-1,2,3,4-tetrahydropyrimidine-5-carbonitrile 18
Yield%: 65, m.p. = 90.6 °C, IR, cm−1: 3381 (NH), 3074 (CH arom.), 2966, 2836 (CH aliph.), 2220 (CN), 1700, 1653 (2C=O). 1H (DMSO-d6, ppm): 2.4 [s, 3H, CH3], 3.2 [s, 3H, N–CH3], 7.0–8.0 [m, 15H, Ar–H], 8.4 [s, 1H, CH–pyrimidine], 9.5 [s, 1H, NH, D2O-exchangeable]. 13C (DMSO-d6, ppm): 14.1, 39.6, 95.3, 108.3, 113.8(2), 114.6, 115.8, 116.4(2), 118.9, 119.5(2), 122.2, 128.6(2), 129.0(2), 129.6, 129.8(2), 130.2, 139.2, 141.5, 144.6, 153.5, 155.7, 165.6. Anal. Calcd. for C28H23N7O2 (489): C, 68.70; H, 4.74; N, 20.03. Found: C, 68.92; H, 4.99; N, 20.33.
3.4.3. (Z)-4-(3-Amino-6-hydrazono-7-phenyl-6,7-dihydropyrazolo[3,4-d]pyrimidin-5-yl)-1,5-dimethyl-2-phenyl-1,2-dihydropyrazol-3-one 19
Compound 10 (0.01 mol) was mixed with hydrazine hydrate (0.02 mol) in dioxane (20 mL) and refluxed for 5 h, the reaction mixture was cooled, poured onto ice water. The precipitated solid products were filtered and crystallized from methanol to give compounds 19. Yield%: 73, m.p. = 222.6 °C, IR, cm−1: 3420, 3362 (NH2), 3050 (CH arom.), 2971, 2861 (CH aliph.), 1654 (C=O), 1617 (C=N). 1H (DMSO-d6, ppm): 2.2 [s, 3H, CH3], 3.2 [s, 3H, N–CH3], 5.4 [s, 2H, N–NH2, D2O-exchangeable], 6.5 [s, 2H, NH2, D2O-exchangeable], 7.0–8.1 [m, 11H, Ar–H + CH–

78
pyrimidine]. 13C (DMSO-d6, ppm): 11.4, 39.0, 97.6, 107.3, 112.6(2), 114.3(2), 116.7, 118.6, 123.7, 128.6(2), 129.1, 129.4(2), 134.1, 139.8, 155.7, 162.3, 166.0(2). Anal. Calcd. for C22H21N9O (427): C, 61.81; H, 4.95; N, 29.49. Found: C, 62.03; H, 5.12; N, 29.67.
3.5. General Procedure for Preparation of Compounds 20 and 21
A solution of 4-aminoantipyrine 1 (0.001 mol) in either triethylorthoformate or triethylorthoacetate (0.001 mol) containing three drops of acetic anhydride was refluxed for 8 h, the reaction mixture was cooled and then poured onto cold water, the obtained solid was recrystallized from methanol to give compounds 20 and 21, respectively.
3.5.1. (E)-Ethyl-N-1,5-dimethyl-3-oxo-2-phenyl-2,3-dihydro-1H-pyrazol-4-yl-formimidate 20
Yield%: 90, m.p. = 196.9 °C, IR, cm−1: 3078 (CH arom.), 2976, 2912 (CH aliph.), 1661 (C=O), 1612 (C=N). 1H (DMSO-d6, ppm): 1.0 [t, 3H, CH3], 2.3 [s, 3H, CH3], 3.1 [s, 3H, N–CH3], 3.5 [q, 2H, CH2], 7.2–7.5 [m, 5H, Ar–H], 8.1 [s, 1H, CH]. 13C (DMSO-d6, ppm): 11.3, 18.5, 39.3, 56.0, 106.3, 107.0(2), 120.0, 129.0(2), 135.1, 151.6, 160.1, 164.7. Anal. Calcd. for C14H17N3O2 (259): C, 64.85; H, 6.61; N, 16.34. Found: C, 64.66; H, 6.34; N, 16.67.
3.5.2. (E)-Ethyl-N-1,5-dimethyl-3-oxo-2-phenyl-2,3-dihydro-1H-pyrazol-4-yl-acetimidate 21
Yield%: 88, m.p. = 81.6 °C, IR, cm−1: 3086 (CH arom.), 2936, 2817 (CH aliph.), 1658 (C=O), 1598 (C=N). 1H (DMSO-d6, ppm): 1.2 [t, 3H, CH3], 1.9 [s, 3H, N=C–CH3], 2.1 [s, 3H, CH3], 3.3 [s, 3H, N–CH3], 4.1 [q, 2H, CH2], 7.2–7.5 [m, 5H, Ar–H]. 13C (DMSO-d6, ppm): 10.1 (CH3–pyrazole), 14.0 (CH3–ethyl), 17.4 (N=C–CH3), 39.1 (N–CH3), 61.0 (CH2–ethyl), 112.6, 118.7(2), 122.8, 128.9(2), 135.4, 146.1, 160.0, 164.0 (C=O). Anal. Calcd. for C15H19N3O2 (273): C, 65.91; H, 7.01; N, 15.37. Found: C, 66.13; H, 7.34; N, 15.48.
3.6. In-Vitro Anticancer Screening
The human tumor cell line (MCF7) was available from the National Cancer Institute, Cairo, Egypt. The antitumor activity of the newly synthesized compounds against the MCF7 cells was measured using the Sulforhodamine B (SRB) assay by the method of Skehan et al. (1990) [23,24]. The cell lines were grown in RPMI 1640 medium containing 10% fetal bovine serum and 2 mM L-glutamine. Cells were plated in 96-multi-well plates (104 cells/well) and were incubated at 37 °C, 5% CO2 in a humidified atmosphere for 24 h to allow attachment prior to addition of compounds. The test compounds 3–14 were dissolved in DMSO and diluted with saline to the appropriate volume and maintained in RPMI 1640 medium. Different concentrations of the compounds under test were made: 5, 12.5, 25, 30 and 50 μM and were added to the cells. Triplicate wells were prepared for each individual dose. Cells were incubated with the compounds for 48 h at 37 °C, 5% CO2. After 48 h, cells were fixed in situ by the gentle addition of 50 μL of cold 30% (w/v) trichloroacetic acid (TCA) (final concentration, 10%) and incubated for 60 min at 4 °C. The supernatant was discarded and the plates were washed five times with tap water and air dried. Sulforhodamine B (SRB) solution (50 μL) at 0.4% (w/v) in 1% acetic acid was added to each well

79
and plates were incubated for 20 min at room temperature. After staining, unbounded dye was removed by four washes with 1% acetic acid, and attached stain was recovered with Tris-EDTA buffer. Color intensity was measured at wave length 564 nm in an ELISA reader (Gmbh, Viesbaden, Germany). The relation between surviving fraction and drug concentration was plotted to get the survival curve from each compound after the specified time. The concentration required for 50% inhibition of cell viability (IC50) was calculated and compared with the reference drug doxorubicin and the results are given in Table 1.
4. Conclusions
The objective of the present study was to synthesize and investigate the anticancer activity of some novel pyrazole carrying a biologically active sulfonamide moieties. It was found that compounds 5, 13, 14, and 16–19 showed promising anticancer activity, higher than that of doxorubicin as reference drug against human breast cancer cell line (MCF7), while compounds 10, 12 are nearly as active as doxorubicin as positive control. Compound 8 exhibited a moderate activity and compounds 2–4, 6, 7, 9, and 20 showed a weak activity, while compounds 11, 15 and 21 revealed no activity. Further investigations on different probable mechanisms of action and dose-response studies should be helpful in identifying the specific site(s) of action and optimum doses of the synthesized antipyrine derivatives. These investigations would be crucial in discovering more potent and more selective anti-breast cancer agents.
Acknowledgments
The authors would like to extend their sincere appreciation to the Deanship of Scientific Research at King Saud University (Riyadh, Saudi Arabia) for its funding of this research through the Research Group Project No. RGP-VPP-302.
Author Contributions
M.M.G. suggested the research idea, contributed in the experimental work and in writing the paper. M.G.E.-G. contributed in experimental work and in writing the paper. M.S.A. contributed in the experimental work, biological activity and in writing the paper.
Conflicts of Interest
The authors declare no conflict of interest.
References
1. Himly, M.; Jahn-Schmid, B.; Pittertschatscher, K.; Bohle, B.; Grubmayr, K.; Ferreira, F.; Ebner, H.; Ebner, C. Ig E-mediated immediate-type hypersensitivity to the pyrazolone drug propyphenazone. J. Allergy Clin. Immunol. 2003, 111, 882–888.
2. Gürsoy, A.; Demirayak, S.; Capan, G.; Erol, K.; Vural, K. Synthesis and preliminary evaluation of new 5-pyrazolinone derivatives as analgesic agents. Eur. J. Med. Chem. 2000, 35, 359–364.

80
3. Teng, Y.; Liu, R.; Li, C.; Zhang, H. Effect of 4-aminoantipyrine on oxidative stress induced by glutathione depletion in single human erythrocytes using a microfluidic device together with fluorescence imaging. J. Hazard. Mater. 2011, 192, 1766–1771.
4. Turan-Zitouni, G.; Sivaci, M.; Kiliç, F.S.; Erol, K. Synthesis of some triazolyl-antipyrine derivatives and investigation of analgesic activity. Eur. J. Med. Chem. 2001, 36, 685–689.
5. Lutsevich, A.N.; Bender, K.I.; Reshet’ko, O.V. The relationship between antipyrine kinetics, the seromucoid content and the xanthine oxidase activity in the plasma of rats with acute and chronic inflammation. Eksp Klin. Farmakol. 1995, 58, 51–55.
6. Bondock, S.; Rabie, R.; Etman, H.A.; Fadda, A.A. Synthesis and antimicrobial activity of some new heterocycles incorporating antipyrine moiety. Eur. J. Med. Chem. 2008, 43, 2122–2129.
7. Metwally, M.A.; Gouda, M.A.; Harmal, A.N.; Khalil, A.M. Synthesis, antitumor, cytotoxic and antioxidant evaluation of some new pyrazolotriazines attached to antipyrine moiety. Eur. J. Med. Chem. 2012, 56, 254–262.
8. Kakiuchi, Y.; Sasaki, N.; Satoh-Masuoka, M.; Murofushi, H.; Murakami-Murofushi, K. A novel pyrazolone, 4,4-dichloro-1-(2,4-dichlorophenyl)-3-methyl-5-pyrazolone, as a potent catalytic inhibitor of human telomerase q. Biochem. Biophy. Res. Commun. 2004, 320, 1351–1358.
9. Sigroha, S.; Narasimhan, B.; Kumar, P.; Khatkar, A.; Ramasamy, K.; Mani, V.; Mishra, R.K.; Abdul Majeed, A.B. Design, synthesis, antimicrobial, anticancer evaluation, and QSAR studies of 4-(substituted benzylidene-amino)-1,5-dimethyl-2-phenyl-1,2-dihydropyrazol-3-ones. Med. Chem. Res. 2012, 21, 3863–3875.
10. Chandrasekharan, N.V.; Dai, H.; Roos, K.L.T.; Evanson, N.K.; Tomsik, J.; Elton, T.S. COX-3, a cyclooxygenase-1 variant inhibited by acetaminophen and other analgesic/antipyretic drugs: Cloning, structure, and expression. Proc. Natl. Acad. Sci. USA 2002, 99, 13926–13931.
11. Levy, M. Hypersensitivity to pyrazolones. Thorax 2000, 55, 72–74. 12. Al-Haiza, M.A.; El-Assiery, S.A.; Sayed, G.H. Synthesis and potential antimicrobial activity
of some new compounds containing the pyrazol-3-one moiety. Acta Pharm. 2001, 51, 251–261. 13. Lin, R.; Chiu, G.; Yu, Y. Design, synthesis, and evaluation of 3,4-disubstituted pyrazole
analogues as anti-tumor CDK inhibitors. Bioorg. Med. Chem. Lett. 2007, 17, 4557–4581. 14. Aly, H.M.; El-Gazzar, M.G. Novel pyrazole derivatives as anticancer and radiosensitizing
agents. Arzneimittelforschung 2012, 62, 105–112. 15. Ghorab, M.M.; Ragab, F.A.; Heiba, H.I.; Hanan, A.Y.; El-Gazzar, M.G. Synthesis of
novel pyrazole and pyrimidine derivatives bearing sulfonamide moiety as antitumor and radiosensitizing agents. Med. Chem. Res. 2012, 21, 1376–1383.
16. Ghorab, M.M.;Heiba, H.I.; Hassan, A.A.; Abd El-Aziz, A.B.; El-Gazzar, M.G. Antimicrobial evaluation of novel pyrrole, pyrazole, pyrimidine and pyrrolo [2,3-d]-pyrimidine derivatives brearing sulfonamide moiety. J. Am. Sci. 2011, 7, 1064–1073.
17. Ghorab, M.M.; Ragab, F.A.; Heiba, H.I.; Youssef, H.A.; Galal, M. Synthesis of some new pyrazole and pyrimidine derivatives carrying a sulfonamide moiety of expected antitumor activity and study of the synergistic effect of gamma-irradiation. Arzneimittelforschung 2010, 60, 48–55.
81
18. Ghorab, M.M.; Alsaid, M.S.; Nissan, Y.M. Dapson in heterocyclic chemistry, part V: Synthesis, molecular docking and anticancer activity of some novel sulfonylbiscompounds carrying biologically active dihydropyridine, dihydroisoquinoline, 1,3-dithiolan, 1,3-dithian, acrylamide, pyrazole, pyrazolopyrimidine and benzochromenemoieties. Chem. Pharm. Bull. (Tokyo) 2012, 60, 1019–1028.
19. Mohareb, R.M.; Sherif, S.M.; Zohdi, H.F. Heterocyclic synthesis with enamines: Convenient synthesis of polyfunctionally substituted pyrazole, pyridine, pyrimidine and pyrazolo[3,4-d]pyrimidine derivatives. J. Chin. Chem. Soc. 1993, 40, 181–187.
20. Mohamed, A.M.; El-Sayed, W.A.; Alsharari, M.A.; Al-Qalawi, H.R.; Germoush, M.O. Anticancer activities of some newly synthesized pyrazole and pyrimidine derivatives. Arch. Pharm. Res. 2013, 36, 1055–1065.
21. Ghorab, M.M.; Ragab, F.A.; Heiba, H.I.; Youssef, H.A.; El-Gazzar, M.G. Synthesis of novel pyrrole and pyrrolo[2,3-d]pyrimidine derivatives bearing sulfonamide moiety for evaluation as anticancer and radiosensitizing agents. Bioorg. Med. Chem. Lett. 2010, 20, 6316–6320.
22. Al-Issa, S.A. Synthesis and anticancer activity of some fused pyrimidines and related heterocycles. Saudi Pharm. J. 2013, 21, 305–316.
23. Skehan, P.; Storeng, R.; Scudiero, D.; Monks, A.; McMahon, J.; Vistica, D.; Warren, J.T.; Bokesch, H.; Kenney, S.; Boyd, M.R. New colorimetric cytotoxicity assay for anticancer-drug screening. J. Natl. Cancer Inst. 1990, 82, 1107–1112.
24. Rubinstein, L.V.; Shoemaker, R.H.; Paull, K.D.; Simon, R.M.; Tosini, S.; Skehan, P.; Scudiero, D.A.; Monks, A.; Boyd, M.R. Comparison of in vitro anticancer-drug-screening data generated with a tetrazolium assay vs. a protein assay against a diverse panel of human tumor cell lines. J. Natl. Cancer Inst. 1990, 82, 1113–1118.

82
The Discovery of Potentially Selective Human Neuronal Nitric
Oxide Synthase (nNOS) Inhibitors: A Combination of
Pharmacophore Modelling, CoMFA, Virtual Screening and
Molecular Docking Studies
Guanhong Xu, Yue Chen, Kun Shen, Xiuzhen Wang, Fei Li and Yan He
Abstract: Neuronal nitric oxide synthase (nNOS) plays an important role in neurotransmission and smooth muscle relaxation. Selective inhibition of nNOS over its other isozymes is highly desirable for the treatment of neurodegenerative diseases to avoid undesirable effects. In this study, we present a workflow for the identification and prioritization of compounds as potentially selective human nNOS inhibitors. Three-dimensional pharmacophore models were constructed based on a set of known nNOS inhibitors. The pharmacophore models were evaluated by Pareto surface and CoMFA (Comparative Molecular Field Analysis) analyses. The best pharmacophore model, which included 7 pharmacophore features, was used as a search query in the SPECS database (SPECS®, Delft, The Netherlands). The hit compounds were further filtered by scoring and docking. Ten hits were identified as potential selective nNOS inhibitors.
Reprinted from Int. J. Mol. Sci. Cite as: Xu, G.; Chen, Y.; Shen, K.; Wang, X.; Li, F.; He, Y. The Discovery of Potentially Selective Human Neuronal Nitric Oxide Synthase (nNOS) Inhibitors: A Combination of Pharmacophore Modelling, CoMFA, Virtual Screening and Molecular Docking Studies. Int. J. Mol. Sci. 2014, 15, 8553-8569.
1. Introduction
Nitric oxide (NO) is one of the most studied biological signaling molecules and is produced by catalysis from nitric oxide synthase (NOS), which converts L-arginine to L-citrulline, and produces this tiny, short-lived molecule. To date, there are three distinct isoforms of NOS: neuronal NOS (nNOS), endothelial NOS (eNOS) and inducible NOS (iNOS). nNOS and eNOS are constitutively expressed and depend on increases in external calcium and binding of a calcium/calmodulin complex for activation. nNOS and eNOS play an important role in neurotransmission and smooth muscle relaxation, respectively, and iNOS is expressed during bacterial infection, tumor cell cytolysis and inflammation [1–3].
As an inorganic reactive free radical gas, NO is believed to be involved in a number of physiological processes such as inflammation, neurotransmission, blood pressure regulation, platelet aggregation and pain [4–6]. However, overproduction of NO has been implicated in numerous disease states [7]. In particular, excess NO in the central nervous system from nNOS activity can lead to many neurological disease states including neurodegeneration during Alzheimer’s and Parkinson’s diseases [8], altered spinal transmission of neuropathic pain [9,10], and progression of migraine and chronic tension-type headaches [11]. Consequently, an inhibitor of nNOS has the potential to be therapeutic in these diseases; however, the functions of eNOS in blood pressure

83
regulation and iNOS in immune responses must be preserved, and the selective inhibition of nNOS has been the challenge of many researchers in the past decade [12–15].
Recently, several categories of selective inhibitors of nNOS have been designed and developed for the treatment of central nervous system (CNS) disorders [3,15–22]. Some showed significant efficacy in the rat Chung model of neuropathic pain [22] and in a rodent model of dural inflammation relevant to migraine pain [22]. X-ray structures of nNOS co-crystallized with various ligands [23–25] provided insights into the essential structural elements and motifs central to its catalytic mechanism and mode of binding. These findings provide useful information about the interaction between the ligands and the residues near the binding site and can be utilized to design even more selective and potent drug-like NOS inhibitors.
Virtual screening based on a pharmacophore model as a 3D search query has been successfully employed as an efficient alternative to high throughput screening approaches for the development of new compounds with the desired biological properties [26]. Pharmacophore modeling can be used to analyze the common functional groups responsible for specific drug receptor interactions or as a prelude to three dimensional quantitative structure activity relationship (3D-QSAR) analyses that are aligned accordingly with a set of known active compounds in 3D space. 3D-QSAR has been successfully applied in drug discovery and design. As a popular QSAR method, Comparative Molecular Field Analysis (CoMFA) [27] studies incorporate 3D information of the ligands by searching for the sites on molecules that are capable of being modified into more specific ligands. As a useful methodology for studying interaction mechanisms, receptor based molecular docking analysis can be used as a complementary tool to prioritize the hits from the pharmacophore-based virtual screening [28].
In the present study, a 3D pharmacophore model for nNOS inhibitors was assembled and the generated model was used as a search query in the SPECS database containing 197,000 compounds. The virtual screening approach, in combination with pharmacophore modeling and molecular docking can be used to identify and design novel nNOS inhibitors with high selectivity. These molecules may be potential lead compounds for future drug development.
2. Results and Discussion
2.1. Pharmacophore Results
Twenty pharmacophore models were generated using SYBYL X 1.3 (Tripos Associates Inc., St. Louis, MO, USA). Table 1 lists the parameters of each model. Specificity is a logarithmic indicator of the expected discrimination for each query and is based on the number of features it contains, their allotment across partial match constraints, and the degree to which the features are separated in space. Strong models should have a high Specificity value. Generally, the Specificity value should be at least 5 in a pharmacophore model used as the query for a UNITY flex search [29]. For this study, MODEL 012, MODEL 019, and MODEL 003 had the high Specificity values of 5.138, 5.128 and 4.8580, respectively. These models yielded reasonable pharmacophore models. The N_HITS column shows the actual number of ligands hit by the model query, with the majority of the models matching at least 5 ligands. The value in the FEATS column indicates the total number of features possessed by each model. All of the models had six or more features except for

84
MODEL 011. The retained models had a PARETO rank value of 0, indicating that a single model is not superior to any other. The HBOND term is a measure of the overall pharmacophoric similarity among the ligand conformers. The STERIC term is a measure of the overall steric similarity among the ligand conformers; this term is basically the same as the HBOND term. The ENERGY term indicates the total energy (using the Tripos force field) of all molecules in the training set.
Table 1. Parameters of the pharmacophore model a.
No. SPECIFICITY N_HITS FEATS PARETO ENERGY STERICS HBOND
MOEDL_001 4.180 4 6 0 15.60 666.7 173.3 MOEDL_002 3.881 8 7 0 15.44 703.1 161.8 MOEDL_003 4.858 6 8 0 18.53 750.4 155.1 MOEDL_004 4.108 6 6 0 18.62 712.0 166.6 MOEDL_005 3.823 9 7 0 20.15 852.7 162.7 MOEDL_006 3.735 6 7 0 17.54 714.7 160.5 MOEDL_007 3.902 9 7 0 58.38 705.2 179.2 MOEDL_008 4.051 6 6 0 19.3 784.6 171.4 MOEDL_009 4.036 3 6 0 40.81 845.3 159.5 MOEDL_010 3.393 5 9 0 35.12 612.2 178.2 MOEDL_011 3.158 6 5 0 22.40 635.3 178.9 MOEDL_012 b 5.138 5 7 0 41.13 870.1 166.1 MOEDL_013 4.048 6 6 0 17.75 732.8 157.0 MOEDL_014 4.124 6 6 0 19.25 861.2 160.2 MOEDL_015 3.867 8 7 0 19.99 567.7 175.3 MOEDL_016 4.050 5 6 0 23.76 834.0 165.7 MOEDL_017 4.053 5 6 0 14.97 658.9 150.8 MOEDL_018 4.058 5 6 0 55.07 859.6 162.8 MOEDL_019 5.128 4 7 0 23.06 654.1 168.0 MOEDL_020 4.050 5 6 0 16.91 748.1 158.3
a SPECIFICITY is a logarithmic indicator of the expected discrimination for each query; N_HITS is the actual number of ligands hit by the model query; FEATS is the total number of features in the model query; PARETO indicates the Pareto rank of the each model; ENERGY is the total energy of the model; STERICS is the steric overlap for the model; HBOND is the pharmacophoric concordance; b The selected model (MODEL_012) is indicated in boldface.
The most significant pharmacophore hypothesis was characterized by the conflicting demands of maximizing pharmacophore consensus, maximizing steric consensus, and minimizing conformer potential energy [30]. We constructed a 3D plot to visualize the Pareto surface and select the best pharmacophore model (Figure 1). Considering only the ENERGY and STERICS criteria, the best model is shown in the upper left-hand corner of the graph in Figure 1b, where the ENERGY is low and the STERICS score is high. In terms of ENERGY and HBOND criteria, the best model is shown in the lower part of the graph in Figure 1c, where the ENERGY is low and the HBOND score is high. Finally, in terms of ENERGY and HBOND, the best model is shown in the upper part of the graph, where both scores are high (Figure 1d). Among the considered models,

85
MODEL_012 (represented with a red cross in Figure 1) has the optimal position because it fulfills the three criteria and it has the highest Specificity value [31].
The best GALAHAD MODEL 012 is displayed in Figure 2. All of the aligned conformers represent low-energy conformations of the molecules, and the final alignment shows a satisfactory superimposition of the pharmacophoric points. Cyan, magenta, green and red spheres indicate hydrophobes, donor atoms, acceptor atoms and positive nitrogens, respectively. Model 012 includes 7 pharmacophore features: three hydrophobes (HY_1, HY_2 and HY_3), one donor atom (DA_4), one acceptor atom (AA_5) and two positive nitrogens (NP_6 and NP_7). The magenta sphere is covered by a green sphere because the donor atom and the acceptor atom are in the same position in this molecule.
Figure 1. Plot of the STERICS, ENERGY and HBOND values for the models with the top ten Specificity values. (a) 3D plot; (b) plot of STERICS vs. ENERGY; (c) plot of ENERGY vs. HBOND; (d) plot of STERICS vs. HBOND. The red cross represents MODEL_12.

86
Figure 2. Selected pharmacophore MODEL_012 and the molecular alignment of the compounds used to elaborate the model.
2.2. CoMFA (Comparative Molecular Field Analysis) Statistical Results
We used MODEL 012 as a template to align all molecules. The generated steric and electrostatic fields were scaled by the CoMFA-Standard scaling method in SYBYL with the default energy cutoff value. The CoMFA model yielded a good cross-validated correlation coefficient (q2) of 0.513 with an optimized component value of 4, which suggests that the model should be a useful tool for predicting the IC50 values. A high non-cross-validated correlation coefficient (r2
ncv) of 0.933 with a low standard error estimate (SEE) of 0.134 and an f value of 149.950 were obtained. The steric and electrostatic contributions were 45.1% and 54.9%, respectively. The predicted activities for the inhibitors are listed in Table 2 and the correlation between the predicted activities and the experimental activities is depicted in Figure 3. The predictive correlation coefficient (r2
pred) was 0.742 for the test set. The statistical results indicate that the CoMFA model is a reliable predictor.
Table 2. Structure and biological values (pIC50) of nNOS inhibitors.
No. Structure pIC50
Observed Predicted
S
HN
NHN O
YX
series 1 [22] - X Y - - 1 H N(CH3)2 6.237 6.089
2 * H N(Et)2 5.656 5.750
3 H N
6.108 5.922
4 H N
6.796 6.650
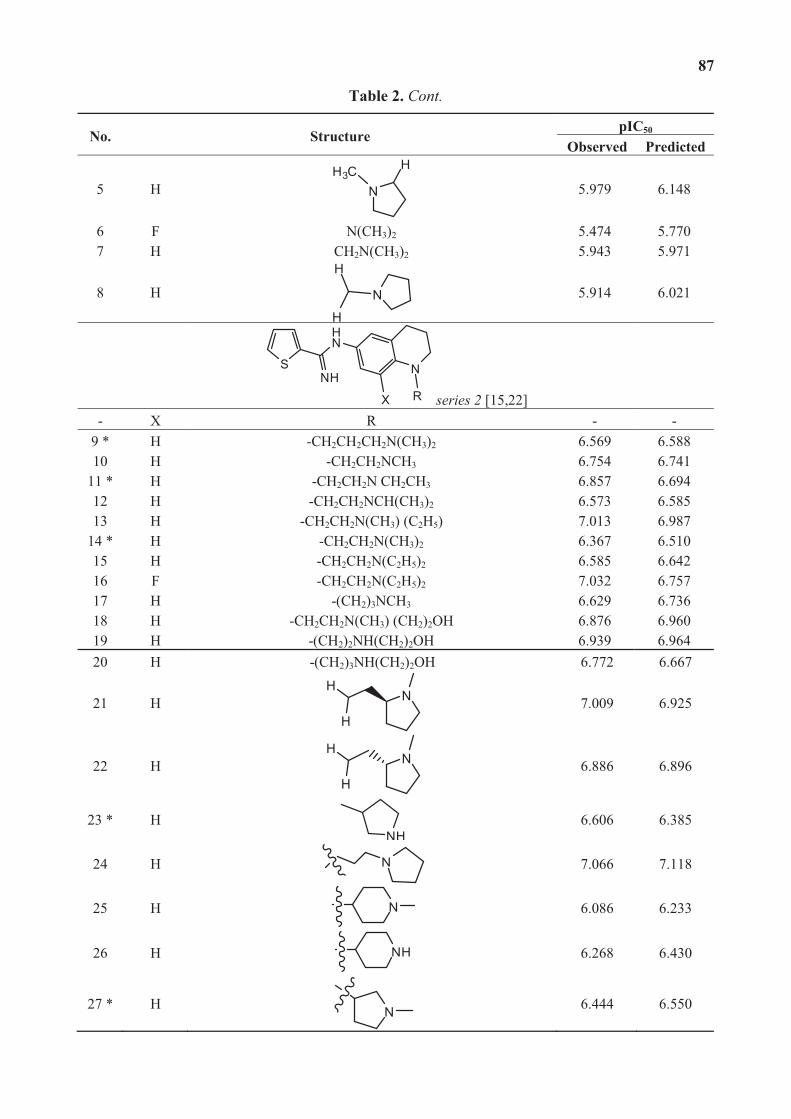
87
Table 2. Cont.
No. Structure pIC50
Observed Predicted
5 H NH3C
H
5.979 6.148
6 F N(CH3)2 5.474 5.770 7 H CH2N(CH3)2 5.943 5.971
8 H N
H
H
5.914 6.021
S
HN
NHN
RX series 2 [15,22] - X R - -
9 * H -CH2CH2CH2N(CH3)2 6.569 6.588 10 H -CH2CH2NCH3 6.754 6.741
11 * H -CH2CH2N CH2CH3 6.857 6.694 12 H -CH2CH2NCH(CH3)2 6.573 6.585 13 H -CH2CH2N(CH3) (C2H5) 7.013 6.987
14 * H -CH2CH2N(CH3)2 6.367 6.510 15 H -CH2CH2N(C2H5)2 6.585 6.642 16 F -CH2CH2N(C2H5)2 7.032 6.757 17 H -(CH2)3NCH3 6.629 6.736 18 H -CH2CH2N(CH3) (CH2)2OH 6.876 6.960 19 H -(CH2)2NH(CH2)2OH 6.939 6.964 20 H -(CH2)3NH(CH2)2OH 6.772 6.667
21 H NH
H
7.009 6.925
22 H NH
H
6.886 6.896
23 * H NH
6.606 6.385
24 H N
7.066 7.118
25 H N
6.086 6.233
26 H NH
6.268 6.430
27 * H N
6.444 6.550

88
Table 2. Cont.
No. Structure pIC50
Observed Predicted
X
HN
NH
HN
R series 3 [21] - X R - -
28 S N
6.699 6.694
29 S N
6.097 6.225
30 S N 6.921 6.701
31 S N
5.824 5.830
32 S N
6.347 6.304
X
HN
NHN
R series 4 [17] - X R - -
33 S N-(1-(3-(dimethylamino)propyl)- 6.328 6.419 34 * S N-(1-(3-(cyclopropylamino)propyl)- 6.585 6.366 35 S N-(1-(3-morpholinopropyl)- 6.181 6.120 36 S N-(1-(3-((1-ethylpyrrolidin-2-yl)methylamino)propyl)- 6.886 6.700 37 S N-(1-(3-adamantanaminopropyl)- 6.444 6.388 38 S N-(1-(2-(dimethylamino)ethyl)- 6.770 6.736 39 S N-(1-(2-(piperidin-1-yl)ethyl)- 6.770 6.930 40 S N-(1-(2-(1-methylpiperidin-2-yl)ethyl)- 7.046 7.131 41 S (S) N-(1-(2-(1-methylpyrrolidin-2-yl)ethyl)- 7.700 7.564 42 O N-(1-(2-(1-methylpyrrolidin-2-yl)ethyl)- 6.602 6.824 43 S N-(1-(1-methylazepan-4-yl)- 6.921 6.893 44 O N-(1-(1-methylazepan-4-yl)- 6.367 6.443
45 * S N-(1-(8-methyl-8-azabicyclo[3.2.1]octan-3-yl)- 6.120 6.168 46 S N-(1-(quinuclidin-3-yl)- 6.444 6.417 47 S N-(1-(1-methylpiperidin-4-yl)- 6.387 6.286
SNH
N
SNHRHN
6
5 series 5 [16]

89
Table 2. Cont.
No. Structure pIC50
Observed Predicted
Substituted R 48 5 2-(Pyridin-2-yl)ethyl 5.959 6.025 49 5 2-Morpholinoethyl 5.886 5.976
50 * 5 1-Benzylpiperidin-4-yl 6.398 6.281 51 5 1-(4-Fluorobenzyl)piperidin-4-yl 6.097 5.986 52 5 (±)-2-(1-Methylpyrrolidin-2-yl)ethyl 7.523 7.582 53 6 2-(Pyridin-2-yl)ethyl 5.886 5.83 54 6 2-Morpholinoethyl 5.699 5.676 55 6 1-Benzylpiperidin-4-yl 6.301 6.216 56 6 1-(4-Fluorobenzyl)piperidin-4-yl 6.699 5.779
57 * 6 2-(1H-Imidazol-5-yl)ethyl 6.523 6.789 58 6 4-Bromophenethyl 5.357 5.188 59 6 Tetrahydro-2H-pyran-4-yl 5.699 5.736
* Compounds taken for the test set.
Figure 3. Correlation between the experimental and CoMFA (Comparative Molecular Field Analysis) predicted activities of compounds.
The CoMFA steric and electrostatic contour maps are shown in Figure 4 using compound 41 as a reference structure. In Figure 4a, the blue contour indicates regions in which an increase of positive charge enhances the activity, and the red contour indicates regions in which more negative charges are favorable for activity. The two large blue contours around the red sphere indicate that the substituent in this region should be electron deficient for increased binding affinity with a protein. Another small blue contour is found around the guanidine isosteric group indicating that a negatively charged substituent in this area is unfavorable. The CoMFA model showed the same result as the pharmacophore hypothesis. In Figure 4b, the steric field is represented by green and yellow contours, in which the green contours indicate regions where a bulky group is favorable and

90
the yellow regions represent regions where a bulky group will decrease activity. In this case, the green contours around the substituent R demonstrated that bulky groups enhance the binding affinity of the nNOS. Most compounds with high activities in this dataset have the same such properties. The CoMFA contour maps and the predicted result further indicated that MODEL 012 can be used as a theoretical screening tool that is able to discriminate between active and inactive molecules [31].
Figure 4. (a) CoMFA steric contour maps and (b) CoMFA electrostatic contour maps.
2.3. Virtual Screening
The pharmacophore based virtual screening was conducted to find potential nNOS inhibitors. A stepwise virtual screening procedure was applied, wherein the pharmacophore based virtual screening was followed by drug-likeness evaluation, screening of the pharmacophore query, QFIT (The QFIT score is a value between 0 and 100, where 100 is best and represents how close the ligand atoms match the query target coordinates within the range of a spatial constraint tolerance) scoring filtration, and a molecular docking study. The sequential virtual screening flowchart we employed is depicted in Figure 5, in which the reduction in the number of hits for each screening step is shown.
2.3.1. Database Searching
Flexible 3D screening was performed using the UNITY tool to screen the SPECS database [32], which contains approximately 197,000 compounds. The database query was generated based on the pharmacophore MODEL 012. The database was restricted with Lipinski's rule. In general, this rule describes molecules that have drug-like properties. Drug-likeness is a property that is most often

91
used to characterize compound libraries such as combinatorial or screening libraries that are screened to find novel lead chemical compounds [33]. According to this rule, we used simple molecular descriptors, such as molecular weight (≤500), hydrophobicity (MLogP ≤ 4.15) and the number of H-bond donor (≤5) and acceptor atoms (≤10), as the first filter to select the molecules with good absorption or permeation [34]. The remaining 223 compounds were further screened on the basis of QFIT to reduce the dataset, where QFIT is the pharmacophore match between the query and hit [35].
Figure 5. Virtual screening flowchart.
2.3.2. Molecular Docking
To predict the appropriate binding conformation for nNOS inhibitors and the reported hit compounds from virtual screening, Surflex Docking (Tripos Associates Inc., St. Louis, MO, USA) was used to generate an ensemble of docking conformations. The top 62 hit compounds with the highest QFIT score from screening after UNITY filtering were further screened using molecular docking into the binding site of nNOS to select the compounds with the ability to form favorable interactions with the active site. The docked compounds were filtered based on scoring function and interaction with the crucial residues [24] in the binding site. Finally, ten compounds were selected on the basis of the dock score and favorable interactions with the key residues. The results of the hit compounds with their dock score and QFIT values are shown in Table 3. Among the active compounds reported [24], AG_205/36953325 has a similar linker length and two aromatic ring centers on both ends. There is also a hydrogen bond donor in the aromatic ring center and at least one hydrogen bond donor on the linker. The phenolic hydroxyl makes a hydrogen bond with the NOS active site GLU592, which is conserved in all mammalian NOS isoforms [24], and the hydrophobic phenyl ring π-stacks with the heme (HEM801) next to the GLU. The long, flexible linker extending from the phenyl ring allows the 2-phenyl-2,3-dihydro-1H-pyrazole to reach and to π-stack with TYR706 (Figure 6). The binding mode of this hit compound is similar to that of the

92
reported co-crystallized compound [24] and indicates that the identified hit compounds may have the same mechanism of action as known nNOS inhibitors.
Table 3. Chemical structures of the hit compounds and their dock scores and QFIT values.
SPECS ID Structure Dock Scores QFIT
AG_205/36953325
OH
N
N
SS NH
O
N N
O
8.29 65.74
AG_205/11218159 Br
OH
N
N
SS NH
O
N N
O 8.20 65.74
AG_205/11218337
N
N
SS NH
O
Br
O
O
Br
8.01 65.82
AG_205/11218321
N
N
SS NH
O
F
O
O
7.86 65.82
AG_205/36564022
OH
N
N
SS
O
NHO
7.65 65.82
AG_205/36953138 N
N
SS NH
O
O
O
OH
7.63 65.81
AG_205/09949027
F
S
NS
N
O7.34 65.82
AG_205/36953406 N
N
S S
OO2N
OH
F
6.78 65.82
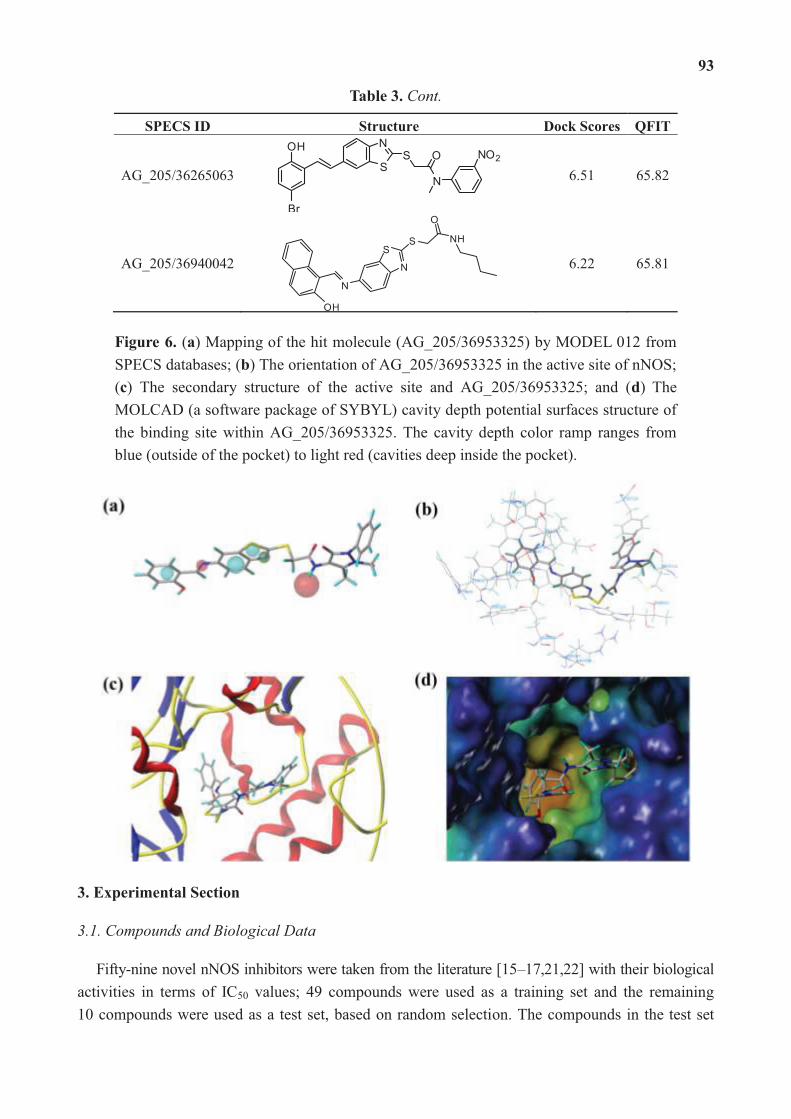
93
Table 3. Cont.
SPECS ID Structure Dock Scores QFIT
AG_205/36265063 S
NS
N
O
Br
OHNO2
6.51 65.82
AG_205/36940042 N
N
SS NH
O
OH
6.22 65.81
Figure 6. (a) Mapping of the hit molecule (AG_205/36953325) by MODEL 012 from SPECS databases; (b) The orientation of AG_205/36953325 in the active site of nNOS; (c) The secondary structure of the active site and AG_205/36953325; and (d) The MOLCAD (a software package of SYBYL) cavity depth potential surfaces structure of the binding site within AG_205/36953325. The cavity depth color ramp ranges from blue (outside of the pocket) to light red (cavities deep inside the pocket).
3. Experimental Section
3.1. Compounds and Biological Data
Fifty-nine novel nNOS inhibitors were taken from the literature [15–17,21,22] with their biological activities in terms of IC50 values; 49 compounds were used as a training set and the remaining 10 compounds were used as a test set, based on random selection. The compounds in the test set

94
have a range of biological activity values similar to that of the training set. The IC50 values of the inhibitors were converted into pIC50 (log (1/IC50)) and used as dependent variables in the Pharmacophore generation and CoMFA calculations. The structures of the compounds and their pIC50 values are given in Table 2. All molecular modeling calculations were conducted using SYBYL X 1.3 (Tripos Associates Inc.). Molecular building was performed with a molecule sketch program in the same software. The molecular geometry of each compound was first minimized using the standard Tripos molecular mechanics force field with 0.01 kcal/(mol A) energy gradient convergence criterion. Partial atomic charges were calculated by the Gasteiger-Hückel method and energy minimizations were performed using the Conjugate Gradient method with 1000 iterations [36,37].
3.2. Pharmacophore Generation
Pharmacophore models were generated and analyzed using the GALAHAD module. In this study, ten compounds (13, 16, 19, 21, 24, 30, 40, 41, 43, and 52) were selected to carry out the pharmacophore hypothesis, and the genetic algorithm was used to create conformers for all molecules. The compounds that were selected to generate the pharmacophore hypothesis are highly active. All of the ligands were aligned with a population size value of 60, a maximum generation value of 60 and a value of molecular required hitting of 5. Twenty models were generated with default parameters.
3.3. CoMFA Field Calculation Partial Least Square Analysis
The standard CoMFA procedure as implemented by SYBYL X 1.3 (Tripos Associates Inc.) was performed. Each set of aligned molecules was positioned inside a 3D cubic lattice with a grid spacing of 2.0 A (default distance) in all Cartesian directions and was generated to enclose the molecule aggregate. The fields generated were automatically scaled by the CoMFA standard in SYBYL. The partial least squares (PLS) methodology was used to derive a linear relationship for the CoMFA, and cross-validation was performed using the leave-one-out (LOO) method to choose the optimum number of components (ONC) and assess the statistical significance of each model. In PLS, the independent variables were the CoMFA descriptors, and the pIC50 values were used as dependent variables. The ONC was the number of components that led to the highest cross-validated correlated correlation coefficient q2 (or r2
cv). Non-cross-validation was performed to calculate conventional r2
ncv using the same number of components [38–40].
3.4. Virtual Screening
The selected pharmacophore model was validated and converted into a UNITY query for pharmacophore guided virtual screening studies. The query was screened against the SPECS database. The flex search option was implemented to perform virtual screening. Primary filters such as Lipinski’s rule of five were applied to reduce the dataset. Further screening of the hits was carried out using the Surflex Dock in SYBYL.
The docking study was performed to validate the hits obtained from the virtual screening. The crystal structure of nNOS was retrieved from the RCSB Protein Data Bank (PDB code: 4EUX) [24].

95
The nNOS structure was utilized in subsequent docking experiments without energy minimization. Protein structures were prepared using the biopolymer module of SYBYL. Hydrogen atoms were added to the structure, atom types and charges were assigned using AMBER7 FF99 force field, and side chain amides were modified. The ligand method was used as the mode of construction for the protomol, threshold and bloat using default values to determine the extent of the protomol.
4. Conclusions
nNOS is a therapeutic target for central nervous system diseases that has attracted interest from pharmaceutical companies and researchers. Selective inhibition of nNOS activity represents an exciting drug approach for the development of new therapeutic agents to treat neurodegenerative diseases. In this study, we described a rational strategy for identifying novel nNOS inhibitors using a pharmacophore-based virtual screening protocol. The best pharmacophore model (MODEL 012) was established and showed good statistical parameters in the validation process. MODEL 012 was further employed as a 3D search query to screen the SPECS compound database. Molecular docking studies were also performed to improve the reliability and accuracy of the virtual screening. Ten hit compounds were identified as potential selective nNOS inhibitors and exhibited good search scoring, high docking scores, similar binding mode to experimentally proven compounds and favorable drug-like properties. The pharmacophore models developed in this work, and the information gained about the interactions between nNOS and the potential selective inhibitors, indicated that the combination of pharmacophore, molecular docking, and virtual screening efforts is a successful approach for identifying effective inhibitory compounds that may have an impact on future experimental studies in selective nNOS inhibition. The identified hit compounds were structurally different from available inhibitors and may serve as potential leads or starting points for structural optimization to identify novel nNOS inhibitors.
Acknowledgments
The authors gratefully acknowledge the support of this work by the Natural Science Foundation of China (No. 21172108), Natural Science Foundation of Jiangsu Education Committee (No. 12KJB350003) and Science and Technology Development Foundation of Nanjing Medical University (No. 2013NJMU023 and 2013NJMU098).
Author Contributions
G.X. performed all experiments and data treatments. Writing was done by G.X., Y.C., K.S., X.W. and F.L., and management and submission tasks were done by F.L., Y.H. and G.X.
Conflicts of Interest
The authors declare no conflict of interest.

96
References
1. Alderton, W.K.; Cooper, C.E.; Knowles, R.G. Nitric oxide synthases: Structure, function and inhibition. Biochem. J. 2001, 357, 593–615.
2. Stuehr, D.J. Structure-function aspects in the nitric oxide synthases. Annu. Rev. Pharmacol. Toxicol. 1997, 37, 339–359.
3. Gabriela, M.; Subhash, C.A.; Jailall, R.; Shawn, P.M.; Suman, R.; John, S.A.; Dongqin, Z.; Frank, P. First-in-class, dual-action, 3,5-disubstituted indole derivatives having human nitric oxide synthase (nNOS) and norepinephrine reuptake inhibitory (NERI) activity for the treatment of neuropathic pain. J. Med. Chem. 2012, 55, 3488–3501.
4. Mustafa, A.K.; Gadalla, M.M.; Snyder, S.H. Signaling by gasotransmitters. Sci. Signal 2009, 2, doi:10.1126/scisignal.268re2.
5. Hao, J.X.; Xu, X.J. Treatment of a chronic allodynia-like response in spinally injured rats: Effects of systemically administered nitric oxide synthase inhibitors. Pain 1996, 66, 313–319.
6. Moncada, S.; Palmer, R.M.; Higgs, E.A. Nitric oxide: Physiology, pathophysiology, and pharmacology. Pharmacol. Rev. 1991, 43, 109–142.
7. Vallance, P.; Leiper, J. Blocking NO synthesis: How, where and why? Nat. Rev. Drug Discov. 2002, 1, 939–950.
8. Calabrese, V.; Mancuso, C.; Calvani, M.; Rizzarelli, E.; Butterfield, D.A.; Stella, A.M. Nitric oxide in the central nervous system: Neuroprotection versus neurotoxicity. Nat. Rev. Neurosci. 2007, 8, 766–775.
9. Tanabe, M.; Nagatani, Y.; Saitoh, K.; Takasu, K.; Ono, H. Pharmacological assessments of nitric oxide synthase isoforms and downstream diversity of NO signaling in the maintenance of thermal and mechanical hypersensitivity after peripheral nerve injury in mice. Neuropharmacology 2009, 56, 702–708.
10. Miclescu, A.; Gordh, T. Nitric oxide and pain: “Something old, something new”. Acta Anaesthesiol. Scand. 2009, 53, 1107–1120.
11. Gruber, H.J.; Bernecker, C.; Lechner, A.; Weiss, S.; Wallner-Blazek, M.; Meinitzer, A.; Höbarth, G.; Renner, W.; Fauler, G.; Horejsi, R.; et al. Increased nitric oxide stress is associated with migraine. Cephalalgia 2010, 30, 486–492.
12. Payne, J.E.; Bonnefous, C.; Symons, K.T.; Nguyen, P.M.; Sablad, M.; Rozenkrants, N.; Zhang, Y.; Wang, L.; Yazdani, N.; Shiau, A.K.; et al. Discovery of dual inducible/neuronal nitric oxide synthase (iNOS/nNOS) inhibitor development candidate 4-((2-cyclobutyl-1H-imidazo[4,5-b]pyrazin-1-yl)methyl)-7,8-difluoroquinolin-2(1H)-one (KD7332) part 2: Identification of a novel, potent, and selective series of benzimidazole-quinolinone iNOS/nNOS dimerization inhibitors that are orally active in pain models. J. Med. Chem. 2010, 53, 7739–7755.
13. Erdal, E.P.; Litzinger, E.A.; Seo, J.; Zhu, Y.; Ji, H.; Silverman, R.B. Selective neuronal nitric oxide synthase inhibitors. Curr. Top. Med. Chem. 2005, 5, 603–624.
14. Silverman, R.B. Design of selective neuronal nitric oxide synthase inhibitors for the prevention and treatment of neurodegenerative diseases. Acc. Chem. Res. 2009, 42, 439–451.

97
15. Ramnauth, J.; Renton, P.; Dove, P.; Annedi, S.C.; Speed, J.; Silverman, S.; Mladenova, G.; Maddaford, S.P.; Zinghini, S.; Rakhit, S.; et al. 1,2,3,4-Tetrahydroquinoline-based selective human neuronal nitric oxide synthase (nNOS) inhibitors: Lead optimization studies resulting in the identification of N-(1-(2-(methylamino)ethyl)-1,2,3,4-tetrahydroquinolin-6-yl)thiophene-2-carboximi damide as a preclinical development candidate. J. Med. Chem. 2012, 55, 2882–2893.
16. Patman, J.; Bhardwaj, N.; Ramnauth, J.; Annedi, S.C.; Renton, P.; Maddaford, S.P.; Rakhit, S.; Andrews, J.S. Novel 2-aminobenzothiazoles as selective neuronal nitric oxide synthase inhibitors. Bioorg. Med. Chem. Lett. 2007, 17, 2540–2544.
17. Renton, P.; Speed, J.; Maddaford, S.; Annedi, S.C.; Ramnauth, J.; Rakhit, S.; Andrews, J. 1,5-Disubstituted indole derivatives as selective human neuronal nitric oxide synthase inhibitors. Bioorg. Med. Chem. Lett. 2011, 21, 5301–5304.
18. Maddaford, S.; Renton, P.; Speed, J.; Annedi, S.C.; Ramnauth, J.; Rakhit, S.; Andrews, J.; Mladenova, G.; Majuta, L.; Porreca, F. 1,6-Disubstituted indole derivatives as selective human neuronal nitric oxide synthase inhibitors. Bioorg. Med. Chem. Lett. 2011, 21, 5234–5238.
19. Annedi, S.C.; Maddaford, S.P.; Ramnauth, J.; Renton, P.; Speed, J.; Rakhit, S.; Andrews, J.S.; Porreca, F. 3,5-Disubstituted indole derivatives as selective human neuronal nitric oxide synthase (nNOS) inhibitors. Bioorg. Med. Chem. Lett. 2012, 22, 1980–1984.
20. Annedi, S.C.; Ramnauth, J.; Maddaford, S.P.; Renton, P.; Rakhit, S.; Mladenova, G.; Dove, P.; Silverman, S.; Andrews, J.S.; Felice, M.D.; et al. Discovery of cis-N-(1-(4-(methylamino) cyclohexyl)indolin-6-yl)thiophene-2-carboximidamide: a 1,6-disubstituted indoline derivative as a highly selective inhibitor of human neuronal nitric oxide synthase (nNOS) without any cardiovascular liabilities. J. Med. Chem. 2012, 55, 943–955.
21. Annedi, S.C.; Maddaford, S.P.; Mladenova, G.; Ramnauth, J.; Rakhit, S.; Andrews, J.S.; Lee, D.K.; Zhang, D.; Porreca, F.; Bunton, D.; et al. Discovery of N-(3-(1-methyl-1,2,3,6-tetrahydropyridin-4-yl)-1H-indol-6-yl) thiophene-2-carboximidamide as a selective inhibitor of human neuronal nitric oxide synthase (nNOS) for the treatment of pain. J. Med. Chem. 2011, 54, 7408–7416.
22. Ramnauth, J.; Speed, J.; Maddaford, S.P.; Dove, P.; Annedi, S.C.; Renton, P.; Rakhit, S.; Andrews, J.; Silverman, S.; Mladenova, G.; et al. Design, synthesis, and biological evaluation of 3,4-dihydroquinolin-2(1H)-one and 1,2,3,4-tetrahydroquinoline-based selective human neuronal nitric oxide synthase (nNOS) inhibitors. J. Med. Chem. 2011, 54, 5562–5575.
23. Xue, F.; Li, H.; Delker, S.L.; Fang J.; Martásek, P.; Roman, L.J.; Poulos, T.L.; Silverman, R.B. Potent, highly selective, and orally bioavailable gem-difluorinated monocationic inhibitors of neuronal nitric oxide synthase. J. Am. Chem. Soc. 2010, 132, 14229–14238.
24. Huang, H.; Ji, H.; Li, H.; Jing, Q.; Labby, K.J.; Martásek, P.; Roman, L.J.; Poulos, T.L.; Silverman, R.B. Selective monocationic inhibitors of neuronal nitric oxide synthase. Binding mode insights from molecular dynamics simulations. J. Am. Chem. Soc. 2012, 134, 11559–11572.
25. Delker, S.L.; Ji, H.; Li, H.; Jamal, J.; Fang, J.; Xue, F.; Silverman, R.B.; Poulos, T.L. Unexpected binding modes of nitric oxide synthase inhibitors effective in the prevention of a cerebral palsy phenotype in an animal model. J. Am. Chem. Soc. 2010, 132, 5437–5442.

98
26. Klebe, G. Virtual ligand screening: Strategies, perspectives and limitations. Drug Discov. Today 2006, 11, 580–594.
27. Cramer, R.D.; Patterson, D.E.; Bunce, J.D. Comparative molecular field analysis (CoMFA). 1. Effect of shape on binding of steroids to carrier proteins. J. Am. Chem. Soc. 1988, 110, 5959–5967.
28. Xu, G.; Chu, Y.; Jiang, N.; Yang, J.; Li, F. The Three Dimensional Quantitative Structure Activity Relationships (3D-QSAR) and docking studies of curcumin derivatives as androgen receptor antagonists. Int. J. Mol. Sci. 2012, 13, 6138–6155.
29. SYBYL®-X Suite. Molecular Modeling from Sequence through Lead Optimization. Available online: http://www.certara.com/products/molmod/sybyl-x (accessed on 12 May 2014).
30. Zhao, X.; Yuan, M.; Huang, B.; Ji, H.; Zhu, L. Ligand-based pharmacophore model of N-Aryl and N-Heteroaryl piperazine alpha 1A-adrenoceptors antagonists using GALAHAD. J. Mol. Graph. Model. 2010, 29, 126–136.
31. Caballero, J. 3D-QSAR (CoMFA and CoMSIA) and pharmacophore (GALAHAD) studies on the differential inhibition of aldose reductase by flavonoid compounds. J. Mol. Graph. Model. 2010, 29, 363–371.
32. The Specs.net Chemistry. Available online: http://www.specs.net (accessed on 12 May 2014). 33. Shaikh, M.S.; Mittal, A.; Bharatam, P.V. Design of fructose-2,6-bisphosphatase inhibitors:
A novel virtual screening approach. J. Mol. Graph. Model. 2008, 26, 900–906. 34. Lipinski C.A.; Lombardo, F.; Dominy, B.W.; Feeney, P.J. Experimental and computational
approaches to estimate solubility and permeability in drug discovery and development settings. Adv. Drug Deliv. Rev. 1997, 23, 3–25.
35. Gugan, K.; Thirumurthy, M.; Changdev, G.G.; Seung, J.C. A combined 3D QSAR and pharmacophore-based virtual screening for the identification of potent p38 MAP kinase inhibitors: An in silico approach. Med. Chem. Res. 2013, 22, 1773–1787.
36. Lan, P.; Sun, J.R.; Chen, W.N.; Sun, P.H.; Chen, W.M. Molecular modelling studies on d-annulated benzazepinones as VEGF-R2 kinase inhibitors using docking and 3D-QSAR. J. Enzym. Inhib. Med. Chem. 2011, 26, 367–377.
37. Clark, M.; Cramer, R.D.; Opdenbosch, N.V. Validation of the general purpose tripos 5.2 force field. J. Comput. Chem. 1989, 10, 982–1012.
38. Lan, P.; Chen, W.N.; Xiao, G.K.; Sun, P.H.; Chen, W.M. 3D-QSAR and docking studies on pyrazolo[4,3-h]qinazoline-3-carboxamides as cyclin-dependent kinase 2 (CDK2) inhibitors. Bioorg. Med. Chem. Lett. 2010, 20, 6764–6772.
39. Pirhadi, S.; Ghasemi, J.B. 3D-QSAR analysis of human immunodeficiency virus entry-1 inhibitors by CoMFA and CoMSIA. Eur. J. Med. Chem. 2010, 45, 4897–4903.
40. Xu, G.; Zhou, Z.; Li, F. Combined 3D-QSAR modeling and molecular docking studies on naphthoquinone analogs as proteasome inhibitors. Lett. Drug Des. Discov. 2013, 10, 129–144.

99
Synthesis, Preliminary Bioevaluation and Computational
Analysis of Caffeic Acid Analogues
Zhiqian Liu, Jianjun Fu, Lei Shan, Qingyan Sun and Weidong Zhang
Abstract: A series of caffeic acid amides were designed, synthesized and evaluated for anti-inflammatory activity. Most of them exhibited promising anti-inflammatory activity against nitric oxide (NO) generation in murine macrophage RAW264.7 cells. A 3D pharmacophore model was created based on the biological results for further structural optimization. Moreover, predication of the potential targets was also carried out by the PharmMapper server. These amide analogues represent a promising class of anti-inflammatory scaffold for further exploration and target identification.
Reprinted from Int. J. Mol. Sci. Cite as: Liu, Z.; Fu, J.; Shan, L.; Sun, Q.; Zhang, W. Synthesis, Preliminary Bioevaluation and Computational Analysis of Caffeic Acid Analogues. Int. J. Mol. Sci. 2014, 15, 8808-8820.
1. Introduction
Inflammation is a hallmark of many diseases, which may lead to various diseases including sepsis, arthritis, atherosclerosis, diabetes and even cancer [1,2]. Nowadays, several steroidal anti-inflammatory drugs (SAID) and nonsteroidal anti-inflammatory drugs (NSAID) have been developed. However, they still have some unexpected side effects and the inflammation mechanism is not exactly clear. Currently, the most important targets are attracting a great deal of interest in contemporary anti-inflammatory drug design and discovery, including signal transducers and activators of transcription (STAT) [3], interleukin (IL) [4], stem cell factor (SCF) [5], macrophage migration inhibitory factor (MIF) [6], Annexin-1 [7], CC chemokine receptor (CCR) [8], Adenosine A2A receptor (A2A-R) [9], melanocortin receptor (MC-R) [10] and NF-κB signaling [11]. Very recently, our group has identified that 5-lipoxygenase was a potential target of (+)-2-(1-hydroxyl-4-oxocyclohexyl) ethyl caffeate [12].
Caffeic acid, a common natural product from Eucalyptus globulus [13], Salvinia molesta [14], Phellinus linteus [15] and coffee, was reported to possess promising in vitro and in vivo anti-inflammatory properties [16]. The caffeic acid is usually found as various simple derivatives including amides, esters, sugar esters and glycosides [17]. Yuu Osanai’s group showed that caffeic acids with the ester functional group had good anti-inflammatory activity but with high cyctoxicity [18] (Figure 1). These findings prompted us to look for new caffeic acid amides with different substituent against inflammation while reducing cyctoxicity. In this report, 20 caffeic acid aimdes were rationally designed, synthesized and evaluated the inhibition of no production in murine macrophage RAW 264.7 cells. Based on the biological result, a 3D pharmacophore model was generated by using the seven active compounds with HipHop approach, which has been recognized as a time-saving and cost-effective technique for discovering new active compounds [19,20]. Furthermore, potential drug target predication was then carried out using pharmacophore-mapping approach [21]. The biological validation is ongoing now.

100
Figure 1. Structure of (A) ester; (B) amide; and (C) ketone derivatives of caffeic acid.
Compounds
A
B
C
2. Results and Discussion
2.1. Biological Studies
A series of caffeic acid amides was synthesized according to general procedure [22] (Scheme 1). Firstly, R1 and R2 were first replaced with different alkyl groups (Compounds 3a–3f). Unfortunately, only the n-Butyl derivative showed moderate nitric oxide (NO) inhibition with an IC50 value of 6.1 μM. The other alkyl derivatives with cyclic or di-substituted groups were completely inactive in the in vitro inhibition assay at 10 μM, probably due to the limited binding space (Table 1). Then, aromatic groups (Compounds 3g–3r) were introduced and four compounds demonstrated good inhibitory activity. Structure−activity relationship (SAR) analysis identified that the type and position of the substituents were important for the inhibitory activity. Substituents on the 3 (Compound 3i, IC50 = 7.9 μM) and 4 (Compound 3j, IC50 = 5.2 μM and Compound 3k, IC50 = 3.7 μM) positions of the benzene ring were favorable for the inhibition of NO production but not suitable for 3-chloro (Compound 3n) and bromo (Compound 3o) derivatives. Similarly, the derivatives with 2-substituents (Compounds 3l, 3m and 3q) were absolutely inactive. Interestingly, the compounds with 3,5-difluorophenylo group (Compound 3h, IC50 = 4.1 μM) and the 3,5-bis(trifluoromethyl)phenyl group (Compound 3g, IC50 > 10 μM) were totally different. Encouraged by the above results, privileged bioactive structures with aromatic ring, such as indol (Compound 3s) and piperonyl (Compound 3t), were then synthesized. Both of them showed promising inhibitory activity with the IC50 of 6.7 and 5.0 μM, respectively, which can be taken as lead structures for further exploration. To our delight, the amides were much better than the original caffeic acid, which only had an IC50 value of 165 μM.
Scheme 1. Synthetic route of the caffic acid amides.

101
Table 1. Synthesis of caffeic acid amide (3a–3t) and inhibitory effect of caffeic acid amides on Lipopolysaccharide (LPS) induced nitrite production.
Compounds R1 R2 Nitric Oxide Inhibition/IC50 (μM) f n-butyl H 6.1
3b cyclopropylmethanyl H >10 3c –CH2)5– –(CH2)5– >10 3d –(CH2)4– –(CH2)4– >10 3e –(CH2)2– –(CH2)2– >10 3f n-butyl n-butyl >10 3g 3,5-bis(trifluoromethyl)phenyl H >10 3h 3,5-difluorophenyl H 4.1 3i 3-(trifluoromethyl)phenyl H 7.9 3j 4-methoxyphenyl H 5.2 3k 4-fluorophenyl H 3.7 3l 2-(hydroxymethyl)phenyl H >10
3m 2-acetylphenyl H >10 3n 3-chlorophenyl H >10 3o 3-bromophenyl H >10 3p 4-methanylphenyl H >10 3q 2-methanylphenyl H >10 3r phenylmethanyl H >10 3s 2-(1H-indol-3-yl)ethyl H 6.7 3t 2-(benzo[d][1,3]dioxol-5-yl)ethyl H 5.0
caffeic acid - - 165 a a data from the reference [2].
2.2. Pharmacophore Model
A set of the seven most potent Compounds 3a, 3h–3k, 3s and 3t was selected as a training set to generate the 3D pharmacophore model. The common feature pharmacophore generation run resulted in 10 pharmacophore models. All the 10 models were generated with three pharmacophoric features, along with good ranking scores ranging from 117.3 to 119.49. As all pharmacophore models didn’t have much difference in their 3D distance constraints, the best model was chosen based on the ranking score of a pharmacophore model and the fit values of the training set compounds. As a result, “Hypo 1” was selected with best ranking score of 119.49 and good fit values from the mapping of the training set compounds upon the chemical features. The pharmacophore model “Hypo 1” containing three hydrophobic (HY), two hydrogen bond acceptor (HBA) and two hydrogen bond donor (HBD) features are shown in Figure 2. The best pharmacophore model, Hypo1, was predicted using seven active compounds. It can map all seven active compounds (Figures S1–S7). The above results mimicked the 3D model of the newly synthesized active small molecules and guided further design strategy of structural optimization.

102
Figure 2. Pharmacophore model of seven active compounds. Three-dimensional spatial arrangement of the best pharmacophore hypothesis “Hypo 1”. Green color represents hydrogen bond acceptor (HBA), magenta represents hydrogen bond donor (HDB) and cyan represents hydrophobic (HY) features.
2.3. Target Predication and Molecular Docking
Despite our synthesized compounds showed promising inhibition of NO production, the exact molecular mechanism by which exerts their effects is not yet clearly understood. Potential drug target predication was then carried out using pharmacophore-mapping approach [21]. Binding properties for Compounds 3a, 3g, 3h–3k, 3s and 3t on potential targets were estimated by a reverse pharmacophore mapping server [23]. These compounds were divided into three categories: aliphatic group (Compound 3a), aromatic group (Compounds 3h–3k) and heterocyclic group (Compounds 3s and 3t). All the predicted targets of these three groups were ranked by the fit score. Among the top 0.3% of the predicted target candidates, there were three common targets (GTPase HRas, Chorismate synthase and Orotidine 5-phosphate decarboxylase), indicating that above compounds may target different proteins comparing with the published caffeic acid ester. Further molecular docking revealed a good interaction between the ligands and the protein active site. Compound 3k has formed hydrogen interactions with Ser17 and Thr35 (Figure 3). In the second potential protein, it has participated in hydrogen bonds interaction with the amino acids Ala133, Asn251, Asp399 and Thr315 (Figure 4). The active site of 5-phosphate decarboxylase surrounds and binds 3k with hydrogen bonds at Val1182 and Asp1020 (Figure 5). These three docking models supported the significance of the hydroxyl group of 3k.

103
Figure 3. The proposed binding mode of Compound 3k within the active site of GTPase HRas (PDB code: 5P21).
Figure 4. The proposed binding mode of Compound 3k within the active site of Chorismate synthase (PDB code: 1QOX).

104
Figure 5. The proposed binding mode of Compound 3k within the active site of Orotidine 5-phosphate decarboxylase (PDB code: 1LOS) and the proposed binding mode of compound 3k within the active site of Orotidine 5-phosphate decarboxylase (PDB code: 1LOS).
3. Experimental Section
3.1. Chemistry
All other commercial reagents and solvents were used as received without further purification. Anhydrous solvent and reagents were analytical pure and dried through routine protocols. The reactions were monitored using analytical thin layer chromatography (TLC) with Merck silica gel 60, F-254 precoated plates (0.25 mm thickness). And the TLC plates were detected under UV light. Flash column chromatography was performed with Merck silica gel 60 (Merck KGaA, Darmstadt, Germany) (200–400 mesh) or the crude product was purified by precipitation from dichloromethane with diethyl ether. 1H NMR and 13C NMR spectra were recorded on Bruker DRX 400 (Bruker Co., Bruker, Germany) at 400, 500 and 100 MHz, using TMS as an internal standard and DMSO-d6 (Sigma-Aldrich Co., St. Louis, MO, USA) as solvents. Chemical shifts (δ values) and coupling constants (J values) are given in ppm and Hz, respectively. ESI-MS (Agilent Technologies, Palo Alto, CA, USA) was recorded on a Waters ZQ 4000 LC-MS (Waters, Milford, MA, USA) spectrometer. The purity of the final compounds was determined using CH3CN/H2O (85:15) with 0.1% triethylamine as the mobile phase with a flow rate of 1.0 mL/min on a C18 column.
3.1.1. General Procedure for the Preparation of Amine (3a–3t)
A solution of the caffeic acid (180 mg, 1 mmol), the dicyclohexyl carbodiimide (DCC, 206 mg, 1 mmol) and amide (1 mmol) was refluxed in THF and the progress of the reaction was monitored by TLC. The solvent was removed under vacuum. The residue was purified by flash chromatography using dichloromethane with diethyl ether (2:1–1:1) as the eluent [18].

105
(E)-N-Butyl-3-(3,4-dihydroxyphenyl)acrylamide (3a). Yield: 65%; 1H NMR (DMSO-d6, 500 MHz) δ: 9.30 (s, 1H), 9.07 (s, 1H), 7.90 (t, J = 5.6 Hz, 1H), 7.19 (d, J = 15.7 Hz, 1H), 6.91 (d, J = 2.0 Hz, 1H), 6.80 (dd, J = 8.1, 1.9 Hz, 1H), 6.71 (d, J = 8.1 Hz, 1H), 6.29 (d, J = 15.7 Hz, 1H), 3.30 (s, 2H), 3.12 (dd, J = 12.8, 6.8 Hz, 2H), 1.97 (s, 2H), 1.48–1.36 (m, 2H), 1.36–1.16 (m, 2H), 0.90–0.81 (m, 3H). 13C NMR (126 MHz, DMSO) δ: 165.6, 139.2, 126.8, 120.6, 119.0, 116.14, 114.18, 38.66, 31.75, 20.04, 14.09. ESI-MS (m/z): 236.12 [M + 1]. High performace liquid chromatograph (HPLC) purity: 97%. Anal. calcd for C13H17NO3: C 66.36, H 7.28, N 5.95, O 20.40, found: C 66.27, H 7.18, N 5.90.
(E)-N-(Cyclopropylmethyl)-3-(3,4-dihydroxyphenyl)acrylamide (3b). Yield: 55%; 1H NMR (DMSO-d6, 400 MHz) δ: 9.36 (s, 1H), 9.13 (s, 1H), 8.05–8.08 (m, 1H), 7.22 (d, J = 16 Hz, 1H), 6.94 (s, 1H), 6.83 (d, J = 8.0 Hz, 1H), 6.74 (d, J = 8.4 Hz, 1H), 6.35 (d, J = 16.0 Hz, 1H), 3.04 (t, J = 6.0 Hz, 2H), 0.40–0.44 (m, 2H), 0.16–0.19 (m, 2H). ESI-MS (m/z): 234.11 [M + 1]. HPLC purity: 96.5%.
(E)-3-(3,4-Dihydroxyphenyl)-1-(piperidin-1-yl)prop-2-en-1-one (3c). Yield: 35%; 1H NMR (DMSO-d6, 400 MHz) δ: 9.42 (s, 1H), 8.97 (s, 1H), 7.3 (d, J = 15.2 Hz, 1H), 7.08 (s, 1H), 6.89–6.98 (m, 2H), 6.73 (d, J = 15.2 Hz, 1H), 3.51–3.59 (m, br, 4H), 1.48–1.60 (m, 6H). ESI-MS (m/z): 248.02 [M + 1]. HPLC purity: 98%.
(E)-3-(3,4-Dihydroxyphenyl)-1-(pyrrolidin-1-yl)prop-2-en-1-one (3d). Yield: 45%; 1H NMR (DMSO-d6, 400 MHz) δ: 9.47 (s, 1H), 9.10 (s, 1H), 7.29 (d, J = 15.2 Hz, 1H), 7.05 (s, 1H), 6.96 (d, J = 8.0 Hz, 1H), 6.74 (d, J = 7.6 Hz, 1H), 6.64 (d, J = 15.2 Hz, 1H), 3.59 (t, J = 6.0 Hz, 2H), 3.67 (t, J = 6.0 Hz, 2H), 1.90 (m, 2H), 1.79 (m, 2H). ESI-MS (m/z): 234.1 [M + 1]. HPLC purity: 97%.
(E)-1-(Aziridin-1-yl)-3-(3,4-dihydroxyphenyl)prop-2-en-1-one (3e). Yield: 69%; 1H NMR (DMSO-d6, 400 MHz) δ: 9.37 (s, 1H), 9.14 (s, 1H), 7.22 (d, J = 15.6 Hz, 1H), 6.92 (s, 1H), 6.82 (d, J = 8.0 Hz, 1H), 6.73 (d, J = 8.0 Hz, 1H), 6.23 (d, J = 15.6 Hz, 1H), 0.64–0.67 (m, 2H), 0.42–0.43 (m, 2H). ESI-MS (m/z): 206.07 [M + 1]. HPLC purity: 97.2%.
(E)-N,N-Dibutyl-3-(3,4-dihydroxyphenyl)acrylamide (3f). Yield: 57%; 1H NMR (DMSO-d6, 400 MHz) δ: 9.41 (s, 1H), 9.04 (s, 1H), 7.30 (d, J = 15.2 Hz, 1H), 7.04 (s, 1H), 6.94 (d, J = 8.0 Hz, 1H), 6.73–6.77 (m, 2H), 3.41 (t, J = 7.2 Hz, 2H), 3.30(t, J = 7.2 Hz, 2H), 1.0–1.5 (m, 8H), 0.87–0.94 (m, 6H). ESI-MS (m/z): 292.02 [M + 1]. HPLC purity: 98%.
(E)-N-(3,5-Bis(trifluoromethyl)phenyl)-3-(3,4-dihydroxyphenyl)acrylamide (3g). Yield: 90%; 1H NMR (DMSO-d6, 400 MHz) δ: 10.46 (s, 1H), 9.50 (s, 1H), 9.24 (s, 1H), 7.39–7.48 (m, 3H), 7.02 (s, 1H), 6.88–6.94 (m, 2H), 6.78 (d, J = 8.0 Hz, 1H), 6.47 (d, J = 15.2 Hz, 1H). ESI-MS (m/z): 392.06 [M + 1]. HPLC purity: 96%.
(E)-N-(3,5-Difluorophenyl)-3-(3,4-dihydroxyphenyl)acrylamide (3h). Yield: 71%; 1H NMR (DMSO-d6, 500 MHz) δ: 7.46–7.22 (m, 3H), 7.00 (d, J = 1.7 Hz, 1H), 6.95–6.80 (m, 2H), 6.76 (d, J = 8.1 Hz, 1H), 6.45 (d, J = 15.6 Hz, 1H). 13C NMR (126 MHz, DMSO) δ: 164.9, 163.7, 161.9, 148.5, 146.0, 142.4, 126.2, 121.5, 116.2, 114.4, 102.2. ESI-MS (m/z): 292.07 [M + 1]. HPLC purity: 97.2%. Anal. calcd for C15H11F2NO3: C 61.86, H 3.81, F 13.05, N 4.81, O 16.48, found: C 61.76, H 3.80, F 13.00, N 4.69, O 16.27.

106
(E)-3-(3,4-Dihydroxyphenyl)-N-(3-(trifluoromethyl)phenyl)acrylamide (3i). Yield: 59%; 1H NMR (DMSO-d6, 500 MHz) δ: 8.18 (s, 1H), 7.83 (d, J = 8.4 Hz, 1H), 7.53 (dd, J = 14.6, 6.6 Hz, 1H), 7.43 (d, J = 15.6 Hz, 1H), 7.37 (d, J = 7.7 Hz, 1H), 7.00 (d, J = 1.9 Hz, 1H), 6.91 (d, J = 8.2, 2.0 Hz, 1H), 6.76 (d, J = 8.1 Hz, 1H), 6.50 (d, J = 15.6 Hz, 1H). 13C NMR (126 MHz, DMSO) δ: 164.91, 148.38, 146.06, 142.00, 140.66, 130.40, 126.38, 122.99, 121.45, 119.73, 118.14–117.25, 116.24, 115.50, 114.43. ESI-MS (m/z): 324.08 [M + 1]. HPLC purity: 98%. Anal. calcd for C16H12F3NO3:C 59.45, H 3.74, F 17.63, N 4.33, O 14.85, found: C59.35, H 3.50, F 17.53, N 4.31, O 14.65.
(E)-3-(3,4-Dihydroxyphenyl)-N-(4-methoxyphenyl)acrylamide (3j). Yield: 78%; 1H NMR (DMSO-d6, 500 MHz) δ: 9.90 (s, 1H), 7.58 (d, J = 9.0 Hz, 2H), 7.35 (d, J = 15.6 Hz, 1H), 6.98 (d, J = 1.8 Hz, 1H), 6.90–6.82 (m, 3H), 6.75 (d, J = 8.1 Hz, 1H), 6.49 (d, J = 15.6 Hz, 1H), 3.71 (s, 3H). 13C NMR (DMSO-d6, 126 MHz,) δ: 163.9, 155.5, 147.9, 146.0, 140.6, 133.1, 126.7, 121.0, 118.99 (s, 3H), 116.2, 114.3, 55.5. ESI-MS (m/z): 286.1 [M + 1]. HPLC purity: 96.6%. Anal. calcd for C15H16NO4: C 67.36, H 5.34, N 4.91, O 22.43, found: C 67.20, H 5.22, N 4.90. O 22.25.
(E)-3-(3,4-Dihydroxyphenyl)-N-(4-fluorophenyl)acrylamide (3k). Yield: 61%; 1H NMR (DMSO-d6, 500 MHz) δ: 10.09 (s, 1H), 9.33 (br, 2H), 7.68 (d, J = 14.1 Hz, 2H), 7.38 (d, J = 15.6 Hz, 1H), 7.13 (d, J = 15.6 Hz, 2H), 6.98 (s, 1H), 6.88 (dt, J = 15.2, 7.6 Hz, 1H), 6.75 (d, J = 8.1 Hz, 1H), 6.48 (d, J = 6.0 Hz, 1H). 13C NMR (DMSO-d6, 126 MHz) δ: 164.3, 159.2, 157.3, 146.0, 141.2, 121.2, 118.6, 116.2, 115.83, 115.7, 114.3. ESI-MS (m/z): 274.08 [M + 1]. HPLC purity: 97.4%. Anal. calcd for C15H12FNO3:C 65.93, H 4.43, F 6.95, N 5.13, O 17.57, found: C 65.65, H 4.35, F 6.72, N 5.05, O 17.37.
(E)-3-(3,4-Dihydroxyphenyl)-N-(2-(hydroxymethyl)phenyl)acrylamide (3l). Yield: 63%; 1H NMR (DMSO-d6, 400 MHz) δ: 9.48 (s, 1H), 9.46 (s, 1H), 9.17 (s, 1H), 7.76 (d, J = 4.0 Hz, 1H), 7.36–7.43 (m, 2H), 7.25 (t, J = 8.0 Hz, 1H), 7.15 (t, J = 8.0 Hz, 1H), 7.03 (s, 1H), 6.92 (d, J = 8.8 Hz, 1H), 6.77 (d, J = 8.4 Hz, 1H), 6.60 (d, J = 15.2 Hz, 1H), 4.53 (s, 2H). ESI-MS (m/z): 286.1 [M + 1]. HPLC purity: 97.6%.
(E)-N-(2-Acetylphenyl)-3-(3,4-dihydroxyphenyl)acrylamide (3m). Yield: 53%; 1H NMR (DMSO-d6, 400 MHz) δ: 11.39 (s, 1H), 9.55 (s, 1H), 9.16 (s, 1H), 8.42 (d, J = 8.0 Hz, 1H), 8.00 (d, J = 8.0 Hz, 1H), 7.62 (t, J = 7.6 Hz, 2H), 7.44 (d, J = 15.2 Hz, 1H), 7.22 (t, J = 7.6 Hz, 1H), 7.09 (s, 1H), 7.01 (d, J = 8.0 Hz, 1H), 6.78 (d, 2H, J = 8.0 Hz), 6.53 (d, J = 15.2 Hz, 1H), 2.64 (s, 3H). ESI-MS (m/z): 298.1 [M + 1]. HPLC purity: 97.8%.
(E)-N-(3-Chlorophenyl)-3-(3,4-dihydroxyphenyl)acrylamide (3n). Yield: 72%; 1H NMR (DMSO-d6, 400 MHz) δ: 10.27 (s, 1H), 9.51 (s, 1H), 9.23 (s, 1H), 7.93 (s, 1H), 7.51 (d, J = 8.0 Hz, 1H), 7.42 (d, J = 15.2 Hz, 1H), 7.36 (t, J = 8.0 Hz, 1H), 7.10 (d, J = 8.0 Hz, 1H), 7.01 (s, 1H), 6.92 (d, J = 8.0 Hz, 1H), 6.78 (d, J = 8.0 Hz, 1H), 6.50 (d, J = 15.2 Hz, 1H). ESI-MS (m/z): 290.02 [M + 1]. HPLC purity: 97.9%.
(E)-N-(3-Bromophenyl)-3-(3,4-dihydroxyphenyl)acrylamide (3o). Yield: 67%; 1H NMR (DMSO-d6, 400 MHz) δ: 10.24 (s, 1H), 9.51 (s, 1H), 9.22 (s, 1H), 8.06 (s, 1H), 7.55 (d, J = 8.0 Hz, 1H),

107
7.42 (d, J = 15.2 Hz, 1H), 7.22–7.30 (m, 2H), 7.01 (s, 1H), 6.92 (d, J = 8.0 Hz, 1H), 6.77 (d, J = 8.0 Hz, 1H), 6.50 (d, J = 15.2 Hz, 1H). ESI-MS (m/z): 334.16 [M + 1]. HPLC purity: 97.6%.
(E)-3-(3,4-Dihydroxyphenyl)-N-p-tolylacrylamide (3p). Yield: 76%; 1H NMR (DMSO-d6, 400 MHz) δ: 9.98 (s, 1H), 9.44 (s, 1H), 9.20 (s, 1H), 7.57 (d, J = 6.8 Hz, 2H), 7.38 (d, J = 15.2 Hz, 1H), 7.20 (d, J = 6.8 Hz, 2H), 7.00 (s, 1H), 6.90 (d, J = 8.0 Hz, 1H), 6.77 (d, J = 8.0 Hz, 1H), 6.52 (d, J = 15.2 Hz, 1H), 2.26 (s, 3H). ESI-MS (m/z): 270.11 [M + 1]. HPLC purity: 97.3%.
(E)-3-(3,4-Dihydroxyphenyl)-N-o-tolylacrylamide (3q). Yield: 68%; 1H NMR (DMSO-d6, 400 MHz) δ: 9.45 (s, 1H), 9.32 (s, 1H), 9.17 (s, 1H), 7.58 (d, J = 8.0 Hz, 1H), 7.38 (d, J = 15.2 Hz, 1H), 7.16–7.23 (m, 2H), 7.01–7.08 (m, 2H), 6.91 (d, J = 8.0 Hz, 1H), 6.77 (d, J = 8.0 Hz, 1H), 6.68 (d, J = 15.2 Hz, 1H), 2.24 (s, 3H). ESI-MS (m/z): 270.1 [M + 1]. HPLC purity: 96%.
(E)-N-Benzyl-3-(3,4-dihydroxyphenyl)-N-methylacrylamide (3r). Yield: 64%; 1H NMR (DMSO-d6, 400 MHz) δ: 9.41 (s, 1H), 9.00 (s, 1H), 7.21–7.40 (m, 6H), 6.89–7.01 (m, 3H), 6.71–6.76 (m, 1H), 4.69 (s, 2H), 2.98 (s, 3H). ESI-MS (m/z): 284.12 [M + 1]. HPLC purity: 97%.
(E)-N-(2-(1H-Indol-3-yl)ethyl)-3-(3,4-dihydroxyphenyl)acrylamide (3s). Yield: 91%; 1H NMR (DMSO-d6, 500 MHz) δ: 10.78 (s, 1H), 9.20 (d, J = 101.6 Hz, 2H), 8.07 (t, J = 5.7 Hz, 1H), 7.54 (d, J = 7.9 Hz, 1H), 7.32 (d, J = 8.1 Hz, 1H), 7.23 (d, J = 15.6 Hz, 1H), 7.14 (s, 1H), 7.04 (dd, J = 11.1, 4.0 Hz, 1H), 7.00–6.88 (m, 2H), 6.81 (dd, J = 8.2, 1.9 Hz, 1H), 6.73 (d, J = 8.1 Hz, 1H), 6.32 (d, J = 15.7 Hz, 1H), 3.44 (d, J = 13.4, 7.1 Hz, 2H), 2.86 (t, J = 7.4 Hz, 2H). 13C NMR (DMSO-d6, 126 MHz) δ: 165.7, 147.6, 145.9, 139.3, 136.6, 127.6, 126.8, 123.0, 121.3, 120.7, 119.1, 118.6, 116.1, 114.2, 112.2, 111.7, 31.0, 25.7. ESI-MS (m/z): 323.13 [M + 1]. HPLC purity: 98%. Anal. calcd for C20H20N2O3: C 71.41, H 5.99, N 8.33, O 14.24, found: C 71.26, H 5.55, N 8.12, O 14.17.
(E)-N-(2-(Benzo[d][1,3]dioxol-5-yl)ethyl)-3-(3,4-dihydroxyphenyl)acrylamide (3t). Yield: 52%; 1H NMR (DMSO-d6, 500 MHz) δ: 9.37 (s, 1H), 9.14 (s, 1H), 8.03 (t, J = 5.5 Hz, 1H), 7.22 (d, J = 15.7 Hz, 1H), 6.93 (s, 1H), 6.82 (d, J = 7.9 Hz, 3H), 6.73 (d, J = 8.1 Hz, 1H), 6.67 (d, J = 8.0 Hz, 1H), 6.31 (d, J = 15.7 Hz, 1H), 5.96 (s, 2H), 3.37–3.29 (m, 4H), 2.69 (dd, J = 18.5, 11.2 Hz, 2H).13C NMR (DMSO-d6, 126 MHz) δ: 165.7, 161.3, 147.5, 145.9, 139.3, 133.5, 126.8, 121.9, 120.7, 118.9, 116.1, 114.2, 109.4, 108.5, 101.0, 35.2, 35.0. ESI-MS (m/z): 228.3 [M + 1]. HPLC purity: 97.7%. Anal. calcd for C18H17NO5: C 66.05, H 5.23, N 4.28, O 24.44, found: C 65.95, H 5.13, N 4.15, O 24.26.
3.2. Biology
3.2.1. Cell Culture
RAW 264.7 murine macrophages were obtained from the Shanghai Institute of Cell Biology, Chinese Academy of Sciences (Shanghai, China) and maintained in DMEM recommended by the suppliers, supplemented with 10% fetal bovine serum (Gibco, Paisley, UK), penicillin (100 U/mL) and streptomycin (100 mg/mL) in a humidified 5% CO2 atmosphere at 37 °C.

108
3.2.2. Measurement of Nitric Oxide
The amount of NO was assessed by determining the nitrite concentration with Griess reagent. Briefly, in the experiment to assess NO in culture supernatants, RAW 264.7 macrophages were seeded into 48-well plates (2 × 10⁶ cells per mL) for 18 h. Then, the cells were pretreated each sample, aminoguanidine or vehicle solution for 20 min, then stimulated with LPS (1 μg/mL) for 18 h. Samples of supernatants (100 mL) were incubated with 50 mL 1% sulfanilamide, then 50 mL of 0.1% naphthylethylenediamine in 2.5% phosphoric acid solution. The absorbance at 570 nm was read and referred to a standard curve of sodium nitrite solution to determine the nitrite concentration. In the other experiment to determine the NO concentration of exudates from rat air pouches, the exudates (50 mL) were incubated with nitrate reductase solution (200 mL; Jiancheng Bioengineering Institute, Nanjing, China) at 37 °C for 1 h. Nitrate was converted into nitrite. After centrifugation, the nitrite concentration in the cell-free supernatants was assessed with Griess reagent as described above [24].
3.3. Computational Protocols
3.3.1. Pharmacophore Generation
All the studies were carried out using Discovery Studio (DS) 2.5 unless it is mentioned. Seven most active compounds as shown in Figure 2 were selected as a training set to generate qualitative pharmacophore models to be used in future database screening to identify new scaffolds for drug discovery. The 2D chemical structures of the training set compounds were built using ChemSketch program version 12, and subsequently converted into 3D structures using DS. All compounds in the training set were given a Principal value of 2 and a Maximum Omitted Feature value of 0 to make sure that all the features of these compounds are considered during pharmacophore generation. Diverse conformational models for every training set compound were generated to cover the flexibility of their chemical nature using polling algorithm. All the compounds were energetically minimized using CHARMM force field implemented in DS. Diverse Conformation Generation protocol with BEST flexible search option implemented in DS was employed with the default value of generating maximum of 250 conformers within the energy range of 20 kcal/mol, with respect to the global minimum. Feature mapping protocol was employed prior to the original pharmacophore generation calculation to identify the chemical features present in the training set compounds. The chemical features such as hydrogen bond acceptor (HBA), hydrogen bond donor (HBD) and hydrophobic (HY) features were used during pharmacophore generation. These chemical features were selected based on the feature mapping results and the possible interaction points. All the other parameters were maintained at their default settings. The seven compounds in the training set along with the generated conformational models were used in pharmacophore model generation. Common feature pharmacophore models, generally, are developed by comparing a set of conformational models and a number of 3D configurations of chemical features shared among the training set compounds. Common Feature Pharmacophore Model Generation protocol implemented in DS was used to generate pharmacophore models. Minimum interfeature distance was 0.5. The other parameters were default.

109
3.3.2. Molecular Docking Study
All the molecular docking studies were performed by GOLD 5.1 program with ChemPLP function score (Cambridge Crystallographic Data Center, London, UK). X-ray crystal structures (PDB ID: 1LOS, PDB ID: 1QXO, PDB ID: 5P21) were used to define the binding site for molecular docking studies. The radius of 12 Å around the active compound was defined to form the active site of the protein.
4. Conclusions
In summary, we rationally designed a series of caffeic acid amide analogues. The preliminary biological evaluations revealed that this class of compounds possessed moderate to good anti-inflammatory activity. A 3D pharmacophore model was then generated based on the biological activity and the better understanding of this feature could provide meaningful insights for further optimization. Potential targets were also predicted by the PharmMapper server. A further study of the structural modification and biological target validation are in process in our laboratory and will be reported elsewhere.
Acknowledgments
The work was supported by programfor New Century Excellent Talents in University Foundation, National Natural Science Foundation of China (81230090), partially supported by Global Research Network for Medicinal Plants (GRNMP) and King Saud University, Shanghai Leading Academic Discipline Project (B906), Key laboratory of drug research for special environments, PLA, Shanghai Engineering Research Center for the Preparation of Bioactive Natural Products (10DZ2251300), the Scientific Foundation of Shanghai China (12401900801,09DZ1975700, 09DZ1971500, 10DZ1971700), National Major Project of China (2011ZX09307-002-03), and National Key Technology R&D Program of China (2012BAI29B06).
Author Contributions
Zhiqian Liu: acquisition of data; analysis and interpretation of data; and drafting of the manuscript; Jianjun Fu, Lei Shan and Qingyan Sun funding obtained and study supervision. All authors read and approved the final manuscript. Weidong Zhang administrative support; and study supervision; and review of the manuscript.
Conflicts of Interest
The authors declare no conflict of interest.
References
1. Hu, J.; Wang, Y.; Wei, X.; Wu, X.; Chen, G.; Cao, G.; Shen, X.; Zhang, X.; Tang, Q.; Liang, G.; et al. Synthesis and biological evaluation of novel thiazolidinone derivatives as potential anti-inflammatory agents. Eur. J. Med. Chem. 2013, 64, 292–301.

110
2. Uwai, K.; Osanai, Y.; Imaizumi, T.; Kanno, S.; Takeshita, M.; Ishikawa, M. Inhibitory effect of the alkyl side chain of caffeic acid analogues on lipopolysaccharide-induced nitric oxide production in RAW264.7 macrophages. Bioorg. Med. Chem. 2008, 16, 7795–7803.
3. O’Sullivan, L.A.; Liongue, C.; Lewis, R.S.; Stephenson, S.E.; Ward, A.C. Cytokine receptor signaling through the Jak-Stat-Socs pathway in disease. Mol. Immunol. 2007, 44, 2497–2506.
4. Jacques, C.; Gosset, M.; Berenbaum, F. The role of IL-1 and IL-1Ra in joint inflammation and cartilage degradation. Vitam. Horm. 2006, 74, 371–403.
5. Reber, L.; da Silva, C.A.; Frossard, N. Stem cell factor and its receptor c-Kit as targets for inflammatory diseases. Eur. J. Pharmacol. 2006, 533, 327–340.
6. Flaster, H.; Bernhagen, J.; Calandra, T.; Bucala, R. The macrophage migration inhibitory factor-glucocorticoid dyad: Regulation of inflammation and immunity. Mol. Endocrinol. 2007, 21, 1267–1280.
7. Dalli, J.; Norling, L.V.; Renshaw, D.; Cooper, D.; Leung, K.Y.; Perretti, M. Annexin 1 mediates the rapid anti-inflammatory effects of neutrophil-derived microparticles. Blood 2008, 112, 2512–2519.
8. De Lucca, G.V. Recent developments in CCR3 antagonists. Curr. Opin. Drug Discov. Devel. 2006, 9, 516–524.
9. Chen, J.F.; Pedata, F. Modulation of ischemic brain injury and neuroin-flammation by adenosine A2A receptors. Curr. Pharm. Des. 2008, 14, 1490–1499.
10. Luger, T.A.; Brzoska, T. Alpha-MSH related peptides: A new class of anti-inflammatory and immunomodulating drugs. Ann. Rheum. Dis. 2007, 66, 52–55.
11. Ghosh, S.; May, M.J.; Kopp, E.B. NF-kappa B and Rel proteins: evolutionarily conserved mediators of immune responses. Annu. Rev. Immunol. 1998, 16, 225–260.
12. Li, L.; Zeng, H.W.; Liu, F.; Zhang, J.G.; Yue, R.C.; Lu, W.Q.; Yuan, X.; Dai, W.X.; Yuan, H.; Sun Q.Y.; et al. Target identification and validation of (+)-2-(1-hydroxyl-4-oxocyclohexyl) ethyl caffeate, An anti-inflammatory natural product. Eur. J. Inflamm. 2012, 10, 297–309.
13. Santos, S.A.; Freire, C.S.; Domingues, M.R.; Silvestre, A.J.; Pascoal, N.C. Characterization of phenolic components in polar extracts of Eucalyptus globulus Labill bark by high-performance liquid chromatography-mass spectrometry. J. Agric. Food Chem. 2011, 59, 9386–9393.
14. Choudhary, M.I.; Naheed, N.; Abbaskhan, A.; Musharraf, S.G.; Siddiqui, H.; Atta-Ur-Rahman. Phenolic and other constituents of fresh water fern Salvinia molesta. Phytochemistry 2008, 69, 1018–1023.
15. Lee., Y.S.; Kang, Y.H.; Jung, J.Y.; Lee, S.; Ohuchi, K.; Shin, KH.; Kang, I.J.; Park, J.H.; Shin, H.K.; Lim, S.S. Protein Glycation Inhibitors from the Fruiting Body of Phellinus linteus. Biol. Pharm. Bull. 2008, 31, 1968–1972.
16. Nagaoka, T.; Banskota, A.H.; Tezuka, Y.; Midorikawa, K. Caffeic acid phenethyl ester (CAPE) analogues: Potent nitric oxide inhibitors from the Netherlands propolis. Biol. Pharm. Bull. 2003, 26, 487–491.
17. Sherif, Y.E.; Fu, J.; Lotfy, M.; Zhu, H.L. QSAR study for newly caffeic acid amides with prominent antibacterial and antifungal activity. Der Pharma Chem. 2010, 2, 105.

111
18. Fu, J.; Cheng, K.; Zhang, Z.M.; Fang, R.Q.; Zhu, H.L. Synthesis, structure and structure–activity relationship analysis of caffeic acid amides as potential antimicrobials. Eur. J. Med. Chem. 2010, 45, 2638–2643.
19. Lyne, P.D. Structure-based virtual screening: An overview. Drug Discov. Today 2002, 7, 1047–1055.
20. Nagarajan, S.; Choo, H.; Cho, Y.S.; Oh, K.S.; Lee, B.H.; Shin, K.J.; Pae, A.N. IKKbeta inhibitors identification part II: Ligand and structure-based virtual screening. Bioorg. Med. Chem. 2010, 18, 3951–3960.
21. Liu, X.; Ouyang, S.; Yu, B.; Liu, Y.; Huang, K.; Gong, J.; Zheng, S.; Li, Z.; Li, H.; Jiang, H. PharmMapper server: A Web server for potential drug target identification using pharmacophore mapping approach. Nucleic. Acids Res. 2010, 38, 609–614.
22. Hung, C.C.; Tsai, W.J.; Kuo, L.M.; Kuo, Y.H. Evaluation of caffeic acid amide analogues as anti-platelet aggregation and anti-oxidative agents. Bioorg. Med. Chem. 2005, 13, 1791–1797.
23. Pharmmapper. Available online: http://59.78.96.61/pharmmapper/index.php (accessed on 23 June 2013).
24. Zeng, H.; Liu, X.; Dou, S.; Xu, W.; Li, N.; Liu, X., Zhang, W.; Hu, Z.; Liu, R. Huang-Lian-Jie-Du-Tang exerts anti-inflammatory effects in rats through inhibition of nitric oxide production and eicosanoid biosynthesis via the lipoxygenase pathway. J. Pharm. Pharmacol. 2009, 61, 1699–707.

112
Synthesis and Antioxidant Activity Evaluation of
New Compounds from Hydrazinecarbothioamide and
1,2,4-Triazole Class Containing Diarylsulfone and
2,4-Difluorophenyl Moieties
Stefania-Felicia Barbuceanu, Diana Carolina Ilies, Gabriel Saramet,
Valentina Uivarosi, Constantin Draghici and Valeria Radulescu
Abstract: In the present investigation, new hydrazinecarbothioamides 4–6 were synthesized by reaction of 4-(4-X-phenylsulfonyl)benzoic acids hydrazides (X= H, Cl, Br) 1–3 with 2,4-difluorophenyl isothiocyanate and further these were treated with sodium hydroxide to obtain 1,2,4-triazole-3-thione derivatives 7–9. The reaction of 7–9 with α-halogenated ketones, in basic media, afforded new S-alkylated derivatives 10–15. The structures of the synthesized compounds have been established on the basis of 1H-NMR, 13C-NMR, IR, mass spectral studies and elemental analysis. The antioxidant activity of all compounds has been screened. Hydrazinecarbothioamides 4–6 showed excellent antioxidant activity and 1,2,4-triazole-3-thiones 7–9 showed good antioxidant activity using the DPPH method.
Reprinted from Int. J. Mol. Sci. Cite as: Barbuceanu, S.-F.; Ilies, D.C.; Saramet, G.; Uivarosi, V.; Draghici, C.; Radulescu, V. Synthesis and Antioxidant Activity Evaluation of New Compounds from Hydrazinecarbothioamide and 1,2,4-Triazole Class Containing Diarylsulfone and 2,4-Difluorophenyl Moieties. Int. J. Mol. Sci. 2014, 15, 10908-10925.
1. Introduction
Oxidation processes are intrinsic to the energy management of all living organisms and are therefore kept under strict control by several cellular mechanisms [1].
Free radicals are molecules, ions or atoms with unpaired electrons in their outermost shell of electrons [2]. These species, which are constantly formed in human body, can become toxic when generated in excess or in the presence of a deficiency in the naturally occurring antioxidant defenses. High levels of free radicals can cause damage to biomolecules such as lipids, proteins, enzymes and DNA in cells and tissues. This may result in many diseases such as: cancer, diabetes, cardiovascular and autoimmune diseases, and neurodegenerative disorders, aging, and other diseases through the violent reactivity of the free radicals [3–5].
Antioxidants are important compounds that reduce or neutralize the free radicals, thus protecting the cells from oxidative injury [6]. Therefore, considerable research has been directed towards the identification of new antioxidants to prevent radical-induced damage.
Over the years triazoles have become an important class of heterocyclic compounds in organic synthesis due to their various biological properties. It is well known that 1,2,4-triazole derivatives have therapeutic applications. Thus, there are various drugs incorporating in their structure the 1,2,4-triazole ring used as antifungal [7–9], antiviral [10] agents, aromatase inhibitors [11], etc. Among the 1,2,4-triazole derivatives, the mercapto- and the thione-substituted 1,2,4-triazole ring

113
systems have been studied and so far a variety of biological properties have been reported for a large number of these compounds including antioxidant [12–14], antibacterial, antifungal [12,15–18], anticancer [17,19], hypolipidemic [20], anti-inflammatory [21] activity. Moreover, various S-alkylated 1,2,4-triazole-3-thiones showed antibacterial [22], antifungal [18,22], anti-inflammatory [23], and hypolipidemic [20] activities.
It has been reported that structural properties of triazoles, like moderate dipole character, hydrogen bonding capability, rigidity and stability under in vivo conditions are the main reasons for their superior pharmacological activities [24].
Many synthetic procedures exist for the synthesis of substituted 1,2,4-triazole-3-thiones. However, the development of simple, facile and efficient methodologies to get five-membered heterocycles is one of the major aspects in organic synthesis. Hydrazinecarbothioamides are valuable intermediates in a variety of synthetic transformations and useful as building blocks in the synthesis of biologically active heterocycles including synthesis of 1,2,4-triazole-thiones. In addition, hydrazinecarbothioamides derivatives exhibit various biological properties such as antioxidant [13,14,25,26], antibacterial [27], and antimycobacterial [28].
Moreover, sulfone derivatives provide examples of an important class of bioactive compounds with biological activities including antibacterial, and anti-HIV-1 [29,30].
On the other hand, incorporation of one or several fluorine atoms into an organic molecule can enhance their biological potency, bioavailability, metabolic stability and lipophilicity. Enhanced lipophilicity may lead to easier absorption and transportation of molecules within biological systems [31].
Considering these published data and as a sequel to our research on the design and synthesis of biologically active new heterocycles from the triazole class [32–35], it was thought worthwhile to synthesize the novel title compounds and to evaluate them for their antioxidant activity.
In this study, we present the design, synthesis, characterization and evaluation of the antioxidant activity of the new hydrazinecarbothioamides, 1,2,4-triazole-3-thiones and some S-alkylated 1,2,4-triazole derivatives incorporating in their molecule diarylsulfone and 2,4-difluorophenyl moieties.
2. Results and Discussion
2.1. Chemistry
The reaction sequences employed for synthesis of title compounds are showed in Scheme 1. In the present work, 2-(4-(4-X-phenylsulfonyl)benzoyl)-N-(2,4-difluorophenyl)hydrazinecarbo-thioamides 4–6 were synthesized by reaction of 4-(4-X-phenylsulfonyl)benzoic acid hydrazides 1–3 (X = H, Cl, Br) with 2,4-difluorophenyl isothiocyanate, in absolute ethanol, at reflux. The 4-(4-X-phenylsulfonyl)benzoic acid hydrazides precursors 1–3 were prepared starting from Friedel-Crafts reaction of benzene or halobenzene with p-tosyl chloride, according to a previously reported method [36,37]. The hydrazinecarbothioamides 4–6 were refluxed in 8% sodium hydroxide solution to obtain 5-(4-(4-X-phenylsulfonyl)phenyl)-4-(2,4-difluorophenyl)-2H-1,2,4-triazole-3(4H)-thiones 7–9 in equilibrium with thiole tautomer. The treatment of 1,2,4-triazoles 7–9 with α-halogenated ketones (2-bromoacetophenone or 2-bromo-4′-fluoroacetophenone), in basic media, produced the new S-alkylated 1,2,4-triazoles namely (2-(5-(4-(4-X-phenylsulfonyl)phenyl)-4-(2,4-

114
difluorophenyl)-4H-1,2,4-triazol-3-ylthio)-1-(phenyl/4-fluorophenyl)ethanones 10–15 and not N-alkylated derivatives.
Scheme 1. Synthetic route of the title compounds.
The structures of all synthesized compounds 4–15 were proven by 1H-NMR, 13C-NMR, MS spectra and elemental analysis.
The IR spectra of hydrazinecarbothioamide derivatives 4–6 exhibit a new absorption band at 1243–1258 cm−1 corresponding to C=S stretching vibration which confirms the nucleophilic addition reaction of 4-(4-X-phenylsulfonyl)benzoic acid hydrazides 1–3 to 2,4-difluorophenyl isothiocyanate. Also, in the IR spectra of these compounds 4–6 was presented as a strong characteristic absorption band for carbonyl group at 1663–1682 cm−1. The stretching bands corresponding to NH groups were observed in range 3150–3319 cm−1. In the IR spectra of compounds 7–9 no absorption band was detected about 1663–1682 cm−1 indicating the absence of C=O group of hydrazinecarbothioamides 4–6 which is evidence for the conversion of these compounds to 1,2,4-triazoles. Compounds 7–9 can exist in two tautomeric forms, 5-(4-(4-X-phenylsulfonyl)phenyl)-4-(2,4-difluorophenyl)-4H-1,2,4-triazole-3-thioles and 5-(4-(4-X-phenylsulfonyl)phenyl)-4-(2,4-difluorophenyl)-2H-1,2,4-triazole-3(4H)-thiones 7–9. The spectral analysis (IR, 1H-NMR, 13C-NMR) shows that these compounds exist in the latter tautomeric form. Thus, in the IR spectra, the νS-H vibration band (~2500–2600 cm−1) was absent and the νC=S vibration band was observed in region 1247–1255 cm−1. Also, the presence of the νNH absorption band in 3278–3414 cm−1 region is

115
an additional proof for the thione tautomeric form [13,38,39]. The structure of compounds 10–12 and 13–15 obtained by alkylation of triazoles 7–9 with α-halogenated ketones was confirmed by the presence in their IR spectra of a new strong stretching band in a 1678–1703 cm−1 region characteristic to C=O group. Also, new bands appeared in 2920–2965 cm−1 region due to the presence of methylene group (νCH2). The disappearance of C=S stretching band in IR spectra supported the S-alkylation leading to the formation of compounds 10–15.
Reaction of hydrazides 1–3 with 2,4-difluorophenyl isothiocyanate has been proven in 1H-NMR spectra of compounds 4–6 by the presence of three singlet signals at ~9.62, ~10.04 and ~10.90 ppm assigned to protons from three NH groups. Intramolecular cyclization of hydrazinecarbothioamides was confirmed in 1H-NMR spectra of compounds 7–9 by presence of a unique singlet at 14.42–14.48 ppm which can be attributed of NH proton from 1,2,4-triazol-3-thione nucleus [38]. The 1H-NMR spectra of all alkylated triazoles 10–15 displayed a singlet signal at δ = 4.99 (for 13–15) and 5.02 ppm (10–12) assignable to S-CH2 protons. The absence of the signal due to NH in 1H-NMR spectra of compounds 10–15 and the presence of a new singlet for S-CH2 confirmed that 1,2,4-triazole-3-thiones 7–9 were converted into alkylated derivatives (10–15) in the reaction with α-halogenated ketones.
The 13C-NMR spectra of hydrazinecarbothioamides 4–6 showed two important signals characteristic of carbon atoms from C=O and C=S groups at δ 164.71–164.75 and 182.47 ppm, respectively [40]. In 13C-NMR of compounds 7–9 the C-3 and C-5 heterocyclic carbon from triazole nucleus resonated at 169.52–169.54 and 149.01–149.03 ppm, respectively. The signal of the C-3 quaternary carbon atom at ~169 ppm is characteristic of C=S group [12,13,41–43] which indicates the presence of the thione tautomeric form in solution. The most significant proof of the alkylation of triazoles 7–9 with 2-bromoacetophenone or 2-bromo-4'-fluoroacetophenone was the presence in 13C-NMR spectra of compounds 10–12 and 13–15 of two new signals at 191.42–192.73 and 40.33–40.46 ppm corresponding to C=O and S-CH2 carbon atoms from a phenacyl/4-fluorophenacyl group. In addition, the formation of S-alkylated and not of N-alkylated products was confirmed by the absence of a C=S characteristic peak at ~169 ppm in 13C-NMR spectra of 10–15. The C-3 and C-5 heterocyclic carbons from these alkylated compounds resonate at 153.09–153.16 ppm (more shielded than the C-3 heterocyclic carbon from 1,2,4-triazoles 7–9) and 153.01–153.09 ppm, respectively [12,43,44].
Moreover, the signals present in the NMR spectra corresponding to aromatic protons and carbons from 2,4-difluorophenyl-, 4-fluorophenyl- and 5-(4-(4-X-phenylsulfonyl)phenyl)-fragments prove the structure of the synthesized compounds. Further confirmations of the structure of the compounds were carried out by mass spectrometry and microanalysis (see experimental part).
2.2. Antioxidant Activity
The free radical scavenging activity of all compounds 4–15 was carried out in the presence of the stable free radical (1,1-diphenyl-2-picrylhydrazyl) DPPH using ascorbic acid (AA), tert-butyl-4-hydroxyanisole (BHA) and 2,6-bis(1,1-dimethylethyl)-4-methylphenol (BHT) antioxidant agents as positive control.
Although a number of methods are available for determination of the antioxidant activity, the DPPH method is very common, rapid and has been shown to be one of the most appropriate methods [12,45].

116
The DPPH solution has a deep purple color, with a strong absoption at 517 nm, and turns to yellow in the presence of antioxidants, which neutralizes the free radicals by pairing the DPPH odd electron with a hydrogen atom or by electron donation. Reduction of DPPH absorption at 517 nm represents the capacity of antioxidants to scavenge free radical [46].
The inhibitory effects of different concentrations of synthesized compounds on DPPH radical are presented in Tables 1 and 2. The antioxidant activity is expressed in terms of % inhibition and IC50 (effective concentration for scavenging 50% of the initial DPPH) value (μM).
Based on the experimental results, among all the compounds synthesized, hydrazinecarbothioamides 4–6 showed higher scavenging activity towards DPPH. These compounds have shown a strong inhibitory effect on DPPH radical at 250 μM concentration and inhibition rates were: 97.18% ± 1.42% (for 4), 96.90% ± 1.39% (for 5), 97.11% ± 1.12% (for 6) better than the positive control AA (91.26% ± 0.49%) and BHA (89.30% ± 1.37%) and much stronger than BHT (23.05% ± 1.32%). These compounds 4–6 inhibited the DPPH activity with an IC50 = 39.39 μM (4), 39.79 μM (5) and 42.32 μM (6) which is better than the specific inhibitor BHA (IC50 = 51.62 μM) and AA
(IC50 = 107.67 μM) and much stronger than BHT (423.37 μM). The 1,2,4-triazole-3-thiones 7–9 obtained by cyclization of hydrazinecarbothioamides
showed (at the same concentration, 250 μM) a good antioxidant activity (7: 67.70% ± 1.68%, 8: 72.45% ± 1.42%, 9: 58.52% ± 1.55%) but lower than AA (91.26% ± 0.49%) and BHA (89.30% ± 1.37%). However, triazoles had higher antioxidant activity than BHT. As deduced from the IC50 data, the triazole with the lowest anti-radical capacity were found to be derivative 9 (with 182.60 μM) followed by 7 (147.79 μM) and 8 was found to be slightly more active (133.80 μM) than its counterparts 7 and 9 (Table 1).
The S-alkylated 1,2,4-triazoles 10–15 showed weak inhibitory effect at 250 μM concentration, in the range of 7.73%–15.04% (Table 2). However, the presence of the third fluorine atom on phenyl radical linked to ketone groups determines a slight increase of antioxidant activity of compounds 13–15 compared with 10–12. Because these compounds presented a weaker action even than BHT, IC50 was not calculated.
Table 1. Antioxidant activity of compounds 4–9 by DPPH method.
Compd. Scavenging Effect (%) IC50
(μM) - 25 μM 50 μM 75 μM 100 μM 125 μM 250 μM - 4 30.54 ± 1.32 64.37 ± 1.35 74.86 ± 1.40 85.39 ± 1.45 95.99 ± 1.50 97.18 ± 1.42 39.39 5 30.39 ± 1.18 63.58 ± 1.62 74.12 ± 1.34 84.69 ± 1.83 95.36 ± 1.87 96.90 ± 1.39 39.79 6 29.14 ± 1.53 59.28 ± 1.23 71.23 ± 1.32 83.23 ± 1.42 95.35 ± 1.18 97.11 ± 1.12 42.32 7 15.88 ± 1.03 24.74 ± 1.32 33.30 ± 1.67 37.93 ± 1.49 46.14 ± 1.45 67.70 ± 1.68 147.79 8 15.56 ± 0.95 24.36 ± 1.19 32.18 ± 1.48 40.58 ± 1.41 48.38 ± 1.54 72.45 ± 1.42 133.80 9 13.96 ± 0.97 22.99 ± 1.05 31.74 ± 1.56 38.63 ± 1.59 43.03 ± 1.63 58.52 ± 1.55 182.60
AA 0.70 ± 1.00 1.08 ± 0.84 17.48 ± 1.03 34.91 ± 0.69 84.12 ± 0.48 91.26 ± 0.49 107.67 BHA 23.27 ± 1.39 48.99 ± 1.42 64.77 ± 1.32 73.89 ± 1.59 81.74 ± 1.45 89.30 ± 1.37 51.62 BHT - - - - - 23.05 ± 1.32 423.37

117
Table 2. Antioxidant activity of compounds 10–15 by DPPH method.
Compd. Concentration (μM) Scavenging Effect (%)
10 250 12.67 ± 0.82 11 250 8.24 ± 1.20
12 250 7.73 ± 0.96
13 250 13.23 ± 0.48 14 250 15.04 ± 0.43 15 250 12.73 ± 0.50 AA 250 91.26 ± 0.49
BHA 250 89.30 ± 1.37
BHT 250 23.05 ± 1.32
The higher antioxidant activity of hydrazinecarbothioamides 4–6 can be explained by the existence of the thiourea fragment [13] that determines stabilization of free radicals of nitrogen atoms (occurring due to the elimination of hydrogen atoms linked to these) by double conjugation, mainly with the thione group. The conjugation between free radicals of the nitrogen atom and π electrons of the aromatic ring represents an additional factor for increasing the stability of the radical structure. The probable mechanism for the reaction of compounds 4–6 with DPPH radical is presented in Scheme 2.
Scheme 2. The probable mechanism for the reaction of compounds 4–6 with DPPH radical
Heterocyclization to 1,2,4-triazole-3-thiones creates only the possibility to conjugate free radicals on the nitrogen atom N-2 with the thione group, which would explain the lower stability of this radical, probably responsible for a weaker antioxidant activity (Scheme 3).
S-alkylation decreases almost entirely the possibilities of conjugation with thione group, causing the least stable radical structure and the weakest antioxidant activity, according to this interpretation.
The compounds tested displayed a considerable lipophilic character, with estimated mean logP values of 4.65 ± 0.71 (ADMET Predictor, Simulation Plus Inc., Lancaster, CA, USA). Based on the preliminary evaluation of biorelevant molecular descriptors and physico-chemical properties, it appears that the evaluated compounds are typical, low solubility—high permeability entities. Therefore, their bioavailability will dependent on the nature of the administration pathways. For

118
oral route, the solubility in the hydrophilic gastro-intestinal fluids is probably the limiting step for absorption. The in-vivo distribution process may include binding and accumulation phenomenon in various organs, likely to be of interest for the antioxidant activity. Moreover, the high lipophilicity can limit the distribution to deeper skin layers or the systemic exposure, which is a considerable advantage for the safety profile. None of the compounds seems to present a high risk of low bioavailability, based on current mnemotic rules [47].
Scheme 3. The probable mechanism for the reaction of compounds 7–9 with DPPH radical.
The lipophilicity, as estimate by logP values, was not directly correlated with the antioxidant activity (Supplementary data). Nevertheless, a rank order relationship seems apparent. The compounds showing higher scavenging activity towards DPPH (4–6) presented the lowest lipophilicity (except for triazole 7 which has lower antioxidant activity than hydrazinecarbothioamides 5 and 6 although it has lower lipophilicity than these derivatives).
3. Experimental
3.1. Chemistry
All reactants and solvents were obtained commercially with the highest purity and were used without further purification. Melting points were determined on a Boetius apparatus and are uncorrected. The IR spectra were recorded in KBr using a Vertex 70 Bruker spectrometer. Elemental analyses were performed on a ECS-40-10-Costeh micro-dosimeter (and are within ±0.4% of the theoretical values). The NMR spectra were recorded on a Varian Gemini 300 BB instrument operating at 300 MHz for a 1H and 75 MHz for 13C. Chemical shifts (δ, ppm) were assigned according to the internal standard signal of tetramethylsilane in DMSO-d6 (δ = 0 ppm). Coupling constants, J, are expressed in hertz (Hz). Mass spectra were recorded on 1200 L/MS/MS triple quadrupole (Varian, Palo Alto, CA, USA) spectrometer. In case of compounds 4–9, solutions of 2 μg/mL in methanol/ammonia (1/1, v/v) were directly injected into the electrospray interface (ESI), after a tenth dilution with methanol, at a flow rate of 20 μL/min. The instrument was operated in positive and negative ions mode. In case of compounds 10–15, methanolic solutions of 0.1 μg/mL (with 0.1% ammonia) were directly infused into APCI (Atmospheric Pressure Chemical Ionization) source with a Prostar 240 SDM Pump (Varian). Parameters for APCI operation were set up as follows: air drying gas at 300 °C and 20 psi, nitrogen as nebulising gas at 40 psi, air as auxiliary gas at 20 psi, APCI torch at 300 °C, and corona discharge needle current at 10 μA. APCI

119
generated only positive ions. Protonated molecular ions were fragmented by collision with argon at 1.5 mTorr.
3.1.1. General Procedure for the Preparation of 2-(4-(4-X-Phenylsulfonyl)benzoyl)-N-(2,4-difluorophenyl)hydrazinecarbothioamides 4–6
Appropriate acid hydrazide 1–3 (5 mmol) in absolute ethanol (25 mL) and 2,4-difluorophenyl isothiocyanate (5 mmol) was heated under reflux for 10 h. The precipitate formed was cooled, filtered, washed with cold ethanol, dried and recrystallized from ethanol.
N-(2,4-Difluorophenyl)-2-(4-(phenylsulfonyl)benzoyl)hydrazinecarbothioamide 4. Yield: 92.0%; m.p. 176–178 °C; IR (KBr, ν, cm−1): 3267, 3169, 3150 (NH), 3067, 3001 (aromatic C-H), 1663 (C=O), 1539, 1510, 1483 (C=C), 1320, 1309, 1155 (SO2), 1258 (C=S), 1144 (C-F); 1H-NMR (DMSO-d6, * ppm): 10.89 (s, 1H; NH); 10.03 (s, 1H, NH); 9.61 (s, 1H, NH); 8.13 (d, 2H, J = 8.8 Hz, aromatic protons); 8.09 (d, 2H, J = 8.8 Hz; aromatic protons); 7.99 (dd, 2H, J = 7.4, 1.4 Hz, aromatic protons); 7.70 (tt, 1H, J = 7.4, 1.4 Hz, aromatic proton); 7.63 (t, 2H, J = 7.4 Hz, aromatic protons); 7.29 (m, 2H, aromatic protons); 7.07 (wt, 1H, J = 8.4 Hz, aromatic proton); 13C-NMR (DMSO-d6, * ppm): 182.47 (C=S), 164.75 (C=O), 160.57 (dd, JC-F = 245.1; 11.2 Hz), 158.55 (dd, JC-F = 248.5; 13.7 Hz), 143.84, 140.64, 137.01, 134.12, 131.87 (d, JC-F = 9.5 Hz), 129.95, 129.40, 127.57, 127.40, 123.81 (d, JC-F = 12.9 Hz), 111.07 (d, JC-F = 22.6 Hz), 104.28 (t, JC-F = 25.5 Hz); (ESI-MS) m/z: 448 [M + H]+, 319 (38) [C6H5SO2C6H4CONHNHCS]+, 277 (100, BP) [C6H5SO2C6H4CONHNH2 + H]+, 245 (19) [C6H5SO2C6H4CO]+; (ESI-MS) m/z: 446 [M − H]−, 426 (2) [M − H-HF]−, 412 (11) [M − H-H2S]−, 275 (100, BP) [C6H5SO2C6H4CONHNH]−; Anal. calcd for C20H15F2N3O3S2 (447.48 g/mol): C, 53.68; H, 3.38; N, 9.39. Found: C, 53.61; H, 3.30; N, 9.28%.
2-(4-(4-Chlorophenylsulfonyl)benzoyl)-N-(2,4-difluorophenyl)hydrazinecarbothioamide 5. Yield: 90%; m.p. 170–172 °C; IR (KBr, ν, cm−1): 3290, 3160 (NH), 3090, 3010 (aromatic C-H), 1680 (C=O), 1531, 1478 (C=C), 1319, 1294, 1156 (SO2), 1243 (C=S), 1145 (C-F), 761 (C-Cl); 1H-NMR (DMSO-d6, * ppm): 10.90 (s, 1H, NH); 10.03 (s, 1H, NH); 9.61 (s, 1H, NH); 8.12 (d, 2H, J = 8.9 Hz, aromatic protons); 8.09 (d, 2H, J = 8.9 Hz, aromatic protons); 8.01 (d, 2H, J = 8.5 Hz, aromatic protons); 7.71 (d, 2H, J = 8.5 Hz, aromatic protons); 7.07 (wt, 1H, J = 8.4 Hz, aromatic protons); 7.29 (m, 2H, aromatic protons); 13C-NMR (DMSO-d6, * ppm): 182.47 (C=S), 164.71 (C=O), 160.65 (dd, JC-F = 246.0; 11.3 Hz), 157.80 (dd, JC-F = 245.0; 13.7 Hz), 143.36, 139.45, 138.98, 137.20, 131.82 (d, JC-F = 9.7 Hz), 130.11, 129.58, 129.47, 127.54, 123.72 (d, JC-F = 19.9 Hz), 111.08 (d, JC-F = 21.8 Hz), 104.28 (t, JC-F = 25.5 Hz); (ESI-MS) m/z: 482 [M + H]+, 484 [M + H]+, 353 (31) [35ClC6H4SO2C6H4CONHNHCS]+, 355 (58) [37ClC6H4SO2C6H4CONHNHCS]+, 311 (100, BP) [35ClC6H4SO2C6H4CONHNH2 + H]+, 313 (100, BP) [37ClC6H4SO2C6H4CONHNH2 + H]+, 279 (5) [35ClC6H4SO2C6H4CO]+, 281 (24) [37ClC6H4SO2C6H4CO]+; (ESI-MS) m/z: 480 [M − H]−, 482 [M − H]−, 446 (9) [35ClM-H-H2S]−, 448 (9) [37ClM-H-H2S]−, 309 (100, BP) [35ClC6H4SO2C6H4CONHNH]−, 311 (100, BP) [37ClC6H4SO2C6H4CONHNH]−; Anal. calcd for C20H14ClF2N3O3S2 (481.92 g/mol): C, 49.84; H, 2.93; N, 8.72. Found: C, 49.75; H, 2.87; N, 8.60%.
2-(4-(4-Bromophenylsulfonyl)benzoyl)-N-(2,4-difluorophenyl)hydrazinecarbothioamide 6. Yield: 88%; m.p. 175–177 °C; IR (KBr, ν, cm−1): 3319, 3280 (NH), 3088, 3044, 3010 (aromatic C-H),

120
1682 (C=O), 1573, 1536, 1481 (C=C), 1321, 1293, 1157 (SO2), 1245 (C=S), 1144 (C-F), 576 (C-Br); 1H-NMR (DMSO-d6, * ppm): 10.90 (s, 1H, NH); 10.04 (s, 1H, NH); 9.62 (s, 1H, NH); 8.11 (d, 2H, J = 8.5 Hz, aromatic protons); 8.10 (d, 2H, J = 8.5 Hz, aromatic protons); 7.92 (d, 2H, J = 8.7 Hz; aromatic protons); 7.85 (d, 2H, J = 8.7 Hz, aromatic protons); 7.29 (m, 2H, aromatic protons); 7.07 (wt, 1H, J = 8.8 Hz, aromatic proton); 13C-NMR (DMSO-d6, * ppm): 182.47 (C=S), 164.71 (C=O), 160.65 (dd, JC-F = 243.0; 11.2 Hz), 157.40 (dd, JC-F = 243.0; 13.2 Hz), 143.33, 139.86, 137.20, 133.05, 131.93 (d, JC-F = 9.6 Hz), 129.60, 129.46, 128.46, 127.54, 123.70, 111.08 (d, JC-F = 20.9 Hz), 104.28 (t, JC-F = 25.2 Hz); (ESI-MS) m/z: 526 [M + H]+, 528 [M + H]+, 397 (40) [79BrC6H4SO2C6H4CONHNHCS]+, 399 (33) [81BrC6H4SO2C6H4CONHNHCS]+, 355 (100, BP) [79BrC6H4SO2C6H4CONHNH2 + H]+, 357 (100, BP) [81BrC6H4SO2C6H4CONHNH2 + H]+, 323 (1) [79BrC6H4SO2C6H4CO]+, 325 (32) [81BrC6H4SO2C6H4CO]+, 172 (5) [2,4-diFC6H3NHCS]+, 130 (6) [2,4-diFC6H3NH2 + H]+; (ESI-MS) m/z: 524 [M − H]−, 526 [M − H]−, 504 (3) [M − H-HF]−, 506 (4) [M − H-HF]−, 490 (7) [M − H-H2S]−, 492 (11) [M − H-H2S]−, 353 (100, BP) [79BrC6H4SO2C6H4CONHNH]−, 355 (100, BP) [81BrC6H4SO2C6H4CONHNH]−; Anal. calcd for C20H14BrF2N3O3S2 (526.37 g/mol): C, 45.64; H, 2.68; N, 7.98. Found: C, 45.58; H, 2.60; N, 7.88%.
3.1.2. General Procedure for the Preparation of 5-(4-(4-X-Phenylsulfonyl)phenyl)-4-(2,4-difluorophenyl)-2H-1,2,4-triazole-3(4H)-thiones 7–9
The corresponding hydrazinecarbothioamide 4–6 (3 mmol) was refluxed in aqueous sodium hydroxide solution (8%, 45 mL) for 5 h. The filtrate obtained by filtration of reaction mixture was cooled and acidified to pH~5 with hydrochloric acid (1%). The precipitated obtained was filtered, washed with water, dried and recristallized from CHCl3/petroleum ether (1:2, v/v).
4-(2,4-Difluorophenyl)-5-(4-(phenylsulfonyl)phenyl)-2H-1,2,4-triazole-3(4H)-thione 7 Yield: 71%; m.p. 256–258 °C; IR (KBr, ν, cm−1): 3414 (NH), 3065, 3015 (aromatic C-H), 1614, 1580, 1518, 1474 (C=N + C=C), 1338, 1290, 1160 (SO2), 1247 (C=S), 1143 (C-F); 1H-NMR (DMSO-d6, * ppm): 14.48 (s, 1H, NH); 8.00 (d, 2H, J = 8.6 Hz, aromatic protons); 7.95 (dd, 2H, J = 7.7, 1.5 Hz, aromatic protons); 7.73 (td, 1H, J = 8.7, 6.1 Hz, aromatic proton); 7.70 (t, 1H, J = 7.7, 1.5 Hz, aromatic proton); 7.61 (t, 2H, J = 7.7 Hz, aromatic protons); 7.58 (d, 2H, J = 8.6 Hz, aromatic protons); 7.54 (ddd, 1H, J = 10.2, 8.9, 2.7 Hz, aromatic protons); 7.31 (dddd, 1H, J = 9.8, 6.1, 2.7, 1.5 Hz, aromatic proton); 13C-NMR (DMSO-d6, * ppm): 169.52 (C3-triazolic ring), 162.96 (dd, JC-F = 251.4; 11.4 Hz), 157.72 (dd, JC-F = 252.8; 13.5 Hz), 149.03 (C5-triazolic ring), 142.85, 140.24, 134.17, 132.75 (d, JC-F = 10.6, Hz), 129.93, 129.86, 128.80, 128.03, 127.62, 118.39 (d, JC-F = 12.7 Hz), 112.99 (d, JC-F = 22.9 Hz), 105.68 (t, JC-F = 23.8 Hz); (ESI-MS) m/z: 430 [M + H]+; 356 (8) [M + H-SCNNH2]+; 289 (100, BP) [M + H-C6H5SO2]+; 172 (10.9) [F2C6H3NCS + H]+; 153 (62) [FC6H4NCS]+; (ESI-MS) m/z: 428 [M − H]−; 408 (15.4) [M − H-HF]−; 388 (15.4) [M − H-2HF]−; 267 (7,3) [M − H-HF-C6H5SO2]−; 141 (100, BP) [C6H5SO2]−; Anal. calcd for C20H13F2N3O2S2 (429.46 g/mol): C, 55.93; H, 3.05; N, 9.78. Found: C, 55.83; H, 2.98; N, 9.65%.
5-(4-(4-Chlorophenylsulfonyl)phenyl)-4-(2,4-difluorophenyl)-2H-1,2,4-triazole-3(4H)-thione 8 Yield: 73%; m.p. 245–247 °C; IR (KBr, ν, cm−1): 3278 (NH), 3091, 3053 (aromatic C-H), 1614, 1580, 1518, 1468 (C=N + C=C), 1338, 1276, 1159 (SO2), 1248 (C=S), 1144 (C-F), 768 (C-Cl); 1H-NMR (DMSO-d6, * ppm): 14.42 (s, 1H, NH); 8.01 (d, 2H, J = 8.5 Hz, aromatic protons); 7.96

121
(d, 2H, J = 8.8 Hz, aromatic proton); 7.73 (td, 1H, J = 8.8, 6.0 Hz, aromatic proton); 7.68 (d, 2H, J = 8.8 Hz, aromatic protons); 7.59 (d, 2H, J = 8.5 Hz, aromatic protons); 7.53 (ddd, 1H, J = 10.2, 9.1, 2.7 Hz, aromatic protons); 7.31 (dddd, 1H, J = 9.8, 6.4, 2.7, 1.5 Hz, aromatic proton); 13C-NMR (DMSO-d6, * ppm): 169.54 (C3-triazolic ring), 162.98 (dd, J = 250.8; 11.7 Hz), 149.01 (C5-triazolic ring), 157.27 (dd, JC-F = 253.1, 13.1 Hz), 142.39, 139.36, 139.04, 132.77 (d, JC-F = 10.5 Hz), 130.78, 130.11, 129.63, 128.86, 128.13, 118.40 (d, JC-F = 12.6 Hz), 113.01 (d, JC-F = 22.6 Hz), 105.70 (t, JC-F = 23.5 Hz); (ESI-MS) m/z: 464 [M + H]+; m/z: 466 [M + H]+; 289 (100, BP) [M + H-ClC6H4SO2]+; (ESI-MS) m/z: 462 [M − H]−; m/z: 464 [M − H]−; Anal. calcd for C20H12ClF2N3O2S2 (463.91 g/mol): C, 51.78; H, 2.61; N, 9.06. Found: C, 51.89; H, 2.47; N, 8.96%.
5-(4-(4-Bromophenylsulfonyl)phenyl)-4-(2,4-difluorophenyl)-2H-1,2,4-triazole-3(4H)-thione 9 Yield: 81%; m.p. 264–266 °C; IR (KBr, ν, cm−1): 3414 (NH), 3095, 3073, 3028 (aromatic C-H), 1614, 1572, 1516, 1471 (C=N + C=C), 1330, 1272, 1169 (SO2), 1255 (C=S), 1145 (C-F), 578 (C-Br); 1H-NMR (DMSO-d6, * ppm): 14.43 (s, 1H, NH); 8.00 (d, 2H, J = 8.5 Hz, aromatic protons); 7.88 (d, 2H, J = 8.8 Hz, aromatic protons); 7.83 (d, 2H, J = 8.8 Hz, aromatic protons); 7.73 (td, 1H, J = 8.8, 6.1 Hz, aromatic protons); 7.59 (d, 2H, J = 8.5 Hz, aromatic protons); 7.54 (ddd, 1H, J = 10.2, 9.0, 2.9 Hz, aromatic proton); 7.31 (dddd, 1H, J = 9.7, 6.5, 2.9, 1.4 Hz, aromatic proton); 13C-NMR (DMSO-d6, * ppm): 169.54 (C3-triazolic ring), 162.98 (dd, JC-F = 251.0, 11.5 Hz), 149.01 (C5-triazolic ring), 157.50 (dd, JC-F = 254.0; 13.4 Hz), 142.35, 139.49, 133.06, 132.78 (d, JC-F = 10.6, Hz), 130.08, 129.66, 128.88, 128.51, 128.14, 118.48 (d, JC-F = 12.6 Hz), 113.03 (d, JC-F = 22.9 Hz), 105.66 (t, JC-F = 23.5 Hz); (ESI-MS) m/z: 508 [M + H]+; m/z: 510 [M + H]+; 289 (100, BP) [M + H-BrC6H4SO2]+; 155 (24.8) [79BrC6H4]+; 157 (25.6) [81BrC6H4]+; 129 (63.2) [F2C6H3NH2]+; Anal. calcd for C20H12BrF2N3O2S2 (508.36 g/mol): C, 47.25; H, 2.38; N, 8.27. Found: C, 47.13; H, 2.30; N, 8.13%.
3.1.3. General Procedure for the Preparation of 2-(5-(4-(4-X-Phenylsulfonyl)phenyl)-4-(2,4-difluorophenyl)-4H-1,2,4-triazol-3-ylthio)-1-(phenyl/4-fluorophenyl)ethanones 10–15
To a solution of sodium ethoxide (23 mg of sodium in 10 mL of absolute ethanol) was added the corresponding triazole 7–9 (1 mmol). The reaction mixture was stirred at room temperature until a solution was obtained. To this solution was added the corresponding α-halogenated ketone (1 mmol) and stirring was continuated for 10 h. The reaction mixture was poured into ice water and the precipitate was filtered off, washed with water and recristallized from ethanol.
2-(4-(2,4-Difluorophenyl)-5-(4-(phenylsulfonyl)phenyl)-4H-1,2,4-triazol-3-ylthio)-1-phenylethanone 10 Yield: 70%; m.p. 176–178 °C; IR (KBr, ν, cm−1): 3070, 3038 (aromatic C-H), 2965, 2922 (CH2), 1685 (C=O), 1614, 1598, 1515 (C=N + C=C), 1312, 1291, 1161 (SO2), 1146 (C-F); 1H-NMR (DMSO-d6, * ppm): 8.03 (dd, 2H, J = 7.7, 1.3 Hz, aromatic protons); 8.00 (d, 2H, J = 8.6 Hz, aromatic protons); 7.97 (dd, 2H, J = 7.7, 1.4 Hz, aromatic proton); 7.87 (dt, 1H, J = 8.8, 5.8 Hz, aromatic proton); 7.71 (m, 1H, aromatic proton); 7.65 (t, 2H, J = 7.7 Hz, aromatic proton); 7.62 (d, 2H, J = 8.6 Hz, aromatic protons); 7.60 (m, 2H, aromatic protons); 7.56 (t, 2H, J = 7.7 Hz, aromatic protons); 7.40 (m, 1H, aromatic proton); 5.02 (s, 2H, S-CH2-); 13C-NMR (DMSO-d6, * ppm): 192.73 (C=O), 163.34 (dd, JC-F = 251.9; 11.7 Hz), 156.66 (dd, JC-F = 253.4; 13.8 Hz), 153.11 (C3-triazolic ring), 153.05 (C5-triazolic ring), 142.27, 140.36, 135.14, 134.07, 133.82,

122
131.59 (d, JC-F = 10.9 Hz), 130.66, 129.87, 128.83, 128.41, 128.30, 128.04, 127.54, 117.50 (d, JC-F = 12.0 Hz), 113.56 (d, JC-F = 25.2 Hz), 106.84 (t, JC-F = 23.2 Hz), 40.46 (S-CH2-); (APCI-MS) m/z: 548 [M + H]+; 514 (5.6) [M + H-H2S]+; 430 (15.3) [M + H-C6H5COCH]+; 398 (98.8) [M + H-C6H5COCHS]+; 105 (88.8) [C6H5CO]+; 91 (100, BP) [tropylium]+; Anal. calcd for C28H19F2N3O3S2 (547.60 g/mol): C, 61.41; H, 3.50; N, 7.67. Found: C, 61.23; H, 3.29; N, 7.48%.
2-(5-(4-(4-Chlorophenylsulfonyl)phenyl)-4-(2,4-difluorophenyl)-4H-1,2,4-triazol-3-ylthio)-1-phenylethanone 11 Yield: 84%; m.p. 191–193 °C; IR (KBr, ν, cm−1): 3084, 3040 (aromatic C-H), 2959, 2921 (CH2), 1678 (C=O), 1612, 1598, 1580, 1516 (C=N) + C=C), 1328, 1283, 1161 (SO2), 1146 (C-F), 767 (C-Cl); 1H-NMR (DMSO-d6, * ppm): 8.03 (dd, 2H, J = 7.7, 1.4 Hz, aromatic protons); 8.00 (d, 2H, J = 8.8 Hz, aromatic protons); 7.96 (d, 2H, J = 8.8 Hz, aromatic protons); 7.70 (d, 2H, J = 8.8 Hz, aromatic proton); 7.65 (m, 1H, aromatic proton); 7.63 (d, 2H, J = 8.8 Hz, aromatic protons); 7.61 (dt, 1H, J = 8.8, 6.0 Hz, aromatic proton); 7.56 (t, 2H, J = 7.7 Hz, aromatic protons); 7.40 (ddd, 1H, J = 10.2, 9.1, 2.8 Hz, aromatic proton); 7.24 (m, 1H, aromatic proton); 5.02 (s, 2H, S-CH2-); 13C-NMR (DMSO-d6, * ppm): 192.72 (C=O), 163.35 (dd, JC-F = 251.9, 11.7 Hz), 156.57 (dd, JC-F = 253.4, 13.5 Hz), 153.09 (C3-triazolic ring), 153.06 (C5-triazolic ring), 141.80, 139.22, 139.16, 135.14, 133.82, 131.59 (d, JC-F = 10.6 Hz), 130.86, 130.03, 129.55, 128.83, 128.41, 128.34, 128.13, 117.55 (d, JC-F = 9.2 Hz), 113.57 (d, JC-F = 20.4 Hz), 106.84 (t, JC-F = 23.5 Hz), 40.35 (S-CH2-); (APCI-MS) m/z: 582 [M + H]+; m/z: 584 [M + H]+; 476 (67.2) [M + H-C6H5CHO]+; 478 (82.3) [M + H-C6H5CHO]+; 464 (28.5) [M + H-C6H5COCH]+; 466 (30.2) [M + H-C6H5COCH]+; 444 (40.1) [M + H-C6H5COCH-HF]+; 446 (41.2) [M + H-C6H5COCH-HF]+; 432 (28.4) [M + H-C6H5COCHS]+; 434 (84.1) [M + H-C6H5COCHS]+; 305 (5.7) [M + H-C6H5COCHS-F2C6H3NH2]+; 307 (7.2) [M + H-C6H5COCHS-F2C6H3NH2]+; 159 (23.4) [35ClC6H4SO]+; 161 (10.3) [37ClC6H4SO]+; 105 (100, BP) [C6H5CO]+; 91 (95.2) [tropylium]+; Anal. calcd for C28H18ClF2N3O3S2 (582.04 g/mol): C, 57.78; H, 3.12; N, 7.22. Found: C, 57.67; H, 3.04; N, 7.07%.
2-(5-(4-(4-Bromophenylsulfonyl)phenyl)-4-(2,4-difluorophenyl)-4H-1,2,4-triazol-3-ylthio)-1-phenylethanone 12 Yield: 82%; m.p. 213–215 °C; IR (KBr, ν, cm−1): 3083, 3050 (aromatic C-H), 2960, 2922 (CH2), 1703 (C=O), 1615, 1598, 1572, 1517 (C=N + C=C), 1321, 1282, 1160 (SO2), 1142 (C-F), 580 (C-Br); 1H-NMR (DMSO-d6, * ppm): 8.03 (dd, 2H, J = 7.7, 1.4 Hz, aromatic protons); 8.00 (d, 2H, J = 8.8 Hz, aromatic protons); 7.89 (d, 2H, J = 8.8 Hz, aromatic protons); 7.87 (dt, 1H, J = 8.8, 5.8 Hz, aromatic proton); 7.83 (d, 2H, J = 8.8 Hz, aromatic protons); 7.69 (tt, 1H, J = 7.7, 1.4 Hz, aromatic proton); 7.65 (m, 1H, aromatic proton); 7.63 (d, 2H, J = 8.8 Hz, aromatic protons); 7.56 (t, 2H, J = 7.7 Hz, aromatic protons); 7.39 (m, 1H, aromatic proton); 5.02 (s, 2H, S-CH2-); 13C-NMR (DMSO-d6, * ppm): 192.71 (C=O), 163.26 (dd, JC-F = 251.7, 11.7 Hz), 156.65 (dd, JC-F = 253.4, 13.5 Hz), 153.11 (C3-triazolic ring), 153.06 (C5-triazolic ring), 141.75, 139.57, 135.13, 133.80, 132.98, 131.59 (d, JC-F = 10.6 Hz), 130.86, 129.56, 129.30, 128.83, 128.41, 128.35, 128.13, 117.51 (d, JC-F = 12.9 Hz), 113.59 (d, JC-F = 22.3 Hz), 106.85 (t, JC-F = 23.5 Hz), 40.46 (S-CH2-); (APCI-MS) m/z: 626 [M + H]+; m/z: 628 [M + H]+; 476 (31.9) [M + H-C6H5COCHS]+; 478 (26.3) [M + H-C6H5COCHS]+; 434 (12.7) [M + H-C6H5COCH2SNCNH]+; 436 (33.2) [M + H-C6H5COCH2SNCNH]+; 159 (23.4) [79BrC6H4SO]+; 161 (10.3) [81BrC6H4SO]+; 105(100, BP) [C6H5CO]+; 91 (95.2) [tropylium]+; Anal. calcd for C28H18BrF2N3O3S2 (626.49 g/mol): C, 53.68; H, 2.90; N, 6.71. Found: C, 53.54; H, 2.79; N, 6.62%.

123
2-(4-(2,4-Difluorophenyl)-5-(4-(phenylsulfonyl)phenyl)-4H-1,2,4-triazol-3-ylthio)-1-(4-fluorophe-nyl)ethanone 13 Yield: 72%; m.p. 152–154 °C; IR (KBr, ν, cm−1): 3071, 3035 (aromatic C-H), 2960, 2922 (CH2), 1682 (C=O), 1614, 1598, 1515 (C=N + C=C), 1313, 1281, 1161 (SO2), 1145 (C-F); 1H-NMR (DMSO-d6, * ppm): 8.11 (dd, 2H, J = 8.8, 5.5 Hz, aromatic protons), 7.99 (d, 2H, J = 8.5 Hz, aromatic protons); 7.95 (dd, 2H, J = 7.4, 1.5 Hz, aromatic protons); 7.86 (dt, 1H, J = 8.8, 5.8 Hz, aromatic proton); 7.71 (tt, 1H, J = 7.4, 1.5 Hz, aromatic protons); 7.65 (m, 1H aromatic proton); 7.63 (d, 2H, J = 8.5 Hz, aromatic protons); 7.62 (t, 2H, J = 7.4 Hz, aromatic protons); 7.39 (t, 2H, J = 8.8 Hz, aromatic protons); 7.30 (m, 1H, aromatic proton); 4.99 (s, 2H, S-CH2-); 13C-NMR (DMSO-d6, * ppm): 191.45 (C=O), 165.36 (d, JC-F = 252.8 Hz), 163.04 (dd, JC-F = 250.5; 11.7 Hz), 156.76 (dd, JC-F = 250.9; 13.2 Hz), 153.16 (C3-triazolic ring), 153.01 (C5-triazolic ring), 142.32, 140.38, 134.10, 131.95 (d, JC-F = 2.7 Hz), 131.60 (d, JC-F = 9.6 Hz), 131.55 (d, JC-F = 9.4 Hz), 130.67, 129.90, 128.34, 128.07, 127.57, 117.48 (d, JC-F = 9.8 Hz), 115.92 (d, JC-F = 21.9 Hz), 113.60 (d, JC-F = 22.7 Hz), 106.16 (dd, JC-F = 235.0, 27.3 Hz), 40.34 (S-CH2-); (APCI-MS) m/z: 566 [M + H]+; 428 (18.9) [M + H-FC6H4COCH3]+; 398 (35.3) [M + H-FC6H4COCHS]+; 356 (16.8) [M + H-FC6H4COCH2SNCNH]+; 137 (26.5) [FC6H4COCH2]+; 123 (82.2) [FC6H4CO]+; 109 (100, BP) [FC6H4N]+; Anal. calcd for C28H18F3N3O3S2 (565.59 g/mol): C, 59.46; H, 3.21; N, 7.43. Found: C, 59.23; H, 3.07; N, 7.26%.
2-(5-(4-(4-Chlorophenylsulfonyl)phenyl)-4-(2,4-difluorophenyl)-4H-1,2,4-triazol-3-ylthio)-1-(4-fluorophenyl)ethanone 14 Yield: 85%; m.p. 226–228 °C; IR (KBr, ν, cm−1): 3068, 3030 (aromatic C-H), 2965, 2920 (CH2), 1682 (C=O), 1615, 1599, 1514 (C=N + C=C), 1322, 1282, 1158 (SO2); 1145 (C-F), 768 (C-Cl); 1H-NMR (DMSO-d6, * ppm): 8.11 (dd, 2H, J = 8.8, 5.5 Hz, aromatic protons), 8.00 (d, 2H, J = 8.5 Hz, aromatic protons), 7.97 (d, 2H, J = 8.7 Hz, aromatic protons); 7.86 (dt, 1H, J = 8.8, 5.8 Hz, aromatic proton); 7.69 (d, 2H, J = 8.7 Hz, aromatic protons); 7.65 (m, 1H, aromatic proton), 7.63 (d, 2H, J = 8.5 Hz, aromatic protons); 7.39 (t, 2H, J = 8.8 Hz, aromatic protons); 7.38 (m, 1H, aromatic proton); 4.99 (s, 2H, S-CH2-); 13C-NMR (DMSO-d6, * ppm): 191.42 (C=O), 165.34 (d, JC-F = 252.5 Hz), 163.18 (dd, JC-F = 250.4, 11.8 Hz), 156.72 (dd, JC-F = 250.8, 13.1 Hz), 153.09 (C3-triazolic ring), 153.04 (C5-triazolic ring), 141.81, 139.22, 139.16, 131.94 (d, JC-F = 2.7 Hz), 131.59 (d, JC-F = 9.7 Hz), 131.52 (d, JC-F = 9.7 Hz), 130.85, 130.05, 128.55, 128.36, 128.14, 117.64 (d, JC-F = 9.8 Hz), 115.89 (d, JC-F = 21.9 Hz), 113.57 (d, JC-F = 19.6 Hz), 106.20 (dd, JC-F = 235.0, 27.3 Hz), 40.33 (S-CH2-); (APCI-MS) m/z: 600 [M + H]+; m/z: 602 [M + H]+; 123 (52.2) [FC6H4CO]+; 123 (48.3) [FC6H4CO]+; 109 (100, BP) [FC6H4N]+; Anal. calcd for C28H17ClF3N3O3S2 (600.03 g/mol): C, 56.05; H, 2.86; N, 7.00. Found: C, 55.97; H, 2.76; N, 6.87%.
2-(5-(4-(4-Bromophenylsulfonyl)phenyl)-4-(2,4-difluorophenyl)-4H-1,2,4-triazol-3-ylthio)-1-(4-fluorophenyl)ethanone 15 Yield: 80%; m.p. 228–230 °C; IR (KBr, ν, cm−1): 3080, 3067 (aromatic C-H), 2963, 2920 (CH2), 1682 (C=O), 1612, 1598, 1574, 1515 (C=N + C=C), 1323, 1282, 1159 (SO2), 1144 (C-F), 578 (C-Br); 1H-NMR (DMSO-d6, * ppm): 8.11 (dd, 2H, J = 8.9, 5.4 Hz, aromatic protons), 8.00 (d, 2H, J = 8.5 Hz, aromatic protons), 7.89 (d, 2H, J = 8.8 Hz, aromatic protons); 7.86 (dt, 1H, J = 8.8, 5.8 Hz, aromatic proton); 7.64 (d, 2H, J = 8.5 Hz, aromatic protons); 7.83 (d, 2H, J = 8.8 Hz, aromatic protons); 7.60 (m, 1H, aromatic proton); 7.38 (t, 2H, J = 8.9 Hz, aromatic protons); 7.30 (m, 1H, aromatic proton); 4.99 (s, 2H, S-CH2-); 13C-NMR (DMSO-d6, * ppm): 191.42 (C=O), 165.34 (d, JC-F = 252.5 Hz), 163.36 (dd, JC-F = 250.2, 11.8 Hz), 156.64 (dd, JC-F = 252.0, 13.4 Hz), 153.10 (C3-triazolic ring), 153.05 (C5-triazolic ring), 141.78, 139.58,
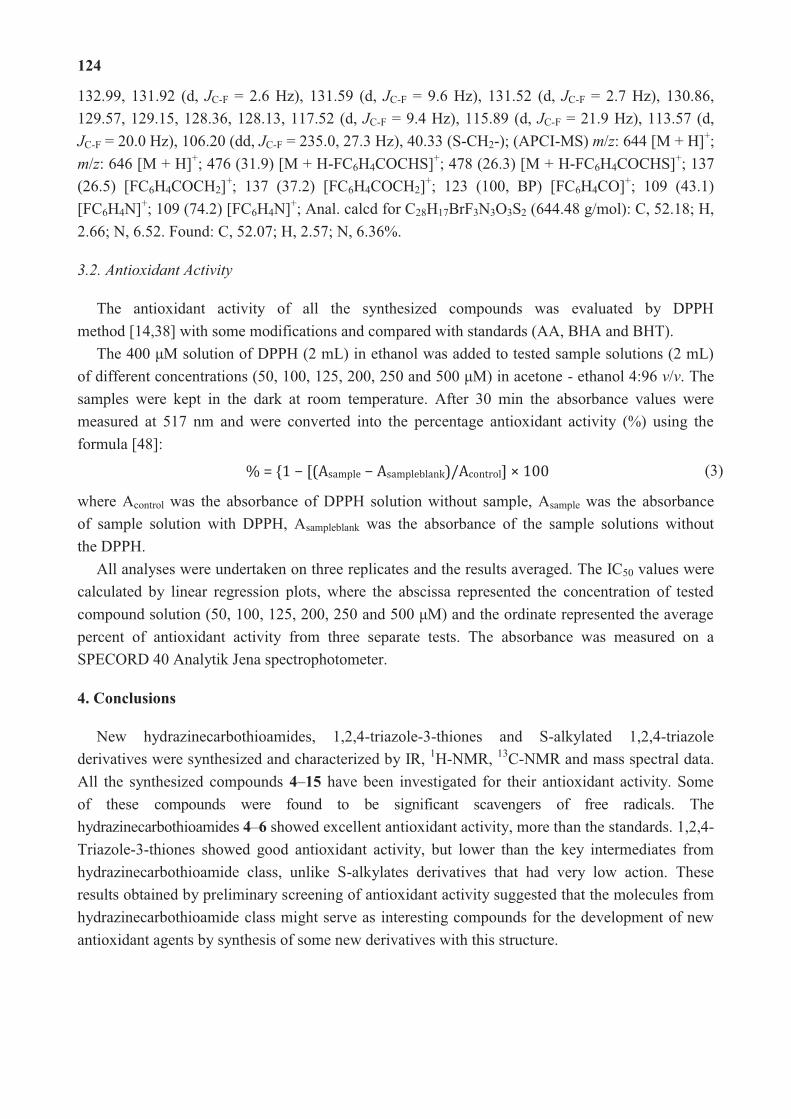
124
132.99, 131.92 (d, JC-F = 2.6 Hz), 131.59 (d, JC-F = 9.6 Hz), 131.52 (d, JC-F = 2.7 Hz), 130.86, 129.57, 129.15, 128.36, 128.13, 117.52 (d, JC-F = 9.4 Hz), 115.89 (d, JC-F = 21.9 Hz), 113.57 (d, JC-F = 20.0 Hz), 106.20 (dd, JC-F = 235.0, 27.3 Hz), 40.33 (S-CH2-); (APCI-MS) m/z: 644 [M + H]+; m/z: 646 [M + H]+; 476 (31.9) [M + H-FC6H4COCHS]+; 478 (26.3) [M + H-FC6H4COCHS]+; 137 (26.5) [FC6H4COCH2]+; 137 (37.2) [FC6H4COCH2]+; 123 (100, BP) [FC6H4CO]+; 109 (43.1) [FC6H4N]+; 109 (74.2) [FC6H4N]+; Anal. calcd for C28H17BrF3N3O3S2 (644.48 g/mol): C, 52.18; H, 2.66; N, 6.52. Found: C, 52.07; H, 2.57; N, 6.36%.
3.2. Antioxidant Activity
The antioxidant activity of all the synthesized compounds was evaluated by DPPH method [14,38] with some modifications and compared with standards (AA, BHA and BHT).
The 400 μM solution of DPPH (2 mL) in ethanol was added to tested sample solutions (2 mL) of different concentrations (50, 100, 125, 200, 250 and 500 μM) in acetone - ethanol 4:96 v/v. The samples were kept in the dark at room temperature. After 30 min the absorbance values were measured at 517 nm and were converted into the percentage antioxidant activity (%) using the formula [48]:
% = {1 − [(Asample − Asampleblank)/Acontrol] × 100 (3)
where Acontrol was the absorbance of DPPH solution without sample, Asample was the absorbance of sample solution with DPPH, Asampleblank was the absorbance of the sample solutions without the DPPH.
All analyses were undertaken on three replicates and the results averaged. The IC50 values were calculated by linear regression plots, where the abscissa represented the concentration of tested compound solution (50, 100, 125, 200, 250 and 500 μM) and the ordinate represented the average percent of antioxidant activity from three separate tests. The absorbance was measured on a SPECORD 40 Analytik Jena spectrophotometer.
4. Conclusions
New hydrazinecarbothioamides, 1,2,4-triazole-3-thiones and S-alkylated 1,2,4-triazole derivatives were synthesized and characterized by IR, 1H-NMR, 13C-NMR and mass spectral data. All the synthesized compounds 4–15 have been investigated for their antioxidant activity. Some of these compounds were found to be significant scavengers of free radicals. The hydrazinecarbothioamides 4–6 showed excellent antioxidant activity, more than the standards. 1,2,4-Triazole-3-thiones showed good antioxidant activity, but lower than the key intermediates from hydrazinecarbothioamide class, unlike S-alkylates derivatives that had very low action. These results obtained by preliminary screening of antioxidant activity suggested that the molecules from hydrazinecarbothioamide class might serve as interesting compounds for the development of new antioxidant agents by synthesis of some new derivatives with this structure.
125
Acknowledgments
This work was supported by University of Medicine and Pharmacy “Carol Davila” Bucharest, a project number 28492/30.10.2012.
Author Contributions
Stefania-Felicia Barbuceanu designed the research, performed the synthesis of the compounds, contributed to the analysis of the data and wrote the paper; Diana Carolina Ilies and Valeria Radulescu performed the antioxidant experiments; Gabriel Saramet and Valentina Uivarosi contributed to the synthesis of the compounds and to the interpretation of the data; Constantin Draghici performed NMR data experiments and contributed to the interpretation of the data.
Conflicts of Interest
The authors declare no conflict of interest.
References and Notes
1. Ślusarczyk, S.; Hajnos, M.; Skalicka-Woźniak, K.; Matkowski, A. Antioxidant activity of polyphenols from Lycopus lucidus Turcz. Food Chem. 2009, 113, 134–138.
2. Dakubo, G.D. Mitochondrial Genetics and Cance; Springer-Verlag Berlin Heidelberg: Berlin, Germany, 2010; doi:10.1007/978-3-642-11416-8.
3. Torreggiani, A.; Tamba, M. Free radical scavenging and metal chelating activity of some therapeutic heterocyclic agents. Trends Heterocycl. Chem. 2005, 10, 115–137.
4. Karalı, N.; Güzel, Ӧ.; Ӧzsoy, N.; Ӧzbey, S.; Salman, A. Synthesis of new spiroindolinones incorporating a benzothiazole moiety as antioxidant agents. Eur. J. Med. Chem. 2010, 45, 1068–1077.
5. Patil, V.P.; Markad, V.L.; Kodam, K.M.; Waghmode, S.B. Facile preparation of tetrahydro-5H-pyrido[1,2,3-de]-1,4-benzoxazines via reductive cyclization of 2-(8-quinolinyloxy)ethanones and their antioxidant activity. Bioorg. Med. Chem. Lett. 2013, 23, 6259–6263.
6. Azam, F. Therapeutic Potential of Free Radical Scavengers in Neurological Disorders in Handbook of Free Radicals: Formation, Types and Effects; Chapter 2; Kozyrev, D., Slutsky, V., Eds.; Nova Science Pub. Inc.: Hauppauge, NY, USA, 2010; pp. 57–97.
7. Groll, A.H.; Kolve, H. Antifungal agents: In vitro susceptibility testing, pharmacodynamics, and prospects for combination therapy. Eur. J. Clin. Microbiol. Infect. Dis. 2004, 23, 256–270.
8. Kathiravan, M.K.; Salake, A.B.; Chothe, A.S.; Dudhe, P.B.; Watode, R.P.; Mukta, M.S.; Gadhwe, S. The biology and chemistry of antifungal agents: A review. Bioorg. Med. Chem. 2012, 20, 5678–5698.
9. Thompson, G.R., III; Cadena, J.; Patterson, T.F. Overview of antifungal agents. Clin. Chest Med. 2009, 30, 203–215.
10. Balfour, H.H., Jr. Antiviral drugs. N. Engl. J. Med. 1999, 340, 1255–1268. 11. Murthy, N.; Rao, A.R.; Sastry, G.N. Aromatase inhibitors: A new paradigm in breast cancer
treatment. Curr. Med. Chem. Anticancer Agents 2004, 4, 523–534.

126
12. Koparir, M.; Orek, C.; Parlak, A.E.; Söylemez, A.; Koparir, P.; Karatepe, M.; Dastan, S.D. Synthesis and biological activities of some novel aminomethyl derivatives of 4-substituted-5-(2-thienyl)-2,4-dihydro-3H-1,2,4-triazole-3-thiones. Eur. J. Med. Chem. 2013, 63, 340–346.
13. Yehye, W.A.; Rahman, N.A.; Alhadi, A.A.; Khaledi, H.; Ng, S.W.; Ariffin, A. Butylated hydroxytoluene analogs: Synthesis and evaluation of their multipotent antioxidant activities. Molecules 2012, 17, 7645–7665.
14. Kuş, C.; Ayhan-Kılcıgil, G.; Özbey, S.; Kaynak, F.B.; Kaya, M.; Çoban, T.; Can-Eke, B. Synthesis and antioxidant properties of novel N-methyl-1,3,4-thiadiazol-2-amine and 4-methyl-2H-1,2,4-triazole-3(4H)-thione derivatives of benzimidazole class. Bioorg. Med. Chem. 2008, 16, 4294–4303.
15. Zoumpoulakis, P.; Camoutsis, C.; Pairas, G.; Soković, M.; Glamočlija, J.; Potamitis, C.; Pitsas, A. Synthesis of novel sulfonamide-1,2,4-triazoles, 1,3,4-thiadiazoles and 1,3,4-oxadiazoles, as potential antibacterial and antifungal agents. Biological evaluation and conformational analysis studies. Bioorg. Med. Chem. 2012, 20, 1569–1583.
16. Eswaran, S.; Adhikari, A.V.; Shetty, N.S. Synthesis and antimicrobial activities of novel quinoline derivatives carrying 1,2,4-triazole moiety. Eur. J. Med. Chem. 2009, 44, 4637–4647.
17. Hassan, G.S.; El-Messery, S.M.; Al-Omary, F.A.M.; Al-Rashood, S.T.; Shabayek, M.I.; Abulfadl, Y.S.; Habib, E.-S.E.; El-Hallouty, S.M.; Fayad, W.; Mohamed, K.M.; et al. Nonclassical antifolates, part 4. 5-(2-Aminothiazol-4-yl)-4-phenyl-4H-1,2,4-triazole-3-thiols as a new class of DHFR inhibitors: Synthesis, biological evaluation and molecular modeling study. Eur. J. Med. Chem. 2013, 66, 135–145.
18. Turan-Zitouni, G.; Kaplancikli, Z.A.; Yildiz, M.T.; Chevallet, P.; Kaya, D. Synthesis and antimicrobial activity of 4-phenyl/cyclohexyl-5-(1-phenoxyethyl)-3-[N-(2-thiazolyl)acetamido]-thio-4H-1,2,4-triazole derivatives. Eur. J. Med. Chem. 2005, 40, 607–613.
19. Duran, A.; Dogan, H.N.; Rollas, S. Synthesis and preliminary anticancer activity of new 1,4-dihydro-3-(3-hydroxy-2-naphthyl)-4-substituted-5H-1,2,4-triazoline-5-thiones. Farmaco 2002, 57, 559–564.
20. Idrees, G.A.; Aly, O.M.; Abuo-Rahma, G.E.D.A.A.; Radwan, M.F. Design, synthesis and hypolipidemic activity of novel 2-(naphthalen-2-yloxy)propionic acid derivatives as desmethyl fibrate analogs. Eur. J. Med. Chem. 2009, 44, 3973–3980.
21. Özadalı, K.; Özkanlı, F.; Jain, S.; Rao, P.P.N.; Velázquez-Martínez, C.A. Synthesis and biological evaluation of isoxazolo[4,5-d]pyridazin-4-(5H)-one analogues as potent anti-inflammatory agents. Bioorg. Med. Chem. 2012, 20, 2912–2922.
22. Orek, C.; Koparir, P.; Koparir, M. N-cyclohexyl-2-[5-(4-pyridyl)-4-(p-tolyl)-4H-1,2,4-triazol-3-ylsulfanyl]-acetamide dihydrate: Synthesis, experimental, theoretical characterization and biological activities. Spectrochim. Acta A 2012, 97, 923–934.
23. Navidpour, L.; Shafaroodi, H.; Abdi, K.; Amini, M.; Ghahremani, M.H.; Dehpour, A.R.; Shafiee, A. Design, synthesis, and biological evaluation of substituted 3-alkylthio-4,5-diaryl-4H-1,2,4-triazoles as selective COX-2 inhibitors. Bioorg. Med. Chem. 2006, 14, 2507–2517.

127
24. Stefanska, J.; Szulczyk, D.; Koziol, A.E.; Miroslaw, B.; Kedzierska, E.; Fidecka, S.; Busonera, B.; Sanna, G.; Giliberti, G.; La Colla, P.; et al. Disubstituted thiourea derivatives and their activity on CNS: Synthesis and biological evaluation. Eur. J. Med. Chem. 2012, 55, 205–213.
25. Šarkanj, B.; Molnar, M.; Čačić, M.; Gille, L. 4-Methyl-7-hydroxycoumarin antifungal and antioxidant activity enhancement by substitution with thiosemicarbazide and thiazolidinone moieties. Food Chem. 2013, 139, 488–495.
26. Kuş, C.; Ayhan-KIlcIgil, G.; Eke, B.C.; Işcan, M. Synthesis and antioxidant properties of some novel benzimidazole derivatives on lipid peroxidation in the rat liver. Arch. Pharm. Res. 2004, 27, 156–163.
27. Shelke, S.; Mhaske, G.; Gadakh, S.; Gill, C. Green synthesis and biological evaluation of some novel azoles as antimicrobial agents. Bioorg. Med. Chem. Lett. 2010, 20, 7200–7204.
28. Sriram, D.; Yogeeswari, P.; Priya, D.Y. Antimycobacterial activity of novel N-(substituted)-2-isonicotinoylhydrazinocarbothioamide endowed with high activity towards isoniazid resistant tuberculosis. Biomed. Pharmacother. 2009, 63, 36–39.
29. Elslager, E.F.; Gavrilis, Z.B.; Phillips, A.A.; Worth, D.F. Repository drugs. IV., 4',4'''-Sulfonylbisacetanilide (acedapsone, DADDS) and related sulfanilylanilides with prolonged antimalarial and antileprotic action. J. Med. Chem. 1969, 12, 357–363.
30. McMahon, J.B.; Gulakowski, R.J.; Weislow, O.S.; Schultz, R.J.; Narayanan, V.L.; Clanton, D.J.; Pedemonte, R.; Wassmundt, F.W.; Buckheit, R.W., Jr.; Decker, W.D.; et al. Diarylsulfones, a new chemical class of nonnucleoside antiviral anhibitors of human immunodeficiency virus Type 1 Reverse Transcriptase. Antimicrob. Agents Chemother. 1993, 37, 754–760.
31. Saeed, A.; Shaheen, U.; Hameed, A.; Kazmi, F. Synthesis and antimicrobial activity of some novel 2-(substituted fluorobenzoylimino)-3-(substituted fluorophenyl)-4-methyl-1,3-thiazolines. J. Fluorine Chem. 2010, 131, 333–339.
32. Barbuceanu, S.-F.; Saramet, G.; Almajan, G.L.; Draghici, C.; Barbuceanu, F.; Bancescu, G. New heterocyclic compounds from 1,2,4-triazole and 1,3,4-thiadiazole class bearing diphenylsulfone moieties. Synthesis, characterization and antimicrobial activity evaluation. Eur. J. Med. Chem. 2012, 49, 417–423.
33. Barbuceanu, S.-F.; Bancescu, G.; Saramet, G.; Barbuceanu, F.; Draghici, C.; Radulescu, F.S.; Ionescu, A.; Negres, S. Synthesis and biological evaluation of some new N1-[4-(4-Chlorophenylsulfonyl)benzoyl]-N4-(aryl)-thiosemicarbazides and products of their cyclization. Heteroat. Chem. 2013, 24, 309–321.
34. Almajan, G.L.; Innocenti, A.; Puccetti, L.; Manole, G.; Barbuceanu, S.; Saramet, I.; Scozzafava, A.; Supuran, C.T. Carbonic anhydrase inhibitors. Inhibition of the cytosolic and tumor-associated carbonic anhydrase isozymes I, II, and IX with a series of 1,3,4-thiadiazole- and 1,2,4-triazole-thiols. Bioorg. Med. Chem. Lett. 2005, 15, 2347–2352.
35. Socea, L.-I.; Apostol, T.V.; Şaramet, G.; Bărbuceanu, Ş.-F.; Drăghici, C.; Dinu, M. Synthesis and root growth activity of some new acetylhydrazinecarbothioamides and 1,2,4-triazoles substituted with 5H-dibenzo[a,d]annulene moiety. J. Serb. Chem. Soc. 2012, 77, 1541–1549.

128
36. Şaramet, I.; Almăjan, G.-L.; Barbuceanu, Ş.; Drăghici, C.; Banciu, M.D. Synthesis of some substituted aroyl thiosemicarbazides, -mercaptotriazoles and -aminothiadiazoles. Rev. Roum. Chim. 2005, 50, 19–27.
37. Mavrodin, A.; Zotta, V.; Stoenescu, V.M.; Oteleanu, D. Sulfones. IV. New sulfone-hydrazide derivatives. Pharm. Zentr. Deutsch. 1956, 95, 353–361.
38. Khan, I.; Ali, S.; Hameed, S.; Rama, N.H.; Hussain, M.T.; Wadood, A.; Uddin, R.; Ul-Haq, Z.; Khan, A.; Ali, S.; et al. Synthesis, antioxidant activities and urease inhibition of some new 1,2,4-triazole and 1,3,4-thiadiazole derivatives. Eur. J. Med. Chem. 2010, 45, 5200–5207.
39. Kumar, H.; Javed, S.A.; Khan, S.A.; Amir, M. 1,3,4-Oxadiazole/thiadiazole and 1,2,4-triazole derivatives of biphenyl-4-yloxy acetic acid: Synthesis and preliminary evaluation of biological properties. Eur. J. Med. Chem. 2008, 43, 2688–2698.
40. Liesen, A.P.; de Aquino, T.M.; Carvalho, C.S.; Lima, V.T.; de Araújo, J.M.; de Lima, J.G.; de Faria, A.R.; de Melo, E.J.T.; Alves, A.J.; Alves, E.W.; et al. Synthesis and evaluation of anti-Toxoplasma gondii and antimicrobial activities of thiosemicarbazides, 4-thiazolidinones and 1,3,4-thiadiazoles. Eur. J. Med. Chem. 2010, 45, 3685–3691.
41. Akhtar, T.; Hameed, S.; Al-Masoudi, N.A.; Khan, K.M. Synthesis and anti-HIV activity of new chiral 1,2,4-triazoles and 1,3,4-thiadiazoles. Heteroat. Chem. 2007, 18, 316–322.
42. Salgın-Gökșen, U.; Gökhan-Kelekçi, N.; Göktaș, Ö.; Köysal, Y.; Kılıç, E.; Ișık, Ș.; Aktay, G.; Özalp, M. 1-Acylthiosemicarbazides, 1,2,4-triazole-5(4H)-thiones, 1,3,4-thiadiazoles and hydrazones containing 5-methyl-2-benzoxazolinones: Synthesis, analgesic-anti-inflammatory and antimicrobial activities. Bioorg. Med. Chem. 2007, 15, 5738–5751.
43. Al-Deeb, O.A.; Al-Omar, M.A.; El-Brollosy, N.R.; Habib, E.E.; Ibrahim, T.M.; El-Emam, A.A. Synthesis, antimicrobial, and antiinflammatory activities of novel 2-[3-(1-adamantyl)-4-substituted-5-tioxo-1,2,4-triazolin-1-yl]acetic acids, 2-[3-(1-adamantyl)-4-substituted-5-tioxo-1,2,4-triazolin-1-yl]-propionic acids and related derivatives. Arzneim.-Forsch./Drug Res. 2006, 56, 40–47.
44. Saadeh, H.A.; Mosleh, I.M.; Al-Bakri, A.G.; Mubarak, M.S. Synthesis and antimicrobial activity of new 1,2,4-triazole-3-thiol metronidazole derivatives. Monatsh. Chem. 2010, 141, 471–478.
45. Kumar, A.; Sharma, P.; Kumari, P.; Kalal, B.L. Exploration of antimicrobial and antioxidant potential of newly synthesized 2,3-disubstituted quinazoline-4(3H)-ones. Bioorg. Med. Chem. Lett. 2011, 21, 4353–4357
46. Zhou, B.; Li, B.; Yi, W.; Bu, X.; Ma, L. Synthesis, antioxidant, and antimicrobial evaluation of some 2-arylbenzimidazole derivatives. Bioorg. Med. Chem. Lett. 2013, 23, 3759–3763.
47. Lipinski, C.A.; Lombardo, F.; Dominy, B.W.; Feeney P.J. Experimental and computational approaches to estimate solubility and permeability in drug discovery and development settings. Adv. Drug. Deliv. Rev. 2001, 46, 3–26.
48. Duan, X.-J.; Zhang, W.-W.; Li, X.-M.; Wang, B.-G. Evaluation of antioxidant property of extract and fractions obtained from a red alga, Polysiphonia urceolata. Food Chem. 2006, 95, 37–43.
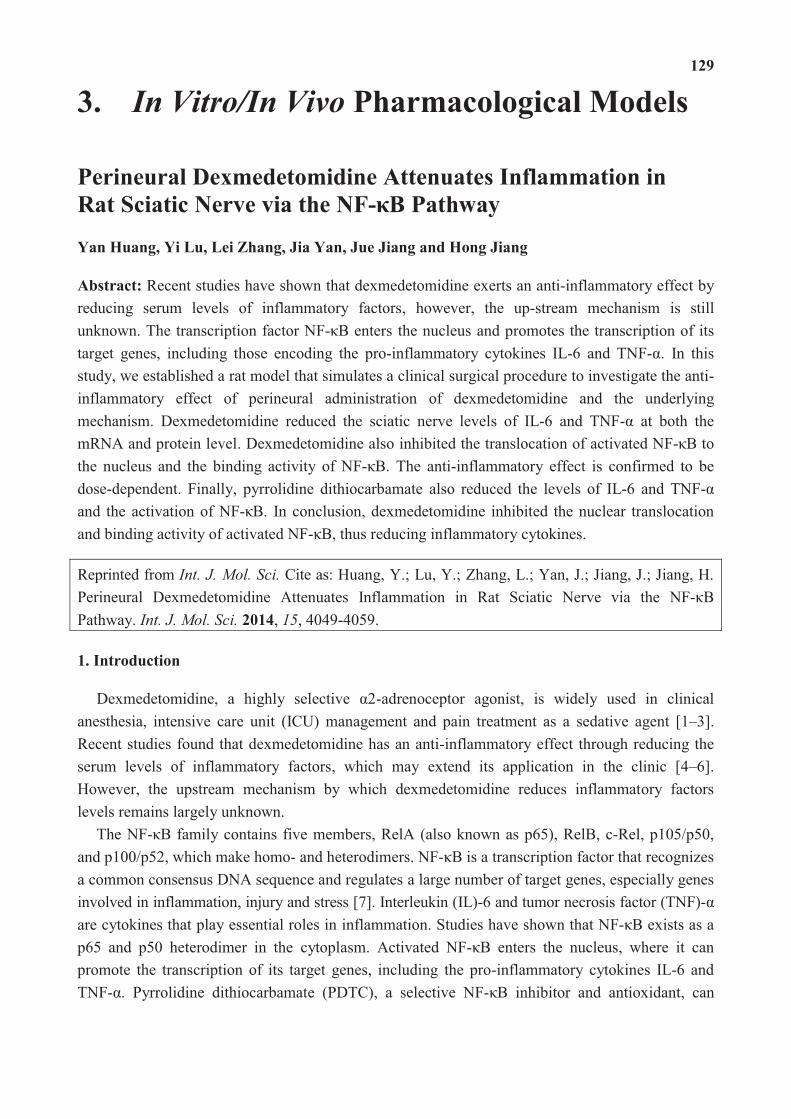
129
3. In Vitro/In Vivo Pharmacological Models
Perineural Dexmedetomidine Attenuates Inflammation in
Rat Sciatic Nerve via the NF-κB Pathway
Yan Huang, Yi Lu, Lei Zhang, Jia Yan, Jue Jiang and Hong Jiang
Abstract: Recent studies have shown that dexmedetomidine exerts an anti-inflammatory effect by reducing serum levels of inflammatory factors, however, the up-stream mechanism is still unknown. The transcription factor NF-κB enters the nucleus and promotes the transcription of its target genes, including those encoding the pro-inflammatory cytokines IL-6 and TNF-α. In this study, we established a rat model that simulates a clinical surgical procedure to investigate the anti-inflammatory effect of perineural administration of dexmedetomidine and the underlying mechanism. Dexmedetomidine reduced the sciatic nerve levels of IL-6 and TNF-α at both the mRNA and protein level. Dexmedetomidine also inhibited the translocation of activated NF-κB to the nucleus and the binding activity of NF-κB. The anti-inflammatory effect is confirmed to be dose-dependent. Finally, pyrrolidine dithiocarbamate also reduced the levels of IL-6 and TNF-α and the activation of NF-κB. In conclusion, dexmedetomidine inhibited the nuclear translocation and binding activity of activated NF-κB, thus reducing inflammatory cytokines.
Reprinted from Int. J. Mol. Sci. Cite as: Huang, Y.; Lu, Y.; Zhang, L.; Yan, J.; Jiang, J.; Jiang, H. Perineural Dexmedetomidine Attenuates Inflammation in Rat Sciatic Nerve via the NF-κB Pathway. Int. J. Mol. Sci. 2014, 15, 4049-4059.
1. Introduction
Dexmedetomidine, a highly selective α2-adrenoceptor agonist, is widely used in clinical anesthesia, intensive care unit (ICU) management and pain treatment as a sedative agent [1–3]. Recent studies found that dexmedetomidine has an anti-inflammatory effect through reducing the serum levels of inflammatory factors, which may extend its application in the clinic [4–6]. However, the upstream mechanism by which dexmedetomidine reduces inflammatory factors levels remains largely unknown.
The NF-κB family contains five members, RelA (also known as p65), RelB, c-Rel, p105/p50, and p100/p52, which make homo- and heterodimers. NF-κB is a transcription factor that recognizes a common consensus DNA sequence and regulates a large number of target genes, especially genes involved in inflammation, injury and stress [7]. Interleukin (IL)-6 and tumor necrosis factor (TNF)-α are cytokines that play essential roles in inflammation. Studies have shown that NF-κB exists as a p65 and p50 heterodimer in the cytoplasm. Activated NF-κB enters the nucleus, where it can promote the transcription of its target genes, including the pro-inflammatory cytokines IL-6 and TNF-α. Pyrrolidine dithiocarbamate (PDTC), a selective NF-κB inhibitor and antioxidant, can

130
inhibit the NF-κB pathway by blocking the entrance of activated NF-κB to the nucleus and the binding of NF-κB to the promoter regions of IL-6 and TNF-α [8–10].
Peripheral nerve block is a common regional anesthetic technique performed everyday throughout the world as an alternative to general anesthesia and is performed for postoperative analgesia [11–13]. Dexmedetomidine is usually injected in the peripheral nerve to prolong the duration of the peripheral nerve block as an adjuvant for local anesthetics [14–17]. In this study, perineural administration of dexmedetomidine not only blocked NF-κB translocation to the nucleus and NF-κB binding activity but also reduced IL-6 and TNF-α levels in rats. PDTC, an NF-κB inhibitor, can also reduce IL-6 and TNF-α levels by inhibiting NF-κB activity following perineural administration. In summary, dexmedetomidine can inhibit inflammation through the NF-κB pathway.
2. Results
2.1. Perineural High Doses of Dexmedetomidine Reduced the IL-6 and TNF-α Levels in the Sciatic Nerve
Rats were anesthetized and injected perineurally with either a high dose of dexmedetomidine (DH, 20 μg/kg) or normal saline (C). Sciatic nerves were harvested 30, 60 and 90 min after injection. Real-time PCR revealed that dexmedetomidine reduced the mRNA levels of both IL-6 and TNF-α at all of the examined time points (Figure 1A,B). The protein levels of both IL-6 and TNF-α were significantly decreased after perineural injection of dexmedetomidine at all time points, as shown by both ELISA (Figure 1C,D) and Western blotting (Figure 1E–G). These results suggested that perineural injection of 20 μg/kg dexmedetomidine reduces the sciatic nerve levels of IL-6 and TNF-α at the level of both mRNA and protein.
2.2. Perineural Dexmedetomidine Decreased NF-κB Translocation to the Nucleus and Transcriptional Binding Activity
As previous studies have shown [16–19], activated NF-κB should translocate to the nucleus and bind to the promoter region of multiple genes, including cytokine genes, inducing the expression of cytokine mRNA and protein. Thus, we assessed the effects of perineural administration of dexmedetomidine on the nuclear levels of NF-κB in sciatic nerve tissue. The sciatic nerve tissues were subjected to Western blot analysis for the total NF-κB protein level, and the nuclear extracts were assessed for the nuclear NF-κB protein level. The Western blot of NF-κB showed that perineural administration of dexmedetomidine decreased the nuclear level of NF-κB compared with the control group at 30, 60 and 90 min (Figure 2A,B), but no significant differences were detected in the total level of NF-κB (Figure 2A,C). These findings indicate that perineural administration of dexmedetomidine may prevent NF-κB translocation into the nucleus in the sciatic nerve and thus may decrease the subsequent expression of inflammatory factors.
We then used EMSA to test the effect of dexmedetomidine on the transcriptional binding activity of NF-κB in nuclear extracts prepared from sciatic nerve tissues [20]. In Figure 2D, lane 1 is a negative control (double-distilled water), lane 2 represents the control group with perineural administration of normal saline, lane 3 represents the DH group with perineural 20.0 μg/kg
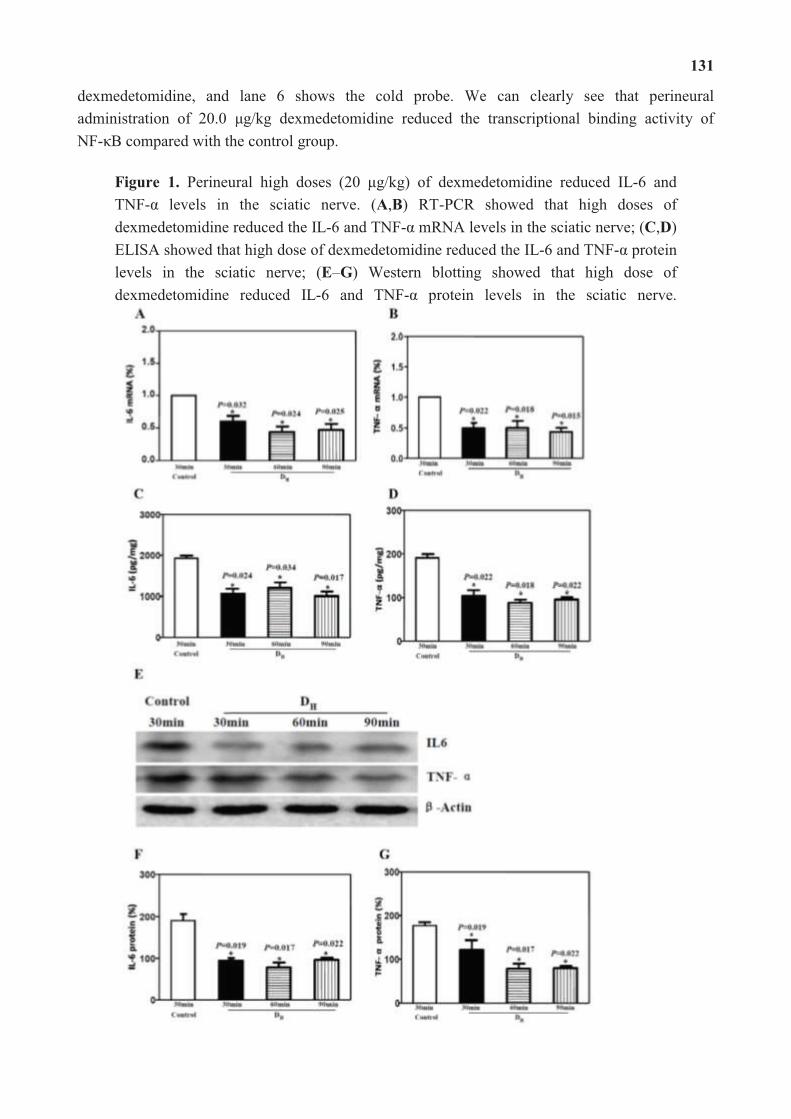
131
dexmedetomidine, and lane 6 shows the cold probe. We can clearly see that perineural administration of 20.0 μg/kg dexmedetomidine reduced the transcriptional binding activity of NF-κB compared with the control group.
Figure 1. Perineural high doses (20 μg/kg) of dexmedetomidine reduced IL-6 and TNF-α levels in the sciatic nerve. (A,B) RT-PCR showed that high doses of dexmedetomidine reduced the IL-6 and TNF-α mRNA levels in the sciatic nerve; (C,D) ELISA showed that high dose of dexmedetomidine reduced the IL-6 and TNF-α protein levels in the sciatic nerve; (E–G) Western blotting showed that high dose of dexmedetomidine reduced IL-6 and TNF-α protein levels in the sciatic nerve.

132
Figure 2. Perineural administration of 20 μg/kg dexmedetomidine decreased the translocation to the nucleus and transcriptional binding activity of NF-κB. (A) Western blot showed that 20 μg/kg dexmedetomidine decreased NF-κB translocation into the nucleus; (B) Dexmedetomidine (20 μg/kg) decreased the nuclear NF-κB protein level; (C) Dexmedetomidine (20 μg/kg) did not alter the total NF-κB protein level; (D) EMSA showed that 20 μg/kg dexmedetomidine decreased the transcriptional binding activity of NF-κB (lane 3); PDTC also decreased NF-κB transcriptional binding activity (lane 5). NF-κB, nuclear factor-kappa B; PDTC, pyrrolidine dithiocarbamate.
2.3. Only High Dose Dexmedetomidine Attenuated the NF-κB Translocation to the Nucleus
Based on the above conclusions, we further tested whether different doses of dexmedetomidine have the same effect on attenuating the translocation of NF-κB. We further tested the DM and DL groups, which received a middle dose and a low dose of dexmedetomidine (10.0 and 5 μg/kg, respectively). Western blotting was used to analyze the total NF-κB protein level and the nuclear NF-κB protein level. The results showed that only the high dose of dexmedetomidine (DH) attenuated NF-κB translocation to the nucleus, whereas the total and nuclear protein levels of

133
NF-κB were unchanged in the DM and DL groups (Figure 3A–C). These results suggested that perineurally administered dexmedetomidine attenuates the inflammatory response above a certain threshold dose.
Figure 3. Only the high dose (20 μg/kg) of dexmedetomidine attenuated NF-κB translocation to the nucleus. (A) Western blotting showed that only the high dose of dexmedetomidine decreased NF-κB translocation to the nucleus; (B) The high dose of dexmedetomidine decreased the nuclear NF-κB protein level, but the middle doses (10 μg/kg) and low doses (5 μg/kg) did not have an effect; (C) Dexmedetomidine did not alter the total NF-κB protein level in any of the groups. NF-κB, nuclear factor-kappa B.
2.4. The Inflammation of the Sciatic Nerve Could Be Attenuated by PDTC via the NF-κB Pathway
PDTC, a selective NF-κB inhibitor and antioxidant, inhibits the NF-κB pathway by blocking the translocation of activated NF-κB to the nucleus [10]. Here, we assessed whether inflammation of the sciatic nerve could be attenuated by PDTC via the NF-κB pathway in a manner similar to that of dexmedetomidine. Western blot analysis confirmed that both the translocation of NF-κB to nucleus and the downstream expression of IL-6 and TNF-α protein were down-regulated by PDTC (Figure 4A–F). RT-PCR (Figure 4G,H) and ELISA (Figure 4I,J) further confirmed the down-regulation of the inflammatory factors IL-6 and TNF-α. EMSA showed that the transcriptional binding activity of NF-κB was reduced by PDTC compared with the control group (Figure 2D, lane 5). These changes were in accordance with our results with dexmedetomidine and suggest that perineural administration of dexmedetomidine has a similar, or at least partly similar, anti-inflammatory effect as PDTC, via the NF-κB signalling pathway.

134
Figure 4. PDTC attenuated the inflammation of the sciatic nerve via the NF-κB pathway. (A,C,D) Western blotting showed that PDTC decreased NF-κB translocation into the nucleus; (B,E,F) Western blotting showed that PDTC reduced the IL-6 and TNF-α protein levels in the sciatic nerve; (G,H) RT-PCR showed that PDTC reduced the IL-6 and TNF-α mRNA levels in the sciatic nerve; (I,J) ELISA showed that PDTC reduced the IL-6 and TNF-α protein level in the sciatic nerve.
3. Discussion
Dexmedetomidine is widely used in clinical anesthesia as a most closely ideal sedative because of its analgesia and sedation effects without respiratory depression [18–21]. Recent studies found that dexmedetomidine has an anti-inflammatory effect by reducing the serum levels of inflammatory cytokines, however, the upstream mechanism is still unknown [4–6]. In the present

135
study, we used a surgical procedure and perineural injection to induce a background inflammatory response (e.g., increasing IL-6 and TNF-α levels) in sciatic nerve tissue to investigate the anti-inflammatory effect of perineural administration of dexmedetomidine and the underlying mechanism. We found that, in the sciatic nerves of rats, perineural administration of 20 μg/kg dexmedetomidine reduced the level of IL-6 and TNF-α, prevented NF-κB translocation to the nucleus and decreased the transcriptional binding activity of NF-κB. These results, in accordance with perineural administration of the NF-κB pathway inhibitor PDTC, suggested that dexmedetomidine reduced inflammation by inhibiting the NF-κB signaling pathway.
Dexmedetomidine is usually intravenously administered during clinical anesthesia as a sedative agent. Currently, perineural administration of dexmedetomidine is widely used in peripheral nerve anesthesia as an adjuvant for local anesthetics to prolong the duration of a peripheral nerve block [3,17,22]. Here, we incised the skin and subcutaneous fat of rats to simulate the clinical surgical procedure. We then exposed the sciatic nerve and injected dexmedetomidine to investigate the inflammatory cytokine levels in the sciatic nerve tissue. As a result, we confirmed that perineural administration of dexmedetomidine inhibited the translocation of activated NF-κB to the nucleus and the binding activity of activated NF-κB, thus reducing the level of inflammatory cytokines. The anti-inflammatory effect of perineural administration of dexmedetomidine may extend its application in clinical anesthesia.
In a previous study [16], dexmedetomidine added to ropivacaine was shown to increase the duration of the sensory block in a dose-dependent fashion, varying from 0.5 to 20 μg/kg, in rats. Interestingly, in our study, NF-κB translocation to the nucleus was not inhibited in the DM and DL groups (which received dexmedetomidine doses of 10.0 and 5 μg/kg, respectively), but the DH group (20 μg/kg) did show an effect. The results indicate that a dose threshold needs to be crossed before an anti-inflammatory effect occurs. Furthermore, Brummett’s study confirmed that a high dose of dexmedetomidine, up to 40 μg/kg, was considered safe for rats because the histopathological evaluation showed that nerve axon and myelin were not altered by dexmedetomidine and there was no neurotoxicity or side-effects for the rats [15]. Similarly, there was no neurotoxicity or side-effect noted at 24 h or 14 days in our study. Based on these results, a high perineural dose of dexmedetomidine may be recommended for routine use as an adjuvant for local anesthetics owing to its anti-inflammatory and analgesia-prolonging effect.
4. Experimental Section
All of the investigators followed the Shanghai Ninth People’s Hospital Animal Study Guidelines, and the study was approved by the Shanghai Ninth People’s Hospital Committee for the Use and Care of Animals (Shanghai, China).
For blinding, all of the drug solutions were prepared in syringes without labels by an investigator other than the one performing the perineural sciatic injection. The investigators who harvested the tissue and performed the later Western blotting, real-time PCR, ELISA and EMSA were also blinded to the study groups.

136
4.1. Animals
Forty-eight Sprague-Dawley rats, weighing 180 to 220 g, were obtained from Shanghai Ninth People’s Hospital SPF Animal Center (Shanghai, China). The rats were housed at 23 °C with a light-dark cycle and allowed free access to food and water.
4.2. Study Groups
The Sprague-Dawley rats were divided into four groups for further intervention. Control group rats received only normal saline. The DH group received a high dose of dexmedetomidine (20.0 μg/kg), whereas the DM and DL groups received a middle dose and a low dose of dexmedetomidine (10.0 and 5 μg/kg, respectively).
4.3. Drug Preparation
An investigator who was not involved in either the perineural sciatic injection or the subsequent analysis prepared the drugs. Dexmedetomidine and normal saline were used to make final drug solutions. Each rat received a total volume of 0.2 mL for a perineural sciatic injection. The doses of dexmedetomidine were based on the individual rats’ body weight for 20.0 μg/kg (DH), 10.0 μg/kg (DM), 5.0 μg/kg (DL) respectively.
4.4. Animal Model and Perineural Injection
To investigate the anti-inflammatory effect of perineural administration of dexmedetomidine, we established a rat model of surgical-induced inflammation. Rats were anesthetized and maintained using 3.0% isoflurane. As previously described [15], an incision was made over the thigh, and the muscle and fascia were dissected to expose the sciatic nerve directly below the clear fascial covering. A total volume of 0.2 mL was injected into the perineural space below the clear fascia covering the nerve using a 30-gauge needle and tuberculin syringe. After injection, the muscle and skin of the thigh were sutured, and the isoflurane was discontinued. The animal model of surgical-induced inflammation was confirmed by increasing the inflammatory factor, such as IL-6 and TNF-α, after the surgical procedure.
4.5. Nuclear Extraction and Western Blotting
A nuclear extraction kit (Ab110168, Abcam, Cambridge, MA, USA) was used for the preparation of nuclear extracts from sciatic nerve tissues. For Western blotting, frozen rat sciatic nerve tissues were homogenized and the lysates were prepared in ice-cold lysis buffer. Nuclear extracts or total protein were collected and normalized for equal amounts of total protein measured by the bicinchoninic acid (BCA) method. Seventy micrograms of protein from each sample was separated on a sodium dodecyl sulfate polyacrylamide gel and transferred to PVDF membranes. The membranes were blocked with 5% nonfat milk and incubated overnight with primary anti-NF-κB antibody (1:1000; sc-109, Santa Cruz, CA, USA), anti-IL-6 antibody (1:1000; ab6672, Abcam, Cambridge, MA, USA), anti-TNF-α antibody (1:1000; AB1837P; Millipore, Billerica, MA, USA), and anti-β-actin (1:5000, Sigma, St. Louis, MO, USA) at 4 °C, followed by incubation with the

137
suitable HRP-conjugated secondary antibody for 4 h. β-actin protein was immunodetected as the internal standard.
4.6. Real-Time PCR and ELISA
The levels of IL-6 and TNF-α mRNA were detected by real-time polymerase chain reaction (RT-PCR) in the sciatic nerve tissues as described [11]. RNA was isolated following the protocol of the RNeasy Mini Kit (Qiagen, Inc., Valencia, CA, USA), while concentration determined using a NanoDrop ND-1000 Spectrophotometer (Thermo Scientific, Wilmington, DE, USA). Primers of Rat IL-6 is 5ꞌ -GACTGATGTTGTTGACAGCCACTGC-3ꞌ ; 5ꞌ -TAGCCACTCCTTCTGTGACTCTAACT-3ꞌ , TNF-α 5ꞌ -TTC TGT CTA CTG AAC TTC GGG GTG ATG GGT CC-3ꞌ ; 5ꞌ -GTA TGA GAT AGC AAA TCG GCT GAC GGT GTG GG-3ꞌ and Rat GAPDH 5ꞌ -CCT TCA TTG ACC TCA ACT AC-3ꞌ ;5ꞌ -GGA AGG CCA TGC CAG TGA GC-3ꞌ . RT-PCR was carried out using the QuantiTect SYBR Green RT-PCR Kit (Qiagen). The quantity of the target mRNA was normalised against a house-keeping gene, GAPDH, which served as an internal control.
The levels of IL-6 and TNF-α proteins in the sciatic nerve were measured using ELISA kits according to the manufacturer’s instructions. ELISA kits for TNF-α and IL-6 were obtained from R & D Systems (Minneapolis, MN, USA).
4.7. Electrophoretic-Mobility Shift Assay (EMSA)
An electrophoretic-mobility shift assay (EMSA) kit (GS-0030, Signosis, Santa Clara, CA, USA) was used to assess the transcriptional binding activity of NF-κB as a previous study described [11]. The nuclear extract (5 mg) was incubated with 1 μL poly d(I-C), 2.0 μL 5× Binding Buffer and 1.0 μL of transcription factor (TF) probe in a 0.5 mL microcentrifuge tube at 20–23 °C for 30 min in a PCR machine. We added 1.0 μL of cold TF probe into this reaction for the cold probe control. Samples were then loaded onto a 6.5% non-denaturing polyacrylamide gel and separated at 100 V, and the proteins were transferred to a membrane at 60 V for 1 h at 4 °C. The membrane was imaged using a chemiluminescence imaging system (Bio-Rad, Hercules, CA, USA).
4.8. Statistics
Data are shown as mean (SD). Student’s t-test, one-way and two-way analysis of variance (ANOVA) were used to compare the differences among the experimental groups and the control group. p < 0.05 (*) was considered statistically significant. The significance testing was two-tailed. Normality tests showed that the data were normally distributed, and the GraphPad software Prism 5 (GraphPad Software Inc., San Diego, CA, USA) was used to analyze the data.
5. Conclusions
In conclusion, we have established a rat model that simulates a clinical surgical procedure to investigate the anti-inflammatory effect of perineural administration of dexmedetomidine and the underlying mechanism. Dexmedetomidine (20 μg/kg) inhibited the translocation of activated

138
NF-κB to the nucleus and its binding activity, thus reducing inflammatory cytokine levels. These results suggest a potential application for dexmedetomidine as an adjuvant in peripheral nerve anesthesia. Future research should focus on finding clinical evidence to support the use of dexmedetomidine as an anti-inflammatory adjuvant for perineural administration in humans.
Acknowledgments
This work was supported by grants from National Natural Science Foundation of China (No. 81272083).
Conflicts of Interest
The authors declare no conflict of interest.
References
1. Niu, X.Y.; Ding, X.B.; Guo, T.; Chen, M.H.; Fu, S.K.; Li, Q. Effects of intravenous and intrathecal dexmedetomidine in spinal anesthesia: A meta-analysis. CNS Neurosci. Ther. 2013, 19, 897–904.
2. Friesen, R.H.; Nichols, C.S.; Twite, M.D.; Cardwell, K.A.; Pan, Z.; Pietra, B.; Miyamoto, S.D.; Auerbach, S.R.; Darst, J.R.; Ivy, D.D. The hemodynamic response to dexmedetomidine loading dose in children with and without pulmonary hypertension. Anesth. Analg. 2013, 117, 953–959.
3. Obayah, G.M.; Refaie, A.; Aboushanab, O.; Ibraheem, N.; Abdelazees, M. Addition of dexmedetomidine to bupivacaine for greater palatine nerve block prolongs postoperative analgesia after cleft palate repair. Eur. J. Anaesthesiol. 2010, 27, 280–284.
4. Tasdogan, M.; Memis, D.; Sut, N.; Yuksel, M. Results of a pilot study on the effects of propofol and dexmedetomidine on inflammatory responses and intraabdominal pressure in severe sepsis. J. Clin. Anesth. 2009, 21, 394–400.
5. Xianbao, L.; Hong, Z.; Xu, Z.; Chunfang, Z.; Dunjin, C. Dexmedetomidine reduced cytokine release during postpartum bleeding-induced multiple organ dysfunction syndrome in rats. Mediat. Inflamm. 2013, 2013, 627831.
6. Tüfek, A.; Kaya, S.; Tokgöz, O.; Firat, U.; Evliyaoğlu, O.; Çelik, F.; Karaman, H. The protective effect of dexmedetomidine on bupivacaine-induced sciatic nerve inflammation is mediated by mast cells. Clin. Investig. Med. 2013, 36, E95–E102.
7. Zhang, L.; Zhang, J.; Yang, L.; Dong, Y.; Zhang, Y.; Xie, Z. Isoflurane and sevoflurane increase interleukin-6 levels through the nuclear factor-kappa B pathway in neuroglioma cells. Br. J. Anaesth. 2013, 110, i82–i91.
8. Kim, K.S.; Oh da, H.; Choi, H.M.; Bang, J.S.; Ryu, C.J.; Kim, J.H.; Yoo, M.C.; Yang, H.I. Pyrrolidine dithiocarbamate, a NF-kappaB inhibitor, upregulates MMP-1 and MMP-13 in IL-1beta-stimulated rheumatoid arthritis fibroblast-like synoviocytes. Eur. J. Pharmacol. 2009, 613, 167–175.

139
9. Snyder, J.G.; Prewitt, R.; Campsen, J.; Britt, L.D. PDTC and Mg132, inhibitors of NF-kappaB, block endotoxin induced vasodilation of isolated rat skeletal muscle arterioles. Shock 2002, 17, 304–307.
10. He, H.J.; Zhu, T.N.; Xie, Y.; Fan, J.; Kole, S.; Saxena, S.; Bernier, M. Pyrrolidine dithiocarbamate inhibits interleukin-6 signaling through impaired STAT3 activation and association with transcriptional coactivators in hepatocytes. J. Biol. Chem. 2006, 281, 31369–31379.
11. McClure, J.H. Ropivacaine. Br. J. Anaesth. 1996, 76, 300–307. 12. Casati, A.; Fanelli, G.; Albertin, A.; Deni, F.; Anelati, D.; Antonino, F.A.; Beccaria, P.
Interscalene brachial plexus anesthesia with either 0.5% ropivacaine or 0.5% bupivacaine. Minerva Anestesiol. 2000, 66, 39–44.
13. Casati, A.; Fanelli, G.; Aldegheri, G.; Berti, M.; Colnaghi, E.; Cedrati, V.; Torri, G. Interscalene brachial plexus anaesthesia with 0.5%, 0.75% or 1% ropivacaine: A double-blind comparison with 2% mepivacaine. Br. J. Anaesth. 1999, 83, 872–875.
14. Brummett, C.M.; Amodeo, F.S.; Janda, A.M.; Padda, A.K.; Lydic, R. Perineural dexmedetomidine provides an increased duration of analgesia to a thermal stimulus when compared with a systemic control in a rat sciatic nerve block. Reg. Anesth. Pain Med. 2010, 35, 427–431.
15. Brummett, C.M.; Norat, M.A.; Palmisano, J.M.; Lydic, R. Perineural administration of dexmedetomidine in combination with bupivacaine enhances sensory and motor blockade in sciatic nerve block without inducing neurotoxicity in rat. Anesthesiology 2008, 109, 502–511.
16. Brummett, C.M.; Padda, A.K.; Amodeo, F.S.; Welch, K.B.; Lydic, R. Perineural dexmedetomidine added to ropivacaine causes a dose-dependent increase in the duration of thermal antinociception in sciatic nerve block in rat. Anesthesiology 2009, 111, 1111–1119.
17. Esmaoglu, A.; Yegenoglu, F.; Akin, A.; Turk, C.Y. Dexmedetomidine added to levobupivacaine prolongs axillary brachial plexus block. Anesth. Analg. 2010, 111, 1548–1551.
18. Ramsay, M.A.; Luterman, D.L. Dexmedetomidine as a total intravenous anesthetic agent. Anesthesiology 2004, 101, 787–790.
19. Martin, E.; Ramsay, G.; Mantz, J.; Sum-Ping, S.T. The role of the alpha2- adrenoceptor agonist dexmedetomidine in postsurgical sedation in the intensive care unit. J. Intensiv. Care Med. 2003, 18, 29–41.
20. Ramsay, M.A.; Saha, D.; Hebeler, R.F. Tracheal resection in the morbidly obese patient: The role of dexmedetomidine. J. Clin. Anesth. 2006, 18, 452–454.
21. Venn, R.M.; Grounds, R.M. Comparison between dexmedetomidine and propofol for sedation in the intensive care unit: Patient and clinician perceptions. Br. J. Anaesth. 2001, 87, 684–690.
22. Marhofer, D.; Kettner, S.C.; Marhofer, P.; Pils, S.; Weber, M.; Zeitlinger, M. Dexmedetomidine as an adjuvant to ropivacaine prolongs peripheral nerve block: A volunteer study. Br. J. Anaesth. 2013, 110, 438–442.

140
Inhibitory Effects of Palmultang on Inflammatory Mediator
Production Related to Suppression of NF-κB and MAPK
Pathways and Induction of HO-1 Expression in Macrophages
You-Chang Oh, Yun Hee Jeong, Won-Kyung Cho, Min-Jung Gu and Jin Yeul Ma
Abstract: Palmultang (PM) is an herbal decoction that has been used to treat anorexia, anemia, general prostration, and weakness due to chronic illness since medieval times in Korea, China, and Japan. The present study focused on the inhibitory effects of PM on the production of inflammatory factors and on the activation of mechanisms in murine macrophages. PM suppressed the expression of nitric oxide (NO), inflammatory cytokines and inflammatory proteins by inhibiting nuclear factor (NF)-κB and mitogen-activated protein kinase (MAPK) signaling pathways and by inducing heme oxygenase (HO)-1 expression. Collectively, our results explain the anti-inflammatory effect and inhibitory mechanism of PM in macrophages stimulated with lipopolysaccharide (LPS).
Reprinted from Int. J. Mol. Sci. Cite as: Oh, Y.-C.; Jeong, Y.H.; Cho, W.-K.; Gu, M.-J.; Ma, J.Y. Inhibitory Effects of Palmultang on Inflammatory Mediator Production Related to Suppression of NF-κB and MAPK Pathways and Induction of HO-1 Expression in Macrophages. Int. J. Mol. Sci. 2014, 15, 8443-8457.
1. Introduction
Palmultang (PM) is a traditional herbal medication that has been used since medieval times in East Asia. Currently, PM is usually prescribed as an herbal medicine for the treatment of various symptoms associated with body weakness. Previous studies demonstrated that PM was an effective treatment for endometriosis [1]. In addition, a recent study revealed that PM has a beneficial effect on reproductive function in female mice [2]. However, the effects of PM on inflammation and inflammatory mechanisms still remain unknown.
Macrophages play a key role in the regulation of inflammatory and immune responses [3,4]. Activation of macrophages is induced by LPS stimulation, and activated macrophages secrete inflammatory factors, such as NO, prostaglandin (PG)E2 and inflammatory cytokines [5,6]. NO and PGE2 are synthesized by inducible nitric oxide synthase (iNOS) and cyclooxygenase (COX)-2, respectively, and the expression of iNOS is closely related to the induction of HO-1. HO-1 is a stress-inducible protein that catalyzes the oxidative degradation of heme; two other heme oxygenase isoforms, HO-2 and HO-3, have also been identified [7]. Enhancing the production of HO-1 reduces the expression of iNOS and the level of free radicals [8].
NF-κB plays an important role in the expression of inflammatory genes. When unstimulated, NF-κB is present in the cytoplasm attached to IκBα; NF-κB is released through degradation of IκBα when induced by LPS [9]. Activated NF-κB can be transferred from the cytoplasm to the nucleus, where it binds to promoters and induces the expression of various inflammatory genes [10,11]. MAPK signaling pathways play an important role in transmitting inflammatory signals [12] and comprise extracellular signal-regulated kinase (ERK), p38, and c-Jun NH2-terminal kinase (JNK)

141
pathways. MAPKs are activated by phosphorylation and induce activation of the NF-κB pathway and expression of the iNOS gene.
In the present study, we evaluated the suppressive effect of PM on inflammation induced by LPS in RAW 264.7 macrophages. Further, we researched whether the effects of PM on NF-κB and MAPK signaling pathways and on induction of HO-1 explain the anti-inflammatory mechanism of PM.
2. Results and Discussion
2.1. PM Did not Show Cytotoxicity and Had Inhibitory Activity against NO and Inflammatory Cytokine Production in Macrophages
In the present study, we demonstrated anti-inflammatory activity of PM in murine macrophages stimulated with LPS. First, we investigated the cytotoxicity of PM in RAW 264.7 macrophages at concentrations of 10–1000 μg/mL. As shown in Figure 1A, PM did not show cytotoxicity at concentrations up to 1000 μg/mL, indicating that it is not toxic to macrophages. Based on this result, we did experiments using up to 1000 μg/mL concentrations of PM.
The overproduction of NO is associated with various inflammatory diseases [13,14], so we preferentially investigated the inhibitory effect of PM on the production of NO induced by LPS stimulation. As shown in Figure 1B, the positive control, dexamethasone, which is known to be an anti-inflammatory drug, exerted a strong inhibitory effect on NO production. In addition, we discovered that PM dose-dependently repressed NO secretion to a statistically significant degree. Notably, PM inhibited NO production by more than 70% at a concentration of 500 μg/mL.
Further, we examined the inhibitory effect of PM on the production of the pro-inflammatory cytokines tumor necrosis factor (TNF)-α, interleukin (IL)-6 and IL-1β. Cytokine expression was analyzed by ELISA and RT-PCR. PM did not inhibit TNF-α secretion (Figure 1C) and did not suppress the expression of TNF-α mRNA (Figure 1F). By contrast, PM effectively inhibited both IL-6 production and mRNA expression in a dose-dependent fashion (Figure 1D,F). Likewise, PM strongly suppressed IL-1β cytokine and mRNA production at high concentrations (Figure 1E,F).
2.2. PM Strongly Suppresses Expression of iNOS but not COX-2 in LPS-Stimulated Macrophages and Induces HO-1 Induction
Because COX-2 and iNOS are enzymes for PGE2 and NO synthesis, respectively, we further investigated the inhibitory effects of PM on COX-2 and iNOS expression using Western blots and RT-PCR. As shown in Figure 2A, PM did not affect expression of COX-2 at the protein or mRNA level. By contrast, PM showed a strong dose-dependent inhibitory effect on iNOS expression that was statistically significant (Figure 2B). The inhibitory effect of PM on iNOS production was believed to contribute to the suppression of NO secretion. These results indicate that PM has inhibitory activity against the production of pro-inflammatory mediators.

142
Figure 1. (A) The cytotoxicity of PM in RAW 264.7 cells. And the suppressive effect of PM on (B) NO production and (C–F) TNF-α, IL-6 and IL-1β expression induced by LPS stimulation in macrophages. RAW 264.7 cells were pretreated with PM for 30 min before incubation with LPS for (A–E) 24 h or (F) 6 h. (A) Cytotoxicity was determined using CCK; (B) The culture supernatant was analyzed for nitrite production; (C–E) Production of cytokines was measured by ELISA and (F) mRNA levels were analyzed by RT-PCR. RNA values were quantitated using the i-MAX™ Gel Image Analysis System (Core Bio, Seoul, Korea). As a control, cells were incubated with vehicle alone. * p < 0.01 and ** p < 0.001 were calculated via comparisons with the LPS-stimulation value.
Increased HO-1 induction has a direct effect on iNOS expression [8]. Therefore, we investigated whether the inhibitory effect of PM on iNOS expression was associated with increased HO-1 production. We assessed HO-1 induction in PM-treated macrophages using Western blot and RT-PCR analyses. First, we measured the induction of HO-1 at 3–24 h after treatment with 1000 μg/mL PM. Protein and mRNA levels of HO-1 were highest at 6 and 3 h, respectively (Figure 2C). Based on the results in Figure 2C, we investigated HO-1 protein and mRNA expression at the indicated time points. PM induced HO-1 expression at the protein and mRNA levels at concentrations of 500 and 1000 μg/mL in a dose-dependent manner (Figure 2D). These results suggest that pretreatment with PM inhibits NO and iNOS production by increasing HO-1 induction.

143
Figure 2. Inhibitory effect of PM on expression of (A) COX-2 and (B) iNOS. And the inductive effect of PM on (C,D) HO-1 in macrophages. Cells were treated with (A,B) LPS alone or LPS plus PM for 24 h and (C,D) with PM alone for the indicated time periods. Protein levels were determined by Western blot analysis, as described in the Materials and Methods, and quantitated using the Davinch-chemi™ CAS-400SM Chemiluminescence Imaging System (Core Bio, Seoul, Korea). Expression of mRNA was analyzed by RT-PCR. * p < 0.01 and ** p < 0.001 were calculated via comparisons with the (A,B) LPS-stimulation value or (D) vehicle alone.
2.3. PM Inhibited NF-κB Pathway Activation via Blockade of IκBα Degradation in Macrophages upon LPS Stimulation
We demonstrated a repressive effect of PM on secretion of the inflammatory cytokine IL-6. NF-κB is a key transcriptional factor associated with the cellular response to stimuli, such as LPS [15–17] and with the production of NO, PGE2, inflammatory cytokines, and iNOS [18–20]. To investigate whether the inhibitory effect of PM on the expression of inflammatory mediators is associated with activity of the NF-κB pathway, we measured the effect of PM on NF-κB activation by analyzing translocation of p65 to the nucleus and the phosphorylation of IκBα. Western blot analysis showed that PM significantly repressed translocation of p65 to the nucleus at a concentration of 100 μg/mL or greater (Figure 3A). In addition, the phosphorylation level of IκBα was depressed dose-dependently after PM treatment (Figure 3B). Thus, PM inhibited the nuclear transcription of p65 by dose-dependently inhibiting IκBα degradation induced by LPS stimulation.

144
These findings are consistent with previous studies showing that an NF-κB response drives the expression of the iNOS and IL-6 genes [21–23].
Figure 3. Inhibitory effects of PM on (A) translocation of NF-κB to the nucleus and (B) phosphorylation of IκBα. Cells were treated with LPS alone or with LPS and PM for 30 min (IκBα) or 1 h (NF-κB). Proteins in the cytosol or nucleus were analyzed by Western blotting. **p < 0.001 were calculated via comparisons with the LPS-stimulation value.
2.4. PM Suppressed LPS-Induced Phosphorylation of MAPKs in RAW 264.7 Cells
Because MAPKs activated by phosphorylation upon LPS stimulation are related to iNOS expression and NF-κB pathway activation in macrophages [24], we examined the inhibitory effect of PM on the phosphorylation of MAPKs. We assessed the phosphorylation levels of MAPKs, including ERK 1/2, p38 and JNK. When RAW 264.7 cells were stimulated with LPS after pretreatment with PM, the levels of phosphorylated ERK and JNK MAPK were significantly decreased with no change in non-phosphorylated MAPK levels (Figure 4A,C). By contrast, PM showed only a slight inhibitory effect on p38 phosphorylation (Figure 4B). These results indicate that the

145
inhibitory effect of PM on the phosphorylation of MAPKs is directly related to inhibition of NF-κB activation and reduced production of inflammatory factors in RAW 264.7 cells.
Figure 4. Inhibitory effect of PM on the phosphorylation of (A) ERK; (B) p38 and (C) JNK MAPK in macrophages. RAW 264.7 cells were treated with PM for 30 min and then incubated with LPS for 30 min. Cell lysates were analyzed by Western blotting using specific antibodies. ** p < 0.001 were calculated via comparisons with the LPS-stimulation value.
2.5. HPLC Analysis and Previous Reports on the Main Constituents of PM
HPLC-diode array detector (DAD) analysis conditions were successfully established for the separation of peaks in PM extracts. The retention times of eight peaks were as follows: 5-hydroxymethylfurfural (5-HMF), 10.30 min; paeoniflorin, 27.22 min; albiflorin, 30.28 min; ferulic acid, 35.20 min; nodakenin, 36.76 min; decursinol, 43.86 min; glycyrrhizin, 48.69 min; and decursin, 60.93 min. Figure 5 shows chromatograms of the reference components and of a 60% methanol extract of PM, with detection of eluents at 205 nm (for decursinol), 250 nm (for 5-HMF, albiflorin, ferulic acid, nodakenin, glycyrrhizin, and decursin), 330 nm (for paeoniflorin), with ultraviolet rays (UV) wavelengths selected according to the results of Figure 6. These compounds were identified by comparing the retention time and DAD spectra with those of authentic standard compounds. Peak purity checking and identification were conducted using a 190–400 nm UV scan with a DAD.

146
Figure 5. HPLC chromatograms of (A) a standard mixture and (B) PM at 250 nm. 1, 5-HMF, 10.30 min; 2, paeoniflorin, 27.22 min; 3, albiflorin, 30.28 min; 4, ferulic acid, 35.20 min; 5, nodakenin, 36.76 min; 6, decursinol, 43.86 min; 7, glycyrrhizin, 48.69 min; and 8, decursin, 60.93 min.
Figure 6. Chemical structures and HPLC DAD spectra of the main constituents of PM.
Calibration curves were obtained using standard solutions containing 1.25–10,000 μg/mL for 5-HMF, ferulic acid, nodakenin, decursinol, glycyrrhizin, and decursin, 20–20,000 μg/mL for peaoniflorin and albiflorin as marker components. Calibration curve showed good linearity (r2 > 0.9990). The limits of detection (LOD) and limits of quantification (LOQ) were 0.16–0.50 μg/mL for 5-HMF, 0.22–0.68 μg/mL for ferulic acid, 0.13–0.40 μg/mL for nodakenin, 0.10–0.29 μg/mL for decursinol, 0.63–0.19 μg/mL for glycyrrhizin and 0.45–0.12 μg/mL for decursin, 48.17–16.05

147
μg/mL for peaoniflorin, 3.30–10.00 μg/mL for albiflorin (Table 1). The amounts of compounds 1–8 (5-HMF, peaoniflorin, albiflorin, ferulic acid, nodakenin, decursinol, glycyrrhizin, and decursin, respectively) were 11.09, 2.59, 2.30, 3.36, 8.23, 5.11, 0.36, and 1.17 mg/g, respectively. The analytical results for each component identified are summarized in Table 2.
Table 1. Linearity, correlation coefficient, limits of detection (LOD), and limits of quantification (LOQ) of the marker compound (n = 3).
Compound Linear Range
(μg/mL) Regression Equation
a
Correlation
Coefficient (r2)
LOD b
(μg/mL)
LOQ c
(μg/mL)
5-HMF 1.25–10,000 y = 403917x − 87212 0.9993 0.16 0.50 Ferulic acid 1.25–10,000 y = 273782x + 89791 0.9998 0.23 0.68 Nodakenin 1.25–10,000 y = 239585x − 25958 1.0000 0.13 0.40 Decursinol 1.25–10,000 y = 598246x + 235041 0.9996 0.10 0.29
Glycyrrhizin 1.25–10,000 y = 43887x + 38994 0.9991 0.63 0.19 Decursin 1.25–20,000 y = 116410x + 1188529 1.0000 0.45 0.12
Peaoniflorin 20–20,000 y = 1871.8x + 16715 0.9990 16.05 48.17 Albiflorin 20–20,000 y = 8026.8x + 6805.9 0.9993 3.33 10.00
a y = peak area (mAU) of the components, x = concentration (μg·mL−1) of the components; b LOD = 3× signal-to-noise (S/S) ratio; c LOQ = 10× signal-to-noise (S/S) ratio.
Table 2. Content of the eight marker compounds of Palmultang (n = 3).
Compound Content (mg/g)
Mean SD RSD (%)
5-HMF 11.09 0.35 3.11 Ferulic acid 2.59 0.00 0.15 Nodakenin 2.30 0.00 0.02 Decursinol 3.36 0.02 0.72
Glycyrrhizin 8.23 0.01 0.13 Decursin 5.11 0.00 0.01
Peaoniflorin 0.36 0.00 0.34 Albiflorin 1.17 0.03 2.41
A previous study reported that 5-HMF prevents TNF-α-induced monocytic cell adhesion to human umbilical vein endothelial cells (HUVECs) by suppression of vascular cell adhesion molecule-1 expression, reactive oxygen species generation and NF-κB activation [25]. Additionally, it was demonstrated that paeoniflorin suppresses TNF-α-induced chemokine production in human dermal microvascular endothelial cells by blocking NF-κB and ERK pathways [26]. Another recent study demonstrated that nodakenin exerts a suppressive effect on LPS-induced inflammatory responses in macrophages by inhibiting TNF receptor-associated factor 6 and NF-κB pathways, and it protects mice from lethal endotoxin shock [27]. A further recent study showed that glycyrrhizin inhibits NO and PGE2 production in a bimodal fashion [28]. Another study demonstrated that decursin inhibits induction of inflammatory mediators by blocking NF-κB activation in macrophages [29]. These facts suggest that the anti-inflammatory activity of PM might be related to active components of PM, including 5-HMF, paeoniflorin, nodakenin, glycyrrhizin, and decursin.
148
3. Experimental Section
3.1. Materials and Reagents
Products related to cell culture (RPMI 1640, fetal bovine serum (FBS) and antibiotics) were purchased from Lonza (Basel, Switzerland). LPS and bovine serum albumin (BSA) were obtained from Sigma (St. Louis, MO, USA). The Cell-Counting Kit (CCK) was obtained from Dojindo Molecular Technologies, Inc. (Kumamoto, Japan). Various primary and secondary antibodies for Western blot analysis were purchased from Cell Signaling Technology, Inc. (Boston, MA, USA). Enzyme-linked immunosorbent assay (ELISA) antibody sets for cytokine detection were obtained from eBioscience (San Diego, CA, USA). An RNA extraction kit was purchased from iNtRON (Sungnam, Korea). DNA synthesizing kits and oligonucleotide primers were obtained from Bioneer (Daejeon, Korea). 5-(Hydroxy-methyl)furfural (5-HMF) and ferulic acid were purchased from Sigma (St. Louis, MO, USA). Paeoniflorin and glycyrrhizin were purchased from Tokyo Chemical Industry Co., Ltd. (Tokyo, Japan). Decursinol was purchased from Elcom Science (Seoul, Korea), nodakenin from Chem Faces (Wuhan, China), albiflorin from Wako (Osaka, Japan), and decursin from the Ministry of Food and Drug Safety (Osong, Korea). The purity of all representative standards was confirmed by high-performance liquid chromatography (HPLC) to be higher than 97%. HPLC grade solutions, acetonitrile and trifluoroacetic acid were purchased from J. T. Baker Inc. (Philipsburg, NJ, USA). Distilled water (DW) was filtered through a 0.45 μm membrane filter from ADVANTEC (Tokyo, Japan) before analysis.
3.2. Preparation of PM Extract
PM is composed of eight medicinal herbs listed in Table 3. All herbs were purchased from Yeongcheon Herbal Market (Yeongcheon, Korea). All voucher specimens were deposited in an herbal tank, placed in 19,200 mL of DW and then extracted by heating for 3 h at 115 °C and under high pressure (Gyeongseo Extractor Cosmos-600, Inchon, Korea). After extraction, the solution was filtered using standard testing sieves (150 μm) (Retsch, Haan, Germany), freeze-dried and kept in desiccators at 4 °C before use. The acquisition was 591 g and the yield was 30.8%. The freeze-dried extract powder was then dissolved in DW, centrifuged at 14,000 rpm for 10 min and supernatant was filtered (pore size, 0.2 μm) and kept at 4 °C prior to use.
Table 3. Herbal components and amount of Palmultang (PM) decoction.
Herbs Amount of Herbs (g)
Ginseng Radix 240 Atractylodes Rhizome White 240
Poria 240 Glycyrrhizae Radix et Rhizoma 240
Angelica Gigas Root 240 Prepared Rehmannia Root 240
Peony Root 240 Cinidium Rhizome 240
Total weight 1920

149
3.3. Cell Culture and Drug Treatment
RAW 264.7 cells were obtained from the Korea Cell Line Bank (Seoul, Korea) and grown in complete RPMI 1640 medium. The cells were incubated in a humidified 5% CO2 atmosphere at 37 °C. To stimulate the cells, the medium was replaced with fresh RPMI 1640 medium, and LPS (200 ng/mL) was added in the presence or absence of various concentrations of PM (10, 100, 500, and 1000 μg/mL) for the indicated time periods.
3.4. Cell Viability Assay
PM was added to the cells, which were incubated for 24 h at 37 °C in 5% CO2. CCK solutions were added to each well, and the cells were incubated for an additional 1 h. The optical density was then read at 450 nm using an ELISA reader (Infinite M200, Tecan, Männedorf, Switzerland).
3.5. Determination of NO, TNF-α, IL-6 and IL-1β Cytokine Production
The cells were pretreated with PM and stimulated with LPS for 24 h. NO production was analyzed by measuring nitrite using Griess reagent (1% sulfanilamide, 0.1% naphthylethylenediamine dihydrochloride, 2.5% phosphoric acid) according to a previous study [30]. Secretion of the inflammatory cytokines TNF-α, IL-6 and IL-1β was analyzed using a mouse ELISA antibody set (eBioscience, San Diego, CA, USA). The inhibitory effects of PM were determined at 570 and 450 nm for NO and cytokines, respectively, using an ELISA reader.
3.6. Preparation of Whole-Cell, Cytosolic and Nuclear Fractions and Western Blot Analysis
The expression of various proteins was analyzed by Western blot analysis according to standard procedures. Cells were stimulated with LPS with or without PM for the indicated time periods at 37 °C. After incubation, the cells were harvested and resuspended in radio immunoprecipitation assay (RIPA) lysis buffer (Millipore, Bedford, MA, USA) containing protease and phosphatase inhibitor cocktail (Roche, Basel, Switzerland) to obtain whole-cell lysates. Cytosolic and nuclear fractions were isolated using NE-PER Nuclear and Cytoplasmic Extraction Reagents (Thermo Scientific, Rockford, IL, USA) according to the procedure described by the manufacturer. After cell debris was removed by centrifugation, the concentration of protein was determined by Bradford’s method, and equal amounts of protein were separated by sodium dodecyl sulfate-polyacrylamide gel electrophoresis (SDS-PAGE). The proteins were transferred onto a nitrocellulose membrane (Millipore, Bedford, MA, USA) and blocked with 3% BSA in Tris-buffered saline containing 0.1% Tween 20 (TBS-T). The membrane was then incubated with each primary antibody at 4 °C overnight, followed by incubation with HRP-conjugated secondary antibodies. The specific proteins were detected using SuperSignal West Femto Chemiluminescent Substrate (Thermo Scientific, Rockford, IL, USA).
3.7. RNA Extraction and Reverse Transcription-Polymerase Chain Reaction (RT-PCR)
Total RNA was isolated using an easy-BLUE™ RNA extraction kit (iNtRON, Daejeon, Korea) according to the procedure described by the manufacturer. cDNA was synthesized using

150
AccuPower® CycleScript RT PreMix (Bioneer, Daejeon, Korea). The sequences of specific primers used for amplification by polymerase chain reaction are shown in Table 4. The following PCR conditions were applied for TNF-α, IL-6, IL-1β, COX-2, iNOS, HO-1, and β-actin: 35 cycles of denaturation at 94 °C for 30 s, annealing at the temperature indicated in Table 4 for 30 s, and extension at 72 °C for 30 s [30–34].
Table 4. Primer sequences and annealing temperatures used for RT-PCR analysis.
Target Gene Primer Sequence Annealing Temp
TNF-α F: 5'-AGCACAGAAAGCATGATCCG-3'
55 °C R: 5'-GTTTGCTACGACGTGGGCTA-3'
IL-6 F: 5'-CATGTTCTCTGGGAAATCGTGG-3'
58 °C R: 5'-AACGCACTAGGTTTGCCGAGTA-3'
IL-1β F: 5'-TGCAGAGTTCCCCAACTGGTACATC-3'
64 °C R: 5'-GTGCTGCCTAATGTCCCCTTGAATC-3'
COX-2 F: 5'-CACTCAGTTTGTTGAGTCATTC-3'
45 °C R: 5'-GATTAGTACTGTAGGGTTAATG-3'
iNOS F: 5'-AGCCCAACAATACAAATGACCCTA-3'
56 °C R: 5'-TTCCTGTTGTTTCTATTTCCTTTGT-3'
HO-1 F: 5'-TGAAGGAGGCCACCAAGGAGG-3'
62 °C R: 5'-AGAGGTCACCCAGGTAGCGGG-3'
β-actin F: 5'-ATGAAGATCCTGACCGAGCGT-3'
58 °C R: 5'-AACGCAGCTCAGTAACAGTCCG-3'
F, forward; R, reverse.
3.8. Preparation of Standard Solutions and Samples
An aqua 60% methanol standard stock solution containing compounds 5-HMF, ferulic acid, nodakenin, glycyrrhizin, decursinol, peaoniflorin, albiflorin, and decursin (each 1 mg/mL) were prepared and stored below −4 °C. Working standard solutions were prepared by serial dilution of stock solution with aqua 60% methanol. All calibration curves were obtains from assessement of peak areas of standards in the concentration ranges. A sample of 10 mg PM extract was prepared in 1 mL DW, extracted by ultra-sonication, and filtered through a 0.2 μm syringe membrane filter from Whatman Ltd. (Maidstone, UK) before injection into the HPLC system for analysis. Sample solutions were stored at −4 °C in a refrigerator before analysis.
3.9. General Experimental Procedures
Analytical HPLC data were obtained using an L-2130 pump, L-2200 auto-sampler, L-2300 column oven and L-2455 UV/VIS DAD. The output signal of the detector was recorded using EZChrom Elite software for the HPLC system (Hitachi, Tokyo, Japan). The OptimaPak C18 analytical HPLC column (4.6 × 250 mm, 5 μm; RS Tech Co., Daejeon, Korea) was used in this study.

151
3.10. Analytical Chromatographic Conditions
The mobile phase consisted of water containing (A) 0.1% trifluoroacetic acid and (B) acetonitrile with gradient elution at a flow rate of 1.0 mL/min. The sample injection volume was 20 μL, and the flow rate of the mobile phase was 1.0 mL/min (Table 5). The column temperature was maintained at 40 °C, and the wavelengths of the UV detector were set at 205, 250, and 330 nm.
Table 5. HPLC conditions used for the analysis of PM.
Item Condition
Mobile phase
Time (min)
Water (Containing 0.1% TFA)
Acetonitrile
0 5 95 5 5 95
15 15 85 25 15 85 50 65 35 60 65 35
Flow rate 1.0 mL/min Inject volume 20 μL
Column OptimaPak C18 (4.6 × 250 mm, 5 μm, RS tech Co., Daejeon, Korea) Column temperature 40 °C
UV wavelength 205, 250 and 330 nm
3.11. Statistical Analysis
The results are expressed as mean ± SE values. Statistical significance for each treated group compared with the negative control was determined using the Student’s t test. Each experiment was repeated at least three times to yield comparable results. p values of <0.01 and <0.001 were considered significant.
4. Conclusions
In conclusion, PM shows significant inhibitory effects on the secretion of NO and expression of IL-6, IL-1β and iNOS in LPS-stimulated RAW 264.7 cells. These effects are due to inhibition of NF-κB activation through suppression of IκBα degradation and blockade of MAPK phosphorylation. Furthermore, the induction of HO-1 by PM inhibits inflammatory factor production. These results show that PM could be developed as a new anti-inflammatory agent derived from natural products.
Acknowledgments
This work was supported by the grant K14050 awarded to Korea Institute of Oriental Medicine (KIOM) from Ministry of Education, Science and Technology (MEST), Korea.

152
Conflicts of Interest
The authors declare no conflict of interest.
References
1. Lee, M.J.; Lim, E.M.; Kwon, K.R. Effect of Paljin-tang on Surgically Induced Endometriosis in Rats. J. Orient. Obstet. Gynecol. 2006, 19, 83–94.
2. Joo, J.M.; Kim, D.C.; Back, S.H.; Kim, E.H. The Effect of Palmultang on the Ovarian Functions and Differential Gene Expression of Caspase-3, MAPK and MPG in Female Mice. J. Orient. Obstet. Gynecol. 2007, 20, 91–110.
3. Pierce, G.F. Macrophages: Important physiologic and pathologic sources of polypeptide growth factors. Am. J. Respir. Cell Mol. Biol. 1990, 2, 233–234.
4. Wadleigh, D.J.; Reddy, S.T.; Kopp, E.; Ghosh, S.; Herschman, H.R. Transcriptional activation of the cyclooxygenase-2 gene in endotoxin-treated RAW 264.7 macrophages. J. Biol. Chem. 2000, 275, 6259–6266.
5. Becker, S.; Mundandhara, S.; Devlin, R.B.; Madden, M. Regulation of cytokine production in human alveolar macrophages and airway epithelial cells in response to ambient air pollution particles: Further mechanistic studies. Toxicol. Appl. Pharmacol. 2005, 207, 269–275.
6. Kim, J.B.; Han, A.R.; Park, E.Y.; Kim, J.Y.; Cho, W.; Lee, J.; Seo, E.K.; Lee, K.T. Inhibition of LPS-induced iNOS, COX-2 and cytokines expression by poncirin through the NF-kappaB inactivation in RAW 264.7 macrophage cells. Biol. Pharm. Bull. 2007, 30, 2345–2351.
7. Pae, H.O.; Chung, H.T. Heme oxygenase-1: Its therapeutic roles in inflammatory diseases. Immune Netw. 2009, 9, 12–19.
8. Ashino, T.; Yamanaka, R.; Yamamoto, M.; Shimokawa, H.; Sekikawa, K.; Iwakura, Y.; Shioda, S.; Numazawa, S.; Yoshida, T. Negative feedback regulation of lipopolysaccharide-induced inducible nitric oxide synthase gene expression by heme oxygenase-1 induction in macrophages. Mol. Immunol. 2008, 45, 2106–2115.
9. De Martin, R.; Vanhove, B.; Cheng, Q.; Hofer, E.; Csizmadia, V.; Winkler, H.; Bach, F.H. Cytokine-inducible expression in endothelial cells of an I kappa B alpha-like gene is regulated by NF kappa B. EMBO J. 1993, 12, 2773–2779.
10. Pahl, H.L. Activators and target genes of Rel/NF-kappaB transcription factors. Oncogene 1999, 18, 6853–6866.
11. Baeuerle, P.A.; Baltimore, D. NF-kappa B: Ten years after. Cell 1996, 87, 13–20. 12. Robinson, M.J.; Cobb, M.H. Mitogen-activated protein kinase pathways. Curr. Opin. Cell Biol.
1997, 9, 180–186. 13. Guzik, T.J.; Korbut, R.; Adamek-Guzik, T. Nitric oxide and superoxide in inflammation and
immune regulation. J. Physiol. Pharmacol. 2003, 54, 469–487. 14. Southan, G.J.; Szabo, C. Selective pharmacological inhibition of distinct nitric oxide synthase
isoforms. Biochem. Pharmacol. 1996, 51, 383–394. 15. Brasier, A.R. The NF-kappaB regulatory network. Cardiovasc. Toxicol. 2006, 6, 111–130. 16. Gilmore, T.D. Introduction to NF-kappaB: Players, pathways, perspectives. Oncogene 2006,
25, 6680–6684.

153
17. Tian, B.; Brasier, A.R. Identification of a nuclear factor kappa B-dependent gene network. Recent Prog. Horm. Res. 2003, 58, 95–130.
18. Chen, F.; Kuhn, D.C.; Sun, S.C.; Gaydos, L.J.; Demers, L.M. Dependence and reversal of nitric oxide production on NF-kappa B in silica and lipopolysaccharide-induced macrophages. Biochem. Biophys. Res. Commun. 1995, 214, 839–846.
19. Roshak, A.K.; Jackson, J.R.; McGough, K.; Chabot-Fletcher, M.; Mochan, E.; Marshall, L.A. Manipulation of distinct NFkappaB proteins alters interleukin-1beta-induced human rheumatoid synovial fibroblast prostaglandin E2 formation. J. Biol. Chem. 1996, 271, 31496–31501.
20. Xie, W.; Merrill, J.R.; Bradshaw, W.S.; Simmons, D.L. Structural determination and promoter analysis of the chicken mitogen-inducible prostaglandin G/H synthase gene and genetic mapping of the murine homolog. Arch. Biochem. Biophys. 1993, 300, 247–252.
21. Ahn, K.S.; Noh, E.J.; Zhao, H.L.; Jung, S.H.; Kang, S.S.; Kim, Y.S. Inhibition of inducible nitric oxide synthase and cyclooxygenase II by Platycodon grandiflorum saponins via suppression of nuclear factor-kappaB activation in RAW 264.7 cells. Life Sci. 2005, 76, 2315–2328.
22. Barnes, P.J.; Karin, M. Nuclear factor-kappaB. A pivotal transcription factor in chronic inflammatory diseases. N. Engl. J. Med. 1997, 336, 1066–1071.
23. Kim, Y.M.; Lee, B.S.; Yi, K.Y.; Paik, S.G. Upstream NF-kappaB site is required for the maximal expression of mouse inducible nitric oxide synthase gene in interferon-gamma plus lipopolysaccharide induced RAW 264.7 macrophages. Biochem. Pharmacol. 1997, 236, 655–660.
24. Caivano, M. Role of MAP kinase cascades in inducing arginine transporters and nitric oxide synthetase in RAW 264.7 macrophages. FEBS Lett. 1999, 429, 249–253.
25. Kim, H.K.; Choi, Y.W.; Lee, E.N.; Park, J.K.; Kim, S.G.; Park, D.J.; Kim, B.S.; Lim, Y.T.; Yoon, S. 5-Hydroxymethylfurfural from black garlic extract prevents TNFα-induced monocytic cell adhesion to HUVECs by suppression of vascular cell adhesion molecule-1 expression, reactive oxygen species generation and NF-κB activation. Phytother. Res. 2011, 25, 965–974.
26. Chen, T.; Guo, Z.P.; Jiao, X.Y.; Jia, R.Z.; Zhang, Y.H.; Li, J.Y.; Huang, X.L.; Liu, H.J. Peoniflorin suppresses tumor necrosis factor-α induced chemokine production in human dermal microvascular endothelial cells by blocking nuclear factor-κB and ERK pathway. Arch. Dermatol. Res. 2011, 303, 351–360.
27. Rim, H.K.; Cho, W.; Sung, S.H.; Lee, K.T. Nodakenin suppresses lipopolysaccharide-induced inflammatory responses in macrophage cells by inhibiting tumor necrosis factor receptor-associated factor 6 and nuclear factor-κB pathways and protects mice from lethal endotoxin shock. J. Pharmacol. Exp. Ther. 2012, 342, 654–664.
28. Kato, T.; Horie, N.; Hashimoto, K.; Satoh, K.; Shimoyama, T.; Kaneko, T.; Kusama, K.; Sakagami, H. Bimodal effect of glycyrrhizin on macrophage nitric oxide and prostaglandin E2 production. In Vivo 2008, 22, 583–586.
29. Kim, J.H.; Jeong, J.H.; Jeon, S.T.; Kim, H.; Ock, J.; Suk, K.; Kim, S.I.; Song, K.S.; Lee, W.H. Decursin inhibits induction of inflammatory mediators by blocking nuclear factor-kappaB activation in macrophages. Mol. Pharmacol. 2006, 69, 1783–1790.

154
30. Choi, H.J.; Kang, O.H.; Park, P.S.; Chae, H.S.; Oh, Y.C.; Lee, Y.S.; Choi, J.G.; Lee, G.H.; Kweon, O.H.; Kwon, D.Y. Mume Fructus water extract inhibits pro-inflammatory mediators in lipopolysaccharide-stimulated macrophages. J. Med. Food 2007, 10, 460–466.
31. Jo, H.Y.; Kim, Y.; Nam, S.Y.; Lee, B.J.; Kim, Y.B.; Yun, Y.W.; Ahn, B. The inhibitory effect of quercitrin gallate on iNOS expression induced by lipopolysaccharide in Balb/c mice. J. Vet. Sci. 2008, 9, 267–272.
32. Kim, H.Y.; Kim, J.K.; Choi, J.H.; Jung, J.Y.; Oh, W.Y.; Kim, D.C.; Lee, H.S.; Kim, Y.S.; Kang, S.S.; Lee, S.H.; et al. Hepatoprotective effect of pinoresinol on carbon tetrachloride-induced hepatic damage in mice. J. Pharmacol. Sci. 2010, 112, 105–112.
33. Srisook, K.; Palachot, M.; Mongkol, N.; Srisook, E.; Sarapusit, S. Anti-inflammatory effect of ethyl acetate extract from Cissus quadrangularis Linn may be involved with induction of heme oxygenase-1 and suppression of NF-κB activation. J. Ethnopharmacol. 2011, 133, 1008–1014.
34. Kwon, D.J.; Ju, S.M.; Youn, G.S.; Choi, S.Y.; Park, J. Suppression of iNOS and COX-2 expression by flavokawain A via blockade of NF-κB and AP-1 activation in RAW 264.7 macrophages. Food Chem. Toxicol. 2013, 58, 479–486.

155
Colonization and Infection of the Skin by S. aureus:
Immune System Evasion and the Response to Cationic
Antimicrobial Peptides
Sunhyo Ryu, Peter I. Song, Chang Ho Seo, Hyeonsook Cheong and Yoonkyung Park
Abstract: Staphylococcus aureus (S. aureus) is a widespread cutaneous pathogen responsible for the great majority of bacterial skin infections in humans. The incidence of skin infections by S. aureus reflects in part the competition between host cutaneous immune defenses and S. aureus virulence factors. As part of the innate immune system in the skin, cationic antimicrobial peptides (CAMPs) such as the β-defensins and cathelicidin contribute to host cutaneous defense, which prevents harmful microorganisms, like S. aureus, from crossing epithelial barriers. Conversely, S. aureus utilizes evasive mechanisms against host defenses to promote its colonization and infection of the skin. In this review, we focus on host-pathogen interactions during colonization and infection of the skin by S. aureus and methicillin-resistant Staphylococcus aureus (MRSA). We will discuss the peptides (defensins, cathelicidins, RNase7, dermcidin) and other mediators (toll-like receptor, IL-1 and IL-17) that comprise the host defense against S. aureus skin infection, as well as the various mechanisms by which S. aureus evades host defenses. It is anticipated that greater understanding of these mechanisms will enable development of more sustainable antimicrobial compounds and new therapeutic approaches to the treatment of S. aureus skin infection and colonization.
Reprinted from Int. J. Mol. Sci. Cite as: Ryu, S.; Song, P.I.; Seo, C.H.; Cheong, H.; Park, Y. Colonization and Infection of the Skin by S. aureus: Immune System Evasion and the Response to Cationic Antimicrobial Peptides. Int. J. Mol. Sci. 2014, 15, 8753-8772.
1. Introduction
Staphylococcus aureus (S. aureus) is a Gram-positive bacterium that can live as a commensal organism on the skin and in the nose and throat. Approximately 30% of healthy people are asymptomatically colonized by S. aureus, which permanently colonizes the anterior nares in 10%–20% of the population and intermittently colonizes 30%–50%; the rest of the population never becomes colonized [1,2]. Importantly, this colonization is a known risk factor for infection [3–7], and S. aureus causes a range of infections, from minor skin infections to abscesses, endocarditis and sepsis. S. aureus is also a major cause of food poising induced by heat resistant enterotoxin A and is a leading cause of nosocomial infections [2], as colonized healthcare workers can transmit the pathogen to immunosuppressed patients. In addition, several cases of community-acquired methicillin-resistant S. aureus (CA-MRSA) infections have been recently reported [8–10]. Notably, these reports describe severe and even lethal infections by highly virulent strains of S. aureus in immunocompetent individuals.
S. aureus is exposed to a large arsenal of highly efficient antimicrobial host factors during skin colonization and infection. However, a growing number of dedicated resistance mechanisms now contribute to the ability of S. aureus to evade host cutaneous defenses and survive during

156
colonization [11,12]. Furthermore, Glaser et al. recently reported that S. aureus small colony variants (SCVs) are less susceptible to the bactericidal activity of different human skin-derived AMP, which are associated with a higher resistance to the killing activity of human stratum corneum [13]. Both host cutaneous defense mechanisms and S. aureus virulence factors appear to be the focus of actively ongoing co-evolution, leading to major variations between different host species and bacterial strains, respectively [14,15]. Understanding how ones immune system combats the evasion strategies of S. aureus could be useful for the development of novel and more sustainable antimicrobial agents that are not subject to the evolution of microbial resistance.
While bacterial resistance to most available antibiotics is increasing and our knowledge about the arsenal of host cutaneous defense strategies is growing, it is becoming increasingly attractive to consider endogenous antimicrobial peptides (AMPs) as sources for more sustainable antimicrobial agents. Of the variety of host defense molecules expressed by organisms, cationic AMPs (CAMPs) have proven to be particularly promising for future development as new antimicrobials. This review focuses on the role of host CAMPs in staphylococcal skin infections, and on the mechanisms underlying S. aureus resistance to CAMPs.
2. Host-Pathogen Interactions during S. aureus Skin Colonization and Infection
The epidermis is composed of proliferating basal and differentiated suprabasal keratinocytes, within which sweat glands, sebaceous glands and hair follicles are sparsely distributed. Langerhans cells in the epidermis as well as dendritic cells, macrophages, mast cells, T and B cells, plasma cells and natural killer cells in the dermis participate in immune responses within the skin. As mentioned, approximately 30% of healthy individuals are colonized by S. aureus [16] through a process that reflects the competition between host factors and commensal organisms that resist colonization and S. aureus virulence factors that facilitate colonization and, possibly, subsequent infection [17]. Among the constitutive properties of skin that help to prevent colonization and infection by S. aureus are its low temperature and acidic pH [18,19]. For instance, an epidermal structural component, filaggrin, is broken down during epidermal differentiation into urocanic acid and pyrrolidone carboxylic acid [20]. These acidic breakdown products then not only contribute to the low pH of the skin surface but also inhibit the growth of S. aureus and the expression of at least two factors involved in S. aureus colonization, clumping factor B (ClfB) and fibronectin binding protein A (FnbpA) [20]. In addition, commensal organisms such as S. epidermidis, P. acnes and the Malassezia species are normally present on the skin surface occupying microbial niches and thus preventing colonization and invasion by S. aureus and other pathogens [18,19]. Skin commensals have also been shown to directly inhibit S. aureus colonization of skin and nasal mucosa. For example, S. epidermidis secretes a serine protease, Esp, which inhibits S. aureus colonization by destroying its biofilms [21]. S. epidermidis also produces phenol-soluble modulins (PSMγ and PSMδ), which have direct antimicrobial activity against S. aureus [22] and activate toll-like receptor 2 (TLR2) on keratinocytes, leading to production of CAMPs (e.g., human β-defensin 2 [hBD2], hBD3 and RNase 7), which amplify the immune response and promote killing of S. aureus [23,24]. CAMPs such as hBD2, hBD3, LL-37 (cathelicidin) and RNase 7, which are produced by keratinocytes in the skin and corneal layer, have bacteriostatic or bactericidal activity against S. aureus [25–28], as

157
evidenced by the observation that S. aureus colonization is increased in skin lesions caused by atopic dermatitis due to reductions in the levels of β-defensins and cathelicidin [29].
To promote colonization of human nasal mucosa and skin, S. aureus expresses various factors that facilitate skin surface binding and survival. To bind to host surface components such as fibrinogen, fibronectin and cytokeratins, which are derived from epidermal keratinocytes or nasal epithelium, S. aureus utilizes microbial surface components recognizing adhesive matrix molecules (MSCRAMMs), which include fibronectin-binding protein A (Fnbp A) and Fnbp B, fibrinogen-binding proteins (ClfA and ClfB), iron-regulated surface determinant A (IsdA) and wall teichoic acid [30–33]. S. aureus-mediated fibronectin and fibrinogen binding is also enhanced by elevated levels of Th2 cytokines. For example, interleukin (IL)-4 is elevated in the skin lesions of atopic dermatitis patients, which are highly susceptible to S. aureus colonization [31]. S. aureus also produces superantigens such as staphylococcal enterotoxins A and B (SEA and SEB) and toxic shock syndrome toxin-1 (TSST-1), which skew the cutaneous immune response towards the Th2 cytokines and thus contribute to the increased colonization of S. aureus in atopic dermatitis patients [34]. In addition, S. aureus expresses factors that enable it to directly counter host CAMP responses. For example, IsdA enhances bacterial cellular hydrophobicity, which renders S. aureus resistant to bactericidal fatty acids in sebum and to β-defensins and cathelicidin [35]. It also secretes a protein, aureolysin, which is an extracellular metalloproteinase that inhibits cathelicidin antimicrobial activity [36]. Virulence factors from S. aureus are also closely related with evasion from human innate immune defenses [37]. In the following section, the mechanisms by which S. aureus inhibits the activities of CAMPs will be described in detail.
3. Methicillin-Resistant S. aureus (MRSA) Infection
Antibiotic resistance is now recognized to be a serious hindrance to the management of S. aureus. For instance, β-lactam antibiotics (e.g., methicillin) have proven unfavorable for the management of toxic S. aureus infections, because even subinhibitory concentrations lead to increased expression of α-toxin through a stimulatory effect on exoprotein synthesis [38–40]. Instead, protein-synthesis-suppressing antibiotics such as clindamycin and linezolid are recommended for the treatment of S. aureus-induced toxicity syndromes, as concentrations below the MIC impair expression of S. aureus virulence factors [41,42]. Clindamycin at a concentration of 1/8 MIC inhibits the expression of α- and δ-haemolysin as well as coagulase [43]. In addition, the expression of protein A is reduced when S. aureus is exposed to clindamycin at concentrations below the MIC, leading to increased bacterial susceptibility to phagocytosis and suggesting additional therapeutic efficacy [44]. However, clindamycin cannot be used to treat toxic MRSA infections because MRSA is largely resistant to clindamycin.
MRSA infections are caused by strains of S. aureus that have become resistant to the antibiotics commonly used to treat ordinary infections. Most MRSA infections occur in people who have been in hospitals or other health care settings, such as nursing homes and dialysis centers. When it occurs in these settings, it is known as health care-associated MRSA (HA-MRSA). HA-MRSA infections are typically associated with invasive procedures or devices, such as surgeries, intravenous tubing or artificial joints. However, another type of MRSA infection occurs in the wider community, among otherwise healthy individuals. This form, community-associated MRSA

158
(CA-MRSA) is spread by skin-to-skin contact. It often begins as a painful skin boil and generally causes skin and soft tissue infections, but it is also capable of causing invasive disease such as endocarditis, necrotizing pneumonia and sepsis [45–50]. HA-MRSA, by contrast, is considered a nosocomial pathogen typically associated with invasive disease, such as bloodstream infections, pneumonia, surgical site infections and urinary tract infections [45,51–53]. It is now recognized that these two entities are genetically distinct. Isolates of HA-MRSA are likely to be resistant to three or more antibiotic classes, whereas CA-MRSA is usually resistant only to β-lactams and macrolides [47,51,53,54].
Resistance to methicillin is mediated in S. aureus by PBP2a, a penicillin-binding protein with a low affinity for β-lactams. PBPs are membrane-bound enzymes that catalyze the transpeptidation reaction, which is necessary for cross-linkage of peptidoglycan chains [55]. PBP2a substitutes for the other PBPs and, because of its low affinity for all β-lactam antibiotics, enables staphylococci to survive exposure to high concentrations of these agents. Thus, resistance to methicillin confers resistance to all β-lactam agents, including cephalosporins. Expression of resistance in some MRSA strains is regulated by homologues of the regulatory genes for blaZ. These genes, mecI and mecR1, regulate the mecA response to β-lactam antibiotics in a fashion similar to the regulation of the blaZ response to penicillin by blaR1 and blaI. Katayama et al. demonstrated that mecA is carried on a mobile genetic element and is part of a genomic island designated staphylococcal cassette chromosome mec (SCCmec) [56]. To date, four different SCCmec elements varying in size from 21 to 67 kb have been characterized [57]. Such islands may also contain additional genes for antimicrobial resistance and insertion sequences, as well as genes whose function is uncertain.
As S. aureus isolates from intensive care units and blood cultures have become increasingly resistant to greater numbers of antimicrobial agents [2,58], this has inevitably diminished the number of effective bactericidal antibiotics available to treat these often life-threatening infections. As rapidly as new antibiotics are introduced, staphylococci are developing efficient mechanisms to neutralize them. Recent reports of S. aureus isolates with intermediate or complete resistance to vancomycin portend a chemotherapeutic era in which effective bactericidal antibiotics against this organism may no longer be readily available [59,60]. Consequently the need to identify new alternative therapeutic targets and to develop novel drugs that can be used against these targets is increasing.
4. Human AMPs Effective against S. aureus
AMPs are a diverse group of polypeptides that are typically less than 50 amino acids in length and exhibit bactericidal activity under physiologic conditions [61–63]. Most AMPs are cationic and interact with the anionic microbial membrane leading to osmotic lysis [61–63]. Autolytic enzymes induced by AMPs may also be associated with bacterial cell death [64]. Whereas some AMPs are produced by keratinocytes and are normally present in the skin, others are induced during infection and inflammation/wounding [65,66]. In this section, we will focus on the specific bacteriostatic or bactericidal AMPs expressed by keratinocytes and by immune cells thought to contribute to host defense against S. aureus (Table 1).
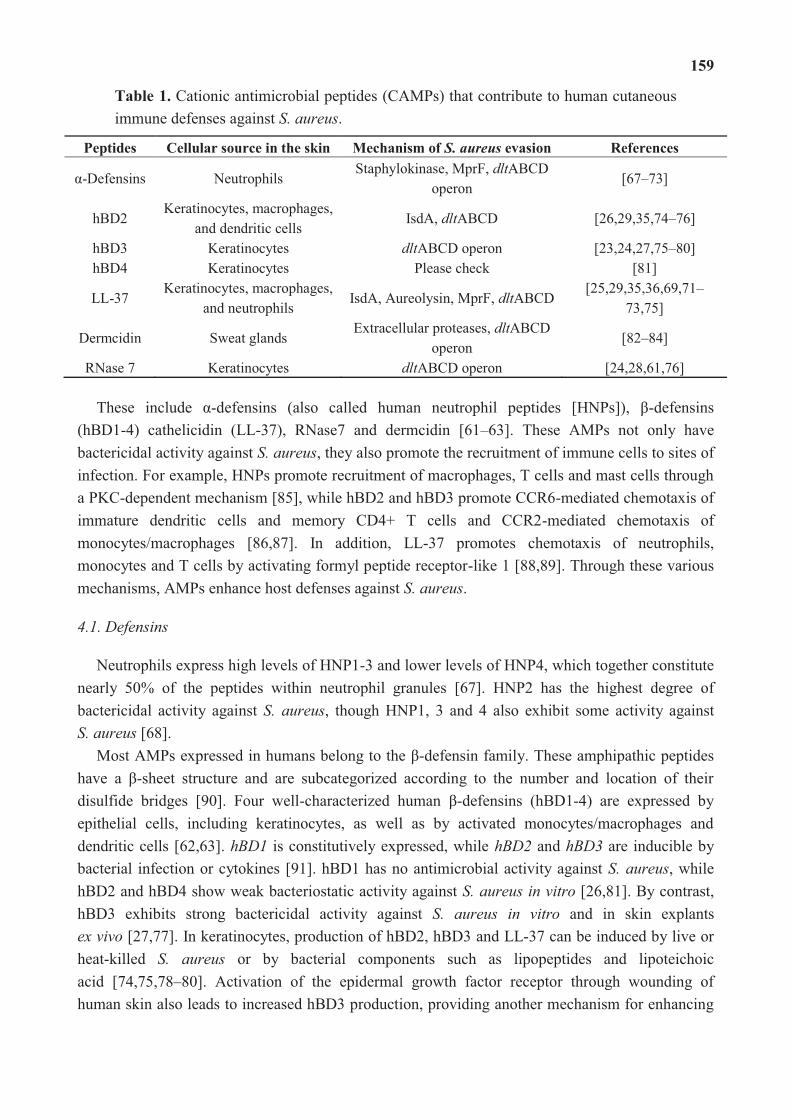
159
Table 1. Cationic antimicrobial peptides (CAMPs) that contribute to human cutaneous immune defenses against S. aureus.
Peptides Cellular source in the skin Mechanism of S. aureus evasion References
α-Defensins Neutrophils Staphylokinase, MprF, dltABCD
operon [67–73]
hBD2 Keratinocytes, macrophages,
and dendritic cells IsdA, dltABCD [26,29,35,74–76]
hBD3 Keratinocytes dltABCD operon [23,24,27,75–80] hBD4 Keratinocytes Please check [81]
LL-37 Keratinocytes, macrophages,
and neutrophils IsdA, Aureolysin, MprF, dltABCD
[25,29,35,36,69,71–73,75]
Dermcidin Sweat glands Extracellular proteases, dltABCD
operon [82–84]
RNase 7 Keratinocytes dltABCD operon [24,28,61,76]
These include α-defensins (also called human neutrophil peptides [HNPs]), β-defensins (hBD1-4) cathelicidin (LL-37), RNase7 and dermcidin [61–63]. These AMPs not only have bactericidal activity against S. aureus, they also promote the recruitment of immune cells to sites of infection. For example, HNPs promote recruitment of macrophages, T cells and mast cells through a PKC-dependent mechanism [85], while hBD2 and hBD3 promote CCR6-mediated chemotaxis of immature dendritic cells and memory CD4+ T cells and CCR2-mediated chemotaxis of monocytes/macrophages [86,87]. In addition, LL-37 promotes chemotaxis of neutrophils, monocytes and T cells by activating formyl peptide receptor-like 1 [88,89]. Through these various mechanisms, AMPs enhance host defenses against S. aureus.
4.1. Defensins
Neutrophils express high levels of HNP1-3 and lower levels of HNP4, which together constitute nearly 50% of the peptides within neutrophil granules [67]. HNP2 has the highest degree of bactericidal activity against S. aureus, though HNP1, 3 and 4 also exhibit some activity against S. aureus [68].
Most AMPs expressed in humans belong to the β-defensin family. These amphipathic peptides have a β-sheet structure and are subcategorized according to the number and location of their disulfide bridges [90]. Four well-characterized human β-defensins (hBD1-4) are expressed by epithelial cells, including keratinocytes, as well as by activated monocytes/macrophages and dendritic cells [62,63]. hBD1 is constitutively expressed, while hBD2 and hBD3 are inducible by bacterial infection or cytokines [91]. hBD1 has no antimicrobial activity against S. aureus, while hBD2 and hBD4 show weak bacteriostatic activity against S. aureus in vitro [26,81]. By contrast, hBD3 exhibits strong bactericidal activity against S. aureus in vitro and in skin explants ex vivo [27,77]. In keratinocytes, production of hBD2, hBD3 and LL-37 can be induced by live or heat-killed S. aureus or by bacterial components such as lipopeptides and lipoteichoic acid [74,75,78–80]. Activation of the epidermal growth factor receptor through wounding of human skin also leads to increased hBD3 production, providing another mechanism for enhancing

160
antimicrobial activity against S. aureus [66,92]. Finally, defensins induce production of cytokines, including IL-8, and have chemotactic activity [93].
4.2. Cathelicidins
Cathelicidins are a family of AMPs whose named reflects their resemblance to the precursor forms of the protein cathelin [94]. The N-terminal cathelin domain keeps the AMP precursor inactive until proteolytic cleavage releases the active C-terminal peptide. Although they may vary in structure, most mature cathelicidins are α-helical, amphipathic and cationic. Cathelicidin is constitutively expressed in neutrophils and has potent bactericidal activity against S. aureus. It is also called LL-37, referring its first two amino acids and total length of 37 amino acids [25,62,63]. Two other forms, RK-31 and KS-30, may be produced through alternative cleavage, especially on the skin [95]. Both KS-30 and RK-31 show greater antimicrobial activity than LL-37 and also differ from LL-37 in their ability to elicit cytokine release. Like defensins, LL-37 can induce both chemotaxis and cytokine release [93].
Vitamin D may also play a role in host defense against S. aureus skin infections, since it induces production of LL-37 in keratinocytes, neutrophils and monocytes/macrophages. However, the link between vitamin D and host defense against S. aureus has yet to be demonstrated in the skin [96–98].
4.3. RNase7
The cationic peptide RNase 7 is produced by many cell types, including keratinocytes, and has bactericidal activity against a broad range of bacteria, including S. aureus [61,99]. The high levels of RNase 7 present in the stratum corneum prevents S. aureus colonization of skin explants [28].
4.4. Dermcidin
Dermcidin is produced by human eccrine sweat glands and its processed forms have activity against numerous bacteria, including S. aureus [82,83,100,101]. While the DCD-1L and DCD-1 processed forms of dermcidin are negatively charged [69], a further processed cationic form (SSl-25) also shows antimicrobial activity, suggesting that charge is of no importance to the mode of action of dermcidin-derived peptides [83].

161
Figure 1. Toll-like receptor-mediated cutaneous immune response against S. aureus. Toll-like receptor 2 (TLR2) and nucleotide-binding oligomerization domain containing 2 (NOD2), which are expressed by keratinocytes, respectively recognize S. aureus lipopeptides/lipoteichoic acid and muramyl dipeptide. Both TLR2 and NOD2 signaling triggers the activation of nuclear factor-κB (NF-κB), which leads to the production of AMPs, cytokines, chemokines, adhesion molecules and granulopoesis factors, all of which contribute to the cutaneous host defense against S. aureus.
5. Cutaneous Host Defense Involving TLR-Mediated AMP Activity against S. aureus
Keratinocytes express pattern recognition receptors such as TLR2, which recognizes S. aureus lipopeptides and lipoteichoic acid, and nucleotide-binding oligomerization domain containing 2 (NOD2), which recognizes the S. aureus peptidoglycan breakdown product muramyl dipeptide. Both the TLR2 and NOD2 signals lead to activation of nuclear factor-κB (NF-κB) and other transcription factors that induce transcription of the proinflammatory mediators (cytokines, chemokines, adhesion molecules and AMPs) involved in cutaneous host defense against S. aureus (Figure 1) [102,103]. Upon cutaneous S. aureus infection, the epidermal barrier is breached and keratinocytes and resident skin immune cells (e.g., Langerhans cells and γδ T cells in the epidermis, as well as dendritic cells, macrophages, fibroblasts, mast cells, B and T cells, plasma cells and natural killer cells in the dermis) produce pro-inflammatory cytokines, chemokines and adhesion molecules. These molecules promote the recruitment of neutrophils from the bloodstream, which help to control the infection by forming an abscess. Neutrophilic abscess formation is a

162
hallmark of S. aureus infections, which are typically pyogenic, and is required for bacterial clearance. Pro-inflammatory cytokines also induce the production of AMPs (e.g., β-defensins and cathelicidins) with bacteriostatic or bactericidal activity against S. aureus [104,105].
Figure 2. IL-1- and IL-17-mediated cutaneous immune response against S. aureus. Infection of the skin by S. aureus leads to the production of IL-1α, IL-1β and IL-17, which in turn triggers activation of nuclear factor-κB (NF-κB). These signaling pathways lead to the production of AMPs, cytokines, chemokines, adhesion molecules and granulopoesis factors, which recruit neutrophils from the circulation to the site of S. aureus infection in the skin. The recruited neutrophils form an abscess that helps control and limit the spread of the infection, and is ultimately required for bacterial clearance. IL-1R1, interleukin-1 receptor 1; IL-17R, interleukin-17 receptor.
6. Cutaneous Host Defense Involving IL-1- and IL-17-Mediated AMP Activity
against S. aureus
IL-1α, which is produced and released by keratinocytes, and IL-1β, which is produced by resident and recruited immune cells (e.g., macrophages and dendritic cells), trigger activation of NF-κB. These signaling pathways lead to the production of β-defensins 2 and 3, cathelicidins and RNase 7. IL-1-mediated responses also result in the production of pro-inflammatory cytokines, chemokines and adhesion molecules that promote the recruitment of neutrophils from

163
the circulation to sites of S. aureus infection in the skin and abscess formation (Figure 2) [106]. In addition to IL-1, recent studies have uncovered the critical role played by IL-17, which is predominantly expressed by recruited T cell subsets (Th17 cells, NKT cells and γδ T cells) and natural killer cells in response to TLR2 activation. The IL-17 produced stimulates production of β-defensins 2 and 3 and cathelicidins by keratinocytes and induces neutrophil recruitment via induction of various chemokines (CXCL1, CXCL2 and IL-8) and granulopoesis factors (G-CSF and GM-CSF) [107].
7. Mechanisms by Which S. aureus Evades Skin-Derived CAMPs
The importance of CAMPs in host cutaneous defense against S. aureus is evidenced by the mechanisms that have evolved in S. aureus to resist and evade these peptides. As shown in Figure 3, S. aureus counteracts CAMPs and antimicrobial fatty acids through at least four mechanisms: (i) production of CAMP-binding molecules, like the fibrinolytic enzyme staphylokinase (SAK), which binds to and inhibits α-defensins; (ii) proteolytic degradation of CAMPs by secreted proteases such as aureolysin, which cleaves and inactivates LL-37; (iii) reduction of the bacterial cell surface net negative charge by modification of teichoic acids using D-alanine or phospholipids with L-lysine; and (iv) alteration of bacterial cell surface hydrophobicity [11,108]. In the following sections, these mechanisms will be discussed in additional detail.
Figure 3. Strategies by which S. aureus evades CAMPs. S. aureus counteracts CAMPs by secreting trapping molecules and proteases that inactivate CAMPs and by modifying the cell membrane hydrophobicity or net charge [108].
7.1. Secretion of Extracellular CAMP-Binding Molecules
S. aureus resists α-defensins through the production of SAK, which binds human α-defensins with high affinity, thereby mediating significant α-defensin resistance. In vitro, SAK levels correlate inversely with the susceptibility of S. aureus isolates to α-defensins (Figure 3a) [70].
7.2. Proteolytic Degradation of CAMPs by Secreted Proteases
S. aureus and many other bacterial species produce peptidases and proteases capable of cleaving CAMPs. In vitro, production of S. aureus protease correlates with staphylococcal resistance to CAMPs [36]. For example, S. aureus produces a metalloproteinase, aureolysin, which cleaves and inactivates LL-37 [36]. S. aureus also secretes extracellular proteases that degrade dermcidin,

164
neutralizing its antimicrobial activity [84], and similar observations have been made with the S. epidermidis protease SepA (Figure 3b) [84].
7.3. Resistance to CAMPs through Reduction of Bacterial Surface Net Negative Charges
CAMPs and most other antimicrobial molecules, including lysozyme, phospholipase A2 and RNase5, have net positive charges. The surface of human cells is normally composed mainly of uncharged or zwitterionic lipids, whereas bacterial surfaces are composed of various anionic components, including as peptidoglycan, the phospholipids phosphatidylglycerol and cardiolipin, lipid A, and teichoic acids, which give it an anionic net charge [109]. Presumably, antimicrobial host factors have evolved to be cationic to achieve strong, selective affinity for the anionic surfaces of bacteria. However, some bacterial species, like S. aureus, are able to reduce the negative charge of their cell envelope, thereby becoming resistant to inactivation by many CAMPs (Figure 3c) [69,71–73,110–112].
7.3.1. Modification of Phospholipids with L-lysine
To reduce anionic charge, S. aureus and other bacteria are able to modify most of their phosphatidylglycerol with L-lysine [113]. The lysinylation of phosphatidylglycerol is mediated by a membrane protein, multiple peptide resistance factor protein (MprF) [112,114], which neutralizes the bacterial cell envelope and thus reduces susceptibility to many CAMPs, including α-defensins, LL-37 and Group IIA-phospholipase A2 [69,71,110,111].
7.3.2. Modification of Teichoic Acids with D-alanine
Products of the dltABCD operon attach positively charged D-alanine residues to negatively charged phosphate groups in the backbone of teichoic acids, rendering bacteria less susceptible to α-defensins and LL-37 [72,73]. Teichoic acids in S. aureus and other Gram-positive bacteria consist of alternating glycerolphosphate or ribitolphosphate units, which are substituted with N-acetyl-glucosamine or D-alanine [113]. These polymers are either anchored to the cytoplasmic membrane (lipoteichoic acid) or to the peptidoglycan cell wall (wall teichoic acid) and are anionic due to the presence of negatively charged phosphate groups. In a fashion similar to lysinylation of phospholipids, modification of teichoic acids with D-alanine leads to a partial neutralization of the polymer [73], which reduces the interaction of CAMPs with the bacterial surface, in turn reducing the susceptibility to cationic host defense molecules, including α-defensins and LL-37 [73]. Consistent with this scenario, an S. aureus mutant lacking D-alanine in its teichoic acids (dltA mutant) as well as clinical isolates expressing lower levels of dltA showed greater susceptibility to CAMPs, including dermcidin, RNase 7, hBD2 and hBD3 [76]. With dermcidin, cationic structures in the N-terminal part of the peptide appear crucial for interaction with the negative bacterial cell surface, which likely explains why D-alanylation influences its efficacy [83]. Also, several studies in animal models have demonstrated that alanylated teichoic acids contribute to an increased virulence of S. aureus [115–117].
165
7.4. Resistance to CAMPs through Alteration of Bacterial Cell Surface Hydrophobicity
Human skin is rich in antimicrobial fatty acids produced by sebaceous glands. S. aureus produces IsdA, which alters its surface hydrophobicity, thereby reducing the efficiency with which fatty acids gain access to the cells [35]. Indeed, by decreasing cellular hydrophobicity, IsdA renders S. aureus resistant to hBD2 and LL-37 on human skin (Figure 3d) [35].
8. Conclusions
S. aureus is a frequent component of human skin and nose microbiota. However, it can also cause various skin diseases, sometimes leading to systemic infections. The ability of S. aureus to colonize and infect the skin is apparently dependent on specific mechanisms that subvert host cutaneous defenses. The existence of these multiple resistance mechanisms makes it clear that CAMPs play a key role in the host cutaneous defense against S. aureus. Peschel et al. proposed the coevolution of CAMP structures and bacterial resistance mechanisms, which has led to the existence of the currently observed CAMPs [118]. One mechanism that renders CAMPs resistant to degradation by proteases is stabilization through disulphide bridges [118]. Other modifications that increase the efficacy of CAMPs include variation in the amino acid sequence, increases in the net positive charge through incorporation of larger numbers of cationic amino acids, and combining multiple antimicrobial mechanisms in a single molecule. These potential modifications of CAMPs are reviewed in detail by Peschel and Sahl [118].
Ouhara et al. showed that several clinical isolates of MRSA strains exhibited reduced susceptibility to the human LL-37 but not to the hBD3 [119]. The greater resistance to LL-37 is based on the more positive net cell-surface charge in MRSA strains than methicillin-susceptible S. aureus strains (MSSA). The fact that the efficacy of hBD3 appears unaffected may be due to its more positive net charge, as compared to LL-37 (+11 vs. +6), which would favor stronger interaction with the bacterial cell surface [119]. This suggests targeting highly conserved bacterial CAMP resistance mechanisms such as lysinylation of phospholipids by MprF or the alanylation of teichoic acids by dltABCD could be an effective treatment strategy. Moreover, in addition to its essential role in mediating resistance to CAMPs [69,111], it appears MprF may dramatically reduce the susceptibility of S. aureus to the novel lipopeptide antibiotic daptomycin [120,121]. Thus, new therapeutics targeting CAMP resistance factors, like MprF, could not only render a pathogen susceptible to host antimicrobial defense, but might also act synergistically to combat infections in combination with currently available antibiotics. Although targeting resistance factors would not directly inactivate S. aureus, it would render it more susceptible to CAMPs, thus assisting host cutaneous defenses to successfully combat skin infections.
The increasing numbers of reports of virulent and drug-resistant strains of S. aureus prompt further investigation into the mechanisms that enable this pathogen to cause infection and overcome the broad spectrum of human cutaneous antimicrobial defenses. We anticipate that future studies will provide further information about the host and bacterial determinants involved in skin colonization and infection by S. aureus. Targeted drug development around highly conserved bacterial resistance mechanisms against host CAMPs is a promising pharmacologic approach in this era of highly virulent and drug-resistant strains of S. aureus.

166
Acknowledgments
This work was supported by the IPET (Korea Institute of Planning and Evaluation for Technology in Food, Agriculture, Forestry and Fisheries), Ministry for Food, Agriculture, Forestry and Fisheries, Republic of Korea and the Human Resource Training Project for Regional Innovation (NRF-2013H1B8A2032054).
Conflicts of Interest
The authors declare no conflict of interest.
References
1. Chambers, H.F. The changing epidemiology of Staphylococcus aureus? Emerg. Infect. Dis. 2001, 7, 178–182.
2. Lowy, F.D. Staphylococcus aureus infections. N. Engl. J. Med. 1998, 339, 520–532. 3. Graham, P.L., 3rd; Lin, S. X.; Larson, E.L. A U.S. population-based survey of
Staphylococcus aureus colonization. Ann. Intern. Med. 2006, 144, 318–325. 4. Kuehnert, M.J.; Kruszon-Moran, D.; Hill, H.A.; McQuillan, G.; McAllister, S.K.; Fosheim, G.;
McDougal, L.K.; Chaitram, J.; Jensen, B.; Fridkin, S.K.; et al. Prevalence of Staphylococcus aureus nasal colonization in the United States, 2001–2002. J. Infect. Dis. 2006, 193, 172–179.
5. Perl, T.M.; Cullen, J.J.; Wenzel, R.P.; Zimmerman, M.B.; Pfaller, M.A.; Sheppard, D.; Twombley, J.; French, P.P.; Herwaldt, L.A.; et al. Intranasal mupirocin to prevent postoperative Staphylococcus aureus infections. N. Engl. J. Med. 2002, 346, 1871–1877.
6. Shopsin, B.; Mathema, B.; Martinez, J.; Ha, E.; Campo, M.L.; Fierman, A.; Krasinski, K.; Kornblum, J.; Alcabes, P.; Waddington, M.; Riehman, M.; et al. Prevalence of methicillin-resistant and methicillin-susceptible Staphylococcus aureus in the community. J. Infect. Dis. 2000, 182, 359–362.
7. Von Eiff, C.; Becker, K.; Machka, K.; Stammer, H.; Peters, G. Nasal carriage as a source of Staphylococcus aureus bacteremia. N. Engl. J. Med. 2001, 344, 11–16.
8. Herwaldt, L.A. Staphylococcus aureus nasal carriage and surgical-site infections. Surgery 2003, 134, S2–S9.
9. Lin, Y.C.; Lauderdale, T.L.; Lin, H.M.; Chen, P.C.; Cheng, M.F.; Hsieh, K.S.; Liu, Y.C. An outbreak of methicillin-resistant Staphylococcus aureus infection in patients of a pediatric intensive care unit and high carriage rate among health care workers. J. Microbiol. Immunol. Infect. 2007, 40, 325–334.
10. Elston, D.M. Community-acquired methicillin-resistant Staphylococcus aureus. J. Am. Acad. Dermatol. 2007, 56, 1–16.
11. Foster, T.J. Immune evasion by staphylococci. Nat. Rev. Microbiol. 2005, 3, 948–958. 12. Kraus, D.; Peschel, A. Molecular mechanisms of bacterial resistance to antimicrobial
peptides. Curr. Top. Microbiol. Immunol. 2006, 306, 231–250.
167
13. Glaser, R.; Becker, K.; von Eiff, C.; Meyer-Hoffert, U.; Harder, J. Decreased susceptibility of Staphylococcus aureus small colony variants (SCVs) towards human antimicrobial peptides. J. Invest. Dermatol. 2014, doi:10.1038/jid.2014.176.
14. Grenfell, B.T.; Pybus, O.G.; Gog, J.R.; Wood, J.L.; Daly, J.M.; Mumford, J.A.; Holmes, E.C. Unifying the epidemiological and evolutionary dynamics of pathogens. Science 2004, 303, 327–332.
15. Woolhouse, M.E.; Webster, J.P.; Domingo, E.; Charlesworth, B.; Levin, B.R. Biological and biomedical implications of the co-evolution of pathogens and their hosts. Nat. Genet. 2002, 32, 569–577.
16. Gorwitz, R.J.; Kruszon-Moran, D.; McAllister, S.K.; McQuillan, G.; McDougal, L.K.; Fosheim, G.E.; Jensen, B.J.; Killgore, G.; Tenover, F.C.; Kuehnert, M.J. Changes in the prevalence of nasal colonization with Staphylococcus aureus in the United States, 2001–2004. J. Infect. Dis. 2008, 197, 1226–1234.
17. Miller, L.G.; Diep, B.A. Clinical practice: Colonization, fomites, and virulence: Rethinking the pathogenesis of community-associated methicillin-resistant Staphylococcus aureus infection. Clin. Infect. Dis. 2008, 46, 752–760.
18. Grice, E.A.; Kong, H.H.; Conlan, S.; Deming, C.B.; Davis, J.; Young, A.C.; Program, N.C.S.; Bouffard, G.G.; Blakesley, R.W.; Murray, P.R.; et al. Topographical and temporal diversity of the human skin microbiome. Science 2009, 324, 1190–1192.
19. Grice, E.A.; Segre, J.A. The skin microbiome. Nat. Rev. Microbiol. 2011, 9, 244–253. 20. Miajlovic, H.; Fallon, P.G.; Irvine, A.D.; Foster, T.J. Effect of filaggrin breakdown products
on growth of and protein expression by Staphylococcus aureus. J. Allergy. Clin. Immunol. 2010, 126, 1184–1190.
21. Iwase, T.; Uehara, Y.; Shinji, H.; Tajima, A.; Seo, H.; Takada, K.; Agata, T.; Mizunoe, Y. Staphylococcus epidermidis Esp inhibits Staphylococcus aureus biofilm formation and nasal colonization. Nature 2010, 465, 346–349.
22. Cogen, A.L.; Yamasaki, K.; Sanchez, K.M.; Dorschner, R.A.; Lai, Y.; MacLeod, D.T.; Torpey, J.W.; Otto, M.; Nizet, V.; Kim, J.E.; et al. Selective antimicrobial action is provided by phenol-soluble modulins derived from Staphylococcus epidermidis, a normal resident of the skin. J. Invest. Dermatol. 2010, 130, 192–200.
23. Lai, Y.; Cogen, A.L.; Radek, K.A.; Park, H.J.; Macleod, D.T.; Leichtle, A.; Ryan, A.F.; Di Nardo, A.; Gallo, R.L. Activation of TLR2 by a small molecule produced by Staphylococcus epidermidis increases antimicrobial defense against bacterial skin infections. J. Invest. Dermatol. 2010, 130, 2211–2221.
24. Wanke, I.; Steffen, H.; Christ, C.; Krismer, B.; Gotz, F.; Peschel, A.; Schaller, M.; Schittek, B. Skin commensals amplify the innate immune response to pathogens by activation of distinct signaling pathways. J. Invest. Dermatol. 2011, 131, 382–390.
25. Braff, M.H.; Zaiou, M.; Fierer, J.; Nizet, V.; Gallo, R.L. Keratinocyte production of cathelicidin provides direct activity against bacterial skin pathogens. Infect. Immun. 2005, 73, 6771–6781.
26. Harder, J.; Bartels, J.; Christophers, E.; Schroder, J.M. A peptide antibiotic from human skin. Nature 1997, 387, 861.

168
27. Kisich, K.O.; Howell, M.D.; Boguniewicz, M.; Heizer, H.R.; Watson, N.U.; Leung, D.Y. The constitutive capacity of human keratinocytes to kill Staphylococcus aureus is dependent on β-defensin 3. J. Invest. Dermatol. 2007, 127, 2368–2380.
28. Simanski, M.; Dressel, S.; Glaser, R.; Harder, J. RNase 7 protects healthy skin from Staphylococcus aureus colonization. J. Invest. Dermatol. 2010, 130, 2836–2838.
29. Ong, P.Y.; Ohtake, T.; Brandt, C.; Strickland, I.; Boguniewicz, M.; Ganz, T.; Gallo, R.L.; Leung, D.Y. Endogenous antimicrobial peptides and skin infections in atopic dermatitis. N. Engl. J. Med. 2002, 347, 1151–1160.
30. Burian, M.; Rautenberg, M.; Kohler, T.; Fritz, M.; Krismer, B.; Unger, C.; Hoffmann, W.H.; Peschel, A.; Wolz, C.; Goerke, C. Temporal expression of adhesion factors and activity of global regulators during establishment of Staphylococcus aureus nasal colonization. J. Infect. Dis. 2010, 201, 1414–1421.
31. Cho, S.H.; Strickland, I.; Tomkinson, A.; Fehringer, A.P.; Gelfand, E.W.; Leung, D.Y. Preferential binding of Staphylococcus aureus to skin sites of Th2-mediated inflammation in a murine model. J. Invest. Dermatol. 2001, 116, 658–663.
32. Clarke, S.R.; Brummell, K.J.; Horsburgh, M.J.; McDowell, P.W.; Mohamad, S.A.; Stapleton, M.R.; Acevedo, J.; Read, R.C.; Day, N.P.; Peacock, S.J.; et al. Identification of in vivo-expressed antigens of Staphylococcus aureus and their use in vaccinations for protection against nasal carriage. J. Infect. Dis. 2006, 193, 1098–1108.
33. Weidenmaier, C.; Kokai-Kun, J.F.; Kristian, S.A.; Chanturiya, T.; Kalbacher, H.; Gross, M.; Nicholson, G.; Neumeister, B.; Mond, J.J.; Peschel, A. Role of teichoic acids in Staphylococcus aureus nasal colonization, a major risk factor in nosocomial infections. Nat. Med. 2004, 10, 243–245.
34. Laouini, D.; Kawamoto, S.; Yalcindag, A.; Bryce, P.; Mizoguchi, E.; Oettgen, H.; Geha, R.S. Epicutaneous sensitization with superantigen induces allergic skin inflammation. J. Allergy. Clin. Immunol. 2003, 112, 981–987.
35. Clarke, S.R.; Mohamed, R.; Bian, L.; Routh, A.F.; Kokai-Kun, J.F.; Mond, J.J.; Tarkowski, A.; Foster, S.J. The Staphylococcus aureus surface protein IsdA mediates resistance to innate defenses of human skin. Cell Host Microbe 2007, 1, 199–212.
36. Sieprawska-Lupa, M.; Mydel, P.; Krawczyk, K.; Wojcik, K.; Puklo, M.; Lupa, B.; Suder, P.; Silberring, J.; Reed, M.; Pohl, J.; et al. Degradation of human antimicrobial peptide LL-37 by Staphylococcus aureus-derived proteinases. Antimicrob. Agents Chemother. 2004, 48, 4673–4679.
37. Zecconi, A.; Scali, F. Staphylococcus aureus virulence factors in evasion from innate immune defenses in human and animal diseases. Immunol. Lett. 2013, 150, 12–22.
38. Hallander, H.O.; Laurell, G.; Lofstrom, G. Enhancement of staphylococcal pathogenicity in the presence of penicillin. Acta Pathol. Microbiol. Scand. 1966, 68, 463–464.
39. Ohlsen, K.; Ziebuhr, W.; Koller, K.P.; Hell, W.; Wichelhaus, T.A.; Hacker, J. Effects of subinhibitory concentrations of antibiotics on α-toxin (hla) gene expression of methicillin-sensitive and methicillin-resistant Staphylococcus aureus isolates. Antimicrob. Agents Chemother. 1998, 42, 2817–2823.

169
40. Shibl, A.M. Effect of antibiotics on production of enzymes and toxins by microorganisms. Rev. Infect. Dis. 1983, 5, 865–875.
41. Bernardo, K.; Pakulat, N.; Fleer, S.; Schnaith, A.; Utermohlen, O.; Krut, O.; Muller, S.; Kronke, M. Subinhibitory concentrations of linezolid reduce Staphylococcus aureus virulence factor expression. Antimicrob. Agents Chemother. 2004, 48, 546–555.
42. Schlievert, P.M.; Kelly, J.A. Clindamycin-induced suppression of toxic-shock syndrome—Associated exotoxin production. J. Infect. Dis. 1984, 149, 471.
43. Shibl, A.M. Role of Staphylococcus aureus exfoliatin toxin in staphylococcal infections in mice. Chemotherapy 1981, 27, 224–227.
44. Veringa, E. M.; Verhoef, J. Influence of subinhibitory concentrations of clindamycin on opsonophagocytosis of Staphylococcus aureus, a protein-A-dependent process. Antimicrob. Agents Chemother. 1986, 30, 796–797.
45. Beilman, G.J.; Sandifer, G.; Skarda, D.; Jensen, B.; McAllister, S.; Killgore, G.; Srinivasan, A. Emerging infections with community-associated methicillin-resistant Staphylococcus aureus in outpatients at an Army Community Hospital. Surg. Infect. (Larchmt) 2005, 6, 87–92.
46. Daum, R.S. Clinical practice: Skin and soft-tissue infections caused by methicillin-resistant Staphylococcus aureus. N. Engl. J. Med. 2007, 357, 380–390.
47. David, M.Z.; Daum, R.S. Community-associated methicillin-resistant Staphylococcus aureus: Epidemiology and clinical consequences of an emerging epidemic. Clin. Microbiol. Rev. 2010, 23, 616–687.
48. DeLeo, F.R.; Otto, M.; Kreiswirth, B.N.; Chambers, H.F. Community-associated meticillin-resistant Staphylococcus aureus. Lancet 2010, 375, 1557–1568.
49. Deurenberg, R.H.; Stobberingh, E.E. The evolution of Staphylococcus aureus. Infect. Genet. Evol. 2008, 8, 747–763.
50. Mediavilla, J.R.; Chen, L.; Mathema, B.; Kreiswirth, B.N. Global epidemiology of community-associated methicillin resistant Staphylococcus aureus (CA-MRSA). Curr. Opin. Microbiol. 2012, 15, 588–595.
51. Chavez, T.T.; Decker, C.F. Health care-associated MRSA versus community-associated MRSA. Dis. Mon. 2008, 54, 763–768.
52. Enright, M.C. The evolution of a resistant pathogen—The case of MRSA. Curr. Opin. Pharmacol. 2003, 3, 474–479.
53. Naimi, T.S.; LeDell, K.H.; Como-Sabetti, K.; Borchardt, S.M.; Boxrud, D.J.; Etienne, J.; Johnson, S.K.; Vandenesch, F.; Fridkin, S.; O’Boyle, C.; et al. Comparison of community- and health care-associated methicillin-resistant Staphylococcus aureus infection. J. Am. Med. Assoc. 2003, 290, 2976–2984.
54. Klein, E.; Smith, D.L.; Laxminarayan, R. Community-associated methicillin-resistant Staphylococcus aureus in outpatients, United States, 1999–2006. Emerg. Infect. Dis. 2009, 15, 1925–1930.
55. Ghuysen, J.M. Molecular structures of penicillin-binding proteins and β-lactamases. Trends. Microbiol. 1994, 2, 372–380.

170
56. Katayama, Y.; Ito, T.; Hiramatsu, K. A new class of genetic element, staphylococcus cassette chromosome mec, encodes methicillin resistance in Staphylococcus aureus. Antimicrob. Agents Chemother. 2000, 44, 1549–1555.
57. Hiramatsu, K.; Cui, L.; Kuroda, M.; Ito, T. The emergence and evolution of methicillin-resistant Staphylococcus aureus. Trends. Microbiol. 2001, 9, 486–493.
58. Diekema, D.J.; Pfaller, M.A.; Schmitz, F.J.; Smayevsky, J.; Bell, J.; Jones, R.N.; Beach, M.; Group, S.P. Survey of infections due to Staphylococcus species: Frequency of occurrence and antimicrobial susceptibility of isolates collected in the United States, Canada, Latin America, Europe, and the Western Pacific region for the SENTRY Antimicrobial Surveillance Program, 1997–1999. Clin. Infect. Dis. 2001, 32, S114–S132.
59. Centers for Disease Control and Prevention. Staphylococcus aureus resistant to vancomycin—United States, 2002. MMWR Morb. Mortal. Wkly. Rep. 2002, 51, 565–567.
60. Hiramatsu, K.; Hanaki, H.; Ino, T.; Yabuta, K.; Oguri, T.; Tenover, F.C. Methicillin-resistant Staphylococcus aureus clinical strain with reduced vancomycin susceptibility. J. Antimicrob. Chemother. 1997, 40, 135–136.
61. Cho, J.S.; Xuan, C.; Miller, L.S. Lucky number seven: RNase 7 can prevent Staphylococcus aureus skin colonization. J. Invest. Dermatol. 2010, 130, 2703–2706.
62. Otto, M. Staphylococcus colonization of the skin and antimicrobial peptides. Expert. Rev. Dermatol. 2010, 5, 183–195.
63. Schauber, J.; Gallo, R.L. Antimicrobial peptides and the skin immune defense system. J. Allergy. Clin. Immunol. 2009, 124, R13–R18.
64. Sahl, H.G.; Pag, U.; Bonness, S.; Wagner, S.; Antcheva, N.; Tossi, A. Mammalian defensins: Structures and mechanism of antibiotic activity. J. Leukoc. Biol. 2005, 77, 466–475.
65. Miller, L.S.; Sorensen, O.E.; Liu, P.T.; Jalian, H.R.; Eshtiaghpour, D.; Behmanesh, B.E.; Chung, W.; Starner, T.D.; Kim, J.; Sieling, P.A.; et al. TGF-α regulates TLR expression and function on epidermal keratinocytes. J. Immunol. 2005, 174, 6137–6143.
66. Sorensen, O.E.; Thapa, D.R.; Roupe, K.M.; Valore, E.V.; Sjobring, U.; Roberts, A.A.; Schmidtchen, A.; Ganz, T. Injury-induced innate immune response in human skin mediated by transactivation of the epidermal growth factor receptor. J. Clin. Invest. 2006, 116, 1878–1885.
67. Lehrer, R.I. Multispecific myeloid defensins. Curr. Opin. Hematol. 2007, 14, 16–21. 68. Ericksen, B.; Wu, Z.; Lu, W.; Lehrer, R.I. Antibacterial activity and specificity of the six
human α-defensins. Antimicrob. Agents Chemother. 2005, 49, 269–275. 69. Peschel, A.; Jack, R.W.; Otto, M.; Collins, L.V.; Staubitz, P.; Nicholson, G.; Kalbacher, H.;
Nieuwenhuizen, W.F.; Jung, G.; Tarkowski, A.; et al. Staphylococcus aureus resistance to human defensins and evasion of neutrophil killing via the novel virulence factor MprF is based on modification of membrane lipids with L-lysine. J. Exp. Med. 2001, 193, 1067–1076.
70. Jin, T.; Bokarewa, M.; Foster, T.; Mitchell, J.; Higgins, J.; Tarkowski, A. Staphylococcus aureus resists human defensins by production of staphylokinase, a novel bacterial evasion mechanism. J. Immunol. 2004, 172, 1169–1176.

171
71. Ernst, C.M.; Staubitz, P.; Mishra, N.N.; Yang, S.J.; Hornig, G.; Kalbacher, H.; Bayer, A.S.; Kraus, D.; Peschel, A. The bacterial defensin resistance protein MprF consists of separable domains for lipid lysinylation and antimicrobial peptide repulsion. PLoS Pathog. 2009, 5, e1000660.
72. Jann, N.J.; Schmaler, M.; Kristian, S.A.; Radek, K.A.; Gallo, R.L.; Nizet, V.; Peschel, A.; Landmann, R. Neutrophil antimicrobial defense against Staphylococcus aureus is mediated by phagolysosomal but not extracellular trap-associated cathelicidin. J. Leukoc. Biol. 2009, 86, 1159–1169.
73. Peschel, A.; Otto, M.; Jack, R.W.; Kalbacher, H.; Jung, G.; Gotz, F. Inactivation of the dlt operon in Staphylococcus aureus confers sensitivity to defensins, protegrins, and other antimicrobial peptides. J. Biol. Chem. 1999, 274, 8405–8410.
74. Dinulos, J.G.; Mentele, L.; Fredericks, L.P.; Dale, B.A.; Darmstadt, G.L. Keratinocyte expression of human β-defensin 2 following bacterial infection: Role in cutaneous host defense. Clin. Diagn. Lab. Immunol. 2003, 10, 161–166.
75. Sayama, K.; Komatsuzawa, H.; Yamasaki, K.; Shirakata, Y.; Hanakawa, Y.; Ouhara, K.; Tokumaru, S.; Dai, X.; Tohyama, M.; Ten Dijke, P.; et al. New mechanisms of skin innate immunity: ASK1-mediated keratinocyte differentiation regulates the expression of β-defensins, LL37, and TLR2. Eur. J. Immunol. 2005, 35, 1886–1895.
76. Simanski, M.; Glaser, R.; Koten, B.; Meyer-Hoffert, U.; Wanner, S.; Weidenmaier, C.; Peschel, A.; Harder, J. Staphylococcus aureus subverts cutaneous defense by D-alanylation of teichoic acids. Exp. Dermatol. 2013, 22, 294–296.
77. Harder, J.; Bartels, J.; Christophers, E.; Schroder, J.M. Isolation and characterization of human β-defensin 3, a novel human inducible peptide antibiotic. J. Biol. Chem. 2001, 276, 5707–5713.
78. Menzies, B.E.; Kenoyer, A. Signal transduction and nuclear responses in Staphylococcus aureus-induced expression of human β-defensin 3 in skin keratinocytes. Infect. Immun. 2006, 74, 6847–6854.
79. Sumikawa, Y.; Asada, H.; Hoshino, K.; Azukizawa, H.; Katayama, I.; Akira, S.; Itami, S. Induction of β-defensin 3 in keratinocytes stimulated by bacterial lipopeptides through Toll-like receptor 2. Microbes. Infect. 2006, 8, 1513–1521.
80. Zanger, P.; Holzer, J.; Schleucher, R.; Scherbaum, H.; Schittek, B.; Gabrysch, S. Severity of Staphylococcus aureus infection of the skin is associated with inducibility of human β-defensin 3 but not human β-defensin 2. Infect. Immun. 2010, 78, 3112–3117.
81. Garcia, J.R.; Krause, A.; Schulz, S.; Rodriguez-Jimenez, F.J.; Kluver, E.; Adermann, K.; Forssmann, U.; Frimpong-Boateng, A.; Bals, R.; Forssmann, W.G. Human β-defensin 4: A novel inducible peptide with a specific salt-sensitive spectrum of antimicrobial activity. FASEB J. 2001, 15, 1819–1821.
82. Rieg, S.; Steffen, H.; Seeber, S.; Humeny, A.; Kalbacher, H.; Dietz, K.; Garbe, C.; Schittek, B. Deficiency of dermcidin-derived antimicrobial peptides in sweat of patients with atopic dermatitis correlates with an impaired innate defense of human skin in vivo. J. Immunol. 2005, 174, 8003–8010.

172
83. Steffen, H.; Rieg, S.; Wiedemann, I.; Kalbacher, H.; Deeg, M.; Sahl, H.G.; Peschel, A.; Gotz, F.; Garbe, C.; Schittek, B. Naturally processed dermcidin-derived peptides do not permeabilize bacterial membranes and kill microorganisms irrespective of their charge. Antimicrob. Agents Chemother. 2006, 50, 2608–2620.
84. Lai, Y.; Villaruz, A.E.; Li, M.; Cha, D.J.; Sturdevant, D.E.; Otto, M. The human anionic antimicrobial peptide dermcidin induces proteolytic defence mechanisms in staphylococci. Mol. Microbiol. 2007, 63, 497–506.
85. Grigat, J.; Soruri, A.; Forssmann, U.; Riggert, J.; Zwirner, J. Chemoattraction of macrophages, T lymphocytes, and mast cells is evolutionarily conserved within the human α-defensin family. J. Immunol. 2007, 179, 3958–3965.
86. Rohrl, J.; Yang, D.; Oppenheim, J.J.; Hehlgans, T. Human β -defensin 2 and 3 and their mouse orthologs induce chemotaxis through interaction with CCR2. J. Immunol. 2010, 184, 6688–6694.
87. Yang, D.; Chertov, O.; Bykovskaia, S.N.; Chen, Q.; Buffo, M.J.; Shogan, J.; Anderson, M.; Schroder, J.M.; Wang, J.M.; Howard, O.M.; et al. β-Defensins: Linking innate and adaptive immunity through dendritic and T cell CCR6. Science 1999, 286, 525–528.
88. De, Y.; Chen, Q.; Schmidt, A.P.; Anderson, G.M.; Wang, J.M.; Wooters, J.; Oppenheim, J.J.; Chertov, O. LL-37, the neutrophil granule- and epithelial cell-derived cathelicidin, utilizes formyl peptide receptor-like 1 (FPRL1) as a receptor to chemoattract human peripheral blood neutrophils, monocytes, and T cells. J. Exp. Med. 2000, 192, 1069–1074.
89. Tjabringa, G.S.; Ninaber, D.K.; Drijfhout, J.W.; Rabe, K.F.; Hiemstra, P.S. Human cathelicidin LL-37 is a chemoattractant for eosinophils and neutrophils that acts via formyl-peptide receptors. Int. Arch. Allergy. Immunol. 2006, 140, 103–112.
90. Ganz, T. Defensins: Antimicrobial peptides of innate immunity. Nat. Rev. Immunol. 2003, 3, 710–720.
91. Harder, J.; Meyer-Hoffert, U.; Wehkamp, K.; Schwichtenberg, L.; Schroder, J.M. Differential gene induction of human β-defensins (hBD-1, -2, -3, and -4) in keratinocytes is inhibited by retinoic acid. J. Invest. Dermatol. 2004, 123, 522–529.
92. Miller, L.S.; Modlin, R.L. Human keratinocyte Toll-like receptors promote distinct immune responses. J. Invest. Dermatol. 2007, 127, 262–263.
93. Yang, D.; Chertov, O.; Oppenheim, J.J. Participation of mammalian defensins and cathelicidins in anti-microbial immunity: Receptors and activities of human defensins and cathelicidin (LL-37). J. Leukoc. Biol. 2001, 69, 691–697.
94. Zanetti, M. Cathelicidins, multifunctional peptides of the innate immunity. J. Leukoc. Biol. 2004, 75, 39–48.
95. Murakami, M.; Ohtake, T.; Dorschner, R.A.; Schittek, B.; Garbe, C.; Gallo, R.L. Cathelicidin anti-microbial peptide expression in sweat, an innate defense system for the skin. J. Invest. Dermatol. 2002, 119, 1090–1095.
96. Liu, P.T.; Stenger, S.; Li, H.; Wenzel, L.; Tan, B.H.; Krutzik, S.R.; Ochoa, M.T.; Schauber, J.; Wu, K.; Meinken, C.; et al. Toll-like receptor triggering of a vitamin D-mediated human antimicrobial response. Science 2006, 311, 1770–1773.

173
97. Schauber, J.; Dorschner, R.A.; Coda, A.B.; Buchau, A.S.; Liu, P.T.; Kiken, D.; Helfrich, Y.R.; Kang, S.; Elalieh, H.Z.; Steinmeyer, A.; et al. Injury enhances TLR2 function and antimicrobial peptide expression through a vitamin D-dependent mechanism. J. Clin. Invest. 2007, 117, 803–811.
98. Wang, T.T.; Nestel, F.P.; Bourdeau, V.; Nagai, Y.; Wang, Q.; Liao, J.; Tavera-Mendoza, L.; Lin, R.; Hanrahan, J.W.; Mader, S.; et al. Cutting edge: 1,25-Dihydroxyvitamin D3 is a direct inducer of antimicrobial peptide gene expression. J. Immunol. 2004, 173, 2909–2912.
99. Zhang, J.; Dyer, K.D.; Rosenberg, H.F. Human RNase 7: A new cationic ribonuclease of the RNase A superfamily. Nucleic. Acids. Res. 2003, 31, 602–607.
100. Rieg, S.; Garbe, C.; Sauer, B.; Kalbacher, H.; Schittek, B. Dermcidin is constitutively produced by eccrine sweat glands and is not induced in epidermal cells under inflammatory skin conditions. Br. J. Dermatol. 2004, 151, 534–539.
101. Schittek, B.; Hipfel, R.; Sauer, B.; Bauer, J.; Kalbacher, H.; Stevanovic, S.; Schirle, M.; Schroeder, K.; Blin, N.; Meier, F.; et al. Dermcidin: A novel human antibiotic peptide secreted by sweat glands. Nat. Immunol. 2001, 2, 1133–1137.
102. Hruz, P.; Zinkernagel, A.S.; Jenikova, G.; Botwin, G.J.; Hugot, J.P.; Karin, M.; Nizet, V.; Eckmann, L. NOD2 contributes to cutaneous defense against Staphylococcus aureus through α-toxin-dependent innate immune activation. Proc. Natl. Acad. Sci. USA 2009, 106, 12873–12878.
103. Takeuchi, O.; Akira, S. Pattern recognition receptors and inflammation. Cell 2010, 140, 805–820. 104. Kim, M.H.; Granick, J.L.; Kwok, C.; Walker, N.J.; Borjesson, D.L.; Curry, F.R.;
Miller, L.S.; Simon, S.I. Neutrophil survival and c-kit+-progenitor proliferation in Staphylococcus aureus-infected skin wounds promote resolution. Blood 2011, 117, 3343–3352.
105. Molne, L.; Verdrengh, M.; Tarkowski, A. Role of neutrophil leukocytes in cutaneous infection caused by Staphylococcus aureus. Infect. Immun. 2000, 68, 6162–6167.
106. Miller, L.S.; Cho, J.S. Immunity against Staphylococcus aureus cutaneous infections. Nat. Rev. Immunol. 2011, 11, 505–518.
107. Cua, D.J.; Tato, C.M. Innate IL-17-producing cells: The sentinels of the immune system. Nat. Rev. Immunol. 2010, 10, 479–489.
108. Kraus, D.; Peschel, A. Staphylococcus aureus evasion of innate antimicrobial defense. Future Microbiol. 2008, 3, 437–451.
109. Huijbregts, R.P.; de Kroon, A.I.; de Kruijff, B. Topology and transport of membrane lipids in bacteria. Biochim. Biophys. Acta 2000, 1469, 43–61.
110. Koprivnjak, T.; Peschel, A.; Gelb, M.H.; Liang, N.S.; Weiss, J.P. Role of charge properties of bacterial envelope in bactericidal action of human group IIA phospholipase A2 against Staphylococcus aureus. J. Biol. Chem. 2002, 277, 47636–47644.
111. Kristian, S.A.; Durr, M.; van Strijp, J.A.; Neumeister, B.; Peschel, A. MprF-mediated lysinylation of phospholipids in Staphylococcus aureus leads to protection against oxygen-independent neutrophil killing. Infect. Immun. 2003, 71, 546–549.

174
112. Staubitz, P.; Neumann, H.; Schneider, T.; Wiedemann, I.; Peschel, A. MprF-mediated biosynthesis of lysylphosphatidylglycerol, an important determinant in staphylococcal defensin resistance. FEMS Microbiol. Lett. 2004, 231, 67–71.
113. Neuhaus, F.C.; Baddiley, J.A continuum of anionic charge: Structures and functions of D-alanyl-teichoic acids in gram-positive bacteria. Microbiol. Mol. Biol. Rev. 2003, 67, 686–723.
114. Oku, Y.; Kurokawa, K.; Ichihashi, N.; Sekimizu, K. Characterization of the Staphylococcus aureus mprF gene, involved in lysinylation of phosphatidylglycerol. Microbiology 2004, 150, 45–51.
115. Collins, L.V.; Kristian, S.A.; Weidenmaier, C.; Faigle, M.; van Kessel, K.P.; van Strijp, J.A.; Gotz, F.; Neumeister, B.; Peschel, A. Staphylococcus aureus strains lacking D-alanine modifications of teichoic acids are highly susceptible to human neutrophil killing and are virulence attenuated in mice. J. Infect. Dis. 2002, 186, 214–219.
116. Kristian, S.A.; Lauth, X.; Nizet, V.; Goetz, F.; Neumeister, B.; Peschel, A.; Landmann, R. Alanylation of teichoic acids protects Staphylococcus aureus against Toll-like receptor 2-dependent host defense in a mouse tissue cage infection model. J. Infect. Dis. 2003, 188, 414–423.
117. Weidenmaier, C.; Peschel, A.; Kempf, V.A.; Lucindo, N.; Yeaman, M.R.; Bayer, A.S. DltABCD- and MprF-mediated cell envelope modifications of Staphylococcus aureus confer resistance to platelet microbicidal proteins and contribute to virulence in a rabbit endocarditis model. Infect. Immun. 2005, 73, 8033–8038.
118. Peschel, A.; Sahl, H.G. The co-evolution of host cationic antimicrobial peptides and microbial resistance. Nat. Rev. Microbiol. 2006, 4, 529–536.
119. Ouhara, K.; Komatsuzawa, H.; Kawai, T.; Nishi, H.; Fujiwara, T.; Fujiue, Y.; Kuwabara, M.; Sayama, K.; Hashimoto, K.; Sugai, M. Increased resistance to cationic antimicrobial peptide LL-37 in methicillin-resistant strains of Staphylococcus aureus. J. Antimicrob. Chemother. 2008, 61, 1266–1269.
120. Friedman, L.; Alder, J.D.; Silverman, J.A. Genetic changes that correlate with reduced susceptibility to daptomycin in Staphylococcus aureus. Antimicrob. Agents Chemother. 2006, 50, 2137–2145.
121. Jones, T.; Yeaman, M.R.; Sakoulas, G.; Yang, S.J.; Proctor, R.A.; Sahl, H.G.; Schrenzel, J.; Xiong, Y.Q.; Bayer, A.S. Failures in clinical treatment of Staphylococcus aureus Infection with daptomycin are associated with alterations in surface charge, membrane phospholipid asymmetry, and drug binding. Antimicrob. Agents Chemother. 2008, 52, 269–278.

175
DADS Suppresses Human Esophageal Xenograft
Tumors through RAF/MEK/ERK and
Mitochondria-Dependent Pathways
Xiaoran Yin, Jun Zhang, Xiaoning Li, Dong Liu, Cheng Feng, Rongrui Liang,
Kun Zhuang, Chenlei Cai, Xinghuan Xue, Fuchun Jing, Xijing Wang, Jun Wang, Xinlian Liu
and Hongbing Ma
Abstract: Diallyl disulfide (DADS) is a natural organosulfur compound isolated from garlic. DADS has various biological properties, including anticancer, antiangiogenic, and antioxidant effects. However, the anticancer mechanisms of DADS in human esophageal carcinoma have not been elucidated, especially in vivo. In this study, MTT assay showed that DADS significantly reduced cell viability in human esophageal carcinoma ECA109 cells, but was relatively less toxic in normal liver cells. The pro–apoptotic effect of DADS on ECA109 cells was detected by Annexin V-FITC/propidium iodide (PI) staining. Flow cytometry analysis showed that DADS promoted apoptosis in a dose-dependent manner and the apoptosis rate could be decreased by caspase-3 inhibitor Ac-DEVD-CHO. Xenograft study in nude mice showed that DADS treatment inhibited the growth of ECA109 tumor in both 20 and 40 mg/kg DADS groups without obvious side effects. DADS inhibited ECA109 tumor proliferation by down-regulating proliferation cell nuclear antigen (PCNA). DADS induced apoptosis by activating a mitochondria-dependent pathway with the executor of caspase-3, increasing p53 level and Bax/Bcl-2 ratio, and downregulating the RAF/MEK/ERK pathway in ECA109 xenograft tumosr. Based on studies in cell culture and animal models, the findings here indicate that DADS is an effective and safe anti-cancer agent for esophageal carcinoma.
Reprinted from Int. J. Mol. Sci. Cite as: Yin, X.; Zhang, J.; Li, X.; Liu, D.; Feng, C.; Liang, R.; Zhuang, K.; Cai, C.; Xue, X.; Jing, F.; Wang, X.; Wang, J.; Liu, X.; Ma, H. DADS Suppresses Human Esophageal Xenograft Tumors through RAF/MEK/ERK and Mitochondria-Dependent Pathways. Int. J. Mol. Sci. 2014, 15, 12422-12441.
1. Introduction
Esophageal carcinoma is among the most common tumors in the world, ranking eighth in occurrence and sixth in mortality [1]. Approximately 70% of global esophageal carcinoma cases occur in China and the five–year survival rate is only 10% [2]. Generally, esophageal carcinoma patients in the primary stage can be cured by surgical resection. However, a majority of patients in the advanced stage eventually succumb to this disease [3]. Although surgery, radiotherapy and chemotherapy are regarded as important parts of the systemic therapy for metastatic esophageal carcinoma, the success of such treatments have been weakened by their severe systemic toxicities and local irritating effects. Therefore, in order to enhance efficacy and reduce toxicity, researchers have urgently tried to develop novel regimens with fewer side effects against esophageal carcinoma [4].

176
Plant-derived herbal medicines have been used in several Asian countries including China for a long time. Some plant compounds have anticancer activity with low toxicity and could be used as alternative chemotherapeutic agents for carcinomas [5]. Garlic, as an herbal medicine, has antimicrobial, antiplatelet, antithrombotic, antiarthritic and antitumorigenic properties [6]. Diallyl disulfide (DADS), CH2=CH–CH2–S–S–CH2CH=CH2, is a lipid–soluble organic compound isolated from garlic. Scientific investigations have shown that DADS reduces the risk of cardiovascular disease and diabetes [7], serves as anti-oxidant [8], fights against infections [9], and exhibits significant protection effects against malignancies [10–12]. Moreover, in human breast cancer MCF–7 cells, the apoptotic effect of DADS is even superior to chemotherapy agents such as 5F-dUMP (5-Fu) and cyclophosphamide (CTX) [13].
Considering limited data on DADS bioavailability, additional studies are warranted to check the effects of DADS in animal models of esophageal carcinoma [11,14]. Moreover, the molecular mechanisms of DADS on various carcinomas are still a matter of debate and the exact effects of DADS in vivo on esophageal carcinoma are still unclear. Therefore, in the present study, we used an ECA109 xenograft model in nude mice to study the effect of DADS on tumor growth. Additionally, we investigated the potential biomarkers and associated molecular alterations in ECA109 xenograft tumor. This is the first study to evaluate the potential effects and mechanisms of DADS on human esophageal carcinoma in vivo.
2. Results and Discussion
2.1. Diallyl Disulfide (DADS) Inhibits Cell Viability
The MTT assay was used to detect the viability inhibitory effects of ECA109 cells and L02 cells incubated with various concentrations of DADS (10–60 μg/mL) for 24 h. DADS was dissolved in DMSO, and mixed with RPMI–1640 for experiments in vitro. The concentration of DMSO added to the medium of DADS was less than 0.01%. The medium with DMSO and in absence of DADS was used as the control group. In addition, we detected the difference of ECA109 cells incubated with DADS and cis-diammminedichloroplatinum (DDP) for 24 h. Our data showed that DADS obviously inhibited cell viability in a dose-dependent manner at concentrations of 10–60 μg/mL for 24 h (p < 0.05, Figure 1). Moreover, DADS had much lower cytotoxicity to L02 normal liver cells than ECA109 esophageal carcinoma cells (p < 0.05, Figure 1). Our data shows that DDP was more effective than DADS on ECA109 cells in vitro (p < 0.05, Figure 2); DDP was used as positive control for in vivo study.
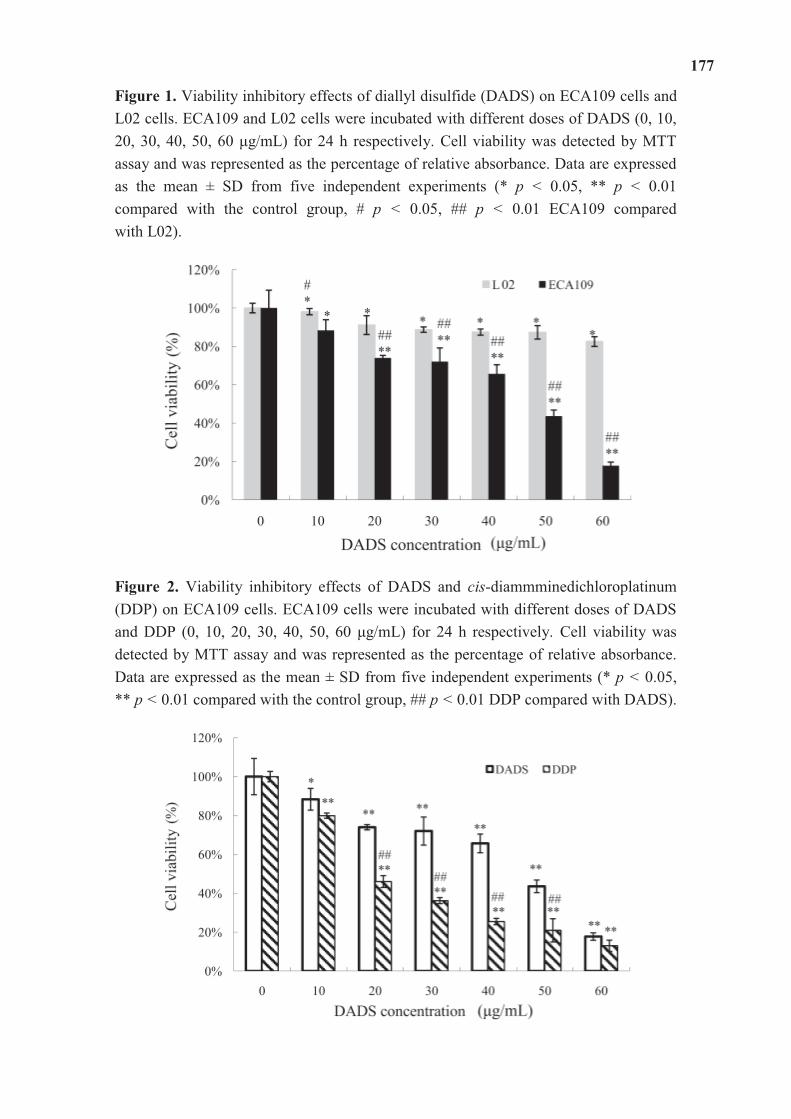
177
Figure 1. Viability inhibitory effects of diallyl disulfide (DADS) on ECA109 cells and L02 cells. ECA109 and L02 cells were incubated with different doses of DADS (0, 10, 20, 30, 40, 50, 60 μg/mL) for 24 h respectively. Cell viability was detected by MTT assay and was represented as the percentage of relative absorbance. Data are expressed as the mean ± SD from five independent experiments (* p < 0.05, ** p < 0.01 compared with the control group, # p < 0.05, ## p < 0.01 ECA109 compared with L02).
Figure 2. Viability inhibitory effects of DADS and cis-diammminedichloroplatinum (DDP) on ECA109 cells. ECA109 cells were incubated with different doses of DADS and DDP (0, 10, 20, 30, 40, 50, 60 μg/mL) for 24 h respectively. Cell viability was detected by MTT assay and was represented as the percentage of relative absorbance. Data are expressed as the mean ± SD from five independent experiments (* p < 0.05, ** p < 0.01 compared with the control group, ## p < 0.01 DDP compared with DADS).
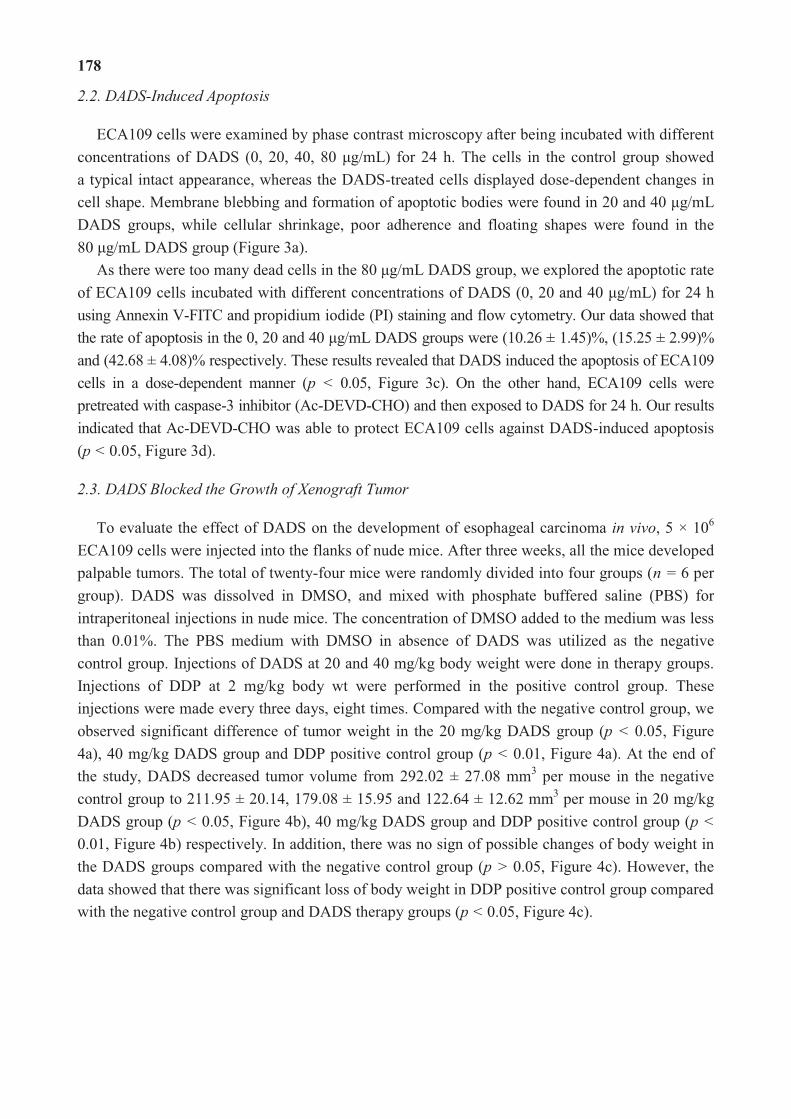
178
2.2. DADS-Induced Apoptosis
ECA109 cells were examined by phase contrast microscopy after being incubated with different concentrations of DADS (0, 20, 40, 80 μg/mL) for 24 h. The cells in the control group showed a typical intact appearance, whereas the DADS-treated cells displayed dose-dependent changes in cell shape. Membrane blebbing and formation of apoptotic bodies were found in 20 and 40 μg/mL DADS groups, while cellular shrinkage, poor adherence and floating shapes were found in the 80 μg/mL DADS group (Figure 3a).
As there were too many dead cells in the 80 μg/mL DADS group, we explored the apoptotic rate of ECA109 cells incubated with different concentrations of DADS (0, 20 and 40 μg/mL) for 24 h using Annexin V-FITC and propidium iodide (PI) staining and flow cytometry. Our data showed that the rate of apoptosis in the 0, 20 and 40 μg/mL DADS groups were (10.26 ± 1.45)%, (15.25 ± 2.99)% and (42.68 ± 4.08)% respectively. These results revealed that DADS induced the apoptosis of ECA109 cells in a dose-dependent manner (p < 0.05, Figure 3c). On the other hand, ECA109 cells were pretreated with caspase-3 inhibitor (Ac-DEVD-CHO) and then exposed to DADS for 24 h. Our results indicated that Ac-DEVD-CHO was able to protect ECA109 cells against DADS-induced apoptosis (p < 0.05, Figure 3d).
2.3. DADS Blocked the Growth of Xenograft Tumor
To evaluate the effect of DADS on the development of esophageal carcinoma in vivo, 5 × 10⁶ ECA109 cells were injected into the flanks of nude mice. After three weeks, all the mice developed palpable tumors. The total of twenty-four mice were randomly divided into four groups (n = 6 per group). DADS was dissolved in DMSO, and mixed with phosphate buffered saline (PBS) for intraperitoneal injections in nude mice. The concentration of DMSO added to the medium was less than 0.01%. The PBS medium with DMSO in absence of DADS was utilized as the negative control group. Injections of DADS at 20 and 40 mg/kg body weight were done in therapy groups. Injections of DDP at 2 mg/kg body wt were performed in the positive control group. These injections were made every three days, eight times. Compared with the negative control group, we observed significant difference of tumor weight in the 20 mg/kg DADS group (p < 0.05, Figure 4a), 40 mg/kg DADS group and DDP positive control group (p < 0.01, Figure 4a). At the end of the study, DADS decreased tumor volume from 292.02 ± 27.08 mm3 per mouse in the negative control group to 211.95 ± 20.14, 179.08 ± 15.95 and 122.64 ± 12.62 mm3 per mouse in 20 mg/kg DADS group (p < 0.05, Figure 4b), 40 mg/kg DADS group and DDP positive control group (p < 0.01, Figure 4b) respectively. In addition, there was no sign of possible changes of body weight in the DADS groups compared with the negative control group (p > 0.05, Figure 4c). However, the data showed that there was significant loss of body weight in DDP positive control group compared with the negative control group and DADS therapy groups (p < 0.05, Figure 4c).

179
Figure 3. Apoptotic effects of DADS on ECA109 cells. (a) Morphology of ECA109 cells treated with different concentrations of DADS for 24 h and examined under phase contrast microscopy (×400); (b) DADS (0, 20 and 40 μg/mL) induced dose-dependent apoptosis in ECA109 cells. Ac-DEVD-CHO inhibited the apoptosis induced by DADS. Apoptosis was assessed using Annexin V-FITC/propidium iodide (PI) double staining; (c) Statistical analysis of the apoptosis rate of DADS; (d) Effects of Ac-DEVD-CHO against the apoptosis induced by DADS. Data are expressed as the mean ± SD from three independent experiments (* p < 0.05, ** p < 0.01 compared with the control group, # p < 0.05, ## p < 0.01 DADS + Ac-DEVD-CHO compared with DADS).
(a) (b)
(c) (d)

180
Figure 4. Effects of DADS on ECA109 xenograft tumor. Nude mice were implanted with ECA109 cells. After the xenograft tumors became palpable, intraperitoneal injections were made eight times every three days, including the negative control group, 20 mg/kg DADS group, 40 mg/kg DADS group and 2 mg/kg DDP positive control group. Effects of DADS on (a) tumor volume; (b) tumor weight; and (c) body weight were recorded. Data shown in a–c are the average of six mice in each group, and are expressed as the mean ± SD (* p < 0.05, ** p < 0.01 compared with the control group).
(a) (b)
(c)
2.4. DADS Inhibited Cell Proliferation and Induced Apoptosis in Xenograft Tumor
We analyzed the effects of DADS on ECA109 tumor proliferation and apoptosis by immunohistochemical staining of proliferation cell nuclear antigen (PCNA) and caspase-3 respectively. By microscopic observation, a larger number of PCNA immunoreactive cells was observed in the negative control group (PBS medium with DMSO and in absence of DADS was utilized for intraperitoneal injections in nude mice) than in the 20 and 40 mg/kg DADS groups (Figure 5a), which accounted for 62.79% ± 9.58%, 32.31% ± 4.13% and 19.29% ± 6.49% respectively (p < 0.01, Figure 5b). However, more caspase-3 immunoreactive cells were observed in the DADS groups than the negative control group (Figure 5a). The quantification of caspase-3 immunoreactive cells was 11.84% ± 2.99% in the control group, and was significantly increased to 42.37% ± 7.39% and 54.28% ± 6.25% in the 20 mg/kg DADS group and 40 mg/kg DADS group, respectively (p < 0.01, Figure 5c).

181
Figure 5. Anti-proliferative and pro-apoptotic effects of DADS on ECA109 xenograft tumors. Tumors from the negative control group, 20 mg/kg DADS group and 40 mg/kg DADS group were processed for immunohistochemical staining of proliferation cell nuclear antigen (PCNA) (a,b) and caspase-3 (a,c). A representative picture had been shown for each case. Immunoreactive cells (yellow to brown) in xenograft tumors were enumerated and analyzed by Image-Pro Plus analysis system (Media Cybernetics, Bethesda, MD, USA) linked to an Olympus microscope (Olympus Corporation, Center Valley, PA, USA). The total number of cells was presented from all the samples in each group of five randomly selected microscopic fields. The data are expressed as the mean ± SD (×400) (** p < 0.01 compared with the control group).
(b)
(a) (c)
2.5. DADS Activated Mitochondria-Dependent Pathway and Up-Regulated Bax/Bcl-2 Ratio in Xenograft Tumors
It is well known that mitochondria–mediated apoptosis involves the release of cytochrome C, as well as the activation of caspase-9 and caspase-3. Our results from qPCR indicated that the levels of cytochrome C, caspase-9 and caspase-3 were stimulated in DADS groups (p < 0.01, Figure 6a). Moreover, DADS significantly increased the expression levels of active caspase-3 and active caspase-9 in total proteins, as well as the expression levels of cytochrome C in cytoplasm proteins in 20 and 40 mg/kg DADS groups by western blot analysis (p < 0.01, Figure 6c,e–g). However, DADS did not affect caspase-8 expression levels (p > 0.05, Figure 6a).
On the other hand, Bcl–2 and Bax are major proteins of the mitochondria apoptosis pathway. Our results of qPCR showed that the expression levels of Bcl-2 decreased in the DADS groups (p < 0.05, Figure 6a), whereas the expression level of Bax increased only in the 40 mg/kg DADS

182
group (p < 0.01, Figure 6a). Therefore, there was a significant up-regulation of the Bax/Bcl-2 ratio in the 40 mg/kg DADS group (p < 0.01, Figure 6b). In addition, the results of qPCR and Western blot suggested that DADS enhanced the expression levels of p53 in the 40 mg/kg group (p < 0.01, Figure 6a,e).
2.6. DADS Alters the RAF/MEK/ERK Pathway in Xenograft Tumors
Western blot analysis was used to evaluate the effects of DADS on the protein levels of RAF1, MEK1, phosphor-MEK1 (p-MEK1), ERK1/2 and p-ERK1/2 in ECA109 xenograft tumors. Our results showed a significant down-regulation of RAF1, p-MEK1, ERK1/2 and p-ERK1/2 protein expressions in 20 and 40 mg/kg DADS groups (p < 0.01, Figure 7b,d–f). The expression level of MEK1 decreased in 40 mg/kg DADS group (p < 0.01, Figure 7c). These results suggested that DADS had a profound effect on the apoptosis in ECA109 xenograft tumor, which might be correlated with the RAF/MEK/ERK pathway.
Figure 6. DADS activated mitochondria-dependent pathway and shift in Bax/Bcl-2 ratio in ECA109 xenograft tumors. The mRNA and protein expression levels of caspase-3, caspase-8, caspase-9, cytochrome C, Bax, Bcl-2 and p53 from the negative control group, 20 mg/kg DADS group and 40 mg/kg DADS group were assessed by qPCR and western blot. (a) The mRNA expressions of caspase-3, caspase-8, caspase-9, cytochrome C, Bax, Bcl-2 and p53; (b) Bax/Bcl-2 ratio; (c) Representative blots; Densitometric analysis was made on the expressions of p53 (7F5) (d); active caspase-3 (e); active caspase-9 (f) and cytochrome C (g). β-Actin was used as the loading control. Data are expressed as the mean ± SD from three independent experiments (* p < 0.05, ** p < 0.01 compared with the control group).
(a)

183
Figure 6. Cont.
(b)
(c) (d)
(e)

184
Figure 6. Cont.
(f) (g)
Figure 7. DADS down-regulated RAF/MEK/ERK pathway in ECA109 xenograft tumor. The protein expression levels of RAF1, MEK1, phosphor-MEK1 (p-MEK1), ERK1/2 and p-ERK1/2 from the negative control group, 20 mg/kg DADS group and 40 mg/kg DADS group were assessed by western blot analysis. (a) Representative blots. Densitometric analysis was made on the expressions of RAF1 (b); MEK1 (c); pMEK1 (d); ERK1/2 (e) and pERK1/2 (f). β-Actin was used as the loading control. Data are expressed as the mean ± SD from three independent experiments (** p < 0.01 compared with the control group).
(a) (b)

185
(c) (d) Figure 7. Cont.
(e) (f)
2.7. Discussion
DADS, a lipid-soluble organic compound isolated from garlic, is a potentially useful agent for cancer prevention and therapy, as it has the ability to reactivate the expression of genes in differentiation, cell cycle regulation, apoptosis and so on [10,12,15,16]. By using MTT assay, DADS showed a dose-dependent anti-viability effect on ECA109 cells in vitro. The viability inhibitory properties of DADS were attributed to its induction of apoptosis in human esophageal carcinoma ECA109 cells (Figures 1–3). Moreover, we demonstrated that DADS had much lower cytotoxicity to normal liver cells L02 in comparison with ECA109 carcinoma cells (Figure 1). In addition, as the data showed that DDP had greater effect on ECA109 cells than DADS in vitro (Figure 2), we used DDP as the positive control in an in vivo study.
Studies of xenograft tumors represent well-established preclinical animal models for evaluating anticancer effects of test agents in vivo. Therefore, additional studies are warranted to check the effects of DADS by using animal models [11,14,17–19]. Researchers have injected DADS in nude mice at 30–200 mg/kg body wt intraperitoneally [17–19]. Consistent with these data, we selected suitable doses of DADS at 20 and 40 mg/kg body weight. Our study showed that DADS treatment inhibited the growth of ECA109 tumors in volume and weight at the two dosages used (Figure 4a,b). Importantly, intraperitoneal injections of DADS for eight times showed no apparent signs of toxicity. However, the data indicated that there was a significant loss of body weight in the DDP positive control group compared with the negative control group and DADS therapy groups (Figure 4c). Although we did not find a stronger anti-cancer effect of DADS compared to the traditional chemotherapy agent DDP, our study indicated that DADS could suppress the growth of ECA109 xenograft tumor effectively and had fewer side effects than DDP. Moreover, our data showed that DADS decreased the expression of tumor proliferation biomarker PCNA in the 20 and 40 mg/kg DADS groups (Figure 5a,b). Therefore, we suggest that DADS might be a promising candidate drug for esophageal carcinoma patients.
Apoptosis is programmed cell death that plays a major role during cancer treatment [20]. DADS has the ability to induce apoptosis of some human tumor cells. However, the apoptosis induced by DADS involves different apoptotic genes and proteins depending on the cell types of different

186
tumors [15,16]. The effects of DADS on esophageal carcinoma are still unclear, especially in vivo. Our study proved the apoptosis effect of DADS on ECA109 cells by using several methods. First, under light microscope, we observed morphology changes of apoptosis, such as membrane blebbing and formation of apoptotic bodies in the 20 and 40 μg/mL DADS groups, and cellular shrinkage, poor adherence and floating shapes in the 80 μg/mL DADS group (Figure 3a). Second, we detected the apoptosis rate by the double-staining of Annexin V-FITC and PI. Our results revealed that DADS induced the apoptosis of ECA109 cells in a dose-dependent manner (Figure 3b,c). In addition, the study indicated that DADS might inhibit the viability of ECA109 cells by promoting apoptosis.
Apoptosis signals are controlled by two distinct pathways, including the extrinsic pathway (death receptor pathway) and the intrinsic pathway (mitochondrial pathway) [21]. Caspases are cysteine proteases that play pivotal roles in apoptosis. Fourteen caspases have been identified based on their functions, which are divided into two groups (initiator caspases and effector caspases) [22]. Initiator caspases (caspase-2, -8, -9, and -10) are activated as a result of protein complex formation [23]. In the death receptor pathway, the activation of the death receptor leads to initiation of a caspase cascade by caspase-8. The mitochondrial pathway is characterized by the release of cytochrome C from mitochondria and the activation of a caspase cascade through caspase-9 [24]. Caspase-3, -6 and -7 function as executioners. Caspase-3 is a crucial executor that cleaves various substrates related to apoptosis [23,25]. Most of the apoptosis procedures induced by DADS are executed by caspase-3. However, some kinds of apoptosis are independent with caspase-3 [26–29]. In order to prove the apoptosis of DADS on ECA109 cells, we studied caspase-3 by qPCR and western blot in vitro and in vivo, as well as by immunohistochemical assay of xenograft tumor in vivo. Our results showed that the apoptosis of DADS was caspase-dependent, since caspase-3 was active during this procedure (Figures 5a,c and 6a,c,e) and that the pre–treatment with caspase-3 inhibitor (Ac-DEVD-CHO) could dramatically block the apoptosis induced by DADS (Figure 3b,d). Besides, many agents can activate cellular apoptotic programs through the mitochondria pathway, which triggers changes in regulatory factors [10]. Some soluble proteins including cytochrome C and Apaf-1, which can combine with caspase-9 to form the apoptosome, are released from the mitochondrial intermembrane space, and subsequently initiate an apoptosis cascade [30]. The mechanisms of apoptosis induced by DADS are different in various cells of different carcinomas. DADS induces apoptosis and promotes the activities of caspase-8 and caspase-9 in human colon cancer cell line (COLO 205) [26]. However, in the present study, our results of qPCR and western blot indicated that the activations of caspase-9 and caspase-3 as well as the release of cytochrome C from mitochondria to cytoplasm were stimulated in DADS groups (Figure 6a,c,f,g), which were involved in the typical mitochondrial apoptosis pathway [24]. Hence, these data suggested that the apoptosis effect induced by DADS on ECA109 cells was caspase-dependent in vitro as well as in vivo. In addition, our results indicated that one central mechanism of the apoptosis inducing by DADS in esophageal xenograft tumor was the activation of the mitochondrial pathway, but not the death receptor pathway.
The activation of caspases has a close relationship with the transduction of apoptosis signalling. P53 is known to inhibit cell proliferation and induce caspase-mediated apoptosis. Bax is a key target of p53 transcription factor in apoptosis [31]. Bcl-2, an antiapoptotic protein, is able to bind

187
and inactivate Bax to modulate tumor cells responding apoptosis [32]. P53 and the Bax/Bcl-2 ratio play important roles in the apoptotic process. The molecular mechanisms of DADS on various carcinomas are still a matter of debate. DADS could up-regulate the p53 level to take part in the apoptotic processes of melanoma in the B16F-10 cell line and human cervical cancer Ca Ski cell line [33,34]. However, the effect of DADS is independent of p53 activity in the osteosarcoma Saos-2 cell line [35]. Moreover, p53 is increased in the colon cancer COLO 205 cell line, and is decreased in the colon cancer SW480 cell line by DADS treatment [26,36]. These experiments have indicated that DADS has various peculiarities in the treatment of different carcinomas. Moreover, even different cell lines of the same carcinoma are probably not alike under DADS treatment. P53 has been found to mutate in 83% esophageal squamous cell carcinomas [2], while p53 is highly expressed in the ECA109 cell line [37]. In the present study, our results of qPCR and Western blot suggested that DADS could enhance p53 expression levels in the two dosages of DADS groups, especially in the 40 mg/kg DADS group (Figure 6a,c,d). By qPCR assay, we found that mRNA expression levels of Bcl-2 were down-regulated in the two DADS groups, whereas the expression level of Bax was up-regulated in the 40 mg/kg DADS group (Figure 6a). Moreover, our data indicated the significant increase of the Bax/Bcl-2 ratio in the 40 mg/kg DADS group (Figure 6b), leading to the pro-apoptosis of ECA109 cells. Based on these observations, our study showed that the up-regulations of p53 expression levels and the Bax/Bcl-2 ratio were involved in DADS-induced cell death.
The RAF/mitogen-activated protein kinase/extracellular signal-regulated kinase (RAF/MEK/ERK) pathway plays a prominent role in the regulation of cell growth [38]. The RAF/MEK/ERK pathway can be affected by the activation of p53 [39]. ERK is a downstream component of conserved signaling module activated by the serine/threonine kinase, RAF. RAF can be recruited to the cellular membrane and activate MEK, which phosphorylates and activates ERK in turn [38]. ERK phosphorylation may control transcription by targeting several different regulators such as transcription factors and histone proteins, which result in proliferation, differentiation and protection against apoptosis [40]. DADS has been shown to be a histone deacetylase (HDAC) inhibitor, which has the ability to affect the growth and survival of tumor cells [12]. Although some studies have indicated that DADS inhibits the phosphorylation of ERK1/2 during the apoptotic processes of the human leukemia HL-60 cell line and human colon cancer COLO 205 cell line [16,41], other studies have shown that DADS activates ERK1/2 in human non-small cell lung cancer H1299 cell line and human nasopharyngeal carcinoma CNE2 cell line [15,42]. Moreover, DADS has no influence on ERK1/2 in apoptosis of the human prostate carcinoma DU145 cell line [10]. In the present study, our western blot results showed that the expression levels of RAF1, phosphor-MEK1 (p-MEK1), ERK1/2 and p-ERK1/2 were inhibited in both the 20 and 40 mg/kg DADS groups (Figure 7a,b,d–f), and that the expression level of MEK1 was down-regulated in the 40 mg/kg DADS group (Figure 7a,c). Based on these findings, it seemed that the down-regulation of the RAF/MEK/ERK signaling pathway contributed to the apoptosis induced by DADS in the ECA109 xenograft tumor. Moreover, the RAF/MEK/ERK pathway might be a valuable therapy target for esophageal carcinoma in the future.

188
3. Experimental Section
3.1. Reagents and Antibodies
ECA109 human esophageal carcinoma cell line and L02 human normal liver cell line were purchased from the Chinese Academy of Shanghai Institute of Cell Biology. DADS and DDP were purchased from Sigma–Aldrich Chemical Company, St. Louis, MO, USA. DMSO, MTT, propidium iodide (PI), phosphate buffered saline (PBS) were purchased from Sigma–Aldrich. Fetal bovine serums (FBS), RPMI-1640 medium and 0.25% trypsin were purchased from Hyclone Company, Logan, UT, USA. Trizol was purchased from Invitrogen, Grand Island, NY, USA. Annexin V-FITC apoptosis kit was purchased from Roche Technology Company, Branchburg, NJ, USA. PrimeScript™ RT Master Mix kit and SYBR® Premix Ex Taq II kit were purchased from Takara Technology Company, Sakado-shi, Saitama, JAPAN. Enhanced chemiluminescence (ECL) kit was purchased from Amersham Life Science, Arlington Heights, UK. Materials and chemicals used for electrophoresis were obtained from Bio-Rad Laboratories, Hercules, CA, USA. ProteoJET cytoplasmic Protein Extraction kit was purchased from Fermentas, Pittsburgh, PA, USA. Antibodies to RAF1, MEK1, phosphor-MEK1 (p-MEK1), ERK1/2, phosphor-ERK1/2 (p-ERK1/2), p53 (7F5), caspase-3, active caspase-3, caspase-9, active caspase-9, cytochrome C and proliferation cell nuclear antigen (PCNA) were purchased from Cell Signaling Technology Company, Danvers, MA, USA. The β-actin antibody was purchased from Santa Cruz Biotechnology, Dallas, TX, USA. Horseradish peroxidase- (HRP-) coupled goat anti-mouse IgG and anti-rabbit IgG (secondary antibody) were purchased from Santa Cruz Biotechnology.
3.2. Cell Culture
Human esophageal carcinoma cell line ECA109 and human normal liver cell line L02 were cultured in RPMI-1640 supplemented with 10% FBS under standard culture condition (37 °C, 95% humidified air and 5% CO2). Exponentially growing ECA109 cells were used for all assays.
3.3. Cell Viability Assay
Cell viability was tested by MTT assay. ECA109 cells and L02 cells were seeded in 96-well plates at 1 × 10⁴ cells/well and incubated with DADS or DDP (10–60 μg/mL) in five replicates for 24 h. Cells treated with PBS with DMSO and in absence of DADS were used as the negative control. After the incubation, 5 mg/mL MTT reagent (20 μL) was added into each well, followed by the addition of 150 μL DMSO. The plates were measured at 570 nm (A570) by spectrophotometer. The percentage of cell viability inhibition rate was calculated according to the following formula:
Cell viability (%) = 1 − [(A570 (control) − A570 (sample)/A570 (control)] × 100% (4)
3.4. Apoptosis Assay
The apoptosis rate was determined by using an Annexin V-FITC detection kit. ECA109 cells of 5 × 10⁵ were incubated with different concentrations of DADS (0, 20, 40 μg/mL) and 10 μM

189
caspase-3 inhibitor (Ac-DEVD-CHO) with DADS for 24 h. The cells were resuspended in 100 μL binding buffer at 1 × 10⁶ cells/mL, and incubated with 5 μL Annexin V-FITC and 10 μL PI for 15 min in the dark. Then, these cells were added into 400 μL binding buffer and measured by flow cytometer. Apoptosis was analyzed by Cell Quest software (BD Biosciences, San Jose, CA, USA).
3.5. Xenograft Tumor Assay in Vivo
Female BALB/c nude mice (4–6 weeks old) were purchased from Beijing Experimental Animal Center. These mice were handled according to the Guidelines for the Care and Use of Laboratory Animals with the approval of the Medical Ethics Committee of the Second Affiliated Hospital of Xi’an Jiaotong University (ID: 2012120, 01 November 2012). Exponentially growing ECA109 cells of 5 × 10⁶ were suspended in 200 μL RPMI–1640 and injected subcutaneously into the flank of each mouse. After growth for three weeks, all the mice developed palpable tumors. Twenty-four mice were randomly divided into four groups (n = 6 per group). The intraperitoneal injections of PBS with DMSO and in absence of DADS as the negative control group, DADS at 20 and 40 mg/kg body weight as therapy groups, DDP at 2 mg/kg body weight as the positive control group were made every three days for eight times. Tumors were monitored every three days by measuring length and width with a vernier caliper (tumor volume = 0.5 × L × W2). All the mice were sacrificed three days after the last injection and the xenograft tumors were observed and measured.
3.6. Immunohistochemical Staining
Tumor samples were formalin-fixed and paraffin-embedded. Paraffin blocks were cut serially at 5 μm thick. The sections were incubated with a specific primary antibody, such as PCNA (1:100) and caspase-3 (1:100), for 1 h at 37 °C followed by the overnight incubation at 4 °C in humidity chamber. Then, they were incubated with an appropriate biotinylated secondary antibody (1:200–1:400) followed by conjugated horseradish peroxidase–streptavidin and 3,3'-diaminobenzidine working solution, and then counterstained with hematoxylin. Immunoreactive cells (yellow to brown) were enumerated and analyzed by Media Cybernetics Image-Pro Plus analysis system linked to Olympus microscope. The total number of cells was presented from five randomly selected microscopic fields of every sample in each group (×400).
3.7. Quantitative Real-Time PCR
Total RNA was extracted from each tumor sample by Trizol method, and the quantity of RNA was assessed by spectrophotometry. The cDNA was obtained by reverse transcription with 1 μg total RNA by using PrimeScript™ RT Master Mix kit. qPCR was made with SYBR Premix Ex Taq™ II Perfect Real Time kit. All the reactions were performed on ABI qPCR System. The individual value was normalized by the loading control, β-actin. The mRNA expression was expressed as fold, and comparative cycle threshold (Ct) method was used to study the relative quantification of gene expression. Sequences of gene primers were listed in Table 1.

190
3.8. Western Blot Assay
ECA109 xenograft tumors of the negative control group and the two DADS groups were washed with cold PBS and homogenized in RIPA lysis buffer. The homogenates were centrifuged at 10,000× g for 10 min at 4 °C, and supernatants were collected as total proteins. Moreover, cytoplasmic proteins were prepared by using ProteoJET cytoplasmic Protein Extraction kit according to the manufacturer’s instruction.
The proteins were separated by 8%–12% sodium dodecyl sulfate-polyacrylamide gel electrophoresis (SDS-PAGE), transferred to polyvinylidene difluoride (PVDF) membrane, and probed with a specific primary antibody, such as RAF1 (1:1000), MEK1 (1:1000), p-MEK1 (1:500), ERK1/2 (1:1000), p-ERK1/2 (1:300), caspase-3 (1:1000), active caspase-3 (1:500), caspase-9 (1:1000), active caspase-9 (1:500), cytochrome C, p53 (7F5) (1:1000) and β-actin (1:1000), followed by an appropriate peroxidase–conjugated secondary antibody (1:5000–1:10,000). The individual value was normalized by the loading control, β-actin. Antigen-antibody complex signals were visualized using BeyoECL Plus (Amersham Life Science). In addition, densitometric analysis was performed by Image J software (National Institutes of Health, Bethesda, MD, USA).
3.9. Quantification and Statistic Analysis
Quantitative data were expressed as the mean ± SD from at least three independent experiments. The two-tailed student’s t-test was performed for paired samples, and one-way ANOVA or two-factor factorial ANOVA was used for multiple groups. The p value less than 0.05 was considered significant. Statistical analyses were performed by SPSS 17.0 statistics software (IBM, Armonk, NY, USA).
4. Conclusions
In summary, the present study demonstrated that DADS suppresses esophageal tumors without any apparent signs of toxicity, which is in agreement with a strong increase of apoptosis both in vitro and in vivo. DADS inhibits ECA109 tumor proliferation through the down-regulation of PCNA. Moreover, DADS induces apoptosis by activating the mitochondria-dependent pathway executed by caspase-3, increasing p53 expression level and the Bax/Bcl-2 ratio, and down-regulating the RAF/MEK/ERK pathway in ECA109 xenograft tumors. Overall, our studies of DADS in cell culture and animal models indicate that DADS is a potentially effective and safe anti-cancer agent for esophageal carcinoma treatment.
Acknowledgments
This study was supported by the Fund for Science and Technology Program of Shaanxi Province (No. 2010K01-141 and No. 2011K13-02-05) and the Important Clinic Project of the Chinese Ministry of Health (No. 2007353). This work was supported by the Research Center of the Second Affiliated Hospital of Xi’an Jiaotong University. The authors are grateful to Zongfang Li and Ke Li for their technical assistances.

191
Author Contributions
Xiaoran Yin, Cheng Feng and Dong Liu performed the majority of the experiments; Jun Zhang and Xiaoning Li provided vital reagents and analytical tools, as well as revised the manuscript; Xiaoran Yin and Hongbing Ma designed the study and wrote the manuscript.
Conflicts of Interest
The authors declare no conflict of interest.
References
1. Liu, R.; Peng, Y.; Li, X.; Wang, Y.; Pan, E.; Guo, W.; Pu, Y.; Yin, L. Identification of plasma metabolomic profiling for diagnosis of esophageal squamous-cell carcinoma using an UPLC/TOF/MS platform. Int. J. Mol. Sci. 2013, 14, 8899–8911.
2. Song, Y.; Li, L.; Ou, Y.; Gao, Z.; Li, E.; Li, X.; Zhang, W.; Wang, J.; Xu, L.; Zhou, Y.; et al. Identification of genomic alterations in oesophageal squamous cell cancer. Nature 2014, 509, 91–95.
3. Cui, X.; Zhao, Z.; Liu, D.; Guo, T.; Li, S.; Hu, J.; Liu, C.; Yang, L.; Cao, Y.; Jiang, J.; et al. Inactivation of miR-34a by aberrant CpG methylation in Kazakh patients with esophageal carcinoma. J. Exp. Clin. Cancer Res. 2014, 33, 20.
4. Shen, Z.T.; Wu, X.H.; Li, B.; Shen, J.S.; Wang, Z.; Li, J.; Zhu, X.X. Nedaplatin concurrent with three-dimensional conformal radiotherapy for treatment of locally advanced esophageal carcinoma. World J. Gastroenterol. 2013, 19, 9447–9452.
5. Yeruva, L.; Elegbede, J.A.; Carper, S.W. Methyl jasmonate decreases membrane fluidity and induces apoptosis through tumor necrosis factor receptor 1 in breast cancer cells. Anti-Cancer Drugs 2008, 19, 766–776.
6. Eswar, K.; Venkateshbabu, N.; Rajeswari, K.; Kandaswamy, D. Dentinal tubule disinfection with 2% chlorhexidine, garlic extract, and calcium hydroxide against Enterococcus faecalis by using real-time polymerase chain reaction: In vitro study. J. Conserv. Dent. 2013, 16, 194–198.
7. Truong, D.; Hindmarsh, W.; O’Brien, P.J. The molecular mechanisms of diallyl disulfide and diallyl sulfide induced hepatocyte cytotoxicity. Chem. Biol. Interact. 2009, 180, 79–88.
8. Lee, I.C.; Kim, S.H.; Baek, H.S.; Moon, C.; Kim, S.H.; Kim, Y.B.; Yun, W.K.; Kim, H.C.; Kim, J.C. Protective effects of diallyl disulfide on carbon tetrachloride-induced hepatotoxicity through activation of Nrf2. Environ. Toxicol. 2013, doi:10.1002/tox.21930. Available online: http://onlinelibrary.wiley.com/doi/10.1002/tox.21930/abstract;jsessionid=1C5EEE912870EFFD9CEB32D9B9CFC1D2.f02t04?deniedAccessCustomisedMessage=&userIsAuthenticated=false (accessed on 1 December 2013).
9. Alam, M.; Zubair, S.; Farazuddin, M.; Ahmad, E.; Khan, A.; Zia, Q.; Malik, A.; Mohammad, O. Development, characterization and efficacy of niosomal diallyl disulfide in treatment of disseminated murine candidiasis. Nanomed. Nanotechnol. Biol. Med. 2013, 9, 247–256.

192
10. Shin, D.Y.; Kim, G.Y.; Lee, J.H.; Choi, B.T.; Yoo, Y.H.; Choi, Y.H. Apoptosis induction of human prostate carcinoma DU145 cells by diallyl disulfide via modulation of JNK and PI3K/AKT signaling pathways. Int. J. Mol. Sci. 2012, 13, 14158–14171.
11. Tang, H.; Kong, Y.; Guo, J.; Tang, Y.; Xie, X.; Yang, L.; Su, Q.; Xie, X. Diallyl disulfide suppresses proliferation and induces apoptosis in human gastric cancer through Wnt-1 signaling pathway by up-regulation of miR-200b and miR-22. Cancer Lett. 2013, 340, 72–81.
12. Myzak, M.C.; Dashwood, R.H. Histone deacetylases as targets for dietary cancer preventive agents: Lessons learned with butyrate, diallyl disulfide, and sulforaphane. Curr. Drug Targets 2006, 7, 443–452.
13. Jun, Z.; Suzuki, M.; Xiao, J.; Wen, J.; Talbot, S.G.; Li, G.C.; Xu, M. Comparative effects of natural and synthetic diallyl disulfide on apoptosis of human breast-cancer MCF-7 cells. Biotechnol. Appl. Biochem. 2009, 52, 113–119.
14. Lai, K.C.; Kuo, C.L.; Ho, H.C.; Yang, J.S.; Ma, C.Y.; Lu, H.F.; Huang, H.Y.; Chueh, F.S.; Yu, C.C.; Chung, J.G. Diallyl sulfide, diallyl disulfide and diallyl trisulfide affect drug resistant gene expression in colo 205 human colon cancer cells in vitro and in vivo. Phytomed. Int. J. Phytother. Phytopharmacol. 2012, 19, 625–630.
15. Hui, C.; Jun, W.; Ya, L.N.; Ming, X. Effect of Allium sativum (garlic) diallyl disulfide (DADS) on human non-small cell lung carcinoma H1299 cells. Trop. Biomed. 2008, 25, 37–45.
16. Tan, H.; Ling, H.; He, J.; Yi, L.; Zhou, J.; Lin, M.; Su, Q. Inhibition of ERK and activation of p38 are involved in diallyl disulfide induced apoptosis of leukemia HL-60 cells. Arch. Pharm. Res. 2008, 31, 786–793.
17. Liao, Q.J.; Su, J.; Zhou, X.T.; Tang, H.L.; Song, Y.; Su, Q. Inhibitory effect of diallyl disulfide on proliferation of human colon cancer cell line SW480 in nude mice. Chin. J. Cancer 2007, 26, 828–832. (In Chinese)
18. Xiang, S.L.; Xiao, X.L.; Ling, H.; Liao, Q.J.; Zhou, X.T.; Dong, L.; Su, Q. Antitumor effect of diallyl disulfide on human gastric cancer MGC803 cells xenograft in nude mice. Chin. J. Cancer 2005, 24, 940–944. (In Chinese)
19. Zhao, J.; Huang, W.G.; He, J.; Tan, H.; Liao, Q.J.; Su, Q. Diallyl disulfide suppresses growth of HL-60 cell through increasing histone acetylation and p21WAF1 expression in vivo and in vitro. Acta Pharmacol. Sin. 2006, 27, 1459–1466.
20. Haneji, T.; Hirashima, K.; Teramachi, J.; Morimoto, H. Okadaic acid activates the PKR pathway and induces apoptosis through PKR stimulation in MG63 osteoblast-like cells. Int. J. Oncol. 2013, 42, 1904–1910.
21. Ozoren, N.; El-Deiry, W.S. Cell surface death receptor signaling in normal and cancer cells. Semin. Cancer Biol. 2003, 13, 135–147.
22. Jin, Z.; El-Deiry, W.S. Overview of cell death signaling pathways. Cancer Biol. Ther. 2005, 4, 139–163.
23. Olsson, M.; Zhivotovsky, B. Caspases and cancer. Cell Death Differ. 2011, 18, 1441–1449.

193
24. Thomas, S.A.; Vasudevan, S.; Thamkachy, R.; Lekshmi, S.U.; Santhoshkumar, T.R.; Rajasekharan, K.N.; Sengupta, S. Upregulation of DR5 receptor by the diaminothiazole DAT1 [4-amino-5-benzoyl-2-(4-methoxy phenyl amino) thiazole] triggers an independent extrinsic pathway of apoptosis in colon cancer cells with compromised pro and antiapoptotic proteins. Apoptosis Int. J. Program. Cell Death 2013, 18, 713–726.
25. Zheng, T.S.; Hunot, S.; Kuida, K.; Momoi, T.; Srinivasan, A.; Nicholson, D.W.; Lazebnik, Y.; Flavell, R.A. Deficiency in caspase-9 or caspase-3 induces compensatory caspase activation. Nat. Med. 2000, 6, 1241–1247.
26. Yang, J.S.; Chen, G.W.; Hsia, T.C.; Ho, H.C.; Ho, C.C.; Lin, M.W.; Lin, S.S.; Yeh, R.D.; Ip, S.W.; Lu, H.F.; et al. Diallyl disulfide induces apoptosis in human colon cancer cell line (COLO 205) through the induction of reactive oxygen species, endoplasmic reticulum stress, caspases casade and mitochondrial-dependent pathways. Food Chem. Toxicol. 2009, 47, 171–179.
27. Nagaraj, N.S.; Anilakumar, K.R.; Singh, O.V. Diallyl disulfide causes caspase-dependent apoptosis in human cancer cells through a Bax-triggered mitochondrial pathway. J. Nutr. Biochem. 2010, 21, 405–412.
28. Altonsy, M.O.; Habib, T.N.; Andrews, S.C. Diallyl disulfide-induced apoptosis in a breast-cancer cell line (MCF-7) may be caused by inhibition of histone deacetylation. Nutr. Cancer 2012, 64, 1251–1260.
29. Gayathri, R.; Gunadharini, D.N.; Arunkumar, A.; Senthilkumar, K.; Krishnamoorthy, G.; Banudevi, S.; Vignesh, R.C.; Arunakaran, J. Effects of diallyl disulfide (DADS) on expression of apoptosis associated proteins in androgen independent human prostate cancer cells (PC-3). Mol. Cell. Biochem. 2009, 320, 197–203.
30. Sun, K.W.; Ma, Y.Y.; Guan, T.P.; Xia, Y.J.; Shao, C.M.; Chen, L.G.; Ren, Y.J.; Yao, H.B.; Yang, Q.; He, X.J. Oridonin induces apoptosis in gastric cancer through Apaf-1, cytochrome c and caspase-3 signaling pathway. World J. Gastroenterol. 2012, 18, 7166–7174.
31. Liu, J.; Qin, C.K.; Lv, W.; Zhao, Q.; Qin, C.Y. OSU-03012, a non-Cox inhibiting celecoxib derivative, induces apoptosis of human esophageal carcinoma cells through a p53/Bax/cytochrome c/caspase-9-dependent pathway. Anti-Cancer Drugs 2013, 24, 690–698.
32. Produit-Zengaffinen, N.; Pournaras, C.J.; Schorderet, D.F. Retinal ischemia-induced apoptosis is associated with alteration in Bax and Bcl-x(L) expression rather than modifications in Bak and Bcl-2. Mol. Vis. 2009, 15, 2101–2110.
33. Pratheeshkumar, P.; Thejass, P.; Kutan, G. Diallyl disulfide induces caspase-dependent apoptosis via mitochondria-mediated intrinsic pathway in B16F-10 melanoma cells by up-regulating p53, caspase-3 and down-regulating pro-inflammatory cytokines and nuclear factor-kappabeta-mediated Bcl-2 activation. J. Environ. Pathol. Toxicol. Oncol. 2010, 29, 113–125.
34. Lin, Y.T.; Yang, J.S.; Lin, S.Y.; Tan, T.W.; Ho, C.C.; Hsia, T.C.; Chiu, T.H.; Yu, C.S.; Lu, H.F.; Weng, Y.S.; et al. Diallyl disulfide (DADS) induces apoptosis in human cervical cancer Ca Ski cells via reactive oxygen species and Ca2+-dependent mitochondria-dependent pathway. Anticancer Res. 2008, 28, 2791–2799.

194
35. Masuelli, L.; Marzocchella, L.; Focaccetti, C.; Tresoldi, I.; Palumbo, C.; Izzi, V.; Benvenuto, M.; Fantini, M.; Lista, F.; Tarantino, U.; et al. Resveratrol and diallyl disulfide enhance curcumin-induced sarcoma cell apoptosis. Front. Biosci. 2012, 17, 498–508.
36. Liao, Q.J.; Su, J.; He, J.; Song, Y.; Tang, H.L.; Su, Q. Effect of diallyl disulfide on cell cycle arrest of human colon cancer SW480 cells. Chin. J. Cancer 2009, 28, 138–141. (In Chinese)
37. Wang, T.T.; Wang, S.K.; Huang, G.L.; Sun, G.J. Luteolin induced-growth inhibition and apoptosis of human esophageal squamous carcinoma cell line Eca109 cells in vitro. Asian Pac. J. Cancer Prev. 2012, 13, 5455–5461.
38. Ciccarelli, A.; Giustetto, M. Role of ERK signaling in activity-dependent modifications of histone proteins. Neuropharmacology 2014, 80C, 34–44.
39. Bhalla, S.; Evens, A.M.; Dai, B.; Prachand, S.; Gordon, L.I.; Gartenhaus, R.B. The novel anti-MEK small molecule AZD6244 induces BIM-dependent and AKT-independent apoptosis in diffuse large B-cell lymphoma. Blood 2011, 118, 1052–1061.
40. Lv, C.; Sun, W.; Sun, H.; Wei, S.; Chen, R.; Wang, B.; Huang, C. Asperolide A, a marine-derived tetranorditerpenoid, induces G2/M arrest in human NCI-H460 lung carcinoma cells, is mediated by p53–p21 stabilization and modulated by Ras/Raf/MEK/ERK signaling pathway. Mar. Drugs 2013, 11, 316–331.
41. Lai, K.C.; Hsu, S.C.; Kuo, C.L.; Yang, J.S.; Ma, C.Y.; Lu, H.F.; Tang, N.Y.; Hsia, T.C.; Ho, H.C.; Chung, J.G. Diallyl sulfide, diallyl disulfide, and diallyl trisulfide inhibit migration and invasion in human colon cancer colo 205 cells through the inhibition of matrix metalloproteinase-2, -7, and -9 expressions. Environ. Toxicol. 2013, 28, 479–488.
42. Zhang, Y.W.; Wen, J.; Xiao, J.B.; Talbot, S.G.; Li, G.C.; Xu, M. Induction of apoptosis and transient increase of phosphorylated MAPKs by diallyl disulfide treatment in human nasopharyngeal carcinoma CNE2 cells. Arch. Pharm. Res. 2006, 29, 1125–1131.

195
4-Hydroxyphenylacetic Acid Attenuated Inflammation
and Edema via Suppressing HIF-1α in Seawater
Aspiration-Induced Lung Injury in Rats
Zhongyang Liu, Ronggang Xi, Zhiran Zhang, Wangping Li, Yan Liu,
Faguang Jin and Xiaobo Wang
Abstract: 4-Hydroxyphenylacetic acid (4-HPA) is an active component of Chinese herb Aster tataricus which had been widely used in China for the treatment of pulmonary diseases. The aim of this study is to investigate the effect of 4-HPA on seawater aspiration-induced lung injury. Pulmonary inflammation and edema were assessed by enzyme-linked immunosorbent assay (ELISA), bronchoalveolar lavage fluid (BALF) white cell count, Evans blue dye analysis, wet to dry weight ratios, and histology study. Hypoxia-inducible factor-1α (HIF-1α) siRNA and permeability assay were used to study the effect of 4-HPA on the production of inflammatory cytokines and monolayer permeability in vitro. The results showed that 4-HPA reduced seawater instillation-induced mortality in rats. In lung tissues, 4-HPA attenuated hypoxia, inflammation, vascular leak, and edema, and decreased HIF-1α protein level. In primary rat alveolar epithelial cells (AEC), 4-HPA decreased hypertonicity- and hypoxia-induced HIF-1α protein levels through inhibiting the activations of protein translational regulators and via promoting HIF-1α protein degradation. In addition, 4-HPA lowered inflammatory cytokines levels through suppressing hypertonicity- and hypoxia-induced HIF-1α in NR8383 macrophages. Moreover, 4-HPA decreased monolayer permeability through suppressing hypertonicity and hypoxia-induced HIF-1α, which was mediated by inhibiting vascular endothelial growth factor (VEGF) in rat lung microvascular endothelial cell line (RLMVEC). In conclusion, 4-HPA attenuated inflammation and edema through suppressing hypertonic and hypoxic induction of HIF-1α in seawater aspiration-induced lung injury in rats.
Reprinted from Int. J. Mol. Sci. Cite as: Liu, Z.; Xi, R..; Zhang, Z.; Li, W.; Liu, Y.; Jin, F.; Wang, X. 4-Hydroxyphenylacetic Acid Attenuated Inflammation and Edema via Suppressing HIF-1α in Seawater Aspiration-Induced Lung Injury in Rats. Int. J. Mol. Sci. 2014, 15, 12861-12884.
1. Introduction
Drowning, one of the three leading causes of unintentional injury death, is a major but often neglected public health problem [1]. The acute lung injury (ALI) is a serious body injuries induced by water aspiration. Some ALI induced by near-drowning would deteriorate into acute respiratory distress syndrome (ARDS) without proper treatments [2–4]. A recent study showed that ALI induced by seawater aspiration is severer than that by freshwater, the reason of which could concern osmotic pressure [5]. Hypoxia and hypertonicity are the two impact factors in seawater aspiration-induced ALI which had an acuter and rapider course than that induced by lipopolysaccharide (LPS) [4,6–8]. Besides mechanical ventilation [9–11], therapies which could attenuate the injuries in lungs at the early stage of seawater aspiration-induced ALI are required to prevent the occurrence of ARDS.

196
Hypoxia-inducible factor-1 (HIF-1) is a key transcription factor that mediates adaptive responses to changes in tissue oxygenation. It is a basic helix-loop-helix transcription factor that is composed of two subunits, HIF-1α and HIF-1β. HIF-1β is constitutively present, whereas HIF-1α protein is kept at a low or undetectable level by continuous HIF-prolyl hydroxylase domain (PHD) enzyme-mediated degradation which is suppressed by hypoxia [12]. More and more evidences have demonstrated that HIF-1α also responds to nonhypoxic stimuli such as hormones, growth factors, vasoactive peptides, cytokines, heat, LPS, and hypertonicity [13–16]. Furthermore, a previous study reported that LPS-induced lung injury could be inhibited by reducing HIF-1α expression [17]. Since both of the two impact factors, hypoxia and hypertonicity, in seawater aspiration-induced ALI affected HIF-1α which played important roles in inflammation and edema [18,19], HIF-1α could be a potential therapeutic target.
4-Hydroxyphenylacetic acid (4-HPA) is an active component of Chinese herb Aster tataricus (fan hun cao) which had been widely used in China for the treatment of pneumonia, HBV, and carcinoma [20–22]. Some previous studies reported that 4-HPA, a metabolite of aromatic amino acid catabolism that is secreted in saliva, controlled the NadA gene expression and could become a potential hypopigmenting agent [23–25]. We also found that Aster tataricus extract and 4-HPA could inhibit HIF-1α expression in our preliminary experiments. Therefore, we hypothesized that 4-HPA might attenuate ALI induced by seawater aspiration through inhibiting HIF-1α expression. The aim of this study is to investigate the effect of 4-HPA on seawater aspiration-induced lung injury.
2. Results
2.1. 4-Hydroxyphenylacetic Acid (4-HPA) Reduced Seawater Instillation-Induced Mortality in Rats
As shown in Figure 1, treatment with 4-hydroxyphenylacetic acid (4-HPA) significantly reduced seawater instillation-induced death, the accumulative mortalities during 12 h in middle dose (100 mg/kg) and high dose (150 mg/kg) of 4-HPA treatment groups were both significantly lower than that in the seawater instillation group (p < 0.05). However, the accumulative mortalities between middle and high does groups had no significant difference and no protection was observed when rats received 4-HPA treatment at dose of 50 mg/kg. Therefore, 100 mg/kg 4-HPA was used in the following studies.
2.2. 4-HPA Increased PaO2 and Decreased PaCO2 in Seawater Instillation Rats
The response of PaO2 and PaCO2 after instillation of seawater with or without treatment of 4-HPA at 0.5, 1, 2, 3, and 4 h was observed (Figure 2). The results showed that PaO2 dropped precipitously to its minimum at 0.5 h after instillation and then recovered gradually. The PaO2 of rats treated with both seawater instillation and 4-HPA were significantly higher (p < 0.05) than that treated with only seawater instillation at 2, 3, and 4 h. Similarly, 4-HPA decreased PaCO2 of rats instilled with seawater at 2, 3, and 4 h.

197
Figure 1. Effects of 4-hydroxyphenylacetic acid (4-HPA) on seawater instillation-induced mortality in rats. Drowning model rats were prepared with or without different does of 4-HPA (50, 100 or 150 mg/kg body weight, i.p.). 4-HPA was administered after seawater instillation for 10 min. The mortality of rats were recorded at 2, 4, 6, 8, 10, and 12 h after seawater instillation in each group (n = 20). * p < 0.05 vs. seawater group, # p < 0.01 vs. seawater group.
Figure 2. Effects of 4-HPA on PaO2 and PaCO2 after seawater instillation in rats. At 0, 0.5, 1, 2, 3, and 4 h after seawater instillation with or without 4-HPA treatment, blood samples were obtained from left carotid artery and then PaO2 (A) and PaCO2 (B) were measured by blood gas analyzer. Data are means ± standard deviation (SD) (n = 10), * p < 0.05 vs. seawater group.
(A)
(B)
Time (h)
Time (h)

198
2.3. 4-HPA Attenuated Inflammation, Vascular Leak, and Edema in Seawater Instillation-Induced Lung Injury in Rats
Inflammatory cytokines such as TNF-α, IL-1β, and IL-6 play important roles in the inflammatory response in lungs. Therefore, we detected the TNF-α (Figure 3A), IL-1β (Figure 3B), and IL-6 (Figure 3C) content to study the inflammatory response in lung tissues. After seawater instillation, the contents of TNF-α, IL-1β, and IL-6 increased at 2, 4, and 6 h (p < 0.05), and 4-HPA markedly inhibited the expression of these cytokines (p < 0.05). Additionally, the degrees of inflammation and vascular leakage in lungs were measured by bronchoalveolar lavage fluid (BALF) white cell count (Figure 3D) and Evans blue dye analysis (Figure 3E), and lung edema was assessed by wet to dry weight ratios (Figure 3F). Seawater instillation caused a significant increase in BALF white cell count, Evans blue dye analysis, and wet to dry weight ratios in seawater group compared with control (p < 0.05). However, administration with 4-HPA markedly reduced the three at 2, 4, and 6 h (p < 0.05). There was no significant difference in BALF white cell count, Evans blue dye analysis, and wet to dry weight ratios between control and 4-HPA groups in the absence of seawater instillation. The histological results showed that seawater aspiration after 4 h induced pulmonary edema, infiltration of inflammatory cells in the lung tissues and alveoli, and alveolar damage (Figure 3I). However, 4-HPA treatment could improve the lung injury (Figure 3J). There was no obvious change in the lung structure in control and 4-HPA groups (Figure 3G,H).
Figure 3. Effects of 4-HPA on inflammatory cytokines, vascular leakage, and edema after seawater instillation in lungs. After instillation of seawater for 0, 2, 4, and 6 h in the absence or presence of 4-HPA, TNF-α (A); IL-1β (B); and IL-6 (C) contents in lung tissues were assessed by ELISA and white cells in brochoalveolar lavage fluid (BALF) were counted (D); Pulmonary vascular leakage was determined by Evans blue dye analysis (E); Lung edema was assessed by wet to dry weight ratios (F); Lung tissues were stained with hematoxilin and eosin to reveal histopathological changes at 4 h after seawater aspiration. (G) Control group; (H) 4-HPA group; (I) Seawater group; and (J) Seawater + 4-HPA group. The data are presented as means ± SD from three independent experiments, * p < 0.05 vs. control group, # p < 0.05 vs. seawater group.
(A) (B)

199
Figure 3. Cont.
(C) (D)
(E) (F)
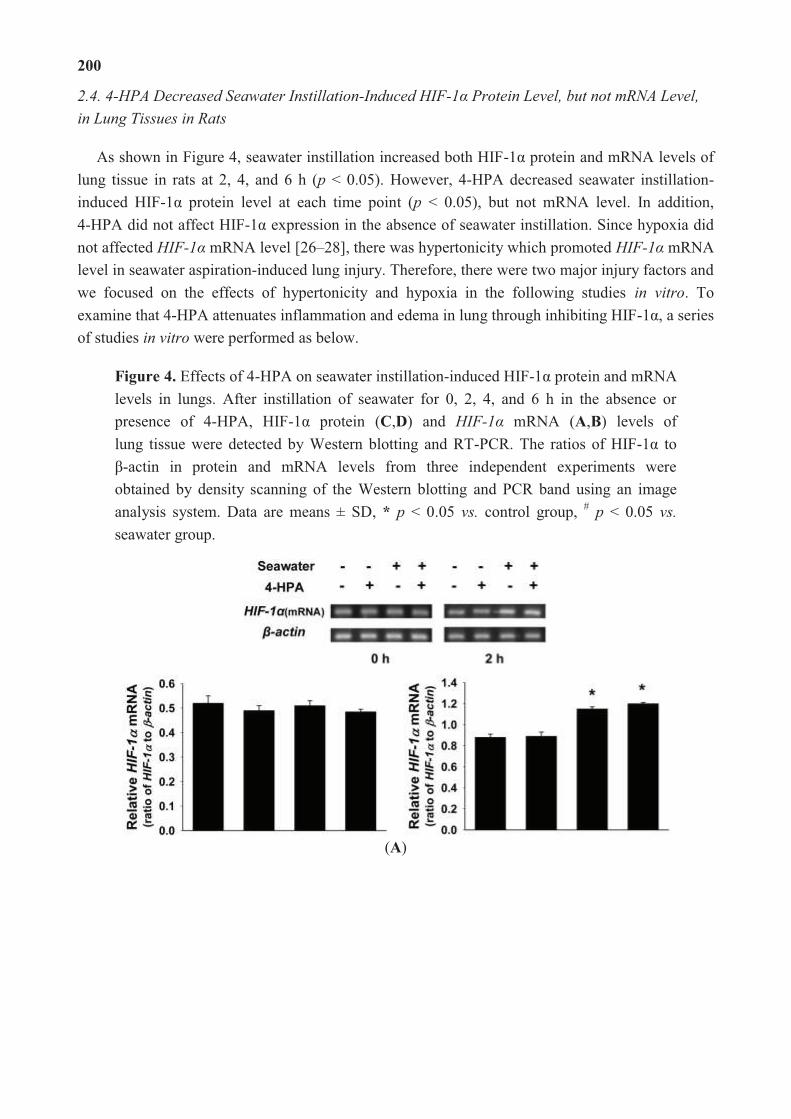
200
2.4. 4-HPA Decreased Seawater Instillation-Induced HIF-1α Protein Level, but not mRNA Level, in Lung Tissues in Rats
As shown in Figure 4, seawater instillation increased both HIF-1α protein and mRNA levels of lung tissue in rats at 2, 4, and 6 h (p < 0.05). However, 4-HPA decreased seawater instillation-induced HIF-1α protein level at each time point (p < 0.05), but not mRNA level. In addition, 4-HPA did not affect HIF-1α expression in the absence of seawater instillation. Since hypoxia did not affected HIF-1α mRNA level [26–28], there was hypertonicity which promoted HIF-1α mRNA level in seawater aspiration-induced lung injury. Therefore, there were two major injury factors and we focused on the effects of hypertonicity and hypoxia in the following studies in vitro. To examine that 4-HPA attenuates inflammation and edema in lung through inhibiting HIF-1α, a series of studies in vitro were performed as below.
Figure 4. Effects of 4-HPA on seawater instillation-induced HIF-1α protein and mRNA levels in lungs. After instillation of seawater for 0, 2, 4, and 6 h in the absence or presence of 4-HPA, HIF-1α protein (C,D) and HIF-1α mRNA (A,B) levels of lung tissue were detected by Western blotting and RT-PCR. The ratios of HIF-1α to β-actin in protein and mRNA levels from three independent experiments were obtained by density scanning of the Western blotting and PCR band using an image analysis system. Data are means ± SD, * p < 0.05 vs. control group, # p < 0.05 vs. seawater group.
(A)

201
Fgure 4. Cont.
(B)
(C)
(D)

202
2.5. 4-HPA Decreased Hypertonicity and Hypoxia-Induced HIF-1α Protein Level, but not mRNA Level, in Primary Rat Alveolar Epithelial Cells (AEC)
As shown in Figure 5, hypertonicity (25% seawater) together with hypoxia (3% O2) or hypertonicity alone promoted both HIF-1α protein and mRNA expression in primary rat alveolar epithelial cells (AEC) (p < 0.05). Moreover, hypertonicity and hypoxia synergistically increased HIF-1α protein level. However, hypoxia alone increased only HIF-1α protein (p < 0.05) but not mRNA level. 4-HPA decreased hypertonicity, hypoxia, and both of the two induced HIF-1α protein levels, but not mRNA levels (p < 0.05).
Figure 5. Effects of 4-HPA on hypertonicity, hypoxia, and both of the two induced HIF-1α protein and mRNA levels in primary AEC. Treated by hypertonicity, hypoxia, or both of the two with or without 4-HPA treatment for 4 h, primary rat alveolar epithelial cells (AEC) were harvested and HIF-1α protein and mRNA levels were assessed by Western blotting and RT-PCR. The ratios of HIF-1α to β-actin in protein and mRNA levels from three independent experiments were obtained by density scanning of the Western blotting and PCR band using an image analysis system. Data are means ± SD, * p < 0.05 vs. control group, # p < 0.05 vs. the groups with stimuli or stimulus in the absence of 4-HPA treatment.
2.6. 4-HPA Decreased Hypertonicity and Hypoxia-Induced HIF-1α Protein Level through Inhibiting the Activations of Protein Translational Regulators, Including p70S6K1, S6 Ribosomal Protein, 4E-BP1, and eIF4E in Primary AEC
Since 4-HPA did not decrease hypertonicity and hypoxia-induced HIF-1α protein level via the inhibition of its mRNA expression (Figure 5), posttranscriptional mechanisms were likely involved. As shown in Figure 6, hypertonicity together with hypoxia promoted the phosphorylation

203
but not the total protein levels of HIF-1α related translational regulators, including p70S6K1, S6 ribosomal protein, 4E-BP1, and eIF4E (p < 0.05), which were attenuated by 4-HPA treatment (p < 0.05) in AEC. Additionally, 4-HPA did not affect these translational regulators under normal condition. However, the activations of these translational regulators were not promoted by either hypertonicity or hypoxia alone and not affected by 4-HPA under hypertonic or hypoxic condition (data not shown).
Figure 6. Effects of 4-HPA on HIF-1α related protein translational regulators under hypertonicity and hypoxia conditions in primary AEC. Primary AEC were treated by hypertonicity and hypoxia in the absence or presence of 4-HPA for 4 h. Then, the cells were harvested for Western blotting and phosphorylation and total protein levels of HIF-1α related translational regulators, including p70S6K1 (A); S6 ribosomal protein (B); 4E-BP1 (C); and eIF4E (D) were detected. The ratios of HIF-1α related translational regulators to β-actin in protein levels from three independent experiments were obtained by density scanning of the Western blotting. Data are means ± SD, * p < 0.05 vs. control group, # p < 0.05 vs. hypertonicity + hypoxia group.
(A)
(B)
(C)

204
Fgure 4. Cont.
(D)
2.7. 4-HPA Decreased Hypertonicity and Hypoxia-Induced HIF-1α Protein Level through Promoting HIF-1α Protein Degradation, Which Was Associated with Prolyl Hydroxylase Domain Enzyme Isoform-2 (PHD2) Elevation in Primary AEC
In the presence of CHX (blocking ongoing protein synthesis), the half-life of HIF-1α protein was longer (p < 0.05) than that in the presence of 4-HPA treatment under hypertonic and hypoxic condition (Figure 7A) in primary AEC. Moreover, 4-HPA also increased the degradation of HIF-1α protein (p < 0.05) under hypoxic (Figure 7B) or hypertonic (Figure 7C) condition. As shown in Figure 7D, hypertonicity and hypoxia significantly decreased the protein level of prolyl hydroxylase domain enzyme isoform-2 (PHD2) which is an important enzyme isoform to regulate the stability of HIF-1α protein, and this effect was impaired by the treatment of 4-HPA. Our results provide the evidence that 4-HPA decreased hypertonicity and hypoxia-induced HIF-1α protein level through a mechanism that involves prolyl hydroxylase-dependent degradation.
2.8. 4-HPA Decreased the Production of Inflammatory Cytokines through Suppressing Hypertonicity and Hypoxia-Induced HIF-1α in NR8383 Macrophages
Hypertonicity and hypoxia increased HIF-1α protein level (p < 0.05), which was markedly inhibited by HIF-1α siRNA or 4-HPA (p < 0.05) in NR8383 macrophages (Figure 8A). Meanwhile, TNF-α, IL-1β, and IL-6 contents in the supernatant from the cells stimulated with hypertonicity and hypoxia for 4 h were much more than those of control (p < 0.05) (Figure 8B–D). 4-HPA and HIF-1α siRNA similarly reduced the production of TNF-α, IL-1β, and IL-6. The scramble sequence exerted no significant impact on HIF-1α expression and the production of inflammatory cytokines in NR8383 macrophages.

205
Figure 7. Effects of 4-HPA on HIF-1α protein degradation under hypertonicty and hypoxia conditions in primary AEC. AEC were treated with hypertonicity (C); hypoxia (B); or both of the two (A) with or without 4-HPA treatment for 4 h, followed by incubation with 100 μM cycloheximide (CHX, blocking ongoing protein synthesis) from 0–30 min. Cell lysates were subjected to Western blotting using antibodies against HIF-1α and β-actin (the left panel) and the intensity of HIF-1α protein relative content was quantified (the right panel). The plot represented means ± SD from three independent experiments, * p < 0.05 vs. groups with 4-HPA treatment; and (D) prolyl hydroxylase domain enzyme isoform-2 (PHD2) protein of AEC which were treated with both hypertonicity and hypoxia in the presence and absence of 4-HPA was detected by Western blotting. Data are means ± SD, & p < 0.01 vs. control group, # p < 0.05 vs. hypertonicity + hypoxia group.
(A)
(B)

206
Figure 7. Cont.
(C)
(D)
2.9. 4-HPA Decreased Monolayer Permeability through Suppressing Hypertonicity and Hypoxia-Induced HIF-1α, Which Was Mediated by Inhibiting VEGF in Rat Lung Microvascular Endothelial Cell Line (RLMVEC)
As shown in Figure 9, hypertonicity and hypoxia increased rat lung microvascular endothelial cell line (RLMVEC) monolayer permeability (p < 0.01), and HIF-1α siRNA, sFlt-1 (VEGF antagonist), or 4-HPA did not affected it significantly during normal culture condition. Furthermore, hypertonicity and hypoxia-induced elevation of RLMVEC monolayer permeability was suppressed by HIF-1α siRNA, sFlt-1, and 4-HPA, respectively (p < 0.05) and there was no significant difference between these suppression effects. VEGF is a standard target gene of HIF-1. Therefore, 4-HPA decreased monolayer permeability through suppressing hypertonicity and hypoxia-induced HIF-1α, which was mediated by inhibiting VEGF in RLMVEC.

207
Figure 8. Effects of 4-HPA on inflammatory cytokines levels under hypertonicty and hypoxia conditions in NR8383 macrophages. (A) NR8383 cells were transfected with HIF-1α siRNA and a scramble sequence. Twenty-four hours after transfection, the cells with or without transfection were stimulated with hypertonicity and hypoxia in the absence or presence of 4-HPA for 4 h and then harvested for Western blotting; The supernatants of the cells were collected to detect the content of TNF-α (B); IL-1β (C); and IL-6 (D) by ELISA. Data are means ± SD from three independent experiments, * p < 0.05 vs. control group, # p < 0.05 vs. 2H group. 2H: hypertonicity and hypoxia, 2H + Scram: hypertonicity and hypoxia + scramble sequence, 2H + SiHIF: hypertonicity and hypoxia + HIF-1α siRNA.
(A)
(B) (C)
(D)
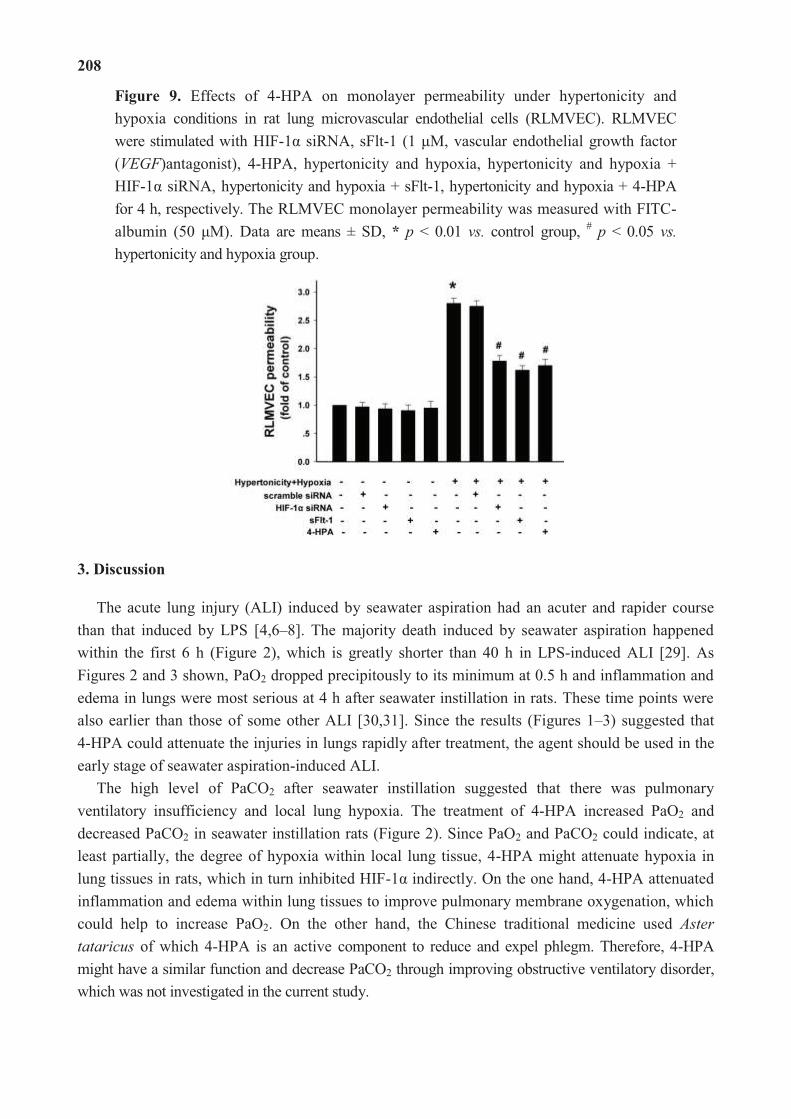
208
Figure 9. Effects of 4-HPA on monolayer permeability under hypertonicity and hypoxia conditions in rat lung microvascular endothelial cells (RLMVEC). RLMVEC were stimulated with HIF-1α siRNA, sFlt-1 (1 μM, vascular endothelial growth factor (VEGF)antagonist), 4-HPA, hypertonicity and hypoxia, hypertonicity and hypoxia + HIF-1α siRNA, hypertonicity and hypoxia + sFlt-1, hypertonicity and hypoxia + 4-HPA for 4 h, respectively. The RLMVEC monolayer permeability was measured with FITC-albumin (50 μM). Data are means ± SD, * p < 0.01 vs. control group, # p < 0.05 vs. hypertonicity and hypoxia group.
3. Discussion
The acute lung injury (ALI) induced by seawater aspiration had an acuter and rapider course than that induced by LPS [4,6–8]. The majority death induced by seawater aspiration happened within the first 6 h (Figure 2), which is greatly shorter than 40 h in LPS-induced ALI [29]. As Figures 2 and 3 shown, PaO2 dropped precipitously to its minimum at 0.5 h and inflammation and edema in lungs were most serious at 4 h after seawater instillation in rats. These time points were also earlier than those of some other ALI [30,31]. Since the results (Figures 1–3) suggested that 4-HPA could attenuate the injuries in lungs rapidly after treatment, the agent should be used in the early stage of seawater aspiration-induced ALI.
The high level of PaCO2 after seawater instillation suggested that there was pulmonary ventilatory insufficiency and local lung hypoxia. The treatment of 4-HPA increased PaO2 and decreased PaCO2 in seawater instillation rats (Figure 2). Since PaO2 and PaCO2 could indicate, at least partially, the degree of hypoxia within local lung tissue, 4-HPA might attenuate hypoxia in lung tissues in rats, which in turn inhibited HIF-1α indirectly. On the one hand, 4-HPA attenuated inflammation and edema within lung tissues to improve pulmonary membrane oxygenation, which could help to increase PaO2. On the other hand, the Chinese traditional medicine used Aster tataricus of which 4-HPA is an active component to reduce and expel phlegm. Therefore, 4-HPA might have a similar function and decrease PaCO2 through improving obstructive ventilatory disorder, which was not investigated in the current study.

209
Hypoxia increases HIF-1α protein by elevating its protein stability but not by prompting its mRNA expression [4,6–8]. However, instillation of seawater increased not only HIF-1α protein but also its mRNA expression (Figure 4). Therefore, hypertonicity induced by seawater instillation could be the factor which was accounted for the increase of HIF-1α mRNA expression. This hypothesis was demonstrated by our following experiments in vitro (Figure 5). Some previous studies reported that HIF-1α also responded to nonhypoxic stimuli such as hormones, growth factors, vasoactive peptides, cytokines, heat, hypertonicity, and LPS [13–16]. Our study demonstrated again that hypertonicity was a nonhypoxic stimulus of HIF-1α (Figures 4 and 5). In addition, a previous study reported that LPS induced HIF-1α synergistically with hypoxia [32]. Our results showed that hypertonicity could synergize with hypoxia to increase HIF-1α protein (Figure 5). Since our results showed that hypertonicity and hypoxia synergistically increased only HIF-1α protein but not mRNA level, posttranscriptional mechanisms were likely involved in this synergistic effect. We found hypertonicity together with hypoxia promoted the phosphorylation but not the total protein levels of HIF-1α related translational regulators, including p70S6K1, S6 ribosomal protein, 4E-BP1, and eIF4E, which were attenuated by 4-HPA treatment in AEC (Figure 6). 4-HPA inhibited the synergistic effect of hypertonicity and hypoxia on HIF-1α probably through suppressing synergistic protein translational process, which need further study to demonstrate. Although HIF-1α related protein translational regulators were not affected by hypertonicity or hypoxia alone (data not shown), HIF-1α protein degradation was suppressed by hypertonicity or hypoxia alone, which could be inhibited by 4-HPA (Figure 7). The HIF-1α protein levels which can be detected by Western blotting are mainly decided by three processes which are the transcription, translation, and degradation of HIF-1α protein. 4-HPA impacted HIF-1α protein levels following either hypertonicity or hypoxia through promoting HIF-1α protein degradation (Figure 7B,C) but not through impacting these translational regulators (data not shown). Moreover, 4-HPA decreased HIF-1α protein levels following both hypertonicity and hypoxia through both inhibiting the activations of protein translational regulators (Figure 6) and promoting HIF-1α protein degradation (Figure 7A). In addition, hypertonicity or hypoxia alone did not impact these translational regulators but hypertonicity together with hypoxia synergistically increased them. Therefore, this synergistic effects might be impacted by 4-HPA which was not investigated in the current study. Taken all together, there are hypertonic and hypoxic factors in seawater aspiration-induced lung injury and these two main impact factors synergistically increased HIF-1α protein which was attenuated by 4-HPA. Therefore, our study focused on how the effects of the two factors together in vitro were affected by 4-HPA.
HIF-1 is a transcription factor which is essential for regulating oxygen homeostasis. It also regulates the expression of target genes important in angiogenesis, erythropoiesis, energy metabolism, and cell survival. However, there would be more detrimental effects of HIF-1α than beneficial ones when the injury factor such as LPS leads to HIF-1α overexpression, which needs an agent to inhibit [17]. In our study, the greatly increased HIF-1α protein induced synergistically by hypertonic and hypoxic factors contributed to the seawater aspiration-induced lung injury and we found that 4-HPA was a proper agent to attenuate the ALI by inhibiting HIF-1α.
4-HPA which can be secreted in saliva is a metabolite of aromatic amino acid catabolism. It is also an active component of some Chinese herb such as Aster tataricus and Rhodiola rosea, as well

210
as an intermediate product of chemical synthesis of atenolol (β-receptor blocking agent) and puerarin (active component of Lobed Kudzuvine Root). Some previous studies reported that 4-HPA controlled the NadA gene expression and could become a potential hypopigmenting agent [23–25]. Our results suggested that 4-HPA was a good inhibitor of hypertonicity, hypoxia, or both of the two-induced HIF-1α expression. Additionally, 4-HPA, a water-soluble small molecular compound, could be a potential agent for the diseases with hypoxia-induced inflammation or edema and some carcinomas of which hypoxia-induced HIF-1α promoted the progress [33]. Moreover, HIF-1α played important roles in some diseases under hypertonic condition, such as diabetic eye disease [34] and some renal diseases [35]. Therefore, 4-HPA might be used in these fields.
4. Experimental Section
4.1. Animal Model and Grouping
Male Sprague–Dawley rats, weighing 180–220 g each, were obtained from the Animal Center (Fourth Military Medical University, Xi’an, China). These rats were kept in a temperature-controlled house with 12 h light-dark cycles and fed with standard laboratory diet and water ad libitum. All experiments approved by the Animal Care and Use Committee of the Fourth Military Medical University conformed to the Declaration of the National Institutes of Health Guide for Care and Use of Laboratory Animals (Publication No.85–23, revised in 1985).
Seawater Drowning Animal Model: the rats were anesthetized with 3% sodium pentobarbital (1.5 mL/kg, Sigma-Aldrich, St. Louis, MO, USA) intraperitoneally and maintained in the supine position during experiments with the head elevated 30°. A catheter was inserted into the right jugular artery to obtain blood samples. A 1 mL syringe was gently inserted into the trachea approximately 1.5 cm above the carina. Then, 4 mL/kg body weight of seawater was instilled within 4 min into both lungs. Seawater (osmolality 1300 mOsm/kgH2O, pH 8.2, temperature 25 °C, specific weight (SW) 1.05, NaCl 26.518 g/L, MgSO4 3.305 g/L, MgCl2 2.447 g/L, CaCl2 1.141 g/L, KCl 0.725 g/L, NaHCO3 0.202 g/L, NaBr 0.083 g/L) was prepared according to the major composition of the East China Sea provided by Chinese Ocean Bureau (Beijing, China).
To assess mortality of rates, drowning rat models were prepared as mentioned before with or without different does of 4-HPA (50, 100 or 150 mg/kg body weight, i.p.) (solubility of 4-HPA, 150 mg/mL, pH 7.4). 4-HPA (Sigma-Aldrich, St. Louis, MO, USA, the chemical structure is showed in Figure 10) was administered after seawater instillation for 10 min. The mortality of rats were recorded every 2 h after seawater instillation in each group (n = 20).
Figure 10. The chemical structure of 4-HPA.
Rats were randomly divided into four groups (n = 40), (1) control; (2) 4-HPA (100 mg/kg) only; (3) seawater only; and (4) seawater + 4-HPA (100 mg/kg). In the seawater + 4-HPA group, rats were treated with 100 mg/kg 4-HPA after seawater instillation for 15 min. Rats were sacrificed at

211
2, 4, or 6 h after seawater instillation. Then, the thorax was opened rapidly and lungs were processed for studies in the manner described below.
4.2. PaO2 and PaCO2 Study
In each group, blood samples were obtained from a PE-50 catheter which was inserted in the right carotid artery at 0, 1, 2, 3, or 4 h after seawater instillation. Then, arterial oxygen tension (PaO2) and arterial carbon dioxide tension (PaCO2) of the blood samples was measured with a blood gas analyzer (Ymb-3100, Yima Opto-Electrical Technology Co., Ltd., Xi’an, China).
4.3. ELISA
The concentrations of TNF-α, IL-1β, and IL-6 were measured by using ELISA kits (R&D systems; Minneapolis, MN, USA). Lungs tissue and cells supernatant were processed according to the manufacturer’s instructions for ELISA.
4.4. Bronchoalveolar Lavage Fluid (BALF) White Cell Count
After seawater instillation for 0, 2, 4, or 6 h, rats were anesthetized with intraperitoneal pentobarbital. The lungs were lavaged with 2.5 mL ice-cold phosphate buffered saline five times in all groups. The recovery ratio of the fluid was about 90%. The collected bronchoalveolar lavage fluid (BALF) was centrifuged at 520× g for 20 min at 4 °C. The cell pellet was then resuspended in 1 mL of red blood cell-lysis buffer to eliminate red cells. White cells were then re-pelleted by centrifugation at 520× g for 20 min at 4 °C. The cell pellet was again resuspended in phosphate buffer saline (PBS) and taken for cell counting using a hemocytometer.
4.5. Assessment of Pulmonary Vascular Leakage
Pulmonary vascular leakage was assessed as previously described [2] by quantitating extravasation of Evans blue into lung parenchyma. In brief, Evans blue dye (20 mg/kg, Sigma-Aldrich, St. Louis, MO, USA) was given intravenously to the rats 30 min before the animals were sacrificed. After the lung was rapidly removed from the thoracic cavity, normal saline was immediately injected into the right ventricle till there was effused clear fluid from the left atrium. The lung was removed and dried to a constant weight at 60 °C for 72 h. The dried lung was weighed and then incubated in formamide (3 mL/100 mg, Sigma-Aldrich, St. Louis, MO, USA) at 60 °C for 24 h. Then, the supernatant was separated by centrifugation at 5000× g for 30 min. The concentration of Evans blue in the supernatant was quantitated by the following formula: A620 (correction) = A620 − (1.426 × A740 + 0.030). The concentration of Evans blue in the lung tissue (ET) was determined from the generated Evans blue standard absorbance curves. At the same time, the concentration of Evans blue in blood (EB) was detected by the same method as described above. ELI = ET/(EB × dry lung weight) × 100%.

212
4.6. Wet-to-Dry Weight (W/D) Ratio
Wet-to-dry weight (W/D) ratio was used to represent the severity of lung edema. After lungs were separated from the thoracic cavity at the end of the experiment, the left lungs were weighed and then dried to constant weight at 50 °C for 72 h. The ratio of wet-to-dry was finally calculated by dividing the wet weight by the dry weight.
4.7. Histological Study
At the end of the experiments, the lung tissues were fixed with 4% paraformaldehyde for 24 h and embedded in paraffin. After deparaffinisation and dehydration, the lungs were cut into 5 μm sections and stained with hematoxylin and eosin.
4.8. Cell Culture and Treatment
Cell isolation and preparation of primary AEC (rat alveolar epithelial cells) monolayers: AT2 (alveolar epithelial type II) cells were isolated from adult male Sprague-Dawley rats (125–150 g) by disaggregation with elastate (2.0–2.5 U/mL; Worthington Biochemical, Freehold, NJ, USA), followed by differential adherence on IgG-coated bacteriological plates. All animals were treated in accordance with the guidelines and approval of the Fourth Military Medical University Institutional Animal Care and Use Committee. Freshly isolated AT2 cells were plated in minimal defined serum-free medium (MDSF) consisting of Dulbecco’s modified Eagle’s medium and Ham’s F-12 nutrient mixture in a 1:1 ratio, supplemented with 1.25 mg/mL bovine serum albumin, 10 mM HEPES, 0.1 mM nonessential amino acids, 2.0 mM glutamine, 100 U/mL sodium penicillin G, and 100 μg/mL streptomycin. Cells were seeded onto tissue culture-treated polycarbonate filter cups (Nuclepore, Corning-Costar, Corning, NY, USA, 0.4 μm) at a density of 1.0 × 10⁶ cells/cm2 and grown to confluence for RNA and protein analyses. Media were changed on the second day after plating and every other day thereafter. Cultures were maintained in a humidified 5% CO2 incubator at 37 °C. AT2 cell purity (>90%) was assessed by staining freshly isolated cells with tannic acid or an antibody (Ab) to a lamellar membrane protein, p180 (Covance Research, Berkeley, CA, USA), followed by immunofluorescence visualization. Cell viability (>95%) was measured by trypan blue dye exclusion. Day of isolation is designated as day 0; cells were used on day 3 or 4.
Hypertonicity in vitro: Hypertonicity was induced by 25% seawater (seawater volume/(seawater volume + Ham’s F12 medium volume) = 25%), osmolality 538.21 ± 0.99 mOsm/kgH2O, pH 8.2, temperature 25 °C. In our preliminary experiment, HIF-1α protein level reached its maximum when AEC were stimulated by 25% seawater, compared with 12.5% or 37.5% seawater.
Hypoxia in vitro: AEC were cultured in a special humidified hypoxic chamber as previously described [19]. Use of an antechamber ensured that once cells became hypoxic, they were never re-exposed to a normoxic environment. The chamber utilized a positive pressure system and was supplied with a gas mixture of 3% O2, 5% CO2, and the balance nitrogen. Culture media and seawater (25%) used in the test were allowed to equilibrate to 3% O2 before initiation of the test.
For effects of 4-HPA on HIF-1α expression induced by hypertonicity, hypoxia, or both of the two, primary AEC cells were stimulated with hypertonicity, hypoxia, or both of the two in the

213
presence or absence of 4-HPA (100 μg/mL, Sigma-Aldrich, St. Louis, MO, USA) for 4 h. After being stimulated by diverse stimulus, HIF-1α protein, mRNA, HIF-1α related protein translational regulators (p70S6K1, S6 ribosomal protein, 4E-BP1, eIF4E), and HIF-prolyl hydroxylase domain enzyme isoform-2 (PHD2) protein levels of the cells were detected with Western blotting and RT-PCR. Additionally, stimulated AEC were incubated with 100 μM cycloheximide (CHX, blocking ongoing protein synthesis, obtained from EMD Biosciences, San Diego, CA, USA) from 0–30 min, then the cells were harvested at indicated time points for Western blotting.
4.9. Plasmid Construction and Transfection
The rat alveolar macrophage cell line NR8383 (endowed by Pharmacology Department, Fourth Military Medical University, Xi’an, China) was maintained in Ham’s F12 medium (Sigma-Aldrich, St. Louis, MO, USA) supplemented with 10% fetal calf serum (FCS) (Sigma-Aldrich, St. Louis, MO, USA), 100 U/mL of penicillin (Sigma-Aldrich, St. Louis, MO, USA) and 100 μg/mL of streptomycin (Sigma-Aldrich, St. Louis, MO, USA) at 37 °C in a humidified atmosphere containing 5% CO2 and 95% air.
HIF-1α siRNA was used to study the effect of 4-HPA on the production of inflammatory cytokines during hypertonic and hypoxic condition. The HIF-1α siRNA and the scramble sequence (Invitrogen, Grand Island, NY, USA) were kindly provided by Lili Liu (Department of Oncology, Tangdu Hospital, Fourth Military Medical University, Xi’an 710038, China), and the siRNA expression vector for HIF-1α was constructed as described previously [36]. NR8383 macrophages and rat lung microvascular endothelial cell line (RLMVEC) were transfected with HIF-1α siRNA or a scramble sequence by using Lipofectamine 2000 (Invitrogen, Carlsbad, CA, USA) according to the manufacturer’s instructions. Twenty-four hours after transfection, NR8383 cells with or without transfection were stimulated with both of hypertonicity and hypoxia for 4 h and harvested for Western blotting to evaluate the changes of HIF-1α expression. Meanwhile, the supernatant was collected to detect the contents of TNF-α, IL-1β, and IL-6 by ELISA. In addition, RLMVEC with or without transfection were used in permeability assay below.
4.10. Permeability Assay
Rat lung microvascular endothelial cells (RLMVEC, VEC Technologies, Rensselaer, NY, USA) were cultured in high-glucose DMEM (Sigma-Aldrich, St. Louis, MO, USA) supplemented with 5% fetal bovine serum (FCS) (Sigma-Aldrich, St. Louis, MO, USA), 50 U/mL of penicillin (Sigma-Aldrich, St. Louis, MO, USA) and 50 μg/mL of streptomycin (Sigma-Aldrich, St. Louis, MO, USA) at 37 °C in a humidified atmosphere containing 5% CO2 and 95% air. RLMVEC were seeded (~100,000 cells/insert) on polystyrene filters (No.3470, 6.5-mm diameter, 0.4-μm pore size; Costar Transwell, Cambridge, MA, USA). RLMVEC were grown to confluence over 48 h after which the cells were treated with (1) standard cell culture conditions; (2) HIF-1α siRNA; (3) 1 μM soluble VEGF receptor-1 (sFlt-1, provided by professor Lan Yang, No. 210 Hospital of PLA, Dalian, China); (4) 4-HPA (100 μg/mL); (5) hypertonicity + hypoxia; (6) hypertonicity + hypoxia + HIF-1α siRNA; (7) hypertonicity + hypoxia + sFlt-1; and (8) hypertonicity + hypoxia + 4-HPA for 4 h, respectively. Then, the RLMVEC were washed three times in serum-free medium, and FITC-labeled

214
albumin (50 μM, Sigma-Aldrich, St. Louis, MO, USA) suspended in serum-free medium was added to the RLMVEC monolayers (100 μL, VEC Technologies, Rensselaer, NY, USA). The insert was placed in a new well of a 24-well plate containing serum-free medium (0.6 mL to ensure that the fluid volume on either side of the inserts was equalized to avoid a hydrostatic gradient that might alter the rate of albumin flux). Measuring the increase of fluoresceinisothiocyanate (FITC)-albumin in the lower well after 1 h assessed the transfer rate of albumin across the monolayer. FITC-albumin was quantified in a F4500 fluorimeter (Hitachi, Tokyo, Japan) and compared with a standard curve of fluorescence made with various dilutions of the FITC-albumin. The measurements of permeability were expressed as the fold of control.
4.11. Western Blotting
The lung tissues and cultured cells were prepared to extract proteins with lysis buffer (10 mM Tris pH 8.0, 1 mM EDTA, 400 mM NaCl, 10% glycerol, 0.5% NP-40, 5 mM sodium fluoride, 0.1 mM phenylmethylsulfonyl fluoride, 1 mM dithiothreitol). The lysates were centrifuged at 12,000 rpm for 30 min at 4 °C, and then supernatants were collected. Equal amounts (50 μg) of protein were separated by SDS-PAGE, transferred to nitrocellulose membrane at 100 V for 2.5 h at low temperature, and blocked with 5% skim milk for 2 h. Subsequently, anti-HIF-1α antibody (dilution 1:1000; Millipore, Bedford, MA, USA), anti-p70S6K1 (Mr 70,000 ribosomal protein S6 kinase 1, 1:1000; Cell Signaling Technology, Danvers, MA, USA), anti-Phospho-p70S6K1 (Phosphorylated Thr-421/Ser-424) (1:500; Cell Signaling Technology, Danvers, MA, USA), anti-S6 ribosomal protein (1:100; Cell Signaling Technology, Danvers, MA, USA), anti-Phospho-S6 ribosomal protein (Ser-234/236) (1:500; Cell Signaling Technology, Danvers, MA, USA), anti-4E-BP1 (eukaryotic initiation factor 4E (eIF4E)-binding protein 1, 1:500, Cell Signaling Technology, Danvers, MA, USA), anti-Phospho-4E-BP1 (Ser-65) (1:500; Cell Signaling Technology, Danvers, MA, USA), anti-eIF4E (1:1000; Cell Signaling Technology, Danvers, MA, USA), anti-Phospho-eIF4E (Ser-209) (1:1000; Cell Signaling Technology), anti-PHD2 (1:1000, Sigma-Aldrich, St. Louis, MO, USA), and anti-β-actin (1:2000, Sigma-Aldrich, St. Louis, MO, USA) were respectively added and kept with the membranes at 4 °C overnight. After repeated washing, the membranes were incubated with horseradish peroxidase-conjugated anti-rabbit secondary antibody (1:2000, Sigma-Aldrich, St. Louis, MO, USA) and bands visualized by using the enhanced chemiluminescence (ECL) system (Amersham Pharmacia Biotech, Arlington Heights, IL, USA). The results were expressed as the ratio to β-actin level in the same protein samples.
4.12. Reverse Transcription-PCR
Total RNA was extracted respectively from lung tissues and cells with Trizol (Invitrogen, Grand Island, NY, USA) according to the manufacturer’s instructions. The total RNA concentration was determined by spectrometric analysis. HIF-1α mRNA was examined by reverse transcription-PCR (RT-PCR) as per the manufacturer’s instructions (Promeaga, Madison, WI, USA). A total of 1 μg of RNA was incubated with reverse transcriptase mixture at 50 °C for 30 min, followed by amplification with the specific primers (synthesized by Invitrogen). The primers for HIF-1α (575 bp) were (forward) 5'-GACACCGCGGGCACCGATT-3', and (reverse) 5'-
215
GTTCATCGTCCTCCCCCGGC-3', and for β-actin (240 bp), were (forward) 5'-TAAAGACCTCTATGCCAACACAGT-3', and (reverse) 5'-CACGATGGAGGGCCGGACTCATC-3', respectively. Thirty-five amplification cycles consisting of 30 s of denaturation at 95 °C, 30 s of annealing at 55 °C, and 1 min of extension at 72 °C were performed. After amplification, the RT-PCR products were separated on 1% agarose gels (Invitrogen, Grand Island, NY, USA), and the bands were visualized by ethidium bromide (Invitrogen, Grand Island, NY, USA) staining. Quantitation was obtained by density scanning of the PCR bands using a Scion image analysis system (Beta 4.02, Scion Corporation, Colombo, Sri Lanka). The results were expressed as the ratio to β-actin mRNA level in the same RNA samples.
4.13. Statistical Analysis
Data are expressed as means ± SD Statistically significant differences between groups were determined by ANOVA followed by Student’s test. Survival data were presented by the Kaplan Meier method [37] and comparisons were made by the log rank test. A statistical difference was accepted as significant if p < 0.05.
5. Conclusions
4-HPA attenuated inflammation and edema through the suppression of hypertonic and hypoxic induction of HIF-1α in seawater aspiration-induced lung injury in rats. It may be considered as a potential agent in treatment of seawater aspiration-induced lung injury.
Acknowledgments
This work was supported by grants from the National Research and Development of Important New drugs Foundation (No. 2009ZXJ09002-019) and the National Natural Science Foundation of China (No. 81270124).
Author Contributions
Z.L., R.X., F.J., and X.W. designed the research; Z.L., Z.Z., and W.L. conducted cell experiments; R.X., Z.Z., and Y.L. conducted animal experiments; Z.L. performed statistical analysis; X.W. and F.J. provided help with data interpretation; and Z.L. wrote the paper. All authors read and approved the final manuscript.
Conflicts of Interest
The authors declare no conflict of interest.
References
1. Van Beeck, E.F.; Branche, C.M.; Szpilman, D.; Modell, J.H.; Bierens, J.J. A new definition of drowning: Towards documentation and prevention of a global public health problem. Bull. World Health Org. 2005, 83, 853–856.

216
2. Li, J.; Xu, M.; Fan, Q.; Xie, X.; Zhang, Y.; Mu, D.; Zhao, P.; Zhang, B.; Cao, F.; Wang, Y.; et al. Tanshinone IIA ameliorates seawater exposure-induced lung injury by inhibiting aquaporins (AQP) 1 and AQP5 expression in lung. Respir. Physiol. Neurobiol. 2011, 176, 39–49.
3. Li, J.H.; Xu, M.; Xie, X.Y.; Fan, Q.X.; Mu, D.G.; Zhang, Y.; Cao, F.L.; Wang, Y.X.; Zhao, P.T.; Zhang, B.; et al. Tanshinone IIA suppresses lung injury and apoptosis, and modulates protein kinase B and extracellular signal-regulated protein kinase pathways in rats challenged with seawater exposure. Clin. Exp. Pharmacol. Physiol. 2011, 38, 269–277.
4. Fan, Q.; Zhao, P.; Li, J.; Xie, X.; Xu, M.; Zhang, Y.; Mu, D.; Li, W.; Sun, R.; Liu, W.; et al. 17β-Estradiol administration attenuates seawater aspiration-induced acute lung injury in rats. Pulm. Pharmacol. Ther. 2011, 24, 673–681.
5. Rui, M.; Duan, Y.Y.; Wang, H.L.; Zhang, X.H.; Wang, Y. Differences between seawater- and freshwater-induced lung injuries. Chin. Crit. Care Med. 2009, 21, 416–420.
6. Wang, Q.; Zheng, X.; Cheng, Y.; Zhang, Y.L.; Wen, H.X.; Tao, Z.; Li, H.; Hao, Y.; Gao, Y.; Yang, L.M.; et al. Resolvin D1 stimulates alveolar fluid clearance through alveolar epithelial sodium channel, Na,K-ATPase via ALX/cAMP/PI3K pathway in lipopolysaccharide-induced acute lung injury. J. Immunol. 2014, 192, 3765–3777.
7. He, J.; Zhao, Y.; Deng, W.; Wang, D.X. Netrin-1 promotes epithelial sodium channel-mediated alveolar fluid clearance via activation of the adenosine 2B receptor in lipopolysaccharide-induced acute lung injury. Respiration 2014, 87, 394–407.
8. Xie, X.Y.; Zhang, B.; Li, J.H.; Fan, Q.X.; Zhang, Y.; Mu, D.G.; Li, W.P.; Xu, M.; Zhao, P.T.; Jin, F.G.; et al. Sodium tanshinone iia sulfonate attenuates seawater aspiration-induced acute pulmonary edema by up-regulating Na+,K+-ATPase activity. Exp. Lung Res. 2011, 37, 482–491.
9. Fan, Y.; Dong, W.; He, J.; Du, L.; Xu, G.; Liu, X.; Pei, Y.; Fu, G.; Ma, G. The effect of HJ-1 NO–HFJV respirator on treating pulmonary edema caused by seawater drowning. J. Biomed. Eng. 2002, 19, 526–528.
10. Zhao, X.W.; Zhang, J.P.; Huang, X.; Liu, Y.N. Effects of positive end expiratory pressure ventilation upon respiratory function and hydrophobic surfactants proteins in rabbit with seawater respiratory distress syndrome. Zhonghua Yi Xue Za Zhi 2009, 89, 3266–3270.
11. Sawada, S.; Ichiba, S.; Itano, H.; Shoga, K.; Shimizu, N. Experimental study of partial liquid ventilation in the setting of acute respiratory failure induced by sea water lung lavage in rabbits. Acta Med. Okayama 1998, 52, 131–137.
12. Wang, G.L.; Jiang, B.H.; Rue, E.A.; Semenza, G.L. Hypoxia-inducible factor 1 is a basic-helix-loop-helix-PAS heterodimer regulated by cellular O2 tension. Proc. Natl. Acad. Sci. USA 1995, 92, 5510–5514.
13. Dery, M.A.; Michaud, M.D.; Richard, D.E. Hypoxia-inducible factor 1: Regulation by hypoxic and non-hypoxic activators. Int. J. Biochem. Cell Biol. 2005, 37, 535–540.
14. Oh, Y.T.; Lee, J.Y.; Yoon, H.; Lee, E.H.; Baik, H.H.; Kim, S.S.; Ha, J.; Yoon, K.S.; Choe, W.; Kang, I. Lipopolysaccharide induces hypoxia-inducible factor-1α mRNA expression and activation via NADPH oxidase and Sp1-dependent pathway in BV2 murine microglial cells. Neurosci. Lett. 2008, 431, 155–160.

217
15. Shein, N.A.; Horowitz, M.; Alexandrovich, A.G.; Tsenter, J.; Shohami, E. Heat acclimation increases hypoxia-inducible factor 1α and erythropoietin receptor expression: Implication for neuroprotection after closed head injury in mice. J. Cereb. Blood Flow Metabol. 2005, 25, 1456–1465.
16. Zhou, B.; Ann, D.K.; Li, X.; Kim, K.J.; Lin, H.; Minoo, P.; Crandall, E.D.; Borok, Z. Hypertonic induction of aquaporin-5: Novel role of hypoxia-inducible factor-1α. Am. J. Physiol. Cell Physiol. 2007, 292, C1280–C1290.
17. Yeh, C.H.; Cho, W.; So, E.C.; Chu, C.C.; Lin, M.C.; Wang, J.J.; Hsing, C.H. Propofol inhibits lipopolysaccharide-induced lung epithelial cell injury by reducing hypoxia-inducible factor-1α expression. Br. J. Anaesth. 2011, 106, 590–599.
18. Hellwig-Burgel, T.; Stiehl, D.P.; Wagner, A.E.; Metzen, E.; Jelkmann, W. Review: Hypoxia-inducible factor-1 (HIF-1): A novel transcription factor in immune reactions. J. Interferon Cytokine Res. 2005, 25, 297–310.
19. Irwin, D.C.; McCord, J.M.; Nozik-Grayck, E.; Beckly, G.; Foreman, B.; Sullivan, T.; White, M.; Crossno, J.T., Jr.; Bailey, D.; Flores, S.C.; et al. A potential role for reactive oxygen species and the HIF-1α-VEGF pathway in hypoxia-induced pulmonary vascular leak. Free Radic. Biol. Med. 2009, 47, 55–61.
20. Ng, T.B.; Liu, F.; Lu, Y.; Cheng, C.H.; Wang, Z. Antioxidant activity of compounds from the medicinal herb Aster tataricus. Comp. Biochem. Physiol. 2003, 136, 109–115.
21. Du, L.; Mei, H.F.; Yin, X.; Xing, Y.Q. Delayed growth of glioma by a polysaccharide from Aster tataricus involve upregulation of Bax/Bcl-2 ratio, activation of caspase-3/8/9, and downregulation of the Akt. Tumour Biol. 2014, 35, 1819–1825.
22. Yen, M.H.; Lee, J.J.; Yeh, C.F.; Wang, K.C.; Chiang, Y.W.; Chiang, L.C.; Chang, J.S. Yakammaoto inhibited human coxsackievirus B4 (CVB4)-induced airway and renal tubular injuries by preventing viral attachment, internalization, and replication. J. Ethnopharmacol. 2014, 151, 1056–1063.
23. Cloward, J.M.; Shafer, W.M. MtrR control of a transcriptional regulatory pathway in Neisseria meningitidis that influences expression of a gene (NadA) encoding a vaccine candidate. PLoS One 2013, 8, e56097.
24. Metruccio, M.M.; Pigozzi, E.; Roncarati, D.; Berlanda Scorza, F.; Norais, N.; Hill, S.A.; Scarlato, V.; Delany, I. A novel phase variation mechanism in the meningococcus driven by a ligand-responsive repressor and differential spacing of distal promoter elements. PLoS Pathog. 2009, 5, e1000710.
25. Wen, K.C.; Chang, C.S.; Chien, Y.C.; Wang, H.W.; Wu, W.C.; Wu, C.S.; Chiang, H.M. Tyrosol and its analogues inhibit α-melanocyte-stimulating hormone induced melanogenesis. Int. J. Mol. Sci. 2013, 14, 23420–23440.
26. Lang, K.J.; Kappel, A.; Goodall, G.J. Hypoxia-inducible factor-1α mRNA contains an internal ribosome entry site that allows efficient translation during normoxia and hypoxia. Mol. Biol. Cell 2002, 13, 1792–1801.

218
27. Laughner, E.; Taghavi, P.; Chiles, K.; Mahon, P.C.; Semenza, G.L. HER2 (neu) signaling increases the rate of hypoxia-inducible factor 1α (HIF-1α) synthesis: Novel mechanism for HIF-1-mediated vascular endothelial growth factor expression. Mol. Cell. Biol. 2001, 21, 3995–4004.
28. Page, E.L.; Robitaille, G.A.; Pouyssegur, J.; Richard, D.E. Induction of hypoxia-inducible factor-1α by transcriptional and translational mechanisms. J. Biol. Chem. 2002, 277, 48403–48409.
29. Zhang, B.; Liu, Z.Y.; Li, Y.Y.; Luo, Y.; Liu, M.L.; Dong, H.Y.; Wang, Y.X.; Liu, Y.; Zhao, P.T.; Jin, F.G.; et al. Antiinflammatory effects of matrine in LPS-induced acute lung injury in mice. Eur. J. Pharm. Sci. 2011, 44, 573–579.
30. Iba, T.; Nagaoka, I.; Yamada, A.; Nagayama, M.; Miki, T. Effect of hemoperfusion using polymyxin B-immobilized fibers on acute lung injury in a rat sepsis model. Int. J. Med. Sci. 2014, 11, 255–261.
31. Gao, J.; Zhan, Y.; Chen, J.; Wang, L.; Yang, J. Triptolide ameliorates lipopolysaccharide-induced acute lung injury in rats. Eur. J. Med. Res. 2014, doi:10.1186/2047-783X-18-58.
32. Mi, Z.; Rapisarda, A.; Taylor, L.; Brooks, A.; Creighton-Gutteridge, M.; Melillo, G.; Varesio, L. Synergystic induction of HIF-1α transcriptional activity by hypoxia and lipopolysaccharide in macrophages. Cell Cycle 2008, 7, 232–241.
33. Semenza, G.L. HIF-1 mediates metabolic responses to intratumoral hypoxia and oncogenic mutations. J. Clin. Investig. 2013, 123, 3664–3671.
34. Vadlapatla, R.K.; Vadlapudi, A.D.; Mitra, A.K. Hypoxia-inducible factor-1 (HIF-1): A potential target for intervention in ocular neovascular diseases. Curr. Drug Targets 2013, 14, 919–935.
35. Nangaku, M.; Rosenberger, C.; Heyman, S.N.; Eckardt, K.U. Regulation of hypoxia-inducible factor in kidney disease. Clin. Exp. Pharmacol. Physiol. 2013, 40, 148–157.
36. Liu, L.; Ning, X.; Sun, L.; Shi, Y.; Han, S.; Guo, C.; Chen, Y.; Sun, S.; Yin, F.; Wu, K.; et al. Involvement of MGr1-Ag/37LRP in the vincristine-induced HIF-1 expression in gastric cancer cells. Mol. Cell. Biochem. 2007, 303, 151–160.
37. Stel, V.S.; Dekker, F.W.; Tripepi, G.; Zoccali, C.; Jager, K.J. Survial analysis I: The Kaplan-Meier method. Nephron. Clin. Pract. 2011, 119, 83–88.
219
Effects of the Novel Compound DK223 ([1E,2E-1,2-Bis(6-
methoxy-2H-chromen-3-yl)methylene]hydrazine) on Migration
and Proliferation of Human Keratinocytes and Primary
Dermal Fibroblasts
Manh Tin Ho, Hyun Sik Kang, Jung Sik Huh, Young Mee Kim, Yoongho Lim
and Moonjae Cho
Abstract: Wound healing plays an important role in protecting the human body from external infection. Cell migration and proliferation of keratinocytes and dermal fibroblasts are essential for proper wound healing. Recently, several studies have demonstrated that secondary compounds produced in plants could affect skin cells migration and proliferation. In this study, we identified a novel compound DK223 ([1E,2E-1,2-bis(6-methoxy-2H-chromen-3-yl)methylene]hydrazine) that concomitantly induced human keratinocyte migration and dermal fibroblast proliferation. We evaluated the regulation of epithelial and mesenchymal protein markers, such as E-cadherin and Vimentin, in human keratinocytes, as well as extracellular matrix (ECM) secretion and metalloproteinase families in dermal fibroblasts. DK223 upregulated keratinocyte migration and significantly increased the epithelial marker E-cadherin in a time-dependent manner. We also found that reactive oxygen species (ROS) increased significantly in keratinocytes after 2 h of DK223 exposure, returning to normal levels after 24 h, which indicated that DK223 had an early shock effect on ROS production. DK223 also stimulated fibroblast proliferation, and induced significant secretion of ECM proteins, such as collagen I, III, and fibronectin. In dermal fibroblasts, DK223 treatment induced TGF-β1, which is involved in a signaling pathway that mediates proliferation. In conclusion, DK223 simultaneously induced both keratinocyte migration via ROS production and fibroblast proliferation via TGF-β1 induction.
Reprinted from Int. J. Mol. Sci. Cite as: Ho, M.T.; Kang, H.S.; Huh, J.S.; Kim, Y.M.; Lim, Y.; Cho, M. Effects of the Novel Compound DK223 ([1E,2E-1,2-Bis(6-methoxy-2H-chromen-3-yl)methylene]hydrazine) on Migration and Proliferation of Human Keratinocytes and Primary Dermal Fibroblasts. Int. J. Mol. Sci. 2014, 15, 13091-13110.
1. Introduction
As the outer sheath of the human body, the skin absorbs initial damage from injuries or wounds. Disruption of the normal anatomic structure and loss of organ function lead to the repair process known as wound healing. Wound healing integrates different types of dermal cells and immune cells, such as keratinocytes and dermal fibroblasts, to mediate hemostasis, coagulation, and inflammation [1,2]. Wound healing begins with inflammation and immune cell recruitment to protect tissue from foreign invaders, such as bacteria and viruses. The next phase resurfaces the skin by stimulating regeneration and repair through proliferation of fibroblasts, re-epithelialization of keratinocytes, and other mechanisms. The final phase involves scar formation, which can cause concern for some patients when the scar is not aesthetically pleasing. Therefore, several studies

220
have investigated methods to enhance the regeneration process, which is a specific substitution of the damaged tissue, and to reduce skin repair, which causes fibrosis and scar formation [1].
Herbal plants, such as garlic and curcuma, have been used traditionally for wound healing, and it is known that their effects are due to secondary compounds, such as flavonoids, saponins and alkaloids [3]. For example, Lopez-Jornet et al. showed that potassium apigenin and other flavonoids present in verbena extract possess powerful anti-inflammatory properties [4]. In addition, Duarte et al. demonstrated the use of chamomile extract ointment for stimulating oral mucosa re-epithelialization and formation of collagen fibers after 10 days of treatment [5]. Moreover, these compounds were demonstrated to influence expression of extracellular matrix (ECM) proteins in skin, including collagen and elastin, which are markers of skin wrinkle [6]. Galicka et al. reported increased collagen synthesis upon exposure to apigenin glycoside 7-O-glucuronide, a flavonoid glycoside, which also promoted procollagen transformation into collagen [7].
Furthermore, wound healing was controlled by matrix metalloproteinases (MMPs), enzymes that degrade the epidermal layer of the ECM, and are related to the cellular migration, invasion and metastasis processes [8]. MMPs, such as MMP1, MMP8, MMP13, play a specific role in mediating collagen degradation to reduce scar formation in wound healing. For example, Dang et al. reported upregulation of MMP1 expression to double normal levels, resulting in scarless wounds in fetal rat skin [9]. The role of MMPs in skin remodeling is well known, they are secreted extra-cellularly and regulated ECM protein accumulation in the wound healing process [10]. Notably, it has been reported that bioactive compounds regulate the expression and activity of MMPs. Catanzaro et al. demonstrated the effects of a sturgeon-based bioactive compound on the expression of the tumor necrosis factor-alpha, MMPs, and type-10 collagen genes in human chondrocytes [11]. Application of bioactive compounds may offer a potential therapy for controlling the wound healing or skin aging process.
Natural secondary metabolites have been demonstrated to have several potential capabilities in gene expression regulation for skin repair. Based on the knowledge of the original structures, drug development science can be used to synthesize compounds that are conformationally modified to improve their activities [12]. In that way, novel compounds have been synthesized using innovative chemical techniques that expand on the original conformation. In this study, we examined the hypothesis that the novel compound DK223 ([1E,2E-1,2-bis(6-methoxy-2H-chromen-3-yl)methylene]hydrazine) could induce keratinocyte migration, fibroblast proliferation, anti-wrinkle gene expression, and enhance the regeneration of skin, rather than mediate scar formation.
2. Results
2.1. DK223 Promoted the Migration but not the Proliferation of HaCaT Cells
To investigate the ability of DK223 to induce migration of human keratinocytes, we treated HaCaT cells with different concentrations of DK223 in a 48 h scratch wound-healing assay. The results showed that DK223 at 2 μM significantly enhanced migration of HaCaT (167%), whereas other concentrations did not produce marked effects (Figure 1A). In order to confirm these results, we performed the migration assay with the ECIS system using other concentrations of DK223. In
221
this assay, during cell growth, the current is impeded based on the number of cells covering the electrode, which indicates the velocity of cell movement. The results were collected as impedance versus time. As expected, 2 μM DK223 significantly enhanced the migration velocity of keratinocytes after 24 h compared with the control (Figure 1B).
We used the MTT assay to assess proliferation of HaCaT cells in response to DK223, and the results demonstrated that there was a significant increase in keratinocyte growth with 2 μM DK223 after 48 h (Figure 1C). Whereas the mRNA and protein expression of p53, p21, p27, cyclin D, and cyclin E did not significantly change in 24 h compared with the untreated cells (Figure 1D,E). These observations indicate that DK223 could induce cell migration, as well as proliferation of human keratinocytes.
2.2. DK223 Did not Induced Epithelial–Mesenchymal Transition (EMT) in HaCaT Cells
EMT is critical for wound healing, and tissue regeneration has been shown to induce keratinocyte migration [13]. Thus, we examined the mRNA and protein expression of EMT markers, such as vimentin, E-cadherin, and Slug after DK223 treatment to investigate whether DK223-induced migration affected the EMT process. As shown by Western blot in Figure 2A, two mesenchymal markers, vimentin and Slug, were down-regulated in a time-dependent manner, whereas the adherents junction protein E-cadherin was increased significantly, peaking 24 h after treatment. These results correlated with the changes in mRNA expression measured by RT-PCR (Figure 2B). This suggested that DK223 did not induced EMT, processes in HaCaT cells.
2.3. DK223 Induced NADPH Oxidase Expression and ROS Accumulation
To gain insight into the mechanism of keratinocyte migration induced by DK223, we assessed NADPH oxidase expression and ROS accumulation, as well as the signaling pathways related to cell migration. As demonstrated in Figure 3B,C, NADPH oxidase 4 mRNA and protein expression increased in a time-dependent manner, peaking 2 h after treatment. This correlated with an up-regulation in ROS accumulation, which also peaked at 2 h (Figure 3A), as well as with the effects on cellular signaling pathways. Phosphorylation of AKT was down-regulated at an early time point, while phosphorylation of ERK and JNK increased after 30 min of treatment (Figure 3D–F). These findings suggest a relationship between the early increase in ROS accumulation at 2 h and concomitant changes in intracellular signaling pathways.
2.4. DK223 Affected Signaling Pathways and Cell Migration via ROS Accumulation
To explore the mechanism mediating the effects of DK223 on signaling pathways and ROS accumulation, we pretreated cells with the NADPH inhibitor diphenylene iodonium (DPI) or the ROS scavenger N-acetylcysteine (NAC) prior to treatment with DK223 for 2 h. As expected, NADPH oxidase 4 was inhibited by DPI and NAC pretreatment. NAC also reduced DK223-induced phosphorylation of JNK and ERK. Interestingly, the activation of AKT, which was down-regulated by DK223 at 2 h, was also attenuated significantly in the presence of NAC and DPI (Figure 3G). These results indicated that DK223 induced the phosphorylation of JNK and ERK at 2 h via ROS accumulation. Interestingly, DK223-induced migration was inhibited significantly by

222
NAC and DPI (Figure 3H), which indicated that the migration induced by DK223 might be regulate by ROS accumulation.
Figure 1. Effect of DK223 on the migration and proliferation of HaCaT cells. (A) Cells were seeded at a density of 3 × 10⁴/mL 24 h before the scratch test. Scratch widths were measured 48 h after DK223 treatment. Data represent the mean width percentage ± SD for at least three replicates, * p < 0.05; (B) Cells were seeded at a density of 3 × 10⁴/mL 24 h before treatment. The impedances were measured and analyzed at 24 h after treatment using the ECIS system software. The line data indicate the migration velocity of cells treated with different concentrations of DK223; (C) Cells were seeded overnight before treatment with varying concentrations of DK223 for 48 h. Cells were then incubated with MTT for 4 h at 37 °C, and the absorbance was measured at 570 nm; (D,E) The expression of cell cycle-related proteins in HaCaT cells induced by 2 μM DK223 for 24 h. Protein expression was examined by Western blot analysis with the specific antibodies indicated, and mRNA expression was assessed by RT-PCR with the gene-specific primers indicated. A histogram depicting the ImageJ data analysis results is shown. Values represent means ± SD of three independent experiments, * p < 0.05 compared with the control in all under experiments.

223
Figure 2. Time-dependent expression of EMT-related genes in HaCaT cells after treatment with DK223. (A) Protein expression was examined in HaCaT cells treated with 2 μM DK223 for different time periods using Western blot analysis with the specific antibodies indicated (B) mRNA expression was investigated by RT-PCR with the specific primers indicated.
Figure 3. Time-dependent expression of NAPDH oxidase, ROS accumulation and signaling pathways in HaCaT cells after treatment with DK223. (A) Time- dependent ROS generation was detected in treated HaCaT cells using the DCF-DA assay. Cells were treated with 2 μM DK223 at different times and then stained with DCF-DA to detect ROS generation, as described previously. H2O2 was used as a positive control; (B,C) The expression of NAPDH oxidase 4 was examined by Western blot and RT-PCR, as described previously; (D–F) Signaling pathways were examined by Western blot with the specific antibodies indicated; (G) Cells were pretreated with 10 μM DPI or 20 μM NAC for 2 h before 24 h DK223 incubation. Signaling pathways were examined by Western blot with the specific antibodies indicated; (H) Cells were seeded at a density of 3 × 10⁴/mL 24 h before the scratch test. Scratch widths were measured 48 h after DK223 treatment only or co-treatment with 10 μM DPI or 20 μM NAC. A histogram shows the results of ImageJ data analysis. Values represent means ± SD of three independent experiments, * p < 0.05 in all under experiments.
E-cadherin
Vimentin
Slug
GAPDH
Vimentin
Slug
GAPDH
E-cadherin

224
Figure 3. Cont.
2.5. Migration-Related Proteins Are Down-Regulated by DK223 Treatment in HaCaT Cells
Because the EMT process did not appear to involve DK223-induced migration, we investigated other migration-related proteins, including the MMPs and collagen I and III in serum-free media which was concentrated by protein filter centrifugation (serum could block the filter). It has been demonstrated recently that these proteins could regulate the migration and proliferation of keratinocytes [14,15]. We observed a significant down-regulation in the mRNA and protein expression of collagen I and III after 24 h of DK223 treatment (Figure 4A–C), while the levels of MMP-1 were increased (Figure 4C) [14]. Thus, high levels of this proteinase might degrade collagen I and III upon DK223 treatment. Moreover, another ECM protein, fibronectin, was highly expressed (Figure 4A–C) with DK223 treatment, which might be associated with the

225
down-regulation of MMP7 (Figure 4D). MMP7 is also known as a matrilysin, since it can use fibronectin as a cleavage substrate [15].
Figure 4. Expression of extracellular matrix proteins and migration-related genes in HaCaT cells treated with DK223. (A) mRNA expression was examined in HaCaT cells treated with 2 μM DK223 for 24 h using RT-PCR with the specific primers indicated; (B) Cells were treated with 2 μM DK223 in serum-free media. Conditioned media were removed and concentrated using Amicon centrifugation. Proteins in the media were analyzed by Western blot for collagen I, III, and fibronectin using the specific antibodies indicated; (C) Proteins in the media was analyzed by Western blot for MMP1 using the specific antibodies indicated; (D) mRNA expression was examined in HaCaT cells treated with 2 μM DK223 for 24 h using RT-PCR with the specific primers indicated; (E,F) Zymograph assay of the conditioned media from HaCaT cells treated with 2 μM DK223 for 24 h. Conditioned media were removed and concentrated using Amicon centrifugation. Proteins in the media were analyzed by a gelatin zymograph, as described previously. A histogram shows the results of ImageJ data analysis. Data are represented as the mean percentage of distance ± SD from at least three replicates, * p < 0.05 in all under experiments.
Fibronectin
Collagen III
Collagen I
GAPDH
MMP1
(-actin
(
MMP2MMP9

226
Alternatively, the mRNA expression of two other metalloproteinases, MMP2 and MMP9, also increased slightly compared with the control (Figure 4D), which correlated with results from the zymography assay for gelatinase activity of MMP2 and MMP9 (Figure 4E,F). These results indicate that the effects of DK223 on keratinocyte migration could be mediated by the degradation of collagen via a highly expressed collagenase.
2.6. DK223 Ameliorates Proliferation of Human Dermal Fibroblasts
Tissue formation, which is the second phase of wound healing, is characterized by migration and proliferation of different cell types. After the initiation of keratinocyte migration, fibroblasts tend to proliferate [2]. Therefore, we investigated the effects of DK223 on human dermal fibroblasts. We initially examined the proliferation of dermal fibroblasts in response to DK223 for 24 and 48 h using the MTT assay. These results demonstrated that DK223 induced dermal fibroblast proliferation in a dose-dependent manner in both 24 and 48 h (Figure 5A). There was no significant difference between 2 and 5 μM concentrations of DK223; thus, we used 2 μM in subsequent experiments.
To confirm the enhanced proliferation of fibroblasts treated with DK223, we evaluated the mRNA and protein expression of cell cycle-related genes. As shown by Western blot in Figure 5B, the protein levels of p21, p27 and p53 were down-regulated significantly after a 24 h exposure to 2 μM DK223, while cyclin D and cyclin E were increased. These results correlated with changes in mRNA expression measured by RT-PCR (Figure 5C) except for p27 expression, which was increased after DK223 treatment. These data further indicate that the proliferation of fibroblasts increased with 2 μM DK223 after 24 h.
In addition, the migration results showed that DK223 at 2 and 5 μM significantly enhanced migration of fibroblast in both 24 and 48 h, whereas other concentrations did not give high effects (Figure 5D).
2.7. Dermal Fibroblasts Promote DK223-Induced ECM Deposition
The ECM contains components essential to wound healing, including collagen I, III, and fibronectin [16]. Therefore, we examined ECM protein secretion from fibroblasts induced by DK223 for 24 h. Western blot analysis revealed high levels of collagen I, III and fibronectin with DK223 treatment (Figure 6A), which correlated with mRNA expression (Figure 6B). Another mesenchymal marker, vimentin, was augmented significantly compared with the control, indicating myofibroblast differentiation and possible migration (Figure 6B). Notably, MMP1, a collagenase protein, was inhibited markedly when treated with DK223 (Figure 6B), which could explain the high levels of collagen I and III in DK223-treated fibroblasts. However, differential effects were seen between MMP2 and MMP9, also known as gelatinase A and gelatinase B. MMP2 was up-regulated in DK223 treatment, while MMP9 was down-regulated (Figure 6C,D). Thus, correlating the expression of these MMPs with our results requires further investigation.

227
Figure 5. Proliferation and migration of dermal fibroblasts treated with DK223 and expression of cell- cycle-related genes in dermal fibroblasts after incubation with DK223. (A) Human dermal fibroblasts were seeded at a density of 3 × 10⁴/mL for 24 and 48 h before treatment. MTT assay was performed as described previously; (B,C) The expressions of cell cycle-related genes, such as p21, p53, p27, cyclin E, cyclin D, were examined by Western blot and RT-PCR in 24 h as described previously; (D) Cells were seeded at a density of 3 × 10⁴/mL 24 h before the scratch test. Scratch widths were measured 48 h after DK223 treatment. A histogram shows the results of ImageJ data analysis. Data are represented as the mean distance percentages ± SD from at least three replicates, * p < 0.05 in all under experiments.
(
(

228
Figure 6. Expression of extracellular matrix proteins and metalloproteinase genes. (A) Dermal fibroblasts were treated with 2 μM DK223 in serum-free media. Conditioned media were removed and concentrated using Amicon centrifugation. Proteins in the media were analyzed by Western blot for collagen I, III, fibronectin, MMP1, and vimentin with the specific antibodies indicated; (B) mRNA expression was examined in human dermal fibroblast cells treated with 2 μM DK223 for 24 h using RT-PCR and the specific primers indicated; (C,D) Zymograph assay of conditioned media from dermal fibroblasts treated with 2 μM DK223 for 24 h. Conditioned media were removed and concentrated using Amicon centrifugation. Proteins in the media were analyzed by a gelatin zymograph as described previously. A histogram shows the results of ImageJ data analysis. Data are represented as the mean distance percentages ± SD from at least three replicates, * p < 0.05.
2.8. DK223 Induces TGF-β11 Secretion in Fibroblasts
Fibroblasts have a key role in wound healing because they secrete growth factors and cytokines, such as TGF-β1, connective transforming growth factor (CTGF), IL-6 and IL-8 [17]. We investigated the production of TGF-β1 in DK223-treated fibroblasts to determine whether proliferation could be correlated with collagen deposition in fibroblasts. We found that DK223 significantly increased TGF-β1 mRNA expression (Figure 7A).

229
Figure 7. The effect of DK223 on TGF-β1 expression and on dermal fibroblast signaling pathways in response to a TGF-β1 receptor inhibitor. (A) Dermal fibroblasts were treated with 2 μM DK223 in serum-free media. TGF-β1 mRNA expression was examined in fibroblast cells treated with 2 μM DK223 for 48 h using RT-PCR with specific primers; (B,D) Dermal fibroblasts were treated with 2 μM DK223 in serum-free medium for different time periods; (C,E) Dermal fibroblasts were pretreated with 10 μM TGF-β1 receptor inhibitor (TGFRI)—LY2157299 before incubating with DK223 for 6 h. Signaling pathways were examined by Western blot with the specific antibodies indicated. A histogram shows the results of ImageJ data analysis. Values represent the means ± SD of three independent experiments, * p < 0.05 compared with the control in all under experiments.
It has been suggested that TGF-β1 might promote fibroblast proliferation [18]. Thus, we investigated the correlations between DK223-induced TGF-β1 cellular changes in fibroblasts by examining the activation of various signaling pathways. The results demonstrated that the phosphorylation of AKT, a potential oncogene, was elevated in a time-dependent manner (Figure 7D). In addition, we observed early activation of pSmad2 at 1 h and increased phosphorylation of pSmad3 (Figure 7B) accompanied by the significant activation of JNK at 6 h
(
(
(
(
(
(
(

230
(Figure 7D). These events indicate that DK223 activates the JNK/pSmad3L/c-Myc oncogenic pathway that mediates increased proliferation of fibroblasts. Interestingly, ERK phosphorylation was down-regulated below basal levels after an initial early increase at 1 h (Figure 7D). This could be the mechanism underlying the anti-proliferative response of the Ras/Raf/MEK/ERK signaling pathway that was previously reported in primary human fibroblasts [19,20]. Taken together, these results suggest that TGF-β1 signaling pathways mediate fibroblast proliferation in response to DK223.
To confirm the involvement of TGF-β1, we treated cells with a TGF-β1 receptor inhibitor (TGFRI), which significantly inhibited pSmad2, pSmad3, JNK, and Akt phosphorylation (Figure 7C,E). Furthermore, TGFRI pretreatment restored ERK phosphorylation to normal levels (Figure 7E). In summary, our results indicate that DK223 modified cellular signaling pathways by elevating TGF-β1 secretion.
3. Discussion
The wound repair process protects the human body from infections and fluid loss; yet, it results in scar formation. In this study, we investigated the effects of DK223 on wound healing processes with the expectation that DK223 could induce skin regeneration.
Skin regeneration is characterized by a re-epithelialization process that covers the wound surface and stimulates re-angiogenesis [21]. After the wound has been blocked by a blood clot, fibroblasts begin secreting ECM proteins, such as collagen III and fibronectin. These proteins reorganize the base structure under the blood clot to aid in keratinocyte migration [1]. We have studied this phenomenon by treating human keratinocytes with different concentrations of DK223 in vitro. While DK223 did not promote keratinocyte cell growth, migration was enhanced significantly. Mesenchymal markers, such as Vimentin and Slug, were down-regulated in a time-dependent manner, whereas the epithelial marker E-cadherin was increased markedly. This indicates that keratinocytes did not induce the EMT process and that the cells were bound together more tightly as migration increased. This phenomenon was compatible with our previous report of increased keratinocyte migration and higher levels of junction and adherent proteins, such as E-cadherin [22]. This was also reported by Li et al., who showed that a whole sheet of epithelial cells could migrate while maintaining tight cell-cell adhesion, a phenomenon they called “collective migration” [23]. As shown in Figure 3, DK223 significantly up-regulated E-cadherin, which plays an important role in re-epithelialization since adherent junctions prevent the epithelial barrier from further damage after wounding [23]. This indicates that DK223 was able to induce collective migration to protect the epithelial barrier from wounds.
In a recent study, Kim et al. demonstrated that HaCaT keratinocyte migration was induced by the EGF-like ligand neuregulin, which was activated via Rac1 and Nox-driven ROS accumulation [24]. In our study, DK223 also significantly increased HaCaT cell migration via intracellular signaling pathways. Our results demonstrated that ROS accumulation peaked at 2 h, along with signaling proteins, such as AKT and ERK. In recent studies, AKT2 was shown to induce cell migration [25] and ERK/MAPK phosphorylation might be activated by ROS [26,27]. In addition, ERK/MAPK phosphorylation ameliorated keratinocyte migration [28]. In light of these

231
results, we propose that DK223 induces keratinocyte migration by modulating intracellular signaling pathways via ROS accumulation.
Dermal fibroblasts are the primary ECM-producing cell type in the skin [29]. Once the wound has formed a blood clot via fibrin, dermal fibroblasts proliferate and infiltrate under the wound [16]. These cells secrete collagen and fibronectin, which replace the clot fibrin to accelerate wound closure [16]. Nevertheless, ECM accumulation in instances of excessive healing may cause unaesthetic scars [2]. In this study, DK223 induced keratinocyte migration and promoted the fibroblast-to-myofibroblast transition to help the wound heal more rapidly [30], with the evidence that vimentin was upregulated in fibroblasts, whereas it modulated ECM production in keratinocytes and fibroblasts. Furthermore, DK223 treatment increased fibronectin expression in both fibroblasts and keratinocytes. It is well known that fibronectin, which is normally produced in the first stage of wound healing, acts as the scaffold for collagen deposition and assists in cell migration to promote the wound healing process [31,32]. Collagens I and III are the main products of the wound healing process. Production of these collagens is necessary for wound healing; however, collagen deposition can promote scar formation. Thus, collagen production must be controlled for ideal wound healing. The DK223 effect resulted in increased collagen in fibroblasts, whereas a reduction in keratinocytes was seen. Correspondingly, levels of the collagenase MMP1 were also increased in keratinocytes and reduced in fibroblasts. These observations suggest a regulatory role for DK223 in maintaining the balance of ECM production in skin repair. Similarly, Xie et al. reported that basic fibroblast growth factor (bFGF) improved wound healing by regulating the balance of ECM synthesis and degradation [33]. These simultaneous effects balance ECM production in the wound healing process and might prevent keloid scar formation. Thus, DK223 differentially modulates MMPs and ECM production in keratinocytes and fibroblasts to regulate individual cell functions during wound healing.
According to our data, DK223 affects both keratinocyte migration and fibroblast proliferation to accelerate the wound healing process. It has been previously demonstrated that other novel compounds also exhibit similar effects. Lee et al. reported that heat-processed ginseng (sun ginseng) protected against UVB-induced damage in keratinocytes and fibroblasts by restoring Bcl-2 and Bcl-xL mRNA levels in keratinocytes to reduce UVB-induced apoptosis, and promote procollagen production in dermal fibroblasts by inhibiting MMP-1 gene expression [34]. Werner et al. also reported that the keratinocyte-fibroblast interaction is also important for wound healing as keratinocytes modulate fibroblast to myofibroblast differentiation by secreting the growth factor-like TGF-β1, which increases production of myofibroblasts in ECM [35]. Moreover, Singh et al. suggested an alternative approach for wound healing by focusing on the effects of traditional medicines on keratinocytes and fibroblasts. Their bioactive compound increased both types of skin cells and reduced free-radical production to support the wound closure process [36].
TGF-β1 can participate in the wound healing process by inducing fibroblast migration and proliferation [37], activating the MMP family [38] and stimulating re-epithelialization [37]. It has been demonstrated that TGF-β1 expression was elevated significantly by excessive wound healing, leading to keloid scarring [39,40]. In our study, DK223 slightly increased TGF-β1 expression in fibroblasts, indicating that it did not promote scarring.

232
4. Materials and Methods
4.1. Reagent
The DK223 (Figure 1A) compound was synthesized and kindly provided by Youngho Lim in the Division of Bioscience and Biotechnology, Konkuk University, Seoul, Korea. K2CO3 (5 mmol, 692 mg) was dissolved in a solution of 2-hydroxy-5-methoxybenzaldehyde (I, 5 mmol, 760 mg) and acrolein (II, 7 mmol, 0.5 mL) in 1,4-dioxane (50 mL) and the reaction mixture was refluxed for 6 h. The solvent was evaporated and residue was extracted with diethyl ether (100 mL) and water (50 mL). Combined organic layers were dried over MgSO4. Filtration and evaporation produced aldehyde (III, 86%, m.p. 48–50 °C), which was used for next step without further purification. p-Nitroacylhydrazine (IV, 2 mmol, 334 mg) and 6-methoxy-2H-chromene-3-carbaldehyde (III, 3 mmol, 570 mg) were dissolved in ethanol (30 mL) and a catalytic volume of conc. HCl was added. The resulting mixture was refluxed for 2 h. The reaction formed intermediates V and VI, which eventually produced DK233. A similar reaction has been reported previously [41]. After cooling to room temperature, the resulting precipitate was filtered and washed with ethanol. Recrystallization of crude solid resulted in pure DK223 (355 mg, 50%, m.p. 246–250 °C; (Figure 8B)).
Figure 8. (A) Chemical structure of DK223; (B) Method of DK223 synthesis, as described in the Materials and Methods section.
(A)
(B)
233
4.2. Cell Culture
In this study, we used the spontaneously immortalized keratinocyte cell line (HaCaT) and human dermal fibroblasts. HaCaT cells were cultured in RPMI medium (GIBCO, Grand Island, NY, USA) supplemented with 10% fetal bovine serum (FBS; GIBCO) and 1% penicillin/streptomycin (PAA Laboratories GmBH, Strasse, Austria). Human dermal fibroblast cells were cultured in DMEM media supplemented with 10% FBS (GIBCO) and 1% penicillin/streptomycin (PAA). Cells were incubated in a humidified atmosphere at 37 °C with 5% CO2.
4.3. Scratch Wound Healing Assay
HaCaT cells were seeded in a 48-well plate before a 24 h wound healing scratch assay [42]. The scratch wound was made using a sterile 200 μL pipette tip to scratch a line across the bottom of the culture dish. Culture media was then removed and replaced with fresh media supplemented with DK223 or dimethyl sulfoxide (DMSO) (Amresco, Solon, OH, USA) as a control. Photographs were taken at 4× magnification using an OLYMPUS IX70 microscope equipped with a digital camera before treatment and 48 h after treatment. The width of the scratch was measured by the distance from the both edge of scratch by ImageJ software (National Institutes of Health, Bethesda, MD, USA). Each scratch was measured 60 times across the span of wound scratch and calculated the average to compare the migration after 24 or 48 h. The experiments were repeated 3 dependent times.
4.4. Migration Assay with the Electric Cell-Substrate Impedance Sensing (ECIS) System
ECIS® (Electric Cell-substrate Impedance Sensing) is a real-time, label-free, impedance-based method of assessing the activities of cells grown in tissue culture. When cells are added to the ECIS Arrays and attached to the electrodes, they act as insulators and increase the impedance. As cells grow and cover the electrodes, the current is impeded in a manner related to the number of cells covering the electrode, the morphology of the cells, and the nature of the cell attachment. When cells are stimulated to change their function, the accompanying changes in cell morphology alter the impedance. Data are generated as impedance versus time.
Electrode plates (eight wells, Applied Biophysics, Troy, NY, USA) were induced with an electrode-stabilizing solution provided by the manufacturer 10 min prior to seeding with HaCaT cells overnight. Cells were then treated with different concentrations of DK223. After 24 h, the electrode plates were placed in the ECIS apparatus in the incubator for migration analysis using the ECIS system software, according to the manufacturer’s instructions (Applied Biophysics, Troy, NY, USA).
4.5. MTT Assay
Cells were seeded in a 96-well plate at a density of 3 × 10⁴/mL. HaCaT cells were treated with DK223 or DMSO for 24 h, while dermal fibroblasts were treated for 48 h. MTT solution 5 mg/mL (Amresco, OH, USA) was added to each well and incubated at 37 °C for 4 h. The medium was

234
then gently removed and replaced with 150 μL DMSO, followed by shaking for 30 min to dissolve the precipitate, and the absorbance was measured at 570 nm.
4.6. Western Blot
Cells were treated with DK223 or DMSO in a time- and dose-dependent manner. Cells lysate proteins were then harvested using a cell scraper and lysed in RIPA buffer. The protein concentration was determined using the bicinchoninic (BCA) assay (Thermo Scientific, Rockford, IL, USA). The protein in conditioned media (serum free media after treated cell with DK223) was concentrated by Amicon (Milipore, Darmstadt, Germany) centrifuge following manufacture instruction. The protein in media after centrifugation was determined the concentration using the Bardford assay (Bio-Rad, Hercules, CA USA). The proteins were separated by SDS-PAGE, followed by Western blot using the appropriate antibodies.
All antibodies for Western blot were purchased commercially and prepared according to the manufacturer’s protocol. p21 (2947), AKT (9272), phosphorylated AKT (9271S), ERK (4695), Slug (9585S), and GAPDH (2118) were obtained from Cell Signaling (Danvers, MA, USA). E-cadherin (610181) was purchased from BD Science Transduction (San Jose, CA, USA). Cyclin E (sc-247), cyclin D1 (sc-246), p53 (sc-126), phosphorylated ERK (sc-7383), collagen I (sc-25974), collagen III (sc-28888), and fibronectin (sc-9068) were purchased from Santa Cruz Biotechnologies (Santa Cruz, Dallas, TX, USA). MMP1 (444209) was purchased from Calbiochem (Hessen, Darmstadt, Germany). We used anti-mouse (PI-2000, Vector Labs Inc., Burlingame, CA, USA), anti-rabbit (PI-1000, Vector Labs), and anti-goat (AP-107P, Millipore, Billerica, MA, USA) secondary antibodies. Differences were confirmed using ImageJ software to determine the relative ratio of changes in the target protein levels to those of the DMSO control.
4.7. RT-PCR
Total RNA from treated cells was extracted using TRIzol reagent (Invitrogen, Grand Island, NY, USA). Equal amounts of total RNA in each treatment group were used to synthesize cDNA using a reverse transcriptase kit (Promega, Seoul, Korea). The resulting cDNA was used for RT-PCR using the G-Taq kit (Cosmo Genetech, Seoul, Korea) based on the manufacturer’s protocols.
RT-PCR was performed using the following gene-specific primers designed using the Blast Primer website: GAPDH, forward primer 5'-GAAGGTGAAGGTCGGAGTC-3', reverse primer 5'-GAAGATGGTGATGGATTTC-3'; p53, forward primer 5'-ACACGCTTCCCTGGATTGG-3', reverse primer 5'-CTGGCATTCTGGGAGCTTCA-3'; p21, forward primer 5'-GTCAGTTCCTTGAGCCG-3', reverse primer 5'-GAAGGTAGAGCTTGGGCAGG-3'; and MMP1, forward primer 5'-AGGGGAGATCATCGGGAC-3', reverse primer 5'-GGCTGGACAGGATTTTGG-3'; MMP2, forward primer 5'-AACACCTTCTATGGCTGCCC-3', reverse primer 5'-ACGAGCAAAGGCATCACCA-3'; MMP7, forward primer 5'-TACAGTGGGAACAGGCTAGG-3', reverse primer 5'-GGCACTCCACATCTGGGC-3'. ImageJ software was used to analyze the results and the relative ratio of changes in the target gene to those of the DMSO control.

235
4.8. MMP Zymograph Assay
An MMP zymograph assay was performed according to the method described by Gogly et al. and modified with use of 8% sodium dodecyl sulfate (SDS) gels mixed with gelatin (0.01 mg/mL). The SDS in the gels was removed by two 30 min incubations in 200 mL 2.5% Triton X-100 at 4 °C, and the gel slabs were incubated at 37 °C overnight in incubation buffer. The gels were subsequently fixed and stained for 1 h in 0.05% Coomassie Blue R-250. The molecular weight protein marker was clearly visible as light blue bands against the blue background. Gelatinase activity was detected as clear zones of negative staining against the blue background. The gels were scanned as permanent records of the results [43].
4.9. ROS Generation Analysis
Accumulation of ROS was measured based on ROS-dependent oxidation of the oxidation-sensitive fluorescent probe 2'7'-dichlorofluorescin diacetate (DCFH-DA) to DCF [44]. Cells were seeded in a 96-well plate (3 × 10⁴ cells/mL) for 24 h before flavonoid treatment and then treated with 2 μM DK223 for 0, 0.5, 1, 2, 12, and 24 h. H2O2 was used as a positive control. The cells were washed with PBS before removing medium, 200 μL of DCFH-DA (100 μM in PBS containing 1% FBS) were added, and the cells were incubated for 30 min at 37 °C in the dark. Intracellular ROS accumulation was measured using DCFH-DA with a DCF-DA microplate assay. A spectrofluorometer (SPECTRAFLUOR, Tecan, Männedorf, Switzerland) was used to assess ROS generation by measuring the fluorescence intensities from 10,000 cells/well at an excitation wavelength of 485 nm and an emission wavelength of 530 nm.
4.10. Statistics
The results were expressed as means ± standard deviation (S.D.). Group comparisons were performed using the SPSS v.16.0 software (SPSS Inc., Chicago, IL, USA) with one-way analysis (ANOVA) and Student’s t-test. p < 0.05 was considered to indicate statistical significance. All experiments were repeated at least in triplicate.
5. Conclusions
In conclusion, the novel compound DK223 has potent capabilities in wound healing and skin regeneration. It induced keratinocyte migration and fibroblast proliferation, while maintaining balance among ECM proteins, such as collagen I, III, and fibronectin. Taken together, DK223 potentially aids wound healing and attenuates keloid scar development.
Acknowledgments
This work was supported by a grant from the Next Generation BioGreen 21 Program (No. PJ009045) funded by the Rural Development Administration, Korea.

236
Author Contributions
Manh Tin Ho and Hyun Sik Kang designed and carried out the experiments. Jung Sik Huh prepared and supplied primary human dermal fibroblast. Young Mee Kim planned and discussed in results analysis and arrangement. Youngho Lim synthesized and supplied the novel compound DK223. Moonjae Cho wrote the manuscript and supervised all the process.
Conflicts of Interest
The authors declare no conflict of interest.
References
1. Reinke, J.M.; Sorg, H. Wound repair and regeneration. Eur. Surg. Res. Eur. Chir. Forsch. Rech. Chir. Eur. 2012, 49, 35–43.
2. Gurtner, G.C.; Werner, S.; Barrandon, Y.; Longaker, M.T. Wound repair and regeneration. Nature 2008, 453, 314–321.
3. Cowan, M.M. Plant products as antimicrobial agents. Clin. Microbiol. Rev. 1999, 12, 564–582.
4. Lopez-Jornet, P.; Camacho-Alonso, F.; Gomez-Garcia, F.; Molina Minano, F.; Canas, X.; Serafin, A.; Castillo, J.; Vicente-Ortega, V. Effects of potassium apigenin and verbena extract on the wound healing process of SKH-1 mouse skin. Int. Wound J. 2012, doi:10.1111/j.1742-481X.2012.01114.x.
5. Duarte, C.M.; Quirino, M.R.; Patrocinio, M.C.; Anbinder, A.L. Effects of Chamomilla recutita (L.) on oral wound healing in rats. Med. Oral Patol. Oral Y Cir. Bucal 2011, 16, e716–e721.
6. Philips, N.; Samuel, M.; Arena, R.; Chen, Y.J.; Conte, J.; Natarajan, P.; Haas, G.; Gonzalez, S. Direct inhibition of elastase and matrixmetalloproteinases and stimulation of biosynthesis of fibrillar collagens, elastin, and fibrillins by xanthohumol. J. Cosmet. Sci. 2010, 61, 125–132.
7. Galicka, A.; Nazaruk, J. Stimulation of collagen biosynthesis by flavonoid glycosides in skin fibroblasts of osteogenesis imperfecta type I and the potential mechanism of their action. Int. J. Mol. Med. 2007, 20, 889–895.
8. Johnson, L.L.; Dyer, R.; Hupe, D.J. Matrix metalloproteinases. Curr. Opin. Chem. Biol. 1998, 2, 466–471.
9. Dang, C.M.; Beanes, S.R.; Lee, H.; Zhang, X.; Soo, C.; Ting, K. Scarless fetal wounds are associated with an increased matrix metalloproteinase-to-tissue-derived inhibitor of metalloproteinase ratio. Plast. Reconstr. Surg. 2003, 111, 2273–2285.
10. Kahari, V.M.; Saarialho-Kere, U. Matrix metalloproteinases in skin. Exp. Dermatol. 1997, 6, 199–213.
11. Catanzaro, R.; Marotta, F.; Jain, S.; Rastmanesh, R.; Allegri, F.; Celep, G.; Lorenzetti, A.; Polimeni, A.; Yadav, H. Beneficial effect of a sturgeon-based bioactive compound on gene expression of tumor necrosis factor-alpha, matrix metalloproteinases and type-10 collagen in human chondrocytes. J. Biol. Regul. Homeost. Agents 2012, 26, 337–345.

237
12. Lee, K.H. Discovery and development of natural product-derived chemotherapeutic agents based on a medicinal chemistry approach. J. Nat. Prod. 2010, 73, 500–516.
13. Rasanen, K.; Vaheri, A. TGF-beta1 causes epithelial-mesenchymal transition in HaCaT derivatives, but induces expression of COX-2 and migration only in benign, not in malignant keratinocytes. J. Dermatol. Sci. 2010, 58, 97–104.
14. Barrientos, S.; Stojadinovic, O.; Golinko, M.S.; Brem, H.; Tomic-Canic, M. Growth factors and cytokines in wound healing. Wound Repair Regen. 2008, 16, 585–601.
15. Visse, R.; Nagase, H. Matrix metalloproteinases and tissue inhibitors of metalloproteinases: Structure, function, and biochemistry. Circ. Res. 2003, 92, 827–839.
16. McDougall, S.; Dallon, J.; Sherratt, J.; Maini, P. Fibroblast migration and collagen deposition during dermal wound healing: Mathematical modelling and clinical implications. Philos. Trans. Ser. A Math. Phys. Eng. Sci. 2006, 364, 1385–1405.
17. Wick, G.; Backovic, A.; Rabensteiner, E.; Plank, N.; Schwentner, C.; Sgonc, R. The immunology of fibrosis: Innate and adaptive responses. Trends Immunol. 2010, 31, 110–119.
18. Leask, A.; Abraham, D.J. TGF-beta signaling and the fibrotic response. FASEB J. 2004, 18, 816–827.
19. Steelman, L.S.; Chappell, W.H.; Abrams, S.L.; Kempf, R.C.; Long, J.; Laidler, P.; Mijatovic, S.; Maksimovic-Ivanic, D.; Stivala, F.; Mazzarino, M.C.; et al. Roles of the Raf/MEK/ERK and PI3K/PTEN/Akt/mTOR pathways in controlling growth and sensitivity to therapy-implications for cancer and aging. Aging 2011, 3, 192–222.
20. Chang, F.; Steelman, L.S.; Lee, J.T.; Shelton, J.G.; Navolanic, P.M.; Blalock, W.L.; Franklin, R.A.; McCubrey, J.A. Signal transduction mediated by the Ras/Raf/MEK/ERK pathway from cytokine receptors to transcription factors: Potential targeting for therapeutic intervention. Leukemia 2003, 17, 1263–1293.
21. Murawala, P.; Tanaka, E.M.; Currie, J.D. Regeneration: The ultimate example of wound healing. Semin. Cell Dev. Biol. 2012, 23, 954–962.
22. Bui, N.T.; Ho, M.T.; Kim, Y.M.; Lim, Y.; Cho, M. Flavonoids promoting HaCaT migration: II. Molecular mechanism of 4',6,7-trimethoxyisoflavone via NOX2 activation. Phytomedicine 2014, 21, 570–577.
23. Li, L.; Hartley, R.; Reiss, B.; Sun, Y.; Pu, J.; Wu, D.; Lin, F.; Hoang, T.; Yamada, S.; Jiang, J.; et al. E-cadherin plays an essential role in collective directional migration of large epithelial sheets. Cell Mol. Life Sci. 2012, 69, 2779–2789.
24. Kim, J.S.; Bak, E.J.; Lee, B.C.; Kim, Y.S.; Park, J.B.; Choi, I.G. Neuregulin induces HaCaT keratinocyte migration via Rac1-mediated NADPH-oxidase activation. J. Cell. Physiol. 2011, 226, 3014–3021.
25. Irie, H.Y.; Pearline, R.V.; Grueneberg, D.; Hsia, M.; Ravichandran, P.; Kothari, N.; Natesan, S.; Brugge, J.S. Distinct roles of Akt1 and Akt2 in regulating cell migration and epithelial-mesenchymal transition. J. Cell Biol. 2005, 171, 1023–1034.
26. Thannickal, V.J.; Fanburg, B.L. Reactive oxygen species in cell signaling. Am. J. Physiol. Lung Cell Mol. Physiol. 2000, 279, L1005–L1028.
27. Jiang, F.; Zhang, Y.; Dusting, G.J. NADPH oxidase-mediated redox signaling: Roles in cellular stress response, stress tolerance, and tissue repair. Pharmacol. Rev. 2011, 63, 218–242.

238
28. Huang, C.; Jacobson, K.; Schaller, M.D. MAP kinases and cell migration. J. Cell Sci. 2004, 117, 4619–4628.
29. Roh, S.S.; Lee, M.H.; Hwang, Y.L.; Song, H.H.; Jin, M.H.; Park, S.G.; Lee, C.K.; Kim, C.D.; Yoon, T.J.; Lee, J.H. Stimulation of the extracellular matrix production in dermal fibroblasts by velvet antler extract. Ann. Dermatol. 2010, 22, 173–179.
30. Van de Water, L.; Varney, S.; Tomasek, J.J. Mechanoregulation of the myofibroblast in wound contraction, scarring, and fibrosis: Opportunities for new therapeutic intervention. Adv. Wound Care 2013, 2, 122–141.
31. Kischer, C.W.; Hendrix, M.J. Fibronectin (FN) in hypertrophic scars and keloids. Cell Tissue Res. 1983, 231, 29–37.
32. Spyrou, G.E.; Naylor, I.L. The effect of basic fibroblast growth factor on scarring. Br. J. Plast. Surg. 2002, 55, 275–282.
33. Xie, J.; Bian, H.; Qi, S.; Xu, Y.; Tang, J.; Li, T.; Liu, X. Effects of basic fibroblast growth factor on the expression of extracellular matrix and matrix metalloproteinase-1 in wound healing. Clin. Exp. Dermatol. 2008, 33, 176–182.
34. Lee, H.; Lee, J.Y.; Song, K.C.; Kim, J.; Park, J.H.; Chun, K.H.; Hwang, G.S. Protective effect of processed panax ginseng, sun ginseng on UVB-irradiated human skin keratinocyte and human dermal fibroblast. J. Ginseng Res. 2012, 36, 68–77.
35. Werner, S.; Krieg, T.; Smola, H. Keratinocyte-fibroblast interactions in wound healing. J. Investig. Dermatol. 2007, 127, 998–1008.
36. Singh, D.; Choi, S.M.; Zo, S.M.; Painuli, R.M.; Kwon, S.W.; Han, S.S. Effect of extracts of terminalia chebula on proliferation of keratinocytes and fibroblasts cells: An alternative approach for wound healing. Evid. Based Complement. Altern. Med. 2014, 2014, 701656.
37. Werner, S.; Grose, R. Regulation of wound healing by growth factors and cytokines. Physiol. Rev. 2003, 83, 835–870.
38. Werb, Z.; Tremble, P.; Damsky, C.H. Regulation of extracellular matrix degradation by cell extracellular matrix interations. Cell Differ. Dev. 1990, 32, 299–306.
39. Lin, R.Y.; Sullivan, K.M.; Argenta, P.A.; Meuli, M.; Lorenz, H.P.; Adzick, N.S. Exogenous transforming growth factor-beta amplifies its own expression and induces scar formation in a model of human fetal skin repair. Ann. Surg. 1995, 222, 146–154.
40. Ghahary, A.; Shen, Y.J.; Scott, P.G.; Gong, Y.; Tredget, E.E. Enhanced expression of mRNA for transforming growth factor-beta, type I and type III procollagen in human post-burn hypertrophic scar tissues. J. Lab. Clin. Med. 1993, 122, 465–473.
41. Rando, D.G.; Doriguetto, A.C.; Tomich de Paula da Silva, C.H.; Ellena, J.; Sato, D.N.; Leite, C.Q.; Varanda, E.A.; Ferreira, E.I. A duplicated nitrotienyl derivative with antimycobacterial activity: Synthesis, X-ray crystallography, biological and mutagenic activity tests. Eur. J. Med. Chem. 2006, 41, 1196–200.
42. Park, S.-Y.; Lim, H.K.; Lee, S.; Hwang, H.C.; Cho, S.K.; Cho, M. Pepsin-solubilised collagen (PSC) from Red Sea cucumber (Stichopus japonicas) regulates cell cycle and the fibronectin synthesis in HaCaT cell migration. Food Chem. 2012, 132, 487–492.

239
43. Gogly, B.; Groult, N.; Hornebeck, W.; Godeau, G.; Pellat, B. Collagen zymography as a sensitive and specific technique for the determination of subpicogram levels of interstitial collagenase. Anal. Biochem. 1998, 255, 211–216.
44. Wang, H.; Joseph, J.A. Quantifying cellular oxidative stress by dichlorofluorescein assay using microplate reader. Free Radic. Biol. Med. 1999, 27, 612–616.
240
4. Computational Model for Drug
Development
Prediction of Protein–Protein Interaction with Pairwise
Kernel Support Vector Machine
Shao-Wu Zhang, Li-Yang Hao and Ting-He Zhang
Abstract: Protein–protein interactions (PPIs) play a key role in many cellular processes. Unfortunately, the experimental methods currently used to identify PPIs are both time-consuming and expensive. These obstacles could be overcome by developing computational approaches to predict PPIs. Here, we report two methods of amino acids feature extraction: (i) distance frequency with PCA reducing the dimension (DFPCA) and (ii) amino acid index distribution (AAID) representing the protein sequences. In order to obtain the most robust and reliable results for PPI prediction, pairwise kernel function and support vector machines (SVM) were employed to avoid the concatenation order of two feature vectors generated with two proteins. The highest prediction accuracies of AAID and DFPCA were 94% and 93.96%, respectively, using the 10 CV test, and the results of pairwise radial basis kernel function are considerably improved over those based on radial basis kernel function. Overall, the PPI prediction tool, termed PPI-PKSVM, which is freely available at http://159.226.118.31/PPI/index.html, promises to become useful in such areas as bio-analysis and drug development.
Reprinted from Int. J. Mol. Sci. Cite as: Zhang, S.-W.; Hao, L.-Y.; Zhang, T.-H. Prediction of Protein–Protein Interaction with Pairwise Kernel Support Vector Machine. Int. J. Mol. Sci. 2014, 15, 3220-3233.
1. Introduction
Protein–protein interactions (PPIs) play an important role in such biological processes as host immune response, the regulation of enzymes, signal transduction and mediating cell adhesion. Understanding PPIs will bring more insight to disease etiology at the molecular level and potentially simplify the discovery of novel drug targets [1]. Information about protein–protein interactions have also been used to address many biological important problems [2–5], such as prediction of protein function [2], regulatory pathways [3], signal propagation during colorectal cancer progression [4], and identification of colorectal cancer related genes [5]. Experimental methods of identifying PPIs can be roughly categorized into low- and high-throughput methods [6]. However, PPI data obtained from low-throughput methods only cover a small fraction of the complete PPI network, and high-throughput methods often produce a high frequency of false PPI information [7]. Moreover, experimental methods are expensive, time-consuming and labor-

241
intensive. The development of reliable computational methods to facilitate the identification of PPIs could overcome these obstacles.
Thus far, a number of computational approaches have been developed for the large-scale prediction of PPIs based on protein sequence, structure and evolutionary relationship in complete genomes. These methods can be roughly categorized into those that are genomic-based [8,9], structure-based [10], and sequence-based [11–26]. Genomic- and structure-based methods cannot be implemented if prior information about the proteins is not available. Sequence-based methods are more universal, but they concatenate the two feature vectors of protein Pa and Pb to represent the protein pair Pa–Pb, and the concatenation order of two feature vectors will affect the prediction results. For example, if we use feature vectors to represent protein Pa and Pb, respectively, then the Pa–Pb protein pair can be expressed as , or . In general, however,
is not equal to . Furthermore, PPIs have a symmetrical character; that is, the
interaction of protein Pa with protein Pb equals the interaction of protein Pb with protein Pa. Under these circumstances, concatenating two feature vectors of protein Pa and Pb to represent the protein pair Pa–Pb and then using the traditional kernel to predict PPIs would not be workable.
Therefore, in this paper, we introduced two kinds of feature extraction approaches, amino acid distance frequency with PCA reducing the dimension (DFPCA) and amino acid index distribution (AAID) to represent the protein sequences, followed by the use of pairwise kernel function and SVM to predict PPI.
2. Results and Discussion
LIBSVM [27], loaded from http://www.csie.ntu.edu.tw/~cjlin, is a library for Support Vector Machines (SVMs), and it was used to design the classifier in this paper. The kernel program of the software was modified to the pairwise kernel functions, which were formed by the RBF genomic kernel function in all experiments.
2.1. The Results of DFPCA and AADI with KII Pairwise Kernel Function SVM
In statistical prediction, the following three cross-validation methods are often used to examine a predictor for its effectiveness in practical application: independent dataset test, K-fold crossover or subsampling test, and jackknife test [28]. However, of the three test methods, the jackknife test is deemed the least arbitrary that can always yield a unique result for a given benchmark dataset as demonstrated by Equations (28)–(30) in [29]. Accordingly, the jackknife test has been increasingly and widely used by investigators to examine the quality of various predictors (see, e.g., [30–41]). However, to reduce the computational time, we adopted the 10-fold cross-validation (10 CV) test in this study as done by many investigators with SVM as the prediction engine.
The four feature vector sets, Hf, Vf, Pf, and Zf, extracted with DFPCA and the five feature vector sets, LEWP710101, QIAN880138, NADH010104, NAGK730103 and AURR980116, extracted with AAID were employed as the input feature vectors for KII pairwise radial basis kernel function (PRBF) SVM. The results of DFPCA and AAID are summarized in Table 1.
From Table 1, we can see that the performances of the two feature extraction approaches, i.e., amino acid distance frequency with PCA (DFPCA) and amino acid index distribution (AAID), are
,a bx x
ab a bx x x� + ba b ax x x� +
a bx x+ b ax x+
1 2( , )k x x
1 2( , )K x x

242
nearly equal when using the KII pairwise kernel SVM. The total prediction accuracies are 93.69%~94%. As previously noted, we used just five amino acid indices, including LEWP710101, QIAN880138, NADH010104, NAGK730103 and AURR980116, to produce the feature vector sets. When we tested the performance of AAID against the remaining 480 amino acid indices from AAindex, we found that the amino acid index does affect predictive results and that the total prediction accuracies of those amino acid indices were 79.4%~94%. Among our original five indices, as noted above, the performance of AAID was superior in comparison to the results from AAindex. To account for the better performance of our five indices, we point to the physicochemical and biochemical properties of amino acids. By single-linkage clustering, one of agglomerative hierarchical clustering methods, Tomii and Kanehisa [42] divided the minimum spanning of these amino acid indices into six regions: α and turn propensities, β propensity, amino acid composition, hydrophobicity, physicochemical properties, and other properties. The indices of LEWP710101, QIAN880138, NAGK730103 and AURR980116 are arranged into the region of α and turn propensities, while NADH010104 is arranged into the hydrophobicity region, indicating that the properties of α and turn propensities, and hydrophobicity contain more distinguishable information for predicting PPIs.
Table 1. Results of DFPCA and AAID with PRBF SVM in 10 CV test.
Feature Set Sn (%) PPV (%) ACC (%) MCC Hf 95.94 ± 1.92 91.98 ± 2.88 93.78 ± 1.44 0.8765 Vf 95.66 ± 2.75 92.52 ± 2.40 93.96 ± 1.86 0.8798 Pf 95.78 ± 2.23 92.07 ± 1.69 93.76 ± 1.93 0.8760 Zf 96.06 ± 1.24 91.71 ± 3.13 93.69 ± 1.86 0.8747
LEWP710101 95.86 ± 2.23 92.08 ± 4.32 93.80 ± 2.42 0.8768 QIAN880138 96.06 ± 2.83 92.27 ± 1.50 94.00 ± 1.22 0.8808 NADH010104 95.82 ± 2.98 92.04 ± 2.51 93.76 ± 1.66 0.8760 NAGK730103 96.06 ± 2.83 92.09 ± 4.02 93.90 ± 3.31 0.8789 AURR980116 95.94 ± 2.07 92.33 ± 1.42 93.98 ± 1.24 0.8804
2.2. The Comparison of Pairwise Kernel Function with Traditional Kernel Function
In order to evaluate the performance of pairwise kernel function, we compared the results of pairwise radial basis kernel function (PRBF) and radial basis function kernel (RBF) with the same feature vector sets. For RBF, we concatenate the two feature vectors of protein Pa and protein Pb to represent the protein pair Pa – Pb; that is, feature vector was used as the input feature
vector of RBF. The results of RBF and PRBF with DFPCA in the 10CV test are listed in Table 2.
ab a bx x x� +

243
Table 2. Results of RBF and PRBF with DFPCA in the 10 CV test.
Feature Set Kernel Function Sn (%) PPV (%) ACC (%)
Hf RBF 89.96 ± 0.52 89.65 ± 2.17 89.88 ± 1.05
PRBF 95.94 ± 1.92 91.98 ± 2.88 93.78 ± 1.44
Vf RBF 90.20 ± 1.31 89.33 ± 2.60 89.72 ± 1.72
PRBF 95.66 ± 2.75 92.52 ± 2.40 93.96 ± 1.86
Pf RBF 89.32 ± 0.86 89.26 ± 2.91 89.28 ± 1.44
PRBF 95.78 ± 2.23 92.07 ± 1.69 93.76 ± 1.93
Zf RBF 90.84 ± 1.85 88.79 ± 2.50 89.64 ± 1.18
PRBF 96.06 ± 1.24 91.71 ± 3.13 93.69 ± 1.86
Table 2 shows that the performance of PRBF is superior to that of RBF for predicting PPI. The total prediction accuracies of PRBF are higher at 3.9%~4.48% than those of RBF. 2.3. The Comparison of DF and DFPCA Feature Extraction Approaches
For the feature extraction approach of distance frequency of amino acids grouped with their physicochemical properties, we compared the results of DF and DFPCA with PRBF SVM to test the validity of adopting PCA. The reduced feature matrix is set to retain 99.9% information of the original feature matrix by PCA. The results of DF and DFPCA with PRBF SVM in the 10CV test are listed in Table 3.
Table 3. Results of DF and DFPCA with PRBF SVM in the 10 CV test.
Feature Set Feature Extraction Approach Sn (%) PPV (%) ACC (%) MCC
Hf DF 97.37 ± 2.55 66.67 ± 27.8 74.34 ± 24.3 0.5485
DFPCA 95.94 ± 1.92 91.98 ± 2.88 93.78 ± 1.44 0.8765
Vf DF 97.21 ± 2.39 71.40 ± 23.0 78.17 ± 27.1 0.6093
DFPCA 95.66 ± 2.75 92.52 ± 2.40 93.96 ± 1.86 0.8798
Pf DF 97.13 ± 4.70 69.48 ± 25.5 77.23 ± 27.2 0.5937
DFPCA 95.78 ± 2.23 92.07 ± 1.69 93.76 ± 1.93 0.8760
Zf DF 97.65 ± 4.82 62.29 ± 29.5 69.26 ± 23.6 0.4680
DFPCA 96.06 ± 1.24 91.71 ± 3.13 93.69 ± 1.86 0.8747
From Table 3, we can see that the performance of DFPCA is superior to that of DF. The total prediction accuracies and MCC (see Equation (16) below) of DFPCA are 15.79%~24.43% and 0.2705~0.4067 higher than those of DF, respectively. Although the sensitivities of DF are a little higher (1.43%~1.59%) than those of DFPCA for the Hf, Vf, Pf and Zf feature sets, the positive predictive values are much less than that of DFPCA (21%~29%), which means that the DFPCA approach can largely reduce the false positives. These results show that the performance of DFPCA is superior to that of DF for predicting PPI. It should be noted that feature vectors generated with either DF or DFPCA contain statistical information of amino acids in protein sequences, as well as information about amino acid position and physicochemical properties.
2.4. The Performance of the Predictive System Influenced by Randomly Sampling the Noninteracting Protein Subchain Pairs

244
To investigate the influence of randomly sampling the noninteracting protein subchain pairs, we randomly sampled 2510 noninteracting protein subchain pairs five times to construct five negative sets, and we used the DFPCA approach with hydrophobicity property to predict PPI in the 10CV test. The results, as shown in Table 4, indicate that random sampling of the noninteracting protein subchain pairs in order to construct negative sets has little influence on the performance of the PPI-PKSVM.
Table 4. Effect of random sampling of the noninteracting protein subchain pairs on the performance of PPI-PKSVM with DFPCA and PRBF SVM in the 10CV test.
Sampling Time Sn (%) PPV (%) AAC (%) MCC 1 95.38 ± 3.35 91.20 ± 3.37 93.09 ± 3.45 0.8627 2 95.42 ± 1.39 91.52 ± 3.24 93.29 ± 1.65 0.8665 3 95.46 ± 3.03 91.21 ± 1.63 93.13 ± 2.29 0.8635 4 95.46 ± 3.03 91.49 ± 1.70 93.29 ± 2.13 0.8666 5 95.94 ± 1.92 91.98 ± 2.88 93.78 ± 1.44 0.8765
2.5. Comparison of Different Prediction Methods
To demonstrate the prediction performance of our method, we compared it with other methods [25] on a nonredundant dataset constructed by Pan and Shen [25], in which no protein pair has sequence identity higher than 25%. The number of positive links, i.e., interacting protein pairs, is 3899, which is composed of 2502 proteins, and the number of negative links, i.e., noninteracting protein pairs, is 4262, which is composed of 661 proteins. Among the prediction results of different methods shown in Table 5, the performance of PPI-PKSVM stands out as the best. When compared to Shen’s LDA-RF, the accuracy (see Equation (15) below) and MCC of LEWP710101/QIAN880138 and Hf-DFPCA are respectively 1.9%, 2%, 0.038 and 0.039 higher. These results indicate that our method is a very promising computational strategy for predicting protein–protein interaction based on the protein sequences.
Table 5. Performance comparison of different PPI methods using Shen’s dataset a in the 10 CV test.
Method Sn (%) Sp (%) ACC (%) MCC LEWP710101 97.3 ± 0.04 99.2 ± 0.04 98.3 ± 0.00 0.966 ± 0.0006 QIAN880138 97.3 ± 0.10 99.1 ± 0.10 98.3 ± 0.10 0.966 ± 0.002 NADH010104 97.2 ± 0.07 99.2 ± 0.04 98.3 ± 0.05 0.965 ± 0.0007 NAGK730103 97.2 ± 0.06 99.2 ± 0.04 98.2 ± 0.06 0.965 ± 0.0004 AURR980116 97.3 ± 0.04 99.1 ± 0.06 98.2 ± 0.06 0.965 ± 0.0006
Hf-DFPCA 97.6 ± 0.20 99.1 ± 0.10 98.4 ± 0.10 0.967 ± 0.002 Vf-DFPCA 97.5 ± 0.10 98.9 ± 1.00 98.3 ± 0.80 0.965 ± 0.007 Pf-DFPCA 96.9 ± 0.10 99.5 ± 0.60 98.2 ± 0.60 0.964 ± 0.004 Zf-DFPCA 97.9 ± 0.90 96.0 ± 0.20 96.9 ± 1.10 0.939 ± 0.002 LDA-RF b 94.2 ± 0.40 98.0 ± 0.30 96.4 ± 0.30 0.928 ± 0.006
LDA-RoF b 93.7± 0.50 97.6 ± 0.60 95.7 ± 0.40 0.918 ± 0.007 LDA-SVM b 89.7 ± 1.30 91.5 ± 1.10 90.7 ± 0.90 0.813 ± 0.018
AC-RF b 94.0 ± 0.60 96.6 ± 0.40 95.5 ± 0.30 0.914 ± 0.007
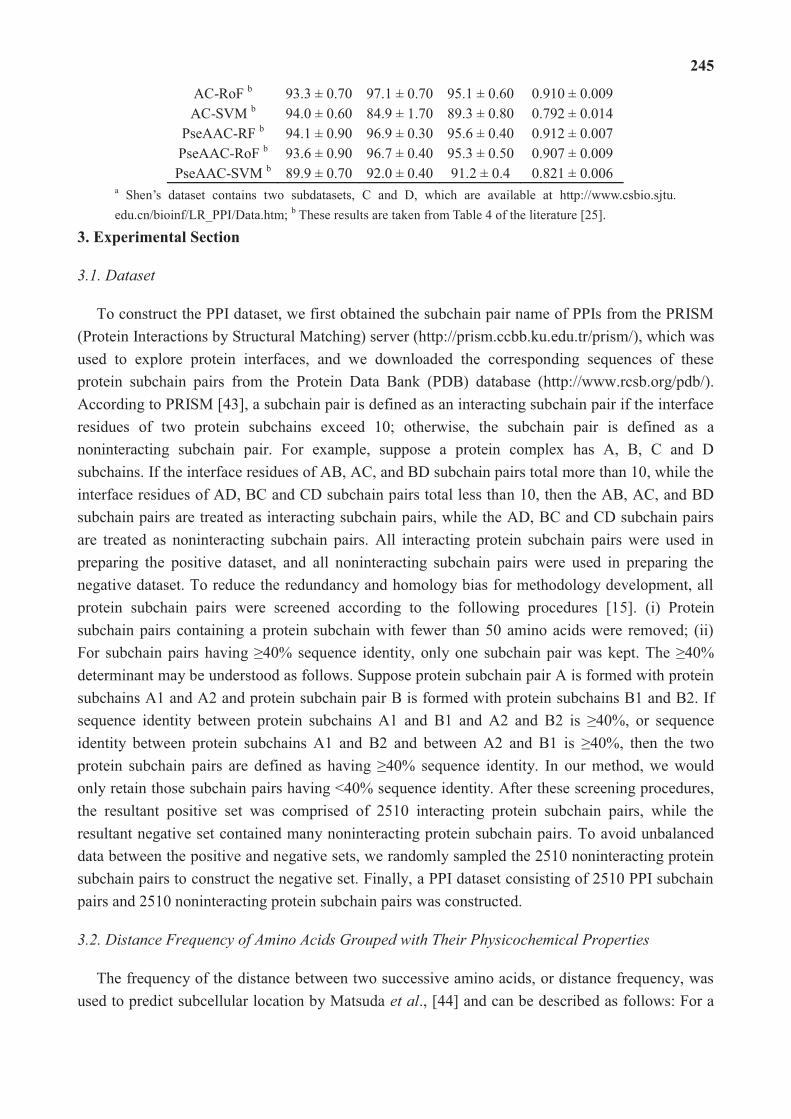
245
AC-RoF b 93.3 ± 0.70 97.1 ± 0.70 95.1 ± 0.60 0.910 ± 0.009 AC-SVM b 94.0 ± 0.60 84.9 ± 1.70 89.3 ± 0.80 0.792 ± 0.014
PseAAC-RF b 94.1 ± 0.90 96.9 ± 0.30 95.6 ± 0.40 0.912 ± 0.007 PseAAC-RoF b 93.6 ± 0.90 96.7 ± 0.40 95.3 ± 0.50 0.907 ± 0.009 PseAAC-SVM b 89.9 ± 0.70 92.0 ± 0.40 91.2 ± 0.4 0.821 ± 0.006
a Shen’s dataset contains two subdatasets, C and D, which are available at http://www.csbio.sjtu. edu.cn/bioinf/LR_PPI/Data.htm; b These results are taken from Table 4 of the literature [25].
3. Experimental Section
3.1. Dataset
To construct the PPI dataset, we first obtained the subchain pair name of PPIs from the PRISM (Protein Interactions by Structural Matching) server (http://prism.ccbb.ku.edu.tr/prism/), which was used to explore protein interfaces, and we downloaded the corresponding sequences of these protein subchain pairs from the Protein Data Bank (PDB) database (http://www.rcsb.org/pdb/). According to PRISM [43], a subchain pair is defined as an interacting subchain pair if the interface residues of two protein subchains exceed 10; otherwise, the subchain pair is defined as a noninteracting subchain pair. For example, suppose a protein complex has A, B, C and D subchains. If the interface residues of AB, AC, and BD subchain pairs total more than 10, while the interface residues of AD, BC and CD subchain pairs total less than 10, then the AB, AC, and BD subchain pairs are treated as interacting subchain pairs, while the AD, BC and CD subchain pairs are treated as noninteracting subchain pairs. All interacting protein subchain pairs were used in preparing the positive dataset, and all noninteracting subchain pairs were used in preparing the negative dataset. To reduce the redundancy and homology bias for methodology development, all protein subchain pairs were screened according to the following procedures [15]. (i) Protein subchain pairs containing a protein subchain with fewer than 50 amino acids were removed; (ii) For subchain pairs having ≥40% sequence identity, only one subchain pair was kept. The ≥40% determinant may be understood as follows. Suppose protein subchain pair A is formed with protein subchains A1 and A2 and protein subchain pair B is formed with protein subchains B1 and B2. If sequence identity between protein subchains A1 and B1 and A2 and B2 is ≥40%, or sequence identity between protein subchains A1 and B2 and between A2 and B1 is ≥40%, then the two protein subchain pairs are defined as having ≥40% sequence identity. In our method, we would only retain those subchain pairs having <40% sequence identity. After these screening procedures, the resultant positive set was comprised of 2510 interacting protein subchain pairs, while the resultant negative set contained many noninteracting protein subchain pairs. To avoid unbalanced data between the positive and negative sets, we randomly sampled the 2510 noninteracting protein subchain pairs to construct the negative set. Finally, a PPI dataset consisting of 2510 PPI subchain pairs and 2510 noninteracting protein subchain pairs was constructed.
3.2. Distance Frequency of Amino Acids Grouped with Their Physicochemical Properties
The frequency of the distance between two successive amino acids, or distance frequency, was used to predict subcellular location by Matsuda et al., [44] and can be described as follows: For a

246
protein sequence P, the distance set dA between two successive letters (e.g., A) appearing in protein sequence P can be represented as:
(1)
where nA is number of letter As appearing in protein sequence P, di is the distance from the ith letter A to the (i + 1)th letter A, and di is calculated in a left-to-right fashion. The distance frequency vector for letter A can be defined by the following equation:
(2)
where Nj represents the number of times that the jth distance unit appears in the dA set. For example, considering the protein sequence AACDAMMADA, the distance sets of letters A, C, D and M are shown respectively as
As a result, the corresponding distance frequency vectors are shown respectively as . The other 16 basic amino acid
distance frequency vectors are zero vector, or V = [0,0,0,0,0]. Thus, we can use the feature vector x to encode the protein sequence P:
In this work, we used the concept of distance frequency [44] and borrowed Dubchak’s idea of representing the amino acid sequence with four physicochemical properties [45] to encode the protein subchain sequence. First, according to the amino acid value given by such physicochemical properties as hydrophobicity [46], normalized van der Waals volume [47], polarity [48] and polarizability [49], the 20 natural amino acids can be divided into three groups [45], as listed in the Table 6. For Hydrophobicity, Normalized van der Waals Volume, Polarity and Polarizability, the amino acids in Group 1, Group 2 and Group 3 were expressed as H1, H2, H3; V1, V2, V3; P1, P2, P3; and Z1, Z2 and Z3, respectively. Second, each protein subchain sequence was then translated into the appropriate three-symbol sequence, depending on the particular physicochemical property, be it H1−3, V1−3, P1−3, or Z1−3. For example, suppose that the original protein sequence is MKEKEFQSKP. Then, by the set of symbols denoted above, in this case, hydrophobicity, this sequence can be translated into H3H1H1H1H1H3H1H2H1H2, and the same would be true for V1–3, P1–
3, or Z1–3. Third, the distance frequency of every symbol in the translated sequence was computed. In the above example, the H1, H2, H3 distance frequency would be respectively computed for the sequence H3H1H1H1H1H3H1H2H1H2. Finally, every protein subchain sequence can be encoded by the following feature vector:
(3)
1 2 1{ , ,..., ,..., } 1,... 1AA i n Ad d d d d i n�� ,,, � �
1 2[ , , , , ] A j mf N N N N� ]j mj m, ,,,
{1,3,3,2}, {0}, {5}, {1}A C D Md d d d� � � �
[1,1,2,0,0], [0,0,0,0,0], [0,0,0,0,1], [1,0,0,0,0]A C D MDf Df Df Df� � � �
[ , , , , ]A C D Yx Df Df Df Df� ]YfY,
1 2 3 1 2 3 1 2 3 1 2 3[ , , ] , [ , , ] , [ , , ] , [ , , ]T T T T
H H H H V V V V P P P P Z Z Z Zx x x x x x x x x x x x x x x x� � � �

247
Table 6. Amino acid groups classified according to their physicochemical value.
Physicochemical property Group 1 Group 2 Group 3
Hydrophobicity H1: R,K,E,D,Q,N H2: G,A,S,T,P,H,Y H3: C,V,L,I,M,F,W van der Waals volume V1: G,A,S,C,T,P,D V2: N,V,E,Q,I,L V3: M,H,K,F,R,Y,W
Polarity P1: L,I,F,W,C,M,V,Y P2: P,A,T,G,S P3: H,Q,R,K,N,E,D Polarizability Z1: G,A,S,D,T Z2: C,P,N,V,E,Q,I,L Z3: K,M,H,F,R,Y,W
Conveniently, the feature set based on hydrophobicity, normalized van der Waals volume, polarity, and polarizability can be written as Hf, Vf, Pf and Zf, respectively. In general, the dimensions of two feature vectors generated separately by two protein subchains are unequal. To solve this issue, we enlarge the feature vector dimension of one protein subchain such that it has a feature vector dimension equal to that of another subchain. For example, given the following protein subchain pair Pa − Pb:
Subchain Pa amino acid sequence: MKEKEFQSKP Subchain Pb amino acid sequence: QNSLALHKVIMVGSG If we adopt the property of hydrophobicity, then Pa and Pb amino acid sequences can be
translated into the following symbol sequence, respectively.
Subchain Pa: H3H1H1H1H1H3H1H2H1H2 Subchain Pb: H1H1H2H3H2H3H2H1H3H3H3H3H2H2H2
Then, the distance sets of subchains Pa and Pb are shown as: and the distance
frequency vectors of subchains Pa and Pb are as follows:
where
Hereinafter we will use “DF” to represent the distance frequency method by grouping amino acids with their physicochemical properties.
By our use of DF to represent the protein subchain pair, we can see that the feature vector is sparse, while the vector dimension is large, when the subchain sequence is longer. To further extract the features, Principal Component Analysis (PCA) was then used to reduce the dimension, and amino acid distance frequency combined with PCA reducing the dimension is now termed DFPCA.
3.3. Amino Acid Index Distribution (AAID)
Let be the amino acid physicochemical value of the 20 natural amino acids (A, C, D, E, F, G, H, I, K, L, M, N, P, Q, R, S, T, V, W, and Y), respectively, which can be
accessed through the DBGET/LinkDB system by inputting an amino acid index (e.g.,
1 2 3 1 2 3{1,1,1,2,2}, {2}, {5}, {1,6}, {2,2,6,1,1}, {2,3,1,1,1,},
H H H H H H
a a a b b bd d d d d d� � � � � �
1 2 3 1 2 3[ , , ], [ , , ]a a a b b b
a H H H b H H Hx x x x x x x x� �
1 2 3
1 2 3
[3,2,0,0,0,0], [0,1,0,0,0,0], [0,0,0,0,1,0],
[1,0,0,0,0,1], [2,2,0,0,0,1], [3,1,1,0,0,0]H H H
H H H
a a a
b b b
x x x
x x x
� � �
� � �
1 2 20, , , , ,iI I I I20I I2
i�

248
LEWP710101). An amino acid index is a set of 20 numerical values representing any of the different physicochemical and biochemical properties of amino acids. We can download these indices from the AAindex database (http://www.genome.jp/aaindex/).
For a given protein sequence P whose length is , we replace each residue in the primary sequence by its amino acid physicochemical value, which results in a numerical sequence
, . Then, we can define the following feature wi of amino acid to represent the protein sequences:
(4)
where is the frequency of amino acid that occurs in protein sequecne P, is the physicochemical value of amino acid , and the symbol indicates the simple product. and
are mutually independent. Obviously, wi includes the physicochemical information and statistical information of amino acid , but it loses the sequence-order information. Therefore, to let feature vectors contain more sequence-order information, we introduced the 2-order center distance by considering the position of amino acid , which is defined as
(5)
where is the total number of amino acid appearing in the protein sequence P,
is the position of the amino acid in the sequence, and is the mean of the position of amino acid .
Now feature di contains the physicochemical information, statistical information and the sequence-order information of amino acid , but it still does not distinguish the protein pairs in
some cases. For example, assume two protein pairs Pa – Pb and Pc – Pd. The sequences of protein Pa, Pb, Pc and Pd are respectively shown as:
Pa: MPPRNKPNRR; Pb: MPNPRNNKPPGRKTR Pc: MPRRNPPNRK; Pd: MGTRPPRNNKPNPRK
Obviously, Pa and Pc, as well as Pb and Pd, have the same wi and di. If we use the orthogonal sum vector, we cannot distinguish between the Pa − Pb and Pc − Pd protein pairs. To solve this problem, the 3-order center distance ti of amino acid was introduced, which is defined as
(6)
Finally, we can use a combined feature vector to represent protein sequence P by serializing above three features as
(7)
L
1 2, , , ,...,l Lh h h h, l ,...,h h, ll ,..., 1 2 20( , ,..., )lh I I I�
i�
ii iw I f� -
if i� iI
i� - if iI
i�
id
i�
, 2
1)
iN
i j ii i
j
k kd I
L
�
�
�� -�
iN� i� ,i jk
( 1,2, , )i
j N�� , )i
, � thj i� ik�
i�
i�
i�
, 3
1)
iNi j i
i ij
k kt I
L
�
�
�� -�
1 20 1 20 1 20[ , , , , , , , , , , , , , , ]Ti i ix w w w d d d t t t� 20 1 20 1 20]20 1 20 1 2020 1 20 1
T20 1 20 120 1 2020 1 20 1d d d20 1 20 120 1 20 120 1 20 120 1 20 120 1 2020 1 2020 1 20

249
The protein pair Pa – Pb can now be represented by the following feature vectors:
(8)
or
(9)
Generally, vector xab is not equal to vector xba. As such, if a query protein pair Pa – Pb is represented by xab and xba respectively, the prediction results may be different. In this paper, we will choose the pairwise kernel function to solve this dilemma.
3.4. Pairwise Kernel Function
Ben-Hur and Noble [13] first introduced a tensor product pairwise kernel function KI to measure the similarity between two protein pairs. The comparison between a pair and another pair
for KI is done through the comparison of with and with , on the one hand, and the comparison of with and with , on the other hand, as
(10)
However, the KI kernel does not consider differences between the elements of comparison pairs in the feature space; therefore, Vert [50] proposed the following metric learning pairwise kernel KII:
(11)
In particular, two protein pairs might be very similar for the KII kernel, even if the patterns of the first protein pair are very different from those of the second protein pair, whereas the KI kernel could result in a large dissimilarity between the two protein pairs. It is easy to prove that the KII kernel satisfies both Mercer’s condition and the pairwise kernel function condition. In this paper, we use the KII kernel function to predict PPI.
1 2020 1 20 1 1 20 1 20 1 20[ , , , , , , , , , , , , , , , , ]a a a a a a b b b b b b Tabx w w d d t t w w d d t t�
20 1 20 1 20 1 2020, , , , , , , , , , , , , , , ]20 1 20 1 1 20 1 20 1 201 20 1 1 20 1 20 120
a a a a a b b b b b b T], , , , , , , , , , , , , , ,, , , , , , , , , , , , , ,20 1 20 1 1 20 1 20 11 20 1 1 20 1 20 11 20 1 1 20 1 20 1a a a a a b b b b ba a a a b b b
1 2020 1 20 1 1 20 1 20 1 20[ , , , , , , , , , , , , , , , , ]b b b b b b a a a a a a Tbax w w d d t t w w d d t t�
20 1 20 1 20 1 2020, , , , , , , , , , , , , , , ]20 1 20 1 1 20 1 20 1 201 20 1 1 20 1 20 120
b b b b b a a a T], 20 1 20 1 1 20 1 20 1b b b b b a a a a a
1 2( , )x x
3 4( , )x x 1x 3x 2x 4x
1x 4x 2x 3x
I 1 2 3 4 1 3 2 4 1 4 2 3(( , ), ( , )) ( , ) ( , ) ( , ) ( , )K x x x x K x x K x x K x x K x x� . � .
2II 1 2 3 4 1 3 2 4 1 4 2 3(( , ),( , )) ( ( , ) ( , ) ( , ) ( , ))K x x x x K x x K x x K x x K x x� � � �

250
3.5. Assessment of Prediction System
Sensitivity (Sn), specificity (Sp), positive predictive value (PPV) and total prediction accuracy (ACC) [39–41] were employed to measure the performance of PPI-PKSVM.
(12)
(13)
(14)
(15)
(16)
where TP and TN are the number of correctly predicted subchain pairs of interacting proteins and noninteracting proteins, respectively, and FP and FN are the number of incorrectly predicted subchain pairs of noninteracting proteins and interacting proteins, respectively.
4. Conclusions
In this work, we introduced two feature extraction approaches to represent the protein sequence. One is amino acid distance frequency with PCA reducing the dimension, termed DFPCA. Another is amino acid index distribution based on the physicochemical values of amino acids, termed AAID. The pairwise kernel function SVM was employed as the classifier to predict the PPIs. From the results, we can conclude that (i) the performance of DFPCA is better than that of DF; (ii) the prediction power of PRBF is superior to RBF, suggesting that designing a rational pairwise kernel function is important for predicting PPIs; (iii) DFPCA and AAID with pairwise kernel function SVM are effective and promising approaches for predicting PPIs and may complement existing methods. Since user-friendly and publicly accessible web servers represent the future direction in the development of predictors, we have provided a web server for PPI-PKSVM, and it can be found at (http://159.226.118.31/PPI/index.html). PPI-PKSVM in its present version can be used to evaluate one protein pair. However, we will soon be developing a newer online version able to predict large numbers of PPIs.
Acknowledgments
This paper was supported by the National Natural Science Foundation of China (No. 61170134 and 60775012).
Conflicts of Interest
The authors declare no conflict of interest.
nTPS
TP FN�
�
pTNS
TN FP�
�
TPPPVTP FP
��
TP TNACCTP TN FP FN
��
� � �
( )( )( )( )TP TN FP FNMCC
TP FN TP FP TN FN TN FP� � �
�� � � �

251
References
1. Lucy, S.; Harpreet, K.S.; Gary, D.B.; Anton, J.E. Computational prediction of protein–protein interactions. Mol. Biotechnol. 2008, 38, 1–17.
2. Hu, L.; Huang, T.; Shi, X.; Lu, W.C.; Cai, Y.D.; Chou, K.C. Predicting functions of proteins in mouse based on weighted protein–protein interaction network and protein hybrid properties. PLoS One 2011, 6, e14556.
3. Huang, T.; Chen, L.; Cai, Y.D.; Chou, K.C. Classification and analysis of regulatory pathways using graph property, biochemical and physicochemical property, and functional property. PLoS One 2011, 6, e25297.
4. Jiang, Y.; Huang, T.; Chen, L.; Gao, Y.F.; Cai, Y.D.; Chou, K.C. Signal propagation in protein interaction network during colorectal cancer progression. BioMed Res. Int. 2013, 2013, doi:10.1155/2013/287019.
5. Li, B.Q.; Huang, T.; Cai, Y.D.; Chou, K.C. Identification of colorectal cancer related genes with mRMR and shortest path in protein–protein interaction network. PLoS One 2013, 7, e33393.
6. Shoemaker, B.A.; Panchenko, A.R. Deciphering protein–protein interactions. Part I Experimental techniques and databases. PLoS Comput. Biol. 2007, 3, e42.
7. Han, J.D.; Dupuy, D.; Bertin, N.; Cusick, M.E.; Vidal, M. Effect of sampling on topology predictions of protein–protein interaction networks. Nat. Biotechnol. 2005, 23, 839–844.
8. Marcotte, E.M.; Pellegrini, M.; Ng, H.L.; Rice, D.W.; Yeates, T.O.; Eisenberg, D. Detecting protein function and protein–protein interactions from genome sequences. Science 1999, 285, 751–753.
9. Juan, D.; Pazos, F.; Valencia, A. High-confidence prediction of global interactomes based on genome-wide coevolutionary networks. Proc. Natl. Acad. Sci.USA 2008, 105, 934–939.
10. Singhal, M.; Resat, H. A domain-based approach to predict proteinprotein interactions. BMC Bioinforma. 2007, 8, 199.
11. Bock, J.R.; Gough, D.A. Predicting protein–protein interactions from primary structure. Bioinformatics 2001, 17, 455–460.
12. Gomez, S.M.; Noble, A.S.; Rzhetsky, A. Learning to predict protein–protein interactions from protein sequences. Bioinformatics 2003, 19, 1875–1881.
13. Ben-Hur, A.; Noble, W.S. Kernel methods for predicting protein–protein interactions. Bioinformatics 2005, 21, i38–i46.
14. Martin, S.; Roe, D.; Faulon, J.L. Predicting protein–protein interactions using signature products. Bioinformatics 2005, 21, 218–226.
15. Chou, K.C.; Cai, Y.D. Predicting protein–protein interactions from sequences in a hybridization space. J. Proteome Res. 2006, 5, 316–322.
16. Nanni, L.; Lumini, A. An ensemble of K-local hyperplanes for predicting protein–protein interactions. Bioinformatics 2006, 22, 1207–1210.
17. Pitre, S.; Dehne, F.; Chan, A.; Cheetham, J.; Duong, A.; Emili, A.; Gebbia, M.; Greenblatt, J.; Jessulat, M.; Krogan, N.; et al. PIPE: A protein–protein interaction prediction engine based on

252
the re-occurring short polypeptide sequences between known interacting protein pairs. BMC Bioinforma. 2006, 7, 365.
18. Li, X.L.; Tan, S.H.; Ng, S.K. Improving domain-based protein interaction prediction using biologically-significant negative dataset. Int. J. Data Min. Bioinforma. 2006, 1, 138–149.
19. Shen, J.W.; Zhang, J.; Luo, X.M.; Zhu, W.L.; Yu, K.Q.; Chen, K.X.; Li, Y.X.; Jiang, H.L. Predicting protein–protein interactions based only on sequences information. Proc. Natl. Acad. Sci. USA 2007, 104, 4337–4341.
20. Guo, Y.Z.; Yu, L.Z.; Wen, Z.N.; Li, M.L. Using support vector machine combined with auto covariance to predict protein–protein interactions from protein sequences. Nucleic Acids Res. 2008, 36, 3025–3030.
21. Chen, X.W.; Han, B.; Fang, J.; Haasl, R.J. Large-scale protein–protein interaction prediction using novel kernel methods. Int. J. Data Min. Bioinforma. 2008, 2, 145–156.
22. Chen, W.; Zhang, S.W.; Cheng, Y.M.; Pan, Q. Prediction of protein–protein interaction types using the decision templates based on multiple classier fusion. Math. Comput. Model. 2010, 52, 2075–2084.
23. Guo, Y.; Li, M.; Pu, X.; Li, G.; Guang, X.; Xiong, W.; Li, J. PRED_PPI: A server for predicting protein–protein interactions based on sequence data with probability assignment. BMC Res. Notes 2010, 3, 145.
24. Yu, C.Y.; Chou, L.C.; Chang, D.T.H. Predicting protein–protein interactions in unbalanced data using the primary structure of proteins. BMC Bioinforma. 2010, 11, 167.
25. Pan, X.Y.; Zhang, Y.N.; Shen, H.B. Large-scale prediction of human protein–protein interactions from amino acid sequence based on latent topic features. J. Proteome Res. 2010, 9, 4992–5001.
26. Liu, C.H.; Li, K.C.; Yuan, S. Human protein–protein interaction prediction by a novel sequence-based co-evolution method: Co-evolutionary divergence. Bioinformatics 2013, 29, 92–98.
27. Hsu, C.; Lin, C.J. A comparision of methods for multi-class support vector machines. IEEE Trans. Neural Netw. 2002, 3, 415–425.
28. Chou, K.C.; Zhang, C.T. Review: Prediction of protein structural classes. Crit. Rev. Biochem. Mol. Biol. 1995, 30, 275–349.
29. Chou, K.C. Some remarks on protein attribute prediction and pseudo amino acid composition (50th Anniversary Year Review). J. Theor. Biol. 2011, 273, 236–247.
30. Esmaeili, M.; Mohabatkar, H.; Mohsenzadeh, S. Using the concept of Chou’s pseudo amino acid composition for risk type prediction of human papillomaviruses. J. Theor. Biol. 2010, 263, 203–209.
31. Hajisharifi, Z.; Piryaiee, M.; Mohammad Beigi, B.; Mandana, B.; Hassan, M. Predicting anticancer peptides with Chou’s pseudo amino acid composition and investigating their mutagenicity via Ames test. J. Theor. Biol. 2014, 341, 34–40.
32. Mohabatkar, H.; Mohammad Beigi, M.; Esmaeili, A. Prediction of GABA(A) receptor proteins using the concept of Chou’s pseudo-amino acid composition and support vector machine. J. Theor. Biol. 2011, 281, 18–23.

253
33. Xu, Y.; Ding, J.; Wu, L.Y.; Chou, K.C. iSNO-PseAAC: Predict cysteine S-nitrosylation sites in proteins by incorporating position specific amino acid propensity into pseudo amino acid composition. PLoS One 2013, 8, e55844.
34. Xu, Y.; Shao, X.J.; Wu, L.Y.; Deng, N.Y.; Chou, K.C. iSNO-AAPair: Incorporating amino acid pairwise coupling into PseAAC for predicting cysteine S-nitrosylation sites in proteins. PeerJ 2013, 1, e171.
35. Chen, W.; Feng, P.M.; Lin, H.; chou, K.C. iRSpot-PseDNC: Identify recombination spots with pseudo dinucleotide composition. Nucleic Acids Res. 2013, 41, e69.
36. Qiu, W.R.; Xiao, X.; Chou, K.C. iRSpot-TNCPseAAC: Identify recombination spots with trinucleotide composition and pseudo amino acid components. Int. J. Mol. Sci. 2014, 15, 1746–1766.
37. Min, J.L.; Xiao, X.; Chou, K.C. iEzy-Drug: A web server for identifying the interaction between enzymes and drugs in cellular networking. Biomed. Res. Int. 2013, 2013, 701317.
38. Zhang, S.W.; Liu, Y.F.; Yu, Y.; Zhang, T.H.; Fan, X.N. MSLoc-DT: A new method for predicting the protein subcellular location of multispecies based on decision templates. Anal. Biochem. 2014, 449, 164–171.
39. Chen, W.; Zhang, S.W.; Cheng, Y.M.; Pan, Q. Identification of protein-RNA interaction sites using the information of spatial adjacent residues. Proteome Sci. 2011, 9, S16.
40. Zhang, S.W.; Zhang, Y.L.; Yang, H.F.; Zhao, C.H.; Pan, Q. Using the concept of Chou’s pseudo amino acid composition to predict protein subcellular localization: An approach by incorporating evolutionary information and von Neumann entropies. Amino Acids 2008, 34, 565–572.
41. Zhang, S.W.; Chen, W.; Yang, F.; Pan, Q. Using Chou’s pseudo amino acid composition to predict protein quaternary structure: A sequence-segmented PseAAC approach. Amino Acids 2008, 35, 591–598.
42. Tomii, K.; Kanehisa, M. Analysis of amino acid indices and mutation matrices for sequence comparison and structure prediction of proteins. Protein Eng. 1996, 9, 27–36.
43. Ogmen, U.; Keskin, O.; Aytuna, A.S.; Nussinov, R.; Gürsoy, A. PRISM: Protein interactions by structural matching. Nucleic Acids Res. 2005, 33, 331–336.
44. Matsuda, S.; Vert, J.P.; Saigo, H.; Ueda, N.; Toh, H.; Akutsu, T. A novel representation of protein sequences for prediction of subcellular location using support vector machines. Protein Sci. 2005, 14, 2804–2813.
45. Dubchak, I.; Muchnik, I.; Mayor, C.; Dralyuk, I.; Kim, S.H. Recognition of a protein fold in the context of the SCOP classification. Proteins 1999, 35, 401–407.
46. Chothia, C.; Finkelstein, A.V. The classification and origins of protein folding patterns. Annu. Rev. Biochem. 1999, 59, 1007–1039.
47. Fauchere, J.L.; Charton, M.; Kier, L.B.; Verloop, A.; Pliska, V. Amino acid side chain parameters for correlation studies in biology and pharmacology. Int. J. Peptide Protein Res. 1998, 32, 269–278.
48. Grantham, R. Amino acid difference formula to help explain protein evolution. Science 1974, 185, 862–864.

254
49. Charton, M.; Charton, B.I. The structural dependence of amino acid hydrophobicity parameters. J. Theor. Biol. 1982, 99, 629–644.
50. Vert, J.P.; Qiu, J.; Noble, W.S. A new pairwise kernel for biological network inference with support vector machines. BMC Bioinforma. 2007, 8, S8.

255
iNR-Drug: Predicting the Interaction of Drugs with Nuclear
Receptors in Cellular Networking
Yue-Nong Fan, Xuan Xiao, Jian-Liang Min and Kuo-Chen Chou
Abstract: Nuclear receptors (NRs) are closely associated with various major diseases such as cancer, diabetes, inflammatory disease, and osteoporosis. Therefore, NRs have become a frequent target for drug development. During the process of developing drugs against these diseases by targeting NRs, we are often facing a problem: Given a NR and chemical compound, can we identify whether they are really in interaction with each other in a cell? To address this problem, a predictor called “iNR-Drug” was developed. In the predictor, the drug compound concerned was formulated by a 256-D (dimensional) vector derived from its molecular fingerprint, and the NR by a 500-D vector formed by incorporating its sequential evolution information and physicochemical features into the general form of pseudo amino acid composition, and the prediction engine was operated by the SVM (support vector machine) algorithm. Compared with the existing prediction methods in this area, iNR-Drug not only can yield a higher success rate, but is also featured by a user-friendly web-server established at http://www.jci-bioinfo.cn/iNR-Drug/, which is particularly useful for most experimental scientists to obtain their desired data in a timely manner. It is anticipated that the iNR-Drug server may become a useful high throughput tool for both basic research and drug development, and that the current approach may be easily extended to study the interactions of drug with other targets as well.
Reprinted from Int. J. Mol. Sci. Cite as: Fan, Y.-N.; Xiao, X.; Min, J.-L.; Chou, K.-C. iNR-Drug: Predicting the Interaction of Drugs with Nuclear Receptors in Cellular Networking. Int. J. Mol. Sci. 2014, 15, 4915-4937.
1. Introduction
With the ability to directly bind to DNA (Figure 1) and regulate the expression of adjacent genes, nuclear receptors (NRs) are a class of ligand-inducible transcription factors. They regulate various biological processes, such as homeostasis, differentiation, embryonic development, and organ physiology [1–3]. The NR superfamily has been classified into seven families: NR0 (knirps or DAX like) [4,5]; NR1 (thyroid hormone like), NR2 (HNF4-like), NR3 (estrogen like), NR4 (nerve growth factor IB-like), NR5 (fushi tarazu-F1 like), and NR6 (germ cell nuclear factor like). Since they are involved in almost all aspects of human physiology and are implicated in many major diseases such as cancer, diabetes and osteoporosis, nuclear receptors have become major drug targets [6,7], along with G protein-coupled receptors (GPCRs) [8–17], ion channels [18–20], and kinase proteins [21–24].

256
Figure 1. An illustration to show a nuclear receptor binding to DNA.
Identification of drug-target interactions is one of the most important steps for the new medicine development [25,26]. The method usually adopted in this step is molecular docking simulation [27–43]. However, to make molecular docking study feasible, a reliable 3D (three dimensional) structure of the target protein is the prerequisite condition. Although X-ray crystallography is a powerful tool in determining protein 3D structures, it is time-consuming and expensive. Particularly, not all proteins can be successfully crystallized. For example, membrane proteins are very difficult to crystallize and most of them will not dissolve in normal solvents. Therefore, so far very few membrane protein 3D structures have been determined. Although NMR (Nuclear Magnetic Resonance) is indeed a very powerful tool in determining the 3D structures of membrane proteins as indicated by a series of recent publications (see, e.g., [44–51] and a review article [20]), it is also time-consuming and costly. To acquire the 3D structural information in a timely manner, one has to resort to various structural bioinformatics tools (see, e.g., [37]), particularly the homologous modeling approach as utilized for a series of protein receptors urgently needed during the process of drug development [19,52–57]. Unfortunately, the number of dependable templates for developing high quality 3D structures by means of homology modeling is very limited [37].
To overcome the aforementioned problems, it would be of help to develop a computational method for predicting the interactions of drugs with nuclear receptors in cellular networking based on the sequences information of the latter. The results thus obtained can be used to pre-exclude the compounds identified not in interaction with the nuclear receptors, so as to timely stop wasting time and money on those unpromising compounds [58].

257
Actually, based on the functional groups and biological features, a powerful method was developed recently [59] for this purpose. However, further development in this regard is definitely needed due to the following reasons. (a) He et al. [59] did not provide a publicly accessible web-server for their method, and hence its practical application value is quite limited, particularly for the broad experimental scientists; (b) The prediction quality can be further enhanced by incorporating some key features into the formulation of NR-drug (nuclear receptor and drug) samples via the general form of pseudo amino acid composition [60].
The present study was initiated with an attempt to develop a new method for predicting the interaction of drugs with nuclear receptors by addressing the two points.
As demonstrated by a series of recent publications [10,18,61–70] and summarized in a comprehensive review [60], to establish a really effective statistical predictor for a biomedical system, we need to consider the following steps: (a) select or construct a valid benchmark dataset to train and test the predictor; (b) represent the statistical samples with an effective formulation that can truly reflect their intrinsic correlation with the object to be predicted; (c) introduce or develop a powerful algorithm or engine to operate the prediction; (d) properly perform cross-validation tests to objectively evaluate the anticipated accuracy of the predictor; (e) establish a user-friendly web-server for the predictor that is accessible to the public. Below, let us elaborate how to deal with these steps.
2. Results and Discussion
2.1. Benchmark Dataset
The data used in the current study were collected from KEGG (Kyoto Encyclopedia of Genes and Genomes) [71] at http://www.kegg.jp/kegg/. KEGG is a database resource for understanding high-level functions and utilities of the biological system, such as the cell, the organism and the ecosystem, from molecular-level information, especially large-scale molecular datasets generated by genome sequencing and other high-throughput experimental technologies. Here, the benchmark dataset can be formulated as
(5)
where is the positive subset that consists of the interactive drug-NR pairs only, while the negative subset that contains of the non-interactive drug-NR pairs only, and the symbol represents the union in the set theory. The so-called “interactive” pair here means the pair whose two counterparts are interacting with each other in the drug-target networks as defined in the KEGG database [71]; while the “non-interactive” pair means that its two counterparts are not interacting with each other in the drug-target networks. The positive dataset contains 86 drug-NR pairs, which were taken from He et al. [59]. The negative dataset contains 172 non-interactive drug-NR pairs, which were derived according to the following procedures: (a) separating each of the pairs in into single drug and NR; (b) re-coupling each of the single drugs with each of the single NRs into pairs in a way that none of them occurred in ; (c) randomly picking the pairs thus formed until reaching the number two times as many as the pairs in . The 86 interactive drug-NR pairs and 172 non-interactive drug-NR pairs are given in

258
Supplementary Information S1, from which we can see that the 86 + 172 = 258 pairs in the current benchmark dataset are actually formed by 25 different NRs and 53 different compounds.
2.2. Sample Representation
Since each of the samples in the current network system contains a drug (compound) and a NR (protein), the following procedures were taken to represent the drug-NR pair sample.
2.2.1. Use 2D Molecular Fingerprints to Represent Drugs
First, for the drug part in the current benchmark dataset, we can use a 256-D vector to formulate it as given by
D = d1 d2 di d256
�
T (6)
where D represents the vector for a drug compound, and di its i-th (i =1,2, ,256) component
that can be derived by following the “2D molecular fingerprint procedure” as elaborated in [10]. The 53 molecular fingerprint vectors thus obtained for the 53 drugs in are, respectively, given in Supplementary Information S2.
2.2.2. Use Pseudo Amino Acid Composition to Represent the Nuclear Receptors
The protein sequences of the 25 different NRs in are listed in Supplementary Information S3. Suppose the sequence of a nuclear receptor protein P with L residues is generally expressed by
P= R1R2R3R4R5R6R7R8 RL (7)
where 1R represents the 1st residue of the protein sequence P , 2R the 2nd residue, and so
forth. Now the problem is how to effectively represent the sequence of Equation (3) with a non-sequential or discrete model [72]. This is because all the existing operation engines, such as covariance discriminant (CD) [17,65,73–79], neural network [80–82], support vector machine (SVM) [62–64,83], random forest [84,85], conditional random field [66], nearest neighbor (NN) [86,87]; K-nearest neighbor (KNN) [88–90], OET-KNN [91–94], and Fuzzy K-nearest neighbor [10,12,18,69,95], can only handle vector but not sequence samples. However, a vector defined in a discrete model may completely lose all the sequence-order information and hence limit the quality of prediction. Facing such a dilemma, can we find an approach to partially incorporate the sequence-order effects?
Actually, one of the most challenging problems in computational biology is how to formulate a biological sequence with a discrete model or a vector, yet still keep considerable sequence order information. To avoid completely losing the sequence-order information for proteins, the pseudo amino acid composition [96,97] or Chou’s PseAAC [98] was proposed. Ever since the concept of PseAAC was proposed in 2001 [96], it has penetrated into almost all the areas of computational proteomics, such as predicting anticancer peptides [99], predicting protein subcellular location [100–106], predicting membrane protein types [107,108], predicting protein submitochondria locations [109–112], predicting GABA(A) receptor proteins [113], predicting enzyme subfamily

259
classes [114], predicting antibacterial peptides [115], predicting supersecondary structure [116], predicting bacterial virulent proteins [117], predicting protein structural class [118], predicting the cofactors of oxidoreductases [119], predicting metalloproteinase family [120], identifying cysteine S-nitrosylation sites in proteins [66], identifying bacterial secreted proteins [121], identifying antibacterial peptides [115], identifying allergenic proteins [122], identifying protein quaternary structural attributes [123,124], identifying risk type of human papillomaviruses [125], identifying cyclin proteins [126], identifying GPCRs and their types [15,16], discriminating outer membrane proteins [127], classifying amino acids [128], detecting remote homologous proteins [129], among many others (see a long list of papers cited in the References section of [60]). Moreover, the concept of PseAAC was further extended to represent the feature vectors of nucleotides [65], as well as other biological samples (see, e.g., [130–132]). Because it has been widely and increasingly used, recently two powerful soft-wares, called “PseAAC-Builder” [133] and “propy” [134], were established for generating various special Chou’s pseudo-amino acid compositions, in addition to the web-server “PseAAC” [135] built in 2008.
According to a comprehensive review [60], the general form of PseAAC for a protein sequence P is formulated by
P = � 1 � 2 � u ��
�
T (8)
where the subscript � is an integer, and its value as well as the components � u (u=1,2, ,� ) will
depend on how to extract the desired information from the amino acid sequence of P (cf. Equation (3)). Below, let us describe how to extract useful information to define the components of PseAAC for the NR samples concerned.
First, many earlier studies (see, e.g., [136–141]) have indicated that the amino acid composition (AAC) of a protein plays an important role in determining its attributes. The AAC contains 20 components with each representing the occurrence frequency of one of the 20 native amino acids in the protein concerned. Thus, such 20 AAC components were used here to define the first 20 elements in Equation (4); i.e.,
� i = fi(1) (i =1,2, , 20) (9)
where fi(1) is the normalized occurrence frequency of the i-th type native amino acid in the nuclear
receptor concerned. Since AAC did not contain any sequence order information, the following steps were taken to make up this shortcoming.
To avoid completely losing the local or short-range sequence order information, we considered the approach of dipeptide composition. It contained 20 × 20 = 400 components [142]. Such 400 components were used to define the next 400 elements in Equation (4); i.e.,
� j+20 = f j(2) ( j =1,2, , 400) (10)
where f j(2)
is the normalized occurrence frequency of the j-th dipeptides in the nuclear receptor concerned.
To incorporate the global or long-range sequence order information, let us consider the following approach. According to molecular evolution, all biological sequences have developed starting out from a very limited number of ancestral samples. Driven by various evolutionary forces such as

260
mutation, recombination, gene conversion, genetic drift, and selection, they have undergone many changes including changes of single residues, insertions and deletions of several residues [143], gene doubling, and gene fusion. With the accumulation of these changes over a long period of time, many original similarities between initial and resultant amino acid sequences are gradually faded out, but the corresponding proteins may still share many common attributes [37], such as having basically the same biological function and residing at a same subcellular location [144,145]. To extract the sequential evolution information and use it to define the components of Equation (4), the PSSM (Position Specific Scoring Matrix) was used as described below.
According to Schaffer [146], the sequence evolution information of a nuclear receptor protein P with L amino acid residues can be expressed by a 20L� matrix, as given by
PPSSM(0) =
E1�10 E1�2
0 E1�200
E2�10 E2�2
0 E2�200
EL�10 EL�2
0 EL�200
�����
�
�����
(11)
where Ei� j0 represents the original score of the i-th amino acid residue (i = 1, 2,…, L) in the nuclear
receptor sequence changed to amino acid type j (j = 1, 2,…, 20) in the process of evolution. Here, the numerical codes 1, 2,…, 20 are used to respectively represent A, C, D, E, F, G, H, I, K, L, M, N, P, Q, R, S, T, V, W, the 20 single-letter codes for the 20 native amino acids. The L × 20 scores in Equation (7) were generated by using PSI-BLAST [147] to search the UniProtKB/Swiss-Prot database (The Universal Protein Resource (UniProt); http://www.uniprot.org/) through three iterations with 0.001 as the E-value cutoff for multiple sequence alignment against the sequence of the nuclear receptor concerned. In order to make every element in Equation (7) be scaled from their original score ranges into the region of [0, 1], we performed a conversion through the standard sigmoid function to make it become
PPSSM(0) =
E1�11 E1�2
1 E1�201
E2�11 E2�2
1 E2�201
EL�11 EL�2
1 EL�201
�����
�
�����
(12)
where
Ei� j1 =
11+ e�Ei� j
0 (1� i � L, 1� j � 20) (13)
Now we extract the useful information from Equation (8) to define the next 20 components of Equation (4) via the following equation
� j+400 = j (j =1,2, , 20) (14)
where
j =1L� Ek� j
1k=1
L� ( j =1,2, , 20) (15)

261
Moreover, we used the grey system model approach as elaborated in [68] to further define the next 60 components of Equation (4); i.e.,
� j+440 = �j ( j =1, 2, , 60) (16)
where
�3 j�2 = w1 f j(1)a1
j
�3 j�1 = w1 f j(1)a2
j
�3 j = w3 f j(1)bj
�
���
���
( j =1, 2, , 20) (17)
In the above equation, w1, w2 , and w3 are weight factors, which were all set to 1 in the current study; f j
(1) has the same meaning as in Equation (5); a1j , a2
j , and bj are given by
a1j
a2j
bj
����
�
����
= B jTB j( )�1
B jTU j ( j =1, 2, , 20) (18)
where
B j =
�E2� j1 � E1� j
1 + 0.5E2� j1( ) 1
�E3� j1 � Ei� j
1 + 0.5E3� j1
i=1
2
�!%#"&$
1
�EL� j1 � Ei� j
1 + 0.5EL� j1
i=1
L�1
�!%#"&$
1
���������
�
���������
(19)
and
U j =
E2� j1 �E1� j
1
E3� j1 �E2� j
1
EL� j1 �EL�1� j
1
������
�
������
(20)
Combining Equations (5), (6), (10) and (12), we found that the total number of the components obtained via the current approach for the PseAAC of Equation (4) is
� = 20+ 400+ 20+ 60 = 500 (21)
and each of the 500 components is given by

262
� u =
fu(1) if 1� u� 20
fu(2) if 21� u� 420
u if 421� u� 440�u if 441� u� 500
�
�
��
�
��
(22
)
2.2.3. Formulate the Pair of Drugs with Nuclear Receptor
Since the elements in Equations (2) and (4) are well defined, we can now formulate the drug-NR pair by combining the two equations as given by
G = D+P = d1 d2 d256 � 1 � 2 � 500
� (23)
where G represents the drug-NR pair, + the orthogonal sum, and the 256 + 500 = 756 components are defined by Equations (2) and (18).
For the sake of convenience, let us use xi (i =1, 2, , 756) to represent the 756 components in
Equation (19); i.e.,
G = x1 x2 xi x756
�
T (24)
To optimize the prediction quality with a time-saving approach, similar to the treatment [148–150], let us convert Equation (20) to
G = y1 y2 yi y756
�
T (25)
where
yi =xi � xi
SD(x) (26)
where the symbol means taking the average of the quantity therein, and SD means the
corresponding standard derivation.
2.2.4. Operation Engine or Algorithm
In this study, the SVM (support vector machine) was used as the operation engine. SVM has been widely used in the realm of bioinformatics (see, e.g., [62–64,151–154]). The basic idea of SVM is to transform the data into a high dimensional feature space, and then determine the optimal separating hyperplane using a kernel function. For a brief formulation of SVM and how it works, see the papers [155,156]; for more details about SVM, see a monograph [157].
In this study, the LIBSVM package [158] was used as an implementation of SVM, which can be downloaded from http://www.csie.ntu.edu.tw/~cjlin/libsvm/, the popular radial basis function (RBF) was taken as the kernel function. For the current SVM classifier, there were two uncertain parameters: penalty parameter C and kernel parameter . The method of how to determine the two parameters will be given later.

263
The predictor obtained via the aforementioned procedure is called iNR-Drug, where “i” means identify, and “NR-Drug” means the interaction between nuclear receptor and drug compound. To provide an intuitive overall picture, a flowchart is provided in Figure 2 to show the process of how the predictor works in identifying the interactions between nuclear receptors and drug compounds.
Figure 2. A flowchart to show the operation process of the iNR-Drug predictor.
3. Experimental Section
3.1. Metrics for Measuring Prediction Quality
To provide a more intuitive and easier-to-understand method to measure the prediction quality, the following set of metrics based on the formulation used by Chou [159–161] in predicting signal peptides was adopted. According to Chou’s formulation, the sensitivity, specificity, overall accuracy, and Matthew’s correlation coefficient can be respectively expressed as [62,65–67]
Input a query protein sequence and
a drug code
500-D Chou’s PseAAC 256-D drug vector
Combination!!
SVM engine Training dataset
Yes No
!Non-interactive NR-drug pair
!Interactive NR-drug pair
AAC Dipeptide Seg Evol
Grey model
Molecular Fingerprint

264
Sn =1� N�+
N+
Sp =1� N+�
N�
Acc =1� N�+ + N+
�
N+ + N�
MCC =1� N�
+ + N+�
N+ + N�
!%#
"&$
1+ N+� �N�
+
N+
!%#
"&$
1+ N�+ �N+
�
N�
!%#
"&$
�
�
�������
�
�������
(27)
where N � is the total number of the interactive NR-drug pairs investigated while N�+ the number of
the interactive NR-drug pairs incorrectly predicted as the non-interactive NR-drug pairs; N� the
total number of the non-interactive NR-drug pairs investigated while N �� the number of the non-
interactive NR-drug pairs incorrectly predicted as the interactive NR-drug pairs. According to Equation (23) we can easily see the following. When N�
+ = 0 meaning none of the interactive NR-drug pairs was mispredicted to be a non-interactive NR-drug pair, we have the sensitivity Sn =1 ; while N�
+ = N+ meaning that all the interactive NR-drug pairs were mispredicted to be the non-interactive NR-drug pairs, we have the sensitivity Sn = 0. Likewise, when N+
� = 0 meaning none of the non-interactive NR-drug pairs was mispredicted, we have the specificity Sp =1; while N+
� = N� meaning all the non-interactive NR-drug pairs were incorrectly predicted as interactive NR-drug pairs, we have the specificity Sp = 0 . When N�
+ = N+� = 0
meaning that none of the interactive NR-drug pairs in the dataset and none of the non-interactive NR-drug pairs in was incorrectly predicted, we have the overall accuracy Acc =1; while N�
+ = N+ and N+� = N� meaning that all the interactive NR-drug pairs in the dataset and
all the non-interactive NR-drug pairs in were mispredicted, we have the overall accuracy Acc = 0. The Matthews correlation coefficient MCC is usually used for measuring the quality of binary (two-class) classifications. When N�
+ = N+� = 0 meaning that none of the interactive
NR-drug pairs in the dataset and none of the non-interactive NR-drug pairs in was mispredicted, we have MCC =1; when N�
+ = N+ / 2 and N+� = N� / 2 we have MCC = 0 meaning
no better than random prediction; when N�+ = N+ and N+
� = N�we have MCC = 0 meaning total disagreement between prediction and observation. As we can see from the above discussion, it is much more intuitive and easier to understand when using Equation (23) to examine a predictor for its four metrics, particularly for its Mathew’s correlation coefficient. It is instructive to point out that the metrics as defined in Equation (23) are valid for single label systems; for multi-label systems, a set of more complicated metrics should be used as given in [162].
3.2. Jackknife Test Approach
How to properly test a predictor for its anticipated success rates is very important for its development as well as its potential application value. Generally speaking, the following three cross-validation methods are often used to examine the quality of a predictor and its effectiveness

265
in practical application: independent dataset test, subsampling or K-fold (such as five-fold, seven-fold, or 10-fold) crossover test and jackknife test [163]. However, as elaborated by a penetrating analysis in [164], considerable arbitrariness exists in the independent dataset test. Also, as demonstrated in [165], the subsampling (or K-fold crossover validation) test cannot avoid arbitrariness either. Only the jackknife test is the least arbitrary that can always yield a unique result for a given benchmark dataset [73,74,156,166–168]. Therefore, the jackknife test has been widely recognized and increasingly utilized by investigators to examine the quality of various predictors (see, e.g., [14,15,68,99,106,107,124,169,170]). Accordingly, in this study the jackknife test was also adopted to evaluate the accuracy of the current predictor.
As mentioned above, the SVM operation engine contains two uncertain parameters C and �. To find their optimal values, a 2-D grid search was conducted by the jackknife test on the benchmark dataset . The results thus obtained are shown in Figure 3, from which it can be seen that the iNR-Drug predictor reaches its optimal status when C = 23 and �= 2�9 . The corresponding rates for the four metrics (cf. Equation (23)) are given in Table 1, where for facilitating comparison, the overall accuracy Acc reported by He et al. [59] on the same benchmark dataset is also given although no results were reported by them for Sn, Sp and MCC. It can be observed from the table that the overall accuracy obtained by iNR-Drug is remarkably higher that of He et al. [59], and that the rates achieved by iNR-Drug for the other three metrics are also quite higher. These facts indicate that the current predictor not only can yield higher overall prediction accuracy but also is quite stable with low false prediction rates.
Figure 3. A 3-D graph showing how to optimize the two parameters � and C in SVM via the jackknife success rates.

266
Table 1. The jackknife success rates obtained iNR-Drug in identifying the interactive NR-drug pairs and non-interactive NR-drug pairs for the benchmark dataset (cf. Supplementary Information S1).
Metrics Used for Measuring Prediction
Quality (cf. Equation (23)) iNR-Drug
a Method by He et al. b
Sn 68 79.07%86
� N/A
Sp 162 94.19%172
� N/A
Acc 230 89.15%258
� 85.66%
MCC 75.19% N/A a The parameters used: 32C � and �= 2�9 for the SVM operation engine; b See [59].
3.3. Independent Dataset Test
As mentioned above (Section 3.2), the jackknife test is the most objective method for examining the quality of a predictor. However, as a demonstration to show how to practically use the current predictor, we took 41 NR-drug pairs from the study by Yamanishi et al. [171] that had been confirmed by experiments as interactive pairs. For such an independent dataset, 34 were correctly identified by iNR-Drug as interactive pairs, i.e., Sn = 34 / 41= 82.92%, which is quite consistent with the rate of 79.07% achieved by the predictor on the benchmark dataset via the jackknife test as reported in Table 1.
4. Conclusions
It is anticipated that the iNR-Drug predictor developed in this paper may become a useful high throughput tool for both basic research and drug development, and that the current approach may be easily extended to study the interactions of drug with other targets as well. Since user-friendly and publicly accessible web-servers represent the future direction for developing practically more useful predictors [98,172], a publicly accessible web-server for iNR-Drug was established.
For the convenience of the vast majority of biologists and pharmaceutical scientists, here let us provide a step-by-step guide to show how the users can easily get the desired result by using iNR-Drug web-server without the need to follow the complicated mathematical equations presented in this paper for the process of developing the predictor and its integrity.
Step 1. Open the web server at the site http://www.jci-bioinfo.cn/iNR-Drug/ and you will see the top page of the predictor on your computer screen, as shown in Figure 4. Click on the Read Me button to see a brief introduction about iNR-Drug predictor and the caveat when using it.
Step 2. Either type or copy/paste the query NR-drug pairs into the input box at the center of Figure 4. Each query pair consists of two parts: one is for the nuclear receptor sequence, and the other for the drug. The NR sequence should be in FASTA format, while the drug in the KEGG code beginning with the symbol #. Examples for the query pairs input and the corresponding output can be seen by clicking on the Example button right above the input box.

267
Figure 4. A semi-screenshot to show the top page of the iNR-Drug web-server. Its website address is at http://www.jci-bioinfo.cn/iNR-Drug.
Step 3. Click on the Submit button to see the predicted result. For example, if you use the three query pairs in the Example window as the input, after clicking the Submit button, you will see on your screen that the “hsa:2099” NR and the “D00066” drug are an interactive pair, and that the “hsa:2908” NR and the “D00088” drug are also an interactive pair, but that the “hsa:5468” NR and the “D00279” drug are not an interactive pair. All these results are fully consistent with the experimental observations. It takes about 3 minutes before each of these results is shown on the screen; of course, the more query pairs there is, the more time that is usually needed.
Step 4. Click on the Citation button to find the relevant paper that documents the detailed development and algorithm of iNR-Durg.
Step 5. Click on the Data button to download the benchmark dataset used to train and test the iNR-Durg predictor.
Step 6. The program code is also available by clicking the button download on the lower panel of Figure 4.
Acknowledgments
The authors would like to express their gratitude to the three anonymous reviewers, whose constructive comments are very helpful for strengthening the presentation of the paper. This work was supported by the grants from the National Natural Science Foundation of China (No. 31260273), the Province National Natural Science Foundation of Jiangxi (No. 2010GZS0122, No. 20114BAB211013 and No. 20122BAB201020), the Department of Education of Jiangxi Province (GJJ12490), the Jiangxi Provincial Foreign Scientific and Technological Cooperation Project (No. 20120BDH80023), and the Jiangxi Provincial Foundation for Leaders of Disciplines in Science (20113BCB22008). The funders had no role in study design, data collection and analysis, decision to publish, or preparation of the manuscript.

268
Conflicts of Interest
The authors declare no conflict of interest.
References
1. Altucci, L.; Gronemeyer, H. Nuclear receptors in cell life and death. Trends Endocrinol. Metab. 2001, 12, 460–468.
2. Bates, M.K.; Kerr, R.M. Nuclear Receptors; Nova Science: Hauppauge, NY, USA, 2011. 3. Bunce, C.M.; Campbell, M.J. Nuclear Receptors: Current Concepts and Future Challenges;
Springer: Dordrecht, The Netherlands; New York, NY, USA, 2010; p. xii, 457. 4. Robinson-Rechavi, M.; Garcia, H.E.; Laudet, V. The nuclear receptor superfamily.
J. Cell Sci. 2003, 116, 585–586. 5. Kastner, P. Non-steroid nuclear receptors: What are genetic studies telling us their role in
renal life? Cell 1995, 83, 859–869. 6. Chen, T. Nuclear receptor drug discovery. Curr. Opin. Chem. Biol. 2008, 12, 418–426. 7. Tirona, R.G.; Kim, R.B. Nuclear receptors and drug disposition gene regulation.
J. Pharm. Sci. 2005, 94, 1169–1186. 8. Lin, W.Z.; Xiao, X.; Chou, K.C. GPCR-GIA: A web-server for identifying G-protein coupled
receptors and their families with grey incidence analysis. Protein Eng. Des. Sel. 2009, 22, 699–705.
9. Chou, K.C.; Elrod, D.W. Bioinformatical analysis of G-protein-coupled receptors. J. Proteome Res. 2002, 1, 429–433.
10. Xiao, X.; Min, J.L.; Wang, P.; Chou, K.C. iGPCR-Drug: A web server for predicting interaction between GPCRs and drugs in cellular networking. PLoS One 2013, 8, e72234.
11. Xiao, X.; Wang, P.; Chou, K.C. GPCR-CA: A cellular automaton image approach for predicting G-protein-coupled receptor functional classes. J. Comput. Chem. 2009, 30, 1414–1423.
12. Xiao, X.; Wang, P.; Chou, K.C. GPCR-2L: Predicting G protein-coupled receptors and their types by hybridizing two different modes of pseudo amino acid compositions. Mol. Biosyst. 2011, 7, 911–919.
13. Gu, Q.; Ding, Y.S.; Zhang, T.L. Prediction of G-protein-coupled receptor classes in low homology using Chou’s pseudo amino acid composition with approximate entropy and hydrophobicity patterns. Protein Pept. Lett. 2010, 17, 559–567.
14. Qiu, J.D.; Huang, J.H.; Liang, R.P.; Lu, X.Q. Prediction of G-protein-coupled receptor classes based on the concept of Chou’s pseudo amino acid composition: An approach from discrete wavelet transform. Anal. Biochem. 2009, 390, 68–73.
15. Xie, H.L.; Fu, L.; Nie, X.D. Using ensemble SVM to identify human GPCRs N-linked glycosylation sites based on the general form of Chou’s PseAAC. Protein Eng. Des. Sel. 2013, 26, 735–742.
16. Zia Ur, R.; Khan, A. Identifying GPCRs and their types with Chou’s pseudo amino acid composition: An approach from multi-scale energy representation and position specific scoring matrix. Protein Pept. Lett. 2012, 19, 890–903.

269
17. Chou, K.C. Prediction of G-protein-coupled receptor classes. J. Proteome Res. 2005, 4, 1413–1418.
18. Xiao, X.; Min, J.L.; Wang, P.; Chou, K.C. iCDI-PseFpt: Identify the channel-drug interaction in cellular networking with PseAAC and molecular fingerprints. J. Theor. Biol. 2013, 337C, 71–79.
19. Chou, K.C. Insights from modelling three-dimensional structures of the human potassium and sodium channels. J. Proteome Res. 2004, 3, 856–861.
20. Pielak, R.M.; Chou, J.J. Influenza M2 proton channels. Biochim. Biophys. Acta 2011, 1808, 522–529.
21. Chou, K.C.; Watenpaugh, K.D.; Heinrikson, R.L. A Model of the complex between cyclin-dependent kinase 5 (Cdk5) and the activation domain of neuronal Cdk5 activator. Biochem. Biophys. Res. Commun. 1999, 259, 420–428.
22. Schnell, J.R.; Zhou, G.P.; Zweckstetter, M.; Rigby, A.C.; Chou, J.J. Rapid and accurate structure determination of coiled-coil domains using NMR dipolar couplings: Application to cGMP-dependent protein kinase Ialpha. Protein Sci. 2005, 14, 2421–2428.
23. Zhou, G.P.; Surks, H.K.; Schnell, J.R.; Chou, J.J.; Mendelsohn, M.E.; Rigby, A.C. The three-dimensional structure of the cGMP-dependent protein kinase I-α leucine zipper domain and its interaction with the myosin binding subunit. Blood 2004, 104, 963a.
24. Zweckstetter, M.; Schnell, J.R.; Chou, J.J. Determination of the packing mode of the coiled-coil domain of cGMP-dependent protein kinase Ialpha in solution using charge-predicted dipolar couplings. J. Am. Chem. Soc. 2005, 127, 11918–11919.
25. Knowles, J.; Gromo, G. A guide to drug discovery: Target selection in drug discovery. Nat. Rev. Drug Discov. 2003, 2, 63–69.
26. Lindsay, M.A. Target discovery. Nat. Rev. Drug Discov. 2003, 2, 831–838. 27. Rarey, M.; Kramer, B.; Lengauer, T.; Klebe, G. A fast flexible docking method using an
incremental construction algorithm. J. Mol. Biol. 1996, 261, 470–489. 28. Chou, K.C.; Wei, D.Q.; Zhong, W.Z. Binding mechanism of coronavirus main proteinase
with ligands and its implication to drug design against SARS. (Erratum: ibid., 2003, Vol. 310, 675). Biochem. Biophys. Res. Commun. 2003, 308, 148–151.
29. Zhou, G.P.; Troy, F.A. NMR studies on how the binding complex of polyisoprenol recognition sequence peptides and polyisoprenols can modulate membrane structure. Curr. Protein Pept. Sci. 2005, 6, 399–411.
30. Chou, K.C.; Wei, D.Q.; Du, Q.S.; Sirois, S.; Zhong, W.Z. Review: Progress in computational approach to drug development against SARS. Curr. Med. Chem. 2006, 13, 3263–3270.
31. Du, Q.S.; Wang, S.; Wei, D.Q.; Sirois, S.; Chou, K.C. Molecular modelling and chemical modification for finding peptide inhibitor against SARS CoV Mpro. Anal. Biochem. 2005, 337, 262–270.
32. Huang, R.B.; Du, Q.S.; Wang, C.H.; Chou, K.C. An in-depth analysis of the biological functional studies based on the NMR M2 channel structure of influenza A virus. Biochem. Biophys. Res. Commun. 2008, 377, 1243–1247.

270
33. Du, Q.S.; Huang, R.B.; Wang, C.H.; Li, X.M.; Chou, K.C. Energetic analysis of the two controversial drug binding sites of the M2 proton channel in influenza A virus. J. Theor. Biol. 2009, 259, 159–164.
34. Wei, H.; Wang, C.H.; Du, Q.S.; Meng, J.; Chou, K.C. Investigation into adamantane-based M2 inhibitors with FB-QSAR. Med. Chem. 2009, 5, 305–317.
35. Du, Q.S.; Huang, R.B.; Wang, S.Q.; Chou, K.C. Designing inhibitors of M2 proton channel against H1N1 swine influenza virus. PLoS One 2010, 5, e9388.
36. Wang, S.Q.; Du, Q.S.; Huang, R.B.; Zhang, D.W.; Chou, K.C. Insights from investigating the interaction of oseltamivir (Tamiflu) with neuraminidase of the 2009 H1N1 swine flu virus. Biochem. Biophys. Res. Commun. 2009, 386, 432–436.
37. Chou, K.C. Review: Structural bioinformatics and its impact to biomedical science. Curr. Med. Chem. 2004, 11, 2105–2134.
38. Cai, L.; Wang, Y.; Wang, J.F.; Chou, K.C. Identification of proteins interacting with human SP110 during the process of viral infections. Med. Chem. 2011, 7, 121–126.
39. Liao, Q.H.; Gao, Q.Z.; Wei, J.; Chou, K.C. Docking and molecular dynamics study on the inhibitory activity of novel inhibitors on epidermal growth factor receptor (EGFR). Med. Chem. 2011, 7, 24–31.
40. Li, X.B.; Wang, S.Q.; Xu, W.R.; Wang, R.L.; Chou, K.C. Novel inhibitor design for hemagglutinin against H1N1 influenza virus by core hopping method. PLoS One 2011, 6, e28111.
41. Ma, Y.; Wang, S.Q.; Xu, W.R.; Wang, R.L.; Chou, K.C. Design novel dual agonists for treating type-2 diabetes by targeting peroxisome proliferator-activated receptors with core hopping approach. PLoS One 2012, 7, e38546.
42. Wang, J.F.; Chou, K.C. Insights from modeling the 3D structure of New Delhi metallo-beta-lactamase and its binding interactions with antibiotic drugs. PLoS One 2011, 6, e18414.
43. Wang, J.F.; Chou, K.C. Insights into the mutation-induced HHH syndrome from modeling human mitochondrial ornithine transporter-1. PLoS One 2012, 7, e31048.
44. Berardi, M.J.; Shih, W.M.; Harrison, S.C.; Chou, J.J. Mitochondrial uncoupling protein 2 structure determined by NMR molecular fragment searching. Nature 2011, 476, 109–113.
45. Schnell, J.R.; Chou, J.J. Structure and mechanism of the M2 proton channel of influenza A virus. Nature 2008, 451, 591–595.
46. OuYang, B.; Xie, S.; Berardi, M.J.; Zhao, X.M.; Dev, J.; Yu, W.; Sun, B.; Chou, J.J. Unusual architecture of the p7 channel from hepatitis C virus. Nature 2013, 498, 521–525.
47. Oxenoid, K.; Chou, J.J. The structure of phospholamban pentamer reveals a channel-like architecture in membranes. Proc. Natl. Acad. Sci. USA 2005, 102, 10870–10875.
48. Call, M.E.; Wucherpfennig, K.W.; Chou, J.J. The structural basis for intramembrane assembly of an activating immunoreceptor complex. Nat. Immunol. 2010, 11, 1023–1029.
49. Pielak, R.M.; Chou, J.J. Solution NMR structure of the V27A drug resistant mutant of influenza A M2 channel. Biochem. Biophys. Res. Commun. 2010, 401, 58–63.
50. Pielak, R.M.; Jason, R.; Schnell, J.R.; Chou, J.J. Mechanism of drug inhibition and drug resistance of influenza A M2 channel. Proc. Natl. Acad. Sci. USA 2009, 106, 7379–7384.

271
51. Wang, J.; Pielak, R.M.; McClintock, M.A.; Chou, J.J. Solution structure and functional analysis of the influenza B proton channel. Nat. Struct. Mol. Biol. 2009, 16, 1267–1271.
52. Chou, K.C.; Jones, D.; Heinrikson, R.L. Prediction of the tertiary structure and substrate binding site of caspase-8. FEBS Lett. 1997, 419, 49–54.
53. Chou, K.C.; Tomasselli, A.G.; Heinrikson, R.L. Prediction of the tertiary structure of a caspase-9/inhibitor complex. FEBS Lett. 2000, 470, 249–256.
54. Chou, K.C.; Howe, W.J. Prediction of the tertiary structure of the beta-secretase zymogen. Biochem. Biophys. Res. Commun. 2002, 292, 702–708.
55. Chou, K.C. Coupling interaction between thromboxane A2 receptor and alpha-13 subunit of guanine nucleotide-binding protein. J. Proteome Res. 2005, 4, 1681–1686.
56. Chou, K.C. Insights from modeling the 3D structure of DNA-CBF3b complex. J. Proteome Res. 2005, 4, 1657–1660.
57. Chou, K.C. Modeling the tertiary structure of human cathepsin-E. Biochem. Biophys. Res. Commun. 2005, 331, 56–60.
58. Sirois, S.; Hatzakis, G.E.; Wei, D.Q.; Du, Q.S.; Chou, K.C. Assessment of chemical libraries for their druggability. Comput. Biol. Chem. 2005, 29, 55–67.
59. He, Z.; Zhang, J.; Shi, X.H.; Hu, L.L.; Kong, X.; Cai, Y.D.; Chou, K.C. Predicting drug-target interaction networks based on functional groups and biological features. PLoS One 2010, 5, e9603.
60. Chou, K.C. Some remarks on protein attribute prediction and pseudo amino acid composition (50th Anniversary Year Review). J. Theor. Biol. 2011, 273, 236–247.
61. Qiu, W.R.; Xiao, X.; Chou, K.C. iRSpot-TNCPseAAC: Identify recombination spots with trinucleotide composition and pseudo amino acid components. Int. J. Mol. Sci. 2014, 15, 1746–1766.
62. Chen, W.; Feng, P.M.; Lin, H.; Chou, K.C. iRSpot-PseDNC: Identify recombination spots with pseudo dinucleotide composition Nucleic Acids Res. 2013, 41, e69.
63. Feng, P.M.; Chen, W.; Lin, H.; Chou, K.C. iHSP-PseRAAAC: Identifying the heat shock protein families using pseudo reduced amino acid alphabet composition. Anal. Biochem. 2013, 442, 118–125.
64. Liu, B.; Zhang, D.; Xu, R.; Xu, J.; Wang, X.; Chen, Q.; Dong, Q.; Chou, K.C. Combining evolutionary information extracted from frequency profiles with sequence-based kernels for protein remote homology detection. Bioinformatics 2013, doi:10.1093/bioinformatics/btt709.
65. Chen, W.; Lin, H.; Feng, P.M.; Ding, C.; Zuo, Y.C.; Chou, K.C. iNuc-PhysChem: A sequence-based predictor for identifying nucleosomes via physicochemical properties. PLoS One 2012, 7, e47843.
66. Xu, Y.; Ding, J.; Wu, L.Y.; Chou, K.C. iSNO-PseAAC: Predict cysteine S-nitrosylation sites in proteins by incorporating position specific amino acid propensity into pseudo amino acid composition. PLoS One 2013, 8, e55844.
67. Xu, Y.; Shao, X.J.; Wu, L.Y.; Deng, N.Y.; Chou, K.C. iSNO-AAPair: Incorporating amino acid pairwise coupling into PseAAC for predicting cysteine S-nitrosylation sites in proteins. Peer J. 2013, 1, e171.

272
68. Min, J.L.; Xiao, X.; Chou, K.C. iEzy-Drug: A web server for identifying the interaction between enzymes and drugs in cellular networking. BioMed Res. Int. 2013, 2013, 701317.
69. Xiao, X.; Wang, P.; Lin, W.Z.; Jia, J.H.; Chou, K.C. iAMP-2L: A two-level multi-label classifier for identifying antimicrobial peptides and their functional types. Anal. Biochem. 2013, 436, 168–177.
70. Guo, S.H.; Deng, E.Z.; Xu, L.Q.; Ding, H.; Lin, H.; Chen, W.; Chou, K.C. iNuc-PseKNC: A sequence-based predictor for predicting nucleosome positioning in genomes with pseudo k-tuple nucleotide composition. Bioinformatics 2014, doi:10.1093/bioinformatics/btu083.
71. Kotera, M.; Hirakawa, M.; Tokimatsu, T.; Goto, S.; Kanehisa, M. The KEGG databases and tools facilitating omics analysis: Latest developments involving human diseases and pharmaceuticals. Methods Mol. Biol. 2012, 802, 19–39.
72. Chou, K.C.; Shen, H.B. Review: Recent progresses in protein subcellular location prediction. Anal. Biochem. 2007, 370, 1–16.
73. Zhou, G.P. An intriguing controversy over protein structural class prediction. J. Protein Chem. 1998, 17, 729–738.
74. Zhou, G.P.; Assa-Munt, N. Some insights into protein structural class prediction. Proteins: Struct. Funct. Genet. 2001, 44, 57–59.
75. Chou, K.C.; Elrod, D.W. Prediction of enzyme family classes. J. Proteome Res. 2003, 2, 183–190.
76. Wang, M.; Yang, J.; Xu, Z.J.; Chou, K.C. SLLE for predicting membrane protein types. J. Theor. Biol. 2005, 232, 7–15.
77. Xiao, X.; Wang, P.; Chou, K.C. Predicting protein structural classes with pseudo amino acid composition: An approach using geometric moments of cellular automaton image. J. Theor. Biol. 2008, 254, 691–696.
78. Chou, K.C. A novel approach to predicting protein structural classes in a (20–1)-D amino acid composition space. Proteins: Struct. Funct. Genet. 1995, 21, 319–344.
79. Zhou, G.P.; Doctor, K. Subcellular location prediction of apoptosis proteins. Proteins: Struct. Funct. Genet. 2003, 50, 44–48.
80. Feng, K.Y.; Cai, Y.D.; Chou, K.C. Boosting classifier for predicting protein domain structural class. Biochem. Biophys. Res. Commun. 2005, 334, 213–217.
81. Cai, Y.D.; Chou, K.C. Artificial neural network for predicting alpha-turn types. Anal. Biochem. 1999, 268, 407–409.
82. Thompson, T.B.; Chou, K.C.; Zheng, C. Neural network prediction of the HIV-1 protease cleavage sites. J. Theor. Biol. 1995, 177, 369–379.
83. Xiao, X.; Wang, P.; Chou, K.C. iNR-PhysChem: A sequence-based predictor for identifying nuclear receptors and their subfamilies via physical-chemical property matrix. PLoS One 2012, 7, e30869.
84. Lin, W.Z.; Fang, J.A.; Xiao, X.; Chou, K.C. iDNA-Prot: Identification of DNA binding proteins using random forest with grey model. PLoS One 2011, 6, e24756.
85. Kandaswamy, K.K.; Chou, K.C.; Martinetz, T.; Moller, S.; Suganthan, P.N.; Sridharan, S.; Pugalenthi, G. AFP-Pred: A random forest approach for predicting antifreeze proteins from sequence-derived properties. J. Theor. Biol. 2011, 270, 56–62.
273
86. Cai, Y.D.; Chou, K.C. Predicting subcellular localization of proteins in a hybridization space. Bioinformatics 2004, 20, 1151–1156.
87. Chou, K.C.; Cai, Y.D. Prediction of protease types in a hybridization space. Biochem. Biophys. Res. Commun. 2006, 339, 1015–1020.
88. Chou, K.C.; Shen, H.B. Predicting eukaryotic protein subcellular location by fusing optimized evidence-theoretic K-nearest neighbor classifiers. J. Proteome Res. 2006, 5, 1888–1897.
89. Chou, K.C.; Shen, H.B. Hum-PLoc: A novel ensemble classifier for predicting human protein subcellular localization. Biochem. Biophys. Res. Commun. 2006, 347, 150–157.
90. Chou, K.C.; Shen, H.B. Large-scale predictions of Gram-negative bacterial protein subcellular locations. J. Proteome Res. 2006, 5, 3420–3428.
91. Chou, K.C.; Shen, H.B. Euk-mPLoc: A fusion classifier for large-scale eukaryotic protein subcellular location prediction by incorporating multiple sites. J. Proteome Res. 2007, 6, 1728–1734.
92. Chou, K.C.; Shen, H.B. Signal-CF: A subsite-coupled and window-fusing approach for predicting signal peptides. Biochem. Biophys. Res. Commun. 2007, 357, 633–640.
93. Shen, H.B.; Chou, K.C. Using optimized evidence-theoretic K-nearest neighbor classifier and pseudo amino acid composition to predict membrane protein types. Biochem. Biophys. Res. Commun. 2005, 334, 288–292.
94. Shen, H.B.; Chou, K.C. A top-down approach to enhance the power of predicting human protein subcellular localization: Hum-mPLoc 2.0. Anal. Biochem. 2009, 394, 269–274.
95. Shen, H.B.; Yang, J.; Chou, K.C. Fuzzy KNN for predicting membrane protein types from pseudo amino acid composition. J. Theor. Biol. 2006, 240, 9–13.
96. Chou, K.C. Prediction of protein cellular attributes using pseudo amino acid composition. Proteins: Struct. Funct. Genet. 2001, 43, 246–255.
97. Chou, K.C. Using amphiphilic pseudo amino acid composition to predict enzyme subfamily classes. Bioinformatics 2005, 21, 10–19.
98. Lin, S.X.; Lapointe, J. Theoretical and experimental biology in one. J. Biomed. Sci. Eng. (JBiSE) 2013, 6, 435–442.
99. Hajisharifi, Z.; Piryaiee, M.; Mohammad Beigi, M.; Behbahani, M.; Mohabatkar, H. Predicting anticancer peptides with Chou’s pseudo amino acid composition and investigating their mutagenicity via Ames test. J. Theor. Biol. 2014, 341, 34–40.
100. Mei, S. Predicting plant protein subcellular multi-localization by Chou’s PseAAC formulation based multi-label homolog knowledge transfer learning. J. Theor. Biol. 2012, 310, 80–87.
101. Chang, T.H.; Wu, L.C.; Lee, T.Y.; Chen, S.P.; Huang, H.D.; Horng, J.T. EuLoc: A web-server for accurately predict protein subcellular localization in eukaryotes by incorporating various features of sequence segments into the general form of Chou’s PseAAC. J. Comput.-Aided Mol. Des. 2013, 27, 91–103.
102. Fan, G.L.; Li, Q.Z. Predict mycobacterial proteins subcellular locations by incorporating pseudo-average chemical shift into the general form of Chou’s pseudo amino acid composition. J. Theor. Biol. 2012, 304, 88–95.

274
103. Huang, C.; Yuan, J. Using radial basis function on the general form of Chou’s pseudo amino acid composition and PSSM to predict subcellular locations of proteins with both single and multiple sites. Biosystems 2013, 113, 50–57.
104. Lin, H.; Wang, H.; Ding, H.; Chen, Y.L.; Li, Q.Z. Prediction of subcellular localization of apoptosis protein using Chou’s pseudo amino acid composition. Acta Biotheor. 2009, 57, 321–330.
105. Wan, S.; Mak, M.W.; Kung, S.Y. GOASVM: A subcellular location predictor by incorporating term-frequency gene ontology into the general form of Chou’s pseudo-amino acid composition. J. Theor. Biol. 2013, 323, 40–48.
106. Huang, C.; Yuan, J.Q. Predicting protein subchloroplast locations with both single and multiple sites via three different modes of Chou’s pseudo amino acid compositions. J. Theor. Biol. 2013, 335, 205–212.
107. Chen, Y.K.; Li, K.B. Predicting membrane protein types by incorporating protein topology, domains, signal peptides, and physicochemical properties into the general form of Chou’s pseudo amino acid composition. J. Theor. Biol. 2013, 318, 1–12.
108. Huang, C.; Yuan, J.Q. A multilabel model based on Chou’s pseudo-amino acid composition for identifying membrane proteins with both single and multiple functional types. J. Membr. Biol. 2013, 246, 327–334.
109. Nanni, L.; Lumini, A. Genetic programming for creating Chou’s pseudo amino acid based features for submitochondria localization. Amino Acids 2008, 34, 653–660.
110. Fan, G.L.; Li, Q.Z. Predicting protein submitochondria locations by combining different descriptors into the general form of Chou’s pseudo amino acid composition. Amino Acids 2012, 43, 545–555.
111. Mei, S. Multi-kernel transfer learning based on Chou’s PseAAC formulation for protein submitochondria localization. J. Theor. Biol. 2012, 293, 121–130.
112. Zeng, Y.H.; Guo, Y.Z.; Xiao, R.Q.; Yang, L.; Yu, L.Z.; Li, M.L. Using the augmented Chou’s pseudo amino acid composition for predicting protein submitochondria locations based on auto covariance approach. J. Theor. Biol. 2009, 259, 366–372.
113. Mohabatkar, H.; Mohammad Beigi, M.; Esmaeili, A. Prediction of GABA(A) receptor proteins using the concept of Chou’s pseudo-amino acid composition and support vector machine. J. Theor. Biol. 2011, 281, 18–23.
114. Zhou, X.B.; Chen, C.; Li, Z.C.; Zou, X.Y. Using Chou’s amphiphilic pseudo-amino acid composition and support vector machine for prediction of enzyme subfamily classes. J. Theor. Biol. 2007, 248, 546–551.
115. Khosravian, M.; Faramarzi, F.K.; Beigi, M.M.; Behbahani, M.; Mohabatkar, H. Predicting antibacterial peptides by the concept of Chou;s pseudo-amino acid composition and machine learning methods. Protein Pept. Lett. 2013, 20, 180–186.
116. Zou, D.; He, Z.; He, J.; Xia, Y. Supersecondary structure prediction using Chou’s pseudo amino acid composition. J. Comput. Chem. 2011, 32, 271–278.
117. Nanni, L.; Lumini, A.; Gupta, D.; Garg, A. Identifying bacterial virulent proteins by fusing a set of classifiers based on variants of Chou’s pseudo amino acid composition and on evolutionary information. IEEE/ACM Trans. Comput. Biol. Bioinform. 2012, 9, 467–475.

275
118. Sahu, S.S.; Panda, G. A novel feature representation method based on Chou’s pseudo amino acid composition for protein structural class prediction. Comput. Biol. Chem. 2010, 34, 320–327.
119. Zhang, G.Y.; Fang, B.S. Predicting the cofactors of oxidoreductases based on amino acid composition distribution and Chou’s amphiphilic pseudo amino acid composition. J. Theor. Biol. 2008, 253, 310–315.
120. Mohammad Beigi, M.; Behjati, M.; Mohabatkar, H. Prediction of metalloproteinase family based on the concept of Chou’s pseudo amino acid composition using a machine learning approach. J. Struct. Funct. Genomics 2011, 12, 191–197.
121. Yu, L.; Guo, Y.; Li, Y.; Li, G.; Li, M.; Luo, J.; Xiong, W.; Qin, W. SecretP: Identifying bacterial secreted proteins by fusing new features into Chou’s pseudo-amino acid composition. J. Theor. Biol. 2010, 267, 1–6.
122. Mohabatkar, H.; Beigi, M.M.; Abdolahi, K.; Mohsenzadeh, S. Prediction of allergenic proteins by means of the concept of Chou’s pseudo amino acid composition and a machine learning approach. Med. Chem. 2013, 9, 133–137.
123. Zhang, S.W.; Chen, W.; Yang, F.; Pan, Q. Using Chou’s pseudo amino acid composition to predict protein quaternary structure: A sequence-segmented PseAAC approach. Amino Acids 2008, 35, 591–598.
124. Sun, X.Y.; Shi, S.P.; Qiu, J.D.; Suo, S.B.; Huang, S.Y.; Liang, R.P. Identifying protein quaternary structural attributes by incorporating physicochemical properties into the general form of Chou’s PseAAC via discrete wavelet transform. Mol. BioSyst. 2012, 8, 3178–3184.
125. Esmaeili, M.; Mohabatkar, H.; Mohsenzadeh, S. Using the concept of Chou’s pseudo amino acid composition for risk type prediction of human papillomaviruses. J. Theor. Biol. 2010, 263, 203–209.
126. Mohabatkar, H. Prediction of cyclin proteins using Chou’s pseudo amino acid composition. Protein Pept. Lett. 2010, 17, 1207–1214.
127. Hayat, M.; Khan, A. Discriminating outer membrane proteins with fuzzy K-nearest neighbor algorithms based on the general form of Chou’s PseAAC. Protein Pept. Lett. 2012, 19, 411–421.
128. Georgiou, D.N.; Karakasidis, T.E.; Nieto, J.J.; Torres, A. Use of fuzzy clustering technique and matrices to classify amino acids and its impact to Chou’s pseudo amino acid composition. J. Theor. Biol. 2009, 257, 17–26.
129. Liu, B.; Wang, X.; Zou, Q.; Dong, Q.; Chen, Q. Protein remote homology detection by combining Chou’s pseudo amino acid composition and profile-based protein representation. Mol. Inform. 2013, 32, 775–782.
130. Li, B.Q.; Huang, T.; Liu, L.; Cai, Y.D.; Chou, K.C. Identification of colorectal cancer related genes with mRMR and shortest path in protein-protein interaction network. PLoS One 2012, 7, e33393.
131. Huang, T.; Wang, J.; Cai, Y.D.; Yu, H.; Chou, K.C. Hepatitis C virus network based classification of hepatocellular cirrhosis and carcinoma. PLoS One 2012, 7, e34460.

276
132. Jiang, Y.; Huang, T.; Lei, C.; Gao, Y.F.; Cai, Y.D.; Chou, K.C. Signal propagation in protein interaction network during colorectal cancer progression. BioMed Res. Int. 2013, 2013, 287019.
133. Du, P.; Wang, X.; Xu, C.; Gao, Y. PseAAC-Builder: A cross-platform stand-alone program for generating various special Chou’s pseudo-amino acid compositions. Anal. Biochem. 2012, 425, 117–119.
134. Cao, D.S.; Xu, Q.S.; Liang, Y.Z. Propy: A tool to generate various modes of Chou’s PseAAC. Bioinformatics 2013, 29, 960–962.
135. Shen, H.B.; Chou, K.C. PseAAC: A flexible web-server for generating various kinds of protein pseudo amino acid composition. Anal. Biochem. 2008, 373, 386–388.
136. Nakashima, H.; Nishikawa, K.; Ooi, T. The folding type of a protein is relevant to the amino acid composition. J. Biochem. 1986, 99, 153–162.
137. Zhang, C.T.; Chou, K.C. An optimization approach to predicting protein structural class from amino acid composition. Protein Sci. 1992, 1, 401–408.
138. Zhang, C.T.; Chou, K.C. Monte Carlo simulation studies on the prediction of protein folding types from amino acid composition. Biophys. J. 1992, 63, 1523–1529.
139. Chou, K.C.; Zhang, C.T. Predicting protein folding types by distance functions that make allowances for amino acid interactions. J. Biol. Chem. 1994, 269, 22014–22020.
140. Zhang, C.T.; Chou, K.C. Monte Carlo simulation studies on the prediction of protein folding types from amino acid composition. II. correlative effect. J. Protein Chem. 1995, 14, 251–258.
141. Chou, K.C. Does the folding type of a protein depend on its amino acid composition? FEBS Lett. 1995, 363, 127–131.
142. Liu, W.; Chou, K.C. Protein secondary structural content prediction. Protein Eng. 1999, 12, 1041–1050.
143. Chou, K.C. The convergence-divergence duality in lectin domains of the selectin family and its implications. FEBS Lett. 1995, 363, 123–126.
144. Chou, K.C.; Wu, Z.C.; Xiao, X. iLoc-Euk: A multi-label classifier for predicting the subcellular localization of singleplex and multiplex eukaryotic proteins. PLoS One 2011, 6, e18258.
145. Chou, K.C.; Wu, Z.C.; Xiao, X. iLoc-Hum: Using accumulation-label scale to predict subcellular locations of human proteins with both single and multiple sites. Mol. Biosyst. 2012, 8, 629–641.
146. Schaffer, A.A.; Aravind, L.; Madden, T.L.; Shavirin, S.; Spouge, J.L.; Wolf, Y.I.; Koonin, E.V.; Altschul, S.F. Improving the accuracy of PSI-BLAST protein database searches with composition-based statistics and other refinements. Nucleic Acids Res. 2001, 29, 2994–3005.
147. Altschul, S.F.; Madden, T.L.; Schaffer, A.A.; Zhang, J.; Zhang, Z.; Miller, W.; Lipman, D.J. Gapped BLAST and PSI-BLAST: A new generation of protein database search programs. Nucleic Acids Res. 1997, 25, 3389–3402.

277
148. Bolstad, B.M.; Irizarry, R.A.; Astrand, M.; Speed, T.P. A comparison of normalization methods for high density oligonucleotide array data based on variance and bias. Bioinformatics 2003, 19, 185–193.
149. Schadt, E.E.; Li, C.; Ellis, B.; Wong, W.H. Feature extraction and normalization algorithms for high-density oligonucleotide gene expression array data. J. Cell Biochem. Suppl. 2001, 37, 120–125.
150. Shi, J.Y.; Zhang, S.W.; Pan, Q.; Cheng, Y.M.; Xie, J. Prediction of protein subcellular localization by support vector machines using multi-scale energy and pseudo amino acid composition. Amino Acids 2007, 33, 69–74.
151. Liu, H.; Wang, M.; Chou, K.C. Low-frequency Fourier spectrum for predicting membrane protein types. Biochem. Biophys. Res. Commun. 2005, 336, 737–739.
152. Wang, S.Q.; Yang, J.; Chou, K.C. Using stacked generalization to predict membrane protein types based on pseudo amino acid composition. J. Theor. Biol. 2006, 242, 941–946.
153. Chen, J.; Liu, H.; Yang, J.; Chou, K.C. Prediction of linear B-cell epitopes using amino acid pair antigenicity scale. Amino Acids 2007, 33, 423–428.
154. Lin, W.Z.; Fang, J.A.; Xiao, X.; Chou, K.C. Predicting secretory proteins of malaria parasite by incorporating sequence evolution information into pseudo amino acid composition via grey system model. PLoS One 2012, 7, e49040.
155. Chou, K.C.; Cai, Y.D. Using functional domain composition and support vector machines for prediction of protein subcellular location. J. Biol. Chem. 2002, 277, 45765–45769.
156. Cai, Y.D.; Zhou, G.P.; Chou, K.C. Support vector machines for predicting membrane protein types by using functional domain composition. Biophys. J. 2003, 84, 3257–3263.
157. Cristianini, N.; Shawe-Taylor, J. An Introduction of Support Vector Machines and Other Kernel-Based Learning Methodds; Cambridge University Press: Cambridge, UK, 2000.
158. Chang, C.; Lin, C. LIBSVM: A library for support vector machines. ACM Trans. Intell. Syst. Technol. (TIST) 2011, 2, doi:10.1145/1961189.1961199.
159. Chou, K.C. Prediction of protein signal sequences and their cleavage sites. Proteins: Struct. Funct. Genet. 2001, 42, 136–139.
160. Chou, K.C. Using subsite coupling to predict signal peptides. Protein Eng. 2001, 14, 75–79. 161. Chou, K.C. Prediction of signal peptides using scaled window. Peptides 2001, 22,
1973–1979. 162. Chou, K.C. Some remarks on predicting multi-label attributes in molecular biosystems.
Mol. Biosyst. 2013, 9, 1092–1100. 163. Chou, K.C.; Zhang, C.T. Review: Prediction of protein structural classes. Crit. Rev. Biochem.
Mol. Biol. 1995, 30, 275–349. 164. Chou, K.C.; Shen, H.B. Cell-PLoc: A package of Web servers for predicting subcellular
localization of proteins in various organisms. Nat. Protoc. 2008, 3, 153–162. 165. Chou, K.C.; Shen, H.B. Cell-PLoc 2.0: An improved package of web-servers for predicting
subcellular localization of proteins in various organisms. Nat. Sci. 2010, 2, 1090–1103. 166. Cai, Y.D.; Zhou, G.P.; Chou, K.C. Predicting enzyme family classes by hybridizing
gene product composition and pseudo-amino acid composition. J. Theor. Biol. 2005, 234, 145–149.
278
167. Cai, Y.D.; Zhou, G.P.; Jen, C.H.; Lin, S.L.; Chou, K.C. Identify catalytic triads of serine hydrolases by support vector machines. J. Theor. Biol. 2004, 228, 551–557.
168. Shi, J.Y.; Zhang, S.W.; Pan, Q.; Zhou, G.P. Using pseudo amino acid composition to predict protein subcellular location: Approached with amino acid composition distribution. Amino Acids 2008, 35, 321–327.
169. Fan, G.L.; Li, Q.Z. Discriminating bioluminescent proteins by incorporating average chemical shift and evolutionary information into the general form of Chou’s pseudo amino acid composition. J. Theor. Biol. 2013, 334, 45–51.
170. Wu, Z.C.; Xiao, X.; Chou, K.C. iLoc-Gpos: A multi-layer classifier for predicting the subcellular localization of singleplex and multiplex gram-positive bacterial proteins. Protein Pept. Lett. 2012, 19, 4–14.
171. Yamanishi, Y.; Kotera, M.; Kanehisa, M.; Goto, S. Drug-target interaction prediction from chemical, genomic and pharmacological data in an integrated framework. Bioinformatics 2010, 26, i246–i254.
172. Chou, K.C.; Shen, H.B. Review: Recent advances in developing web-servers for predicting protein attributes. Nat. Sci. 2009, 2, 63–92.

279
Qualitative Analysis of the Helical Electronic Energy of
Inherently Chiral Calix[4]arenes: An Approach to
Effectively Assign Their Absolute Configuration
Shuang Zheng, Ming-Liang Chang, Jing Zhou, Jing-Wei Fu, Qing-Wei Zhang,
Shao-Yong Li, Wei Qiao and Jun-Min Liu
Abstract: For all microhelices on aromatic rings of inherently chiral calix[4]arene, an expression was derived from one approximation and one hypothesis on the basis of
the electron-on-a-helix model of Tinoco and Woody as follows: 21 ( )H KE
/ �� � 0 , where 1/ � for
the right-handed microhelix and 1/ � � for the left-handed microhelix; and H and K are constant and greater than zero. The expression correlates microhelical electronic energy (E) with the atom polarizability difference ( �0 ) on both microhelix ends, which intuitively and clearly shows the impact of helical substituent polarizability on helical electronic energy. The case analysis almost entirely proves that the qualitative analysis of the helical electronic energy of inherently chiral calix[4]arenes with the expression is scientific and can be used to effectively assign their absolute configuration.
Reprinted from Int. J. Mol. Sci. Cite as: Zheng, S.; Chang, M.-L.; Zhou, J.; Fu, J.-W.; Zhang, Q.-W.; Li, S.-Y.; Qiao, W.; Liu, J.-M. Qualitative Analysis of the Helical Electronic Energy of Inherently Chiral Calix[4]arenes: An Approach to Effectively Assign Their Absolute Configuration. Int. J. Mol. Sci. 2014, 15, 9844-9858.
1. Introduction
Inherently chiral calixarenes, whose chiralities result from the dissymmetric substitution of achiral residues on calixarene skeletons, are a type of attractive chiral molecule, because of their potential applications in chiral recognition and asymmetrical catalysis [1–6]. Although the first example of inherently chiral calixarene [7] appeared in 1982 and all varieties of them have been reported by now [1–3,6], only a few of them have been characterized by absolute configuration assignment, which seriously impedes their application in chiral recognition [8–14] and asymmetrical catalysis [10,11,15–20]. Therefore, the development of effective approaches for the absolute configuration assignment of inherently chiral calixarenes is of great importance.
A few approaches have been used to assign the absolute configuration of inherently chiral calixarenes, including chemical interconversions [19,21–25], X-ray crystallography [23], circular dichroism (CD) analysis [25] and density functional theory (DFT) calculation [26]. However, chemical interconversion requires an inherently chiral calixarene, whose absolute configuration has been assigned. A crystal is not always readily available for crystal structure determination. CD analysis is limited in inherently chiral calixarene, whose different phenoxyl orientations are confirmatory. The newer DFT calculation seems applicable, but commonly very time-consuming for the too large basis set of inherently chiral calixarenes. The relationship between the absolute configuration of a chiral molecule and its specific optical rotation has long been a very important

280
and well-known research area in stereochemistry. Many empirical and semi-empirical methods and rules, especial those developed by Brewster and Wang [27–31], have been devoted to it. As a part of electron helix theory [29], a variety of approaches have been exhaustively presented by Wang to establish the relationship between absolute configurations of chiral molecules and their helical characters. Their practicability and effectivity are also proven by many simple chiral molecules. However, the helical characters of inherently chiral calixarenes are so complex that their analysis cannot be fully achieved with general approaches in electron helix theory and used to assign their absolute configurations. Although the dilemma exists, we still believe that they are one of the best empirical solutions for the absolute configuration assignment of chiral molecules. Keeping this in mind, we now try to bring forward some approximations and hypothesis in the framework of electron helix theory to achieve the helical electronic energy analysis and absolute configuration assignment of inherently chiral calix[4]arene.
2. Results and Discussion
By keeping the calixarene skeleton integrated, the common dissymmetrical substitutions to create inherent chirality are O-alkylation or acylation on the OH group and meta- or para-substitution on the aromatic ring, although their synthesis can be achieved from either fragment condensation or dissymmetrical derivation of the macrocylic skeleton. Conformational inversion combined with functionalization at different positions can produce a variety of inherently chiral calixarenes [1–3,6]. It is known that there are two types of helices: the physical helix originated from asymmetric orbital twisting; and the geometrical helix originated from purely geometrical twisting, in many chiral molecules [29]. Theoretically, these two helices should also exist in inherently chiral calix[4]arenes.
As illustrated in Figure 1, three types of helices, the macrocyclic skeleton helix comprised of four phenyls and four bridging carbons (Figure 1b), the bridging carbon helix originated from asymmetrically substituted bridging carbon C1 (Figure 1c) and the phenyl ring helix originated from the asymmetrically substituted phenyl ring A1 (Figure 1d), can be abstracted from the inherently chiral calix[4]arene model (Figure 1a).
The nature of the sp2 hybrid orbital of phenyl carbon can theoretically impel each phenyl and its substituents to be almost located on one plane and their six pairs of exterior angles to be almost 120°, although their substituents can slightly destroy the tendency. For example, in a representative meta-substituted inherently chiral calix[4]arene (−)-1 [21], the dihedral angles and six pairs of exterior angles on phenyl ring A1 from its crystal data are shown in Table 1. Since a very large substituent (Br) exists on phenyl ring A1, these dihedral angles are indeed small and can be omitted, and these exterior angles are all approximately equal to 120°.

281
Figure 1. Structural analysis of inherently chiral calix[4]arene and representative inherently chiral calix[4]arene (−)-1. inherently chiral calix[4]arene model (a); macrocyclic skeleton helix (b); bridging carbon helix (c); phenyl ring helix (d); geometrical helix model of inherently chiral calix[4]arene model (e) and geometrical helix model of (−)-1 (f).
Table 1. The dihedral angles and six pairs of exterior angles on phenyl ring A1 of (−)-1.
Dihedral Angle (°) 1 f aC C C Br
1� � � = 4.2828 a bBr C C N
1� � � = 2.8760 b cN C C H
1� � � = −0.1161
4c dH C C C1
� � � = −6.3989 4 d eC C C O1
� � � = 6.7100 1e fO C C C1
� � � = −7.0711 Exterior Angle (°)
a bBrC C2 = 118.450 b aNC C2 = 122.317 c bHC C2 = 119.125a fBrC C2 = 119.182 b cNC C2 = 119.757 c dHC C2 = 119.096
4 d cC C C2 = 121.734 e dOC C2 = 118.688 1 f eC C C2 = 118.7034 d eC C C2 = 120.026 e fOC C2 = 118.095 1 f aC C C2 = 124.316
In a macrocyclic skeleton helix, four dummy atoms (D1, D2, D3 and D4) on four phenyl centers are used to replace four phenyls, respectively. Then, one geometrical helix model (Figure 1e) can be abstracted from the macrocyclic skeleton helix after successively connecting four dummy atoms and four bridging carbons. When the above-stated slight destruction of their substituents is ignored, the geometrical helix model should be equivalent to the macrocyclic skeleton helix. The geometrical helix model can be split into two parts along the dotted line of D1D3. Since the substitution pattern of all bridging carbons are same, the distances between each dummy atom and bridging carbon should normally be equal. When the relation of the angles exists as
1 1 2 1 4 4D C D D C D2 �2 , 1 2 2 4 4 3C D C C D C2 �2 and 2 2 3 4 3 3D C D D C D2 �2 , the geometrical

282
helices on the two parts will be canceled. For example, in (−)-1, the distances between dummy atoms and bridging carbons and three pairs of angles in the geometrical helix model (Figure 1f) based on its crystal data are shown in Table 2. It is obvious that these distances are indeed approximately equal, and these slight differences between three pairs of angles can indeed be ignored. Therefore, the geometrical helices on its two parts can be canceled, and the whole macrocyclic skeleton helix in (−)-1 can be omitted.
Table 2. The distances between dummy atoms and bridging carbons and three pairs of angles in the geometrical helix model of (−)-1.
Distance (Å)
1 1C Dd = 2.9240 4 1C D
d = 2.9161 1 2C Dd = 2.9212 4 4C D
d = 2.9209
2 2C Dd = 2.9308 3 4C D
d = 2.9385 2 3C Dd = 2.9094 3 3C D
d = 2.9144
Angle (°) 1 1 2D C D2 = 104.257 1 2 2C D C2 = 121.606 2 2 3D C D2 = 102.747 1 4 4D C D2 = 108.995 4 4 3C D C2 = 121.172 4 3 3D C D2 = 102.767
Four substituents (one equatorial hydrogen (He), one axial hydrogen (Ha) and aromatic rings A1 and A2) exist on bridging carbon C1. He and Ha differentiate each other due to their outer electronic shielding effect from two adjacent aromatic rings. In all kinds of inherently chiral calix[4]arenes, the length difference between bond C1–He and C1–Ha, the angle difference between 1 1
eH C A2 and 1 1
aH C A2 and the angle difference between 1 2eH C A2 and 1 2
aH C A2 are commonly slight and can almost be ignored. For example, in (−)-1, the corresponding bond length and angle from its crystal data are as follows: 1
eC Hb = 0.9904 Å, 1
aC Hb = 0.9909 Å, 1 f
eH C C2 = 109.7822°, 1 f
aH C C2 = 109.8750°, 1 geH C C2 = 109.8749° and 1 g
aH C C2 = 109.8069°. These slight differences of bond length and angle about He and Ha can indeed be ignored. Moreover, until now, the hydrogen polarizability difference originated from different outer electronic environments is still not experimentally or theoretically determined. Here, to simplify the calculation, the above differences of He and Ha were tentatively ignored. Then, bridging carbon C1 (Figure 1a) can be treated as an achiral one. The geometrical helix and physical helix on bridging carbon C1 can be omitted.
In the phenyl ring helix in Figure 1d, when the above-stated slight destruction of their substituents is ignored, phenyl ring A1 and its six substituents can be almost treated as coplanar. Then, the geometrical helix on phenyl ring A1 can be omitted, and only its physical helix needs be considered. Therefore, after the omission of the macrocyclic skeleton helix, bridging carbon helices and geometrical helices on four phenyl rings, only physical helices on four phenyl rings need be considered for the helical character analysis of inherently chiral calix[4]arenes.
Since all aromatic rings are asymmetric and the architectures on two sides of each aromatic ring plane are different, then inherently chiral calix[4]arenes can theoretically be regarded as a type of complex planar chiral molecule (Figure 2b). Referring to the helical character analysis for planar chirality [29], the helices of representative aromatic ring A1 in Figure 2b (the dashed line denotes the remainder of calix[4]arene) can be resolved into six microhelices, X–a–b–Y, Y–b–c–Z, Z–c–d–

283
C4, C4–d–e–O, O–e–f–C1 and C1–f–a–X, respectively. Here, the microhelical electronic energy of microhelix X–a–b–Y was representatively analyzed.
Figure 2. Helical character analysis of microhelix X–a–b–Y in inherently chiral calix[4]arene. inherently chiral calix[4]arene model (a); complex planar chiral model of aromatic ring A1 (b); helical character analysis of aromatic ring A1 (c); different electron movement of bond Xa, ab and bY (d); electron movement of bond bY relative to xy plane when αX < αY (e); electron movement of bond bY relative to xy plane when αX > αY (f); right-handed cylindrical microhelix model when αX < αY (g) and left-handed cylindrical microhelix model when αX > αY (h).
2.1. Microhelical Model
The calix[4]arene cavity is comprised of four aromatic rings and has a high electronic density. Each aromatic ring has a tendency to move away from the cavity to weaken their electrostatic repulsion. As a result, each aromatic ring is essentially equal to being placed in a dissymmetrical electric field. Therefore, the electrons on bonds Xa, ab and bY of microhelix X–a–b–Y should move away from their atomic nuclei, and the corresponding induced dipoles would come into being in a dissymmetrical electric field.
Now, a Cartesian coordinate was introduced to analyze the electron movement of bond bY, in which the coordinate axis parallel to bond bY is set as the x-axis, the plane of aromatic ring A1 is set as the xy plane and the coordinate axis perpendicular to the xy plane is set as the z-axis (Figure 2c). In the orientation parallel to the x-axis, since the permanent bonding force between b and Y is known to be far greater than the normal induced dipole force, the electron movement of bond bY

284
parallel to the x-axis can be omitted [32]. Moreover, in the orientation parallel to the y-axis, since there is two permanent electrostatic repulsions from atom X and Z, the electron movement of bond bY parallel to the y-axis can also be omitted. Therefore, only the electron movement of bond bY parallel to the z-axis needs to be considered. Analogously, only the electron movement of bond Xa and ab parallel to the z-axis need to be considered.
According to the polarizability difference of atom X, a, b and Y, the electron movement of bond Xa, ab and bY can be illustrated in Figure 2d, in which electron movement distance is proportional to the length of the arrowed line. If the electron-distorted bonds can be approximately considered as linear and the plane composed of bond Xa and ab (red bold line) is selected as the x'y' plane, the electron movement of bond bY (blue plain line) relative to the x'y' plane can be illustrated in Figure 2e,f. When the polarizability sequence is αX < αY, a right-handed cylindrical microhelix model [28,33] can be abstracted in Figure 2g. When the polarizability sequence is αX > αY, a left-handed cylindrical one can be abstracted in Figure 2h.
2.2. Microhelical Radius
If the directly connected substituents on all aromatic rings of inherently chiral calix[4]arene are different, the length of all aromatic bonds and their directly connected bonds should be different. In order to facilitate the calculation of the microhelix radius, one approximation was tentatively made that the length of all aromatic bonds and their directly connected bonds is equal to the average length of all aromatic bonds.
In Figure 2e,f, segment bU is the projection of bond bY in the x'y' plane, the point, o, is the intersection point of the extension lines of Xa and bU. Then, based on the approximation, the relative relations of bond length on microhelix X–a–b–Y in Figure 2e,f can be drawn as:
Xa ab bY oa ob B� � � � � (28)
here, B is a constant, denoting the average length of all aromatic bonds. The nature of the sp2 hybrid orbital of phenyl carbon can theoretically impel each phenyl and its
substituents to be almost located on one plane and their six pairs of exterior angles to be almost 120°, which has been proven by a representative meta-substituted inherently chiral calix[4]arene (−)-1. Then, the relative relations of angle on microhelix X–a–b–Y can be drawn as:
o60oab abo aob XoU2 �2 �2 �2 � (2)
Moreover, in order to facilitate the calculation of the height difference (h) between atom X and Y on the cylindrical microhelix, one hypothesis was artificially brought forward that the electric fields parallel to the z-axis (DZ) acting on all aromatic rings and their directly connected substituents are equal when the conformation of inherently chiral calix[4]arene becomes stable. Then, the distance (d) from the negative charge to the positive charge in the induced dipole moment (P) can be calculated as:
ZP = αD qd� ; zDd α
q� (3)

285
where α is atomic polarizability and q is the induced charge. Normally, the bonds between all aromatic rings and their directly connected substituents are the σ bond, in which there are two bonding electrons, one from a substituent and the other from an aromatic carbon. So q can be treated as a constant for all microhelices on aromatic rings.
Then, the height difference (h) between atom X and Y on microhelix X–a–b–Y can be derived as:
zX Y X Y
Dh = d d =q
� �� � (4)
The length of segment bU and XU can be derived as:
3 422 22 2 2 22z
X YDbU bY h B h Bq
� �� � � � � � �
3 4 3 4 3 4 3 43 4 3 4 3 4 3 4
2 2
2 2
2 cos
2 cos
XU oX oU oX oU XoU
oa aX ob bU oa aX ob bU XoU
� � � 2
� � � � � � � 2
(5)
From Expressions (1), (2) and (5), the length of segment XU can be calculated as: 2
2224 z
X YDXU Bq
� �� � � (6)
From sine theorem, the radius (r) of microhelix X–a–b–Y can be calculated from:
2sin
XUrXoU
�2 (7)
From Expressions (2) and (6), the microhelical radius can be derived as:
222
2
4 3 3
zX Y
Dr Bq
� �� � � (8)
2.3. Microhelical Electronic Energy
The states and eigenvalues of an electron constrained to move on a helix were successfully solved on the basis of the electron-on-a-helix model by Tinoco and Woody [34]. The calculation formula of helical electronic energy (E) of a microhelix with an electron of mass m constrained on a k-turn helix with a radius, r, and a pitch, 2πw, was deduced as follows:
2 2
2 2 , 1,2,3,...8 ( )
nE nmk r w
� ��
2 2nn (9)
where ħ is the reduced Planck constant and n is the quantum number of the transition [31,34]. Apparently, the helical electronic energy (E) of microhelix X–a–b–Y can theoretically be calculated with the formula.
Since microhelix X–a–b–Y is essentially a physical helix and bond Xa, ab and bY are σ bonds, it can be deduced that its pitch should be far less than its radius. Then, for this microhelix, the above calculation formula can be simplified as:

286
2 2
2 , 1,2,3,...8
nE nmkr
5 �2 2nn
(10)
Then, the reciprocal of electronic energy (E) of microhelix X–a–b–Y can be deduced from Expression (8) as:
222
2 2 2
222
2 2 2 2 2
1 8 4 3 3
832 3 3
zX Y
zX Y
Dmk BE n q
mkDmkBn n q
� �
� �
! "� � �# $
% &
� � �
2 22 2n # BB% 33
2 2 2 2 22 2 232 2 Xn n q3�X� �
(11)
Since the interior structure and exterior environment of all microhelices on aromatic rings of inherently chiral calix[4]arene are similar, the variable k, n, m and q should be the same to them. Moreover, based on the above approximation and hypothesis, the variables, B and DZ are also the same to them. Then, it can be supposed that:
2
2 2
323
mkBHn
� 2 2n ; 2
2 2 2
83
zmkDKn q
� 2 2 2n q ; X Y� � �0 � � (12)
where H and K are constant and greater than zero for all microhelices on aromatic rings of inherently chiral calix[4]arene. Then, Expression (8) can be transformed into:
21 H KE
�� � 0 (13)
Essentially, the electronic energy of the electron in a helix is the same whether the helix is right- or left-handed. However, similar to other energy concepts, such as potential energy, the sign of the electronic energy can be artificially stipulated based on a selected reference point. Therefore, in order to distinguish left-handed and right-handed microhelices, we stipulate that Expression (13) is only suitable for a right-handed microhelix and should be changed into Expression (14) when the microhelix is left-handed, as follows:
21 H KE
�� � � 0 (14)
Actually, the above two expressions can be united into:
3 421 H KE
/ �� � 0 (15)
where 1/ � for the right-handed microhelix and 1/ � � for the left-handed microhelix. By the way, two concepts, “helical character” and “helical electronic energy”, should be
tentatively discussed. Wang noted that “in the context of this helix theory, the terms, that is, the helical character and the local energy of electrons of a helix, are equivalent” [30]. From Expression (15) and the illustration in Figure 2, it is obvious that our comprehensive “helical character” comprises helical radius, pitch and orientation, the mass and quantity of electrons constrained on the helix, “helical electronic energy”, exterior electric field acting on the helix, and so on. Therefore, here, the “helical electronic energy” is a connotation of “helical character”, which is slightly different from those proposed by Wang.

287
There are two rules presented by Wang that “a molecular helix’s helical character (local electronic energy) increases as its length, which usually correlates to its ring size, decreases (Rule I); and, at a fixed helix length, increases as its radius, which correlates to the relevant groups’ polarizability distinctions that result in the bonds’ helical deformations, decreases (Rule II)” [30]. Expression (15) intuitively and clearly shows the impact of helical substituent polarizability distinction on helical electronic energy in inherently chiral calix[4]arenes, which is actually accordant with Rule II.
Since the above deduction is suitable for all microhelices on aromatic rings of inherently chiral calix[4]arene, Expression (15) can be universally used to qualitatively calculate their microhelical electronic energy. Therefore, if the sum of the reciprocal of the helical electronic energy of inherently chiral calix[4]arene is less than zero, it can be assigned as a right-handed helix and dextrorotatory, and vice versa [35,36]. Based on Expression (15), we can effectively deduce the signs of the helical electronic energy of inherently chiral calix[4]arenes and assign their absolute configurations with the limited polarizability data and sequences of atoms directly attached to their microhelices.
Although a variety of inherently chiral calix[4]arenes were synthesized until now, there are only enumerable entities whose absolute configurations and optical rotation signs have been ascertained. Here, the scientificity of the qualitative calculation of helical electronic energy based on Expression (15) can be verified with inherently chiral calix[4]arene (−)-1 [21], (−)-2 [21], (−)-3 [22], (+)-4 [26], (+)-5 [23], (−)-6 [12], (+)-7a and (+)-7b [24] and (+)-8 [25] (Figure 3). Prior to the qualitative calculation of their helical electronic energy, the polarizability of their bridging carbons should be differentiated. Each bridging carbon is connected with one equatorial hydrogen (He), one axial hydrogen (Ha) and two different aromatic rings. The difference of He and Ha can be also ignored as stated above. Then, the bridging carbon polarizability should be decided by the electrification of the two remaining aromatic rings.
In (−)-1, its atom polarizability sequence on the meta-substituted aromatic ring is 1 2 2in NHBr N HC C
� � � � �6 5 6 6 and 3 4 3 41 2in NH(3.013) (0.387) (1.061) (0.964)Br H NC� � � �� 6 �
[37]. Then, without consideration of microhelices canceled by each other, the reciprocal of its helical electronic energy can be deduced from microhelices C1–Br, Br–N, N–H and C2–H (here, the microhelix is simply illustrated with one dashed line and two atomic labels on its two ends) as:
1 22 2
1 12 2
1 12 2
2 2 2 2in NH in NH
2 2 2 2in NH in NH
in NH in NH
1 [( ) ( ) ( ) ( ) ]
[( ) ( ) ( ) ( ) ]
2 ( )( ) 0
Br Br N N H HC C
Br Br N N H HC C
N N Br HC C
KE
K
K
� � � � � � � �
� � � � � � � �
� � � � � �
� � � � � � � � �
5 � � � � � � � �
� � � � � � 6 (16)
Therefore, it should be a left-handed helix and levorotatory.

288
Figure 3. Inherently chiral calix[4]arenes, whose absolute configuration and optical rotation sign have been ascertained.
In (+)-2, its atom polarizability sequence on the meta-substituted aromatic ring is 1 22 2in NO in NHN N HC C
� � � � �6 5 6 6 and 3 4 3 412 2in NO in NH(1.090) (0.387) (1.061) (0.964)N H NC� � � �� � �
[37]. Then, without consideration of microhelices canceled by each other, the reciprocal of its helical electronic energy can be deduced from microhelices C1–N1, N1–N2, N2–H and C2–H as:
2
1 1 1 2 2 2
1 12 2 2 2
1 1 2 2in NH
2 2 2 2
2 2 2 2in NO in NO in NH in NH
in NH in NO
1 [( ) ( ) ( ) ( ) ]
[( ) ( ) ( ) ( ) ]
2 ( )( ) 0N
H HN C N N N C
N N N N H HC C
N N HC C
KE
K
K �
� � � � � � � �
� � � � � � � �
� � � � �
� � � � � � � � �
5 � � � � � � � �
� � � � � � �
(17)
Therefore, it should be a right-handed helix and dextrorotatory. In (−)-3, its atom polarizability sequence on the meta-substituted aromatic ring is
1 2in N=CN HC C� � � �6 5 6 [37]. Then, without consideration of microhelices canceled by each other,
the reciprocal of its helical electronic energy can be deduced from microhelices C1–N, N–H and C2–H as:
1 2
1 1
1 1
2 2 2
2 2 2
1 [( ) ( ) ( ) ]
[( ) ( ) ( ) ]
2 ( )( ) 0
N in N C N in N C H HC C
N in N C N in N C H HC C
H N in N CC C
KE
K
K
� � � � � �
� � � � � �
� � � �
� �
� �
�
� � � � � � �
5 � � � � � �
� � � � 6
(18)
Therefore, it should be a left-handed helix and levorotatory.

289
In (+)-4, its atom polarizability sequence on the meta-substituted aromatic ring is 1 2 3in Ar in CMeC C HC C
� � � � �6 5 7 6 (here, Ar denotes 2,4,6-trihydroxyphenyl) and
3 4 3 41 3in Ar in CMe(1.352) (0.387) (1.061) (1.061)C H CC� � � �� � � [37]. Then, without consideration of
microhelices canceled by each other, the reciprocal of its helical electronic energy can be deduced from microhelices C1–C4, C4–C3, C3–H and C2–H as:
4 1 4 3 3 2
1 13 3
1 13 3
2 2 2 2
2 2 2 2in CMe in CMe
in CMe in CMe
1 [( ) ( ) ( ) ( ) ]
[( ) ( ) ( ) ( ) ]
2 ( )( ) 0
H HC C C C C C
C in Ar C in Ar C C H HC C
C C C in Ar HC C
KE
K
K
� � � � � � � �
� � � � � � � �
� � � � � �
� � � � � � � � �
5 � � � � � � � �
� � � � � � � (19)
Therefore, it should be a right-handed helix and dextrorotatory. In (+)-5, since the electron-withdrawing capability is Br H6 and 3 2( ) OHOCH CH 6 , the
phenyl polarizability should be 4 3 2 1A A A A� � � �666 5 and the bridging carbon polarizability should
be 3 2 4 1C C C C� � � �666 5 (because the polarizability is electron-rich groups > electron-poor
analogues) [29]. Moreover, since the bond polarizability is O – H O C–6 [37], the oxygen polarizability should be 1 2 4 3>
O O O O� � � �5 5 . Then, besides those symmetrical microhelices,
microhelices C2–O2 and C4–O1 and microhelices C1–O2 and C1–O1 can also be canceled by each other. Without consideration of microhelices canceled by each other, the reciprocal of its helical electronic energy can be deduced from microhelices C3–O3, C2–O3, C3–O4 and C4–O4 as:
3 3 2 3 3 4 4 4
3 3 2 3 3 4 2 4
3 2 4 3
2 2 2 2
2 2 2 2
1 [( ) ( ) ( ) ( ) ]
[( ) ( ) ( ) ( ) ]
2 ( )( ) 0
C O C O C O C O
C O C O C O C O
C C O O
KE
K a
K
� � � � � � � �
� � � � � � �
� � � �
�� � � � � � � �
5 � � � � � � � �
�� � � � (20)
Therefore, it should be a right-handed helix and dextrorotatory. In (−)-6, since the electron-withdrawing capability is Br H66 and
4 2 3 12O Pr O CH COOH O H O H5 6 5 , the phenyl polarizability should be 3 4 2 1A A A A
� � � �666 5 and the bridging carbon polarizability should be 3 2 4 1C CC C � �� � 665 5 . Moreover, since the polarizability sequences are O – H O C–6 and carbonyl carbon alkyl carbon� �6 [37], the oxygen polarizability is 3 1 2 4O O O O
� � � �5 6 6 . Then, besides those symmetrical microhelices, microhelices C1–O1 and
C4–O1 and microhelices C2–O3 and C3–O3 can also be canceled by each other. Without consideration of microhelices canceled by each other, the reciprocal of its helical electronic energy can be deduced from microhelices C2–O2, C1–O2, C4–O4 and C3–O4 as:
2 2 1 2 4 4 3 4
3 2 1 2 1 4 3 4
1 3 2 4
2 2 2 2
2 2 2 2
1 [( ) ( ) ( ) ( ) ]
[( ) ( ) ( ) ( ) ]
2 ( )( ) 0
C O C O C O C O
C O C O C O C O
C C O O
KE
K
K
� � � � � � � �
� � � � � � � �
� � � �
�� � � � � � � �
5 � � � � � � � �
�� � � 6 (21)
Therefore, it should be a left-handed helix and levorotatory. In (+)-7a and (+)-7b, since the electron-withdrawing capability is
4 2 1 32O CH COOH O Pr O Pr O H7 5 6 (for (+)-7a) and 4 2 1 3
2 3O CH COOCH O Pr O Pr O H7 5 6 (for (+)-7b), their phenyl polarizability should be 3 2 1 4A A A A
� � � �6 5 7 and the bridging carbon

290
polarizability should be 3 2 1 4C CC C � �� �7 6 7 . Moreover, since the polarizability sequences are
O – H O C–6 and carbonyl carbon alkyl carbon� �6 [37], the oxygen polarizability is 3 4 2 1O O O O� � � �6 6 5 .
Then, besides those symmetrical microhelices, microhelices C1–O2 and C1–O1 can also be canceled by each other. Without consideration of microhelices canceled by each other, the reciprocal of their helical electronic energy can all be deduced from microhelices C2–O3, C2–O2, C3–O4, C3–O3, C4–O1 and C4–O4 as:
2 2 3 3 4 4 2 3 3 4 4 1
2 1 2 2 3 3 4 4 2 3 3 4 4 1
2 2 2 2 2 2
2 2
1 [( ) ( ) ( ) ( ) ( ) ( ) ]
( 2 2 2 2 2 2 )
C O C O C O C O C O C O
O O C O C O C O C O C O C O
KE
K
� � � � � � � � � � � �
� � � � � � � � � � � � � �
�� � � � � � � � � � � �
� � � � � � � � � (22)
Since 3 2C C� �7 and 2 1O O� �5 , then:
2 2 4 4 2 4 4 2 2 4 4 2
1 ( 2 2 2 2 ) 2 ( )( ) 0C O C O C O C O C C O O
K KE
� � � � � � � � � � � �5 � � � � � � � � � � (23)
Therefore, they should be right-handed helices and dextrorotatory. In (+)-8, since the electron-withdrawing capability is 1 2 3 4
2 2O CH Ph O CH Ph O H O H5 6 5 [29], the phenyl polarizability should be 3 4 1 2A A A A
� � � �5 6 5 and the bridging carbon
polarizability should be 3 2 4 1C C C C� � � �6 5 6 . Moreover, since the group polarizabilities are
O – H O C–6 , the oxygen polarizability should be 3 4 1 2O O O O� � � �5 6 5 . Then, besides those
symmetrical microhelices, microhelices C3–O3 and C3–O4, microhelices C2–O3 and C4–O4 and microhelices C2–H (on aromatic ring A3) and C4–H (on aromatic ring A4) can also be canceled by each other. Without consideration of microhelices canceled by each other, the reciprocal of its helical electronic energy can be deduced from microhelices C2–H, C2–O2, C1–O2 and C1–H on aromatic ring A2 and C1–H, C1–O1, C4–O1 and C4–H on aromatic ring A1 as:
2 2 2 1 2 1 1 1 4 4 1 4
2 2 2 1 2 1
2 1 2
2 2 2 2 2 2 2 2
2 2 2 2
1 [ ( ) ( ) ( ) ( ) ( ) ( ) ( ) ( ) ]
2 [ ( ) ( ) ( ) ( ) ]
4 ( )( ) 0
H H H HC C O C O C C C O C O C
H HC C O C O C
HC C O
KE
K
K
� � � � � � � � � � � � � � � �
� � � � � � � �
� � � �
� � � � � � � � � � � � � � � � � �
5� � � � � � � � �
� � � � 6
(24)
Therefore, it should be a left-handed helix and levorotatory. It should be mentioned that geometrical helices, resulting from an intermolecular or
intramolecular non-bonded interaction in a high concentration and polar solvents, are not taken into consideration in the above analysis and calculation from Expression (15). Therefore, the calculated results only can be compared with those measured in low concentration and non-polar solvents. It is very surprising and satisfying that all of optical rotations from the above analysis are consistent with the actual facts, except (+)-8. Therefore, from the above case analysis, the qualitative analysis of the helical electronic energy of inherently chiral calix[4]arenes with Expression (15) is almost entirely proven as scientific and can be used to effectively assign their absolute configurations.
Due to structural similarity, Expression (15) can be popularized to assign the absolute configurations of other inherently chiral calix[n]arenes (n = 5, 6, 8) and other inherently chiral concave molecules. However, it must be admitted that this expression is only a qualitative analysis tool for the helical electronic energy of inherently chiral calix[4]arenes. The above approximation

291
and hypothesis in its deduction need to be further verified, and the variables, m, q and DZ, need to be quantified with theoretic deduction and experimental data. Moreover, the exception from (+)-8 may be satisfactorily interpreted in an upcoming quantificational expression. Therefore, the relevant verification and variable quantification will be explored in our subsequent works.
3. Conclusions
In summary, inherently chiral calix[4]arenes can be theoretically regarded as a type of complex planar chiral molecule when bridging carbons are treated as achiral and each phenyl ring and its six substituents are treated as coplanar. Based on one approximation and one hypothesis, we derive Expression (15) to qualitatively analyze microhelical electronic energy. Its scientificity and effectivity in absolute configuration assignments of inherently chiral calix[4]arenes were almost entirely confirmed with all of the entities, whose absolute configurations and optical rotation signs have been ascertained.
Acknowledgments
We thank the National Natural Science Foundation of China (Nos. 21272173 and 21272292) for financial support. Special thanks go to David Zhigang Wang at the Shenzhen Graduate School of Peking University, whose instructive advice made it possible to complete this work.
Author Contributions
Theoretic deduction: Jing Zhou, Jing-Wei Fu, Qing-Wei Zhang, Shao-Yong Li, Wei Qiao and Jun-Min Liu; Wrote the paper: Shuang Zheng, Ming-Liang Chang and Shao-Yong Li.
Conflicts of Interest
The authors declare no conflict of interest.
References
1. Li, S.Y.; Xu, Y.W.; Liu, J.M.; Su, C.Y. Inherently chiral calixarenes: Synthesis, optical resolution, chiral recognition and asymmetric catalysis. Int. J. Mol. Sci. 2011, 12, 429–455.
2. Luo, J.; Zheng, Q.; Chen, C.; Huang, Z. Progress in inherently chiral calixarenes. Prog. Chem. 2006, 18, 897–906.
3. Böhmer, V.; Kraft, D.; Tabatabai, M. Inherently chiral calixarenes. J. Incl. Phenom. Mol. Recognit. Chem. 1994, 19, 17–39.
4. Szumna, A. Inherently chiral concave molecules—Rrom synthesis to applications. Chem. Soc. Rev. 2010, 39, 4274–4285.
5. Cort, A.D.; Mandolini, L.; Pasquini, C.; Schiaffino, L. “Inherent chirality” and curvature. New J. Chem. 2004, 28, 1198–1199.
6. Zheng, Y.S.; Luo, J. Inherently chiral calixarenes: A decade’s review. J. Incl. Phenom. Macrocycl. Chem. 2011, 71, 35–56.

292
7. No, K.H.; Gutsche, C.D. Calixarenes 8: Short, stepwise synthesis of p-phenylcalix[4]arene, p-phenyl-p-tert-butylcalix[4]arene, and derived products. J. Org. Chem. 1982, 47, 2713–2719.
8. Jin, T.; Monde, K. Synthesis and optical resolution of a fluorescent chiral calix[4]arene with two pyrene moieties forming an intramolecular excimer. Chem. Commun. 1998, 1357–1358.
9. Luo, J.; Zheng, Q.Y.; Chen, C.F.; Huang, Z.T. Facile synthesis and optical resolution of inherently chiral fluorescent calix[4]crowns: Enantioselective recognition towards chiral leucinol. Tetrahedron 2005, 61, 8517–8528.
10. Shirakawa, S.; Moriyama, A.; Shimizu, S. Design of a novel inherently chiral calix[4]arene for chiral molecular recognition. Org. Lett. 2007, 9, 3117–3119.
11. Shirakawa, S.; Moriyama, A.; Shimizu, S. Synthesis, optical resolution and enantiomeric recognition ability of novel, inherently chiral calix[4]arenes: Trial application to asymmetric reactions as organocatalysts. Eur. J. Org. Chem. 2008, 5957–5964.
12. Kliachyna, M.A.; Yesypenko, O.A.; Pirozhenko, V.V.; Shishkina, S.V.; Shishkin, O.V.; Boyko, V.I.; Kalchenko, V.I. Synthesis, optical resolution and absolute configuration of inherently chiral calixarene carboxylic acids. Tetrahedron 2009, 65, 7085–7091.
13. Xia, Y.X.; Zhou, H.H.; Shi, J.; Li, S.Z.; Zhang, M.; Luo, J.; Xiang, G.Y. An inherently chiral calix[4]crown carboxylic acid in the 1,2-alternate conformation. J. Incl. Phenom. Macrocycl. Chem. 2012, 74, 277–284.
14. Shi, J.; Li, S.Z.; Xia, Y.X.; Wang, X.G.; Luo, J.; Wan, Q. An inherently chiral calix[4]crown carboxylic acid in the partial cone conformation. J. Incl. Phenom. Macrocycl. Chem. 2013, 77, 327–335.
15. Dieleman, C.; Steyer, S.; Jeunesse, C.; Matt, D. Diphosphines based on an inherently chiral calix[4]arene scaffold: Synthesis and use in enantioselective catalysis. J. Chem. Soc. Dalton Trans. 2001, 17, 2508–2517.
16. Xu, Z.X.; Li, G.K.; Chen, C.F.; Huang, Z.T. Inherently chiral calix[4]arene-based bifunctional organocatalysts for enantioselective aldol reactions. Tetrahedron 2008, 64, 8668–8675.
17. Miao, R.; Xu, Z.X.; Huang, Z.T.; Chen, C.F. Enantiopure inherently chiral calix[4]arene derivatives containing quinolin-2-yl-methanol moiety: Synthesis and application in the catalytic asymmetric addition of diethylzinc to benzaldehyde. Sci. China B Chem. 2009, 52, 505–512.
18. Shirakawa, S.; Kimura, T.; Murata, S.; Shimizu, S. Synthesis and resolution of a multifunctional inherently chiral calix[4]arene with an ABCD substitution pattern at the wide rim: The effect of a multifunctional structure in the organocatalyst on enantioselectivity in asymmetric reactions. J. Org. Chem. 2009, 74, 1288–1296.
19. Shirakawa, S.; Shimizu, S. Synthesis of an inherently chiral calix[4]arene amino acid and its derivatives: Their application to asymmetric reactions as organocatalysts. Eur. J. Org. Chem. 2009, 1916–1924.
20. Shirakawa, S.; Shimizu, S. Improved design of inherently chiral calix[4]arenes as organocatalysts. New J. Chem. 2010, 34, 1217–1222.
21. Xu, Z.X.; Zhang, C.; Zheng, Q.Y.; Chen, C.F.; Huang, Z.T. A new approach to enantiopure inherently chiral calix[4]arenes: Determination of their absolute configurations. Org. Lett. 2007, 9, 4447–4450.

293
22. Xu, Z.X.; Huang, Z.T.; Chen, C.F. Synthesis and structures of novel enantiopure inherently chiral calix[4]arene-derived salphen ligands and their transition-metal complexes. Tetrahedron Lett. 2009, 50, 5430–5433.
23. Yakovenko, A.V.; Boyko, V.I.; Danylyuk, O.; Suwinska, K.; Lipkowski, J.; Kalchenko, V.I. Diastereoselective lower rim (1S)-camphorsulfonylation as the shortest way to the inherently chiral calix[4]arene. Org. Lett. 2007, 9, 1183–1185.
24. Karpus, A.O.; Yesypenko, O.A.; Andronov, L.P.; Boyko, V.I.; Garasevich, S.G.; Voitenko, Z.V.; Chernega, A.N.; Kalchenko, V.I. Stereoselective synthesis of enantiomerically pure inherently chiral p-tert-butylcalix[4]arene carboxylic acids. Tetrahedron Asymmetry 2012, 23, 1243–1250.
25. Narumi, F.; Hattori, T.; Yamabuki, W.; Kabutoc, C.; Kameyama, H. Resolution of inherently chiral anti-O,O'-dialkylated calix[4]arenes and determination of their absolute stereochemistries by CD and X-ray methods. Tetrahedron Asymmetry 2005, 16, 793–800.
26. Talotta, C.; Gaeta, C.; Troisi, F.; Monaco, G.; Zanasi, R.; Mazzeo, G.; Rosini, C.; Neri, P. Absolute configuration assignment of inherently chiral calix[4]arenes using DFT calculations of chiroptical properties. Org. Lett. 2010, 12, 2912–2915.
27. Eliel, E.L.; Wilen, S.H.; Mander, L.N. Stereochemistry of Organic Compounds; Wiley: New York, NY, USA, 1994; pp. 126–144.
28. Wang, D.Z. A helix theory for molecular chirality and chiral interaction. Mendeleev Commun. 2004, 14, 244–247.
29. Wang, D.Z. Conservation of helical asymmetry in chiral interactions. Tetrahedron 2005, 61, 7125–7133.
30. Wang, D.Z. Catalyst-substrate helical character matching determines enantiomeric excess. Tetrahedron 2005, 61, 7134–7143.
31. Wang, D.Z. Conservation of helicity and helical character matching in chiral interactions. Chirality 2005, 17, S177–S182.
32. Stone, A.J. The Theory of Intermolecular Forces; Oxford University Press: Oxford, UK, 1996. 33. Yin, Y. Helix structure and opticity activity. Hua Xue Tong Bao 1993, 10, 1–9. 34. Tinoco, I., Jr.; Woody, R.W. Optical rotation of oriented helices IV: A free electron on a helix.
J. Chem. Phys. 1964, 40, 160–165. 35. Brewster, J.H. Helix models for optical activity. Top. Steroechem. 1967, 2, 1–72. 36. Caldwell, D.J.; Eyring, H. The Theory of Optical Activity; John Wiley & Sons: New York, NY,
USA, 1971. 37. Miller, K.J. Additivity methods in molecular polarizability. J. Am. Chem. Soc. 1990, 112,
8533–8542.

294
Elucidating Polypharmacological Mechanisms of Polyphenols
by Gene Module Profile Analysis
Bin Li, Min Xiong and Hong-Yu Zhang
Abstract: Due to the diverse medicinal effects, polyphenols are among the most intensively studied natural products. However, it is a great challenge to elucidate the polypharmacological mechanisms of polyphenols. To address this challenge, we establish a method for identifying multiple targets of chemical agents through analyzing the module profiles of gene expression upon chemical treatments. By using FABIA algorithm, we have performed a biclustering analysis of gene expression profiles derived from Connectivity Map (cMap), and clustered the profiles into 49 gene modules. This allowed us to define a 49 dimensional binary vector to characterize the gene module profiles, by which we can compare the expression profiles for each pair of chemical agents with Tanimoto coefficient. For the agent pairs with similar gene expression profiles, we can predict the target of one agent from the other. Drug target enrichment analysis indicated that this method is efficient to predict the multiple targets of chemical agents. By using this method, we identify 148 targets for 20 polyphenols derived from cMap. A large part of the targets are validated by experimental observations. The results show that the medicinal effects of polyphenols are far beyond their well-known antioxidant activities. This method is also applicable to dissect the polypharmacology of other natural products.
Reprinted from Int. J. Mol. Sci. Cite as: Li, B.; Xiong, M.; Zhang, H.-Y. Elucidating Polypharmacological Mechanisms of Polyphenols by Gene Module Profile Analysis. Int. J. Mol. Sci. 2014, 15, 11245-11254.
1. Introduction
Since reactive oxygen species (ROS), e.g., superoxide radical, hydrogen peroxide, and hydroxyl radical, are involved in the pathogenesis of many diseases, such as cancer, neurodegenerative diseases and atherosclerosis [1], antioxidants in particular polyphenolic antioxidants, have been widely expected to exert prophylactic or therapeutic effects on these diseases [2–5]. However, a large number of researches indicated that the strong in vitro antioxidant activities of polyphenols can not be translated into in vivo therapeutic effects [5–9]. This antioxidant paradox was primarily explained by the poor bioavailability of exogenous polyphenols [10]. Our analysis about the biological roles of polyphenols revealed that they were evolved for filtering UV light rather than scavenging intense ROS, which provided an evolutionary explanation to the weak in vivo radical-scavenging potential of polyphenols [11]. The evolutionary consideration also suggested that natural polyphenols have evolved an excellent scaffold with well-balanced rigidity and flexibility to adapt to different structures of enzymes in the biosynthetic pipeline, which enables the compounds to bind various proteins [12]. This finding implies that natural polyphenols have inherent potential to exert polypharmacological effects other than redox modulation [13]. However, how to elucidate the polypharmacological mechanisms of natural polyphenols is a great challenge,

295
because the conventional methods to dissect drug mode of action (MoA) are laborious and low throughput [14].
Recently, gene expression-based analysis showed great potential in identifying drug targets [15–17]. But the existent methods for gene expression profile analysis normally use limited signature genes (usually corresponding to ~500 probes out of 22,000+), which lose valuable information. In addition, these methods are efficient to reveal a single MoA or target for a certain drug, rather than its polypharmacological mechanisms [16]. Since gene expression signatures related to different biological activities cluster into different modules [18], we speculate that the polypharmacological mechanisms of polyphenols may be better dissected in terms of module profiles of gene expression.
In a previous analysis about connectivity map (cMap), which contains 7056 expression profiles of 5 different human cell lines treated with 1309 agents (including 20 polyphenols), we generated 49 gene modules by using biclustering approach FABIA (factor analysis for bicluster acquisition) [19]. Through analyzing the biological functions of the modules, we revealed that some polyphenols exert polypharmacological effects through activating transcription factors, such as estrogen receptors, nuclear factor (erythroid-derived 2)-like 2, and peroxisome proliferator-activated receptor gamma. In this study, we first establish a gene module-based target identification method and then use this method to further elucidate the polypharmacological mechanisms for the 20 polyphenols.
2. Results and Discussion
In a prior research, the cMap-derived 1309 agents and expression profiles have been grouped into 49 gene modules by FABIA algorithm [19], which consist of 5921 probes, much greater than those used in the conventional microarray analysis [15,16]. Thus, each chemical agent in cMap has a gene module profile, which is defined by a 49 dimensional binary vector, with 1 or 0 representing the presence or not of the module (Table S1). This allows us to calculate Tanimoto coefficient for each pair of the compounds to characterize the similarity of their gene expression profiles. The bigger the Tanimoto coefficient is, the more similar biological effects of the compound pairs are expected. For the compound pairs with similar gene module profiles, if one has the MoA and/or target information, we can predict the medicinal behaviors of the other. A total of 856,086 pairwise Tanimoto coefficients were calculated for the 1309 compounds in the cMap dataset (Table S2). The top 1% and 5% coefficients are higher than 0.45 and 0.33, respectively (Figure 1).
Figure 1. Cumulative frequency (F(x)) of pairwise Tanimoto coefficients for 1309 agents.

296
To evaluate the effectiveness of this parameter in target identification, we performed a target enrichment test. First, by searching DrugBank [20] and Therapeutic Target Database (TTD) [21], we retrieved 573 approved drugs from 1309 agents, which hit 536 targets. Then, we found that 209 targets were shared by at least two drugs. These targets and corresponding 476 drugs can be used to assess the target enrichment significance. Although the drug targets collected by DrugBank and TTD may be incomplete and may be indirect targets, these information have been successfully used by previous studies to evaluate the target enrichment efficiency [16]. 113,050 pairwise Tanimoto coefficients were calculated for the 476 drugs. The drug pairs with Tanimoto coefficients of higher than 0.33 were used to estimate the probability of target sharing by hypergeometric test. The results showed that 78 targets of 128 drugs can be enriched (q < 0.05) (Table S3). It is noteworthy that 96 of 128 drugs have multiple targets (≥2), for which the average ratio of target enrichment reaches 68.75% (66/96) (Table S3). In particular, the 7 targets of chlorpromazine, 8 targets of maprotiline, and 14 targets of imipramine were completely enriched (Table S3). Thus, the present method has great potential to predict MoA and targets of chemical agents, especially to dissect the polypharmacological mechanisms of natural products.
The cMap-derived 1309 agents involve four kinds of polyphenols, i.e., flavonoids (16 agents), monolignols (2 agents) and stilbenoids (1 agent), phenylpropanoids (1 agent). The gene module profiles of these polyphenols show that they are involved in more gene modules than other agents (14.85 ± 4.80 vs. 11.85 ± 5.42, p < 0.01, t-test), suggesting that polyphenols indeed have more complex biological functions than others. The most common modules covered by the 20 polyphenols include module 11 (with occurrence of 14), module 18 (with occurrence of 13), module 25 (with occurrence of 13), module 7 (with occurrence of 12), and module 3 (with occurrence of 12). According to the previously enriched biological functions of 49 gene modules [19], the major functions associated with these modules are protein transport, protein location, cytoskeleton organization, cell motion, purine and pyrimidine metabolism, oxidative phosphorylation, cell cycle, RNA processing, ubiquitin-dependent protein catabolic process and translational elongation. By searching in GeneDecks [22], it was found that four of the five common modules (modules 3, 11, 18 and 25) are tightly linked to cancer and tumors (p < 0.0001).
There are 93 drugs that are similar to the 20 polyphenols in terms of gene expression module profile (with Tanimoto coefficients > 0.45), which correspond to 148 targets and provide meaningful clues to clarifying the polypharmacology for these polyphenols (Table S4). In the predicted medicinal effects, anti-neoplastic is most popular (with occurrence of 17 in 93 drugs), in good agreement with the above finding that cancer is linked to most common gene modules.
Tables 1–4 list the predicted targets of four most intensively studied polyphenols, including genistein (a representative component of soybean), quercetin (one of most widely distributed flavonoids), resveratrol (a representative component of red wine), and (−)-catechin (a representative component of green tea). It can be seen that antineoplastic and antihypertensive are the most common predicted activities of the four polyphenols, which agree well with the health benefits of their dietary sources. For instance, accumulating evidence indicated that high soybean intake and regular green tea drinking are associated with low incidence rates of human cancers and hypertension [23–28]. In addition, a large part (50%) of the predicted targets of these polyphenols

297
are validated by experiments, most (92.3%) of which are direct targets (Tables 1–4). These results strongly warrant the experimental evaluation of other predicted targets.
It is intriguing to note that phosphodiesterase enzymes (PDEs) and estrogen receptor are predicted targets for three of four polyphenols. This finding agrees well with the opinion that plant polyphenols collectively behave as phytoestrogens and can inhibit several isoforms of PDEs [29–31]. A major progress in recent natural medicine research was the identification of PDEs as the target of resveratrol [32]. The present analysis highlights the similar pharmacological mechanisms underlying genistein and quercetin.
Table 1. Predicted similar drugs and associated targets of genistein.
Drugs Therapeutic Uses Targets References
Imatinib Antineoplastic Agents
Platelet-derived growth factor receptor a [33] Proto-oncogene tyrosine-protein
kinase ABL1 a [34]
Mast/stem cell growth factor receptor a [35]
Raloxifene Antihypocalcemic Agents Estrogen receptor a [36]
Iloprost Antihypertensive Agents
Prostaglandin E2 receptor, EP2 subtype b [37] cAMP-specific 3',5'-cyclic
phosphodiesterase a [38]
Prostacyclin receptor c [37]
Cisapride Anti-Ulcer Agents
5-Hydroxytryptamine 4 receptor - Gastrointestinal Agents Prokinetic Agents
Fluticasone Anti-inflammatory Agents Glucocorticoid receptor a [39]
Diethylstilbestrol Antineoplastic Agents Estrogen receptor a [36]
Finasteride Anti-baldness Agents Steroid-5-alpha reductase a [40] Antihyperplasia Agents Sulindac sulfide Rheumatoid arthritis - -
Prednisone Anti-inflammatory
Agents Glucocorticoid receptor a [39] Antineoplastic Agents
Estradiol Anti-menopausal Agents
Estrogen receptor a [36] Anticholesteremic Agents
Dydrogesterone Progesterones Progesterone receptor a as direct targets of genistein; b as indirect target of genistein which increases prostaglandin release; c as indirect target of genistein which increases prostacyclin release.

298
Table 2. Predicted similar drugs and associated targets of quercetin.
Drugs Therapeutic Uses Targets References
Tolazoline Adrenergic alpha-Antagonists
Alpha adrenergic receptor - Antihypertensive Agents Vasodilator Agents
Tamoxifen Antineoplastic Agents
Estrogen receptor a [41] Bone Density Conservation Agents
Finasteride Anti-baldness Agents
Steroid-5-alpha reductase - Antihyperplasia Agents Skin and Mucous Membrane Agents
Sulindac sulfide Rheumatoid arthritis - -
Iloprost Antihypertensive Agents Prostaglandin E2 receptor, EP2 subtype -
cAMP-specific 3',5'-cyclic phosphodiesterase a [42] Prostacyclin receptor -
Raloxifene Antihypocalcemic Agents
Estrogen receptor a [41] Bone Density Conservation Agents
Apomorphine Antiparkinson Agents Dopamine receptor a [43] Adrenergic receptors -
5-Hydroxytryptamine receptor a [43] Fluticasone Anti-inflammatory Agents Glucocorticoid receptor - Tocainide Anti-Arrhythmia Agents Sodium channel protein type 5 subunit alpha a [44]
a as direct targets of quercetin.
Table 3. Predicted similar drugs and associated targets of resveratrol.
Drugs Therapeutic Uses Targets Reference
s
Reserpine Antihypertensive Agents
Synaptic vesicular amine transporter - Antipsychotic Agents
Mercaptopurine Antineoplastic Agents Hypoxanthine-guanine
phosphoribosyltransferase -
Immunosuppressive Agents Niclosamide Antiparasitic Agents - - Daunorubicin Antineoplastic Agents DNA topoisomerase -
Terfenadine
Anti-Allergic Agents Histamine H1 receptor -
Antiarrhythmic Agents Potassium voltage-gated channel subfamily H
member 2 a [45]
Muscarinic acetylcholine receptor M3 - Fluphenazine Antipsychotic Agents Dopamine receptor -
Dipyridamole Vasodilator Agents Adenosine deaminase -
cGMP-specific 3',5'-cyclic phosphodiesterase a [46] Rescinnamine Antihypertensive Agents Angiotensin-converting enzyme a [47]
Trifluoperazine Antipsychotic Agents Dopamine receptor - Metixene Antiparkinson Agents Muscarinic acetylcholine receptor -
a as direct targets of resveratrol.

299
Table 4. Predicted similar drugs and associated targets of (−)-catechin.
Drugs Therapeutic Uses Targets References
Letrozole Antineoplastic Agents Cytochrome P450 19A1 a [48] Triprolidine Anti-Allergic Agents Histamine H1 receptor
Pindolol Antihypertensive Agents Adrenergic receptor -
Vasodilator Agents 5-hydroxytryptamine receptor - Norfloxacin Anti-Bacterial Agents DNA topoisomerase 2-alpha a [48] Prilocaine Anesthetics Sodium channel protein type 5 subunit alpha -
Estradiol Anti-menopausal Agents
Estrogen receptor a [49] Anticholesteremic Agents
Doxycycline Anti-Bacterial Agents 30S ribosomal protein -
Bendroflumethiazide Antihypertensive Agents
Solute carrier family 12 member 3 - Calcium-activated potassium channel
subunit alpha 1 -
Carbonic anhydrase -
Theophylline Bronchodilator Agents Adenosine A1 receptor -
Vasodilator Agents cGMP-specific 3',5'-cyclic phosphodiesterase a [29] Naltrexone Anti-craving Agents Opioid receptor a [50]
a as direct targets of (−)-catechin.
3. Experimental
3.1. Tanimoto Coefficient Calculation
Tanimoto coefficient (TC) was calculated with a perl program to compare the gene module profiles of each compound pair.
(29
)
where NA and NB are the number of bits set for gene module profiles of compounds A and B, respectively, and NAB is the set bits that A and B have in common. If TC = 1, the compound pair have the same module profiles; if TC = 0, the pair have totally different module profiles.
3.2. Drug Target Enrichment
Hypergeometric test was used to assess the drug target enrichment significance. The Equation (2) was derived by computing the extreme tail probabilities:
∞
(30
)
where N is the number of total approved drugs for target enrichment (i.e., 476), M is the number of drugs involving the similar module profiles (with Tanimoto coefficient > 0.33), i is the number of drugs sharing the same target in N, K is the number of drugs sharing the same target in M. Thus, we can calculate the probability by chance, at least x occurrences of a target among those associated with the M drugs. The p-values were further adjusted by False Discovery Rate

300
calculation (with R function ‘p.adjust()’ using Benjamini-Hochberg method [51]). The enriched targets were ranked by p-value from most significant to least significant. Then, for each target the q-value is calculated by Equation (3):
(31
)
where Count is the total number of enriched targets. The enriched targets were then selected using a q-value threshold of 0.05.
4. Conclusions
Natural products (NPs) have made important contributions to safe guarding human health. Not only ancient humans depended on NPs to cure various diseases, modern pharmaceutical industry also benefit from NPs to find hits, leads and drugs [12]. Therefore, it is of great significance to elucidate the therapeutic mechanisms of NPs. However, this is a big challenge, because NPs usually hit multiple targets with relatively weak affinity and the conventional target identification methods are laborious and low throughput [14].
In this study, we established a gene module-based target identification method. Because gene modules cover more gene probes, this method is more efficient than conventional microarray analysis methods in information extraction. Therefore, this method enables the discovery of richer information about the medicinal effects of chemical agents, which is very helpful to clarify the polypharmacological mechanisms of polyphenols and other NPs. Moreover, this method may be used to predict targets for NPs beyond those contained in cMap, so it is expected to find more and more applications in the omics era, because the NP-related microarray data are rapidly accumulated.
Acknowledgments
We are grateful to Qiang Zhu for helpful discussions. This work was supported by the National Basic Research Program of China (973 project, grant 2010CB126100), the National Natural Science Foundation of China (grant 21173092) and the Natural Science Foundation of Hubei Province (grant 2013CFA016).
Author Contributions
Bin Li and Min Xiong performed research, analyzed data, and wrote the paper. Hong-Yu Zhang designed research, analyzed data, and wrote the paper.
Conflicts of Interest
The authors declare no conflict of interest.
References
1. Halliwell, B.; Gutteridge, J. Free Radicals in Biology and Medicine; Oxford University Press: New York, NY, USA, 2007.
301
2. Rice-Evans, C.A.; Miller, N.J.; Paganga, G. Structure-antioxidant activity relationships of flavonoids and phenolic acids. Free Radic. Biol. Med. 1996, 20, 933–956.
3. Zhang, H.Y. Structure-activity relationships and rational design strategies for radical-scavenging antioxidants. Curr. Comput. Aided Drug Des. 2005, 1, 257–273.
4. Fernández-Arroyo, S.; Herranz-López, M.; Beltrán-Debón, R.; Borrás-Linares, I.; Barrajón-Catalán, E.; Joven, J.; Fernández-Gutiérrez, A.; Segura-Carretero, A.; Micol, V. Bioavailability study of a polyphenol-enriched extract from Hibiscus Sabdariffa in rats and associated antioxidant status. Mol. Nutr. Food Res. 2012, 56, 1590–1595.
5. Melton, L. The antioxidant myth: a medical fairy tale. New Sci. 2006, 2563, 40–43. 6. Pun, P.B.; Gruber, J.; Tang, S.Y.; Schaffer, S.; Ong, R.L.; Fong, S.; Ng, L.F.; Cheah, I.;
Halliwell, B. Ageing in nematodes: Do antioxidants extend lifespan in Caenorhabditis elegans? Biogerontology 2010, 11, 17–30.
7. Stanner, S.A.; Hughes, J.; Kelly, C.N.; Buttriss, J. A review of the epidemiological evidence for the “antioxidant hypothesis”. Public Health Nutr. 2004, 7, 407–422.
8. Hollman, P.C.; Cassidy, A.; Comte, B.; Heinonen, M.; Richelle, M.; Richling, E.; Serafini, M.; Scalbert, A.; Sies, H.; Vidry, S. The biological relevance of direct antioxidant effects of polyphenols for cardiovascular health in humans is not established. J. Nutr. 2011, 141, 989S–1009S.
9. Halliwell, B. Free radicals and antioxidants—Quo vadis? Trends Pharmacol. Sci. 2011, 32, 125–130.
10. Halliwell, B.; Rafter, J.; Jenner, A. Health promotion by flavonoids, tocopherols, tocotrienols, and other phenols: direct or indirect effects? Antioxidant or not? Am. J. Clin. Nutr. 2005, 81, 268S–276S.
11. Zhang, H.Y.; Chen, L.L.; Li, X.J.; Zhang, J. Evolutionary inspirations for drug discovery. Trends Pharmacol. Sci. 2010, 31, 443–448.
12. Ji, H.F.; Li, X.J.; Zhang, H.Y. Natural products and drug discovery. Can thousands of years of ancient medical knowledge lead us to new and powerful drug combinations in the fight against cancer and dementia? EMBO Rep. 2009, 10, 194–200.
13. Middleton, E.; Kandaswami, C.; Theoharides, T.C. The effects of plant flavonoids on mammalian cells: implications for inflammation, heart disease, and cancer. Pharmacol. Rev. 2000, 52, 673–751.
14. Yue, R.; Shan, L.; Yang, X.; Zhang, W. Approaches to target profiling of natural products. Curr. Med. Chem. 2012, 19, 3841–3855.
15. Lamb, J.; Crawford, E.D.; Peck, D.; Modell, J.W.; Blat, I.C.; Wrobel, M.J.; Lerner, J.; Brunet, J.P.; Subramanian, A.; Ross, K.N.; et al. The Connectivity Map: Using gene-expression signatures to connect small molecules, genes, and disease. Science 2006, 313, 1929–1935.
16. Iorio, F.; Bosotti, R.; Scacheri, E.; Belcastro, V.; Mithbaokar, P.; Ferriero, R.; Murino, L.; Tagliaferri, R.; Brunetti-Pierri, N.; Isacchi, A.; et al. Discovery of drug mode of action and drug repositioning from transcriptional responses. Proc. Natl. Acad. Sci. USA 2010, 107, 14621–14626.

302
17. Qu, X.A.; Rajpal, D.K. Applications of Connectivity Map in drug discovery and development. Drug Discov. Today 2012, 17, 1289–1298.
18. Hochreiter, S.; Bodenhofer, U.; Heusel, M.; Mayr, A.; Mitterecker, A.; Kasim, A.; Khamiakova, T.; van Sanden, S.; Lin, D.; Talloen, W.; et al. A. FABIA: factor analysis for bicluster acquisition. Bioinformatics 2010, 26, 1520–1527.
19. Xiong, M.; Li, B.; Zhu, Q.; Wang, Y.X.; Zhang, H.Y. Identification of transcription factors for drug-associated gene modules and biomedical implications. Bioinformatics 2013, 30, 305–309.
20. Wishart, D.S. DrugBank and its relevance to pharmacogenomics. Pharmacogenomics 2008, 9, 1155–1162.
21. Zhu, F.; Shi, Z.; Qin, C.; Tao, L.; Liu, X.; Xu, F.; Zhang, L.; Song, Y.; Zhang, J.; Han, B.; et al. Therapeutic target database update 2012: a resource for facilitating target-oriented drug discovery. Nucleic Acids Res. 2012, 40, D1128–D1136.
22. Stelzer, G.; Inger, A.; Olender, T.; Iny-Stein, T.; Dalah, I.; Harel, A.; Safran, M.; Lancet, D. GeneDecks: Paralog hunting and gene-set distillation with GeneCards annotation. OMICS 2009, 13, 477–487.
23. Chen, Z.Y.; Peng, C.; Jiao, R.; Wong, Y.M.; Yang, N.; Huang, Y. Anti-hypertensive nutraceuticals and functional foods. J. Agric. Food Chem. 2009, 57, 4485–4499.
24. Wang, J.; Zhang, W.; Sun, L.; Yu, H.; Ni, Q.X.; Risch, H.A.; Gao, Y.T. Green tea drinking and risk of pancreatic cancer: A large-scale, population-based case-control study in urban Shanghai. Cancer Epidemiol. 2012, 36, e354–e358.
25. Kurahashi, N.; Sasazuki, S.; Iwasaki, M.; Inoue, M.; Tsugane, S.; Grp, J.S. Green tea consumption and prostate cancer risk in Japanese men: A prospective study. Am. J. Epidemiol. 2008, 167, 71–77.
26. Trichopoulou, A.; Lagiou, P.; Kuper, H.; Trichopoulos, D. Cancer and Mediterranean dietary traditions. Cancer Epidemiol. Biomark. Prev. 2000, 9, 869–873.
27. Erlund, I. Review of the flavonoids quercetin, hesperetin, and naringenin. Dietary sources, bioactivities, and epidemiology. Nutr. Res. 2004, 24, 851–874.
28. Bhat, K.P.; Pezzuto, J.M. Cancer chemopreventive activity of resveratrol. Ann. N. Y. Acad. Sci. 2002, 957, 210–229.
29. Beretz, A.; Anton, R.; Stoclet, J.C. Flavonoid compounds are potent inhibitors of cyclic AMP phosphodiesterase. Experientia 1978, 34, 1054–1055.
30. Kuiper, G.G.; Lemmen, J.G.; Carlsson, B.; Corton, J.C.; Safe, S.H.; van der Saag, P.T.; van der Burg, B.; Gustafsson, J.A. Interaction of estrogenic chemicals and phytoestrogens with estrogen receptor beta. Endocrinology 1998, 139, 4252–4263.
31. Goodin, M.G.; Fertuck, K.C.; Zacharewski, T.R.; Rosengren, R.J. Estrogen receptor-mediated actions of polyphenolic catechins in vivo and in vitro. Toxicol. Sci. 2002, 69, 354–361.
32. Baur, J.A.; Mai, A. Revelations into resveratrol’s mechanism. Nat. Med. 2012, 18, 500–501. 33. Yan, G.R.; Xiao, C.L.; He, G.W.; Yin, X.F.; Chen, N.P.; Cao, Y.; He, Q.Y. Global
phosphoproteomic effects of natural tyrosine kinase inhibitor, genistein, on signaling pathways. Proteomics 2010, 10, 976–986.
303
34. Lin, M.Q.; den Dulk-Ras, A.; Hooykaas, P.J.J.; Rikihisa, Y. Anaplasma phagocytophilum AnkA secreted by type IV secretion system is tyrosine phosphorylated by Abl-1 to facilitate infection. Cell Microbiol. 2007, 9, 2644–2657.
35. Packer, A.I.; Hsu, Y.C.; Besmer, P.; Bachvarova, R.F. The ligand of the c-kit receptor promotes oocyte growth. Dev. Biol. 1994, 161, 194–205.
36. Rickard, D.J.; Monroe, D.G.; Ruesink, T.J.; Khosla, S.; Riggs, B.L.; Spelsberg, T.C. Phytoestrogen genistein acts as an estrogen agonist on human osteoblastic cells through estrogen receptors alpha and beta. J. Cell Biochem. 2003, 89, 633–646.
37. Hermenegildo, C.; Oviedo, P.J.; Garcia-Perez, M.A.; Tarin, J.J.; Cano, A. Effects of phytoestrogens genistein and daidzein on prostacyclin production by human endothelial cells. J. Pharmacol. Exp. Ther. 2005, 315, 722–728.
38. Shih, C.-H.; Lin, L.-H.; Lai, Y.-H.; Lai, C.-Y.; Han, C.-Y.; Chen, C.-M.; Ko, W.-C. Genistein, a competitive PDE1-4 inhibitor, may bind on high-affinity rolipram binding sites of brain cell membranes and then induce gastrointestinal adverse effects. Eur. J. Pharmacol. 2010, 643, 113–120.
39. Nishizaki, Y.; Ishimoto, Y.; Hotta, Y.; Hosoda, A.; Yoshikawa, H.; Akamatsu, M.; Tamura, H. Effect of flavonoids on androgen and glucocorticoid receptors based on in vitro reporter gene assay. Bioorg. Med. Chem. Lett. 2009, 19, 4706–4710.
40. Ye, L.; Su, Z.J.; Ge, R.S. Inhibitors of testosterone biosynthetic and metabolic activation enzymes. Molecules 2011, 16, 9983–10001.
41. Maggiolini, M.; Bonofiglio, D.; Marsico, S.; Panno, M.L.; Cenni, B.; Picard, D.; Ando, S. Estrogen receptor alpha mediates the proliferative but not the cytotoxic dose-dependent effects of two major phytoestrogens on human breast cancer cells. Mol. Pharmacol. 2001, 60, 595–602.
42. Lines, T.C.; Ono, M. FRS 1000, an extract of red onion peel, strongly inhibits phosphodiesterase 5A (PDE 5A). Phytomedicine 2006, 13, 236–239.
43. Gaulton, A.; Bellis, L.J.; Bento, A.P.; Chambers, J.; Davies, M.; Hersey, A.; Light, Y.; McGlinchey, S.; Michalovich, D.; Al-Lazikani, B.; et al. ChEMBL: A large-scale bioactivity database for drug discovery. Nucleic Acids Res. 2012, 40, D1100–D1107.
44. Wallace, C.H.R.; Baczko, I.; Jones, L.; Fercho, M.; Light, P.E. Inhibition of cardiac voltage-gated sodium channels by grape polyphenols. Br. J. Pharmacol. 2006, 149, 657–665.
45. Granados-Soto, V.; Arguelles, C.F.; Ortiz, M.I. The peripheral antinociceptive with activation of effect of resveratrol is associated potassium channels. Neuropharmacology 2002, 43, 917–923.
46. Park, S.J.; Ahmad, F.; Philp, A.; Baar, K.; Williams, T.; Luo, H.; Ke, H.; Rehmann, H.; Taussig, R.; Brown, A.L.; et al. Resveratrol ameliorates aging-related metabolic phenotypes by inhibiting cAMP phosphodiesterases. Cell 2012, 148, 421–433.
47. Melzig, M.F.; Escher, F. Induction of neutral endopeptidase and anglotensin-converting enzyme activity of SK-N-SH cells in vitro by quercetin and resveratrol. Pharmazie 2002, 57, 556–558.

304
48. Davis, A.P.; King, B.L.; Mockus, S.; Murphy, C.G.; Saraceni-Richards, C.; Rosenstein, M.; Wiegers, T.; Mattingly, C.J. The comparative toxicogenomics database: Update 2011. Nucleic Acids Res. 2011, 39, D1067–D1072.
49. Damianaki, A.; Bakogeorgou, E.; Kampa, M.; Notas, G.; Hatzoglou, A.; Panagiotou, S.; Gemetzi, C.; Kouroumalis, E.; Martin, P.-M.; Castanas, E. Potent inhibitory action of red wine polyphenols on human breast cancer cells. J. Cell Biochem. 2000, 78, 429–441.
50. Katavic, P.L.; Lamb, K.; Navarro, H.; Prisinzano, T.E. Flavonoids as opioid receptor ligands: Identification and preliminary structure-activity relationships. J. Nat. Prod. 2007, 70, 1278–1282.
51. Benjamini, Y.; Hochberg, Y. Controlling the false discovery rate: A practical and powerful approach to multiple testing. J. R. Statist. Soc. B. 1995, 57, 289–300.

305
Prediction of Multi-Target Networks of Neuroprotective
Compounds with Entropy Indices and Synthesis, Assay,
and Theoretical Study of New Asymmetric
1,2-Rasagiline Carbamates
Francisco J. Romero Durán, Nerea Alonso, Olga Caamaño, Xerardo García-Mera,
Matilde Yañez, Francisco J. Prado-Prado and Humberto González-Díaz
Abstract: In a multi-target complex network, the links (Lij) represent the interactions between the drug (di) and the target (tj), characterized by different experimental measures (Ki, Km, IC50, etc.) obtained in pharmacological assays under diverse boundary conditions (cj). In this work, we handle Shannon entropy measures for developing a model encompassing a multi-target network of neuroprotective/neurotoxic compounds reported in the CHEMBL database. The model predicts correctly >8300 experimental outcomes with Accuracy, Specificity, and Sensitivity above 80%–90% on training and external validation series. Indeed, the model can calculate different outcomes for >30 experimental measures in >400 different experimental protocolsin relation with >150 molecular and cellular targets on 11 different organisms (including human). Hereafter, we reported by the first time the synthesis, characterization, and experimental assays of a new series of chiral 1,2-rasagiline carbamate derivatives not reported in previous works. The experimental tests included: (1) assay in absence of neurotoxic agents; (2) in the presence of glutamate; and (3) in the presence of H2O2. Lastly, we used the new Assessing Links with Moving Averages (ALMA)-entropy model to predict possible outcomes for the new compounds in a high number of pharmacological tests not carried out experimentally.
Reprinted from Int. J. Mol. Sci. Cite as: Durán, F.J.R.; Alonso, N.; Caamaño, O.; García-Mera, X.; Yañez, M.; Prado-Prado, F.J.; González-Díaz, H. Prediction of Multi-Target Networks of Neuroprotective Compounds with Entropy Indices and Synthesis, Assay, and Theoretical Study of New Asymmetric 1,2-Rasagiline Carbamates. Int. J. Mol. Sci. 2014, 15, 17035-17064.
1. Introduction
Entropy measures are universal parameters useful to codify biologically relevant information in many systems. In the 1970’s Bonchev and Trinajstic et al. published works about the use of Shannon’s entropy to calculate a structural information parameter [1–4]. Kier published another seminar works on the use of Shannon’s entropy to encoding molecular structure in Cheminformatics studies in 1980 [4]. Many other authors used Shannon’s entropy parameters for the same purpose on small molecule structure [5–10]. Graham et al. [11–16] used entropy measures to study the information properties of organic molecules. Entropy information measures were used to describe proteins [17,18], DNA sequences [19], protein networks [20], and magnetic resonance outcomes [21]. The software MARCH-INSIDE (MI) uses the theory of Markov chains to calculate the parameters θk(G). These values are the Shannon entropies of order kth of a graph G. The θk(G) values are useful quantify information about the structure of molecular systems [22].
306
The graph G represents a complex molecular system as a network of nodes interconnected by links (Lij = 1) or not connected (Lij = 0). MI algorithm associates a Markov matrix to the graph G in order to define the probabilities of interactions (ties or relationships) between nodes. These entropy parameters θk(G) can be calculated for many types of systems (molecular or otherwise). We have studied small molecules, RNA secondary structures, protein sequences, viral surfaces, cerebral cortex networks, metabolic networks, host-parasite networks, world trading networks, social networks, etc. In molecules, we know the information about links Lij (covalent bonds, hydrogen bonds, spatial contacts, etc.) beyond any reasonable doubt. However, we can use the information (θk(G) values)of the system to predict interactions with other systems in a network of a higher-structural level. For instance, we use the θk(G) values of drugs and targets structure to predict drug–target interactions (links) in drug–target network. In other cases, linking patterns change, are not known, or we find contradictory information. This is the case of the existence of different relationships between nodes in biological webs or social networks. In these cases, we can use the θk(G) values of known networks to find models useful to predict links in new networks [23–25].
On the other hand, the discovery of new drugs for the treatment of neurodegenerative diseases such as Alzheimer’s, Parkison’s, and Huntington’s disease, Friedreich ataxia and others, is an important goal of medicinal chemistry [26–29]. The genes causing hereditary forms of some of these diseases have been identified but the molecular mechanisms of the neuronal degeneration have not been totally understood yet [30]. This picture, and some disappointing results in clinical trials, makes interesting the prediction of drug candidates with computational techniques [31,32]. In order to design these computational models we need to process chemical information from public databases. These databases have accumulated immense datasets of experimental results of pharmacological trials for many compounds. For instance, CHEMBL [33,34] is one of the biggest with more than 11,420,000 activity data for >1,295,500 compounds, and 9844 targets. This huge amount of information offers a fertile field for the application of computational techniques [34,35].
The analysis of all this data is very complex due to the presence of multi-target, multi-output, and multi-scale information. Multi-target complication emerges due to the existence of compounds with multiple targets [36–38]. This led to the formation of complex networks of drug–target interactions. We can represent drug–target networks as a graph with two types of nodes drugs (di) and targets (tj) interconnected by links (Lij). Barabasi et al. [39], constructed a drug–target network based on Food and Drug Administration (FDA) drugs and proteins linked by drug–target binary associations. Csermely et al. [40], reviewed the use of networks, including drug–target networks, for drug discovery.
Multi-output feature refers to the necessity of prediction of different experimental parameters (IC50, Ki, Km, etc.) to decided whether two nodes (drug and target) interact (Lij = 1) or not (Lij = 0). Multi-scaling refers to the different structural levels of the organization of matter. In this case, the input variables quantify molecular information (drugs structure) and macromolecular information (targets). They have to quantify also cellular (cellular targets) and organism information (specie that express the target). In these models we have a high number of assays carried out in very different conditions (cq) like time, concentrations, temperature, cellular targets, tissues, organisms, etc. In a recent work, we combined the θk(G) values calculated with MI and the idea of Moving
307
Average (MA) operators with a similar purpose [41]. In time series analysis the MA operators are average values of characteristic of the system for different seasons. In fact, MA models became popular after the initial works of Box and Jenkins [42]. In time series analysis, MA models may combine other operators I = Integrated, AR = Autoregressive, N = Non-linear operators, or X = Exogenous effects. In this sense, others models have emerged combining different operators: ARMA, ARIMA, VARIMA, ARIMAX, NARMA, etc. In multi-output modeling, we calculate the MA operators as the average of the property of the system (molecular descriptors or others) for all drugs or targets with a specific response in one assay carry out under a sub-set of conditions (cj). Consequently, our MA operator is not acting over a time domain but over a sub-set of conditions of the pharmacological assays. The idea of application of MA operators to other domains different from time is gaining adepts due to its advantages. For instance, Botella-Rocamora et al. [43] developed a model for disease mapping using spatial Box–Jenkins operators with the form of MAs, to define dependence of the risk of a disease to occur. In our models, we use MA in relation with properties of nodes of networks (drugs, proteins, reactions, laws, neurons, etc.); which form links Lij(cq) in specific sub-set of conditions (cq). For this reason, we decided to call this strategy as ALMA (Assessing Links with Moving Averages) models. Speck-Planche and Cordeiro reported different multi-target or multi-output models using the same type of ALMA models [44–46].
In the specific area of neurodegenerative diseases, almost all these datasets includes also large sub-sets of assays involving potential neuroprotective drugs, targets, as well as drug-target and/or target–target interactions. The database NeuroDNet has interactive tools to create interaction networks for twelve neurodegenerative diseases. According to Vasaikar et al. [47], it is the first of its kind, which enables the construction and analysis of neurodegenerative diseases through protein interaction networks, regulatory networks and Boolean networks. In the case of neuroprotective compounds, some authors have reported multi-target ALMA models. García et al. used topological descriptors for a large series of 3370 active/non-active compounds to fit a classification function that can predict links Lij (interactions) of heterogeneous series of GSK inhibitors compounds with different neurological targets relevant to Alzheimer’s disease and parasite species. Speck-Planche et al. [48], developed a multi-target model using a large and heterogeneous database of inhibitors against five proteins associated with Alzheimer’s disease. The model correctly classified more than 90% of active and inactive compounds in the treatment of Alzheimer’s disease on both, training and prediction series. Several guidelines are offered in other paper to show how the use of fragment-based descriptors can be determinant for the design of multi-target inhibitors of proteins associated with Alzheimer’s disease [49].
In a recent work, we used the method TOPS-MODE (TM) [50] to calculate the structural parameters of drugs. The model correctly classified 4393 out of 4915 total cases with Specificity (Sp), Accuracy (Ac), and Sensitivity (Sn), of 80%–98%. We also used the method TM to develop one ALMA [51] model useful for the prediction of neuroprotective drugs. This dataset includes Multi-output assay endpoints of 2217 compounds for at least one out of 338 assays, with 148 molecular or cellular targets, and 35 types of activity measures in 11 model organisms (including human). In a third work [52], we introduced another ALMA model for neurotoxicity/neuroprotective effects of drugs based on the method MI. First, we used MI to calculate molecular descriptors of the type of stochastic spectral moments of all compounds. Next,

308
we found a model that classified correctly 2955/3548 total cases on training and validation series with Ac, Sn, and Sp > 80%. Each data point (>8000) contains the values of 37 possible measures of activity, 493 assays, 169 molecular or cellular targets, and 11 different organisms (including human) for a given compound. The model has shown excellent results also in computational simulations of high-throughput screening experiments, with Ac = 90.6% for 4671 positive cases. Both models are able to predict the links Lij(cq) between ith drugs and jth targets according to the assay aq. However, we do not carried out a formal construction and a comparison of the drug-target networks for the CHEMBL data in previous papers. In any case, despite the high versatility of entropy measures to codify structural information, there is no report of a multi-target model for drug–target interactions for compounds with neuroprotective/neurotoxic effect. In this work, we report the first multi-target, multi-output, and multi-scale ALMA model for CHEMBL data of neuroprotective/neurotoxic effect of drugs. Then, we construct and compare for the first time three Multi-output assay complex networks for these CHEMBL dataset using the two previous models and the model reported in this work. From there, we reported by the first time the synthesis, characterization, and experimental assays of a new series of rasagiline carbamate derivatives not reported in previous works. We carried out three different experimental tests: assay (1) in absence of neurotoxic agents; (2) in the presence of glutamate; and (3) in the presence of H2O2. Finally, we used the new entropy model to predict possible outcomes for these compounds in a high number of pharmacological tests not carried out experimentally. The results presented here show the high potential of entropy parameters of chemical information for the design of neuroprotective drugs, the construction of complex bio-molecular networks, and the potential of ALMA models for multi-target, multi-output, and multi-scale modeling.
2. Results and Discussion
2.1. Development of New Model for Prediction of Drug–Target Networks
2.1.1. Model Training and Validation
We report a model to predicting when the ith compound may present a high (Lij(cq) = 1) or not (Lij(cq) = 0) value of the experimental parameter used to characterize interaction with a molecular or cellular target involved in a neuroprotective/neurodegenerative process. The output Sij(cq) of our multi-output model depend on both chemical structure of the ith drug di and the set of conditions selected to perform the biological assay (cq) including the jth target, of course. In consonance, the ALMA model should predict different probabilities if we change the organisms (c1), the biological assays (c2), the molecular/cellular target (c3), or the standard experimental parameter measured (c4), for the same compound [53].The best ALMA-entropy model found in this work was:
3 4 3 4 3 43 4 3 4
005.0007.191372.02661
·0017.0·0202.0
·4349.0·1993.0)(·4039.01396.1
211
111
����
0�0�
0�0���
pRNto
ascpcS
c
ei
ti
ui
xii
lqij
8
��
���
(1)
The statistical parameters for the above equation in training are: Number of cases used to train the model (N), Canonical Regression Coefficient (Rc), Chi-square (χ2), and p-level [54]. The

309
probability cut-off for this Linear Discriminant Analysis (LDA) model is ip1(cq) > 0.5 ≥ Lij(cq) = 1. It means that the drug di predicted by the model, with probability p > 0.5, is expected to give a positive outcome in the qth assays carry out under the given set of conditions cq. This ALMA-entropy model presents excellent performance in both training and external validation series with Sn, Sp, and Ac > 80% (see Table 1). Values higher than 75% are acceptable for LDA-QSAR models, according to previous reports [55–59].
The first term in the equation, quantify both the quality of the input data p(cl) and the information θi
5 about the structure of the drug (see material and methods and previous works [51]). We can expand the Box–Jenkins MA terms in the ALMA equation in order to clearly depict all the parameters involved:
3 4 3 43 4 3 4 3 4� �3 4 3 4 3 4� �3 4 3 4 3 4� �3 4 3 4 3 4� �
005.0007.191372.02661
··001660.0
··020189.0
··434889.0
··199322.0
··403994.0139556.1
2
515
515
515
515
51
����
��
��
��
��
��
pRN
ttpt
oopo
aapa
ssps
spcS
c
eeei
ttti
uuui
xxxi
ixqij
8
��
��
��
��
�
(2)
After inspection of this equation, we can see that the ALMA model can predict for the same compound different scores for different experimental parameters, targets, assays, or even different organisms. In Table 2 we illustrate the values of probability of drug–target interaction pij(cq) predicted with the previous model, for several examples of known drugs or new promising compounds. These are the probabilities with which the ith compound interact with the jth drug under the assay conditions cq. This is equivalent to pij(cq) > 0.5 ≥ Lij(cq)pred = 1. However, online supplementary material files contain a complete list with many examples of positive and control cases.
The Table 2 shows predictions of the same drug in different sets of conditions of assay cq, including different targets, organisms, or assays. Therefore, we only have to substitute in the equation the value of θi
5 of the compound and the respective values p1(cq)·<θi5(cq)> for the MA
operators of each condition. In the Table 3 we depict many examples of values of MA operators p1(cq)·<θi
5(cq)> for different conditions.
Table 1. Results of Assessing Links with Moving Averages (ALMA) models for entropy measures vs. different spectral moments.
Descriptor Sub-Set Stat. a % Groups Ci(mj)pred = 1 Ci(mj)pred = 0 Reference
MI-Entropy
Train Sp 79.0 Lij(Cq)obs = 1 1092 290
This work
Sn 91.5 Lij(Cq)obs = 0 412 4438
Ac 88.7 Total
CV Sp 81.3 Lij(Cq)obs = 1 379 87 Sn 92.6 Lij(Cq)obs = 0 119 1492
Ac 90.1 Total

310
Table 1. Cont.
Descriptor Sub-Set Stat. a % Groups Ci(mj)pred = 1 Ci(mj)pred = 0 Reference
MI spectral moments
Train Sp 84.6 Lij(Cq)obs = 1 1172 214
[52]
Sn 82.4 Lij(Cq)obs = 0 224 1051
Ac 83.5 Total
CV Sp 83.3 Lij(Cq)obs = 1 385 77 Sn 81.6 Lij(Cq)obs = 0 78 347
Ac 82.5 Total
TM spectral moments
Train Sp 81.3 Lij(Cq)obs = 1 1533 352
[51]
Sn 98.0 Lij(Cq)obs = 0 36 1762
Ac 89.5 Total
CV Sp 81.0 Lij(Cq)obs = 1 513 120 Sn 97.7 Lij(Cq)obs = 0 14 585
Ac 89.1 Total MI, MARCH-INSIDE; a Sensitivity = Sn = Positive Correct/Positive Total; Specificity = Sp = Negative Correct/Negative Total; Accuracy = Ac = Total Correct/Total; TM, TOPS-MODE.
Table 2. Examples predicted with the model.
Compound (i) pij(cq) Assay ID Measure (Units) Organism Target Protein
Arecoline 0.94 796814 Efficiency (%) rno Muscarinic acetylcholine receptor
Bipinnatin-A 1.00 751272 Inhibition (%) mmu Acetylcholine receptor protein β chain
Carachol 0.99 796814 Efficiency (%) rno Muscarinic acetylcholine receptor
Caulophylline 0.96 838016 EC50 (nM) hsa Neuronal acetylcholine receptor; α4/β2
Citalopram 0.99 740208 Ki (nM) mmu Dopamine transporter
Condelphine 1.00 748943 −Log(IC50) (nM) rno Neuronal acetylcholine receptor protein α-7 subunit
Delcorine 1.00 748943 −Log(IC50) (nM) rno Neuronal acetylcholine
receptor protein α-7 subunit
Delsoline 1.00 748943 −Log(IC50) (nM) rno Neuronal acetylcholine
receptor protein α-7 subunit Desipramine 0.99 797692 −Log(IC50) (nM) rno Norepinephrine transporter
Elatine 1.00 748943 −Log(IC50) (nM) rno Neuronal acetylcholine
receptor protein α-7 subunit
Emopamil 1.00 817225 −Log(IC50) (nM) rno Voltage-gated R-type calcium channel α-1E
subunit
Epibatidine 0.94 838016 EC50 (nM) hsa Neuronal acetylcholine
receptor; α4/β2
Epibatidine 0.19 825420 Efficacy (%) hsa Neuronal acetylcholine
receptor; α4/β2 Femoxetine 0.99 740206 Ki (nM) mmu Dopamine transporter
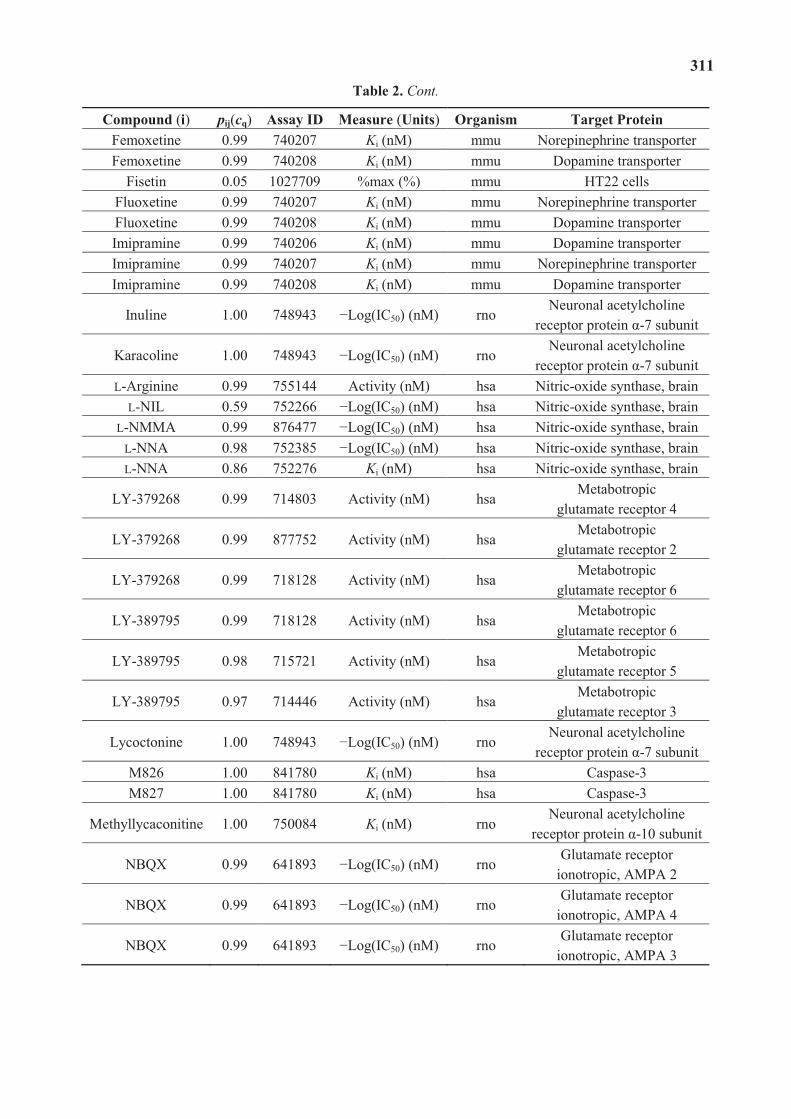
311
Table 2. Cont.
Compound (i) pij(cq) Assay ID Measure (Units) Organism Target Protein
Femoxetine 0.99 740207 Ki (nM) mmu Norepinephrine transporter Femoxetine 0.99 740208 Ki (nM) mmu Dopamine transporter
Fisetin 0.05 1027709 %max (%) mmu HT22 cells Fluoxetine 0.99 740207 Ki (nM) mmu Norepinephrine transporter Fluoxetine 0.99 740208 Ki (nM) mmu Dopamine transporter Imipramine 0.99 740206 Ki (nM) mmu Dopamine transporter Imipramine 0.99 740207 Ki (nM) mmu Norepinephrine transporter Imipramine 0.99 740208 Ki (nM) mmu Dopamine transporter
Inuline 1.00 748943 −Log(IC50) (nM) rno Neuronal acetylcholine
receptor protein α-7 subunit
Karacoline 1.00 748943 −Log(IC50) (nM) rno Neuronal acetylcholine
receptor protein α-7 subunit L-Arginine 0.99 755144 Activity (nM) hsa Nitric-oxide synthase, brain
L-NIL 0.59 752266 −Log(IC50) (nM) hsa Nitric-oxide synthase, brain L-NMMA 0.99 876477 −Log(IC50) (nM) hsa Nitric-oxide synthase, brain
L-NNA 0.98 752385 −Log(IC50) (nM) hsa Nitric-oxide synthase, brain L-NNA 0.86 752276 Ki (nM) hsa Nitric-oxide synthase, brain
LY-379268 0.99 714803 Activity (nM) hsa Metabotropic
glutamate receptor 4
LY-379268 0.99 877752 Activity (nM) hsa Metabotropic
glutamate receptor 2
LY-379268 0.99 718128 Activity (nM) hsa Metabotropic
glutamate receptor 6
LY-389795 0.99 718128 Activity (nM) hsa Metabotropic
glutamate receptor 6
LY-389795 0.98 715721 Activity (nM) hsa Metabotropic
glutamate receptor 5
LY-389795 0.97 714446 Activity (nM) hsa Metabotropic
glutamate receptor 3
Lycoctonine 1.00 748943 −Log(IC50) (nM) rno Neuronal acetylcholine
receptor protein α-7 subunit M826 1.00 841780 Ki (nM) hsa Caspase-3 M827 1.00 841780 Ki (nM) hsa Caspase-3
Methyllycaconitine 1.00 750084 Ki (nM) rno Neuronal acetylcholine
receptor protein α-10 subunit
NBQX 0.99 641893 −Log(IC50) (nM) rno Glutamate receptor
ionotropic, AMPA 2
NBQX 0.99 641893 −Log(IC50) (nM) rno Glutamate receptor
ionotropic, AMPA 4
NBQX 0.99 641893 −Log(IC50) (nM) rno Glutamate receptor
ionotropic, AMPA 3

312
Table 2. Cont.
Compound (i) pij(cq) Assay ID Measure (Units) Organism Target Protein
NBQX 0.99 641893 −Log(IC50)
(nM) mmu
Glutamate receptor ionotropic, AMPA 1
Nipecotic acid 0.28 785010 −Log(IC50)
(nM) rno GABA transporter 1
Nipecotic acid 0.28 785010 −Log(IC50)
(nM) rno GABA transporter 2
Nipecotic acid 0.28 785010 −Log(IC50)
(nM) rno GABA transporter 3
Nipecotic acid 0.28 785010 −Log(IC50)
(nM) rno Betaine transporter
NOHA 0.04 755137 NO
formation (%) rno Nitric-oxide synthase, brain
Norepinephrine 0.98 780755 Concentration (% dose·g−1)
rno
Nudicauline 1.00 748943 −Log(IC50)
(nM) rno
Neuronal acetylcholine receptor protein α-7 subunit
Omega nitro-arginine
0.99 752258 Ki (nM) hsa Nitric-oxide synthase, brain
Oxotremorine 0.84 798083 pD2 rno Muscarinic acetylcholine
receptor M1 Paroxetine 1.00 740206 Ki (nM) mmu Dopamine transporter
RedAm-Ethyl 0.33 840782 Selectivity hsa Nitric-oxide
synthase, endothelial RedAm-Ethyl 0.28 840782 Selectivity hsa Nitric-oxide synthase, brain
Resveratrol 0.99 1613870 EC50 (nM) hsa Nuclear factor NF-κB
p105 subunit
Resveratrol 0.99 1613870 EC50 (nM) hsa Nuclear factor NF-κB
p65 subunit
Stemofoline 1.00 936299 EC50 (nM) hvi Nicotinic acetylcholine
receptor α1 subunit
Thiocytisine 0.51 857972 Log Ki rno Neuronal acetylcholine
receptor; α4/β2 rno, Rattus norvegicus (Rat); mmu, Mus musculus (Mouse); hsa, Homo sapiens (Human); and hvi, Heliothis virescens.
2.1.2. Comparison with Other ALMA Models
An interesting exercise is the comparison of the present model and the network predicted with outcomes obtained with other methods. Until the best of our knowledge, there are only two similar models. Both models make use of the spectral moments of a molecular matrix as input variables (Di) to quantify the molecular structure of drugs. The first model [51] applies spectral moments μk of order kth of the bond adjacency matrix (1
B) calculated with the TM approach. The equation of this model is the following:

313
3 4 3 4 3 4 3 43 4 3 4
005.07.03683198684.4·10·84.2·10·16.1
·10·93.2·10·84.7·10·01.7
54
54
54
54
54
����0�0�
0�0�.����
���
pRNto
ascpcS
c
ii
iiijqij
//
///
(3)
The second model [52] employs as input the πik values of the Markov matrix (1Π) of atom–atom
electron delocalization calculated with the software MI. In the TM method, we weighted the edges of the molecular graph with standard distances of chemical bonds whereas the MI algorithm employs atom standard electronegativities to weighting the nodes of molecular graph. The equation of the second model is:
3 4 3 4 3 4 3 43 4 3 4
005.0007.191372.02661
·001660.0·020189.0
·434889.0·199322.0·403994.0139556.1
215
555
����
0�0�
0�0�.��
pRNto
ascpcS
c
ei
ti
ui
xii
jqij
8
99
999
(4)
In both cases, as well as in the present ALMA-entropy model, we used MA terms to quantify the deviations of the structure of one compound from sub-sets of compounds with a positive outcome in different conditions cq. The three methods showed excellent values of Ac, Sp, and Sn on both training and validation series (see Table 1). Apparently, the TM model shows better values of these parameters but we have to take into consideration the differences in the complexity of the data sets used to train and validate these models. The TM-spectral moment model is able to classify correctly 83%–82% of 4915 cases in total (on training and validation series respectively). The MI-spectral moment model is able to classify correctly 89%–92% of 3598 cases. Notably, the MI-entropy model is able to classify correctly 89%–92% of 8309 cases. Consequently, the statistics for the present model refer to a dataset with more than twice the number of data points present in previous models.
2.1.3. Construction of Drug–Target Networks with ALMA Models
ALMA models may be useful both (1) for computational or virtual High-Throughput Screening (HTS) screening of large databases like CHEMBL and/or (2) for construction of drug–target networks. All the results, discussed in previous section, indicate that many compounds may act as multi-target drugs with non-linear or indirect effect (orthosteric and/or allosteric) over different targets in different pathways. In a recent special issue edited by Csermely, Nussinov, and Szilágyi [60], different research groups discussed about this topic and related concepts such as allo-networks. In one of these papers, Mueller et al. [61] have developed a computational model for the HTS of drugs with action over mGluR5; which represent a promising strategy for the treatment of schizophrenia. Considering the relevance of allotropy for these and other receptors for our study, and all previous comments about allo-network drugs, we decided to use our model to construct a drug-target network. The interest in doing so is that this type of network-based tools may be applied for the discovery of new drugs, including perhaps allo-network drugs [40,60,62].

314
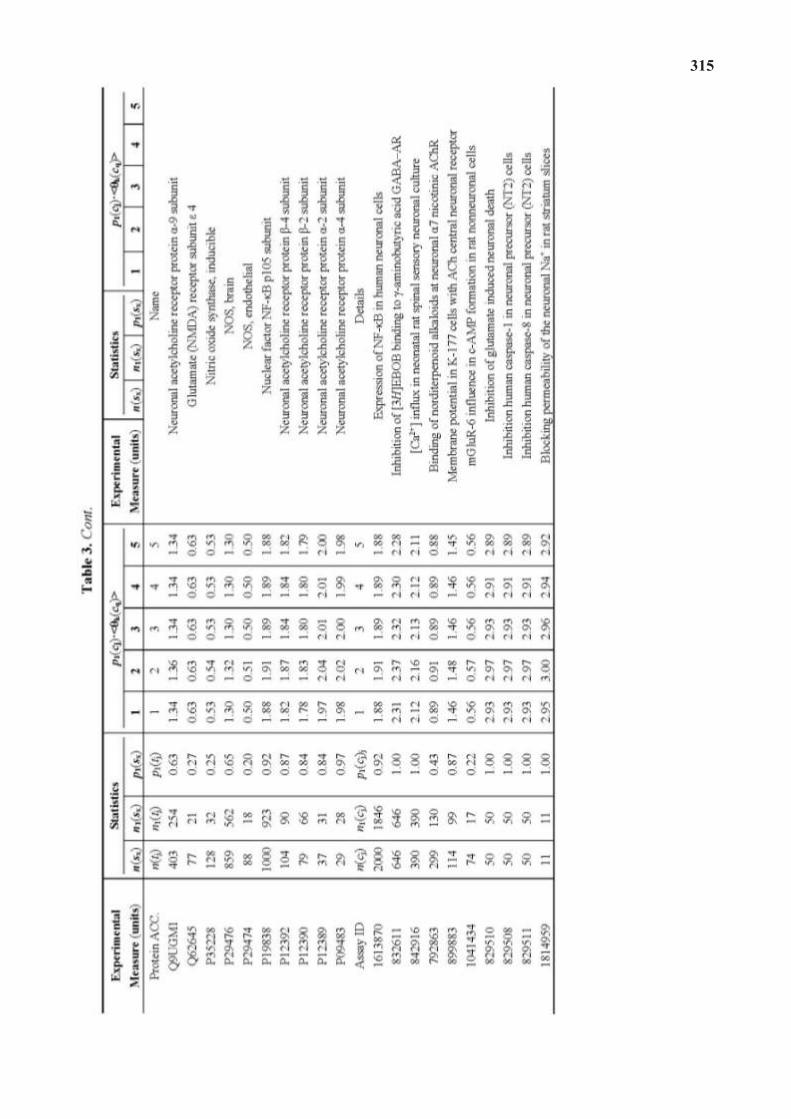
315

316
Considering these points, we constructed here by the first time a drug–target network with CHEMBL experimental outcomes of multiplex assays of neuroprotective effects of drugs with the same dataset used in the previous section. This is probably the first drug–target network representation of the interaction of neuroprotective compounds with cellular or protein targets; many of them susceptible to allosteric modulators. In this directed network, we used three classes of nodes, drugs (di), targets (tj), and pharmacological assays (aq). They are connected by only three classes of arcs (directed links) drug ≥ (di ≥ tj), drug ≥ assay (di ≥ aq), and target-assay (tj ≥ aq). Other types of relationships were not considered. The observed drug–target network was constructed with the input dependent variable Lij(cq). In consequence, if CHEMBL reports the case of drug di that causes an strong biological response (Lij(cq) = 1) in one biological experiment carry out under the conditions cq = (tj, aq), we have to draw in the network the path di ≥ tj ≥ aq. We omitted here the representation of nodes for the type of experimental measure and the organism that express the target. This avoids very highly connected nodes that may cause a strong distortion in network topology and mask or hidden the relevance of important drugs or targets.
The observed network constructed with the dataset published in the previous work has 968 nodes = 721 drugs + 72 targets + 175 pharmacological assays for neuroprotective effects. We apply, also, the software MI to quantify the structural information of the drug–target networks. In so doing, we calculated the Shannon entropy (Sh), as well as δ = node degrees for the nodes (drugs, targets, and assays) in the network, see Table 4. Please note that the Sh entropy values for the nodes in the drug–target network (supra-molecular structural level) are different from the θk entropy values use to quantify the information about the structure of the drug (molecular structural level). Actually, we do not use a classic Shannon entropy (H) but a first-order Markov–Shannon entropy [25].
After a first inspection, we can observe that the degree of a node (δ) in the network has average values of δ = 4.8 ≈ 5 for all nodes, δ = 4.8 ≈ 5 for drugs, and δ = 4.3 ≈ 4 for assays. It means that, on average, each drug interacts with five targets and we can measure this interaction with approximately four assays. It is easy to realize that the higher δ for targets may be determined in part by their position in the network. For each link of drug or assay node, we have two interactions for the target di ≥ tj and tj ≥ aq). As a result, we can decompose the δ into δ = δin + δout = node degree = in-degree + out-degree [63]. For this reason, we carried out all calculations eliminating the direction of arcs. In so doing, we considered them as symmetric links to avoid this “over-booking” of target nodes. Consequently, the average is δ = 6.1 ≈ 6 for targets, a value still higher, but closer to 5 than to 8–10, the double is expected.
In a second stage, we use our model to reconstructing/predicting the same network, based on the probability p(mj) outputs of the model. Two nodes are connected when the probability predicted by the model is p(cq) > 0.5, it means that p(di, tj), or p(di, aq), or p(tj, aq) are >0.5, for different pairs of links. We can perceive that the values of the drug–target network predicted by the model are very similar to those of the observed network. Consequently, we can conclude that the model is efficient not only in the overall prediction of links in the network (high Ac, Sp, and Sn, see Table 1) but in the reconstruction of topological patterns. For instance, from information theory we can deduce that the uncertainty of links is similar in both networks because Shannon entropy calculated for all links is
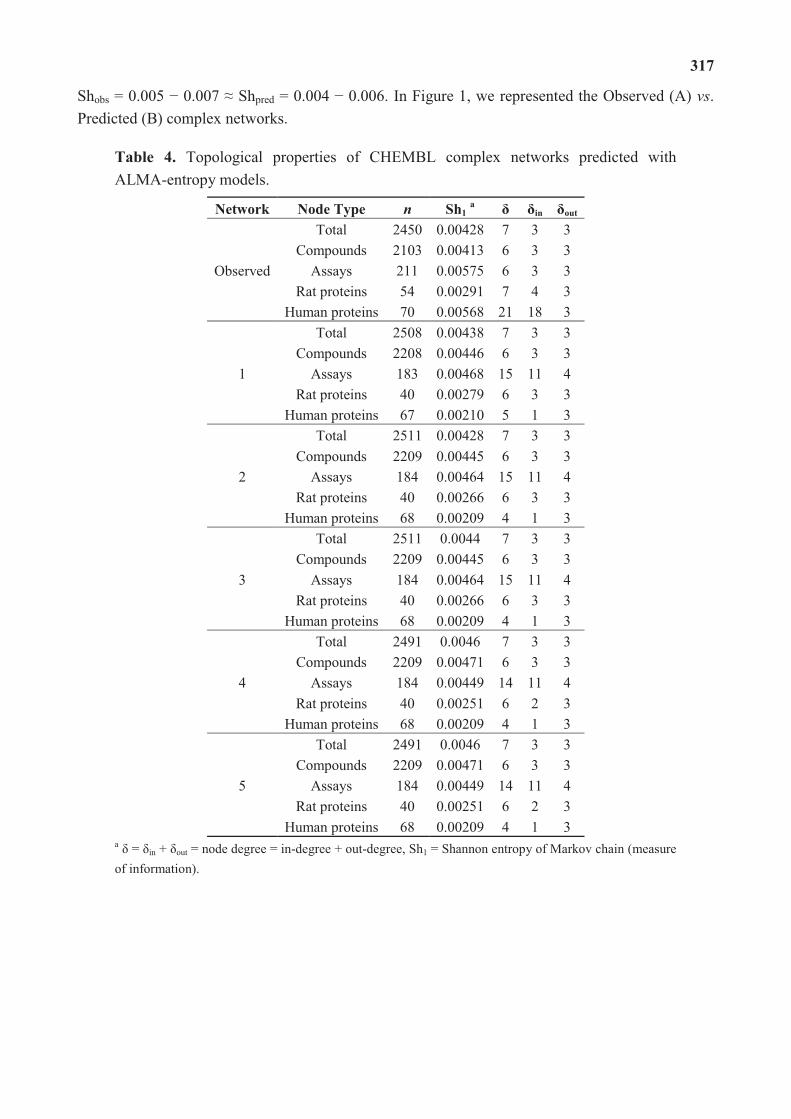
317
Shobs = 0.005 − 0.007 ≈ Shpred = 0.004 − 0.006. In Figure 1, we represented the Observed (A) vs. Predicted (B) complex networks.
Table 4. Topological properties of CHEMBL complex networks predicted with ALMA-entropy models.
Network Node Type n Sh1 a δ δin δout
Observed
Total 2450 0.00428 7 3 3 Compounds 2103 0.00413 6 3 3
Assays 211 0.00575 6 3 3 Rat proteins 54 0.00291 7 4 3
Human proteins 70 0.00568 21 18 3
1
Total 2508 0.00438 7 3 3 Compounds 2208 0.00446 6 3 3
Assays 183 0.00468 15 11 4 Rat proteins 40 0.00279 6 3 3
Human proteins 67 0.00210 5 1 3
2
Total 2511 0.00428 7 3 3 Compounds 2209 0.00445 6 3 3
Assays 184 0.00464 15 11 4 Rat proteins 40 0.00266 6 3 3
Human proteins 68 0.00209 4 1 3
3
Total 2511 0.0044 7 3 3 Compounds 2209 0.00445 6 3 3
Assays 184 0.00464 15 11 4 Rat proteins 40 0.00266 6 3 3
Human proteins 68 0.00209 4 1 3
4
Total 2491 0.0046 7 3 3 Compounds 2209 0.00471 6 3 3
Assays 184 0.00449 14 11 4 Rat proteins 40 0.00251 6 2 3
Human proteins 68 0.00209 4 1 3
5
Total 2491 0.0046 7 3 3 Compounds 2209 0.00471 6 3 3
Assays 184 0.00449 14 11 4 Rat proteins 40 0.00251 6 2 3
Human proteins 68 0.00209 4 1 3 a δ = δin + δout = node degree = in-degree + out-degree, Sh1 = Shannon entropy of Markov chain (measure of information).
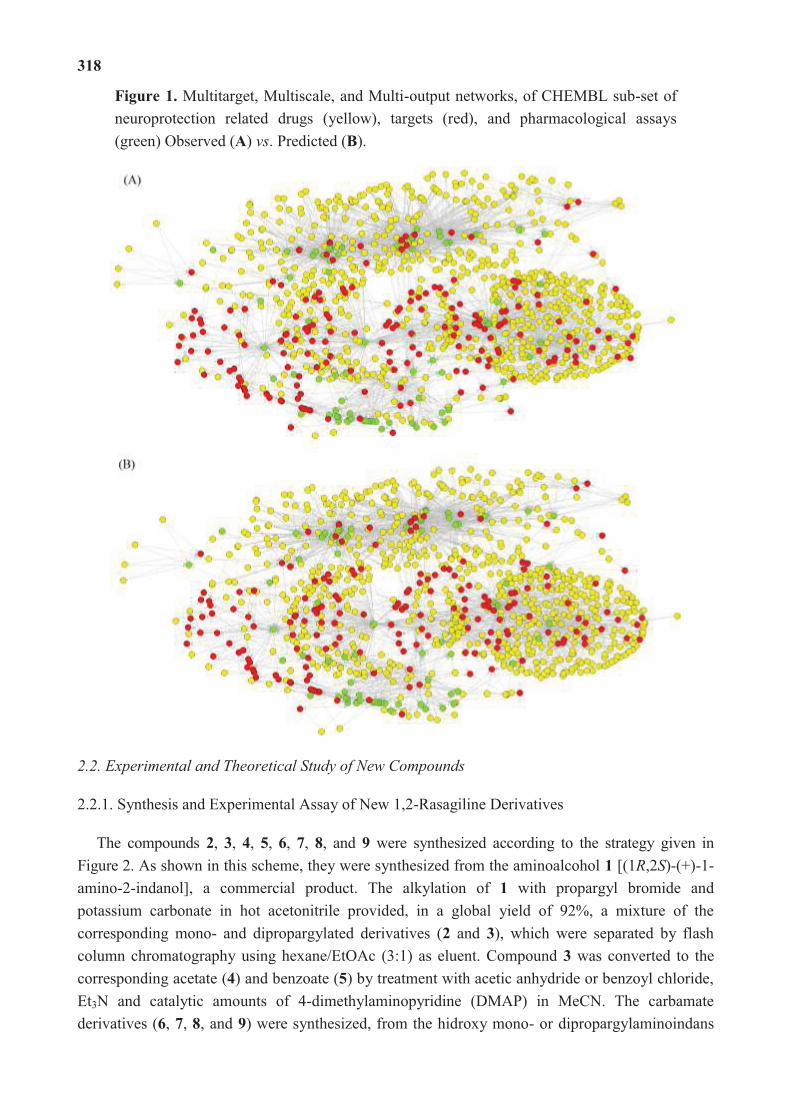
318
Figure 1. Multitarget, Multiscale, and Multi-output networks, of CHEMBL sub-set of neuroprotection related drugs (yellow), targets (red), and pharmacological assays (green) Observed (A) vs. Predicted (B).
2.2. Experimental and Theoretical Study of New Compounds
2.2.1. Synthesis and Experimental Assay of New 1,2-Rasagiline Derivatives
The compounds 2, 3, 4, 5, 6, 7, 8, and 9 were synthesized according to the strategy given in Figure 2. As shown in this scheme, they were synthesized from the aminoalcohol 1 [(1R,2S)-(+)-1-amino-2-indanol], a commercial product. The alkylation of 1 with propargyl bromide and potassium carbonate in hot acetonitrile provided, in a global yield of 92%, a mixture of the corresponding mono- and dipropargylated derivatives (2 and 3), which were separated by flash column chromatography using hexane/EtOAc (3:1) as eluent. Compound 3 was converted to the corresponding acetate (4) and benzoate (5) by treatment with acetic anhydride or benzoyl chloride, Et3N and catalytic amounts of 4-dimethylaminopyridine (DMAP) in MeCN. The carbamate derivatives (6, 7, 8, and 9) were synthesized, from the hidroxy mono- or dipropargylaminoindans

319
(2 and 3), by reaction with the corresponding dialkylcarbamyl chloride in NaH and acetonitrile following the procedure described in the literature [64].
Figure 2. Synthesis of compounds 2–9.
The new compounds synthesized in this work (2, 3, 4, 5, 6, 7, 8, and 9) were subjected to an initial study to determinate its neuroprotective ability in both the presence and the absence of neurotoxic agents (ANA). The method of reduction of the 3-(4,5-dimethylthiazol-2-yl)-2,5-diphenyltetrazolium bromide (MTT) was used to ascertain the cell viability, given by the number of cells present in the culture. The ability of cells to reduce MTT is an indicator of the integrity of mitochondria, and its functional activity is interpreted as a measure of cell viability [65]. Three assays were conducted in a culture of motor cortex neurons of 19-day-old Sprague–Dawley rat embryos. All results are expressed as the mean ± S.E.M. [51,52] of at least three independent experiments (Table 5).
Firstly, we studied the ability to induce a neuroprotective effect in the absence of any neurotoxic stimulation. Secondly, we studied the neuroprotective effect in the presence of glutamate, a compound that causes a pathological process, in which neurons are damaged leading to apoptosis when its receptors, such as the NMDA and AMPA, are over-activated. Lastly, the ability of the compounds synthesized to protect from damage by H2O2, that causes neuronal death by oxidative stress, was analyzed. The results obtained allow to deduce the existence of a moderate neuroprotective effect in the absence of any toxic stimulus, presenting the best results type 6 and 9 carbamate derivatives, with values of 11.5% and 8.4%, respectively, followed by the compound 3, 4, and 7 with values slightly above 4% (see Figure 3).
OH
NH2
OH
HN
OH
N
BrK2CO3MeCN�
Cl NO R
RNaH,�MeCN
O
N
ON
R
RO
HN
ON
R
R
Ac2O�or�BzCl
TEA,�DMAP,�MeCNOR
N
1
2 34,�R�=�Ac5,�R�=�Bz
6,�R�=�Me7,�R�=�Et
8,�R�=�Me9,�R�=�Et

320
Table 5. Neuroprotective ability of the new 1,2-rasagiline derivatives.
Compound Formula % Neuro-Protection
% ANA a e.s.m. Glutamate
b e.s.m. H2O2
c e.s.m.
2
0.0 2.8 0.0 6.5 −2.8 1.2
3
4.7 6.0 −0.2 1.6 −12.3 2.1
4
4.2 6.5 −8.1 4.9 −14.2 2.1
5
1.2 5.0 3.8 5.0 2.9 1.0
6
11.5 8.8 −4.0 5.5 −9.1 2.4
7
4.0 4.5 2.6 3.9 -6.1 1.1
8
−1.7 6.9 −5.2 5.9 −8.9 1.9
9
8.4 10.7 −5.2 2.3 −14.0 2.0
a % protection (comp 5 μM), in the Absence of Neurotoxic Agents (ANA); b % protection (comp 5 μM) against Glutamate 100 μM; c % protection (comp 5 μM) against H2O2 100 μM.
Figure 3. Results of the experimental assay of neuroprotective effect of the new compounds.

321
2.2.2. Using ALMA-Entropy Model to Predicting New Drugs in Other Assays
We used the ALMA-entropy model to predicting the more probable results for all the new rasagiline derivatives synthesized in this work, in >500 assays not carried out experimentally. When the molecular descriptors (entropy indices) of the new rasagiline derivatives were introduced in our model, we obtained the probable interaction with different targets. The model predicts that most of them could interact with the subunits A and B of the 5-hidroxy-tryptamine type 3 receptors (5-HT3Rs), see Table 6. These results seem to be consistent with the literature, since the antagonists of 5-HT3Rs have been related to neuroprotective properties in vitro and in vivo [66]. In fact, this could be a potential mechanism of neuroprotection added to several described mechanisms for rasagiline derivatives [67,68]. Rasagiline is also known for promoting serotoninergic activity by other ways, which is a clinically relevant fact in certain circumstances [69]. All in one highlights the intricate relationships of these drugs with the 5-hidroxy-tryptamine (serotonine) system.
Table 6. Some predictive results for interaction between compound 6 with 5HT3Rs and other targets.
Si(cj) Meassure Assay ID Target ID Target a Neurotoxic Agent
2.097 pA2 617971 1899 5HT3aR ANA 2.097 pA2 617969 1899 5HT3aR ANA 2.097 pA2 617971 3895 5HT3bR ANA 2.097 pA2 617969 3895 5HT3bR ANA 1.78 Selectivity 848737 3568 bNOS H2O2 1.78 Selectivity 840777 3568 bNOS H2O2 1.78 Selectivity 755901 3568 bNOS H2O2 1.17 Activity (%) 866501 2586 nAChRβ-3 H2O2 0.42 pIC50 (nM) 710048 3772 mGluR1 Glu
a nAChRβ-3 = neuronal acethyl-choline receptor β3, mGluR1 = metabotropic glutamate receptor type 1.
In any case, we need to analyze these results with caution. In our previous works [51,52], we predicted with new models and confirmed experimentally that some rasagiline derivatives (similar to the derivatives studied in this work) presented activity over glutamate receptors (GluRs) pathway. In the first of these works [51], we study experimental measures of neuroprotective capacity of new 1,3-rasagiline derivatives. All the compounds, except one of them, had a high protective activity against damage mediated by H2O2. The best one of all, a monopropargyl trans derivative, showed also a high neuroprotective action in all three type of assays. Our first model predicted for this compound high probability of activity in relationship with acetylcholine and GABA, in addition to GluRs. In coincidence, acetylcholine receptors (AChRs) have been associated with neuroprotective proprieties in several recent experimental works, and there are also reports of association of GABA and GluRs with neuroprotective ability [70,71]. Nuritova et al. [72], discussed a neuroprotective strategy involving retrograde release of glutamate.
In our second work [52], we studied two types of substituent groups (propargyl groups attached to the nitrogen and a carbamate or esther group instead of hydroxyl). The compounds also presented two different chirality patterns but with 1,3 substitutions pattern. The compounds of this second series were active experimentally in the absence and presence of neurotoxic agents. The

322
best compound of this second series, a dipropargyl derivative, was predicted to have brain nitric oxide synthase (bNOS) as the most probable target and certain probability of multi-target ligand. Again, bNOS was associated experimentally with neuroprotective action in several works [73,74].
The compounds studied this third work present similar substituent groups and stereochemistry but one 1,2 substitution pattern. Based on the previous results, we should expect a similar experimental activity and predictions. However, in the previous section we shown experimentally that the present set of compounds seems not to be very active over GluRs and the model predicts the higher scores of activity over 5-HT3Rs instead of the expected receptors. As we stated in the previous paragraph, 5-HT3Rs have been related to neuroprotective properties in vitro and in vivo [66]. A plausible hypothesis (pendent of further experimental confirmation) is the variation in receptor affinity (from GluRs to 5-HT3Rs pathway) due to the change from 1,3 to 1,2 substitution pattern. From our point of view, these correspondences between targets that our equations predict, and the references cited from the literature could indicate biological plausibility of our models.
3. Materials and Methods
3.1. Computational Methods
3.1.1. ALMA-Entropy Models
ALMA models may be classified as a general type of model to assessing the links in different systems. They are adaptable to all molecular descriptors and/or graphs invariants or descriptors for complex networks. In general, we refer to a descriptor Di
k of type kth of the ith system (compound or drug di in this case) represented by a matrix M. In fact, in this work we are going to compare the model based on entropy values θi
k of a Markov matrix 1Π with other ALMA models based on other invariants of the same matrix 1Π, or invariants of the bond adjacency matrix 1
B. Consequently, we describe first the general equations of the model using a generic descriptor, or graph theoretical invariant Di
k, and later we give the specific equation for the entropy model based on θik values. The
aim of this model is to link the scores Sij(cq) with the molecular descriptors Dik of a
given compound di and the Box–Jenkins MA operators written in the form of deviation terms ΔDi
k(cq) = Dik – <Di
k(cq)>. The model has the following general form:
3 4
3 4
3 4 3 4� ����
���
��
�
�
�
�
�
�
�
�
�
�
�
�
�
�
�
�
.�.�..��
0.�..��
.�.��
5
1
5
0
5
00
5
1
5
0
5
00
5
1
5
00
'')('
'')('
)(''''''
q
q
k
kqk
iqk
iqk
k
kk
ilk
q
q
k
kqk
ijk
k
kk
ilk
q
kijjk
k
kq
kkqij
cDcpDaDcpaa
cDaDcpaa
cSaSaacS
(5)
The output dependent variable is Sij(cq) = Sij(cl, c2, c3, c4, c5) = Sij(cl, aq, ot, tj, sx). The variable Sij(cq) is a numerical score of the biological activity of the ith drug (di) vs. the jth target measured in one assay carried out under the set of qth conditions cq. Our hypothesis is H0: we can calculate the output Si(cq) as a linear combination of scores. We have two types of scores. The first type are the

323
scores 'Sik = 'ak·p(cl)·iDk that account for the quality of data p(cl) and for contributions of the kth
molecular descriptors to the final activity score Sij(cq). In fact, we used the probability p(c1) = 1.0; 0.75; or 0.5 for data curated in CHEMBL database at levels of expert, intermediate, or auto-curation level, respectively. The second type are scores ''Sij
k(cq>1) = ''ak·ΔDik(cj) for the
contributions of deviations ΔDik(cq) = (Di
k − <Dik(cq)>) of the descriptors of di from the average of
those of active molecules Lij(cq) = 1 for different cq. In general, cj refers to different Multi-output assay conditions, e.g., targets, assays, cellular lines, organisms, organs, etc. In this sense, c0 = is the accuracy of the data for this assay, c1 = au is the assay per se, c2 = ot is the organism that express the target, c3 = tj is the jth cellular or molecular target, and c5 = sx is standard experimental measure of activity. Then, the parameter Di
k and ΔDik(cq) are the input independent variables and Lij(cq) = 1
is the input dependent variable. Here, <Dik(cq)> is the average of the kth descriptors Di
k of all ith compounds considered as active (Lij(cq) = 1) in an assay carry out under the set of conditions cq. The parameters ΔDi
k(cq) are similar to the MA used in time series analysis for Bob–Jenkins ARIMA models and others [42]. This type of MA model has been used before to solve different problems in Cheminformatics before. It means that, firstly, we sum the values of Di
k for all the nj drugs with Lij(cq) = 1 in the assay carry out in the conditions cj. Next, we divide this sum by the number of compounds nj with this condition.
3 4 3 4��
�
�qni
iqk
i
qqk
i cDn
cD1
1 (6)
In this model, we used only one molecular descriptor θi5. This is the Shannon entropy of order
k = 5 calculated with MI. We do not use low-order entropies k = 0, 1, 2, 3, and 4. Accordingly, the general equation is:
3 4
3 4
3 4 3 4� ��
�
�
�
�
�
�
�
�
.�.�..��
0.�..��
.�.��
5
15550
5
15550
5
1
5550
'')('
'')('
)('''')(''
q
iqqk
ilk
q
ijk
il
q
qqijjkliqij
ccpacpaa
cacpaa
cSacSaacS
i
���
�� (7)
This type of moving average or deviation-like models was coined by us as the ALMA models, and has been used before to solve different problems [54,75–77]. In order to seek the model we used the technique Linear Discriminant Analysis (LDA) implemented in the software package STASTICA 6.0 [78]. The statistical parameters used to corroborate the model were: Number of cases in training (N), and overall values of Sp, Sn, and Ac [54].
3.1.2. CHEMBL Dataset
We downloaded from the public database CHEMBL a general data set composed of >8000 Multi-output assay endpoints (results of multiple assays) [33,34]. We assigned a value of the observed (obs) class variable Lij(cq)obs = 1 (active compound) or Lij(cq)obs = 0 (non-active compounds) to every ith drug biologically assayed in different conditions cj. The dataset used to train and validate the model includes N = 3548 statistical cases, formed by Nd = 3091 unique drugs

324
which have been assayed each one in at least one out of 37 possible standard type measures determined in, at least, one out of 493 assays. Each assay involves, in turn, at least one out of 169 molecular or cellular targets expressed in the tissues of at least one out of 11 different organisms (including human).
3.2. Experimental Methods: Chemistry
3.2.1. Synthesis of 1,2-Rasagiline Derivatives
Melting points are uncorrected and were determined in Reichert Kofler Thermopan (Reichert, Vienna, Austria) or in capillary tubes on a Büchi 510 apparatus (BÜCHI Labortechnik AG, Flawil, Switzerland). Infrared spectra were recorded on a JASCO FT/IR-4100 spectrophotometer (JASCO Analytical Instruments, Easton, PA, USA). The 1H-NMR spectra (300 MHz) and 13C-NMR spectra (75 MHz) were recorded in a Bruker AMX spectrometer (Bruker BioSpin Corporation, Fremont, CA, USA), using TMS as internal reference (chemical shifts in δ values, J. in Hz). EI Mass spectra were recorded on a HEWLETT-PACKARD 5988A spectrometer (Hewlett-Packard Company, Palo Alto, CA, USA). FABMS were obtained using MICROMASS AUTOSPEC mass spectrometer (WATERS, Milford, MA, USA) and ESIMS were determined on a BRUKER AMAZON ETD spectrometer (Bruker BioSpin Corporation). We performed microanalyses in a Perkin-Elmer 240B elemental analyzer (PerkinElmer, Waltham, MA, USA) by the Microanalysis Service of the University of Santiago de Compostela. The specific rotation was measured with a PERKIN-ELMER 241 polarimeter (PerkinElmer), and it is expressed in (°) (dm−1) (g−1) (mL). Most of the reactions were monitored by TLC on pre-coated silica gel plates (Merck 60 F254, 0.25 mm, Merck KGaA, Darmstadt, Germany). Synthesized products were purified by flash column chromatography on silica gel (Merck 60, 230–240 mesh, Merck KGaA) and crystallized if necessary. Solvents were dried by distillation prior use.
Compound (3): (1S,2R)-(+)-cis-1-(N-Propargylamino)-2-indanol (2) and (1S,2R)-(+)-cis-1-(N,N-dipropargylamino)-2-indanol. A mixture of 1 (0.20 g, 1.34 mmol), K2CO3 (0.18 g, 1.34 mmol) and MeCN (7 mL) was stirred at room temperature under argon for 5 min. A solution of propargyl bromide (0.3 mL, 2.7 mmol) dissolved in MeCN (2 mL) was added dropwise with stirring. After being stirred for 24 h, the solvent was evaporated and the residue was dissolved in EtOAc (10 mL). The organic layer was washed with NaOH 2N (3 × 10 mL) and dried (Na2SO4). The removal of excess of solvent to give a white solid, that was purified by flash column chromatography using hexane/EtOAc (3:1) as eluent to give, in first place 3 (170 mg, yield 56%) as a white solid and in second place 2 (90 mg, yield 36%) as a white solid.
(+)-cis-2. M.p. 106–108 °C. = +38° (25 °C, 0.25, CHCl3). IR ν = 3277, 2906, 1421, 1339, 1140, 1051, 731 cm−1. 1H NMR (300 MHz, CDCl3) δ = 7.32–7.22 (m, 4H, Harom), 4.51–4.47 (m, 1H, 2-H), 4.31–4.29 (m, 1H, 1-H), 3.69–3.52 (AB system , 1H, J = 17.2 Hz, CH2), 3.68–3.51 (AB system, 1H, J. = 17.2 Hz, CH2), 3.11–2.96 (m, 2H, 3α-H, 3β-H), 2.67 (br. s., 1H, D2O exch., OH), 2.31 (t, 1H, J. = 2.2 Hz, CH). 13C RMN (75 MHz, CDCl3) δ = 141.85 (C-3a), 141.05 (C-7a), 128.17, 126.79, 125.58 and 123.94 (CHarom), 82.27 (C≡CH), 71.90 (C-2), 70.87 (C≡CH), 64.78 (C-1), 39.59 (CH2), 37.16 (C-3). MS (EI): m/z (%): 186 (2) [M−1]+, 168 (5) [M+–H2O], 148

325
(100) [M+–propargyl], 130 (21), 115 (10), 103 (31), 77 (11). Anal. calcd. for C12H13NO (187.24): C 76.98, H 7.00, N 7.48; found C 76.63, H 7.12, N 7.36.
(+)-cis-3. M.p. 106–109 °C. = +72° (25 °C, 0.25, CHCl3). IR ν = 3279, 2894, 1339, 1244, 1137 cm−1. 1H NMR (300 MHz, CDCl3) δ = 7.52–7.50 (m, 1H, 7-H), 7.29–7.18 (m, 3H, 4-H, 5-H, 6-H), 4.52 (dd, 1H, J. = 13.2, 6.9 Hz, 2-H), 4.42–4.40 (m, 1H, 1-H), 3.74 (br. s., 1H, D2O exch., OH), 3.65–3.39 (AB system, 2H, J. = 17.1 Hz, CH2), 3.64–3.38 (AB system, 2H, J. = 17.1 Hz, CH2), 3.24–2.79 (part AB of an ABM system, 2H, JAB = 16.4 Hz, JAM =7.2 Hz, JBM = 6.1 Hz, 3α-H, 3β-H), 2.29 (t, 2H, J. = 2.3 Hz, 2 × CH). 13C RMN (75 MHz, CDCl3) δ = 141.47 (C-3a), 138.15 (C-7a), 128.68, 127.04, 126.65 and 125.46 (CHarom), 80.37 (2 × C≡CH), 72.87 (C-2), 71.39 (2 × C≡CH), 68.37 (C-1), 41.04 (2 × CH2), 40.31 (C-3). MS (EI): m/z (%): 226 (2) [M+1]+, 225 (5) [M+], 224 (4) [M−1]+, 208 (2) [M+–H2O], 186 (100) [(M−1)+–propargyl], 133 (32), 116 (35), 77 (29). Anal. calcd. for C15H15NO (225.29): C 79.97, H 6.71, N 6.22; found C 79.81, H 6.92, N 6.29.
Compound (4): (1S,2R)-(−)-cis-1-(N,N-Dipropargylamino)-2-indanyl acetate. A mixture of 3 (0.08 g, 0.36 mmol), acetic anhydride (66 μL, 0.72 mmol), Et3N (100 μL, 0.72 mmol), DMAP (a catalytic amount) in MeCN (5 mL), under argon, was stirred at room temperature for 3 h. The solvent was removed and the residue was partitioned between EtOAc (10 mL) and H2O (10 mL), and the organic layer was washed with a saturated solution of NaCl (3 × 10 mL), dried (Na2SO4) and evaporated, to give 4 (as a white solid (76 mg, yield 80%). M.p. 52–53 °C. º = −70.6° (25 °C, 0.25, CHCl3). IR ν = 3239, 2890, 1729, 1210, 1035 cm−1. 1H NMR (300 MHz, CDCl3) δ = 7.49–7.46 (m, 1H, 7-H), 7.31–7.21 (m, 3H, 4-H, 5-H, 6-H), 5.68 (dt, 1H, J. = 5.4, 2.4 Hz, 2-H), 4.61 (d, 1H, J. = 5.4 Hz, 1-H), 3.77–3.63 (AB system, 2H, J. = 17.5 Hz, CH2), 3.76–3.62 (AB system, 2H, J. = 17.3 Hz, CH2), 3.17–2.93 (part AB of an ABM system, 2H, JAB = 17.2 Hz, JAM = 5.7 Hz, JBM = 2.5 Hz, 3α-H, 3β-H), 2.21 (t, 2H, J. = 2.4 Hz, 2 × CH), 2.02 (s, 3H, CH3). 13C NMR (75 MHz, CDCl3) δ = 170.40 (COCH3), 140.01 (C-3a), 139.48 (C-7a), 128.07, 126.97, 125.24 and 125.13 (CHarom), 81.21 (2 × C≡CH), 77.04 (C-2), 71.74 (2 × C≡CH), 68.94 (C-1), 39.99 (2 × CH2), 37.68 (C-3), 21.70 (CH3). MS (FAB): m/z (%): 269 (6) [M+2]+, 268 (26) [M+1]+, 225 (2) [M+–acetyl], 197 (18), 169 (12), 154 (88), 137 (100). Anal. calcd. for C17H17NO2 (267.32): C 76.38, H 6.41, N 5.24; found C 76.12, H 6.68, N 5.36.
Compound (5): (1S,2R)-(−)-cis-1-(N,N-Dipropargylamino)-2-indanyl benzoate. To a solution of of 3 (0.08 g, 0.36 mmol), DMAP (a catalytic amount) in MeCN (5 mL), at 0 °C and under argon, was added dropwise a solution of benzoyl chloride (82 μL, 0.72 mmol) and Et3N (100 μL, 0.72 mmol). The mixture was stirred at room temperature for 2 h. the solvent was evaporated and the residue was dissolved in CH2Cl2 (10 mL). The layer organic was washed with a saturated solution of NaCl (3 × 10 mL), dried (Na2SO4) and evaporated, to give a yellow oil that was purified by flash column chromatography using hexane–EtOAc (6:1) as eluent to give 5 (73 mg, yield 73%) as a yellow oil. º = −85.6° (25 °C, 0.25, CHCl3). IR ν = 3289, 2842, 1714, 1267, 1108, 1069 cm−1. 1H NMR (300 MHz, CDCl3) δ = 7.95–7.92 (m, 2H, 2'-H, 6'-H), 7.56–7.50 (m, 7H, 3'-H, 4'-H, 5'-H, 4 × Harom), 6.00 (dt, 1H, J. = 5.6, 2.6 Hz, 2-H), 4.74 (d, 1H, J. = 5.3 Hz, 1-H), 3.75 (d, 4H, J. = 2.3 Hz, 2 × CH2), 3.29–3.06 (part AB of an ABM system, 2H, JAB = 17.0 Hz, JAM = 5.7 Hz, JBM = 2.7 Hz, 3α-H, 3β-H), 2.15 (t, 2H, J. = 2.1 Hz, 2 × CH). 13C NMR (75 MHz, CDCl3) δ = 166.36 (CO), 140.30 (C-3a), 139.81 (C-7a), 133.16 (C'-4), 130.72 (C'-1), 129.83, 128.61,
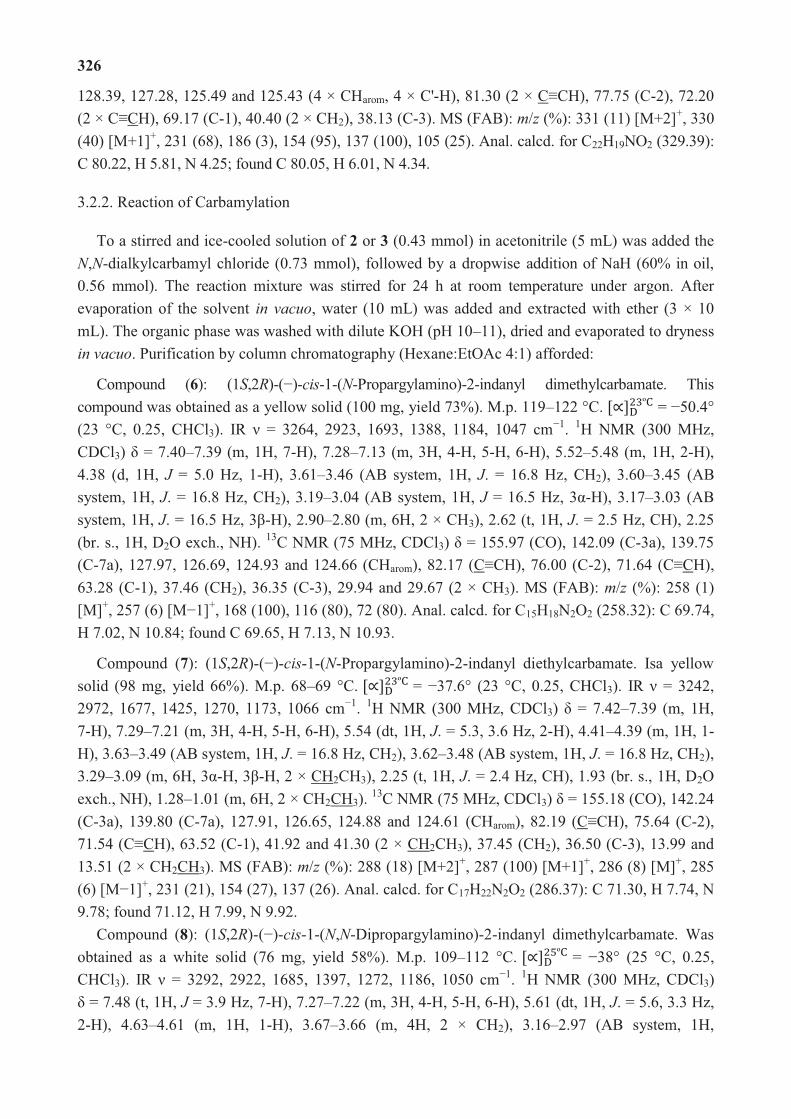
326
128.39, 127.28, 125.49 and 125.43 (4 × CHarom, 4 × C'-H), 81.30 (2 × C≡CH), 77.75 (C-2), 72.20 (2 × C≡CH), 69.17 (C-1), 40.40 (2 × CH2), 38.13 (C-3). MS (FAB): m/z (%): 331 (11) [M+2]+, 330 (40) [M+1]+, 231 (68), 186 (3), 154 (95), 137 (100), 105 (25). Anal. calcd. for C22H19NO2 (329.39): C 80.22, H 5.81, N 4.25; found C 80.05, H 6.01, N 4.34.
3.2.2. Reaction of Carbamylation
To a stirred and ice-cooled solution of 2 or 3 (0.43 mmol) in acetonitrile (5 mL) was added the N,N-dialkylcarbamyl chloride (0.73 mmol), followed by a dropwise addition of NaH (60% in oil, 0.56 mmol). The reaction mixture was stirred for 24 h at room temperature under argon. After evaporation of the solvent in vacuo, water (10 mL) was added and extracted with ether (3 × 10 mL). The organic phase was washed with dilute KOH (pH 10–11), dried and evaporated to dryness in vacuo. Purification by column chromatography (Hexane:EtOAc 4:1) afforded:
Compound (6): (1S,2R)-(−)-cis-1-(N-Propargylamino)-2-indanyl dimethylcarbamate. This compound was obtained as a yellow solid (100 mg, yield 73%). M.p. 119–122 °C. º = −50.4° (23 °C, 0.25, CHCl3). IR ν = 3264, 2923, 1693, 1388, 1184, 1047 cm−1. 1H NMR (300 MHz, CDCl3) δ = 7.40–7.39 (m, 1H, 7-H), 7.28–7.13 (m, 3H, 4-H, 5-H, 6-H), 5.52–5.48 (m, 1H, 2-H), 4.38 (d, 1H, J = 5.0 Hz, 1-H), 3.61–3.46 (AB system, 1H, J. = 16.8 Hz, CH2), 3.60–3.45 (AB system, 1H, J. = 16.8 Hz, CH2), 3.19–3.04 (AB system, 1H, J = 16.5 Hz, 3α-H), 3.17–3.03 (AB system, 1H, J. = 16.5 Hz, 3β-H), 2.90–2.80 (m, 6H, 2 × CH3), 2.62 (t, 1H, J. = 2.5 Hz, CH), 2.25 (br. s., 1H, D2O exch., NH). 13C NMR (75 MHz, CDCl3) δ = 155.97 (CO), 142.09 (C-3a), 139.75 (C-7a), 127.97, 126.69, 124.93 and 124.66 (CHarom), 82.17 (C≡CH), 76.00 (C-2), 71.64 (C≡CH), 63.28 (C-1), 37.46 (CH2), 36.35 (C-3), 29.94 and 29.67 (2 × CH3). MS (FAB): m/z (%): 258 (1) [M]+, 257 (6) [M−1]+, 168 (100), 116 (80), 72 (80). Anal. calcd. for C15H18N2O2 (258.32): C 69.74, H 7.02, N 10.84; found C 69.65, H 7.13, N 10.93.
Compound (7): (1S,2R)-(−)-cis-1-(N-Propargylamino)-2-indanyl diethylcarbamate. Isa yellow solid (98 mg, yield 66%). M.p. 68–69 °C. º = −37.6° (23 °C, 0.25, CHCl3). IR ν = 3242, 2972, 1677, 1425, 1270, 1173, 1066 cm−1. 1H NMR (300 MHz, CDCl3) δ = 7.42–7.39 (m, 1H, 7-H), 7.29–7.21 (m, 3H, 4-H, 5-H, 6-H), 5.54 (dt, 1H, J. = 5.3, 3.6 Hz, 2-H), 4.41–4.39 (m, 1H, 1-H), 3.63–3.49 (AB system, 1H, J. = 16.8 Hz, CH2), 3.62–3.48 (AB system, 1H, J. = 16.8 Hz, CH2), 3.29–3.09 (m, 6H, 3α-H, 3β-H, 2 × CH2CH3), 2.25 (t, 1H, J. = 2.4 Hz, CH), 1.93 (br. s., 1H, D2O exch., NH), 1.28–1.01 (m, 6H, 2 × CH2CH3). 13C NMR (75 MHz, CDCl3) δ = 155.18 (CO), 142.24 (C-3a), 139.80 (C-7a), 127.91, 126.65, 124.88 and 124.61 (CHarom), 82.19 (C≡CH), 75.64 (C-2), 71.54 (C≡CH), 63.52 (C-1), 41.92 and 41.30 (2 × CH2CH3), 37.45 (CH2), 36.50 (C-3), 13.99 and 13.51 (2 × CH2CH3). MS (FAB): m/z (%): 288 (18) [M+2]+, 287 (100) [M+1]+, 286 (8) [M]+, 285 (6) [M−1]+, 231 (21), 154 (27), 137 (26). Anal. calcd. for C17H22N2O2 (286.37): C 71.30, H 7.74, N 9.78; found 71.12, H 7.99, N 9.92.
Compound (8): (1S,2R)-(−)-cis-1-(N,N-Dipropargylamino)-2-indanyl dimethylcarbamate. Was obtained as a white solid (76 mg, yield 58%). M.p. 109–112 °C. º = −38° (25 °C, 0.25, CHCl3). IR ν = 3292, 2922, 1685, 1397, 1272, 1186, 1050 cm−1. 1H NMR (300 MHz, CDCl3) δ = 7.48 (t, 1H, J = 3.9 Hz, 7-H), 7.27–7.22 (m, 3H, 4-H, 5-H, 6-H), 5.61 (dt, 1H, J. = 5.6, 3.3 Hz, 2-H), 4.63–4.61 (m, 1H, 1-H), 3.67–3.66 (m, 4H, 2 × CH2), 3.16–2.97 (AB system, 1H,

327
J. = 16.8 Hz, 3α-H), 3.14–2.96 (AB system, 1H, J. = 16.8 Hz, 3β-H), 2.91–2.81 (m. 6H, 2 × CH3), 2.21 (t, 1H, J. = 2.2 Hz, 2 × CH) 13C NMR (75 MHz, CDCl3) δ = 155.98 (CO), 140.05 (C-3a), 139.82 (C-7a), 127.96, 126.76, 125.39 and 125.10 (CHarom), 81.10 (2 × C≡CH), 77.36 (C-2), 71.91 (2 × C≡CH), 68.31 (C-1), 40.24 (2 × CH2), 37.94 (C-3), 36.49 and 36.14 (2 × CH3). MS (FAB): m/z (%): 298 (19) [M+2]+, 297 (100) [M+1]+, 296 (4) [M]+, 295 (9) [M−1]+, 231 (30), 204 (21), 154 (31), 137 (39). Anal. calcd. for C18H20N2O2 (296.36): C 72.95, H 6.80, N 9.45; found 72.78, H 7.01, N 9.53.
Compound (9): (1S,2R)-(−)-cis-1-(N,N-Dipropargylamino)-2-indanyl diethylcarbamate. This compound was obtained as an oil (70 mg, yield 49%). º = −18.6° (25 °C, 0.25, CHCl3). IR ν = 3292, 2928, 1688, 1425, 1270, 1167, 1062 cm−1. 1H NMR (300 MHz, CDCl3) δ = 7.49 (t, 1H, J = 4.2 Hz, 7-H), 7.28–7.23 (m, 3H, 4-H, 5-H, 6-H), 5.59 (dt, 1H, J. = 5.8, 3.9 Hz, 2-H), 4.62 (d, 1H, J. = 5.8 Hz, 1-H), 3.71–3.57 (m, 4H, 2 × CH2), 3.35–3.23 (m, 4H, 2 × CH2CH3), 3.17–2.98 (AB system, 1H, J. = 16.8 Hz, 3α-H), 3.15–2.97 (AB system, 1H, J = 16.8 Hz, 3β-H), 2.21 (t, 2H, J. = 2.2 Hz, 2 × CH), 1.12–1.01 (m, 6H, 2 × CH2CH3). 13C NMR (75 MHz, CDCl3) δ = 155.21 (CO), 139.98 (C-3a), 139.86 (C-7a), 128.00, 126.74, 125.55 and 125.01 (CHarom), 81.06 (2 × C≡CH), 76.58 (C-2), 71.97 (2 × C≡CH), 67.99 (C-1), 41.65 and 41.12 (2 × CH2CH3), 40.14 (2 × CH2), 37.81 (C-3), 13.97 and 13.47 (2 × CH2CH3). MS (FAB): m/z (%): 326 (20) [M+2]+, 325 (92) [M+1]+, 324 (2) [M]+, 323 (8) [M−1]+, 288 (89), 230 (51), 154 (71), 137 (100). Anal. calcd. for C20H24N2O2 (324.42): C 74.04, H 7.46, N 8.64; found 73.89, H 7.61, N 8.75.
3.3. Experimental Methods: Biology
3.3.1. Culture of Rat Cortical Neurons
Embryos were selected from 19 to 20 days pregnant rats by caesarean section. Meninges were removed and cortex was isolated after the dissection of the brain. The fragments obtained from several embryos were subjected to mechanic digestion. We re-suspended the cells in a Neurobasal medium with 2% B-27. We seeded in 48-well plates at a density of 100,000 cells/mL. Neuronal cultures were allowed to grow for 8–10 days. Incubations with different CSF were done when the microscope showed the existence of a dense neuronal network. Embryos were selected from 19 to 20 days pregnant rats, which were decapitated and embryos were extracted from the womb by caesarean section. Meninges were removed and a portion of motor cortex was isolated after the dissection of the brain. Fragments obtained from several embryos were subjected to mechanic digestion and cells were re-suspended in Neurobasal medium with 2% B-27 and seeded in 48-well plates at a density of 100,000 cells/mL. Neuronal cultures were allowed to grow for 8–10 days and when the microscope showed the existence of a dense neuronal network, incubations with different CSF were done [79].
3.3.2. Measurement of Neuronal Viability
We used the MTT reduction assay following the procedure previously described [65]. After the appropriate incubations with the compounds alone, or co-incubated with 100 μM H2O2 or glutamate, 0.5 mg/mL MTT were added to each well and incubation was performed at 37 °C for 2 h.

328
Formazan salt formed was dissolved in DMSO, and colorimetric determination were performed at 540 nm. Control cells without compounds or toxic stimulus were considered 100% viability. Neuronal viability after exposure to compounds or different treatments was expressed as% of control within each individual experiment. Graph Pad Prism Software (GraphPad Software, San Diego, CA, USA) was used to perform statistical analyses and graphical presentation. Experiments were reproduced at least three times. Data were expressed as mean ± S.E.M. values. Groups were compared by ANOVA/Dunnett’s test. A p-value ≤0.05 was accepted as the limit of statistical significance.
4. Conclusions
We can use Shannon entropy measures to developing predictive models for multi-target networks of neuroprotective/neurotoxic compounds. In doing so, we can use Box–Jenkins operators of molecular descriptors to obtain multi-target, multi-scale, and multi-output models able to predict different outcomes for multiple combinations of output experimental measures, experimental protocols, organisms, and molecular and cellular targets. One of these models has been demonstrated here to be useful as a complementary tool in the organic synthesis and evaluation of the multi-target biological activity of new compounds with potential neuroprotective activity. The model is also a very useful tool to predict complex networks of drug-target interactions with possible applications to the study of non-linear effects in the biological activity of neuroprotective drugs.
Acknowledgments
The authors thank the Xunta de Galicia for financial support of this work under project 07CSA008203PR.
Author Contributions
Synthesis, identification, purification, and characterization of new organic compounds: Xerardo García-Mera, Olga Caamaño, and Nerea Alonso; Pharmacological assays: Matilde Yañez; Data retrieval and preprocessing, cheminformatics calculations, statistical analysis, complex network analysis, predictive study: Francisco J. Romero Durán, Francisco J. Prado-Prado and Humberto González-Díaz; Writing of paper: Francisco J. Romero Durán, Xerardo García-Mera, and Humberto González-Díaz.
Supplementary Information
Supplementary material files which contain detailed lists of the values of parameters are available upon requests to the corresponding author.
Conflict of Interest
The authors declare no conflict of interest.

329
References
1. Mekenyan, O.; Bonchev, D.; Trinajstic, N. Chemical graph theory modeling the thermodynamic properties of molecules. Intern. J. Quantum Chem. Symp. 1980, 18, 369–380.
2. Bonchev, D.; Trinajstic, N. Information theory, distance matrix, and molecular branching. J. Chem. Phys. 1977, 67, 4517–4533.
3. Bonchev, D.; Kamenski, D.; Kamenska, V. Symmetry and information content of chemical structures. Bull. Math. Biol. 1976, 38, 119–133.
4. Kier, L.B. Use of molecular negentropy to encode structure governing biological activity. J. Pharm. Sci. 1980, 69, 807–810.
5. Stahura, F.L.; Godden, J.W.; Bajorath, J. Differential Shannon entropy analysis identifies molecular property descriptors that predict aqueous solubility of synthetic compounds with high accuracy in binary QSAR calculations. J. Chem. Inf. Comput. Sci. 2002, 42, 550–558.
6. Stahura, F.L.; Godden, J.W.; Xue, L.; Bajorath, J. Distinguishing between natural products and synthetic molecules by descriptor Shannon entropy analysis and binary QSAR calculations. J. Chem. Inf. Comput. Sci. 2000, 40, 1245–1252.
7. Roy, K.; Saha, A. Comparative QSPR studies with molecular connectivity, molecular negentropy and tau indicespart I: Molecular thermochemical properties of diverse functional acyclic compounds. J. Mol. Model. 2003, 9, 259–270.
8. Agrawal, V.K.; Khadikar, P.V. Modelling of carbonic anhydrase inhibitory activity of sulfonamides using molecular negentropy. Bioorg. Med. Chem. Lett. 2003, 13, 447–453.
9. Katritzky, A.R.; Lomaka, A.; Petrukhin, R.; Jain, R.; Karelson, M.; Visser, A.E.; Rogers, R.D. QSPR correlation of the melting point for pyridinium bromides, potential ionic liquids. J. Chem. Inf. Comput. Sci. 2002, 42, 71–74.
10. Katritzky, A.R.; Perumal, S.; Petrukhin, R.; Kleinpeter, E. Codessa-based theoretical QSPR model for hydantoin HPLC-RT lipophilicities. J. Chem. Inf. Comput. Sci. 2001, 41, 569–574.
11. Graham, D.J.; Schacht, D. Base information content in organic molecular formulae. J. Chem. Inf. Comput. Sci. 2000, 40, 942.
12. Graham, D.J. Information content in organic molecules: Structure considerations based on integer statistics. J. Chem. Inf. Comput. Sci. 2002, 42, 215.
13. Graham, D.J.; Malarkey, C.; Schulmerich, M.V. Information content in organic molecules: Quantification and statistical structure via brownian processing. J. Chem. Inf. Comput. Sci. 2004, 44, 1601–1611.
14. Graham, D.J.; Schulmerich, M.V. Information content in organic molecules: Reaction pathway analysis via brownian processing. J Chem. Inf. Comput Sci. 2004, 44, 1612–1622.
15. Graham, D.J. Information content and organic molecules: Aggregation states and solvent effects. J. Chem. Inf. Model. 2005, 45, 1223–1236.
16. Graham, D.J. Information content in organic molecules: Brownian processing at low levels. J. Chem. Inf. Model. 2007, 47, 376–389.
17. Strait, B.J.; Dewey, T.G. The Shannon information entropy of protein sequences. Biophys. J. 1996, 71, 148–155.

330
18. Dima, R.I.; Thirumalai, D. Proteins associated with diseases show enhanced sequence correlation between charged residues. Bioinformatics 2004, 20, 2345–2354.
19. Loewenstern, D.; Yianilos, P.N. Significantly lower entropy estimates for natural dna sequences. J. Comput. Biol. 1999, 6, 125–142.
20. Manke, T.; Demetrius, L.; Vingron, M. Lethality and entropy of protein interaction networks. Genome Inform. Ser. 2005, 16, 159–163.
21. Mikolas, P.; Vyhnanek, J.; Skoch, A.; Horacek, J. Analysis of FMRI time-series by entropy measures. Neuro Endocrinol. Lett. 2012, 33, 471–476.
22. Gonzalez-Diaz, H.; Duardo-Sanchez, A.; Ubeira, F.M.; Prado-Prado, F.; Perez-Montoto, L.G.; Concu, R.; Podda, G.; Shen, B. Review of march-inside & complex networks prediction of drugs: ADMET, anti-parasite activity, metabolizing enzymes and cardiotoxicity proteome biomarkers. Curr. Drug Metab. 2010, 11, 379–406.
23. González-Díaz, H.; Molina, R.; Uriarte, E. Markov entropy backbone electrostatic descriptors for predicting proteins biological activity. Bioorg. Med. Chem. Lett. 2004, 14, 4691–4695.
24. González-Díaz, H.; de Armas, R.R.; Molina, R. Markovian negentropies in bioinformatics. 1. A picture of footprints after the interaction of the HIV-1 psi-RNA packaging region with drugs. Bioinformatics 2003, 19, 2079–2087.
25. Riera-Fernandez, P.; Munteanu, C.R.; Escobar, M.; Prado-Prado, F.; Martin-Romalde, R.; Pereira, D.; Villalba, K.; Duardo-Sanchez, A.; Gonzalez-Diaz, H. New Markov–Shannon entropy models to assess connectivity quality in complex networks: From molecular to cellular pathway, parasite-host, neural, industry, and legal-social networks. J. Theor. Biol. 2012, 293, 174–188.
26. Allegri, R.F.; Guekht, A. Cerebrolysin improves symptoms and delays progression in patients with Alzheimer’s disease and vascular dementia. In Drugs Today; 2012 Prous Science, S.A.U. or Its Licensors: Riva, MD, USA, 2012; Volume 48, pp. 25–41.
27. Park, N.H. Parkinson disease. JAAPA 2012, 25, 73–74. 28. Morris, H.R.; Waite, A.J.; Williams, N.M.; Neal, J.W.; Blake, D.J. Recent advances in the
genetics of the ALS–FTLD complex. Curr. Neurol. Neurosci. Rep. 2012, 12, 243–250. 29. Trushina, E.; McMurray, C.T. Oxidative stress and mitochondrial dysfunction in
neurodegenerative diseases. Neuroscience 2007, 145, 1233–1248. 30. Martin, L.J. Biology of mitochondria in neurodegenerative diseases. In Progress in Molecular
Biology and Translational Science; Elsevier Inc.: Amsterdam, The Netherlands, 2012; Volume 107, pp. 355–415.
31. Howells, D.W.; Sena, E.S.; O’Collins, V.; Macleod, M.R. Improving the efficiency of the development of drugs for stroke. Int. J. Stroke 2012, 7, 371–377.
32. Nurisso, A.; Simoes-Pires, C.; Martel, S.; Cressend, D.; Guillot, A.; Carrupt, P.A. How to increase the safety and efficacy of compounds against neurodegeneration? A multifunctional approach. Chimia 2012, 66, 286–290.
33. Heikamp, K.; Bajorath, J. Large-scale similarity search profiling of CHEMBL compound data sets. J. Chem. Inf. Model. 2011, 51, 1831–1839.

331
34. Gaulton, A.; Bellis, L.J.; Bento, A.P.; Chambers, J.; Davies, M.; Hersey, A.; Light, Y.; McGlinchey, S.; Michalovich, D.; Al-Lazikani, B.; et al. Chembl: A large-scale bioactivity database for drug discovery. Nucleic Acids Res. 2012, 40, D1100–D1107.
35. Mok, N.Y.; Brenk, R. Mining the chembl database: An efficient chemoinformatics workflow for assembling an ion channel-focused screening library. J. Chem. Inf. Model. 2011, 51, 2449–2454.
36. Hu, Y.; Bajorath, J. Molecular scaffolds with high propensity to form multi-target activity cliffs. J. Chem. Inf. Model. 2010, 50, 500–510.
37. Erhan, D.; L’Heureux P, J.; Yue, S.Y.; Bengio, Y. Collaborative filtering on a family of biological targets. J. Chem. Inf. Model. 2006, 46, 626–635.
38. Namasivayam, V.; Hu, Y.; Balfer, J.; Bajorath, J. Classification of compounds with distinct or overlapping multi-target activities and diverse molecular mechanisms using emerging chemical patterns. J. Chem. Inf. Model. 2013, 53, 1272–1281.
39. Yildirim, M.A.; Goh, K.I.; Cusick, M.E.; Barabasi, A.L.; Vidal, M. Drug–target network. Nat. Biotechnol. 2007, 25, 1119–1126.
40. Csermely, P.; Korcsmaros, T.; Kiss, H.J.; London, G.; Nussinov, R. Structure and dynamics of molecular networks: A novel paradigm of drug discovery: A comprehensive review. Pharmacol. Ther. 2013, 138, 333–408.
41. Tenorio-Borroto, E.; Garcia-Mera, X.; Penuelas-Rivas, C.G.; Vasquez-Chagoyan, J.C.; Prado-Prado, F.J.; Castanedo, N.; Gonzalez-Diaz, H. Entropy model for multiplex drug–target interaction endpoints of drug immunotoxicity. Curr. Top. Med. Chem. 2013, 13, 1636–1649.
42. Box, G.E.P.; Jenkins, G.M. Time Series Analysis; Holden-Day: San Francisco, CA, USA, 1970; p. 553.
43. Botella-Rocamora, P.; Lopez-Quilez, A.; Martinez-Beneito, M.A. Spatial moving average risk smoothing. Stat. Med. 2013, 32, 2595–2612.
44. Speck-Planche, A.; Kleandrova, V.V.; Cordeiro, M.N. Chemoinformatics for rational discovery of safe antibacterial drugs: Simultaneous predictions of biological activity against streptococci and toxicological profiles in laboratory animals. Bioorg. Med. Chem. 2013, 21, 2727–2732.
45. Speck-Planche, A.; Kleandrova, V.V.; Luan, F.; Cordeiro, M.N. Chemoinformatics in multi-target drug discovery for anti-cancer therapy: In silico design of potent and versatile anti-brain tumor agents. Anticancer Agents Med. Chem. 2012, 12, 678–685.
46. Speck-Planche, A.; Kleandrova, V.V.; Luan, F.; Cordeiro, M.N. Chemoinformatics in anticancer chemotherapy: Multi-target QSAR model for the in silico discovery of anti-breast cancer agents. Eur. J. Pharm. Sci. 2012, 47, 273–279.
47. Vasaikar, S.V.; Padhi, A.K.; Jayaram, B.; Gomes, J. Neurodnet—An open source platform for constructing and analyzing neurodegenerative disease networks. BMC NeuroSci. 2013, 14, 3.
48. Speck-Planche, A.; Kleandrova, V.V.; Luan, F.; Cordeiro, M.N. Multi-target inhibitors for proteins associated with Alzheimer: In silico discovery using fragment-based descriptors. Curr. Alzheimer Res. 2013, 10, 117–124.

332
49. Speck-Planche, A.; Luan, F.; Cordeiro, M.N. Role of ligand-based drug design methodologies toward the discovery of new anti-Alzheimer agents: Futures perspectives in fragment-based ligand design. Curr. Med. Chem. 2012, 19, 1635–1645.
50. Marzaro, G.; Chilin, A.; Guiotto, A.; Uriarte, E.; Brun, P.; Castagliuolo, I.; Tonus, F.; Gonzalez-Diaz, H. Using the tops-mode approach to fit multi-target QSAR models for tyrosine kinases inhibitors. Eur. J. Med. Chem. 2011, 46, 2185–2192.
51. Luan, F.; Cordeiro, M.N.; Alonso, N.; Garcia-Mera, X.; Caamano, O.; Romero-Duran, F.J.; Yanez, M.; Gonzalez-Diaz, H. Tops-mode model of multiplexing neuroprotective effects of drugs and experimental-theoretic study of new 1,3-rasagiline derivatives potentially useful in neurodegenerative diseases. Bioorg. Med. Chem. 2013, 21, 1870–1879.
52. Alonso, N.; Caamano, O.; Romero-Duran, F.J.; Luan, F.; Dias Soeiro Cordeiro, M.N.; Yanez, M.; Gonzalez-Diaz, H.; Garcia-Mera, X. Model for high-throughput screening of multi-target drugs in chemical neurosciences; synthesis, assay and theoretic study of rasagiline carbamates. ACS Chem. NeuroSci. 2013, 4, 1393–1403.
53. Gerets, H.H.; Dhalluin, S.; Atienzar, F.A. Multiplexing cell viability assays. Methods Mol. Biol. 2011, 740, 91–101.
54. Hill, T.; Lewicki, P. Statistics Methods and Applications. A Comprehensive Reference for Science, Industry and Data Mining; StatSoft: Tulsa, OK, USA, 2006; Volume 1, p. 813.
55. Patankar, S.J.; Jurs, P.C. Classification of inhibitors of protein tyrosine phosphatase 1b using molecular structure based descriptors. J. Chem. Inf. Comput. Sci. 2003, 43, 885–899.
56. Garcia-Garcia, A.; Galvez, J.; de Julian-Ortiz, J.V.; Garcia-Domenech, R.; Munoz, C.; Guna, R.; Borras, R. New agents active against mycobacterium avium complex selected by molecular topology: A virtual screening method. J. Antimicrob. Chemother. 2004, 53, 65–73.
57. Marrero-Ponce, Y.; Castillo-Garit, J.A.; Olazabal, E.; Serrano, H.S.; Morales, A.; Castanedo, N.; Ibarra-Velarde, F.; Huesca-Guillen, A.; Sanchez, A.M.; Torrens, F.; et al. Atom, atom-type and total molecular linear indices as a promising approach for bioorganic and medicinal chemistry: Theoretical and experimental assessment of a novel method for virtual screening and rational design of new lead anthelmintic. Bioorg. Med. Chem. 2005, 13, 1005–1020.
58. Casanola-Martin, G.M.; Marrero-Ponce, Y.; Khan, M.T.; Ather, A.; Sultan, S.; Torrens, F.; Rotondo, R. Tomocomd-cardd descriptors-based virtual screening of tyrosinase inhibitors: Evaluation of different classification model combinations using bond-based linear indices. Bioorg. Med. Chem. 2007, 15, 1483–1503.
59. Casanola-Martin, G.M.; Marrero-Ponce, Y.; Khan, M.T.; Khan, S.B.; Torrens, F.; Perez-Jimenez, F.; Rescigno, A.; Abad, C. Bond-based 2D quadratic fingerprints in QSAR studies: Virtual and in vitro tyrosinase inhibitory activity elucidation. Chem. Biol. Drug Des. 2010, 76, 538–545.
60. Csermely, P.; Nussinov, R.; Szilagyi, A. From allosteric drugs to allo-network drugs: State of the art and trends of design, synthesis and computational methods. Cur. Topics Med. Chem. 2013, 13, 2–4.
61. Mueller, R.; Rodriguez, A.L.; Dawson, E.S.; Butkiewicz, M.; Nguyen, T.T.; Oleszkiewicz, S.; Bleckmann, A.; Weaver, C.D.; Lindsley, C.W.; Conn, P.J.; et al. Identification of metabotropic glutamate receptor subtype 5 potentiators using virtual high-throughput screening. ACS Chem. NeuroSci. 2010, 1, 288–305.

333
62. Szilagyi, A.; Nussinov, R.; Csermely, P. Allo-network drugs: Extension of the allosteric drug concept to protein–protein interaction and signaling networks. Curr. Top. Med. Chem. 2013, 13, 64–77.
63. Junker, B.H.; Koschutzki, D.; Schreiber, F. Exploration of biological network centralities with centibin. BMC Bioinform. 2006, 7, 219.
64. Sterling, J.; Herzig, Y.; Goren, T.; Finkelstein, N.; Lerner, D.; Goldenberg, W.; Miskolczi, I.; Molnar, S.; Rantal, F.; Tamas, T.; et al. Novel dual inhibitors of ache and MAO derived from hydroxy aminoindan and phenethylamine as potential treatment for Alzheimer’s disease. J. Med. Chem. 2002, 45, 5260–5279.
65. Mosmann, T. Rapid colorimetric assay for cellular growth and survival: Application to proliferation and cytotoxicity assays. J. Immunol. Methods 1983, 65, 55–63.
66. Fakhfouri, G.; Rahimian, R.; Ghia, J.E.; Khan, W.I.; Dehpour, A.R. Impact of 5-ht(3) receptor antagonists on peripheral and central diseases. Drug Discov. Today 2012, 17, 741–747.
67. Mandel, S.; Weinreb, O.; Amit, T.; Youdim, M.B. Mechanism of neuroprotective action of the anti-parkinson drug rasagiline and its derivatives. Brain Res. Brain Res. Rev 2005, 48, 379–387.
68. Naoi, M.; Maruyama, W.; Inaba-Hasegawa, K. Revelation in the neuroprotective functions of rasagiline and selegiline: The induction of distinct genes by different mechanisms. Expert Rev. Neurother. 2013, 13, 671–684.
69. Fernandes, C.; Reddy, P.; Kessel, B. Rasagiline-induced serotonin syndrome. Mov. Disord. 2011, 26, 766–767.
70. Iwamoto, K.; Mata, D.; Linn, D.M.; Linn, C.L. Neuroprotection of rat retinal ganglion cells mediated through α7 nicotinic acetylcholine receptors. Neuroscience 2013, 237, 184–198.
71. Pera, M.; Camps, P.; Munoz-Torrero, D.; Perez, B.; Badia, A.; Clos Guillen, M.V. Undifferentiated and differentiated pc12 cells protected by huprines against injury induced by hydrogen peroxide. PLoS One 2013, 8, e74344.
72. Nuritova, F.; Frenguelli, B.G. Putative depolarisation-induced retrograde signalling accelerates the repeated hypoxic depression of excitatory synaptic transmission in area ca1 of rat hippocampus via group i metabotropic glutamate receptors. In Neuroscience, 2012 IBRO; Elsevier Ltd.: Waltham, MA, USA, 2012; Volume 222, pp. 159–172.
73. Sharma, H.S. A combination of tumor necrosis factor-α and neuronal nitric oxide synthase antibodies applied topically over the traumatized spinal cord enhances neuroprotection and functional recovery in the rat. Ann. N. Y. Acad. Sci. 2010, 1199, 175–185.
74. Drury, P.P.; Davidson, J.O.; van den Heuij, L.G.; Tan, S.; Silverman, R.B.; Ji, H.; Blood, A.B.; Fraser, M.; Bennet, L.; Gunn, A.J. Partial neuroprotection by nNOS inhibition during profound asphyxia in preterm fetal sheep. Exp. Neurol. 2013, 250, 282–292.
75. Concu, R.; Dea-Ayuela, M.A.; Perez-Montoto, L.G.; Prado-Prado, F.J.; Uriarte, E.; Bolas-Fernandez, F.; Podda, G.; Pazos, A.; Munteanu, C.R.; Ubeira, F.M.; et al. 3D entropy and moments prediction of enzyme classes and experimental–theoretic study of peptide fingerprints in leishmania parasites. Biochim. Biophys. Acta 2009, 1794, 1784–1794.

334
76. Speck-Planche, A.; Kleandrova, V.V.; Luan, F.; Cordeiro, M.N. Multi-target drug discovery in anti-cancer therapy: Fragment-based approach toward the design of potent and versatile anti-prostate cancer agents. Bioorg. Med. Chem. 2011, 19, 6239–6244.
77. Tenorio-Borroto, E.; Penuelas Rivas, C.G.; Vasquez Chagoyan, J.C.; Castanedo, N.; Prado-Prado, F.J.; Garcia-Mera, X.; Gonzalez-Diaz, H. Ann multiplexing model of drugs effect on macrophages; theoretical and flow cytometry study on the cytotoxicity of the anti-microbial drug G1 in spleen. Bioorg. Med. Chem. 2012, 20, 6181–6194.
78. Statistica (Data Analysis Software System), Version 6.0. Available online: http://www.statsoft.com (accessed on 2002).
79. Yanez, M.; Galan, L.; Matias-Guiu, J.; Vela, A.; Guerrero, A.; Garcia, A.G. Csf from amyotrophic lateral sclerosis patients produces glutamate independent death of rat motor brain cortical neurons: Protection by resveratrol but not riluzole. In Brain Research; Elsevier B.V: Amsterdam, The Netherlands, 2011; Volume 1423, pp. 77–86.

MDPI AG Klybeckstrasse 64
4057 Basel, Switzerland Tel. +41 61 683 77 34 Fax +41 61 302 89 18 http://www.mdpi.com/
IJMS Editorial Office E-mail: [email protected]
http://www.mdpi.com/journal/ijms


MDPI • Basel • Beijing • Wuhan ISBN 978-3-906980-84-3www.mdpi.com