molecular characterization of the freshwater snail
TRANSCRIPT

University of New MexicoUNM Digital Repository
Biology ETDs Electronic Theses and Dissertations
12-1-2013
Molecular characterization of the freshwater snailPhysella acuta.Journey R. Nolan
Follow this and additional works at: https://digitalrepository.unm.edu/biol_etds
This Thesis is brought to you for free and open access by the Electronic Theses and Dissertations at UNM Digital Repository. It has been accepted forinclusion in Biology ETDs by an authorized administrator of UNM Digital Repository. For more information, please contact [email protected].
Recommended CitationNolan, Journey R.. "Molecular characterization of the freshwater snail Physella acuta.." (2013). https://digitalrepository.unm.edu/biol_etds/87

i
Journey R. Nolan Candidate Biology Department This thesis is approved, and it is acceptable in quality and form for publication: Approved by the Thesis Committee: Dr. Coenraad M. Adema , Chairperson Dr. Stephen Stricker Dr. Cristina Takacs-Vesbach

ii
Molecular characterization of the freshwater
snail Physella acuta.
by
JOURNEY R. NOLAN
B.S., BIOLOGY, UNIVERSITY OF NEW MEXICO, 2009 M.S., BIOLOGY, UNIVERSITY OF NEW MEXICO, 2013
THESIS
Submitted in Partial Fulfillment of the Requirements for the Degree of
Masters of Science
Biology
The University of New Mexico,
Albuquerque, New Mexico
DECEMBER 2013

iii
ACKNOWLEDGEMENTS
I would like to thank Dr. Sam Loker and Dr. Bruce Hofkin for undergraduate
lectures at UNM that peaked my interest in invertebrate biology. I would also like to
thank Dr. Coen Adema for recommending a work-study position in his lab in 2009,
studying parasitology, and for his continuing mentoring efforts to this day. The position
was influential in my application to UNM PREP within the Department of Biology and
would like to thank the mentors Dr. Richard Cripps and Antonio Bañuelos and
acknowledge support from NIH R25 GM075149 while in PREP.
During my time as a Research Assistant and later as a graduate student, I would
like to thank the members of the Adema Lab, Janeth Peña and Jonathan Schultz, for
helpful discussions as well as all the members (present and past) of the Parasitology
group for interesting paper discussions. I would like to thank Sarah Buddenborg for her
training in molecular techniques as well as discussion. Amanda Fingaro, my
undergraduate study, also collected RNA that I used for the 454 transcriptomic sequence
validation. Lastly, I would like to thank my committee members Dr. Stephen Stricker
and Dr. Cristina Takacs-Vesbach for support and guidance. I would also like to
acknowledge financial support by the UNM Biology department from teaching
assistantships.
For submission of my manuscript, I want to thank my co-authors Dr. Adema and
Dr. Bergthorssen. Dr. Sara V. Brant (CETI, UNM) who provided the field collected
physid snails that were used to start the two isolates now maintained in the lab. Dr.
Jeffrey C. Nekola (UNM) provided helpful discussion and contributed primers for
nuclear ITS1 and ITS2 regions.

iv
Molecular characterization of the freshwater
snail Physella acuta. by
JOURNEY R. NOLAN
B.S., BIOLOGY, UNIVERSITY OF NEW MEXICO, 2009 M.S., BIOLOGY, UNIVERSITY OF NEW MEXICO, 2013
ABSTRACT
Current insights into general animal biology, including immune function, are
derived mostly from a few model organisms, a necessity imposed by effort required for
in-depth studies. Modern next-generation sequencing (NGS) enables genomics-level
investigations to test whether specific aspects of biology are general or unique across
animal phylogeny. Meaningful comparisons require thorough identification of
phylogenetically-relevant species. To provide a touchstone for Biomphalaria glabrata, a
freshwater snail that is a major study model for invertebrate immunity, physid snails
(Physidae; Hygrophila; Panpulmonata; Gastropoda; Mollusca) will be developed as a
model for comparative immunogenomics. Chapter 1 introduces current research
capabilities and details the rationale behind developing a physid as a comparative model
for B. glabrata. Chapter 2, submitted as a manuscript to the Journal of Molluscan Studies,
describes the molecular characterization that was performed for species identification and
confirms taxonomic placement of physid snails relative to B. glabrata. Comparative

v
mitogenomics revealed high levels of intraspecific sequence divergence between the
entire mitochondrial genomes of the two P. acuta isolates, identified a unique gene order,
and compared substitutions rates of gene sequences from the mitochondrial genomes of
other gastropods. Additional materials are provided in the Appendices; Appendix A
provides supplemental information for Chapter 2 and Appendix B provides a report of
preliminary results from NGS-based gene discovery for initial characterization of the
immune response of P. acuta to bacterial exposure toward comparative immunogenomics.
Results from this thesis support continuing efforts to develop P. acuta as a comparative
immunogenomic model to B. glabrata.

vi
TABLE OF CONTENTS
LIST OF FIGURES.........................................................................................................vii
LIST OF TABLES..........................................................................................................viii
CHAPTER 1 INTRODUCTION......................................................................................1
CHAPTER 2 SUBMITTED MANUSCRIPT…………................................................15
Abstract. ......................................................................................................................15
Background..................................................................................................................16
Methods and Materials ................................................................................................18
Results……..................................................................................................................26
Discussion....................................................................................................................36
APPENDICES..................................................................................................................45
A1……. ......................................................................................................................45
A2…………................................................................................................................46
B1. Preliminary Report on Transcriptomic Results.....................................................47
Background............................................................................................................47
Methods and Materials..........................................................................................49
Results...................................................................................................................50
Discussion..............................................................................................................51
Figures and Tables for Appendix B1.....................................................................53
Sequence Alignments for B1……….....................................................................56
REFERENCES.................................................................................................................64
vii
LIST OF FIGURES
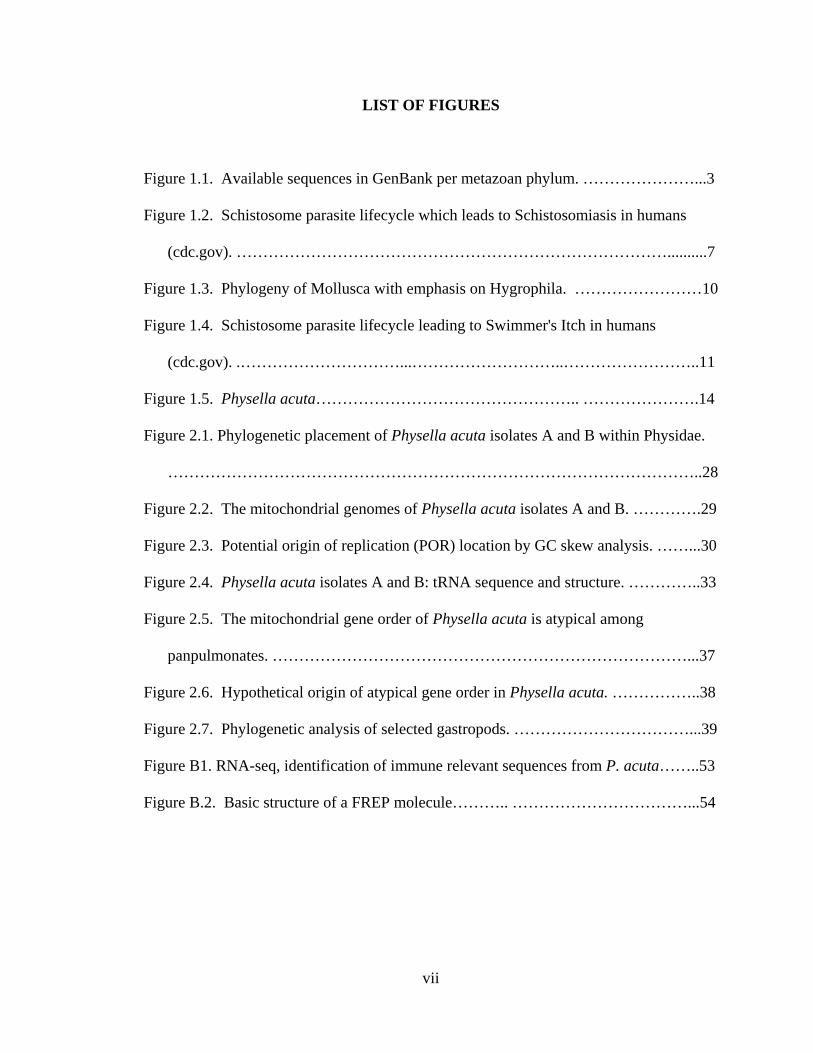
Figure 1.1. Available sequences in GenBank per metazoan phylum. …………………...3
Figure 1.2. Schistosome parasite lifecycle which leads to Schistosomiasis in humans
(cdc.gov). ………………………………………………………………………..........7
Figure 1.3. Phylogeny of Mollusca with emphasis on Hygrophila. ……………………10
Figure 1.4. Schistosome parasite lifecycle leading to Swimmer's Itch in humans
(cdc.gov). .…………………………...………………………..……………………..11
Figure 1.5. Physella acuta………………………………………….. ………………….14
Figure 2.1. Phylogenetic placement of Physella acuta isolates A and B within Physidae.
………………………………………………………………………………………..28
Figure 2.2. The mitochondrial genomes of Physella acuta isolates A and B. ………….29
Figure 2.3. Potential origin of replication (POR) location by GC skew analysis. ……...30
Figure 2.4. Physella acuta isolates A and B: tRNA sequence and structure. …………..33
Figure 2.5. The mitochondrial gene order of Physella acuta is atypical among
panpulmonates. ……………………………………………………………………...37
Figure 2.6. Hypothetical origin of atypical gene order in Physella acuta. ……………..38
Figure 2.7. Phylogenetic analysis of selected gastropods. ……………………………...39
Figure B1. RNA-seq, identification of immune relevant sequences from P. acuta……..53
Figure B.2. Basic structure of a FREP molecule……….. ……………………………...54

viii
LIST OF TABLES
Table 2.1. Table of primers used to characterize the mitochondrial genomes of Physella
acuta. ………………………………………………………………………………...22
Table 2.2. Physella acuta isolates A and B, comparison of mitochondrial genes. ……...31
Table 2.3. Different codon usage in the mitochondrial genomes of two Physella acuta
isolates. ……………………………………………………………………………...35
Table 2.4. Non-synonymous per synonymous (dN/dS) substitution ratios, comparing P.
acuta to other gastropods. …………………………………………………………...41
Table B.1. Transcript validation by RT-PCR and direct sequencing.…………………..55

1
CHAPTER 1
Introduction
Molecular techniques are powerful tools that facilitate the study of genomics,
analyzing of the genetic code of DNA. This is one important approach to learn about
general biology of organisms, complimenting ecological and biochemical approaches.
The term molecular biology, or the study of the molecular basis of biological activity,
was coined in 1938 by Warren Weaver, an important early advocate for medical,
molecular, and genomic research [Rees, 1987]. Another important figure in development
of molecular biology was Linus Pauling who is well known for his publication of a
molecular basis of sickle-cell anemia [Pauling et al., 1949]. Moreover, Pauling’s work
from the mid 1940’s into the 1950’s contributed significant insights in the field of
chemistry, for which he won the Nobel Prize in 1954, and in structural biology [Goertzel
& Goertzel, 1995], one of which related to the structure of DNA, unknown in this era. In
response to Pauling’s hypothesis on DNA structure, Rosalind Franklin used X-ray
diffraction to show DNA molecules existed as a double helix (under supervision of
Wilkins, 1952) which was confirmed and published by Watson and Crick in 1953 [Sayre,
1975; Watson & Crick, 1953]. These works enabled the advancement of molecular
techniques that lead to Sanger sequencing [Sanger & Coulson, 1977]. Subsequent
development of large scale sequencing and bioinformatics, in short, genomics,
dramatically changed our abilities to characterize organisms and their biology. Today,
we have sequenced the entire genome of humans [Venter et al., 2001] and hundreds of
other organisms [NCBI, 2013]. The insights resulting from genomics are considerable

2
and we are even having preliminary success with gene therapy to cure devastating
diseases of humans [Cartier & Aubourg, 2009; Maguire et al., 2008; Fisher et al., 2010;
Lewitt et al., 2011]. Previous genome sequencing efforts focused on mostly humans and
other model organisms such as Drosophila melanogaster (fruit fly) [Adams et al., 2000]
and Caenorhabditis elegans; this free-living nematode was the first multi-cellular
organism to have a nuclear genome sequenced [The C. elegans Sequencing Consortium,
1998]. Advancements in sequencing, such as next-generation sequencing (NGS), permit
genomic level exploration of organisms additionally to human and other model
organisms for comparative studies.
Comparative genomic studies across animal phylogeny have provided significant
insights into animal biology [Pires-daSilva & Sommer, 2003; Olson & Varki, 2003; Korf,
2004; Gross et al., 2007; King et al., 2008; Alföldi & Lindlad-Toh, 2013; Yuen et al.,
2013]. In Figure 1.1, a phylogeny of Metazoa is provided along with the number of
sequence entries available in GenBank [Bensen et al., 2013] for each phylum. The
phylum Chordata contains the subphylum Vertebrata which incorporates vertebrates and
thus humans. The importance of collecting sequence data for medical and veterinarian
reasons partly explains why the majority of sequencing efforts have been directed at this
phylum (72,487,939 entries; GenBank – November, 2013). The number of sequences
from only humans (Homo sapiens) accounts for 18.9 million entries, but is still more than
all the sequence entries from invertebrates combined.
The study of immunology has benefited from advancements made in molecular
techniques and comparative studies, but in general, the immune function of invertebrates
remains understudied [Loker et al., 2004]. Sequence data from GenBank also include

3
expressed sequence tags (ESTs), which result from transcriptomic analyses that provide
insight into immune responses. The use of microarrays is an informative method for
determining expression profiles [Granjeau et al., 1999]. Microarrays can be designed
based on previously identified sequences even though the function of the sequences may
not be known. Next-generation sequencing efforts have greatly increased the available
sequences from non-model organisms. Additionally, pyrosequencing (454) and Illumina
HEMICHORDATA
ONYCHOPHORA
CHORDATA
ARTHROPODA
TARDIGRADA
NEMATODA
PRIAPULIDA
KINORHYNCHA
BRYOZOA
BRACHIOPODA
ANNELIDA
MOLLUSCA
CNIDARIA
CTENOPHORA
PORIFERA
CHAETOGNATHS
NEMERTEA
ECHINODERMATA
NEMATOMORPHA
PLATYHELMITHES
ACANTHOCEPHALA
METAZOAN PHYLOGENY
1
2
3
4
5
0 10 20 30 40 50 60 70 80
GenBank sequences (millions)
H. sapiens
XENACOELOMORPHA
Figure 1.1. Available sequences in GenBank per metazoan phylum. The number of nucleotide and EST entries (in millions) is provided in a horizontal bar graph next to the respective phylum. Metazoan phylogeny based on morphological and molecular data [Halanych & Passamaneck, 2001; Jenner, 2004; Philippe et al., 2011]. The greatest number of sequence entries available is from the phylum Chordata. The lighter blue bar within the Chordata sequences represent the number of sequence entries contributed from H. sapiens alone. Nodes with dark blue squares represent the following clades of animals; (1) Bilateria, (2) Deuterostomia, (3) Protostomia, (4) Ecdysozoa, (5) Lophotrochozoa. Additional shading of nodes 4 and 5 has been done to clarify protostome taxonomic clades.

4
NGS methods can yield now over a million or over two billion sequences reads per run,
respectively, from either whole genome or whole transcriptomes without prior knowledge
of an organism’s genomic information [Liua et al., 2012; Quail et al., 2012] . The
identification of relevant immune gene homologs can greatly benefit from NGS; easier
access to a higher yield of sequences may lead to increased sampling from a broader
taxonomic range for comparative genomic and transcriptomic studies.
Generally, our insights into invertebrate immunology are modest. As stated by
Loker et al. [2004], invertebrates are a heterogeneous group of animals with diverse
evolutionary histories. Consider the phylum Chordata (Figure 1.1), it includes both
vertebrates and invertebrates (lacking vertebra) such as Tunicata (tunicates) and
Cephalochordata (lancets). These invertebrates are represented a modest number of
sequence entries (2,162,602). Every other animal phylum solely consists of invertebrate
animals. There are the pre-bilateral invertebrates (Porifera, Ctenophora, and Cnidaria)
and the invertebrates with bilateral symmetry (node 1, Fig. 1.1). Animals with bilateral
symmetry are further divided based on patterns of embryonic development. In
Deuterostomia, animal embryos develop the anus first versus the “mouth first”
development in animals of Protostomia. The orientation of cellular division differs;
deuterostomes have radial cleavage versus spiral cleavage in protostomes [Pechenik,
2005]. Additionally in deuterostomes, cellular differentiation appears to happen at later
stage of cell division, the coelom uniformly has three pairs of coelomic pouches, and the
mesodermal tissue(s) is found in different locations within the coelom [Pechenik, 2005].
Two major clades of invertebrates exist within Protostomia, the ecdysozoans and the
lophotrochozoans. Ecdysozoan animals typically are surrounded by a protective cuticle

5
which are shed or molted and they have amoeboid-like sperm [Pechenik, 2005]. The
majority of insights into invertebrate immunity have been derived from ecdysozoan
animals. The clade Ecdysozoa contains the largest and most diverse phylum of animals,
Arthropoda, that incorporates insects, crustaceans, arachnids, etc. [Pechenik, 2005]. This
phylum has also yielded a large number of sequence entries from invertebrate animals
(Fig. 1.1). For instance, studies of D. melanogaster have yielded significant
evolutionary insights such as the discovery of Toll-like receptors revealing conserved
receptors and signaling pathways for immune activation in both invertebrates and
vertebrates [Lemaitre et al., 1996; Medzhitov et al., 1997]. Other insects that are models
of immunology studies are those involved in transmission of devastating diseases such as
mosquitoes (Malaria, West Nile, Yellow Fever, Lymphatic Filariasis), kissing bugs
(Chagas’ disease), and sandflies (Leishmaniasis) [Roberts & Janovy, 2005] to name a few.
Crustaceans that are an important food source, especially those produced in large scale by
aquaculture, have been used as models for studies of invertebrate immunology [Kang et
al., 2004; Vazquez et al., 2009; Wang and Wang, 2013]. Lastly, the phylum Nematoda,
which includes C. elegans, is highly studied as many of the animals are parasitic to
humans such as the hookworm, pinworm, Ascaris spp., and filarial worms which can
cause elephantiasis and river blindness [Roberts & Janovy, 2005]. The other clade of
protostomes, the lophotrochozoans, is typically characterized by either existence of
ciliated mouth tentacles (lophophore) or ciliated larva (trochophore). The apparent
artificial grouping of lophotrochozoan animals together into a single clade is supported
by molecular analysis of nuclear sequences [Philippe et al., 2005]. Lophotrochozoa
contain several phyla, some of these are listed here. Platyhelminthes contains free living

6
and parasitic flatworms and this phylum is a source of a significant number of sequence
entries in GenBank. Many species from the phylum Mollusca are also subject to gene
discovery efforts; many mollusks are important food sources (squid, octopus, mussels,
and snails), on the other hand, many mollusks can transmit parasitic diseases. Compared
to Ecdysozoa, there have been fewer efforts toward sequence characterization from the
Lophotrochozoa clade (Fig. 1.1) and fewer models exist for immunological studies
[Deleury et al., 2012].
General knowledge of invertebrates and invertebrate immunology is important;
many invertebrate parasites (phylum Nematoda and Platyhelminthes) have complicated
lifecycles that may involve obligate development in invertebrates host species that can
transmit the parasite to a vertebrate host, including humans. The successful development
and transmission of a particular parasite is challenged by the immune response mounted
by the invertebrate host upon invasion. Numerous studies are available on this issue of
compatibility, the successful or unsuccessful parasite infection on invertebrate hosts,
especially when humans are involved in the parasite lifecycle. One example is the study
of the immune response of freshwater snails against schistosome parasites. Schistosomes
are flatworm parasites that cause the human disease schistosomiasis. Schistosomiasis
affects over 200 million people worldwide and associates with considerable morbidity
[King et al., 2005]. The impact of schistosomiasis on global human health is second only
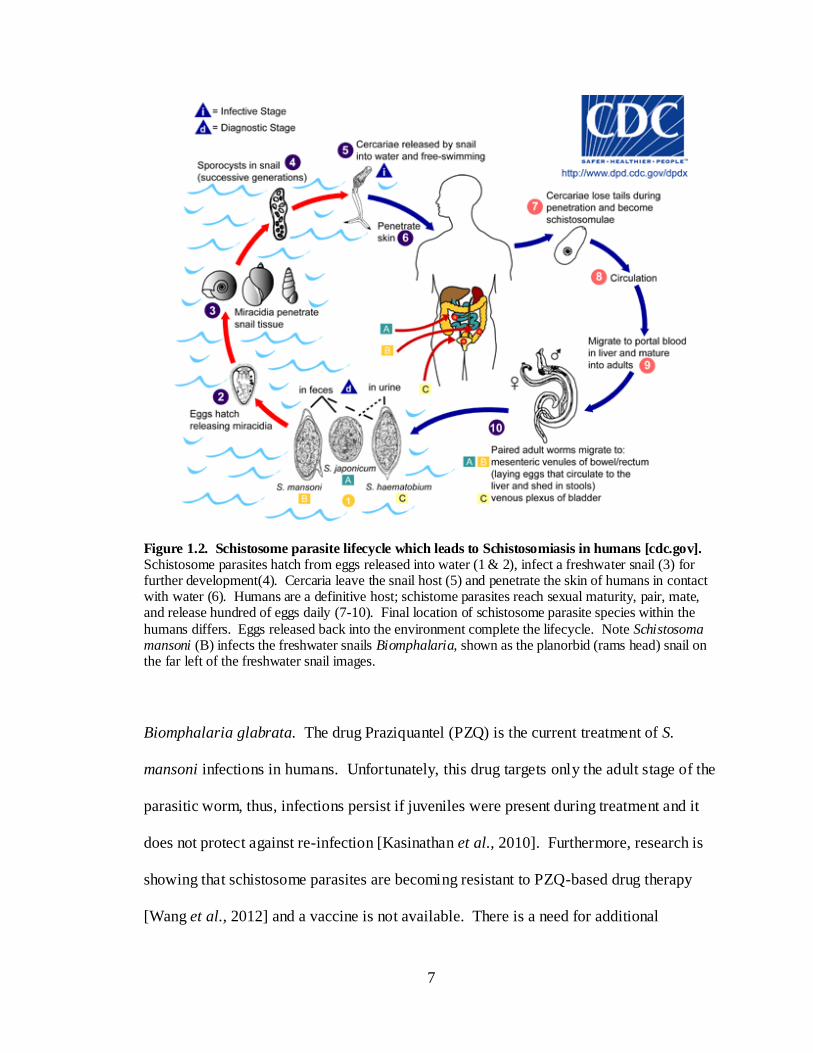
to malaria [WHO, 2013]. Figure 1.2 shows the indirect lifecycle of three different
species of schistomes that infect humans. Each involves obligate development in their
respective freshwater snail host species before entry into a human host. One example
shown is transmission of Schistosoma mansoni along with the obligate intermediate host,
7
Figure 1.2. Schistosome parasite lifecycle which leads to Schistosomiasis in humans [cdc.gov]. Schistosome parasites hatch from eggs released into water (1 & 2), infect a freshwater snail (3) for further development(4). Cercaria leave the snail host (5) and penetrate the skin of humans in contact with water (6). Humans are a definitive host; schistome parasites reach sexual maturity, pair, mate, and release hundred of eggs daily (7-10). Final location of schistosome parasite species within the
humans differs. Eggs released back into the environment complete the lifecycle. Note Schistosoma mansoni (B) infects the freshwater snails Biomphalaria, shown as the planorbid (rams head) snail on the far left of the freshwater snail images.
Biomphalaria glabrata. The drug Praziquantel (PZQ) is the current treatment of S.
mansoni infections in humans. Unfortunately, this drug targets only the adult stage of the
parasitic worm, thus, infections persist if juveniles were present during treatment and it
does not protect against re-infection [Kasinathan et al., 2010]. Furthermore, research is
showing that schistosome parasites are becoming resistant to PZQ-based drug therapy
[Wang et al., 2012] and a vaccine is not available. There is a need for additional

8
integrated control methods which include education of people in endemic areas to reduce
transmission as well as control of intermediate snail populations by use of molluscicides
[Rozendaal, 1997]. Additionally, understanding of the geographical patterns of parasite
transmission by snails would help direct and focus control effort. The suitability of B.
glabrata as host for S. mansoni infections varies based on genetic background of strains
of both parasite and host [Files & Cram, 1949; Lewis et al., 1993]. Many researchers are
studying the immune responses of B. glabrata to determine the factors that allow
parasites to develop in snail host or factors that defeat parasite infections, termed snail
susceptibility versus resistance [Bayne, 2009].
As a result of the association with schistosome transmission, B. glabrata is
currently a model organism for invertebrate immunity studies for host-parasite
interactions. Additionally, B. glabrata is a major representative of the Lophotrochozoa
clade (Mollusca) for comparative immunology. The mechanism for parasite survival in
invertebrates is not fully understood, however, molecular characterization and analysis of
ESTs are being performed to determine differences between susceptible and resistant
strains of B. glabrata snails to infection of S. mansoni [Raghayan et al., 2003; Nowak et
al., 2004; Hertel et al, 2005; Guillou et al, 2007; Bender et al., 2007; Lockyer et al.,
2008; Roger et al., 2008]. One mechanism discovered to determine susceptibility or
resistance of B. glabrata to parasitic infections is production of immune factors called
fibrinogen-related proteins (FREPs)[Adema et al., 1997]. Circulating hemocytes,
phagocytic defense cells, within B. glabrata were found to proliferate after infection of S.
mansoni parasites. These hemocytes are produced from progenitor cells in the APO
[Sullivan et al.¸2004] and the genomic DNA of these hemocytes cells is hypothesized to

9
go through somatic diversification to produce genetically different hemocyte cells. Based
on the mutations in the hemocytes from which they derive, variant FREP immune factors
are secreted into the hemolymph by the hemocytes [Stout et al., 2009]. Thus, within each
B. glabrata snail exists an individual repertoire of secreted FREP non-self recognition
factors [Hanington et al., 2010; Moné et al., 2010; Mitta et al., 2012]. If these FREPs
can successfully bind to parasite surface antigens, the FREPs signal hemocytes to
encapsulate the parasite for destruction; however, if the FREPs fail to bind to parasite
antigens, no recognition occurs [Mitta et al., 2012] and without a defense response, the
parasite survives. These non-self receptors are best characterized in B. glabrata
[Hanington et al., 2010; Hanington and Zhang, 2010] but FREPs have also been
described in the sea hare, Aplysia californica. In this opisthobranch snail, the FREPs
were not found to diversify [Gorbushin et al., 2010]. However, B. glabrata is still a
single model system and phylogenetically far removed from opisthobranchs. It would be
beneficial to have access to another snail model for comparative studies. Then
comparative immunogenomics can be applied to investigate and identify existence of
both similar and unique defense mechanisms, including diversification of FREPs. This
investigation is important to confirm insights which currently suggest that diversification
of immune factors may have been a common aspect during the evolution of immunity
[Litman & Copper, 2007; Moné et al., 2010; Ghosh et al., 2010].
The focus of my research was to characterize another gastropod as a comparative
model additional to B. glabrata for comparative studies of immunity in gastropods.
Phylogenetic representation was an important consideration. Figure 1.3 provides a
simplified phylogeny of Mollusca. For instance, FREP molecules have only been

10
LYMNAEIDAE
CHILINOIDAE
ACROLOXIDAE
PLANORBIDAE
- Biomphalaria
PHYSIDAE
- Physella
HYGROPHILA
PYRAMIDELLOIDEA
SIPHONARIOIDEA
AMPHIBOLOIDEA
ACOCHLIDIACEA
EUPULMONATA
- Stylommatophoran
- Systellommatophoran
- Ellobioidea
- Otinoidea
- Trimusculoidea
POLYPLACOPHORA
SCAPHOPODA
GASTROPODA
BIVALVIA
APLACOPHORA
CEPHALOPODAMOLLUSCA
GASTROPODA
BASAL GASTROPODS
CAENOGASTOPODS
NUDIPLEURA & EUOPISTHOBRANCHIA
PANPULMONATA
LOWER HETEROBRANCHIAKocot et al., 2011
Jörger et al., 2010 & White et al., 2011
Jörger et al., 2010 Jörger et al., 2010 & Dayrat et al., 2011
Figure 1.3. Phylogeny of Mollusca with emphasis on Hygrophila. Phylogenetic placements were
simplified based on references shown within the figure. Work from this thesis focus on molecular characterization of a member of Physidae, boxed in orange, member of Hygrophila (highlighted in blue) for comparative studies with B. glabrata (Biomphalaria, Planorbidae). Additional, the classes and clades of importance in this thesis are emphasized; clade Panpulmonata (highlighted in green) and class Gastropoda (highlighted in yellow). Aplysia californica resides in Euopisthobranchia outside of Panpulmonata.
characterized within the class Gastropoda, the largest class of Mollusca. Biomphalaria
glabrata is a panpulmonate gastropod found within Hygrophila, a clade of freshwater
snails. Panpulmonata is a clade proposed by Jörger, et al. [2010] which incorporates the
pulmonates, select (previously termed) opisthobranchs, and Pyramidelloidea based on
molecular data including16S and CO1 mitochondrial sequences as well as 18S nuclear
sequences. A member of the family Physidae was chosen to be developed as a
comparative model to B. glabrata. Physidae is a sister family to Planorbidae, of which

11
Biomphalaria is a member. Both families fall within the clade Hygrophila where many
snails are intermediate hosts to a variety of trematode parasites that can infect birds and
mammals. Swimmer’s Itch is a skin inflammation suffered by humans that is caused by
avian schistosomes that may be transmitted by physid snails (Fig. 1.4). Note the
similarity of parasite lifecycle of Swimmer’s Itch to that of schistosomiasis; parasites
infect the freshwater snail, develop through asexual reproduction, and finally exit the
snail as cercaria. Humans are an accidental and dead end host in the schistosome
lifecycle. Physids are native to North America as a species, they are now distributed
around the world [Burch, 1989]. Lastly, physids are found locally which provides a local
connection to New Mexico biology and parasitology.
Figure 1.4. Schistosome parasite lifecycle leading to Swimmer's Itch in humans [cdc.gov]. This figure depicts lifecycle of an avian schistome, in which a duck is typically the definitive host. Humans are exposed to parasite cercaria released from freshwater snails into the water, however, parasites do no further develop in the human host. Parasites typically die within the skin of humans, causing server itching. Swimmer’s itch is formally known as cercarial dermatitis.

12
Characterization of the physid snail models began with species identification.
The systematics of Physidae is complex and species identification previously relied on
examination of internal anatomy of the penial complex [Te, 1978]. However,
Wethington & Lydeard [2007] determined that species within Physidae could be
identified by molecular characterization of 16S and CO1 mitochondrial gene sequences
using conserved primers for PCR amplification. Sequencing these genes from the two
lab isolates from locally collected physid snails yielded high levels of intraspecific
differences. This led me to characterize the entire mitochondrial genome of both isolates
of the physid snails to determine the level of difference that could be expected in
intraspecific comparisons of mitochondrial genome sequences. An additional incentive
to characterize the full mitochondrial genome was this information was not yet available
for the Physidae family. Entire mitochondrial genome sequences for hygrophilids existed
only from Biomphalaria and from two species of Lymnaeidae (See Hygrophila, Fig. 1.3).
Typically for metazoans, mitochondrial DNA is maternally inherited (uniparental) and
exists as a circular double-stranded chromosome which consists of 37 genes: 13 protein-
encoding genes, 22 transfer RNAs (tRNAs), and 2 ribosomal RNAs (rRNAs).
Sequencing from mitochondrial genes have provided a valuable tool for species
identification and assembling phylogenetic relationships; mitochondrial sequences have
increased substitutions rates of 5-10 fold over nuclear DNA [Brown et al., 1979]. With
increased ease of PCR amplification with the availability of conserved primers and
sequencing, including NGS, the number of whole mitochondrial genomes from animals,
including mollusks, is continually increasing.

13
Mitogenomics, the study of mitochondrial genomes, has yielded many insights to
animal phylogeny, also within Mollusca [Rokas & Holland, 2000; Boore et al., 2004;
Grande et al., 2008; Cunha et al., 2009; Webster & Littlewood, 2012]. Generally,
sequencing entire mitochondrial genomes, rather than single gene sequences, provides
additional sequence for analysis. Comparative mitogenomic can provide additional
information; (1) identification of conserved regions to generate phylogenetically useful
primers [Boore et al., 2005], (2) determination of substitution rates of protein-encoding
gene sequences (a) as measure of selection pressures and (b) to determine a molecular
clock, both 2a and 2b aid in establishing phylogeny [Rota-Stabelli et al., 2010] , and (3)
discovery of novel gene orders, gene rearrangements have also aided in resolving
phylogenetic relationships among animals [Podsiadloweski et al., 2009; Kalay et al.,
2013]. Comparative mitogenomics have identified a high number of diverse sets of
mitochondrial gene orders within the phylum Mollusca [Boore, 1999; Gissi et al., 2008].
Indeed, these alternative gene rearrangements have also aided in establishing phylogeny
within classes of Mollusca, such as Gastropoda. This class also has a high number of
rearrangements in the mitochondrial genomes [Grande et al., 2008; Rawlings et al., 2010].
Following this introductory CHAPTER 1 of this thesis, CHAPTER 2 consists of
the manuscript submitted to the Journal of Molluscan Studies, modified to fit the Thesis
requirements as directed by the Office of Graduate Students (OGS). This manuscript
describes, for the first time, the entire mitochondrial genome from two isolates of
Physella acuta. One locally collected P. acuta snail is shown in Figure 1.5. The results
from characterizing the full mitochondrial genome provide additional insights into intra-
and inter- specific difference in sequence composition among Panpulmonata. In addition,

14
the results are important in that
mitochondrial and nuclear
sequences confirm the physid
lab isolates to be the same
species, P. acuta. The
mitochondrial genome from P.
acuta is available to represent
Physidae for additional
mitogenomic comparisons that
may provide better insight on
phylogenetic placements of families within Hygrophila. Lastly, mitogenomic analyses
from P. acuta confirm its placement within Hygrophila along with B. glabrata.
Additional reference to the Appendices is recommended. Appendix A1 and A2
provide supplemental nuclear ITS1 and ITS2 sequence alignments of P. acuta isolates A
and B. Appendix B provides a report of preliminary transcriptomic work obtained from
454 (pyro-)NGS efforts and RT-PCR results for immune relevant transcripts. Though
further work is necessary, these preliminary results indicate existence of FREP molecules
and other immune gene homologs characterized from immune responses of B. glabrata.
In summary, results from Chapter 2 and Appendix B confirm Physella as an
appropriate model among panpulmonates for comparative immunogenomics for future
investigations of shared and unique immune traits.
Figure 1.5. Physella acuta. Photo of the physid snail
identified as P. acuta by mitochondrial and nuclear sequences. Snail was collected from Stubblefield Lake, New Mexico.

15
CHAPTER 2
Physella acuta: atypical mitochondrial gene order among panpulmonates
(Gastropoda: Mollusca).
by
Journey R. Nolan, Ulfar Bergthorsson, Coen M. Adema
Submitted to the Journal of Molluscan Studies on October 13, 2013
Abstract
Mitochondrial (mt) sequences are frequently applied to inform on phylogeny and
for identification of species of molluscs. This study expands the phylogenetic range of
Hygrophila (Panpulmonata, Heterobranchia, Gastropoda, Mollusca) for which such
sequence data is available by characterizing the full mt genome of the invasive freshwater
snail, Physella acuta (family Physidae). The mt genome sequences of two P. acuta
isolates from Stubblefield Lake, New Mexico (USA) differ in length (14,490 bp vs.
14,314 bp) and show 11.49% sequence divergence, whereas ITS1 and ITS2 sequences
from the nuclear genome differed by 1.75%. The mt gene order of P. acuta (cox1, P,
nad6, nad5, nad1, D, F, cox2, Y, W, nad4L, C, Q, atp6, R, E, rrnS, M, T, cox3, I, nad2, K,
V, rrnL, L1, A, cytb, G, H, L2, atp8, N, nad2, S1, S2, nad4) differs considerably from the
relatively conserved gene order within Panpulmonata. Phylogenetic trees show that the
13 protein-encoding mt gene sequences (equivalent codons) of P. acuta group according
to gastropod phylogeny, yet branch lengths and dN/dS ratios for P. acuta indicate
elevated amino acid substitutions relative to other gastropods. This study indicates that
16
mt sequences of P. acuta are phylogenetically informative despite a considerable
intraspecific divergence and the atypical gene order in the mt genome of P. acuta among
Panpulmonata.
Background
Mitochondrial (mt) gene sequences commonly aid in investigating phylogenetic
relationships [Boore, 1999; Valles & Boore, 2006] but obtaining entire mitochondrial
genomes provides greater amounts of sequences for analysis, identification of mt gene
order, and discovery of novel mt gene rearrangements. Comparative mitogenomic
analyses can inform on animal phylogeny [Knudsen et al., 2006; Rokas & Holland, 2000;
Jex et al., 2010; Kayal et al., 2013].
Although the gene order of mt genomes is typically conserved within a phylum,
classes of the phylum Mollusca display diverse sets of mt gene orders [Kurabayashi &
Ueshima, 2000; Boore et al., 2004; Grande et al., 2008]. Within the class Gastropoda, a
generally standard order of mt genes has been recorded Panpulmonata [Knudsen et al.,
2006; White et al., 2011], a clade established by Jörger et al. [2010]. Still, the mt
genomes of Panpulmonata are no exception to frequent, but minor, gene rearrangements
that mainly involve modest numbers of tRNA genes but occasionally also single protein-
encoding genes, as seen in Cepea nemoralis [Terrett et al., 1996], Pyramidella dolabrata
[Grande et al., 2008], Siphonaria gigas [White et al., 2011], and Siphonaria pectinata
[Grande et al., 2008].
Our current insights are restricted by the incomplete phylogenetic coverage that is
provided by the 24 panpulmonate species from which mt genomes have been sequenced

17
completely. Panpulmonata contains the medically important clade Hygrophila; many of
these freshwater snails are intermediate host for flatworm parasites and transmit
infectious diseases of human and veterinary importance such as fascioliasis [Mas-Coma
et al., 2009], clonorchiasis and paragonimiasis [Rozendaal, 1997], cercarial dermatitis
and schistosomiasis [Morgan et al., 2002]. Based on 16S-, 18S-, and CO1- informed
phylogenetic analysis, Hygrophila was divided into 5 families: Acroloxidae, Chilinoidae,
Planorbidae, Lymnaeidae, and Physidae [Dayrat et al., 2011]. Perhaps because the mt
genomes of freshwater panpulmonates are considered difficult to sequence [White et al.,
2011], to date, complete mt genomes are available only for two families of Hygrophila;
Planorbidae: Biomphalaria glabrata [DeJong et al., 2004] and Biomphalaria tenagophila
[Jannotti-Passos et al., 2010] and Lymnaeidae: Radix balthica [Feldmeyer et al., 2010]
and Galba pervia [Liub et al., 2012]. No mt genome sequence was previously available
for the family Physidae.
Physids are the most abundant and diverse freshwater gastropods to their native
North America and due to their invasive nature occur throughout the world [Burch, 1989].
The phylogeny of Physidae is complex but 16S and CO1 mt sequences combined with
morphological features were used to reorganize taxonomy of North American physids
[Wethington & Lydeard, 2007]. Physella acuta [Draparnaud, 1805], frequently
designated by the synonym Physa acuta, is a widely used model snail that is well
distributed, easily obtainable, and can be maintained effortlessly in the lab. This snail
species serves as aquatic biomarker due to the ability to live in polluted water spaces
[Sánchez-Argüello et al., 2009; Lee et al., 2011], has considerable high salinity
thresholds [Kefford & Nugegoda, 2005], and is used in population and mating studies
18
[Bousset et al., 2004; Dillon et al., 2011]. As an invasive species, P. acuta is studied for
competitiveness with indigenous gastropod fauna [Madsen & Frandsen, 1989; Albrecht et
al., 2009]. Here, we characterize the mt genome of P. acuta, a representative of the
Physidae family.
In this study, 16S and CO1 mt sequences [Wethington & Lydeard, 2007] are used
for species identification of lab maintained snails of the family Physidae. In addition,
sequences from the nuclear genome, internal transcribed spacer (ITS)1 and ITS2 are also
employed. The ITS sequences are often used for species identifications at lower
taxonomic levels [Armbruster & Korte, 2006], including species identification within
Hygrophila [DeJong et al., 2001; Correa et al., 2010]. The mt genomes from two isolates
of P. acuta (A and B) are characterized and compared. The mt genes and gene order
from these physid snails are analyzed versus those of other panpulmonates. Finally we
perform a rate analysis and determine dN/dS ratios of mt protein-encoding genes of P.
acuta to investigate the rate of genome evolution in P. acuta relative to other
panpulmonates.
Methods and Materials
Snail isolates, DNA extraction, and species identification
In 2010, freshwater panpulmonate snails, morphologically identified as physids
(sinistral shells, digitations on mantle collar) [Paraense & Pointier, 2003] were collected
from Stubblefield Lake in Northern New Mexico (USA) and maintained in aquariums at
room temperature. Separate lines of lab cultured physid snails were initiated with
hatchling snails from recently deposited single egg masses that were isolated in different

19
tanks. This approach was taken to separate morphologically similar yet genetically
distinct Physella species [Wethington & Lydeard, 2007] and to avoid pre-existing
(trematode) parasite infections in the parental snails that were collected from the field.
Two separate lines of physids were established, designated as isolates A and B. Snails
were kept in artificial spring water and fed lettuce ad libitum and chicken feed (Egg
Layer pellets, Onate Feed Co) once a week.
Total DNA was extracted from whole body tissues from individual snails (4-6mm
shell length) using a cetyltrimethyl-ammonium bromide (CTAB)-based method
[Winnepenninckx et al., 1993]. For taxonomic identification, PCR (AmpliTaq Gold,
Applied Biosystems) was performed to amplify sequences fragments from the
phylogenetically informative mt genes 16S [Palumbi et al., 1991] and CO1 [Folmer et al.,
1994] as described by Wethington & Lydeard [2007], see Table 4 for primers. The
complete nuclear ITS1 and ITS2 regions were amplified using the following primers;
ITS1: 5'TAACAAGGTTTCCGTATGTGAA3' [Armbruster & Bernhard, 2000] and
ITS2R 5' GGTTTCACGTACTCTTGAAC 3' (provided by Nekola, J. modified from that
published in Wade & Mordan, 2000]. Termini of ITS regions were assigned by
identifying flanking ribosomal DNA gene boundaries according to DeJong et al. [2001].
Thermal cycling consisted of 10 min at 94ºC (initial denaturation), 25 cycles of 30 sec at
94ºC, 30 sec at primer annealing temperatures (50 ºC for 16S and CO1, 48 ºC for ITS
regions) , 1 min at 72ºC, and 7 min 72ºC final extension. Amplicons were purified
(QIAquick PCR purification Kit, Qiagen) and sequenced directly on both strands (Big
Dye 3.1, Applied Biosystems). Extension products were read on an ABI 3130
Automated DNA Sequencer. Sequences were edited by eye and assembled into contigs

20
using Sequencher 5.0 (Gene Codes Corporation). The sequences were compared to
GenBank using BLAST [Altschul et al., 1997] for gene identification. Phylogenetic
analyses of CO1 and 16S sequences from the P. acuta isolates was performed using
Neighbor Joining (NJ), Maximum Parsimony (MP), and Maximum Likelihood (ML)
(Gamma distribution + invariant sites) to place the experimentally-obtained nucleotide
sequences in the context of separate pre-existing CO1- and 16S-based phylogenies of
Physidae that also included members of Lymnaeidae and Planorbidae as outgroups
[NCBI popset: 164430598 and NCBI popset: 164430551, respectively; Wethington &
Lydeard, 2007] with 1000 replicates using MEGA 5.05 [Tamura et al., 2011].
The uncorrected p-distances (proportion of nucleotide sites at which sequences
differ) [Nei & Kumar, 2000] were calculated for each of 16S, CO1, ITS1, ITS2
sequences and the full length mt genome from the two isolates of P. acuta, and for
several publicly-available sequences to determine and compare ranges of intra- and inter-
specific sequence differences. Intraspecific differences were determined for 16S
sequences of the P. acuta [NCBI popset: 164430551; Wethington & Lydeard, 2007] and
Biomphalaria glabrata [NCBI popset: 15717799; DeJong et al., 2004], CO1 sequences
from P. acuta [Albrecht et al., 2009], and ITS1 and ITS2 sequences from 12 species of
Biomphalaria [NCBI popset: 15717841; DeJong et al., 2001]. Interspecific differences
among entire mt genomes or selected genes from four genera were determined for
Aplysia: A. californica [GenBank: NC_005827; Knudsen et al., 2006]; A. dactlyomela
[GenBank: NC_015088; Medina et al., 2011], and A. vaccaria [GenBank: DQ991928;
Medina et al., 2011]; Biomphalaria: B. glabrata [GenBank: NC_005439; DeJong et al.,
2004] and B. tenagophila [GenBank: NC_010220; Jannotti-Passos et al., 2010];
21
Onchidella: O. borealis [GenBank:DQ991936; Medina et al., 2011] and O. celtica
[GenBank: NC_012376; Grande et al., 2008]; and Siphonaria: S. gigas [GenBank:
NC_016188; White et al., 2011] and S. pectinata [GenBank: NC_012383; Grande et al.,
2008].
Full mitochondrial genome sequencing
Complete mt genomes were characterized from single individual snails, one each
from Physella acuta isolates A and B. PCR primers (Table 2.1) were designed and
optimized using Primer3 [Rozen & Skaletsky, 2000] to target conserved regions of mt
genes that were identified in alignments of previously reported complete mt genome
sequences from gastropod species (Panpulmonata) and EST data available from GenBank
[Lee et al., 2011; White et al., 2011]. High fidelity, long distance (LD)-PCR (Advantage
Genomic LA Polymerase Mix, Clontech) was used to generate overlapping amplicons
that encompassed the complete mt genome. Amplicons were sequenced directly by
primer walking (see above) at double coverage or higher. Chromatograms were edited by
eye and assembled into contigs (Sequencher 5.0). Once mt genome sequences of isolates
A and B were characterized completely, primers listed in (Table 2.1) were used to
generate seven overlapping PCR fragments (range 1931 – 2624 bp), again from the same
original genomic DNA template, that completely covered the mt genomes. High fidelity
LD-PCR amplicons were cloned (TOPO TA-cloning, Invitrogen) and sequenced
completely to confirm the mt sequence data.

22
Table 2.1. Table of primers used to characterize the mitochondrial genomes of Physella acuta.
Lines to the left of the primers delineate the seven overlapping long distance PCR amplicons that were cloned and sequenced to confirm data obtained by direct sequencing. Amplicons 1 and 7 overlap due to the circular nature of the mt genome, (7) indicates the end of the 7th fragment. Internal primers were used for sequencing by primer walking. The (*) indicates conserved primers targeting 16S and
CO1 for species identification [Wethington & Lydeard, 2007]. The location of the 3’ end of the primer positions are provided for each isolate A/B.
Primer ( 5’ – 3’) 3' Position (A/B)
1 Pa16SF TAAAGTGGTATTAGATCTGACGA 10780 / 10598
*H3080 ACGTGATCTGAGTTCAGACCGG 10915 / 10733
PaCYBF GGAGATCACATACTTGCCAAGACC 11200 / 11017
(7) PaCYBR TCAAAAGATCTGGCGATATTAGCC 11296 / 11114
2 ATP8JF AATTCCATAAGTGGGGCTGAG' 12610 / 12431
ND3JR TCTTGAAAGTGTCGTGATCCT 13040 / 12608
ATP8JFC CCTCTTGATATACCTCTGGATCG 13080 / 12902
ND4JR (B) ATGTCCAACTGACGAATACGC 13986 / 13810
*LCO1490 GGTCAACAAATCATAAAGATATTGG 38
A_CO1JRC AAACCTGTACCGACCAATCC 90
B_CO1JRC CAAAAGCATGTGCTGTAACG 159
3 PaCO1F GTTTGATCGGTGTTAATTACTGCA 564
*LCO2198 TAAACTTCAGGGTGACCAAAAAATCA 694
CO1JFC CGAGCTTATTTTACAGCAGCAAC' 911
ND5JRC GACGTGATTCCTAATCCATCTCAC 2371
4 ND5JF TAAGGCAATGCTTTTCATGG 2939
ND5JR GGAATACCCATTAATGAAAGTCCAC 3042
ND5JFC ATCGGTTCCGTAAACACGTC 3249
CO2JRC CCTCCTGAATAGGTGATGCTG 4701 / 4699
5 PaCO2F AACAAGTGCTGACGTATTGCATGC 5127 / 5125
CO2JR2 CAATGACAGGCACTAATATCTGC 5562 / 5367
A_ND4LJFC TTTGGTGGCAGATATGTAGTGC 5576 / --------
B_ND4LJFC GCCCTGGGACTGACCTTG ------- / 5698
A_ATP6JF2 AAGCTCAAATCTTTTTGTGCAAC 6064 / 5869
12SJRC GTGGGGCACAAATGTAGGAC 7428 / 7237
6 CO3JF GTTATGGGCCCAATAGCTTC 7679 / 7469
CO3JR ACCACGTTGGATTCTTAGCC' 7855 / 7666
CO3JFC CCTCAATGGCATGATGAGC 8127 / 7685
ND2JRC GACTTTCGGGTAAAACAACAGG 9381 / 9195
7 ND2JF CCTGTTGTTTTACCCGAAAGTC 9402 / 9216
16SJR2 ATACTTTTCCCCGCTATCCAG 10051 / 9863
N2G16SJFC CCTTTCAAATTTTGTGATAGCTG 10053 / 9865
*L2510 CGCCTGTTTATCAAAAACAT 10418 / 10232

23
Annotation and comparison of Physella acuta mitochondrial genomes
BLAST was used to identify protein-encoding and rRNA mt genes of P. acuta A
and B. Gene termini were designated based on open reading frame (ORF) analyses to
minimize overlap with adjacent genes, considering alternative start and stop codons,
finally checking predictions against RNA-SEQ data from P. acuta [Nolan & Adema,
unpublished]. The mapping of tRNA genes was based on identification of anticodons
surrounded by sequences that formed secondary structures, similar to DeJong et al.
[2004]. Codon usage was determined using MEGA 5.2 [Tamura et al., 2011]. To predict
the location of the potential origin of replication (POR), the following was considered:
(1) non-coding regions greater than 40 bp in length containing high, localized AT
richness and predictive 5’ TATA sequence repeats as seen in Drosophila [Kilpert &
Podsiadlowski, 2006], (2) regions with high GC skew [(G-C)/(G+C)] [Xia, 2012] using
1500 steps, window size 72nt [CGview; Stothard & Wishart, 2005], (3) POR locations as
hypothesized for other panpulmonates [Grande et al., 2008; White et al., 2011]. Mt
genomes were depicted graphically using Artemis [Rutherford et al., 2000]. The
predicted secondary structures of tRNAs were visualized with RNAviz2 [De Rijk et al.,
2003]. The mt genomic sequences from P. acuta isolates A and B were compared for
length, indels, nucleotide content, and predicted amino acid composition (Sequencher
5.0).
Mitochondrial gene order: P. acuta versus other panpulmonates
Starting with cox1, the order of mt genes recorded from P. acuta isolates A and B
were depicted in linear fashion and aligned with mt genomes of basal and derived

24
Panpulmonata, as inferred from 18S, 28S, 16S, and CO1 sequence data [Jörger et al.,
2010]: S. pectinata (basal) [GenBank: NC_012383; Grande et al., 2008]; Salinator
rhamphidia (Amphiboloidea) [GenBank: NC_016185; White et al., 2011]; Ovatella
vulcani [GenBank: NC_016175] and Trimusculus reticulatus [GenBank: NC_016193]
(both Ellobiidae) [White et al., 2011]; Rhopalocaulis grandidieri (Veronicellidae)
[GenBank: NC_016183; White et al., 2011] and O. celtica (Onchidiidae) [GenBank:
NC_012376; Grande et al., 2008] (Systellommatophora); Albinaria caerulea [GenBank:
NC_001761; Hatzoglou et al., 1995] and C. nemoralis [GenBank: NC_001816;
Yamazaki et al., 1997] (Stylommatophora); Pyramidella dolabrata (Pyramidellidae)
[GenBank: NC_012435; Grande et al., 2008]; and from members of two sister families of
the Physidae within the Hygrophila, B. glabrata (Planorbidae) [GenBank: NC_005439;
DeJong et al., 2004]; Radix balthica [GenBank: HQ330989; Feldmeyer et al., 2010]
(Lymnaeidae).
The substitution rates of the mitochondrial genomes of P. acuta versus other gastropods
Neighbor Joining (NJ), Maximum Parsimony (MP), and Maximum Likelihood
(ML) analyses were performed to investigate the phylogenetic relationship of P. acuta
with other gastropods and to determine branch lengths as a measure for divergence.
Complete nucleotide sequences for protein-encoding genes were obtained from Genbank
for the panpulmonates listed above. The phylogenetic range for testing was expanded by
also including sequences from Aplysia californica [GenBank: NC_005827; Knudsen et
al., 2006], a derived gastropod, and basal outgroups Dendropoma maximum [GenBank:
NC_014583; Rawlings et al., 2010], Conus textile [GenBank: NC_008797;

25
Bandyopadhyay et al., 2008], Haliotis rubra [GenBank: NC_005940; Maynard et al.,
2005], Nerita melanotragus [GenBank: GU810158; Castro & Colgan, 2010] and Lottia
digitalis [GenBank: NC_007782; Simison et al., 2006]. The mt genome sequence of the
lymnaeid R. balthica was not used because of the low quality of the 454-reads with
respect to length of mononucleotide tracts [Feldmeyer et al., 2010]. The protein-encoding
gene sequences of the 16 gastropods and P. acuta isolates A and B were individually
translated, aligned, and cropped by hand to remove highly divergent, non-alignable gap-
columns using COBALT [Papadopoulous & Agarwala, 2007] and Bioedit [Hall,1999].
Gene sequences were then concatenated for each gastropod. Phylogenetic NJ, MP and
ML analyses were performed in MEGA 5.05 using WAF+F+G (5 gamma categories)
with 1000 bootstrap replicates on the concatenated protein-encoding genes.
The relative rate test [Tajima, 1993] was performed in MEGA 5.05 to test the mt
genomes of P. acuta for accelerated nucleotide and amino acid substitution rates relative
to B. glabrata (with P. dolabrata as an outgroup) using aligned sequences with gaps
removed.
The GA-Branch program was used through the Datamonkey portal [Pond and
Frost, 2005] to identify terminal branches with significantly different dN/dS ratios in the
gastropod ML tree. The dN/dS ratios were generated from 12 of the 13 protein-encoding
gene sequences from the two isolates of P. acuta along with selected gastropods to
investigate substitution rates of P. acuta compared to other gastropods. Due to short
length of alignable codons, atp8 was excluded in dN/dS analyses. The gastropod species
A. californica, C. nemoralis, and N. melanotragus appeared to have undergone rate
acceleration and were excluded from this analysis. The nucleotide sequences of

26
individual protein-encoding genes were translated, aligned, and gap columns were
removed to analyze dN/dS ratios for each gene and also for the concatenated gene
sequences to identify amino acid substitutions across the mt genomes as a whole.
Results
Species identification
The initial morphology-based identification as physid snails was confirmed when
BLAST searches revealed greatest sequence similarities to database entries for Physella
acuta of experimentally derived ITS1, ITS2, 16S, and CO1 from both isolates A and B.
The ITS1 sequences [A: 495 bp, GenBank:KF316327; B: 497 bp, GenBank:KF316329]
differed at 10 nucleotide (nt) positions and ITS2 sequences [A: 301 bp,
GenBank:KF316328 ; B: 302 bp, GenBank:KF316326] differed by 4 nt (for alignments
see Appendix A1 and A2). The combined ITS regions differed in nt sequence by 1.75%
between P. acuta A and B. This value falls within the intraspecific divergence for the
combined ITS fragments of 12 different Biomphalaria species, ranging from 0% (B.
alexandrina) to 2.70% (B. glabrata) [DeJong et al., 2001]. The mt genome-derived
sequences (GenBank accession numbers in following paragraph) from isolates A and B
showed a higher divergence. The amplicons from the 16S genes were 496 bp (A) and
500 bp (B) with a 5.38 % nt difference evident from the sequence alignment (length of
502 bp with gaps). The CO1 sequence fragments, 655 bp for both isolates, displayed a
4.27% nt difference. The sequences were confirmed from sibling snails of both isolates.
Combining both 16S and CO1, the total sequence difference was 4.75% over 1151 bp.
Based on a threshold of less than 6% difference in these combined sequences, as defined

27
by Wethington & Lydeard [2007], both isolates are representatives of the species
Physella acuta. This divergence between mt sequences of P. acuta A and B is less than
the maximum intraspecific divergence calculated at 7.0% for 16S sequences from B.
glabrata [DeJong et al., 2001] and at 11.9% from CO1 sequences reported for P. acuta
elsewhere [Albrecht et al., 2009]. Accordingly, analysis of the CO1 sequences relative to
a previously reported phylogeny of physid snails [Wethington & Lydeard, 2007] placed
isolates A and B within the clade of P. acuta, with the two isolates representing separate
genetic lineages of the species (Fig. 2.1). Similar results were obtained with 16S
sequences (data not shown).
General features of the mitochondrial genome of P. acuta
The complete mt genomes of isolates A and B were characterized [A: GenBank:
JQ390525; B: GenBank: JQ390526] and while they differed considerably in sequence
composition (see next section), the following features are held in common. Physella
acuta has the standard metazoan complement of mt genes consisting of 13 protein-
encoding genes, 2 ribosomal RNA (rRNA) genes, and 22 transfer RNA (tRNA) genes.
The genomes have an AT-content of 69.22% for isolate A and 69.69% for isolate B. The
mt gene order is as follows: cox1, P, nad6, nad5, nad1, D, F, cox2, Y, W, nad4L, C, Q,
atp6, R, E, rrnS, M, T, cox3, I, nad2, K, V, rrnL, L1, A, cytb, G, H, L2, atp8, N, nad3, S2,
S1 and nad4 (Fig. 2.2). The underlined genes are located on the negative strand of the
circular genome. Intergenic regions are evident but the genes are generally spaced
closely together. Protein-encoding gene nad4 has an incomplete stop codon (T_ _);
inspection of cDNA transcripts confirmed that this stop codon is completed by mRNA

28
74
99
88
86
80
77
84
99
95
99
7199
Planorbidae
P. acuta isolate A
P. acuta (CARR1)
P. acuta (CARR2)
P. acuta (argrv3)
P. acuta (CAnr1)
P. acuta (F13)
Aplexa elongata
P. acuta isolate B
P. carolinaea (scjni1 / scjni2)
P. gyrina (multiple isolates)
Lymnaeidae
P. pomilli (multiple isolates)
P. acuta (multiple isolates)
P. marmorata (Gmar1 / Gmar2)
P. vernalis (maamb1 / maamb2)
Figure 2.1. Phylogenetic placement of Physella acuta isolates A and B within Physidae.
Experimentally derived sequences were incorporated into NCBI popset 164430598 [Wethington & Lydeard, 2007], CO1 sequences from snails of the family Physidae (boxed) to generate a ML tree; NJ and MP yielded the same results. Original identifiers of strains or isolates of P. acuta are indicated in brackets. The outgroup includes sequences from snails of the Lymnaeidae and Planorbidae. Isolates A and B, which co-exist side by side in Stubblefield Lake, NM, USA (bolded), cluster with different clades of P. acuta. The tree has been simplified for clarity, boot strap values are indicated from 1000
replicates.
polyadenylation. Several genes overlap partially; nad5 and nad1 overlap by 13 bp,
nad4L and trnC by 2 bp, trnY and trnW by 7 bp, trnL1 and trnA by 4 bp, and finally trnC
and trnQ, two tRNAs that are located on opposite strands, overlap by 6 bp. The location
of the potential origin of replication (POR) is predicted in the intergenic region between
cox3 and trnI, upstream of nad2. This is one of the largest intergenic regions, 45/48 bp
with 84.1%/87.5% AT-richness (P. acuta isolate A/B, respectively) and contains
predictive 5’ TATA sequence repeats. Additionally, this intergenic region is near the

29
rrnS
nad4L
nad3
atp8
trnA
trnCtrnT trnM
trnQ
trnW
trnP
trnF
trnY
trnE trnR
trnD
trnL1
trnV
trnK
trnI
trnS2trnN
trnL2
trnG
Physella acuta “A”
Mitochondrial Genome
14,490 bp
trnS1
trnH
13 bp
rrnS
nad4L
nad3
atp8
trnA
trnCtrnT trnM
trnQ
trnW
trnP
trnF
trnY
trnEtrnR
trnD
trnL1
trnV
trnK
trnI
trnS1
trnS2trnN
trnL2
trnH
trnG
13 bp
Physella acuta “B”
Mitochondrial Genome
14,314 bp
Figure 2.2. The mitochondrial genomes of Physella acuta isolates A and B. The outer circle
represents the positive strand, the inner circle the negative strand. Protein-encoding genes are darkened to distinguish from rRNA genes. Bars (with length in bp) indicate location of sequence
overlap between protein-encoding genes. Note the size difference of the mt genomes of the two P. acuta isolates, especially the indel beginning in cox2 following the intergenic region upstream of trnY.
highest G/C skew value (Fig. 2.3) and it has been predicted to contain the POR for other
panpulmonates [Grande et al., 2008; White et al., 2011].
Differences between mitochondrial sequences of P. acuta isolates A and B
The mt genomes from isolates A and B of the same species P. acuta are dissimilar
in both size (14,490 bp versus 14,314 bp) and in sequence content. With the exception of
the tRNAs I, M, and P, every other mt gene homolog differed in sequence composition
and/or size (Table 2.2). The intergenic regions range from 1 to 226 bp in length, with the
latter only recorded from isolate A. The nucleotide composition of the mt genome
sequence from the two isolates differ by 9.92% (1,416 nt in 14,275 bp), gaps excluded,

30
-0.1
-0.05
0
0.05
0.1
0.15
0.2
cox3
nad2trnI
cox3
nad2
trnI
(G-C)/(G+C)
Figure 2.3. Potential origin of replication (POR) location by GC skew analysis. GC skew [(G-C)/(G+C)] ratios were plotted in a bar graph relative to a linear representation of the mt genome of P. acuta (isolate A shown). Positive values indicate greater G content and negative values indicate increased C content. The vertical dotted line indicates the predicted location of the POR; note the GC skew maximum at 0.162 that further supports this prediction. Color coding of protein-encoding and
RNA genes is the same as in Figure 2.2.
this value increases to 11.49% (1,670 nt in 14,529 bp) with the inclusion of indel
positions. A total of 37 indels contribute to the size difference of the two mt genomes. A
193 bp indel occurs in the intergenic region between cox2 and trnY; the 3’ coding region
of the cox2 gene of isolate A contains a 39 bp extension followed by a 154 bp addition to
the non-coding region between cox2 and trnY. No indels created frame shifts within
protein-encoding gene sequences. Further indels contributed one additional amino acid
codon (3bp) in each of isolate A’s atp6 and nad1, an additional one bp in rrnS of isolate
A, and an additional nine bp in rrnL of isolate B. The remaining indels occur in
intergenic regions.

31
Table 2.2. Physella acuta isolates A and B, comparison of mitochondrial genes. The genes are
listed in order starting with cox1. For isolate A versus B, nucleotide (nt) substitutions and the percentage of sequence difference (uncorrected p-distance) per gene are provided. For each protein-encoding gene, c, nc represents the number of conserved and non-conserved amino acid (AA) substitutions the total number of amino acids in parenthesis. In addition, percent amino acid similarity
(Blosum62), start, and stop codons are provided for the protein-encoding genes. Note that greatest difference in protein sequence occurs in cox2 due to the 39 bp indel (isolate A) and that all of the substitutions in atp8 were conserved. Cells containing two entries represent isolates A / B, respectively. Data for protein-encoding genes have been bolded.
Gene Length (bp)
nt
substitutions
nt sequence
difference %
AA substitutions
c, nc
(total AA) AA similarity % Start Codon Stop Codon
cox1 1527 83 5.44% 1, 1 (509) 99.80% TTG TAA
P 63 0 0%
nad6 423 50 11.82% 11, 11 (141) 92.14% ATA TAA
nad5 1563 151 9.66% 20, 21 (521) 95.96% TTG TAA
nad1 906 / 903 147 16.23% 21, 25 (302) 91.69% ATG TAG
D 70 / 69 8 11.43%
F 65 5 7.69%
cox2 660 / 621 154 23.33% 9, 30 (220) 86.30% TTG TAG / TAA
Y 65 / 64 5 7.69%
W 69 / 70 9 13.04%
nad4L 279 83 29.75% 15, 9 (93) 90.22% ATT TAA
C 62 / 63 2 3.17%
Q 74 / 73 3 4.05%
atp6 630 / 627 70 11.11% 8, 5 (210) 97.61% ATC TAA
R 67 5 7.46%
E 72 / 73 3 4.17%
rrnS 771 / 770 21 2.72%
M 66 0 0%
T 72 / 73 4 5.48%
cox3 777 48 6.18% 3, 3 (259) 98.84% ATT TAA
I 74 0 0%
nad2 846 117 13.83% 24, 22 (282) 92.20% ATG TAA
L 70 3 4.29%
V 75 7 9.33%
rrnL 1247 / 1255 95 7.62%
L1 63 / 64 2 3.13%
A 74 6 8.11%
cytb 1119 71 6.34% 10, 5 (373) 98.66% ATA TAA / TAG
G 56 3 5.36%
H 63 1 1.59%
L2 65 / 64 1 1.54%
atp8 114 6 5.26% 3, 0 (38) 100.00% ATT / ATC TAA
N 67 3 4.48%
nad3 351 57 16.24% 15, 8 (117) 93.10% ATA TAA
S2 63 / 64 4 6.35%
S1 59 / 60 1 1.67%
nad4 1303 85 6.52% 15, 16 (434) 96.32% ATA T(AA) by poly-
adenylation

32
Differences in sequence composition occur in 19 of the 30 intergenic regions,
both rRNAs, and in 19 of the 22 tRNAs. The nt substitutions between the tRNAs from
the isolates A and B typically affect the loops and rarely the stems of the predicted clover
leaf structures (Fig. 2.4). The protein-encoding genes between the two isolates have a
broad range of synonymous and non-synonymous nt substitutions (Table 2.2).
Nucleotide sequence differences ranged from 5.26% (atp8) to 29.75% (nad4L). This
affected overall dominant codon in isolate A versus CUU in isolate B (Table 2.3), but this
was not leaf structures (Fig. 2.4). The protein-encoding genes between the two isolates
have a broad range of synonymous and non-synonymous nt substitutions (Table 2.2).
Nucleotide sequence differences ranged from 5.26% (atp8) to 29.75% (nad4L). This
affected overall codon usage, with the greatest difference recorded for Leucine (L1):
CUA was the significant (CUAχ2=0.087, p = 0. 77; CUU χ2= 0.98, p = 0.32).
Additionally, (alternative) start codons and stop codons vary between atp8, cox2, and
cytb gene homologs. The amino acid substitutions ranged from 0.59% (cox1) to 25.81%
(nad4L). With exception of cox2 (increased length due to indel), the similarity of protein
sequences of P. acuta A and B was ≥ 90% due to a majority of synonymous
replacements (Table 2.2).
The 11.49 % overall intraspecific divergence at nt level of complete mt genomes
of P. acuta A and B exceeds that of two strains of B. glabrata (18 of 13670 nt or 0.13%;
uncorrected p-distance). This divergence is comparable to interspecific difference from
total mt genome sequences among additional species within either the genus Aplysia or
the genus Biomphalaria, however, it did not exceed the interspecific sequence differences
from species within the genera Onchidella nor Siphonaria. Regardless of the high

33
Figure 2.4. Physella acuta isolates A and B: tRNA sequence and structure. Predicted secondary
structures of the 22 tRNAs encoded in the mt genomes from P. acuta isolates A and B. Only three
tRNA genes from isolates A and B have 100% nt identity. Two graphical representations are shown for all tRNA genes that differ in sequence between isolates A and B. Typically such differences occurred in the loops, not the stems. Three letter codes identify the amino acid anticodon specificity. Irregular tRNAs are Gly, Ser (AGN), and Ser (UCN).
intraspecific divergence, P. acuta is distinct from other genera. A direct comparison of
the cox1 gene sequences from P. acuta isolate A compared to B. glabrata (representing
the sister taxon), yielded over 20% sequence divergence between genera.

34
Mitochondrial gene order: P. acuta vs. Panpulmonata
The mt gene order from P. acuta is novel compared to the rather standard gene
order that has been recorded from other panpulmonates, to date (Fig. 2.5). Despite the
rearrangements evident from P. acuta, the coding directionality on the positive or
negative strand is identical for gene homologs of all the panpulmonates. In addition,
several groups of genes that occur adjacent in the mt genome of P. acuta, have been
designated as gene clusters because identical groups of genes are present (in different
order) in the mt genomes of other panpulmonates. The rearranged mt gene order of P.
actua may have resulted from processes that have retained several gene clusters. A
scenario for the origin of the rearranged gene order in the mt genome of P. acuta is
depicted in Figure 2.6, starting from the mt gene order from B. glabrata, a
phylogenetically close relative that is a good representative of the conserved mt gene
order of the Panpulmonata.
Rate of mutation of the mitochondrial genome of P. acuta
The maximum likelihood (ML) tree of the equivalent amino acids predicted from
equivalent codons of protein-encoding genes of the mt genomes of P. acuta and other
selected gastropods (Fig. 2.7) is similar to generally accepted phylogenies [Grande et al.,
2008; Klussman-Kolb et al., 2008; Jörger et al., 2010; Dayrat et al., 2011; White et al.,
2011]; NJ and MP analyses (not shown) yielded similar results. The long branch lengths
for P. acuta relative to most other clades, especially close phylogenetic neighbors, is
indicative of a higher substitution rate in the mt genomes of P. acuta.

35
Table 2.3. Different codon usage in the mitochondrial genomes of two Physella acuta isolates.
Amino acid (AA), codon, the number of occurrence of a single codon (N), and the relative synonymous codon usage (RSCU) are provided for isolates A and B. The most frequently used codon
for each amino acid is bolded. Isolates A and B differ in dominant codon usage for L1. Stop codons (*). Start codons, including alternative start codons, include the number of uses in superscript for each isolate; A,B respectively.
Isolate A Isolate B Isolate A Isolate B
AA Codon N RSCU N RSCU AA Codon N RSCU N RSCU
A
GCA 48 1.16 49 1.23
P
CCA 46 1.51 46 1.52
GCC 23 0.55 27 0.68 CCC 16 0.52 16 0.53
GCG 11 0.27 12 0.30 CCG 11 0.36 8 0.26
GCU 84 2.02 72 1.80 CCU 49 1.61 51 1.69
C UGC 7 0.27 6 0.22
Q CAA 43 1.51 36 1.38
UGU 45 1.73 48 1.78 CAG 14 0.49 16 0.62
D GAC 16 0.53 12 0.41
R
CGA 20 1.63 24 1.96
GAU 44 1.47 47 1.59 CGC 3 0.24 5 0.41
E GAA 48 1.25 51 1.36 CGG 10 0.82 6 0.49
GAG 29 0.76 24 0.64 CGU 16 1.31 14 1.14
F UUC 64 0.44 64 0.44
S1
AGA 57 1.28 63 1.39
UUU 224 1.56 230 1.56 AGC 21 0.47 21 0.46
G
GGA 84 1.62 79 1.55 AGG 27 0.61 13 0.29
GGC 9 0.17 15 0.29 AGU 66 1.48 67 1.48
GGG 46 0.89 52 1.02
S2
UCA 69 1.55 74 1.64
GGU 68 1.31 58 1.14 UCC 23 0.52 19 0.42
H CAC 18 0.48 22 0.62 UCG 21 0.47 23 0.51
CAU 57 1.52 49 1.38 UCU 73 1.64 82 1.81
I AUC1,2 59 0.41 56 0.40
T
ACA 65 1.38 70 1.48
AUU3,2 228 1.59 223 1.60 ACC 30 0.63 29 0.61
K AAA 85 1.68 76 1.63 ACG 17 0.36 18 0.38
AAG 16 0.32 17 0.37 ACU 77 1.63 72 1.52
L1
CUA 72 0.81 67 0.74
V
GUA 97 1.58 98 1.58
CUC 18 0.20 17 0.19 GUC 30 0.49 26 0.42
CUG 33 0.37 26 0.29 GUG 42 0.68 40 0.65
CUU 67 0.75 73 0.81 GUU 77 1.25 84 1.35
L2 UUA 255 2.85 265 2.94
W UGA 60 1.48 59 1.42
UUG3,3 91 1.02 92 1.02 UGG 21 0.52 24 0.58
M AUA4,4 192 1.59 188 1.55
Y UAC 45 0.57 36 0.45
AUG2,2 50 0.41 54 0.45 UAU 113 1.43 124 1.55
N AAC 31 0.45 30 0.44
(*) UAA 11 1.69 11 1.69
AAU 107 1.55 107 1.56 UAG 2 0.31 2 0.31

36
The relative rate analysis showed a highly significant acceleration in both nt (not
shown) and amino acid substitutions in the mt genomes of P. acuta relative to B. glabrata
(isolate A χ2=38.01, isolate B χ2= 30.82, p < 0.000001 for each).
The dN/dS ratios for the terminal branches (Table 2.4) from the ML tree across
the protein-encoding genes identified a significant increase of amino acid substitutions in
P. acuta (0.091) as compared to other gastropods (0.019). Increased dN/dS values for
individual genes were recorded for cox2, nad1, nad2, nad4, nad5, and (isolate B only)
nad6, but not all were significant, see Table 2.4. The remaining protein-encoding genes
had equivalent dN/dS ratios relative to other gastropods. Note that the cox1 of isolate A
was the only gene with a lower dN/dS ratio as compared to other gastropods. Gene
relocations resulting from putative gene rearrangements (Fig. 2.6) did not appear to
associate with altered dN/dS ratios of particular genes of P. acuta as compared to other
gastropods (Table 2.4).
Discussion
The characterization of the mt genome of P. acuta revealed 1) considerable
intraspecific differences in length and sequence composition, 2) a novel gene order that is
unique among panpulmonates, and 3) elevated substitution rates in protein-encoding
genes compared to mt genomes of other gastropods. The sequence data (ITS1, ITS2, 16S,
and CO1) obtained from the physid snails collected from Stubblefield Lake in North-
Eastern NM (USA) identified isolate A and B as the same species, P. acuta.
The isolate-specific differences between the sequences that were analyzed fell
within the ranges of considerable intraspecific divergence that are routinely recorded

Figure 2.5. The mitochondrial gene order of Physella acuta is atypical among panpulmonates. Alignment of linear representation of mt gene order of P. acuta and other panpulmonate gastropods (see methods section for accession numbers). Phylogenetic relationships shown are based on analysis of 18S, 28S, 16S, and CO1 sequences [Jörger et al., 2010]. Protein-encoding and rRNA genes are color coded to emphasize patterns and gene rearrangements. Single letters designate tRNA genes. The genes encoded on the negative strand (underlined) are the same for all species shown. Bold lines under the alignment delineate clusters of genes with the same internal order for the majority of the panpulmonates. Note that gene rearrangements among the panpulmonates are modest and rarely affect protein-encoding gene orders, with the exception of P. acuta. Alignment is not to scale.
37

38
from phylogenetic studies that employ such genes of other snail species [Thomaz et al.,
1996; Stothard & Rollinson, 1997; Armbruster & Bernhard, 2000; DeJong et al., 2001;
Dillon & Frankis, 2004; Albrechts et al., 2009; Nekola et al., 2009; Wethington et al.,
2009].For P. acuta, the levels of intraspecific divergence were different for the nuclear
genome-derived ITS sequences (> 98% identity) versus the 16S and CO1 sequences from
the mt genome (95.25% identity). Differences in 16S and CO1 gene sequences between
Biomphalaria
intermediate
Physella
D FC
QCFD
Q
D FC Q
c
o
x
1
n
a
d
4
L
c
y
t
b
n
a
d
4
L
c
y
t
b
D FC Q D FC Q
c
o
x
1
n
a
d
4
L
c
y
t
b
c
y
t
b
n
a
d
4
L
D F QC
n
a
d
4
L
c
y
t
b
c
o
x
1
n
a
d
4
L
c
y
t
b
c
o
x
1
D FC D C
QCD FC D
n
a
d
4
L
n
a
d
4
L
c
y
t
b
c
o
x
1
D F C Q
n
a
d
4
L
c
y
t
b
c
o
x
1
c
o
x
1
Major segmental duplication and
deletion of gene duplicates.
Minor segmental duplication and
deletion of gene duplicates.
Figure 2.6. Hypothetical origin of atypical gene order in Physella acuta. A combination of
consecutive segmental genome duplications and selective loss of duplicated genes may account for the change from a conserved mt gene order as found in B. glabrata to result in the gene order recorded from P. acuta. Gene order is shown in linear fashion for mt genomes of B. glabrata (top) and P. acuta (bottom), using identical colors as in Figure 2.5. Lines and arrows indicate the genome regions that were duplicated. Hatched blocks indicate loss of duplicated genes. The transition from top to bottom includes one intermediate configuration. Horizontal bars identify clusters of genes that remain together throughout the genome rearrangements. Selected genes are labeled for clarity.

39
the two isolates did not exceed the 6% difference needed to delineate the two isolates as
separate species of within Physella [Wethington & Lydeard, 2007]. Additionally,
phylogenetic reconstruction placed isolates A and B within the P. acuta clade, but as
separate genetic lineages (Fig. 2.1). The characterization of the complete mt genomes
revealed additional extensive differences in sequence and length that further increased the
mt nucleotide divergence between P. acuta A and B to 11.49%. Based upon the limited
number of reports available for such comparison of complete mt genomes, this level
exceeds the intraspecific divergence of B. glabrata [DeJong et al., 2004] and it is more in
Cepaea nemoralis
Lottia digitalis
Dendropoma maximum
Nerita melanotragus
Haliotis rubra
Rhopalocaulis grandidieri
Albinaria coerulea
Physella acuta isolate A
Physella acuta isolate B
Biomphalaria glabrata
Conus textile
Pyramidella dolabrata
Trimusculus reticulatus
Aplysia californica
Onchidella celtica
Salinator rhamphidia
Siphonaria pectinata
Ovatella vulcani
100
100
100
100
100
74
89
89
97
80
96
85
100
Pa
np
ulm
on
ata
Figure 2.7. Phylogenetic analysis of selected gastropods. Representative gastropods with fully
characterized mt genomes were selected to compare protein-encoding genes to those of P. acuta. Optimized alignments of amino acid sequences of all 13 protein-encoding genes were concatenated for Maximum Likelihood analysis (1000 bootstrap replicates). Longer branch lengths indicate increased mutation rates of amino acid sequences across the mt genome. Note the relatively long branch of the Physella clade. See methods section for accession numbers.

40
range of interspecific divergence within gastropod genera of Biomphalaria and Aplysia
[DeJong et al., 2004; Knudsen et al., 2006; Jannotti-Passos et al., 2010; Medina et al.,
2011]. The observation in one gastropod species of minimal intraspecific differences in
nuclear sequences combined with elevated divergence of mt sequences is not novel.
Additional to P. acuta, another instance was reported for the slug Arion subfuscus
(Stylommatophora) with 16S sequence difference reaching 21% while 0.3% mean
pairwise sequence divergence was observed in ITS1 [Pincell et al., 2005]. Dramatic
intraspecific differences occur in some bivalve molluscs where doubly uniparental
inheritance (DUI) of maternally (F genome) and paternally (M genome) transmitted
mitochondrial genomes differ in size, gene order, and sequence [Doucet-Beaupré et al.,
2010]. However, this does not apply here; P. acuta belongs to a different class
(Gastropoda versus Bivalvia) and it is a simultaneous hermaphrodite. Thomaz et al.
[1996] proposed that intraspecific variance of mt genomes populations may stem from 1)
rapid mt evolution; 2) sequence divergence in previously isolated; 3) selection acting to
generate and maintain variability; and 4) unusually structured or large populations. Thus,
it is not unlikely that intraspecific divergence has developed in the mt genome of a
globally invasive species with complex genetic population structures that are capable of
reproduction by selfing such as P. acuta [Escobar et al., 2008; Albrecht et al., 2009].
The occurrence of variant mt genomes in the species P. acuta may then result from
putative mitochondrial introgression [Ballard & Whitlock, 2004] but more data is needed
to resolve this hypothesis. These considerations and the findings in this study suggest that
it may be informative for molecular sequence-based taxonomic identification of snails to

41
employ combined analyses of sequences encoded by both mitochondrial and nuclear
genomes.
A standard ancestral gene pattern has been postulated for molluscan mt genomes
[Ki et al., 2010] but frequent and extensive rearrangements have led to highly diverse
patterns of gene order in mt genomes across the phylogeny of molluscs [Boore et al.,
2004; Grande et al., 2008]. The mt genomes of Panpulmonata, however, display a
relative standard gene order with modest variations in the relative positions of tRNA
genes and only rarely of protein-encoding genes [Kurabayashi & Ueshima 2000;
Knudsen et al., 2006; Grande et al., 2008]. In light of the apparent standard gene pattern
it was surprising that the gene order of the mt genome of P. acuta differed radically from
that of phylogenetically close relatives within the clade of Panpulmonata (Fig. 2.5). It
remains unclear what mechanisms underlie the rearrangements of the mt genomes in this
Table 2.4. Non-synonymous per synonymous (dN/dS) substitution ratios, comparing P. acuta to
other gastropods. The dN/dS ratios were calculated for individual and concatenated mt protein-encoding gene sequences with the exception to atp8. Other gastropods include A. coerulea, B. glabrata, C. textile, D. maximum, H. rubra, L. digitalis, O. celtica, O. vulcani, P. dolabrata, R. grandidieri, S. pectinata, S. rhamphidia, and T. reticulatus; see Methods for accession numbers.
Single ratios indicate no difference between other gastropods and P. acuta isolates. Different ratios from isolates of P. acuta are separated by a forward slash; n.d. = not determined. Genes with significantly different (p < 0.001) dN/dS ratio between the P. acuta isolates and the other gastropods are indicated by an asterisk. Positive selection was not found for any of the sequences analyzed.
dN/dS ratio dN/dS ratio
Gene sequence
other gastropods
P. acuta A/B Gene
sequence other
gastropods P. acuta A/B
concatenated gene set *
0.019 0.091 atp6 0.03
cox1 0.011 0.006 / 0.011 cox3 0.022
nad6 0.101 0.101 / 0.239 nad2* 0.033 0.216
nad5* 0.016 0.091 / 0.074 cytb 0.035
nad1* 0.026 0.122 atp8 n.d.
cox2 0.042 0.076 nad3 0.082
nad4L 0.049 nad4 0.059 0.139
42
group [Grande et al., 2008; White et al., 2011], but the analysis of the mt gene order of P.
acuta relative to the standard panpulmonate genome favors a combination of segmental
duplication and selective deletion of supernumerary genes [Kurabayashi & Ueshima
2000; Knudsen et al., 2006; Grande et al., 2008] (Figs. 2.5 & 2.6). Despite extensive
gene rearrangements, the mt genome of P. acuta still shows homage to the common mt
gene order shared by many Panpulmonata. The directionality of gene homologs is the
same and complements of genes that are encoded on either the H and L strands are
identical. Several clusters of genes with the same relative internal positions as seen in
other panpulmonates were identified in the divergent gene pattern of the mt genome of P.
acuta. Similar as proposed for other panpulmonates [Grande et al., 2008; White et al.,
2011], the location of the POR of P. acuta is predicted in the intergenic region between
cox3 and trnI (Fig. 2.3), within a gene cluster that remained undisturbed during the
rearrangements. This suggests that rearrangements involved groups of genes (segments of
the mt genome) rather than individual genes.
Additional differences in the mt genome of P. acuta versus other panpulmonates
are the longer branch lengths (Fig. 2.7), accelerated amino acid substitutions (relative rate
test), and increased substitution rates (Table2. 4). These are indications that the mt
genome of P. acuta is evolving faster than those of several other gastropods. Still,
phylogenetic analysis performed with concatenated protein-encoding gene sequences
place P. acuta in the clade Hygrophila (Fig. 2.7). This is in agreement with other
phylogenetic trees based on mt and nuclear DNA sequences [Grande et al., 2008;
Klussman-Kolb et al., 2008; Jörger et al., 2010; Dayrat et al., 2011; White et al., 2011].
A number of processes may account for increased branch lengths and the increased

43
dN/dS rates; 1) increased substitution rates that create a spectrum of mutations which
may generate increased amino acid replacements, 2) relaxation of selection which could
allow for an increase in the number of substitution sites, 3) mechanistic flaws in
replication and/or mismatch DNA repair, 4) population effects such as bottlenecking or
reproduction, especially because P. acuta is a simultaneous hermaphrodite that is capable
of selfing in analogy to parthenogenetic snails [Neiman et al., 2010]. Finally, increased
substitutions rates may be explained by genome rearrangements via genome duplication
and selective loss of genes.
In summary, two isolates of P. acuta that appear side by side in the Stubblefield
Lake in New Mexico (USA) have highly similar ITS1 and ITS2 sequences, yet display
high mt sequence divergence and differ considerably in length of mt genomes. Few
studies provide the entire mt genome from multiple individuals of the same species from
Gastropoda, but none of these match the intraspecific sequence divergence of entire mt
genome sequences as seen within P. acuta. The physid snails have a mt gene order that
is strikingly different from the relatively conserved pattern previously described from
within panpulmonates and phylogenetic analysis indicates overall elevated substitution
rates, yet placement of P. acuta remains within Hygrophila (Panpulmonata). The mt
genomes from P. acuta may be used in future studies of topics such as intra- and inter-
specific sequence divergence, genome evolution, and establishing phylogeny aided by
gene rearrangements. We conclude that White et al. [2011] correctly postulated that with
increased mt genomes being sequenced, there would be increased detection of mt gene
rearrangements. Also, Boore [1999] validly cautioned against interpretation of
phylogenetic relationships solely based on mt gene rearrangements within Mollusca due

44
to the phylum’s myriad of gene rearrangements which are not connected with any type of
molecular clock. It appears P. acuta provides an intriguing example of the diversity of
mt genomes within Mollusca.

45
Appendix A1: Alignment of the nuclear ITS1 sequences from P. acuta isolates A
and B. The alignment of the internal transcribed spacer 1 (ITS1) sequences obtained
from P. acuta isolate A and B.
ITS1 alignment
. .. .| .. .. |. .. .| .. .. |. .. .|. .. .| .. .. |. .. .| .. .. |. .. .| .. .. |.. .. |
Physella acuta A 1 A CG AA TT GT TG TC TC GT GT GC GT TA CC GC GC CA TG AA CA AT AA AA CT CG TA AC AA AA CG T
Physella acuta B 1 A CG AA TG GT TG TT TC GT GT GC GT TA CC GC GC CA TG AG CA AT AA AA CT CG TA AC AA AA CG T
. .. .| .. .. |. .. .| .. .. |. .. .|. .. .| .. .. |. .. .| .. .. |. .. .| .. .. |.. .. |
Physella acuta A 61 C TT GT CC GA TG CT AG CC CG GT CG GG AC TT GG CC GC AC GA AG CG CG GT TC CG AC TG GC TC G
Physella acuta B 61 C TT GT CC GA TG CT TG CC CG GT CG GG AC TT GG CC GC AC GA AG CG CG GT CC CG AC TG GC CC G
. .. .| .. .. |. .. .| .. .. |. .. .|. .. .| .. .. |. .. .| .. .. |. .. .| .. .. |.. .. |
Physella acuta A 121 A CC GC TC CC CT GT TT CG GG GT AC CT AG TG CA TG TC CT CG AT GC GA CC CA CG GT GA CG GC T
Physella acuta B 121 A CC GC TC CC CT GT TT CG GG GT AC CT AG TG CA TG TC CT CG AT GC GA CC CA CG GT GA CG GC T
. .. .| .. .. |. .. .| .. .. |. .. .|. .. .| .. .. |. .. .| .. .. |. .. .| .. .. |.. .. |
Physella acuta A 181 A GA GC TG CG AA CG GG CT CG CC GG GT CG CG CT AG GT TC AA AG AG TG GC TC GT GT TC GG TG A
Physella acuta B 181 A GA GC TG CG AA CG GG CT CG CC GG GT CG CG CT AG GT TC AA AG AG TG GC TC GT GT TC GG TG A
. .. .| .. .. |. .. .| .. .. |. .. .|. .. .| .. .. |. .. .| .. .. |. .. .| .. .. |.. .. |
Physella acuta A 241 A TT GT GC CG GG CC CG GG CG AC CG CC CC GC TT AT GT GG CG AC CA AA GG GG TA CC TG CG TC T
Physella acuta B 241 A TT GT GC CG GG CC CG GG CG AC CG CC CC GC TT AT GT GG CG AC CA AA GG GG TA CC TG CG TC T
. .. .| .. .. |. .. .| .. .. |. .. .|. .. .| .. .. |. .. .| .. .. |. .. .| .. .. |.. .. |
Physella acuta A 301 C TT T~C CC GCG AGG GA ATG AG GCG GG AGC TC CAG CTT CC TAT AG CAG GC CGC GAG GT TCA A
Physella acuta B 301 C TT TTC CC GCG AGG GA ATG AG GCG GG AGC TC CAG CTT CC TAT AG CAG GC CGC GAG GT TCA A
. .. .| .. .. |. .. .| .. .. |. .. .|. .. .| .. .. |. .. .| .. .. |. .. .| .. .. |.. .. |
Physella acuta A 360 A G AG T CC G AC GC T GC TC T CG CG T CG G CC GC C CC TT G TC CT C AC G TT AC A TT TT T CA TT T
Physella acuta B 361 A G AG T CC G AC GC C GC TC T CG CG T CG G CC GC C CC TT G TC CT C AC G TT AC A TT TT T CA TT T
. .. .| .. .. |. .. .| .. .. |. .. .|. .. .| .. .. |. .. .| .. .. |. .. .| .. .. |.. .. |
Physella acuta A 420 T GA AC GC AT TG TG CA TT TT TT CA CT TT TC GA TA CG AC TG AC GG CC AG GA GC GC CT CA GT T
Physella acuta B 421 T GA AC GC AT TG TG CA TT TT TT CA CT TT TC GA TA CG AC TG AC GG CC AG GA GC GC CT CG GT T
. .. .| .. .. |. .. .| .. .. |. .. .|. .. .| .. .. |. .. .| .. .. |. .. .| .. .. |.. .. |
Physella acuta A 480 A AA AA AA ~T CC AA AT AC XX XX XX XX XX XX XX XX XX XX XX XX XX XX XX XX XX XX XX XX XX X
Physella acuta B 481 A AA AA AA AT CC AA AT AC XX XX XX XX XX XX XX XX XX XX XX XX XX XX XX XX XX XX XX XX XX X
10 20 30 40 50 60
70 80 90 100 110 120
130 140 150 160 170 180
190 200 210 220 230 240
250 260 270 280 290 300
310 320 330 340 350 360
370 380 390 400 410 420
430 440 450 460 470 480
490 20 30 40 50 60
* * *
* * *
*
*
*
*

46
Appendix A2: Alignment of the nuclear ITS2 sequences from P. acuta isolates A
and B. The alignment of the internal transcribed spacer 2 (ITS2) sequences obtained
from P. acuta isolate A and B.
ITS2 alignment
. .. .| .. .. |. .. .| .. .. |. .. .| .. .. |. .. .| .. .. |. .. .| .. .. |. .. .| .. .. |
Physella acuta A 1 C GA CT AA AT CA AT CG AG CT CG TC TT GT TT TC CA CG AC AC TC GT CT GG CT GG AA AG CG GG C
Physella acuta B 1 C GA CT AA AT CA AT CG AG CT CG TC TT GT TT TC CA CG AC AC TC GT CT GG CT GG AA AG CG GG C
. .. .| .. .. |. .. .| .. .. |. .. .| .. .. |. .. .| .. .. |. .. .| .. .. |. .. .| .. .. |
Physella acuta A 61 T CG CG CT GA AC CG TC GA GG TT TC CA CG CT CC AC TC GG GC GG GG AT CC CC GT GG TT TC AA G
Physella acuta B 61 T CG CG CT GA AC CG TC GA GG TT TC CA CG CT CC AC TC GG GC GG GG AT CC CC GT GG TT TC AA G
. .. .| .. .. |. .. .| .. .. |. .. .| .. .. |. .. .| .. .. |. .. .| .. .. |. .. .| .. .. |
Physella acuta A 121 T CC AA GC TG CG CC GT CG TC CT AT GT CC TC GA TG CT GC TT GC GC GG TT TC AC CG CC TG GC A
Physella acuta B 121 T CC AA GC TG CG CC GT CG TC CT AT GT CC TC GA TG CT GC TT GT GC GG TT TC AC CG CC TG GC A
. .. .| .. .. |. .. .| .. .. |. .. .| .. .. |. .. .| .. .. |. .. .| .. .. |. .. .| .. .. |
Physella acuta A 181 G GA CT CG GC TC GT GT AA AA AG CG AG TT TC GG GC CT GC TT CT TG GC AC TG CT CT CG GG TG A
Physella acuta B 181 G GA CT CG GC TC GT GT AA AA AG CG AG TT TC GG GC CT GC TT CA TG GC AC TG CT CT CG GG TG A
. .. .| .. .. |. .. .| .. .. |. .. .| .. .. |. .. .| .. .. |. .. .| .. .. |. .. .| .. .. |
Physella acuta A 241 A GC GG CA AG CG GC GT CG TC AG CG AC CG TG GT TC GG TG CC AC TT TT AA AA AA TT AT TC AT A
Physella acuta B 241 A GC GG CA AG CG AC GT CG TC AG CG AC CG TG GT TC GG TG CC AC TT T~ AA AA AA TT AT TC AT A
. .. .| .. .. |. .. .| .. .. |. .. .| .. .. |. .. .| .. .. |. .. .| .. .. |. .. .| .. .. |
Physella acuta A 301 T CX XX XX XX XX XX XX XX XX XX XX XX XX XX XX XX XX XX XX XX XX XX XX XX XX XX XX XX XX X
Physella acuta B 300 T CX XX XX XX XX XX XX XX XX XX XX XX XX XX XX XX XX XX XX XX XX XX XX XX XX XX XX XX XX X
20 30 40 50 60
*
10 20 30 40 50 60
70 80 90 100 110 120
130 140 150 160 170 180
190 200 210 220 230 240
250 260 270 280 290 300
310 320 330 340 350 360
380 390 400 410 420
* *
*
47
Appendix B1. Preliminary Report on Transcriptomic Results
(Preliminary) Transcriptomic analysis of Physella acuta for comparative
immunogenomics studies relative to Biomphalaria glabrata.
Background
Molecular characterization and analysis of expressed sequences (mRNA
transcripts) is commonly performed to determine differences between susceptibility and
resistance B. glabrata snails to particular strains of Schistosoma. mansoni parasitic
infection [Raghayan et al., 2003; Nowak et al., 2004; Hertel et al., 2005; Guillou et al.,
2007; Bender et al., 2007; Lockyer et al., 2008] and compared the immune responses
from bacterial infections or other pathogens [Adema et al, 2010; Hanelt et al.,2008;
Deleury et al., 2012]. Comparative immunogenomics is crucial in the identification of
transcripts that are determinants of immune function, especially from underrepresented
animals of the lophotrochozoan clade. These studies can pin-point unique transcripts in
response to specific treatment and/or identify trends of differences in expression levels of
transcripts. Function of many identified sequences without homologs in the databases
can not easily be inferred solely from trends in one single species without comparison to
phylogenetic close and increasingly distant relatives.
The freshwater snail, Physella acuta was chosen to develop as a comparative
immunogenomics model to B. glabrata as the two snails represent two sister families that
belong to the same taxonomic clade Hygrophila and are involved in similar parasite

48
lifecycles. Next-generation sequencing (NGS) can provide access to total transcriptomes
that represent different experimental treatments in a single run. In this study, 454
pyrosequencing was used to generate transcriptomic profiles from control and bacterial
exposed snails. This method of NGS was optimal for the physid snails as minimal
sequence characterization has been performed previously and without a reference genome
to map to, the longer sequence reads returned by 454 reads allow for easier assembly of
complete gene transcripts. Determining differential expression of transcripts is less
reliable than Illumina-based NGS (which more often requires a reference
genome/transcriptome), however, sorting computationally assembled transcripts based on
the number of constitutive reads does allow for identification of potentially up-regulated
transcripts. Validation of existence and expression levels from these potentially up-
regulated transcripts is necessary.
Preliminary BLAST searches have yielded several immune relevant transcripts
that are homologs to immune factors of B. glabrata. There were relevant candidates for
validation including the immune transcripts Aplysianin, Biomphalysin, Dermatopontin, a
FREP, and a Galectin-type lectin transcript. Aplysianin is an antimicrobial factor
[Butzke et al., 2004]. Biomphalysin is a beta-pore forming toxin found in B. glabrata,
this immune effector molecule is produced in response to S. mansoni infection [Galinier
et al., 2013]. Dermatopontin is involved in formation of extracellular matrix in both
vertebrates and invertebrates. However, in invertebrates, it has also been found to be an
adhesion/agglutination molecule during immune response [Huang et al., 2007] and it is
up-regulated in defense responses of B. glabrata [Hanington et al., 2010]. Galectin-type
lectin and FREPs are molecules that have been found to bind to carbohydrate structures

49
on various pathogens; galectin is a galactoside-binding lectin [Wang and Wang, 2013]
while FREPs can bind microbial and animal pathogens [Zhang et al., 2008 and Moné et
al., 2010], more information is available in Chapter 1, page 9.
Methods and Materials
454 pyrosequencing preparation
To generate a transcriptomic profile of the immune response of P. acuta snails to
bacteria, total RNA was extracted from one snail at 12 hour post injection of a 50/50 E.
coli and M. luteus bacterial mixture (bacterial exposed; BE) as well as one snail from a
sham-exposed group (SE), control. From high quality (spectrophotomerty, bioanalyzer
2100) whole body RNA, mRNA was isolated (Ambion® MicroPoly(A) Purist Kit, Life
Technologies) and a sample from each treatment was used for 454 Next-Gen sequencing
(Research and Testing Laboratory, Lubbock, TX). The 454 generated sequences were
contig-assembled (standard parameters, Newbler software, Roche) and larger contigs
(>500 nt) were sorted based on the number of constituent reads. Larger contigs with
>500 constituent reads were considered to be differentially expressed transcripts and
BLAST searches were performed for identification of highly expressed transcripts.
Remaining transcripts are currently awaiting annotation using standard bioinformatics
approaches [Hanelt et al., 2008], with assistance from the CETI bioinformatics core, and
analyzed for immune relevant transcripts.
Validation of NGS results
Total RNA was extracted from 3 snails of three different treatment groups: (1)

50
bacterial injections (B1- B3) and (2) sham exposure (S1- S3), and (3) sterile wounding
(W1- W3). The latter treatment was performed to identify transcripts expressed due to the
wounding associated with bacterial injections and, by elimination, identify pathogen-
specific responses. To target all mRNA transcripts and represent the expression profiles
for each snail and treatment, cDNA was reversed transcribed (Omniscript RT Kit;
Qiagen) using a poly-T primer to anneal to the mRNA 3’ poly-A tails.
From the computationally assembled full length transcripts, specific primers were
designed (Primer3; Rozen and Skaletsky, 2000) for RT-PCR amplification of target
transcript sequences. The amplification of 16S was used as a positive control. In case of
the FREP, primers were design to amplify and connect the the IgSF domain and the
fibrinogen domain (Figure B.2), that are critical for FREP identification. Resulting RT-
PCR amplicons were sequenced directly (BigDye, ABI) with the same pri mers to confirm
target identity.
Results
454 data: preliminary analysis
Half plate 454 pyrosequencing yielded 548,871 sequence reads for the SE snail
(average read length 355 bp) and 635,344 from the BE snail (average read length of 349
bp). In total, 1,184,215 sequence reads were returned, see Figure B.1.
Newbler-effected assembly generated 98 transcripts with greater than 500
constituent reads. Forty six of these transcripts were shared between SE and BE, 24 were
unique to the SE snail, and 28 were unique to the BE snail. From the BE unique
transcripts, BLAST searches identified Aplysianin-, Biomphalysin-, and Dermatopontin-

51
like sequences. General BLAST searches among the total transcriptomic data also
identified Galectin- and FREP-like sequences (Fig. B.1). These five transcripts were the
targets for RT-PCR and direct sequencing for validation of transcript prediction and
expression.
Validation by RT-PCR
Generally, RT-PCR reactions yielded multiple amplicons and will require
optimization. However, sequences were obtained from reactions that yielded prominent
amplicon bands for individual snails. Expression of Biomphalysin and Galectin could
not be confirmed by sequencing at this time though Galectin-specific primers generated
amplicons of the anticipated size. Aplysianin was recovered and confirmed by direct
sequencing from a bacterially-exposed snail. Dermatopontin yielded amplicons from all
three treatment groups and was confirmed by sequence in wounded and bacterially-
exposed treatment groups. FREP amplicons also appeared in every treatment group and
were confirmed by sequence in sham and bacterially exposed snails. Figure B.2 displays
the domains of the FREP discovered in P. acuta. See Table B.1 for summary of results.
Discussion
RNA-seq provided for the first time, comprehensive transcriptomic data for P.
acuta. Preliminary bioinformatics analysis revealed several immune relevant transcripts
that are homologs to defense factors of B. glabrata. Discovery of a FREP is especially
noteworthy; physids are now the third member of the Gastropoda for which FREPs have
52
been described. This suggests that P. acuta will be a good model for comparative
immunogenomics studies relative to B. glabrata.
At this stage, three of the five target transcripts were validated independent from
prediction. Primer optimization is likely to improve these results. Multiple amplicons
resulting from some primer combinations may have resulted from technical challenges.
One example I did experience was single primers acting as both a forward and reverse
primer and thus generated undesired amplicons. Other potential problems may have been
if designed primers, with high specificity for the target transcript, were annealing (and
had reduced specificity) to other transcript sequences, generating the true among many
false amplicons. This may be due to similar sequence or shared domains among several
transcripts. Multiple amplicons could have potentially been result of contamination by
genomic DNA , where both RT-created cDNA and gene would generate amplicons of
different sizes if the primers annealing to genomic DNA included intron sequence(s).
However, the RNA extraction protocol incorporated a DNA elimination step and the
RNA quality check (BioAnalyzer) did not indicate DNA contamination, thus, multiple
amplicons are less likely due to DNA contamination. Lastly, multiple amplicons may be
due to the presence of polymorphic target sequences which is interesting in the context of
immune function.
In summary, more work will need to be performed to confirm the two remaining
transcripts from a single treatment and bioinformatics of the full data set is still pending.
However, this work has begun to reveal some common aspects of the immune
capabilities of B. glabrata and P. acuta.

53
RNA-seq: response to bacteria
VS
Septic Exposure Control
548,871 readsAve: 355 nt
635,344 readsAve: 349 nt > 500 nt
46 2428
Sorted≥ 500 constituent reads
Unique to SE
Aplysianin
Biomphalysin
Dermatopontin
Additional search
Galectin
Physid FREP
Newbler Contigs
7,745contigs
7,611contigs
Figure B.1. RNA-seq, identification of immune relevant sequences from P. acuta.

54
Outline
Rationale
Physella acuta
Mitochondrial genomics
(Immune-)transcriptomics
Conclusion
Future work
PROTEINC
SP IgSF ICRICR FBG
N
Figure B.2. Basic structure of a FREP molecule. The FREP protein begins with a signaling peptide (SP) followed by the critical immunoglobulin super family (IgSF) domain, an interconnecting region (ICR), and ending with the defining fibrinogen domain (FBG). This unique structure from mRNA transcripts of P. acuta. Clearly, FREPs can be studied in physid snails.

55
Table B.1. Transcript validation by RT-PCR and direct sequencing. Individual snails are identified by S for sham, W for wounding, and B for bacterial exposure. 16S was used as a positive control. Galectin and often FREP specific primers yielded double amplicons* that prevented direct sequencing. Results are summarized from two replicate RT-PCR experiments. Amplicon = a, Sequence = s.
Aplysianin Biomphalysin Dermatopontin FREP Galectin 16S
a s a s a s a s a s a
S1 *
S2 * *
S3 * *
W1 * *
W2
W3
B1 *
B2 * *
B3 * *

Aplysianin-A like/achacin: P. acuta aligned to B. glabrata [snaildb.org; contig 372 ORF sequence only]. Underlined amino acid sequence indicates signaling peptide. Forward and reverse primers highlighted in yellow and green, respectively. P. acuta 1 MIYVAFLCLFALALGQEPENPSRRITDQCQRIVDVAVIGAGTTGAYAAYKLKDQQLKVEV 60 --------------------------++C R VD+A++GAG + AY Y ++ L VE+ B. glabrata 1 MLLAVLAVAWA----------EIDPLEKCDRKVDLAIVGAGPSRAYFGYMMRKAGLNVEI 50 P. acuta 61 VELKDVVGGRHQTVYLPDVPSIPVELGQRMYADIHPIMQRLVSELGLTQEVFPEGWANKE 120 +E D VGGRH+T LP + ++P++LG MY+D+H M+ ++ EL LT+E FP GW E B. glabrata 51 IEYTDRVGGRHKTERLPGLENVPIDLGPIMYSDLHQRMKTIIQELELTEENFPSGWTVPE 110 P. acuta 121 --RFYLKGQHYKQEDIESNSVNLPYDLTPEEKQNQGNIVKFYFKKLT---GLDLQPLMPR 175 R+ LKGQ + +++I+ + LPY LT EEK NQG + ++Y +KLT G D+ P + B. glabrata 111 ETRYVLKGQSFTEKEIQ-DGAPLPYQLTKEEKDNQGRLARYYLEKLTSYTGSDMPPNIRM 169 P. acuta 176 EQRLLLKVIKPTX--RLYEHRIDEALDLVASPGGKEFFKAIVKSRYAIYKDASALLVFGD 233 R+ L+ + LY++ + EALDLVAS GKE F A+ K + A+YKD +A+L F + B. glabrata 170 HLRVQLQDSRGLQYKHLYQYNLSEALDLVASKDGKELFMALSKRKGAVYKDVNAVLAFSN 229 P. acuta 234 EMDYNNANTTLYKVREGMDSIPKKLIEKFTMASSSNKVTFNRKLEAIQRFQNMTYILKLK 293 +Y++ N T ++++GM+++P+ LI+KF SS +K++ NRKL+AI + YI++LK B. glabrata 230 HFNYDSNNATRKRIQQGMEALPRTLIKKFLDESSKHKLSLNRKLDAIAGRELFDYIMRLK 289 P. acuta 260 ETKTVDGRIIELGPEEFLCAKQVILAIPKDSLDHLQWSCTKGWTQRMALNAVRPVPEHRV 353 +T+T DGR E+GPEEF+CA +++LA+P SL +QW K AL++VR VP V B. glabrata 256 QTETKDGRTYEIGPEEFVCASKIVLALPASSLKIIQWEPLKSSLVSEALDSVRSVPVSTV 349
56

P. acuta 354 VMSFNVDFWSGTDFP-KMTNIKFTDTVLGSLQALGKSNNQNLLLA—(incomplete)-- 392 VM+F+ W D P K ++ FTD + + LG+S B. glabrata 350 VMTFSQRHWQ--DNPNKKASVLFTDESISQVVELGQSPDSRAYVLQASFAEGDRVRDLET 408 P. acuta --- ------------------------------------------------------------ --- B. glabrata 409 LNLYKSAGSSQLGENQVSQELSDHIITKLSSVFGTQFSKPLSSMGVFWTKYPQSGGQTVW 468 P. acuta --- ------------------------------------------------------ --- B. glabrata 469 KANRHYDLVKSIIEHPSIEDDVYVVGSDFAWGNLQFWTEGSLETVENVLFKYFV 524
57

Biomphalysin: P. acuta aligned to B. glabrata [GenBank: KC012466]. Underlined region indicates signaling peptide. No primers are indicated; no designed primers successfully amplified the cDNA transcript. P. acuta -- ------------------------------------------------------------ -- B. glabrata 1 MFLQIFVAVTLVQYVSSQCTYSSWWYSFDTPGQSKCNEINSYINALDRNDVNWADDALSN 60 P. acuta ------------------------------------------------------------ B. glabrata 61 LEGVQCCRPPAPWNNVEQQVVYEDWTATLDSDYTWAFCRVGYFLQGLYRSDTGWPRFKGY 120 P. acuta 1 ------(incomplete)-----------------------ESYVAGVYRGTYNKLYFLE 17
++ G+YR + LYFL+ B. glabrata 121 LFNLESARCTKPANHPLNYGTCQDIDVSSCMGRKGQCSCPGGYFLTGLYRADGDDLYFLK 180 P. acuta 18 KLRCCKTAEGPEELDELYKVKTRIMDTTMWDMASLARFLGYGYPGGCRGFEKVGENENFR 77 K+RCC A P E+DE K++TRIMDTT+W+MA+LA ++GYG+ GC G VGE+F F B. glabrata 181 KIRCCTPAAKPLEMDEKSKIQTRIMDTTLWNMATLAHYMGYGWCYGCHGL-AVGEDEDFT 199 P. acuta 78 RSGDTWKADTS---GR-CTGYLSDKRLSMAYGDWSFGIKDIKYGTPVIQDLIPETIDFGT 133 R+G TW ADT G+ C G + +RL++ +GDW F +K+I YG VI+DL E++D G B. glabrata 200 RNGFTWAADTRTFWGKWCEGDKNGERLNLVFGDWGFAVKEIIYGKSVIEDLQAESVDSGV 259 P. acuta 134 ISNDDPTDVTKTIMQSETSVRSVTHTTTSSWKNSDELNVQVSFMPYGVGVSAGYKFNYET 193 + N + VT++I +S+T ++TH+TTS++ NS L V++ F V A YK +E B. glabrata 260 LYNRASSPVTESIERSKTIQETITHSTTSTFTNSHGLGVELEFEIASVKGKASYKTRFEY 319
58

P. acuta 194 STTTSDETKKEQSKTFVVNTSKTLKPNSASKWSLVLSKTRTSVTYTATVIAKFSCELQGI 253 ST+T++ +++ F +S TL P +K+ +++SK+RT+V YTA + KFS E++G B. glabrata 320 STSTTNSKSISETQGFTKQSSITLGPMEGAKYEVIMSKSRTTVPYTAIITTKFSTEMKGF 379 P. acuta 254 LSWFEGSNSKYSNYHYQHRGNEDFPRFHYRFGDSSIPFYTALKRQSETNSLPWMWNDMKN 313 L W +G+ N+H +R N P F+YRFGDSS+PFY ALK+QS+ N WMW + B. glabrata 380 LRWEDGN----GNFHQDYRTNSGRPTFNYRFGDSSVPFYKALKKQSDNNEGVWMWGMLFQ 435 P. acuta 314 AHPNAQYFINDLCNENRYTFKI---(incomplete)----------------------- 336 P+A+ N L +E +Y F + B. glabrata 436 KFPDARRVTNRLTDETQYQFTLAGKLEKVEGTSVNVKWEKMKLNRRDVSGNDEPGSNITT 495 P. acuta -- --------------------------------------- -- B. glabrata 496 YIAASGPADKPAVVEYPKVNLNNKEPFKPIEIPVTEVKV 534 59

Dermatopontin: P. acuta aligned to B. glabrata [GenBank: DQ113395]. Underlined region indicates signaling peptide. Forward and reverse primers highlighted in yellow and green, respectively. P. acuta 1 MYAVVFALCLVGALSQRGDWDPERDWDSDRDRDRDRGFVHDWREDFTFKCPADQIINRLV 60
+V+DW + F F+CP Q+++ + B. glabrata 1 MASVASAAYVNDWDQPFNFRCPDGQVVSYVS 31 P. acuta 61 SVHSSEKNDRRWRIFCKSVTGGTRNCETSEFANDFDEPLLYKCPSGKVLTGIKSDYDSRS 120 S+H++ + DRRW C+S T T +C S + NDFD PL+Y CP KV+ G+ S +++R B. glabrata 32 SIHNNRREDRRWEFLCRS-TRQTHSCTDSGYVNDFDGPLVYTCPGNKVMVGVHSYHNNRR 90
P. acuta 121 KDRRYSFQCCKVRRSNPSDCKLSDWQNNFGEKLRYMVPDGWGIRGVYSFHKNKE------ 174 +DRR+ F CC V+ S P DC +++ N++ EKL +VP+G ++ YS H N+ B. glabrata 91 EDRRFGFYCCDVQGSTPRDCYTTNYVNDWDEKLTLVVPEGTAVKAAYSHHDNRREDRRWQ 150 P. acuta --- ------(incomplete) B. glabrata 151 FQICTL 156
60

FREP: P. acuta aligned to B. glabrata [GenBank: AAC47699]. Underlined regions indicate signaling peptide (single) and interconnecting region. (double). Forward and reverse primers highlighted in yellow and green, respectively. P. acuta 1 MGTLRRFGVFGLFCFFHLAASNPSNVKADPSISASPATIRLGXTQSLSVRCDIPAGWGS- 59 S A I L C B. glabrata 1 MKNLLLCLFLVSATLGSR-----------LSFNANVEKINEVIR-PLMLTCSFEVSRNDS 48 P. acuta 60 --IDSVILSQVDGTAVHPLAEITPSIGV---ISTLAAEDAKVT-GALNPAGN---YLQVT 110 V H I I A G LN + QVT B. glabrata 49 WQNTKVQLMYIM----HETKGFVATITKDQNITGNADMTFSEGQGTLNNEIDNTSFFQVT 104 P. acuta 111 WSFPQVATSGVYACEGVGTNSLGK----SVSFSVQVRVSTEYASQPEYVNEIITLHKQQQ 166 W SG Y C TN+ GK S S VQV+ E A +YV ++ K+ B. glabrata 105 WKNASNELSGKYICVVHATNAEGKVEFLSASLKVQVQ-KLEIADLAQYVVDLTARVKESD 163 P. acuta 167 QTVQLLADAYATVNATQHLLDK---AARR----IRQINDN----CEPVVG-TGCSDPSLP 214 +Q ++ + L + AA R I+++N N CE + T C D B. glabrata 164 DKIQNYTRNVTSIKEELNALKENHLAALRSLDIIKKVNKNLQLSCECLAKPTSCRDVIST 223 P. acuta 215 VGQHVITVTPNDGLGGIKVLCDVRVPGDGWTVFQKRFNGSVDFYEDYAAYENGFGNVDGG 274 + V+T+ G++V+CD G GWT+FQ+RFNGS+DFY D+ Y GFG+ + G B. glabrata 224 EDRVVVTLAS-----GLEVMCDTTTDGGGWTIFQRRFNGSIDFYRDWKEYRDGFGDYNIG 278 P. acuta 275 EFWLGLKNIRRLLLENNDENTLRIDMTEQGTGFNFTRVYPVFMLGDESGSYTLFLDGYD- 333 EF+LG +NI L E LR D+ + + F Y F L DE+ Y L + Y B. glabrata 279 EFYLGNENIFNLTSSRKYE--LRFDLEYENKKY-FAH-YSDFKLLDENNKYKLIIGSYSG 334 P. acuta 334 DGGTGMSANSGARFSTFDKDT----SGGCPSSLRIAGWWFETGCGYVNLNGLYGLSXGEA 389 + G M + F+TFDND + C + +R WW++ C VNLNG +G GE B. glabrata 335 NAGDSMRRHVNKFFTTFDKDNDDSPNDNC-AIIRRGAWWYQ-NCADVNLNGNWGR--GEP 390
61

P. acuta 390 S-MFWYEIYNHPRHSMSRTEMKFKRAKCPLSTFRQ 423 +FW I S+S +E+K + B. glabrata 391 DGVFWDNITVWE—SVSFSEIKIREIDKEKNKS 421
62

Galectin: P. acuta aligned to Tandem Repeat Galectin from B. glabrata [GenBank: EF687664]. No signal peptide was predicted. The two tandemly arranged galectin domains are underlined with a single and double line, respectively. Forward and reverse primers highlighted in yellow and green, respectively. P. acuta 1 -----(incomplete)-------------------NLCSGQTYD-SDTALHFNPRFDQN 23 ------------------------------------NLC+G T+D SD ALHFNPRF+QN B. glabrata 1 MAYPVPYSAPLPFTLADGKEIIIDGVVTPYCSRFSINLCAGPTFDNSDAALHFNPRFEQN 60 P. acuta 24 EVVRTHNRGGWGAEEKHGGFPFYKGGAFEVKIIVRHHAFQIFVNNTFFCDFNHRIPKETA 83
EVVRTH G WG EEKHGGFPFY+G AF++KI+VRHHAFQI+VNN +F DFNHR+ KE B. glabrata 61 EVVRTHKCGNWGPEEKHGGFPFYRGAAFQLKIVVRHHAFQIYVNNNYFTDFNHRLAKEAV 120 P. acuta 84 RFLYIAGDVTINRIAYLDVIQNPPVPLTTFINGGIYPGRKIVIDGIPRPGASRFNVNLVC 143 R+LYIAGDV+INRIA+ DVI NP VPLT I+G + G++IVI G+PR GA RFNVNLVC B. glabrata 121 RYLYIAGDVSINRIAFSDVIINPAVPLTLPISGALQHGKQIVIQGVPRHGAQRFNVNLVC 180 P. acuta 144 GPNFDANDVALHFDARFNYGDSHNTVVRTHKAPGAAWGAEEKHCS-YSLRAKRPVEILIL 203 GP+FD DVALHFDARFN+G HNTVVR HK+ G +WG EE H + + P EI I B. glabrata 181 GPSFDGCDVALHFDARFNFGSCHNTVVRNHKSSG-SWGGEETHANFFPFSCNTPFEIRIY 239 P. acuta 204 VESHGFKIAVNNQHF-------------(incomplete)----- 218 VE HG+++ VNNQHF------------------------------ B. glabrata 240 VEHHGYRVTVNNQHFTEFNHRIHPVQRVSHLNIQGDVNLSQVSIQ 284
63

64
REFERENCES
Adams, M.D., Celniker, S.E., Holt, R.A., Evans. C.A., Gocayne, J.D., Amanatides, P.G.,
Scherer, S.E., Li, P. W., Hoskins, R.A., Galle, R.F., George. R.A., Lewis. S.E., Richards,
S., Ashburner, M., Henderson, S.N, Sutton. G.G., Wortman, J.R., Yandell, M.D., Zhang,
Q., Chen, L.X., Brandon, R.C., Yu-Hui C. Rogers, Y-H.C., Blazej, R.G., Champe, M.,
Pfeiffer, B.D., Wan, K.H., Doyle, C., Baxter, B.E., Helt, G., Nelson, C.R.4, et al. 2000.
The Genome Sequence of Drosophila melanogaster. Science, 287(5461): 2185-2195.
Adema, C.M., Hertel, L.A., Miller, R.D. & Loker, E.S. 1997. A family of fibrinogen-
related proteins that precipitates parasite-derived molecules is produced by an
invertebrate after infection. PNAS, 94:8691–8696.
Adema, C.M., Hanington, P.C., Lun, C.-M., Rosenberg, G.H., Aragon, A.D., Stout, B.A.,
Lennard-Richard, M.L., Gross, P.S. & Loker, E.S. 2010. Differential transcriptomic
responses of Biomphalaria glabrata(Gastropoda, Mollusca) to bacteria and metazoan
parasites,Schistosoma mansoni and Echinostoma paraensei (Digenea, Platyhelminthes).
Molecular Immunology, 47(4): 849-860.
Albrecht, C., Kroll, O., Moreno-Terrazas, E. & Wieke, T. 2009. Invasion of ancient Lake
Titicaca by globally invasive Physa acuta (Gastropoda: Pulmonata: Hygrophila).
Biological Invasions, 11: 1821-1826.
Alföldi, J. & Lindblad-Toh, K. 2013. Comparative genomics as a tool to understand
evolution and disease. Genome Research, 23:1063-1068.
Altschul, S.F., Madden, T.L., Schäffer, A.A., Zhang, J., Zhang, Z., Miller, W. & Lipman,
D.J. 1997. Gapped BLAST and PSI-BLAST: a new generation of protein database search
programs. Nucleic Acids Research, 25: 3389-3402.
Armbruster, G.F.J. & Bernhard, D. 2000. Taxonomic significance of ribosomal ITS-1
sequence markers in self-fertilizing land snails of Cochlicopa (Stylommatophora,
Chochilcopidae). Zoosystematics and Evolution, 76:11-18.
Armbruster, G.F.J. & Korte, A. 2006. Genomic nucleotide variation in the ITS1 rDNA
spacer of land snails. Journal of Molluscan Studies, 72(2): 211-213.
Ballard, J.W.O. & Whitlock, M.C. 2004. The incomplete natural history of mitochondria.
Molecular Ecology, 13: 729-744.
Bandyopadhyay, P.K., Stevenson, B.J., Ownby, J.-P., Cady, M.T., Watkins, M. &
Olivera, B.M. 2008. The mitochondrial genome of Conus textile, coxI-coxII intergenic
sequences and Conoidean evolution. Molecular Phylogenetics and Evolution, 46(1):215-
223.
65
Bayne, C.J. 2009. Successful parasitism of vector snail Biomphalaria glabrata by the
human blood fluke (trematode)Schistosoma mansoni: a 2009 assessment. Molecular and
Biochemical Parasitology, 165(1):8-18.
Bender, R.C., Goodall, C.P., Blouin, M.S. & Bayne C.J. 2007. Variation in expression of
Biomphalaria glabrata SOD1: A potential controlling factor in susceptibility/resistance to Schistosoma mansoni. Developmental and Comparative Immunology, 31(9): 874-878.
Benson, D.A., Cavanaugh, M., Clark, K., Karsch-Mizrachi, I., Lipman, D.J., Ostell, J. &
Sayers, E.W. 2013. GenBank. Nucleic Acids Research, 41:D36-42
Boore, J.L. 1999. Animal mitochondrial genomes. Nucleic Acids Research, 27:1767-1280.
Boore, J.L., Medina, M. & Rosenberg, L.A. 2004. Complete Sequences of the Highly
Rearranged Molluscan Mitochondrial Genomes of the Scaphopod Graptacme eborea and
the Bivalve Mytilus edulis. Molecular Biology and Evolution, 21(8):492-1503.
Boore J.L., Macey, J.R. & Medina, M. 2005. Sequencing and comparing whole
mitochondrial genomes of animals. In: Molecular evolution: producing the biochemical
data, Part B of the methods in enzymology series, Vol. 395(E.A. Zimmer & E. Roalson
Elsevier, Burlington.
Bousset, L., Henry, P.Y., Sourrouille, P. & Jarne, P. 2004. Population biology of the
invasive freshwater snail Physa acuta approached through genetic markers, ecological
characterization and demography. Molecular Ecology, 13:2023-2036.
Brown, W.M., George Jr., M. & Wilson, A.C. 1979. Rapid evolution of animal
mitochondrial DNA. PNAS, 76(4):1967-1971.
Burch, J.B. 1989. North American Freshwater Snails. Malacological Publications.
Hamburg, MI. 364 pp. 276.
Butzke, D., Machuy, N., Thiede, B., Hurwitz, R., Goedert, S. & Rudel, T. 2004.
Hydrogen peroxide produced by Aplysia ink toxin kills tumor cells independent of
apoptosis via peroxiredoxin I sensitive pathways. Cell Death and Differientiation, 11(6):
608-617.
Cartier, N. & Aubourg, P. 2009. Hematopoietic Stem Cell Transplantation and
Hematopoietic Stem Cell Gene Therapy in X-Linked Adrenoleukodystrophy. Brain
Pathology, 20(4): 857–862.
Castro, L.R. & Colgan, D.J. 2010. The phylogenetic position of Neritimorpha based on the mitochondrial genome of Nerita melanotragus (Mollusca: Gastropoda). Molecular
Phylogenetics and Evolution, 57:918-923.

66
Correa, A.C., Escobar, J.S., Durand, P., Renaud, F., David, P., Jarne, P., Pointier, J.-P. &
Hurtrez-Boussès, S. 2010. Bridging gaps in the molecular phylogeny of the Lymnaeidae
(Gastropod: Pulmonata), vectors of Fascioliasis. BMC Evolutionary Biology, 10:381.
Cunha, R.L., Grande, C., & Zardoya, R. 2009. Neogastropod phylogenetic relationships
based on entire mitochondrial genomes. BMC Evolutionary Biology, 9:210.
Dayrat, B., Conrad, M., Balayan, S., White, T.R., Albrecht, C., Golding, R., Gomes,
S.R., Harasewych, M.G. & Martins, A.M. 2011. Phylogenetic relationships and evolution
of pulmonate gastropods (Mollusca): New insights from increased taxon sampling.
Molecular Phylogenetics and Evolution, 59:425-437.
De Rijk, P., Wuyts, J. & De Wachter, R. 2003. RnaViz2: an improved representation of
RNA secondary structure. Bioinformatics, 19:299-300.
DeJong, R.J., Morgan, J.A.T., Paraense, W.L., Pointier, J.-P., Amarista, M., Ayeh-Kumi,
P.F.K., Babiker, A., Barbosa, C.S., Brémond, P., Canese, A.P., Pereira de Souza, C.,
Dominguez, C., File, S., Gutierrez, A., Incani, R.N., Kawano, T., Kazibwe, F., Kpikpi, J.,
Lwambo, N.J.S., Mimpfoundi, R., Njiokou, F., Poda, J.N., Sene, M., Velásquez, L.E.,
Yong, M., Adema, C.M., Hofkin, B.V., Mkoji, G.M. & Loker, E.S. 2001. Evolutionary
Relationships and Biogeography of Biomphalaria (Gastropoda: Planorbidae) with
Implications Regarding Its Role as Host of the Human Bloodfluke, Schistosoma mansoni.
Molecular Biology and Evolution, 18(12):222-239.
DeJong, R.J., Emery, A.M. & Adema, C.M. 2004. The mitochondrial genome of
Biomphalaria glabrata (Gastropoda: Basommatophora), intermediate host of
Schistosoma mansoni. Journal of Parasitology, 90:991-996.
Deleury, E., Dubreuil1, G., Elangovan, N., Wajnberg, E., Reichhart, J-M, Gourbal, B.,
Duval, D., Baron, O.L., Gouzy, J. & Coustau, C. 2012. Specific versus Non-Specific
Immune Responses in an Invertebrate Species Evidenced by a Comparative denovo
Sequencing Study. PLoS ONE, 7(3): e32512.
Dillon, R.T.Jr, Wethington, A.R. & Lydeard, C. 2011. The evolution of reproductive
isolation in a simultaneous hermaphrodite, the freshwater snail Physa. BMC Evolutionary
Biology, 11:144.
Dillon, R.T.Jr & Frankis, R.C.Jr. 2004. High levels of mitochondrial DNA sequence
divergence in isolated populations of freshwater snails of the genus Goniobasis Lea,
1862*. American Malacological Bulletin, 19(1/2):69-77.
Doucet-Beaupré, H., Breton, S., Chapman, E.G., Blier, P.U., Bogan, A.E., Stewart, D.T.,
Hoeh, W.R. 2010. Mitochondrial phylogenomics of the Bivalvia (Mollusca): searching
for the origin and mitogenomic correlates of doubly uniparental inheritance of mtDNA.
BMC Evolutionary Biology,10: 50.
67
Draparnaud, J.P.R. 1805. VII PHYSE Physa. In Histoire Naturelle des Mollusques
Terrestres et Fluviatiles de la France, Ouvrage posthume, Avec XIII planches, pp. 55.
Montepellier, Paris
Escobar, J.S., Nicot, A. & David, P. 2008. The Different Sources of Variation in
Inbreeding Depression, Heterosis and Outbreeding Depression in a Metapopulation of
Physa acuta. Genetics, 180:1593–1608.
Feldmeyer, B., Hoffmeier, K. & Pfenninger, M. 2010. The complete mitochondrial
genome of Radix balthica (Pulmonata, Basommatophora), obtained by low coverage
shotgun next generation sequencing. Molecular Phylogenetics and Evolution, 57:1329-
1333.
Files, V.S. & E.B. Cram, E.B. 1949. A study on the comparative susceptibility of snail
vectors to strains of Schistosoma mansoni. Journal of Parasitology, 35: 555–560.
Fischer, A., Hacein-Bey-Abina, S. & Cavazzana-Calvo, M. 2010. 20 years of gene
therapy for SCID. Nature Immunology, 11(6): 457–460.
Folmer, O., Black, M., Hoeh, W., Lutz, R. & Vrijenhoek, R. 1994. DNA primers for
amplification of mitochondrial cytochrome c oxidase subunit I from diverse metazoan
invertebrates. Molecular Marine Biology and Biotechnology, 5:294-299.
Galinier, R., Portela, J., Moné, Y., Allienne, J.F., Henri, H., Delbecq, S., Mitta, G.,
Gourbal, B., Duval, D. 2013. Biomphalysin, a new β pore-forming toxin involved in
Biomphalaria glabrata immune defense against Schistosoma mansoni. PLoS Pathology,
9(3): e1003216.
Ghosh J. G., Buckley K. M., Nair S. V., Raftos D. A., Miller C. A., Majeske A. J., Hibino
T., Rast J. P., Roth M., Smith L. C. 2010. Sp185/333: a novel family of genes and
proteins involved in the purple sea urchin immune response. Developmental and
Comparative Immunology, 34: 235–245.
Gissi, C., Iannelli, F. & Pesole, G. 2008. Evolution of the mitochondrial genome of
Metazoa as exemplified by comparison of congeneric species. Heredity, 101: 301–320.
Goertzel, T. & Goertzel, B. 1995. Linus Pauling: A Life in Science and Politics. Basic
Books, New York.
Gorbushin, A.M., Panchin, Y.V. & Iakovleva, N.V. 2010. In search of the origin of
FREPs: characterization of Aplysia californica fibrinogen-related proteins.
Developmental and Comparative Immunology, 34(4):465-73.
Grande, C., Templado, J. & Zardoya, R. 2008. Evolution of gastropod mitochondrial
genome arrangements. BMC Evolutionary Biology, 8:61.

68
Granjeau, S., Bertucci, F. & Jordan, B.R. 1999. Expression profiling: DNA arrays in
many guises. BIOESSAYS, 21(9): 781-790.
Gross, S.S., Do, C.B., Sirota, M. & Batzoglou, S. 2007. CONTRAST: a discriminative,
phylogeny-free approach to multiple informant de novo gene prediction. Genome Biology,
8:R269.
Guillou, F., Mitta, G., Galinier, R. & Coustau, C. 2007. Identification and expression of
gene transcripts generated during and anti-parasitic response in Biomphalaria glabrata.
Developmental and Comparative Immunology, 31(7):657-671.
Halanych, K.M. & Passamaneck, Y. 2001. A brief review of metazoan phylogeny and
future prospects in Hox-research. American Zoologist, 41:629-639.
Hall, T.A. 1999. BioEdit: a user-friendly biological sequence alignment editor and
analysis program for Windows 95/98/NT. Nucleic Acids Symposium Series, 41:95-98.
Hanington, P.C., Lun, C.M., Adema, C.M. & Loker, E.S. 2010. Time series analysis of
the transcriptional responses of Biomphalaria glabrata throughout the course of
intramolluscan development of Schistosoma mansoni and Echinostoma
paraensei. International Journal of Parasitology, 40:819–831.
Hanington, P.C. & Zhang, S-M. 2010. The Primary Role of Fibrinogen-Related Proteins
in Invertebrates Is Defense, Not Coagulation. Journal of Innate Immunity 3(1): 17–27.
Hanelt, B., Lun, C.M. & Adema, C.M. 2008. Comparative ORESTES-sampling of
transcriptomes of immune-challenged Biomphalaria glabratasnails. Journal of
Invertebrate Pathology, 99(2):192-203.
Hatzoglou, E., Rodakis, G.C. & Lecanidou, R.L. 1995. Complete sequence and gene
organization of the mitochondrial genome of the land snail Albinaria coerulea. Genetics,
140:1353-1366.
Hertel, L.A., Adema, C.M. & Loker, E.S. 2005. Differential expression of FREP genes in
two strains of Biomphalaria glabrata following exposure to the digenetic trematodes Schistosoma mansoni and Echinostoma paraensi. Developmental and Comparative
Immunology, 29(4): 295-303.
Huang, G., Liu, H., Han, Y., Fan, L., Zhang, Q., Liu, J., Yu, X., Zhang, L., Chen, S.,
Dong, M., Wang, L. & Xu, A. 2007. Profile of acute immune response in Chinese
amphioxus upon Staphylococcus aureus and Vibrio parahaemolyticus infection. Dev
Comparative Immunology, 31(10):1013-1023.
Jannotti-Passos, L.K., Ruiz, J.C., Caldeira, R.L., Murta, S.M., Coelho, P.M. & Carvalho,
O.S. 2010. Phylogenetic analysis of Biomphalaria tenagophila (Orbigny,
1935)(Mollusca: Gastropoda). Memórias do Instituto Oswaldo Cruz, 105: 504-51.

69
Jenner, R.A. 2004. Towards a phylogeny of the Metazoa: evaluating alternative
phylogenetic positions of Platyhelminthes, Nemertea, and Gnathostomulida, with a
critical reappraisal of cladistic characters. Contributions to Zoology, 73(1/2): 3-163.
Jex, A.R., Hall, R.S., Littlewood, D.R.J, Gasser, R.B. 2010. An integrated pipeline for
next-generation sequencing and annotation of mitochondrial genomes. Nucleic Acids
Research, 38(2):522-533.
Jörger, K.M., Stöger, I., Kano, Y., Fukuda, H., Knebelsberger, T. & Schrödl, M. 2010.
On the origin of Acochlidia and other enigmatic euthyneuran gastropods, with
implications for the systematics of Heterobranchia. BMC Evolutionary Biology, 10:323.
Kang, C.J., Wang, J.X., Zhao, X.F., Yang, X.M., Shao, H.L., Xiang, J.H. 2004.
Molecular cloning and expression analysis of Ch-penaeidin, and antimicrobial peptide
from Chinese shrimp, Fenneropenaeus chinensis. Fish Shellfish Immunology, 16: 513-525.
Kasinathan, R.S., Morgan, W.M. & Greenberg, R.M. 2010. Schistosoma mansoni express
higher levels of multidrug resistance-associated protein 1 (SmMRP1) in juvenile worms
and in response to praziquantel. Molecular and Biochemical Parasitology, 173: 25–31.
Kayal, E., Roure, B., Philippe, H., Collins, A.G. & Lavrov, D.V. 2013. Cnidarian
phylogenetic relationships as revealed by mitogenomics. BMC Evolutionary Biology,
13:5
Kefford, B.J. & Nugegoda, D. 2005. No evidence for a critical salinity threshold for
growth and reproduction in the freshwater snail Physa acuta. Environmental Pollution,
134:377-383.
Ki, J.S, Lee, Y.M., Jung, S.O., Horiguchi, T., Cho, H.S. & Lee, J.S. 2010. Mitochondrial
genome of Thais clavigera (Mollusca: Gastropoda): affirmation of the conserved,
ancestral gene pattern within the molluscs. Molecular Phylogenetics and Evolution,
54(3):1016-1020.
Kilpert, F. & Podsiadlowski, L. 2006. The complete mitochondrial genome of the
common sea slater, Ligia oceanica (Crustacea, Isopoda) bears a novel gene order and
unusual control region features. BMC Genomics, 7:241.
King, C.H., Dickman, K. & Tisch, D.J. 2005. Reassessment of the cost of chronic
helminthic infection: a meta-analysis of disability-related outcomes in endemic
schistosomiasis. Lancet, 365:1561–1569.
King, N., Westbrook, J.M., Young, S.L., Kuo, A., Abedin,M., Chapman, J., Fairclough,
S., Hellsten, U., Isogai, Y., Letunic, I., Marr, M., Pincus, D., Putnam, N., Rokas, A.,
Wright, J.K., Zuzow, R., Dirks, W., Good, W., Goodstein, D., Lemons, D., Li, W., Lyons,
J.B., Morris, A., Nichols, S., Richter, D.J., Salamov, A., JGI Sequencing, Bork, P., Lim,

70
W.A., Manning, et al. 2008. The genome of the choanoflagellate Monosiga
brevicollis and the origin of metazoans. Nature, 451: 783-788.
Klussmann-Kolb, A., Dinapoli, A., Kuhn, K., Streit, B., Albrecht, C. 2008. From sea to
land and beyond – New insights into the evolution of euthyneuran Gastropoda (Mollusca).
BMC Evolutionary Biology, 8:57.
Knudsen, B., Kohn, A.B., Nahir, B., McFadden, C.S. & Moroz, L.L. 2006. Complete
DNA sequence of the mitochondrial genome of the sea-slug, Aplysia californica:
conservation of the gene order in Euthyneura. Molecular Phylogenetics and Evolution,
38:459-469.
Kocot, K.M., Cannon, J.T., Todt, C., Citarella, M.R., Kohn, A.B., Meyer, A., Santos,
S.R., Schander, C., Moroz, L.L., Lieb, B. & Halanych, K.M. 2011. Phylogenomics
reveals deep molluscan relationships. Nature, 477(7365): 453-456.
Korf, I. 2004. Gene finding in novel genomes. BMC Bioinformatics, 5:59.
Kurabayashi, A.& Ueshima, R. 2000. Complete sequence of the mitochondrial DNA of
the primitive opisthobranch gastropod Pupa strigosa: systematic implication of the
genome organization. Molecular Biology and Evolution, 17:266-277.
Lee, Y.S., Lee, S.G., Kang, S.W., Jeong, J.E., Baek, M.K., Choi, S.H., Chae, S.H., Jo,
Y.H., Han, Y.S. & Park, H.S. 2011. Expressed Sequence Tag Analysis of Physa acuta: A
Freshwater Pulmonate in Korea. Journal of Shellfish Research, 30:127-132.
Lemaitre, B., Nicolas, E., Michaut, L., Reichhart, J.M. & Hoffmann JA. 1996. The
dorsoventral regulatory gene cassette spätzle/Toll/cactus controls the potent antifungal
response in Drosophila adults. Cell, 86(6): 973–983.
Lewis, F.A., Richards, C.S., Knight, M., Cooper, L.A., Clark, B. 1993. Schisotosoma
mansoni: Analysis of an unusual infection phenotype in the intermediate host snails
Biomphalaria glabrata. Experimental Parasitology, 77(3): 349-361.
Lewitt, P.A., Rezai, A.R., Leehey, M.A., Ojemann, S.G., Flaherty, A.W., Eskandar, E. N.,
Kostyk, S.K., Thomas, K., Sarkar, A., Siddiqui, M.S., Tatter, S. B., Schwalb, J.M.,
Poston, K.L., Henderson, J.M., Kurlan, R.M., Richard, I.H., Van Meter, L., Sapan, C.V.,
During, M.J., Kaplitt, M.G., Feigin, A. 2011. AAV2-GAD gene therapy for advanced
Parkinson's disease: A double-blind, sham-surgery controlled, randomised trial. The
Lancet Neurology, 10(4): 309–319.
Litman, G.W. & .Cooper, M.D. 2007. Why study the evolution of immunity? Nature
Immunology, 8(6): 547-8, 2007.

71
Liua, L., Li, Y., Li, S., Hu, N., He, Y., Pong, R., Lin, D., Lihua Lu, L. & Law, M. 2012.
Comparison of Next-Generation Sequencing Systems. Journal of Biomedicine and
Biotechnology, 2012:1-11.
Liub, G.H., Wang, S.Y., Huang, W.Y., Zhao, G.H., Wei, S.J., Song, H.Q., Xu, M.J., Lin,
R.Q., Zhou, D.H. & Zhu, X.Q. 2012. The complete mitochondrial genome of Galba
pervia (Gastropoda: Mollusca), an intermediate host snail of Fasciola spp. PLoS ONE, 7:
e42172
Lockyer, A.E., Spinks, J., Kane, R.A., Hoffmann, K.F., Fitzpatrick, J.M., Rollinson, D., Noble, L.R. & Jones, C.S. 2008. Biomphalaria glabrata transcriptome: cDNA microarray
profiling identifies resistant- and susceptible-specific gene expression in haemocytes
from snail strains exposed to Schistosoma mansoni. BMC Genomoics, 9: 634.
Loker, E.S., Adema, C.M., Zhang, S-M & Kepler, T.B. 2004. Invertebrate immune
systems – not homogeneous, not simple, not well understood. Immunological Reviews,
198: 10-24.
Madsen, H. & Frandsen, F. 1989. The spread of freshwater snails including those of
medical and veterinary importance. Acta Tropica, 46:139-146.
Maguire, A.M., Simonelli, F., Pierce, E.A., Pugh Jr, E.N., Mingozzi, F., Bennicelli, J.,
Banfi, S., Marshall, K.A., Testa, F., Surace, E.M., Rossi, S., Lyubarsky, A., Arruda, V.R.,
Konkle, B., Stone, E., Sun, J., Jacobs, J., Dell'Osso, L., Hertle, R., Ma, J. X., Redmond,
T. M., Zhu, X., Hauck, B., Zelenaia, O., Shindler, K.S., Maguire, M.G., Wright, J.F.,
Volpe, N.J., McDonnell, J.W., Auricchio, A. 2008. Safety and Efficacy of Gene Transfer
for Leber's Congenital Amaurosis. New England Journal of Medicine, 358(21): 2240-
2248.
Marchler-Bauer, A., Lu, S., Anderson, J.B., Chitsaz, F., Derbyshire, M.K., DeWeese-
Scott, C., Fong, J.H., Geer, L.Y., Geer, R.C., Gonzales, N.R., Gwadz, M., Hurwitz, D.I.,
Jackson, J.D., Ke, Z., Lanczycki, C.J., Lu, F., Marchler, G.H., Mullokandov, M.,
Omelchenko, M.V., Robertson, C.L., Song, J.S., Thanki, N., Yamashita, R.A., Zhang, D.,
Zhang, N., Zheng, C. & Bryant, S.H. 2011. CDD: a Conserved Domain Database for the
functional annotation of proteins. Nucleic Acids Research, 39(D): 225-229.
Mas-Coma, S., Valero, M.A. & Bargues, M.D. 2009. Chapter 2. Fasciola, lymnaeids and
human fascioliasis, with a global overview on disease transmission, epidemiology,
evolutionary genetics, molecular epidemiology and control. Advances in Parasitology,
69:41-146.
Maynard, B.T., Kerr, L.J., McKiernan, J.M., Jansen, E.S. & Hanna, P.J. 2005.
Mitochondrial DNA sequence and gene organization in Australian backup abalone Haliotis rubra (Leach). Marine Biotechnology, 7:645-658.

72
Medina, M., Lal, S., Vallès, Y., Takaoka, T., Dayrat, B., Boore, J. & Gosliner, T. 2011.
Crawling through time: Transition of snails to slugs dating back to the Paleozoic, based
on mitochondrial phylogenomics. Marine Genomics, 4(1):51-59.
Medzhitov, R., Preston-Hurlburt, P. & Janeway, C.A. 1997. A human homologue of the
Drosophila Toll protein signals activation of adaptive immunity. Nature, 388(6640):
394–397.
Mitta, G., Adema, C.M., Gourbal, B., Loker, E.S. & Theron, A. 2012. Compatibility
polymorphism in snail/schistosome interactions: From field to theory to molecular
mechanisms. Developmental and Comparative Immunology, 37(1):1-8.
Moné, Y., Gourbal, B., Duval, D., Du Pasquier, L., Keiffer-Jaquinod, S. & Mitta, G.
2010. A large repertoire of parasite epitopes matched by a large repertoire of host
immune receptors in an invertebrate host/parasite model. PLoS Neglected Tropical
Disease, 10(4):e813.
Morgan, J.A., DeJong, R.J., Jung, Y., Khallaayoune, K., Kock, S., Mkoji, G.M. & Loker,
E.S. 2002. A phylogeny of planorbid snails, with implications for the evolution of
Schistosoma parasites. Molecular Phylogenetics and Evolution, 25:477-488.
NCBI (National Center for Biotechnology Information). Eukaryotic genome sequencing
projects. http;//www.ncbi.nlm.nih.gov/genomes/leuks.cgi. Retrieved November 1, 2013.
Neiman, M., Hehman, G., Miller, J.T., Logsdon, J.M.Jr., Taylor, D.R. 2010. Accelerated
Mutation Accumulation in Asexual Lineages of a Freshwater Snail. Molecular Biology
and Evolution, 27(4):954-963.
Nekola, J.C., Coles, B.F. & Bergthorsson, U. 2009. Evolutionary Pattern and Process
within the Vertigo gouldii (Mollusca: Pulmonata, Pupillidae) group of minute North
American Land Snails. Molecular Phylogenetics and Evolution, 53(2):1010-1024.
Nei, M. & Kumar, S. 2000. Molecular Evolution and Phylogenetics, pp. 33. Oxford
University Press, New York.
Nowak, T.S., Woodards, A.C., Jung, Y., Adema, C.M. & Loker, E.S. 2004. Identification
of transcripts generated during the response of resistant Biomphalaria glabrata to
Schistosoma mansoni infections using suppression subtractive hybridization. Journal of
Parasitology, 90(5): 1034-1040.
Olson, M.V. & Varki, A. 2003. Sequencing the chimpanzee genome: insights into
human evolution and disease. Nature Reviews Genetics, 4:20-28.
Palumbi, S., Martin, A., Romano, S., McMillan, W.O., Stice, L. & Grabowski, G. 1991.
The Simple Fool's Guide to PCR Version 2.0. Privately published. University of Hawaii:
Department of Zoology and Kewalo Marine Laboratory.

73
Papadopoulos, J.S. & Agarwala, R. 2007. COBALT: constraint-based alignment tool for
multiple protein sequences. Bioinformatics, 23:1073-1079.
Paraense, W.L. & Pointier, J.P. 2003. Physa acuta Draparnaud, 1805 (Gastropoda:
Physidae): a study of topotypic specimens. Memórias do Insitituto Oswaldo Cruz,
98:513-517
Pauling, L., Harvey, I., S. J. Singer, S.J. & Wells, I. 1949. Sickle Cell Anemia, a
Molecular Disease. Science, 110(2865): 543-548.
Pechenik, Jan A. 2005. Invertebrate Classification and Relationships. In: Biology of
Invertebrates, 5th edition. McGraw-Hill Companies, Inc., New York.
Philippe, H., Lartillot, N. & Brinkmann H. 2005. Multigene Analyses of Bilaterian
Animals Corroborate the Monophyly of Ecdysozoa, Lophotrochozoa, and Protostomia.
Molecular Biology and Evolution, 22(5):1246-1253.
Philippe, H., Brinkmann, H., Copley, R.R., Moroz, L.L., Nakano,H., Poustka, A.J.,
Wallberg, A., Peterson, K.J. & Telford, M.J. 2011. Acoelomorph flatworms are
deuterostomes related to Xenoturbella. Nature, 470: 255–258
Pincell, J., Jordaens, K. & Blackeljau, T. 2005. Extreme mtDNA divergences in a
terrestrial slug (Gastropoda,Pulmonata, Arionidae): accelerated evolution, allopatric
divergence and secondary contact. Journal of Evolutionary Biology, 18:1264-1280.
Pires-daSilva, A. & Sommer, R.J. 2003. The evolution of signalling pathways in animal
development. Nature Reviews Genetics, 4:39-49
Podsiadlowski, L., Braband, A., Struck, H.T., von Döhren, J. & Bartolomaeus, T. 2009.
Phylogeny and mitochondrial gene order variation in Lophotrochozoa in the light of new
mitogenomic data from Nemertea. BMC Genomics, 10: 364.
Pond, S.L. & Frost, S.D.W. 2005. A Genetic Algorithm Approach to Detecting Lineage-
specific Variation in Selection Pressure. Molecular Biology and Evolution, 22(3):478-
485.
Quail, M., Smith, M.E., Coupland, P., Otto, T.D., Harris, S.R., Connor, T.R., Bertoni, A.,
Swerdlow, H.P. & Gu, Y. 2012. A tale of three next generation sequencing platforms:
comparison of Ion torrent, pacific biosciences and illumina MiSeq sequencers. BMC
Genomics, 13(1): 341.
Raghavan, N., Miller, A.N., Gardner, M., FitzGerald, P.C., Kerlayage, A.R., Johnston,
D.A., Lewis, F.A. & Knight, M. 2003. Comparative gene analysis of Biomphalaria glabrata hemocyte pre- and post-exposure to miracidia of Schistosoma mansoni.
Molecular and Biochemical Parasitology,126(2): 181-191.

74
Rawlings, T.A., MacInnis, M.J., Bieler, R., Boore, J.L. & Collins, T.M. 2010. Sessile
snails, dynamic genomes: gene rearrangements within the mitochondrial genomes of a
family of Caenogastropoda molluscs. BMC Genetics, 11:440.
Rees, M. 1987. Warren Weaver. pp.503. National Academy of Sciences Biographical
Memoirs, Washington D.C.
Roberts, L.S. & Janovy Jr., J. 2005. Gerald D. Schmidt, G.D. & Larry S. Roberts'
Foundations of Parasitology. McGraw-Hill Companies, Inc., New York.
Roger, E., Mitta, G., Moné, Y., Bouchut, A., Rognon, A., Grunau, C., Boissier, J., Théron,
A. & Gourbal, B.E. 2008. Molecular determinants of compatibility polymorphism in
the Biomphalaria glabrata/Schistosoma mansoni model: New candidates identified by a
global comparative proteomics approach. Molecular and Biochemical Parasitology,
157:205–216.
Rokas, A. & Holland, P.W.H. 2000. Rare genomic changes as a tool for phylogenetics.
TREE, 15:454-459
Rota-Stabelli, O., Kayal, E., Gleeson, D., Daub, J., Boore, J.L., Telford, M.J., Pisani, D.,
Blaxter, M. & Lavrov, D.V. 2010 Ecdysozoan Mitogenomics: Evidence for a Common
Origin of the Legged Invertebrates, the Panarthropoda. Genome Biology and Evolution,
2: 425-440.
Rozen, S. & Skaletsky, H.J. 2000. Primer3 on the WWW for general users and for
biologist programmers. In Bioinformatics Methods and Protocols: Methods in Molecular
Biology, (S. Krawetz & S.A. Misener, eds), 365-386. Humana Press Press Inc., Totowa,
New Jersey.
Rozendaal, J.A. 1997. Freshwater snails. In Vector Control – Methods for Use by
Individuals and Communities, pp.337-356. Alden Press, England.
Rutherford, K., Parkhill, J., Crook, J., Horsnell, T., Rice, P., Rajandream, M.A. & Barrell,
B. 2000. Artemis: sequence visualization and annotation. Bioinformatics, 16:944-945.
Sánchez-Argüello, P., Fernández, C. & Tarazona, J.V. 2009. Assessing the effects of
fluoxetine on Physa acuta (Gastropoda, Pulmonata) and Chironomus riparius (Insecta,
Diptera) using a two-species water-sediment test. Science of the Total Environment,
407:1937-1946.
Sanger, F., Nicklen, S. & Coulson, A.R. 1977. DNA sequencing with chain-terminating
inhibitors. PNAS, 74(12): 5463-5467.
Sayre, A. 1975. Rosalind Franklin and DNA. New York: Norton.

75
Simison, W.B., Lindberg, D.R. & Boore, J.L. 2006. Rolling circle amplification of
metazoan mitochondrial genomes. Molecular Phylogenetics and Evolution, 39:562-567.
snaildb.org – Biomphalaria glabrata ESTs Snail database. Retrieved November 11th,
2013.
Sullivan, J.T., Pikios, S.S. & Alonzo, A.Q. 2004. Mitotic responses to extracts of
miracidia and cercaria of Schistosoma mansoni in the amebocyte-producing organ of
snail intermediate host Biomphalaria glabrata. Journal of Parasitology, 90(1): 92-96.
Stothard, J.R. & Rollinson, D. 1997. Partial DNA sequences from the mitochondrial
cytochrome oxidase subunit I (COI) gene can differentiate the intermediate snail
hosts Bulinus globosus and B. nasutus (Gatropoda: Planorbidae). Journal of Natural
History, 31:727-737.
Stothard, P. & Wishart, D.S. 2005. Circular genome visualization and exploration using
CGView. Bioinformatics, 21:537-539.
Stout, B.A., Adema, C.M., Zhang, S-M & Loker, E.S. 2009. Biology of FREPs:
diversified lectins with fibrinogen-related domains from the freshwater
snail Biomphalaria glabrata. In: Animal Lectins: A Functional View (G.R. Vasta & H.
Ahmed eds), pp. 475–491. CRC Press, Boca Raton.
Tajima, F. 1993. Simple methods for testing molecular clock hypothesis. Genetics,
135:599-607.
Tamura, K., Peterson, D., Peterson, N., Stecher, G., Nei, M., Kumar, S. 2011. MEGA5:
Molecular Evolutionary Genetics Analysis using Maximum Likelihood, Evolutionary
Distance, and Maximum Parsimony Methods. Molecular Biology and Evolution,
28:2731-2739.
Te, G.A. 1978. The systematics of the Family Physidae (Basommatophora:Pulmonata).
PhD thesis, University of Michigan.
Terrett, J.A., Miles, S. & Thomas, R.H. 1996. Complete DNA sequence of the
mitochondrial genome of Cepaea nemoralis (Gastropoda: Pulmonata). Journal of
Molecular Evolution, 42:160-168.
The C. elegans Sequencing Consortium. 1998. Genome sequence of the nematode C.
elegans: a platform for investigating biology. Science, 282(5396): 2012–2018.
Thomaz, D., Guiller, A., Clarke, B. 1996. Extreme Divergence of Mitochondrial DNA
within Species of Pulmonate Land Snails. Proceedings of the Royal Society,
263(1368):363-368.

76
Valles, Y. & Boore, J.L. 2006. Lophotrochozoan mitochondrial genomes. Integrative
and Comparative Biology, 46(4):544-547.
Vazquez, L., Alpuche, J., Maldonado, G., Agundis, C., Pereyra-Morales, A. & Zenteno,
E. 2009. Review: Immunity mechanisms in crustaceans. Innate Immunity, 15(3): 179-
188.
Venter, J.C., Adams, M.D., Myers, E.W., Li, P.W., Mural, R.J., Sutton, G.G., Smith,
H.O., Yandell, M., Evans, C.A., Holt, R.A., Gocayne, J.D., Amanatides, P., Ballew,
R.M., Huson, D.H.,Wortman, J.R., Zhang, Q., Kodira, C.D., Zheng, X.H., Chen, L.,
Skupski, M., Subramanian, G., Thomas, P.D., Zhang, J., Gabor Miklos. G.L., Nelson, C.,
Broder, S., Clark, A.G., Nadeau, J., McKusick, V.A., Zinder, N., Levine, A.J., et al.
2001. The sequence of the human genome. Science, 291(5507): 1304-1351.
Wade, C.M. & Mordan, P.B. 2000. Evolution within the gastropod Molluscs; using the
ribosomal RNA gene-cluster as an indicator of phylogenetic relationships. Journal
of Molluscan Studies, 66:565-570.
Watson, J.D. & Crick, F.H. 1953. Molecular structure of nucleic acids; a structure for
deoxyribose nucleic acid. Nature, 171(4356): 737–738.
Webster B.L & Littlewood, D.T.J. 2012. Mitochondrial gene order change in
Schistosoma (Platyhelminthes: Digenea: Schistosomatidae). International Journal of
Parasitology, 42: 313-321.
Wethington, A.R., Wise, J. & Dillon, R.T.Jr. 2009. Genetic and morphological
characterization of the Physidae of South Carolina (Gastropoda: Pulmonata:
Basommatophora), with description of a new species. Nautilus, 123(4):282-292.
Wethington, A.R. & Lydeard, C. 2007. A molecular phylogeny of Physidae (Gastropoda:
Basommatophora) based on mitochondrial DNA sequences. Journal of
Molluscan Studies, 73:241-257.
White, T.R., Conrad, M.M., Tseng, R., Balayan, S., Golding, R., Martins, A.M. & Dayrat,
B.A. 2011. Ten new complete mitochondrial genomes of pulmonates (Mollusca:
Gastropoda) and their impact on phylogenetic relationships. BMC Evolutionary Biology,
11:295.
WHO (World Health Organization.). Initiative for Vaccine Research (IVR), Parasitic
Disease. Retrieved on October 16th, 2013.
http://www.who.int/vaccine_research/diseases/soa_parasitic/en/index5.html
Winnepenninckx, B., Backeljau, T. & De Wachter, R. 1993. Extraction of high molecular
weight DNA from molluscs. Trends in Genetics, 12:407.

77
Yamazaki, N., Ueshima, R., Terrett, J.A., Tokobori, S.I., Kaifu, M., Segawa, R.,
Kobayashi, T., Numachi, K.I., Ueda, T., Nishikawa, K., Watanabe, K. & Thomas, R.H.
1997. Evolution of pulmonate gastropod mitochondrial genomes: Comparisons of gene
organizations of Euhadra, Cepaea and Albinaria and implication of unusual trna
secondary structures. Genetics, 145:749-758.
Yoshino, T.P., Dinguirard, N., Kunert, J. & Hokke, C.H. 2008. Molecular and functional
characterization of a tandem-repeat galectin from the freshwater snail Biomphalaria
glabrata, intermediate host of the human blood fluke Schistosoma mansoni. Gene,
31(1/2):46-58.
Yuen, B, Bayes, J.M. & Degnan, S.M. 2013. The characterization of sponge NLRs
provides insight into the origin and evolution of this innate immune gene family in
animals. Molecular and Phylogenetic Evolution, (N/A; online only).
Wang, W., Wang, L. & Liang, Y-S. 2012. Susceptibility or resistance of praziquantel in
human schistosomiasis: a review. Parasitology Research, 111:1871–1877.
Wang, X.W. & Wang, J.X. 2013. Diversity and multiple functions of lectins in shrimp
immunity. Developmental and Comparative Immunology, 39(1-2): 27-38.
Xia, X. 2012. DNA replication and strand asymmetry in prokaryotic and mitochondrial
genomes. Current Genomics, 13:16-27.
Zhang, S.M., Zeng, Y. & Loker, E.S. 2008. Expression profiling and binding properties
of fibrinogen-related proteins (FREPs), plasma proteins from the schistosome snail host
Biomphalaria glabrata. Innate Immununity, 14: 175–189.