molecular approaches to detect and control cercospora
TRANSCRIPT
Louisiana State UniversityLSU Digital Commons
LSU Doctoral Dissertations Graduate School
2012
Molecular Approaches to Detect and ControlCercospora kikuchii in SoybeansAshok Kumar ChandaLouisiana State University and Agricultural and Mechanical College, [email protected]
Follow this and additional works at: https://digitalcommons.lsu.edu/gradschool_dissertations
Part of the Plant Sciences Commons
This Dissertation is brought to you for free and open access by the Graduate School at LSU Digital Commons. It has been accepted for inclusion inLSU Doctoral Dissertations by an authorized graduate school editor of LSU Digital Commons. For more information, please [email protected].
Recommended CitationChanda, Ashok Kumar, "Molecular Approaches to Detect and Control Cercospora kikuchii in Soybeans" (2012). LSU DoctoralDissertations. 3002.https://digitalcommons.lsu.edu/gradschool_dissertations/3002

MOLECULAR APPROACHES TO DETECT AND CONTROL CERCOSPORA
KIKUCHII IN SOYBEANS
A Dissertation
Submitted to the Graduate Faculty of the
Louisiana State University and
Agricultural and Mechanical College
In partial fulfillment of the
requirements for the degree of
Doctor of Philosophy
in
The Department of Plant Pathology and Crop Physiology
by
Ashok Kumar Chanda
B.S., Acharya N. G. Ranga Agricultural University, 2001
M.S., Acharya N. G. Ranga Agricultural University, 2004
August 2012
ii
DEDICATION
This work is dedicated to my
Dear Mother, PADMAVATHI
Dear Father, MADHAVA RAO
Sweet Wife, MALA
Little Angel, HAMSINI

iii
ACKNOWLEDGEMENTS
I would like to express my sincere gratitude to my advisors Dr. Zhi-Yuan Chen and Dr.
Raymond Schneider, for giving me the opportunity to pursue this doctoral program, valuable
guidance throughout my research as well as freedom to choose my work, kindness and constant
encouragement, and teaching me how to become a molecular plant pathologist. I am very
grateful to my committee members, Dr. Christopher Clark, Dr. Jeffrey Hoy, and Dr. Kenneth
Damann, for their constructive criticism and valuable suggestions from the time I proposed until
the completion of my research and especially for their critical review of my dissertation. My
special thanks to our head, Dr. Lawrence Datnoff, for his constant encouragement and
motivation.
I would like to thank all the people who helped me in completion of this dissertation
research. I owe special thanks to PPCP family for their love and affection to me and my family
during the stay at LSU. I thank all my friends, especially Suman, Ramu, Dina, Freddy, Sunny,
Nicole, Syam, Alessandro, Yi for their help, sharing knowledge, and for the memorable times we
had together.
I am very thankful to my family members, Amma, Nana, Vijay Anna, Malathi Vadina,
Patricia mama for their unconditional love and support during my time away from home. Amma
deserves special thanks for her love and staying with us to help with our baby girl during the
final stage of writing this dissertation. If I can thank only one person, it will be my sweet wife,
MALA, for always being with me in ups and downs in research and in life, for her unconditional
love and support, taking care of everything during drafting of this dissertation. Thanks to our
little angel HAMSINI for bringing us lots of joy in our life.
iv
TABLE OF CONTENTS
DEDICATION ................................................................................................................................ ii
ACKNOWLEDGEMENTS ........................................................................................................... iii
LIST OF TABLES ....................................................................................................................... viii
LIST OF FIGURES ....................................................................................................................... ix
LIST OF ABBREVIATIONS ....................................................................................................... xv
ABSTRACT .................................................................................................................................. xx
CHAPTER: 1. INTRODUCTION .................................................................................................. 1
1.1 Justification ...................................................................................................................... 1
1.2 Objectives ......................................................................................................................... 4
CHAPTER 2: REVIEW OF LITERATURE .................................................................................. 5
2.1 Soybean ............................................................................................................................ 5
2.2 Soybean Growth and Development.................................................................................. 5
2.3 Yield Loss Caused by Cercospora kikuchii ..................................................................... 6
2.4 Cercospora kikuchii ......................................................................................................... 7
2.4.1 Cercospora kikuchii and Latent Infection of Soybeans ............................................ 7
2.4.2 Purple Seed Stain (PSS) ............................................................................................ 9
2.4.3 Cercospora Leaf Blight (CLB)................................................................................ 10
2.4.4 Resistance to PSS and CLB .................................................................................... 10
2.4.5 Management of Cercospora Leaf Blight ................................................................. 11
2.5 Cercosporin .................................................................................................................... 12
2.5.1 Cercosporin and Mode of Action ............................................................................ 12
2.5.2 Role of Cercosporin in Plant Diseases .................................................................... 13
2.5.3 Cercosporin Biosynthesis........................................................................................ 14
2.5.4 Resistance to Cercosporin ....................................................................................... 18
2.5.5 Factors Affecting Cercosporin Production ............................................................. 20
2.6 Real-Time Polymerase Chain Reaction (Real-time PCR) ............................................. 20
2.6.1 Available Real-Time PCR Technologies ................................................................ 20
2.6.2 Application of Real-Time PCR to Study Plant Pathogens...................................... 22

v
2.7 Proteomics ...................................................................................................................... 24
2.7.1 Introduction and Advantages .................................................................................. 24
2.7.2 2-Dimensional Electrophoresis ............................................................................... 26
2.7.3 Different Staining Techniques ................................................................................ 27
2.7.4 Application of Proteomics to Study Plant Pathogenic Fungi ................................. 28
2.7.5 Application of Proteomics to Study Secreted Proteins from Plant Pathogenic Fungi
……………………………………………………………………………………..30
CHAPTER 3: LATENT INFECTION BY CERCOSPORA KIKUCHII, CAUSAL AGENT OF
CERCOSPORA LEAF BLIGHT IN SOYBEAN ........................................................................ 36
3.1 Introduction ......................................................................................................................... 36
3.2 Materials and Methods ........................................................................................................ 38
3.2.1 Cercospora Species ................................................................................................ 38
3.2.2 Development of Specific Real-time PCR Primers and Probe for C. kikuchii ......... 39
3.2.3 Real-Time PCR Assay and Quantification of DNA of C. kikuchii in Field Samples
……………………………………………………………………………………..40
3.2.4 Plant Materials, Sampling Details, and Fungicide Sprays ...................................... 42
3.2.5 DNA Extraction ...................................................................................................... 42
3.2.6 Cercospora Leaf Blight Disease Severity Ratings .................................................. 44
3.2.7 Data Analysis .......................................................................................................... 44
3.3 Results ............................................................................................................................ 45
3.3.1 Developing Real-Time PCR Primers Specific to C. kikuchii ................................. 45
3.3.2 Standard Curves and Sensitivity of Real-Time PCR Assays .................................. 47
3.3.3 Visual Rating of Disease Severity and Quantification of C. kikuchii DNA in
Soybean Leaf Samples Using Real-Time PCR ..................................................................... 47
3.4 Discussion ...................................................................................................................... 56
CHAPTER 4: IDENTIFICATION AND CHARACTERIZATION OF LIGHT-INDUCIBLE
PROTEINS FROM CERCOSPORA KIKUCHII .......................................................................... 62
4.1 Introduction ......................................................................................................................... 62
4.2 Materials and Methods ................................................................................................... 64
4.2.1 Fungal Cultures and Cercosporin Determination ................................................... 64
4.2.2 Protein Extraction ................................................................................................... 65
4.2.3 First-Dimension Gel Electrophoresis ...................................................................... 66
vi
4.2.4 Second-Dimension Gel Electrophoresis, Staining, and Gel Analysis .................... 66
4.2.5 Protein Identification .............................................................................................. 67
4.2.6 Cloning of the HNR Gene from C. kikuchii ............................................................ 68
4.2.7 Targeted Disruption of the HNR Gene .................................................................... 69
4.2.8 Cloning of the AHCY Gene from C. kikuchii .......................................................... 70
4.2.9 Targeted Disruption of the AHCY Gene ................................................................. 72
4.2.10 Preparation of C. kikuchii Protoplasts ..................................................................... 73
4.2.11 C. kikuchii Transformation ..................................................................................... 74
4.2.12 Pathogenicity Assay on Soybeans .......................................................................... 75
4.3 Results ............................................................................................................................ 76
4.3.1 Light Enhanced Cercosporin Production in C. kikuchii.......................................... 76
4.3.2 Comparison of Protein Profiles between Light and Dark Grown C. kikuchii ........ 76
4.3.3 Identification of Differentially Expressed Proteins ................................................ 78
4.3.4 Cloning and Characterization of HNR and AHCY Genes ....................................... 81
4.3.5 Target Gene Disruption of HNR and AHCY Genes in C. kikuchii .......................... 88
4.3.6 Detection and Quantification of Cercosporin ......................................................... 93
4.3.7 Pathogenicity Assay on Soybeans .......................................................................... 94
4.4 Discussion ...................................................................................................................... 97
CHAPTER 5: IDENTIFICATION OF SECRETED PROTEINS FROM CERCOSPORA
KIKCUHII ................................................................................................................................... 105
5.1 Introduction ....................................................................................................................... 105
5.2 Materials and Methods ................................................................................................. 108
5.2.1 Culture Conditions and Concentrating Culture Supernatant Fraction .................. 108
5.2.2 Protein Extraction ................................................................................................. 109
5.2.3 2-DE (IEF/SDS-PAGE), Staining, and Scanning ................................................. 109
5.2.4 In-Gel Trypsin Digestion ...................................................................................... 110
5.2.5 Liquid Chromatography Tandem Mass Spectrometry and Protein Identification 111
5.3 Results ............................................................................................................................... 112
5.3.1 2-D Electrophoresis of the Secreted Proteins ....................................................... 112
5.3.2 Protein Identification ............................................................................................ 112
5.4 Discussion ......................................................................................................................... 113

vii
CHAPTER 6: EVALUATION OF HOST-INDUCED GENE SILENCING (HIGS) STRATEGY
FOR CONTROL OF CERCOSPORA KIKUCHII INFECTION OF SOYBEANS ................... 119
6.1 Introduction .................................................................................................................. 119
6.2 Materials and Methods ................................................................................................. 121
6.2.1 Construction of BPMV-Derived Vectors.............................................................. 121
6.2.2 Delivery of BPMV-Derived Vectors into Soybean Leaves .................................. 122
6.2.3 Cercospora kikuchii Inoculation of Soybean Plants Carrying BPMV-Derived
Vectors ……………………………………………………………………………………124
6.2.4 Soybean Leaf Tissue Collection ........................................................................... 125
6.2.5 Total RNA Isolation and RT-PCR Analysis ......................................................... 125
6.2.6 DNA Isolation and Quantitative Real-Time PCR Assessment of C. kikuchii
Accumulation....................................................................................................................... 126
6.3 Results .......................................................................................................................... 127
6.3.1 Successful Delivery of VIGS Vectors into Soybeans ........................................... 127
6.3.2 Silencing expression of Cercospora kikuchii AHCY Transcript in Soybean using
BPMV as a HIGS Vector..................................................................................................... 128
6.3.3 Inoculation of Soybeans Plants Carrying HIGS Constructs with Cercospora
kikuchii ……………………………………………………………………………………129
6.4 Discussion .................................................................................................................... 131
CHAPTER 7: GENERAL CONCLUSIONS AND PROSPECTS FOR FUTURE RESEARCH
..................................................................................................................................................... 133
7.1 General Conclusions ......................................................................................................... 133
7.2 Prospects for Future Research ........................................................................................... 134
LITERATURE CITED ............................................................................................................... 135
APPENDIX ................................................................................................................................. 164
VITA ........................................................................................................................................... 166
viii
LIST OF TABLES
Table 3.1. Cercospora species tested for the specificity of the real-time PCR primers and probe
developed in this study.................................................................................................................. 39
Table 3.2. Primer pairs, based upon the CTB gene cluster in Cercospora nicotianae, used for
amplification in Cercospora kikuchii ............................................................................................ 41
Table 3.3. Experimental details for field studies related to Cercospora leaf blight of soybean .. 43
Table 3.4. Cercospora kikuchii infection of soybean leaf samples collected at various growth
stages in 2007 ................................................................................................................................ 53
Table 3.5. Cercospora kikuchii infection of soybean leaf samples collected from DP 5808RR at
various growth stages in 2009....................................................................................................... 55
Table 3.6. Cercospora kikuchii infection of soybean leaf samples collected from Pioneer 95Y20
at various growth stages in 2010 ................................................................................................... 58
Table 4.1. Identification of differentially expressed protein spots from Cercospora kikuchii
grown under continuous light and dark through peptide sequencing using tandem mass
spectrometry (MS/MS) ................................................................................................................. 82
Table 5.1. List of secreted proteins of Cercospora kikuchii identified by LC-MS/MS.............. 115
Table 5.2. List of peptide sequences of unknown secreted proteins of Cercospora kikuchii
identified by de novo sequecing using Mascot Distiller version 2.4.2.0 .................................... 116
Table 6.1. List of primers used in this HIGS study .................................................................... 126
ix
LIST OF FIGURES
Figure 1.1. Cercospora kikuchii characteristics and symptoms on soybean. A, C. kikuchii
conidiophores developed on a soybean leaf showing typical CLB symptoms after incubating in a
moist chamber for 48 hours. B, Fascicle of conidiophores (A). Conidia (B), Original in: Hsieh,
W.H. & Goh, T.K. 1990, Cercospora and similar fungi from Taiwan. Published 1990 by Maw
Chang Book Co. in Taipei, Taiwan. Image source:
http://www.mycobank.org/MycoTaxo.aspx?Link=T&Rec=252873. C, Typical purple seed stain
(PSS) symptoms on soybean seeds. (Image source:
http://www.omafra.gov.on.ca/english/crops/pub811/14soybean.htm). D, Typical cercospora leaf
blight (CLB) symptoms on soybean leaves. (Image source: Dr. Zhi-Yuan Chen). ........................ 9
Figure 1.2. Chemical structure of cercosporin. Source:
http://www.apsnet.org/publications/apsnetfeatures/Pages/Cercosporin.aspx ............................... 13
Figure 1.3. Speculated biosynthetic pathway leading to the formation of cercosporin, showing
hypothesized functions of the CTB gene products in Cercospora nicotianae (Chen et al. 2007b).
....................................................................................................................................................... 19
Figure 3.1. CNCTB6F/CNCTB6R primer pair showing specificity to Cercospora kikuchii pure
culture or C. kikuchii infected soybean leaves. Lane 1, C. kikuchii isolate MRL 6020-2B; lane 2,
C. sojina isolate RWS1; lane 3, healthy greenhouse-grown soybean cultivar CP 5892; lane 4,
healthy greenhouse-grown soybean cultivar 1001M; lane 5, greenhouse-grown soybean cultivar
1001M grown from purple stained seed; lanes 6 and 7, naturally infected field grown soybean
cultivar DP 5634 at R5 stage (71 DAP), showing typical CLB symptoms. ................................. 46
Figure 3.2. Partial DNA sequence of CTB6 gene from Cercospora kikuchii (CK). Open boxes
indicate the variable nucleotides between CK and C. nicotianae (CN). Arrows indicate location
of real-time PCR primers (CKCTB6-2F and CKCTB6-2R) and probe (CKCTB6-PRB) used in
real-time PCR detection of C. kikuchii in soybean samples. ........................................................ 46
Figure 3.3. Real-time PCR amplification plots and standard curves for serial dilutions of DNA of
Cercospora kikuchii. A, Representative real-time PCR fluorescent amplification curves for C.
kikuchii DNA concentrations from left to right are 10 ng, 1 ng, 100 pg, 10 pg, and 1 pg. Each
standard was spiked with 10 ng of soybean DNA. B, Data represent mean cycle threshold (Ct)
values of at least six replicates of each dilution and error bars indicate standard deviation. Ct
values were plotted against known DNA concentrations of C. kikuchii and the linear regression
equation for calculating quantity of DNA of C. kikuchii in soybean leaf sample is shown inside
the graph........................................................................................................................................ 48
Figure 3.4. Cercospora leaf blight disease severity ratings and quantification of levels of DNA of
Cercospora kikuchii in leaves of soybean cultivars CP5892 and DP5634 in 2007 in non-sprayed
(U) and sprayed (S) plants. Arrows indicate the days after planting (DAP) when fungicides were
applied. A, Bars represent the mean disease severity of 3 plots within each treatment and the
error bars indicate standard deviation. The groups of means indicated with the same letters were
x
not significantly different according to Tukey’s honestly significant difference (HSD) test at P <
0.05. B, First planting. Soybean leaf samples were collected at R2 (58 DAP), R4 (78 DAP), R5
(85 DAP), and R6 (107 DAP) growth stages. In sprayed treatments, a mixture of pyraclostrobin
and metconazole was applied at R2 (62 DAP) and R4 (78 DAP) growth stages. Error bars
indicate standard deviation. C, Second planting. Soybean leaf samples were collected at V8-V9
for CP 5892 and R2 for DP 5634 (44 DAP), R3-R4 (64 DAP), R5 (71 DAP), and R6 (93 DAP)
growth stages. In sprayed treatments, a mixture of pyraclostrobin and metconazole was applied
at R3-R4 (64 DAP) growth stage. Error bars indicate standard deviation. D, Third planting.
Soybean leaf samples were collected at V3 for CP 5892 and V3-V4 for DP 5634 (22 DAP), R1-
R2 for CP 5892 and R2 for DP 5634 (42 DAP), R2 (49 DAP), R3 (57 DAP), and R5 (71 DAP)
growth stages. In sprayed treatments, a mixture of pyraclostrobin and metconazole was applied
at R1-R2 (42 DAP) growth stage. ................................................................................................. 50
Figure 3.5. Cercospora leaf blight disease severity ratings and quantification of levels DNA of
Cercospora kikuchii in leaves of soybean cultivar DP 5808RR in 2009. Arrows indicate the days
after planting (DAP) when fungicides were applied. A, Bars represent the mean disease severity
of 3 plots within each treatment and the error bars indicate standard deviation. Letters represent
groups of means that were determined according to Tukey’s honestly significant difference
(HSD) test. Different letters indicate significant differences at P < 0.05. B, Soybean leaf samples
were collected at V4 (35 DAP), Late R1 (52 DAP), R2 (59 DAP), R3 (70 DAP), R4 (76 DAP),
Late R4 (85 DAP), R5 (97 DAP), R6 (109 DAP), Late R6 (116 DAP), and R7 (124 DAP) growth
stages. In sprayed treatments, pyraclostrobin was applied at R1 (48 DAP), R2 (55 DAP), R3 (74
DAP), R4 (90 DAP), and R5 (103 DAP) growth stages. Error bars indicate standard deviation. 54
Figure 3.6. Cercospora leaf blight disease severity ratings and quantification of levels of
Cercospora kikuchii DNA in leaves of soybean cultivar Pioneer 95Y20 in 2010. Arrows indicate
the days after planting (DAP) when fungicides were applied. A, Bars represent the mean disease
severity of 4 plots within each treatment and the error bars indicate standard deviation. Letters
represent groups of means that were determined according to Tukey’s honestly significant
difference (HSD) test. Different letters indicate significant differences at P < 0.05. B, Soybean
leaf samples were collected at V5 (33 DAP), R1 (44 DAP), R2 (58 DAP), and R5 (100 DAP)
growth stages. Flutriafol® was sprayed at V5 (30 DAP) growth stage in treatment with one spray
(1S); at V5 (30 DAP), R1-R2 (51 DAP), and R3 (77 DAP) in treatment with three sprays (3S);
and at V5 (30 DAP), R1-R2 (51 DAP), R3 (77 DAP), R5 (99 DAP), and R6 (113 DAP) growth
stages in treatment with five sprays (5S). Error bars indicate standard deviation. ....................... 57
Figure 4.1. Hydroxynaphthalene reductase (HNR) disruption strategy in Cercospora kikuchii. . 71
Figure 4.2. Adenosylhomocysteinase (AHCY) disruption strategy in Cercospora kikuchii. ........ 73
Figure 4.3. Effect of light on Cercosporin production and fungal growth of Cercospora kikuchii.
A, Production of cercosporin toxin by the wild-type Cercospora kikuchii isolate MRL 6020-2B.
The fungus was grown in CM broth under continuous light or darkness for 4 to 16 days.
Cercosporin was extracted with 5 N KOH and quantified by absorbance at 480 nm. Data shown
are the means of five biological replications and error bars indicate standard deviation. Means
with the same letters were not significantly different at P < 0.05 according to Tukey’s honestly

xi
significant difference (HSD) test. B, Fungal growth of C. kikuchii under light and dark
conditions. Mycelia were separated by vacuum filtration and dry weights were determined after
freeze drying. Data shown are the means of five biological replications and error bars indicate
standard deviation. ........................................................................................................................ 77
Figure 4.4. Two dimensional gel electrophoresis of proteins extracted from Cercospora kikuchii
mycelia grown under light and dark conditions. Mycelial protein profiles of C. kikuchii grown in
continuous light for 6 days (A), or under continuous dark for 8 days (B). 100 µg mycelia proteins
were subjected to IEF on 18 cm 3-10 NL IPG strips followed by second dimension on 12.5%
linear SDS-PAGE, and visualization of proteins with silver staining. Differentially expressed
protein spots were indicated with open circles and spots were excised from the gels as indicated
and subjected to in-gel digestion with trypsin prior to LC-MS/MS analysis. C, Gel sub-sections
of selective protein spots up- (57 and 34) and down-regulated under light. D, Heat map showing
fold change up- and down-regulation of protein spots under light. .............................................. 79
Figure 4.5. Cloning and characterization of the hydroxynaphthalene reductase (HNR) gene from
Cercospora kikuchii. A, PCR amplification of HNR coding region from C. kikchii gDNA using
degenerate primers HNRF and HNRR (see Materials and Methods). A specific PCR product was
amplified only in the presence of both HNRF and HNRR primers and the template (lane 1). No
specific amplifications was visible when PCR with only one primer (HNRF only, lane 2; HNRR
only, lane 3) or without template (lane 4). B, Schematic diagram of strategy to clone the full
length HNR gene using genome walking. Note: drawing is not to scale. C, Multiple sequence
alignment of HNR protein to hydroxynaphthalene reductase from Cochliobolus lunatus (gi
23451229), Brn1 from Cochliobolus heterostrophus (gi 2760604), 1,3,8-trihydroxynaphthalene
reductase from Alternaria alternata (gi 4115722), 1,3,8-trihydroxynaphthalene reductase from
Setosphaeria turcica (gi 188039929), a hypothetical protein from Mycosphaerella graminicola
(gi 339468210), and an ESC reductase (RDT1)from Elsinoe fawcettii (gi 166865159). Conserved
amino acid residues across all sequences were shaded in black. .................................................. 83
Figure 4.6. Cloning and characterization of the adenosylhomocysteinase (AHCY) gene from
Cercospora kikuchii. A, PCR amplification of the AHCY coding region from C. kikchii gDNA
using degenerate primers AHCYF and AHCYR (see Materials and Methods). A specific PCR
product was amplified only in the presence of both AHCYF and AHCYR primers and the
template (lane 1). No specific amplifications was visible when PCR with only one primer
(AHCYF only, lane 2; AHCYR only, lane 3) or without template (lane 4). B, Schematic diagram
of strategy to clone full length AHCY gene using genome walking. Note: drawing is not to scale.
C, Multiple sequence alignment of AHCY protein to hypothetical protein from Mycosphaerella
graminicola (gi 339476483), adenosylhomocysteinase from Pyrenophora tritici-repentis (gi
189189746), Paracoccidioides brasiliensis (gi 225682808), Aspergillus fumigatus (gi
70995231), Neosartorya fischeri (gi 119495963), Metarhizium acridum (gi 322692740), and
Ajellomyces dermatitidis (gi 261194789). Conserved amino acid residues across all sequences
were shaded in black. .................................................................................................................... 86
Figure 4.7. Disruption of the hydroxynaphthalene reductase (HNR) gene in Cercospora kikuchii.
A, Two truncated HNR fragments (5′ and 3′-end) were joined to hygromycin resistance gene
cassette (HYG) using polymerase chain reaction (PCR) to generate the 4.3 kb DNA fragment.
xii
Nested PCR was done using HNR5FN2 and HNR3RN2 primer pairs and the resultant 4.2 kb
fragment was directly transformed into C. kikuchii protoplasts. Note: drawing is not to scale. B,
PCR confirmation of the presence of 466 bp hygromycin fragment in 20 of HNR gene disruption
mutants (∆hnr1 to ∆hnr20). C, Site-specific disruption of the HNR gene as confirmed by PCR
using primer pairs HNR5F (upstream primer) and HY primer. An expected 2.7 kb PCR product
was detected in ∆hnr1, ∆hnr2, ∆hnr11, ∆hnr12, ∆hnr17, and ∆hnr18. D, Insertion of HYG in the
middle of HNR gene using primer pairs HNR5F and HNR3R showed presence of a 4.3 kb
fragment only in ∆hnr2, ∆hnr12, and ∆hnr17whereas wild type or pUCATPH vector controls
showed only the 2.0 kb fragment. E, Quantitative real-time RT-PCR data showing fold reduction
in HNR transcript levels in ∆hnr2, ∆hnr12, and ∆hnr17. The ratio of gene expression in the
mutants was normalized to pUCATPH vector control and 18S RNA was used as internal
reference. Data shown were means of four replications and error bars represent the standard
deviation. ....................................................................................................................................... 89
Figure 4.8. Disruption of adenosylhomocysteinase (AHCY) gene in Cercospora kikuchii. A, Two
truncated AHCY fragments (5′ and 3′-end) were joined to the hygromycin resistance gene
cassette (HYG) using polymerase chain reaction (PCR) as described in text to generate the 5.3 kb
DNA fragment. A nested PCR was conducted using AHCY5FN2 and AHCY3RN2 primer pairs
and the resultant 5.1 kb fragment was directly transformed into C. kikuchii protoplasts. Note:
drawing is not to scale. B, PCR confirmation of the presence of 466 bp hygromycin fragment in
20 AHCY gene disruption mutants (∆ahcy1 to ∆ahcy20). C, Site-specific disruption of the AHCY
gene as confirmed by PCR using primer pairs AHCY5F (upstream primer) and HY primer,
which showed presence of a 2.57 kb fragment in ∆ahcy1, ∆ahcy3, ∆ahcy4, ∆ahcy9, ∆ahcy10,
and ∆ahcy12. D, Quantitative real-time RT-PCR data showing fold reduction in AHCY transcript
levels in ∆ahcy1, ∆ahcy3, and ∆ahcy4. The ratio of gene expression in the mutants was
normalized to pUCATPH vector control and 18S RNA was used as internal reference. Data
shown were means of four replications and error bars represent the standard deviation. ............ 92
Figure 4.9. Characterization of cercosporin produced by vector-transformed control and hnr and
ahcy disruption mutants of C. kikuchii. A, Vector-transformed control, ∆hnr, and ∆ahcy
disruption mutants were grown on CM plates amended with hygromycin (300 μg/ml) in
continuous light and cercosporin production was assayed on mycelial agar plugs according to
Jenns et al. (1989) and the absorbance at 480 nm was recorded. Error bars represent standard
error of four biological replications. Asterisk indicates significant difference at p < 0.05 using
ANOVA. B, Appearance of vector-transformed control (A), wild-type with no hygromycin (B),
wild-type with hygromycin (no growth) (C), hnr disruption mutants (D through F), and ahcy
disruption mutants (G through I) on CM plates viewed from underside of plates (C from top
side). Reduction in cercosporin production in mutants compared to wild-type and pUCATPH
vector control can be observed on underside of plates. ................................................................ 95
Figure 4.10. Pathogenicity assay of ∆hnr and ∆ahcy mutants on detached soybean leaves
harvested at R1 growth stage from cv. ASGROW 6202. Three 3 mm diameter mycelial agar
plugs were excised from 7 day-old cultures grown on CM plates and directly placed on the
detached soybean leaves with mycelia side touching the adaxial surface of leaves in a Petri plate.
Plates were kept under 16 h light and 8 h dark at 25 ºC for 2 weeks and observed for symptoms.
Severe necrosis and chlorosis was observed in leaves treated with wild type C. kikuchii (A) or C.

xiii
kikuchii transformed with pUCATPH vector (B) compared to very minimal symptoms in leaves
treated with C. kikuchii ∆hnr (C through E) or ∆ahcy (F through H) mutants. ........................... 97
Figure 4.11. Pathogenicity assay of ∆hnr and ∆ahcy mutants on soybean plants (cv. ASGROW
6202) at R1 growth stage in greenhouse inoculations. All cultures were grown on CM plates
lined with Spectra/Por 1 6-8 kDa MWCO dialysis membrane for 10 days in the dark, mycelia
were removed, blended in Waring blender at high speed (1 gm fresh wt. mycelia in 100 ml
water), and sprayed on soybean plants until runoff. Several necrotic spots (pin head size)
surrounded by chlorosis were observed in soybean plants inoculated with wild type (A) or
pUCATPH vector-transformed C. kikuchii (B) compared to very tiny necrotic spots (pin tip size)
in soybean plants inoculated with ∆hnr (C through E) or ∆ahcy (F through H) mutants 2 weeks
after inoculation. ........................................................................................................................... 98
Figure 5.1. Profiles of secreted proteins from Cercospora kikuchii grown under dark and light
conditions separated on two dimensional polyacrylamide gels. Protein profiles of C. kikuchii
grown in minimal media broth with constant shaking (200 rpm) for 1 week in continuous dark
(A, 224 μg) and continuous light (B, 51 μg). Culture supernatant was concentrated and secreted
proteins were precipitated by acetone precipitation and separated on 3-5.6 NL IPG strip,
followed by 12% w/v SDS-PAGE. Arrows indicate the protein spots recovered from the SDS-
PAGE gel for LC-MS/MS. ......................................................................................................... 113
Figure 6.1. A, Diagram of the RNA2 molecule of BPMV. The restriction sites at the end are for
integration of genes of interests into the vector. B, Diagram of AHCY gene with arrows
indicating location of primers used to amplify the middle and 3′ fragments of the AHCY gene in
Cercospora kikuchii. Note: Map is not to scale. ......................................................................... 123
Figure 6.2. PCR amplification of two different regions of AHCY gene from Cercospora kikuchii.
Lane 1, the middle region of AHCY (AHCY #6, 439 bp); lane 2, the 3′ end of AHCY (AHCY #7-
1, 393 bp); and lane M is 1 kb DNA ladder. ............................................................................... 123
Figure 6.3. Restriction digestion of pBPMV-AHCY-6 (lane 1) and pTOPO-AHCY-6 (lane 2)
with StuI and SalI showing release of a 428 bp fragment corresponding to AHCY #6. Restriction
digestion of pBPMV-AHCY-7 (lane 3) and pTOPO-AHCY-7-1 (lane 4) with SalI showing
release of a 241 bp fragment corresponding to AHCY #7. The linearized pBPMV-IA-V2 (lanes
1 and 3) and pCR™ TOPO®-2.1 (lanes 2 and 4) vector parts are shown as 7.8 kb and 3.9 kb
fragments, respectively. Lane M is 1 kb DNA ladder. ............................................................... 124
Figure 6.4. Symptoms induced by blank BPMV vector or modified recombinant virus expressing
foreign genes on leaves of soybean cultivar ASGROW 6202. pBPMV-IA-R1M was used as the
RNA1 for all inoculations. A, Vector soybean plants were bombarded with the empty pBPMV-
IA-V2. B, PDS plants were bombarded with the modified virus containing pBPMV-PDS-3R as
RNA2. C and D, AHCY #6 and AHCY #7 plants that were bombarded with modified virus
containing pBPMV-AHCY-6 and pBPMV-AHCY-7 as RNA2, respectively. AHCY #7 induced
strong viral symptoms compared to AHCY #6. Plants were photographed at 4 weeks post
inoculation................................................................................................................................... 128

xiv
Figure 6.5. Empty vector (pBPMV-IA-V2) amplified with primers BPMV-IA-F1 and BPMV-IA-
R1 (lane 1) showing expected 1.1 kb fragment with no insert. RT-PCR analysis using the
forward primer R2-3195F and each of the reverse primer corresponding to the PDS, AHCY #6,
and AHCY #7 target sequence in each of the HIGS constructs to confirm the PDS (lane 2),
AHCY #6 (lane 3) and AHCY #7 (lane 4) fragment insertions. Lane M is 1 kb DNA ladder... 129
Figure 6.6. RT-PCR analysis showing C. kikuchii AHCY transcript levels in soybeans carrying
recombinant HIGS vectors. AHCY transcript levels in AHCY #6 and AHCY #7 were normalized
against empty vector AHCY transcript levels and 18S rRNA was used as internal reference. ... 130
Figure 6.7. Symptoms on soybean plants carrying recombinant HIGS vectors after 14 days after
Cercospora kikuchii inoculation. Vector control leaves showed small necrotic lesions (see
enlarged region) and BPMV symptoms (A), AHCY #6 plants (B), and ACHY #7 (C) leaves
showed only BPMV symptoms. ................................................................................................. 130
Figure 6.8. Quantitative real-time PCR analysis showing differential accumulation of C. kikuchii
in soybeans carrying recombinant HIGS vectors........................................................................ 131
xv
LIST OF ABBREVIATIONS
2-DE 2-Dimensional electrophoresis
2-DGE 2-Dimensional gel electrophoresis
2-ME 2-Mercaptoethanol
aa Amino acid
ABC ATP-binding cassette
ACN Acetonitrile
AHCY Adenosylhomocysteinase
ANOVA Analysis of variance
BiP Binding innmunoglobulin protein
bp Base pair
BPMV Bean pod mottle virus
BSMV Barley stripe mosaic virus
CBB Coomassie brilliant blue
CDD Conserved domain database
cDNA Complementary DNA
cDNA-AFLP cDNA-amplified fragment length polymorphism
CFP Cercosporin facilitatior protein
CHAPS 3-[(3- cholamidopropyl) dimethylammonio]-1-propane sulfonate
CLB Cercospora leaf blight
CM Complete medium
CMC Carboxymethylcellulose
CTB1 Cercosporin toxin biosynthesis 1
xvi
DAP Days after planting
DD Differential display
DIGE Difference gel electrophoresis
DNA Deoxyribonucleic acid
dpi Days post inoculation
dsRNA Double stranded RNA
DSS Disease severity scores
DTT Dithiotheritol
Ecp Extracellular protein
ESI IT MS/MS Electrospray ionization ion trap tandem mass spectrometry
EST Expressed sequence tag
ETI Effector triggered immunity
FAD Flavin adenine dinucleotide
FCR Fusarium crown rot
FRET Fluorescence resonance energy transfer
GUS β-glucuronidase
HIGS Host-induced gene silencing
HNR Hydroxynaphthalene reductase
HYG Hygromycin
IAA Iodoacetamide
IEF Isoelectric focusing
IPG Immobilized pH gradient
ITS Internal transcribed spacer
xvii
kb Kilo base
kDa Kilo dalton
LC-MS/MS Liquid chromatography tandem mass spectrometry
MALDI-TOF Matrix-assisted laser desorption/ionization time-of-flight
MAPKKK Mitogen activated protein kinase kinase kinase
MFS Membrane facilitator superfamily
miRNA Micro RNA
MM Minimal medium
MP-PCR Microsatellite-primed PCR
MS Mass spectrometry
MW Molecular weight
MWCO Molecular weight cut off
NCBI National Center for Biotechnology Information
NIP Necrosis inducting protein
NL Nonlinear
NMR Nuclear magnetic resonance
nt Nucleotide
NTC No-template control
ORF Open reading frame
PCR Polymerase chain reaction
PDA Potato dextrose agar
PDB Potato dextrose broth
pI Isoelectric point

xviii
PKS Polyketide synthase
PSS Purple seed stain
PST Puccinia striiformis f. sp. tritici
PTGS Post-transcriptional gene silencing
PTM Post-translational modification
qPCR Quantitative polymerase chain reaction
Q-TOF Quadrupole time-of-flight
RAPD Random amplified polymorphic DNA
RdRP RNA dependent RNA polymerase
REMI Restriction enzyme-mediated integration
RH Relative humidity
RNA Ribonucleic acid
RNAi RNA interference
RNA-Seq RNA sequencing
rRNA Ribosomal RNA
RT Room temperature
RT-PCR Reverse transcription-polymerase chain reaction
SAGE Serial analysis of gene expression
SDS Sodium dodecyl sulfate
SDS-PAGE Sodium dodecyl sulfate polyacrylamide gel electrophoresis
siRNA Short interfering RNA
SIX Secreted in xylem
sRNA Small RNA
xix
SSH Suppression subtractive hybridization
SSR Simple sequence repeat
TCA Trichloroacetic acid
TCW Tomato cell walls
TFA Trifluoroacetic acid
TM Transmembrane
TSS Transcriptional start site
TTSS Type three secretion system
VCG Vegetative compatibility group
VIGS Virus induced gene silencing
WT Wild type

xx
ABSTRACT
Cercospora leaf blight (CLB) caused by Cercospora kikuchii, has become a troublesome
disease in the southern United States. C. kikuchii produces a non-hostspecific phytotoxin and a
pathogenicity factor known as cercosporin during infection of soybean. A quantitative real-time
PCR assay was developed for detection and quantification of C. kikuchii. The sensitivity of
detection is 1 pg of genomic DNA. The assay detected the presence of C. kikuchii in soybean
leaves long before the appearance of disease symptoms. C. kikuchii DNA levels in soybean
leaves increased slowly during early soybean development, followed by a quick increase at late
reproductive stages. Results from three year field studies of soybean plants with various
fungicide treatments showed that multiple fungicide applications beginning from late vegetative
stages until late reproductive stages can reduce C. kikuchii growth and CLB symptom
development. However, different fungicides vary in their effectiveness.
In order to identify genes involved in cercosporin biosynthesis, proteins were isolated
from C. kikuchii and compared between cultures grown under light (promotes toxin production
up to 6 fold) and dark conditions through proteomics. Six proteins were up-regulated and two
were down-regulated in C. kikuchii grown under light. Two of the up-regulated proteins
[hydroxynaphthalene reductase (HNR) and adenosylhomocysteinase (AHCY)] were further
studied through gene disruption. The resulting mutants showed reduced cercosporin production
in vitro and virulence on soybean leaves.
C. kikuchii secreted proteins from culture were also examined to identify proteins
involved in the infection of soybean. Two of them showed high homology to glucan beta 1,3-
glucosidase and EAP30 family proteins and identity of several proteins remains unknown. The
function of these proteins in infecting soybean remains to be determined.
xxi
Two small portions of AHCY gene also were inserted into a Bean Pod Mottle Virus
(BPMV) derived vectors and introduced into soybean to explore the possibility of using host-
induced gene silencing (HIGS) in controlling C. kikuchii infection of soybean, The target gene
expression was reduced by 3.5 to 6.6-fold, and C. kikuchii growth was reduced by 16 to18-fold
in the HIGS treated soybean compared to vector control plants, indicating a possible new
approach to control CLB in soybean.
.
1
CHAPTER: 1. INTRODUCTION
1.1 Justification
Soybean is the second among economic crops grown in the United States with annual
production of 261 million tons (FAOSTAT data, 2010). Cercospora kikuchii (T. Matsumoto &
Tomoy.) M. W. Gardner causes purple seed stain (PSS) and cercospora leaf blight (CLB) in
soybeans. In 2006, the estimated yield loss caused by C. kikuchii in 16 southern states was
estimated to be 2.14 million bushels, out of which Louisiana accounts for 0.43 million bushels
(Southern Soybean Disease Workers report, 2006). Purple seed stain was first reported in Korea
in 1921 (Suzuki 1921) and later observed in the US in 1924 (Gardner 1926). PSS is now
distributed worldwide. Typical symptoms of CLB are observed at the beginning of seed filling
(R5) until the end of seed filling (R6) and maturity (R7) (Walters et al. 1980). Varying degrees
of resistance to CLB and PSS have been observed in different soybean cultivars, which are
highly dependent on favorable weather conditions for disease development, and there is no
strong correlation between incidence of CLB and PSS (Orth and Schuh 1994). There has been an
increase in number of soybean cultivars susceptible to CLB in field. In 2002, 59 out of 62
cultivars were susceptible to CLB in standardized cultivar trials (Schneider et al. 2003), whereas
in 2005, all 285 entries were susceptible (R. W. Schneider, unpublished).
Currently, fungicide application is the only solution to manage CLB under field
conditions as most of the soybean cultivars are susceptible to this disease. Different fungicides
were evaluated (Schneider and Whitam 2002, Schneider et al. 2005) to manage CLB but none of
them were effective when applied alone. When two different fungicides were applied together
during reproductive stage, they were slightly effective. Fungicides like pyraclostrobin were only
effective when applied more than once during late vegetative stages (Chanda et al. 2009;
2
Robertson et al. 2011), which is not economically feasible for soybean growers. Earlier studies
found that C. kikuchii and many other fungi often cause latent infections in soybeans
(Cerkauskas and Sinclair 1980; Hartman et al. 1999; Orth and Schuh 1992; Sinclair 1991).
Traditional methods involving bioassays, histological and serological assays to detect latent
infections in soybeans are often time consuming and not sensitive. Without knowing when
infection occurs, producers do not know when to initiate fungicide applications.
Conventional polymerase chain reaction (PCR) has made it possible to detect plant
pathogens based on primers designed for a specific part of their genome sequence. However,
conventional PCR involves separation of reaction products on an agarose gel and is not suitable
for automation when there is a need to screen a large number of samples. The development of
high throughput real-time PCR technology, which uses primers and a fluorogenic probe to
amplify a specific target sequence, allows monitoring the PCR amplification process in real time
and the quantification of target sequence by measuring fluorescence signal without the need for
post PCR gel analysis. After the first successful application of real-time PCR for detecting
Phytophthora strains in their host plants (Böhm et al. 1999), it has been successfully employed in
detecting various plant pathogens including fungi (Li et al. 2008; Oliver et al. 2008; Pico et al.
2008), bacteria (De Bellis et al. 2007; Vandroemme et al. 2008), and viruses (Kokkinos and
Clark 2006; Stewart et al. 2007). It also has been used to quantify growth of pathogens based on
quantification of pathogen DNA (Guo et al. 2006; Qi and Yang 2002). Therefore, there is a
strong need to develop an assay for detection and quantification of C. kikuchii using real-time
PCR primers and probes.
C. kikuchii produces a non-hostspecific phytotoxin known as cercosporin (Kuyama and
Tamura 1957). The biosynthesis of cercosporin is induced by light, and cercosporin itself is
3
photo-activated by blue-wavelength light. Light-activated cercosporin catalyzes the production
of singlet oxygen and superoxide ions, which in turn can cause membrane lipid peroxidation
resulting in host cell damage (Daub 1987). Cercosporin has been shown to be the crucial
pathogenicity factor for C. kikuchii (soybean), C. nicotianae (tobacco), and C. zeae-maydis
(maize). Mutants lacking the ability to produce cercosporin did not cause lesions or produced
only few lesions when inoculated on respective host plants (Choquer et al. 2005; Shim and
Dunkle 2003; Upchurch et al. 1991).
The chemical characteristics of cercosporin are well established, but the biosynthetic
pathway in C. kikuchii remains uncharacterized. Ehrenshaft and Upchurch (1991) successfully
isolated six light enhanced cDNAs of C. kikuchii by subtracting the cDNA library of C. kikuchii
grown under dark from that grown under light. The transcript accumulation of these cDNAs was
positively correlated with light, suggesting the role of light in cercosporin production in addition
to media composition in some isolates. There are several studies that have shown that the level of
gene expression does not necessarily correlate with the protein levels in a cell (Gygi et al. 1999).
One approach to identify additional cercosporin biosynthesis pathway genes is to use proteomics.
Proteomics is a study of all proteins, including their relative abundance, distribution, post-
translational modification, functions and interactions with other macromolecules in a given cell
or tissue. The identification of genes involved in the cercosporin biosynthetic pathway may be
essential for developing resistance in soybean cultivars and other crops susceptible to diseases
caused by cercosporin-producing species of this fungal genus by using modern strategies like
host-induced gene silencing (Helber et al. 2011; Nowara et al. 2010; Stärkel 2011; Yin et al.
2011). This approach may also allow the identification of the genes used by C. kikuchii to confer
self-resistance to cercosporin. Genetic engineering can be used to incorporate these toxin
4
resistance genes in crops to protect from the damage caused by the phytotoxin cercosporin. We
can analyze proteins isolated from C. kikuchii using 2-D gel electrophoresis (2-DGE) and
compare the resulting protein profile differences between different conditions like cercosporin
production favorable (light) and non-favorable conditions (dark) to identify possible proteins
involved in cercosporin biosynthesis and/or protein involved in resistance to cercosporin. In
addition to proteins involved in cercosporin biosynthesis that can be used to manipulate/enhance
host resistance to this pathogen, studying fungal secreted proteins, which often contain virulence
factors/effectors to either suppress host defense response or breach host defense
mechanism/breach host physical barrier to gain access to host nutrients, is another approach to
understand host-pathogen interaction and to enhance soybean resistance to C. kikuchii infection
in soybean.
1.2 Objectives
1) To develop a real-time PCR assay specific for detection of Cercospora kikuchii
2) To quantify Cercospora kikuchii directly from naturally infected soybean tissues
3) To compare DNA content of Cercospora kikuchii in infected plants subjected to different
fungicide treatments to dertermine the efficacy of various treatments
4) To identify differentially expressed proteins from light and dark-grown Cercospora
kikuchii through proteomics approach
5) To characterize roles of light-induced HNR and AHCY genes identified through
proteomics approach in Cercospora kikuchii infection of soybean.
6) To identify secreted proteins from Cercospora kikuchii
7) To evaluate whether host-induced gene silencing strategy can be used to control CLB
using AHCY gene

5
CHAPTER 2: REVIEW OF LITERATURE
2.1 Soybean
Soybean, Glycine max (L.) Merr., was cited as one of the five sacred grains in China as early as
2838 B.C. Soybean was introduced into the United States in 1765 when soybean seed from
China was planted by a colonist in the British colony of Georgia (Hartman et al. 1999). In 2010,
soybeans were planted on 102 million ha worldwide with a production of 261 million metric tons
(FAOSTAT, 2010). Soybean is the second most important crop in the United States next to corn,
and is planted on 31 million ha with a total production of 91 million tons in 2010. The top five
countries that produced more than 94% of the world soybeans include the United States (35%),
Brazil (26%), Argentina (20%), China (9.5%), and India (3.7%) (FAOSTAT, 2010). Soybean
seeds are rich in oil (20%) and protein (40%). Soybean meal is mainly used as animal feed and a
small proportion is used for human consumption. Soybean oil is mainly used for human
consumption (83%) and also for making adhesives, coatings and printing inks, lubricants,
plastics and specialty products (United Soybean Board, http://www.unitedsoybean.org/).
2.2 Soybean Growth and Development
Soybeans have two growth habits, determinate and indeterminate growth. The main
distinguishing feature is that the indeterminate soybeans continue main stem growth indefinitely
after first flowering, whereas determinate soybeans terminate main stem growth shortly after first
flowering. Indeterminate varieties generally are classified as early maturing soybeans (maturity
group IV or lower), whereas determinate soybeans are generally in the late maturing groups
(maturity groups V through VIII) (Louisiana Soybean, 1996, Louisiana Cooperative Extension
Service publication). The maturity classification of soybeans is based on the days from
emergence to maturity for a specific maturity group in the area of adaptation and when planted at

6
the optimal planting date. Traditionally late maturing determinate soybeans have been grown in
Louisiana and the rest of the southeastern U.S., and early maturing indeterminate varieties are
grown in midwestern and northeastern U.S.
Soybean is a quantitative short day plant, which means day-length must be at a critical
level or less for rapid profuse flowering to occur. Soybean cultivars require a specific length of
dark period to flower (Hartwig 1973), and based on their response to photoperiod, they are
divided into 13 maturity groups designated 000, 00, 0 and I to X. Those cultivars with the
shortest dark period requirements (group 000) are adapted to highest latitudes, whereas groups
IX and X are used primarily in semitropical or tropical production areas. Most cultivars within
maturity groups are adapted for full-season growth in a band of latitude no wider than 160 to 240
km (Hartman et al. 1999).
The lifecycle of soybean is divided into two general categories, vegetative period and the
reproductive period. The vegetative period extends from emergence until first flowering,
whereas the reproductive period lasts from first flowering until maturity. Fehr et al. (1971)
developed a well-defined system for describing different stages of soybean development.
Vegetative stages are named for the appearance of leaves, and begin with the V1 stage until the
beginning of the reproductive stage. Reproductive stages are defined by the letter R. First
flowering is R1. Full flowering, pod initiation, pod elongation, the start of seed filling and the
end of seed filling are designated as R2, R3, R4, R5, R6, and R7, respectively.
2.3 Yield Loss Caused by Cercospora kikuchii
Soybean production can be affected by a variety of pathogens, including fungi, bacteria,
viruses and nematodes resulting in significant yield losses. In 2005, 6.9 million tons (9%) of
soybeans were lost because of different diseases in the U.S. (Wrather and Kenning 2006) out of
7
77.3 million tons total production. Among disease caused by fungi, Cercospora leaf blight (CLB)
and purple seed stain (PSS) diseases are caused by Cercospora kikuchii (T. Matsumoto &
Tomoy.) M. W. Gardner (Matsumoto and Tomoyasu 1925; Suzuki 1921; Walters 1980). In 2006,
the estimated yield loss caused by C. kikuchii in 16 southern states was estimated to be 2.14
million bushels, out of which Louisiana accounts for 0.43 million bushels (Southern Soybean
Disease Workers report, 2006).
2.4 Cercospora kikuchii
2.4.1 Cercospora kikuchii and Latent Infection of Soybeans
Cercospora kikuchii growth on artificial media is uniformly dense, with deep folds
radiating from the center. Colonies are white at the edges and light grayish olive toward the
centers (Hartman et al. 1999). The medium beneath the colony varies in color but is often dark
purple to red in color (Hartman et al. 1999; Murakishi 1951; Roy 1982). Condiophores form in
fascicles, and they are medium dark brown, multiseptate and geniculate, unbranched and 45-220
x 4-6 μm (Fig. 1.1A and B). Conidia are hyaline, acicular, indistinctly multiseptate (2-49),
straight to curved, base truncate with thickened hilum (Fig. 1.1B) and 50-375 x 2.5-5 μm (Chupp
1954; Hartman et al. 1999). Young hyphae in culture are hyaline, septate, 2-4 μm thick, whereas
old hyphae are pale brown, 3-5 μm thick, and closely septate (Hartman et al. 1999). C. kikuchii
sporulates profusely under high humidity and temperatures of 23-27°C on infected plant tissues
and excised seed coats. But, for sporulation on artificial media, addition of senescent soybean
leaf powder and incubation under light (Chen 1979; El-Gholl et al. 1981; Vathakos and Walters
1979; Yeh and Sinclair 1980) are essential requirements. C. kikuchii can survive on infected
seeds and surface debris in the field for extended periods (Jones 1968; Kilpatrick 1956). Cai and
Schneider (2005) analyzed the vegetative compatibility groups (VCGs) in C. kikuchii and found

8
that some VCGs are specific to isolates from either leaf or seed. However, randomly amplified
DNA polymorphism (RAPD) and microsatellite-primed PCR (MP-PCR) based clustering of
these isolates was different from VCG grouping, indicating that VCG is not an indicator of
evolutionary lineage and could be possible due to cryptic sexual reproduction (Cai and Schneider
2008).
Purple stained seeds and crop debris on the soil surface may serve as primary inoculum
during the growing season (Jones 1968; Kilpatrick 1956; Orth and Schuh 1994). Orth and Schuh
(1992) observed latent infection of C. kikuchii resulting from active penetration of the host
epidermal cell wall followed by subsequent colonization of one to a few cells during soybean
growth stage V2-R4. They based their conclusions on a procedure in which they either
desiccated asymptomatic leaves for 48 hours or dipped the leaves in 11.64% paraquat solution.
Latent infecting hyphae resumed growth and sporulation during the senescent phase, and these
conidia may serve as secondary inoculum for sustaining an epidemic. Spore trapping
experiments revealed two peaks in aerial spore concentration, one at the beginning of the
growing season and the other at the beginning of the seed set. The second sporulation peak, in
the absence of visible symptoms or crop residues from the previous season, resulted from latent
infections on leaves (Hartman et al. 1999).

9
Figure 1.1. Cercospora kikuchii characteristics and symptoms on soybean. A, C. kikuchii
conidiophores developed on a soybean leaf showing typical CLB symptoms after incubating in a
moist chamber for 48 hours. B, Fascicle of conidiophores (A). Conidia (B), Original in: Hsieh,
W.H. & Goh, T.K. 1990, Cercospora and similar fungi from Taiwan. Published 1990 by Maw
Chang Book Co. in Taipei, Taiwan. Image source:
http://www.mycobank.org/MycoTaxo.aspx?Link=T&Rec=252873. C, Typical purple seed stain
(PSS) symptoms on soybean seeds. (Image source:
http://www.omafra.gov.on.ca/english/crops/pub811/14soybean.htm). D, Typical cercospora leaf
blight (CLB) symptoms on soybean leaves. (Image source: Dr. Zhi-Yuan Chen).
2.4.2 Purple Seed Stain (PSS)
Purple seed stain was first reported in Korea (Suzuki 1921) and later observed in the U.S.
(Gardner 1926) and Japan (Kikuchi 1924) in 1924. PSS is now a worldwide disease of soybean.
PSS symptoms are characterized by irregular blotches varying from light pink to dark purple and
ranging from a tiny spot to the entire area of the seed coat (Murakishi 1951) (Fig. 1.1C) PSS
does not affect soybean yield but reduces the quality of soybean seeds. Purple stained seeds have
poor germination and produce weak seedlings (Lehman 1950; Murakishi 1951; Pathan and
Sinclair 1989; Wilcox and Abney 1973). Cercospora kikuchii causes symptoms on hypocotyls,
leaves, stems, petioles as well as on pods and seeds (Jones 1968; Kilpatrick 1956; Lehman 1950;
Matsumoto and Tomoyasu 1925; Murakishi 1951).

10
2.4.3 Cercospora Leaf Blight (CLB)
Typical symptoms of CLB are observed at the beginning of seed filling (R5) until the end
of seed filling (R6) and maturity (R7). Reddish purple, angular-to-irregular lesions occur on
upper leaves exposed to sunlight (Fig. 1.1D). Numerous infections cause rapid chlorosis and
necrosis of leaf tissue, resulting in defoliation. The most obvious symptom is the premature
blighting of the younger, upper leaves over large areas, even entire fields (Walters et al. 1980).
CLB is an economically important disease and can cause substantial yield loss in many countries
(Wrather et al. 1997, 2001). In Louisiana, CLB became more severe beginning in 1999 (Moore
and Walcott 2000). Originally CLB was limited to the southern United States, but the disease has
been slowly moving as far north as Iowa and Ohio in the past few years. Currently, CLB is the
top soybean disease in Louisiana causing great concern to soybean growers in the state
(Raymond Schneider, personal communication).
2.4.4 Resistance to PSS and CLB
Varying degrees of resistance to leaf blight and purple seed stain have been observed in
different soybean cultivars. However, there is no strong correlation between incidence of CLB
and PSS and both diseases are highly dependent on favorable weather conditions for
development (Orth and Schuh1994). Two studies (Ploper et al. 1992; Roy and Abney 1976)
indicated that soybean line PI 80837 is resistant to PSS. Using a F2 population derived from a
cross between cultivars Agripro 350 (AP 350) and PI 80837 and simple sequence repeat (SSR)
markers, Jackson et al. (2006, 2008) showed that resistance to PSS in PI 80837 was controlled by
a single dominant gene, Rpss1, and mapped between Sat_308 (6.6 cM) and Satt594 (11.6 cM) on
soybean molecular linkage group G. Walters (1980) screened 10 soybean cultivars for resistance
to C. kikuchii. Based on greenhouse inoculations, he reported that all cultivars were susceptible

11
to leaf blight, but cultivars Davis and Lee74 were moderately susceptible, and cultivar Tracy was
slightly susceptible. There has been an increase in the number of soybean cultivars susceptible to
CLB in the field. In 2002, 59 out of 62 cultivars were susceptible to CLB in standardized cultivar
trials (Schneider et al. 2003), whereas in 2005, all 285 entries were susceptible (Raymond
Schneider, personal communication). This forced soybean growers in Louisiana to shift to plant
early maturing cultivars in part to avoid CLB and other late-season diseases (Moore and Bouquet
2008). Cai et al. (2009) screened 11 varieties under greenhouse and field conditions for
resistance to CLB and found only 2 varieties, AG5701 and TV59R85, with a moderate level of
resistance to CLB.
2.4.5 Management of Cercospora Leaf Blight
Currently, fungicide application is the only solution to manage CLB under field
conditions as most of the soybean cultivars are susceptible to this disease. Different fungicides
were evaluated (Schneider and Whitam 2002; Schneider et al. 2005) to manage CLB but none of
them were effective when applied alone. However, when two different fungicides were applied
together during reproductive stages, they were slightly effective. Fungicides like pyraclostrobin
were only effective when applied more than once during late vegetative stages (Chanda et al.
2009, Robertson et al. 2011) but multiple applications are not economically feasible option for
soybean growers.
As the symptoms of CLB are not visible until late reproductive stages (R5 and later), it is
very difficult to know when the initial infection occurred. The successful use of fungicide
application strategy requires early detection of C. kikuchii in soybean tissues. Earlier studies
found that C. kikuchii and many other fungi often cause latent infections in soybeans (Hartman et
al. 1999; Orth and Schuh 1992; Sinclair 1991). As a result disease symptoms, such as chlorosis

12
and necrosis, only become visible long after initial infection and usually at late growth stages
when plants are under stress or there is a sudden change in nutritional or environmental
conditions (Cerkauskas and Sinclair 1980; Hartman et al. 1999; Orth and Schuh 1994).
Fungicide applications at these late growth stages are usually ineffective (Robertson et al. 2011).
2.5 Cercosporin
2.5.1 Cercosporin and Mode of Action
Kuyama and Tamura (1957) isolated a deep red pigment from dried mycelia of C.
kikuchii. Further study showed that the pigment can be dissolved in aqueous alkali and in
reduced state, had a bright yellow color with intense green fluorescence. Because of the presence
of a chromophoric system in the pigment that differed remarkably from pigments isolated from
other fungi and lichens at that time, they named this toxin as cercosporin. Kuyama (1962)
described the nature of aromatic ring of cercosporin. The chemical structure of cercosporin (Fig.
1.2) was elucidated independently by Lousberg et al. (1971) and Yamazaki and Ogawa (1972) to
be 1,12-bis(2-hydroxypropyl)-2,11-dimethoxy-6,7-methylenedioxy-4,9-dihydroxyperylene-3,10-
quinone (C29H26O10). Yamazaki et al. (1975) demonstrated the requirement for both light and
oxygen and the photodynamic properties of cercosporin on mice and bacteria. Similar effects
also were observed with suspension-cultures of tobacco cells (Daub 1982) and plant tissues
(Macri and Vianello 1979), with a linear relationship between cell death and light intensity. The
action spectrum of the cell killing response agreed with the absorption spectrum of cercosporin.
Cercosporin is a photosensitizer that absorbs light energy and is converted to an
energetically activated triplet state (3S).
3S reacts by an electron transfer reaction (type I reaction)
through a reducing substrate (R) to generate a reduced sensitizer (S-.), which in turn reacts with
molecular oxygen to generate superoxide ions (O2-.). Alternatively,
3S may react directly with
13
oxygen by an energy transfer process to generate singlet oxygen (1O2) (type II reaction).
Evidence suggests that 1O2 formation is the major mechanism by which cercosporin exerts its
toxicity (reviewed in Daub and Ehrenshaft 1997). The production of 1O2 from cercosporin in
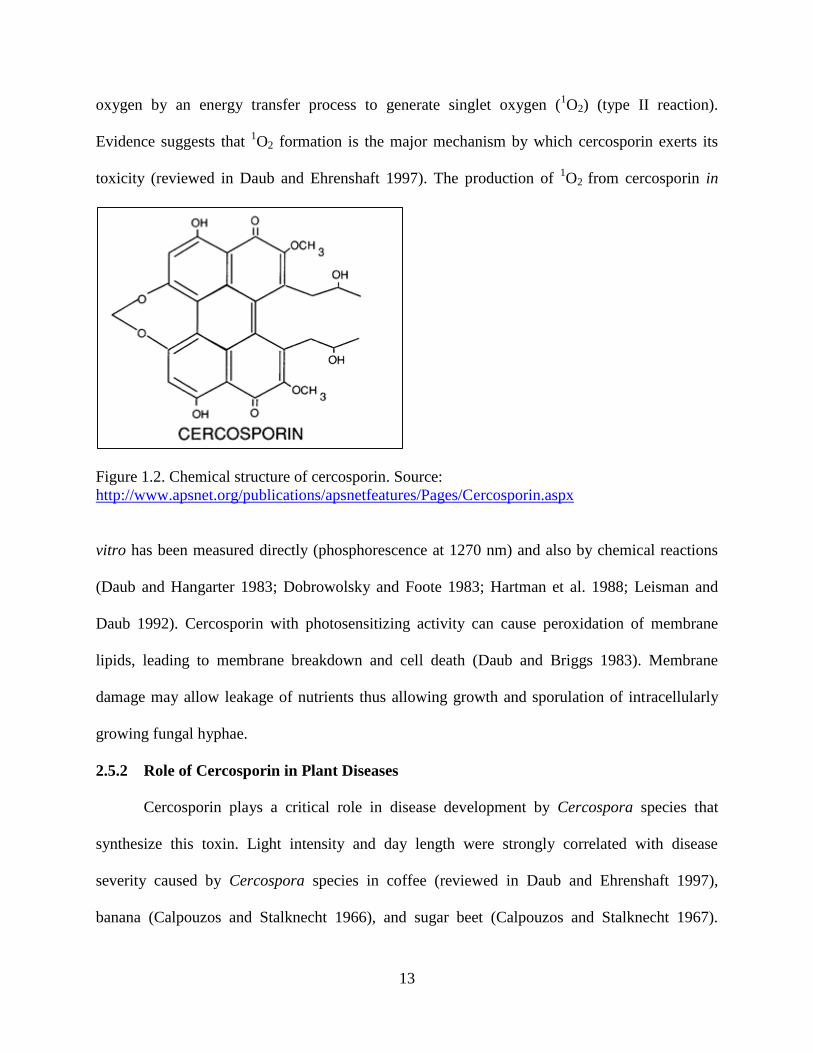
Figure 1.2. Chemical structure of cercosporin. Source:
http://www.apsnet.org/publications/apsnetfeatures/Pages/Cercosporin.aspx
vitro has been measured directly (phosphorescence at 1270 nm) and also by chemical reactions
(Daub and Hangarter 1983; Dobrowolsky and Foote 1983; Hartman et al. 1988; Leisman and
Daub 1992). Cercosporin with photosensitizing activity can cause peroxidation of membrane
lipids, leading to membrane breakdown and cell death (Daub and Briggs 1983). Membrane
damage may allow leakage of nutrients thus allowing growth and sporulation of intracellularly
growing fungal hyphae.
2.5.2 Role of Cercosporin in Plant Diseases
Cercosporin plays a critical role in disease development by Cercospora species that
synthesize this toxin. Light intensity and day length were strongly correlated with disease
severity caused by Cercospora species in coffee (reviewed in Daub and Ehrenshaft 1997),
banana (Calpouzos and Stalknecht 1966), and sugar beet (Calpouzos and Stalknecht 1967).
14
Treatment of sugar beet leaves with pure cercosporin reproduced the necrotic symptoms that are
both consistent with the known mode of action of cercosporin and similar to the disease
symptoms caused by C. beticola (Steinkamp et al. 1979, 1981). In addition, cercosporin has been
isolated from necrotic lesions of several infected plant hosts (Fajola 1978; Kuyama and Tamura
1957; Venkataramani 1967). Cercosporin has been shown to be the crucial pathogenicity factor
for C. kikuchii (soybean), C. nicotianae (tobacco), and C. zeae-maydis (maize). C. kikuchii
mutants disrupted for the CFP transporter gene had reduced ability to produce cercosporin and
reduced virulence on soybeans and increased sensitivity to exogenously applied cercosporin
(Upchurch et al. 1991). C. zeae-maydis mutants disrupted for CZK3 MAP kinase kinase kinase
(MAPKKK) have lost capability to produce cercosporin, and conidia and produced only
chlorotic lesions compared to necrotic lesions that are produced by the wild type (Shim and
Dunkle 2003). Choquer et al. (2005) disrupted the CTB1 gene coding for polyketide synthase in
C. nicotianae and mutants for CTB1 gene did not produce cercosporin and produced fewer
lesions but not necrotic lesions that are typical of wild type C. nicotianae.
2.5.3 Cercosporin Biosynthesis
Once the chemical structure and photodynamic characteristics of cercosporin were
understood, research focused on understanding cercosporin biosynthesis. Japanese researchers
(Okubo et al. 1975; Yamazaki and Ogawa 1972) conducted substrate feeding experiments in
which C. kikuchii was incubated in the presence of 14
C and
13C incorporated acetate and formate
compounds. Mass spectrometry (MS) and nuclear magnetic resonance (NMR) data indicated that
cercosporin produced from these cultures was synthesized by condensation of acetate and
malonate via a polyketide pathway (Fig. 1.3). Ehrenshaft and Upchurch (1991), using subtractive
hybridization, found several mRNA transcripts that are accumulated at higher levels in C.
15
kikuchii that was grown in light as compared to dark. Rollins et al. (1993) performed two-
dimensional gel electrophoresis (2-DGE) of both extracted proteins and in vitro translation
products of wild type C. kikuchii and found polypeptides and poly (A)+ RNAs that were
positively regulated by light, but they did not identify any related proteins. One cDNA, LE6 from
Ehrenshaft and Upchurch (1991), was sequenced and identified as cercosporin facilitator protein
(CFP). CFP has 14 transmembrane (TM) domains with high homology to membrane facilitator
superfamily (MFS) drug resistance transporter proteins (Callahan et al. 1999). C. kikuchii
mutants disrupted for CFP produced very low levels of cercosporin, were sensitive to
exogenously applied cercosporin and also exhibited greatly reduced virulence to soybeans. Shim
and Dunkle (2002) constructed a suppression subtractive hybridization (SSH) library of C. zeae-
maydis by subtracting poly (A)+ RNA isolated from cercosporin-suppressing medium from poly
(A)+ RNA isolated from cercosporin- inducing medium and identified nearly 197 cDNAs. Based
on the predicted functions of the proteins encoded by these cDNAs, the genes were grouped into
nine categories. Northern blot analysis of seven selected clones showed high expression under
cercosporin-inducing conditions and genes were predicted to be involved in fatty acid
metabolism (fatty acid synthase, oleate ∆-12 desaturase, and linolate diol synthase), secondary
metabolism (cytochrome P450 oxidoreductase, cytochrome P450 monooxygenase,
dihydrogeodin phenol oxidase), and coproporphyrinogen oxidase. However, none of these genes
was characterized by generating loss-of-function mutants. Further analysis of the cDNA library
revealed the presence of a MAPKKK (mitogen-activated protein kinase kinase kinase) gene that
plays a key role in many signal transduction pathways (Shim and Dunkle 2003). Targeted
disruption of CZK3 MAPKKK abolished cercosporin production, conidiation, and also mutants
were less virulent on maize leaves. Bluhm et al. (2008) constructed an extensive expressed
16
sequence tag (EST) library of C. zeae-maydis and evaluated expression of selected genes during
vegetative, infectious, and reproductive growth. They also identified several genes potentially
involved in growth regulation, development, and pathogenesis in C. zeae-maydis.
Much of the understanding about cercosporin biosynthesis comes from research done on
C. nicotianae. Chung et al. (2003c) used restriction enzyme-mediated integration (REMI) and
generated several C. nicotianae mutants that were deficient in cercosporin production.
Sequencing one of the rescued plasmids (pCTB1) from one of the toxin deficient mutants
revealed the presence of a polyketide synthase (PKS) gene which they named CTB1 (cercosporin
toxin biosynthesis 1). Disruption of CTB1 completely abolished cercosporin production and
mutants disrupted for CTB1 caused only few necrotic lesions compared to wild type C.
nicotianae. Expression of CTB1 transcript was also highly up-regulated by light and nutrient
media that favor cercosporin production. Dekkers et al. (2007) found another gene, CTB3,
adjacent to CTB1, which encodes two putative domains i.e., an O- methyltransferase domain in
the N-terminus and a flavin adenine dinucleotide (FAD)-dependent monooxygenase domain in
the C-terminus and demonstrated that CTB3 is also required for cercosporin biosynthesis and
also hypothesized that cercosporin toxin biosynthesis genes in C. nicotianae may be arranged as
a gene cluster. Genes involved in the biosynthesis of many secondary metabolites are often
arranged in clusters, for example, afaltoxin by Aspergillus species (Brown et al. 1996, 1999; Yu
et al. 2004a), fumonisin and trichothecene in Fusarium (Gibberella) species (Hohn et al. 1993;
Proctor et al. 2003; Seo et al. 2001), sirodesmin in Leptosphaeria maculans (Gardiner et al.
2004), compactin in Penicillium citrinum (Abe et al. 2002), gibberellin in Gibberella fujikuroi
(Tudzynski and Hölter 1998), alkaloids in Claviceps purpurea (Tudzynski et al. 1999) and
Neotyphodium uncinatum (Speiring et al. 2005), AK toxin in Alternaria alternata (Tanaka and
17
Tsuge 2000) and HC toxin in Cochliobolus carbonum (Ahn and Walton 1996). CTB3 disruption
mutants produced yellow/brown pigment and also were less virulent on tobacco leaves.
Sequencing of the 34 kb region identified presence of 10 additional open reading frames (ORFs)
that might be part of the gene cluster. Choquer et al. (2007) identified a CTB4 gene downstream
of CTB1 and CTB4 has similarity to MFS transporter genes with 12 TM domains. Mutants
disrupted for CTB4 produced less cercosporin and did not secrete cercosporin into the medium,
suggesting that CTB4 is involved in secretion and accumulation of cercosporin. Chen et al.
(2007a) reported that CTB5 and CTB7 (FMN/FAD-dependent oxidoreductases), and CTB6
(NADPH-dependent oxidoreductase) genes also were involved in cercosporin biosynthesis. Chen
et al. (2007b) characterized a Zinc finger transcription factor encoding gene CTB8 and putative
CTB2 gene (O-methyltransferase) involvement in cercosporin biosynthesis. Disruption of CTB8
abolished the accumulation of transcripts CTB1 through CTB7 indicating that CTB8 acts a
regulatory switch to control the cercosporin biosynthetic pathway. Based on observations from
CTB1-CTB8 genes, Chen et al. (2007b) proposed a possible biosynthetic pathway for cercosporin
in C. nicotianae (Fig. 1.3). Production of cercosporin is regulated by signaling network interplay
between Ca2+
/calmodulin and a MAP kinase pathway (Chung 2003; Shim and Dunkle 2003).
Chung et al. (2003a and 2003b) also characterized a CRG1 protein containing a Cys6Zn2
binuclear cluster DNA-binding motif with homology to various fungal regulatory proteins,
indicating that CRG1 may function as a transcription activator. CRG1 disruption mutants were
partially sensitive to cercosporin and also produced low levels of cercosporin, indicating that
CRG1 is involved in the activation of genes associated with cercosporin resistance and
production in the fungus C. nicotianae. Amnuaykanjanasin and Daub (2009) identified ATR1 and
CnCFP genes in C. nicotianae from a subtractive library between the wild type (WT) and a crg1
18
mutant. ATR1 is an ATP-binding cassette (ABC) transporter gene and disruption resulted in
lower cercosporin and increased sensitivity to exogenously applied cercosporin. Constitutive
expression of ATR1 in the crg1 mutant restored cercosporin biosynthesis and moderately
increased resistance to cercosporin.
The chemical characteristics of cercosporin are well established, but the biosynthetic
pathway in C. kikuchii remains uncharacterized. The elucidation of this cercosporin biosynthetic
pathway may be essential for developing resistance in soybean cultivars and other crops
susceptible to diseases caused by cercosporin-producing species of this fungal genus. One
approach to identify additional cercosporin biosynthesis pathway genes is to separate proteins
isolated from C. kikuchii isolates using two dimensional gel electrophoresis (2-DGE) and to
compare the resulting protein profile differences between different conditions such as
cercosporin production favoring (light) and suppressive conditions (dark).
2.5.4 Resistance to Cercosporin
Apart from cercosporin biosynthesis, research on Cercospora species has also focused on
understanding self-resistance to cercosporin, the knowledge of which can be utilized to
genetically engineer important crops to protect them from the damage caused by cercosporin.
The CFP gene in C. kikuchii was shown to be involved in resistance to cercosporin (Callahan
1999). Upchurch et al. (2002) transformed the cercosporin sensitive fungus, Cochliobolus
heterostrophus, with CFP and demonstrated enhanced resistance to cercosporin. Certain bacteria
such as Xanthomonas campestris pv. zinniae and X. campestris pv. pruni can degrade
cercosporin (Mitchell et al. 2002) into a non-toxic compound, xanosporic acid. A putative
oxidoreductase was involved in this degradation process (Taylor et al. 2006). Studies C.
nicotianae mutants sensitive to cercosporin identified several genes that confer resistance to
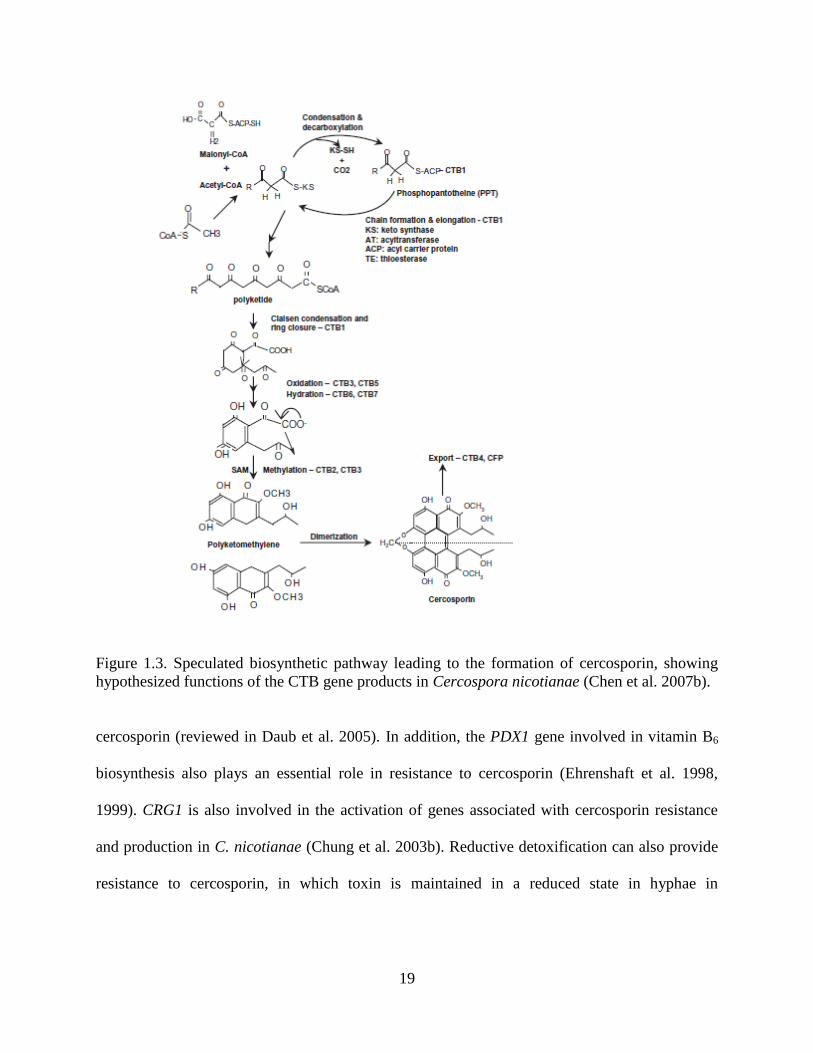
19
Figure 1.3. Speculated biosynthetic pathway leading to the formation of cercosporin, showing
hypothesized functions of the CTB gene products in Cercospora nicotianae (Chen et al. 2007b).
cercosporin (reviewed in Daub et al. 2005). In addition, the PDX1 gene involved in vitamin B6
biosynthesis also plays an essential role in resistance to cercosporin (Ehrenshaft et al. 1998,
1999). CRG1 is also involved in the activation of genes associated with cercosporin resistance
and production in C. nicotianae (Chung et al. 2003b). Reductive detoxification can also provide
resistance to cercosporin, in which toxin is maintained in a reduced state in hyphae in

20
Cercospora species and emits green fluorescence. Upon excretion by fungal cells, this reduced
form of cercosporin was oxidized and regained photodynamic activity (Daub et al. 1992).
2.5.5 Factors Affecting Cercosporin Production
Cercosporin biosynthesis is affected by diverse factors such as light, temperature, nutrient
conditions, pH, source of carbon and nitrogen, and carbon : nitrogen ratio. Higher cercosporin
was accumulated at 20°C compared to 30°C in two media by different C. kikuchii isolates. C.
kikuchii ATCC 86864 produced more cercosporin on malt media while C. kikuchii IN (isolated
from soybeans in Indiana) produced more on PDA, indicating there is isolate/media specificity
for cercosporin production. Peak cercosporin accumulation occurred at C:N ratios of 500:1 in C.
kikuchii PR (isolated from soybeans in Puerto Rico), 150:1 in C. kikuchii IL (isolated from
soybeans in Illinois), 50:1 in C. beticola, and 10:1 in C. nicotianae (Jenns et al. 1989). Depletion
of nitrogen in the medium had little effect on cercosporin production whereas depletion of
carbon drastically reduced cercosporin production in C. nicotianae (You et al. 2008). Unlike the
above factors, light is a universally required cue for cercosporin production by all Cercospora
isolates tested. Light is required for both production and activation of cercosporin. C. kikuchii
isolates grown in continuous light accumulated 100-fold more cercosporin than dark-grown
cultures (Ehrenshaft and Upchurch 1991, Fajola 1978). Lynch and Geoghegan (1979)
demonstrated using spectral analysis that cercosporin production was stimulated by wavelengths
of 450-490 nm in C. beticola.
2.6 Real-Time Polymerase Chain Reaction (Real-time PCR)
2.6.1 Available Real-Time PCR Technologies
Invention of the polymerase chain reaction by Kary Mullis in 1984 (Mullis and Faloona
1987) was a major breakthrough in science and has accelerated scientific discoveries. Soon after
21
this invention, researchers were interested in quantifying PCR to determine the concentration of
nucleic acids for gene quantification and pathogen detection. This has led to development of
real-time PCR, in which PCR amplification was monitored from cycle to cycle using detectors,
rather than end point detection by electrophoretic gel separation in conventional PCR.
Real-time PCR technology has gained momentum with the use of fluorescent dyes for
detection of amplicons. Early detection techniques used intercalating dyes such as SYBR® Green
for detecting amplification. SYBR® Green was very useful and can be used with any gene/primer
combinations. However, as it can bind to both specific and non-specific amplification products,
the reaction needs proper optimization. A SYBR® Green assay should always be accompanied by
a melting curve analysis to confirm the amplification of a single target region and also SYBR®
Green assays do not allow multiplexing.
The potential problem of detecting non-specific amplicons has led to development of new
techniques that involve the use of labeled oligonucleotides that bind specifically to target
sequence. This technology uses probes labeled with two different fluorochromes and is based on
Fluorescence Resonance Energy Transfer (FRET). This energy transfer only occurs if the two
molecules are in close proximity to each other (a few nanometers). Depending on the proximity
to the second fluorochrome, the first one may either emit light or transfer its energy to the
second, which in turn fluoresces. Thus, bringing the two fluorochromes in close proximity to
each other results in the fluorescence quenching of the first one, and fluorescence emission of the
second one. As the fluorescence from the emitting fluorochrome increases proportionally with
the amount of newly synthesized DNA, both effects can be recorded to follow the amplification
of the target DNA. However FRET was not popular in plant sciences owing to the use of four
oligonucleotides and was only limited to studies that required very high level of specificity.
22
FRET was followed by development of the quenching system such as the Taqman®
assay which is based on the 5′ 3′ exonuclease activity of Taq DNA polymerase. In the
Taqman® assay, in addition to gene-specific forward and reverse primers, oligonucleotide
probes also are included which have a fluorescent reporter dye [e.g. 6-carboxy-fluorescein
(FAM)] at the 5′ end and a fluorescent quencher [e.g. 6-carboxy-tetramethylrhodamine
(TAMRA)] at the 3′ end with a blocked phosphate group to prevent PCR-driven elongation.
Once the PCR is in progress, primers and probe will bind to complementary regions. As the
forward primer is extended during the extension step, the 5′ end of the probe is cleaved because
of the 5′ 3′ exonuclease activity of Taq DNA polymerase which releases the fluorescent
reporter dye. Once the reporter dye is cleaved and away from the quencher, an increase in
fluorescence is detected. As more and more amplicon is produced exponentially during the
subsequent cycles, fluorescence will also increase exponentially. By plotting the increase in
fluorescence (ΔRn) versus the PCR threshold cycle number (Ct), the system produces plots that
provide a more complete picture of the PCR process. The higher the starting copy number of the
nucleic acid target, the sooner a significant increase in fluorescence is observed. Finally, the use
of an internal positive control (e.g. 18S rRNA or other housekeeping gene) in parallel reactions
to the target reactions allows the normalization of DNA/RNA extraction variations between
samples (AppliedBiosystems, Foster City, CA). Taqman® probes were followed by the
development of Molecular beacons (Tyagi and Kramer 1996) and ScorpionTM
probes (Thelwell
et al. 2000).
2.6.2 Application of Real-Time PCR to Study Plant Pathogens
Since its first application in the detection of Phytophthora strains in their host plants
(Böhm et al. 1999), real-time quantitative PCR (qPCR) has proven to be a very simple and
23
reliable way to detect numerous plant pathogens such as fungi (Filion et al. 2003; Gachon and
Saindrenan 2004; Gao et al. 2004; Li et al. 2008; Oliver et al. 2008; Pico et al. 2008), bacteria
(De Bellis et al. 2007; Weller et al. 2000; Randhawa et al. 2001; Schaad et al. 1999;
Vandroemme et al. 2008; Weller and Stead 2002), viruses (Kokkinos and Clark 2006; Stewart et
al. 2007), and nematodes (Cao et al. 2005; Madani et al. 2005; Francois et al. 2007). Compared
to other classical diagnostic methods, real-time PCR-based assays are rapid, sensitive, specific
and best suited to discriminate between slightly different levels of infection (Winton et al. 2003).
Moreover, since their specificity relies on primer/probe sequences, such assays are easy to
develop and they can be transposed to virtually every pathosystem. Real-time PCR also has been
extensively used in clinical microbiology, food microbiology, and clinical oncology for detection
and quantification of various infectious agents (Klein 2002). Real-time PCR is not only useful
for detection but also quantification of plant pathogens in host tissues (Guo et al. 2006; Qi and
Yang 2002).
Evaluation of host disease resistance was often based on lesion diameter measurement or
on the proportion of inoculated leaves exhibiting spreading necrosis (Nandi et al. 2003). Direct
assessment of fungal development on inoculated leaves might be an alternative to those
techniques and provide more robust results. With the advent of real-time quantitative polymerase
chain reaction, researchers possess the unprecedented ability to accurately quantify a specific
pathogen within a host plant. By comparing the amplification pattern of an unknown sample
against that of known standards, the quantity of target DNA in the unknown sample can be
accurately determined (Heid et al. 1996). Strausbaugh et al. (2005) found significant correlations
between percent infected root area and Fusarium DNA quantities in F. culmorum-inoculated
plants. Gachon and Saindrenan (2004) developed a real-time PCR-based assay to follow disease

24
progression on Arabidopsis plants infected with the fungi Alternaria brassicicola and Botrytis
cinerea. It was based on the relative quantification of plant and fungal DNA in infected tissues
by performing two real-time PCR reactions targeted at fungal and plant sequences on inoculated
samples. The study allowed quantitative monitoring of the growth of the fungi A. brassicicola
and B. cinerea. This method was very robust and was able to differentiate between lines
displaying slightly different levels of resistance. Similarly, a better and more sensitive real time
PCR based method was developed by Hogg et al. (2007) to replace the traditional methods for
evaluating Fusarium crown rot (FCR). Disease severity scores (DSS) and Fusarium DNA
quantities were positively correlated for all three cultivars. The traditional methods involved
scoring of mature wheat tillers using a subjective scale that was based on the intensity and
distance brown discoloration extended up the tillers. They were labor intensive, time consuming,
and often varied greatly from evaluator to evaluator.
Ma and Michailides (2004) designed a real-time PCR assay to detect azoxystrobin-
resistant populations of Alternaria from pistachio groves in California, based on a single point
mutation (G143A) in mitochondrial cytochrome b (cyt b) gene in resistant populations. Real-time
PCR based pathogen quantification showed a very good correlation to visual methods of disease
assessment in many fungal diseases of wheat (Guo et al. 2007; Fraaije 2001).
2.7 Proteomics
2.7.1 Introduction and Advantages
Plant pathogenic fungi cause significant yield losses in crops worldwide and millions of
dollars are invested in fungicides in the U.S. every year to control plant diseases. Understanding
molecular mechanisms underlying the interaction of fungi with their host plants and virulence
mechanisms are essential to devise effective disease management strategies. The availability of
25
fast and efficient DNA sequencing technologies has led to a genomics era with whole genome
sequencing of many plant pathogenic fungi. Once the genome sequences became available,
several reverse genetics approaches, such as targeted gene disruption/replacement (knock-out)
(Schumacher et al. 2008), gene silencing (knock-down) (Ajiro et al. 2010), insertional
mutagenesis (Chi et al. 2009), or targeting induced local lesions in genomes (TILLING) (Lamour
et al. 2006) were developed as part of functional genomics research. Transcriptomics, the global
analysis of gene expression at the mRNA level has also become an attractive method for
analyzing the molecular basis of fungal-plant interactions and pathogenesis (Bhadauria et al.
2007; Oh et al. 2008; Takahara et al. 2009; Wise et al. 2007), and includes differential display
(DD) (Venkatesh et al. 2005), cDNA-Amplified Fragment Length Polymorphism (cDNA-
AFLP) (Wang et al. 2009b), suppression subtractive hybridization (SSH) (Fekete et al. 2009),
serial analysis of gene expression (SAGE) (Venu et al. 2007), expressed sequence tags (ESTs)
(Yin et al. 2009), and DNA microarrays (Venu et al. 2007), or RNA-Seq (RNA sequencing)
using next generation sequencing technologies (Wang et al. 2009a). However mRNA expression
based studies have some limitations: (i) highly expressed mRNAs do not necessarily correlate
with protein expression (Gygi et al. 1999, Tsai-Morris et al. 2004) (ii) spliced variants of genes
are known to code for different types of proteins (Blencowe and Khanna 2007, Cheah et al.
2007), and (iii) post-translational modifications (PTMs) of a single protein may lead to multiple
functions (Davison 2002, de la Cadena et al. 2007). All these limitations can be overcome by a
complementary proteomics approach.
The term proteomics was coined by Marc Wilkins to simply refer to “PROTEin
complement of a genOME” (Wilkins et al. 1995). In the broadest sense, the proteome can be
defined as being the total set of protein species present in a biological unit (organelle, cell, tissue,

26
organ, individual, species, and ecosystem) at any developmental stage and under specific
environmental conditions. Proteomics helps us understand how, where, and when the several
hundred thousands of individual protein species are produced in a living organism, and how they
interact with one another. Proteomics can include several areas such as (i) descriptive
proteomics, including intracellular and subcellular proteomics, (ii) differential expression
proteomics, (iii) post-translational modifications, (iv) interactomics, (v) proteinomics (targeted or
hypothesis-driven proteomics), and (vi) secretomics (fungal effectors and virulence factors)
(González-Fernández et al. 2010).
2.7.2 2-Dimensional Electrophoresis
The original two-dimensional electrophoresis (2-DE) based proteomics technique,
developed in the 1970s (O’Farrell 1975), suffered from problems of poor resolution and
reproducibility. The development of immobilized pH gradient (IPG) strips, technical
advancement in improving quality and reproducibility of 2-DE gels, non-gel based high-
throughput separation of proteins using liquid chromatography (LC), and mass spectrometry
(MS) have led to accelerated use of proteomics in various scientific disciplines including plant
biology (Chen and Harmon 2006; Domon and Aebersold 2006). 2-DE involves separation of
proteins in the first dimension according to their isoelectric point (pI), by isoelectric focusing,
and in the second dimension, according to their molecular weight (MW), by sodium dodecyl
sulfate polyacrylamide gel electrophoresis (SDS-PAGE) (Görg et al. 2004). 2-DE gels can
resolve thousands of protein spots and provide information about MW, pI, quantity and post-
translational modifications (Görg et al. 2004, Whittmann-Liebold et al. 2006).
27
2.7.3 Different Staining Techniques
Protein spots separated on 2-DE gels can be visualized by several staining techniques
with varying sensitivities that include Coomassie Brilliant Blue (CBB), silver, and fluorescent
SYPRO® dyes (Miller et al. 2006). Under acidic conditions, CBB sticks to the amino groups of
proteins by electrostatic and hydrophobic interactions (Westermeier and Marouga 2005). CBB
R-250 has very low sensitivity requiring 100-500 ng of protein per spot for detection (Candiano
et al. 2004). However, by using colloidal Coomassie G-250, the detection limit up to 1 ng per
spot can be achieved (Candino et al. 2004) and G-250 staining is also compatible with
downstream MS applications. Silver stain is very sensitive with detection limits up to 0.1 ng per
spot but it interferes with downstream MS applications (Syrovy and Hodny 1991). Jin et al.
(2008) developed a modified silver staining method that is compatible with MS. Fluorescent
dyes show very wide dynamic ranges, over four orders of magnitude. Among SYPRO®
dyes
(Orange, Red, Tangerine and Ruby) SYPRO®
Ruby has very high sensitivity with detection limit
less than 1 ng per spot (Berggren et al. 2002). Deep PurpleTM
dye containing fluorophore
“epicocconone” can detect a few hundred picograms of proteins (Mackintosh et al. 2003).
Fluorescent dyes offer high sensitivity of detection with reliable quantification over a wide linear
dynamic range. However, the high cost of dyes and requirement of specialized scanners to
document gel images limit the use of fluorescent dyes in many proteomics studies. In addition to
staining all the proteins in the gel, glycosylated proteins can be stained specifically with Pro-Q®
Emerald dye (Hart et al. 2003) and phosphorylated proteins with Pro-Q® Diamond dye
(Steinberg et al. 2003). However, all these staining techniques only allow visualization on the
gels, but if the objective is to find differentially up- or down-regulated proteins between different
treatments, the gel-to-gel variation of biological and technical repeats poses a problem in
28
accurate quantification of protein expression. To solve this problem, difference gel
electrophoresis (DIGE) was developed by Unlu et al. (1997), which employs the use of size and
charge matched cyanine dyes (CyDyeTM
DIGE flours Cy3, Cy2, and Cy5) with different
excitation and emission wavelengths as proteins labels for different samples. DIGE allows
multiplexing of samples and use of an internal standard, which is created by using one of the
labels (Cy2) for a pooled mixture of all samples in a given experiment (Westermeier and
Marouga 2005). Thus, the DIGE method gives highly accurate qualitative and quantitative
results, because of elimination of gel-to-gel variation.
2.7.4 Application of Proteomics to Study Plant Pathogenic Fungi
Fernandez-Acero et al. (2006) used two-dimensional electrophoresis coupled with MS
to generate a partial proteome map for Botrytis cinerea and detected 400 spots in Coomassie-
stained 2-DE gels. Out of 60 spots subjected to MS analysis, twenty-two spots were identified
using matrix assisted laser desorption/ionization time of flight (MALDI-TOF) or electrospray
ionization ion trap tandem mass spectrometry (ESI IT MS/MS), with some proteins
corresponding to variants of malate dehydrogenase, glyceraldehyde-3-phosphate dehydrogenase,
and cyclophilin. Comparative proteome analysis of two B. cinerea strains with different
virulence and toxin production characteristics also revealed the presence of qualitative and
quantitative differences in the 2-DE protein profile (Fernandez-Acero et al. 2007). Yajima and
Kav (2006) identified 18 secreted proteins and 95 mycelial proteins in Sclerotinia sclerotiorum
using 2-DE and MS/MS and found many cell wall-degrading enzymes in the secreted proteins
that were previously identified as pathogenicity or virulence factors of S. sclerotiorum. One-
dimensional electrophoresis and 2-DE was also used by Xu et al. (2007) to analyze the protein
profile of six isolates of Curvularia lunata, a pathogen of maize, and correlation was observed

29
between the band or spot pattern and virulence. Out of 423 spots resolved by 2-DE, 29 spots
were isolate-specific and 39 showed quantitative differences. Sulc et al. (2009) built a mass
spectral database with twenty-four Aspergillus strains by profiling spores followed by MALDI-
TOF MS. These mass fingerprints generated by MS can be used for genotyping and
characterizing different Aspergillus strains and also finding new biomarkers in host-pathogen
interactions. Biotrophic fungi such as downy mildews (Oomycota), powdery mildews
(Ascomycota), and rust fungi (Basidiomycota) are some of the most destructive plant pathogens
and in vitro studies of these biotrophs is difficult as they cannot survive outside of their host.
Godfrey et al. (2009) reported a technique to isolate the fungal haustoria from barley plants,
infected with Blumeria graminis f.sp. hordei (Bgh), the powdery mildew pathogen, and analyzed
haustorial proteins using liquid chromatography tandem mass spectrometry (LC-MS/MS). The
resulting MS/MS data were searched against the Bgh EST sequence database and the NCBInr
fungal protein database. They identified 204 haustorial proteins. Apart from whole cell
proteomes, subcellular proteomes such as mitochondrial proteins of Trichoderma harzianum
were studied by Grinyer et al. (2004). A reference proteome map of the dimorphic maize
pathogen, Ustilago maydis, was developed by Böhmer et al. (2007) using 2-DE coupled with
MALDI-TOF MS and ESI-MS/MS. In its haploid phase, this fungus is unicellular and multiplies
vegetatively by budding. It then undergoes a dimorphic transition to infective filamentous
growth. They observed 13 protein spots accumulated in high abundance in the filamentous form
as compared to the budding form.
Cooper et al. (2007) used multidimensional protein identification technology to survey
proteins in germinating asexual urediniospores of the bean rust pathogen, Uromyces
appendiculatus, and compared the data to proteins discovered in an inactive spore. There were
30
few changes in amounts of accumulated proteins involved in glycolysis, acetyl Co-A
metabolism, citric acid cycle, ATP-coupled proton transport, or gluconeogenesis. Germlings
contained a greater amount of proteins involved in mitochondrial ADP:ATP translocation
(indicative of increased energy production) and more histone proteins, pointing to the
reorganization of the nuclei that occurs after germination prior to appresorium formation. These
changes are indicative of metabolic transition from dormancy to germination and are supported
by cytological and developmental models of germling growth. Noir et al. (2009) used 2-DE and
MALDI TOF MS to generate an annotated proteome map of nongerminated conidiospores of the
ascomycete barley powdery mildew pathogen, Blumeria graminis f.sp. hordei, in which they
identified 123 distinct fungal gene products. Most of the identified proteins have a predicted
function in carbohydrate, lipid or protein metabolism, indicating that the spore is equipped for
the catabolism of storage compounds as well as for protein biosynthesis and folding on
germination. Luster et al. (2010) applied 2-DE and MS to identify predominantly soluble
proteins present during the germination phase of Phakopsora pachyrhizi urediniospores that are
involved in early infection and interaction with host legumes. They identified 117 fungal proteins
with demonstrated roles in cell biosynthesis, metabolism, regulatory, signaling, stress responses
and infection.
2.7.5 Application of Proteomics to Study Secreted Proteins from Plant Pathogenic Fungi
The combination of native secreted proteins and the cell machinery involved in their
secretion is defined as the “secretome” (Tjalsma et al. 2000). Many plant pathogenic fungi
secrete a large number of degradative enzymes and other proteins, which have diverse functions
in colonization, nutrient acquisition, and ecological interactions (de Vries 2003; Freimoser et al.
2003; Walton 1994). Many extracellular enzymes such as polygalacturonase, pectate lyase,

31
xylanase, and lipase, were shown or proposed to be required for virulence in plant pathogenic
fungi (Brito et al. 2006; Deising et al. 1992; Isshiki et al. 2001; Oeser et al. 2002; ten Have et al.
1998; Voigt et al. 2005; Yakoby et al. 2001).
The ability of Aspergillus flavus and A. parasiticus to degrade the flavonoid, rutin
(quercetin 3-O-glycoside), secondary metabolite produced by plants in response to invading
microorganisms, was studied by Medina et al. (2004). The secreted proteins were analyzed by 2-
DE and MALDI-TOF MS and 15 rutin-induced proteins and 7 non-induced proteins and
glycosidases were identified. In the second study, the growth media including glucose and potato
dextrose broth were used to identify differentially expressed secreted proteins by 1- and 2-DE
and MS/MS (Medina et al. 2005). Among identified proteins, ten were unique to rutin-, five to
glucose-, and one to potato dextrose-grown A. flavus and sixteen proteins were common to all
three media. An investigation of the exoproteome of Fusarium graminearum, found a greater
quantity and diversity of proteins when the fungus was grown on hop cell wall than when grown
on glucose (Phalip et al. 2005). Using 1- and 2-DE followed by LC-MS/MS, they identified 84
proteins unique to cell-wall grown fungal exoproteome and most were enzymes involved in
carbohydrate metabolism, including cellobiohydrolase, which can act as a sensor of the extra
cellular environment. These results indicated that fungal metabolism becomes oriented towards
the synthesis and secretion of an arsenal of enzymes able to digest almost the complete plant cell
wall.
Lim et al. (2001) extracted and separated 220 cell envelope associated proteins from
Trichoderma reesei mycelia with great variation in quantities secreted. The most abundant
protein identified in both conditions was HEX1, the major woronin body protein, which is
unique to fungal mycelia. The extracellular proteome secreted by T. harzianum in the presence of
32
fungal cell walls (Pythium ultimatum, B. cinerea, R. solani) and chitin as a nutrient source was
studied by Suarez et al. (2005). They found abundant expression of aspartic protease (P6281)
under all conditions, which showed homology to polyporopesin from the basidiomycete Irpex
lacteus, and they speculated upon the putative role of protease P6281 in mycoparasitism. Tseng
et al. (2008) studied the biocontrol mechanism of T. harzianum in response to R. solani by
analyzing the secretome. Seven cell-wall degrading enzymes, chitinase, cellulase, xylanase, β-
1,3-glucanase, β-1,6-glucanase, mannanase, and protease, were revealed by activity assay, in-gel
activity stain, 2-DE, and LC-MS/MS analysis, and the production of these enzymes increased in
response to R. solani. Meijer et al. (2006) studied cell wall associated proteins of the oomycete,
Phytophthora ramorum, the causal agent of sudden oak death. Based on LC-MS/MS, they
identified 17 secreted proteins with homology to mucin or mucin-like proteins, putative
glycoside hydrolases, transgluataminases, annexin-like protein and kazal-type protease inhibitor.
Yajima and Kav (2006) studied the secreted proteins from Sclerotinia sclerotiorum and
identified 18 secreted proteins by MS/MS, which include mainly cell wall degrading enzymes
that were previously identified as pathogenicity or virulence factors of S. sclerotiorum. This
study also identified an alpha-L-arabinofuranosidase, which was not present in earlier
comprehensive EST studies (Li et al. 2004; Sexton et al. 2006). Liang et al. (2010) studied the
proteins present in the liquid sclerotial exudates of S. sclerotiorum using 1- and 2-DE followed
by LC-MS/MS and identified 56 proteins that included five glucanases, GPI anchor protein,
glucoamylase, arabinifuranosidase, tyrosinase etc.
Paper et al. (2007) used high-throughput MS/MS to identify secreted proteins of F.
graminearum in vitro (grown on 13 different media) and in planta (infection of wheat heads). A
total of 289 proteins (229 in vitro and 120 in planta) were identified with high statistical

33
confidence. They identified 49 unique proteins in planta, which were absent in in vitro
conditions. Compared to in planta proteins (56%), the majority of in vitro proteins had predicted
signal peptides. Some of the non-secreted proteins found in planta included single-copy
housekeeping enzymes such as enolase, triose phosphate isomerase, phosphoglucomutase,
calmodulin, aconitase, and malate dehydrogenase, which indicated the occurrence of significant
fungal lysis during pathogenesis. Several of the proteins lacking signal peptides that were found
in planta have been reported to be potent immunogens secreted by animal pathogenic fungi,
indicating their importance in interactions between F. graminearum and its host plants. A
comprehensive proteomic-level comparison of Pyrenophora tritici-repentis avirulent race 4 and
virulent race 5 by 2-DE followed by MS/MS, identified 29 differentially abundant proteins in the
secretome and included the secreted enzymes α-mannosidase and exo-β-1,3-glucanase, heat-
shock and BiP (binding imunoglobulin protein) proteins, and various metabolic enzymes (Cao et
al. 2009). The proteome-level differences suggested that reduced pathogenic ability in race 4 of
P. tritici-repentis may reflect its adaptation to a saprophytic habit.
Several studies examined the secretome of Botrytis cinerea, an important necrotrophic
pathogen of nursery plants, vegetables, ornamental, field, orchard crops, as well as stored and
transported agricultural products, causing significant economic losses. Shah et al. (2009a) used
1-DE and LC-MS/MS to identify 89 secreted proteins from B. cinerea grown on a solid substrate
of a cellophane membrane appressed to the nutrient medium, which was supplemented with an
extract from full red tomato, ripened strawberry or Arabidopsis leaf extract. Sixty proteins were
predicted to contain signal motif indicating extracellular localization. Botrytis cinerea increased
secreted protein production in the presence of favorable food sources such as full red tomato and
ripe strawberry extract compared to Arabidopsis leaf extract. The identified secreted proteins

34
include transport proteins, proteins involved in carbohydrate metabolism, peptidases, and
pathogenicity factors that provide important insight into how B. cinerea may use secreted
proteins for infection and colonization of hosts. Shah et al. (2009b) also identified 126 proteins
secreted by B. cinerea by growing the fungus on highly or partially esterified pectin, or on
sucrose in liquid culture. They identified 13 proteins related to pectin degradation in both pectin
growth conditions indicating that it is unlikely that the activation of B. cinerea from the dormant
state to active infection is solely dependent on the changes in degree of esterification of the
pectin component of the plant cell wall. Fernandez-Acero et al. (2010) studied the secretion of
discrete sets of proteins by B. cinerea grown on culture media supplemented with different
carbon sources [glucose, carboxymethylcellulose (CMC), starch, pectin] and plant-based elicitors
[tomato cell walls (TCW)]. A total of 78 spots were identified by MALDI-TOF/TOF MS/MS
analysis, corresponding to 56 unique proteins and 45 identified proteins contained secretion
signal peptides for both classical and nonclassical secretory pathways. The use of different
carbon sources and plant-based elicitors resulted in different degrees of complexity of fungal
response, moving from a state of constitutive fungal growth and a simple secretome (by using
glucose as a nutrient) toward a more complex and possibly pathogenic secretory behavior
(induced by TCW). The corresponding 2-DE profiles showed an increasing number and variety
of spots when CMC or TCW were used. Some of the identified proteins are involved in the
pathogenicity process (e.g. pectin methylesterases, xylanases, and proteases). Espino et al.
(2010) studied the early secreted proteome of B. cinerea grown in conditions that resemble the
plant environment (a synthetic medium enriched with low molecular weight plant compounds, in
a dialysis bag that contained 50% tomato, strawberry, or kiwifruit extracts) by collecting proteins
secreted during first 16 hours of conidial germination. Using 2-DE coupled with MALDI TOF
35
and 1-DE coupled with LC-MS/MS, they identified a total of 121 proteins. One interesting
conclusion from this study was that the secreted proteome did not differ significantly during the
first 16 h of growth by B. cinerea on media with and without plant extracts. Proteasomes
dominated the early secretome indicating their role in degradation of plant cell wall proteins to
promote fungal hyphal penetration and to suppress plant defense proteins to increase the chances
for a successful infection. The first most abundant proteins secreted and detected in all
conditions was the BcAP8 (asparatic protease) followed by BcPG1 (endopolygalacturonase),
which is also shown to be required for B. cinerea virulence (Espino et al. 2010).
36
CHAPTER 3: LATENT INFECTION BY CERCOSPORA KIKUCHII,
CAUSAL AGENT OF CERCOSPORA LEAF BLIGHT IN SOYBEAN
3.1 Introduction
Cercospora kikuchii (T. Matsumoto & Tomoy.) M.W. Gardner is the causal agent of
Cercospora leaf blight (CLB) and purple seed stain (PSS) of soybean (Orth and Schuh 1994).
This pathogen can affect all aerial parts of the plant including leaves, petioles, stems, pods, and
seeds (Matsumoto and Tomoyasu 1925; Suzuki 1921; Walters 1980). PSS is widely distributed
in all soybean growing regions of the world and primarily affects seed germination leading to
reduced stands and poor seed quality (Lehman 1950; Wilcox and Abney 1973). Until recently,
CLB was a minor disease in the southern U.S., but it has become a serious concern to soybean
producers in recent years (Moore and Wolcott 2000). CLB has been reported in other major
soybean producing states such as Iowa. The disease is capable of causing substantial yield
losses, and it is associated with a disorder known as green stem in which stems remain green
while pods and seeds are mature (Hartman et al. 1999; Leonard et al. 2011; Schneider et al.
2003; Wrather et al. 1997, 2001).
Several attempts have been made to identify soybean cultivars with resistance to CLB.
Moderate levels of resistance were found in some soybean lines, but there was no relationship
between resistance to CLB and PSS in that soybean cultivars resistant to CLB were susceptible
to PSS and vice versa (Orth and Schuh 1994; Walters 1980). Development of CLB symptoms
depends upon environmental conditions. Warm and humid conditions favor the spread of
disease, especially at the end of the growing season, while hot dry conditions at the end of the
season lead to severe blight symptoms (Raymond Schneider, Personal communication). Some
growers have resorted to early planting to avoid favorable conditions for development of CLB
37
later in the season because most commercial cultivars lack complete resistance to C. kikuchii
(Moore and Boquet 2008; Schneider et al. 2003). In addition, the pathogen is extremely diverse,
and there are significant location and time interactions with respect to susceptibility (Cai and
Schneider 2005, 2008; Cai et al. 2009).
Another viable alternative to the use of resistant cultivars or early planting for CLB
management is fungicide applications. However, the successful use of this strategy requires early
detection of the pathogen as demonstrated for sheath blight in rice (Sayler and Yang 2007).
Earlier studies showed that C. kikuchii and many other fungi often cause latent infections in
soybeans (Hartman et al. 1999; Sinclair 1991). As a result disease symptoms, such as chlorosis
and necrosis, only become visible long after initial infection and usually at late growth stages
when plants are under stress or there is a sudden change in nutritional or environmental
conditions (Cerkauskas and Sinclair 1980; Hartman et al. 1999). Fungicide applications at these
late growth stages are usually ineffective (Robertson et al. 2011). However, traditional methods
involving bioassays, histological and serological assays to detect latent infections in soybeans are
often time consuming and not sensitive. Without knowing when infection occurs, producers do
not know when to initiate fungicide applications.
The advent of traditional polymerase chain reaction (PCR), made it possible to detect
plant pathogens based on primers designed for a specific part of their genomic sequence.
However, traditional PCR involves separation of reaction products on an agarose gel for
visualization and qualitative analysis, which are not suitable for automation when there is a need
to screen a large number of samples. The development of high throughput real-time PCR
technology, which uses primers and a fluorogenic probe to amplify a specific target sequence,
allows monitoring the PCR amplification process in real time and the quantification of target
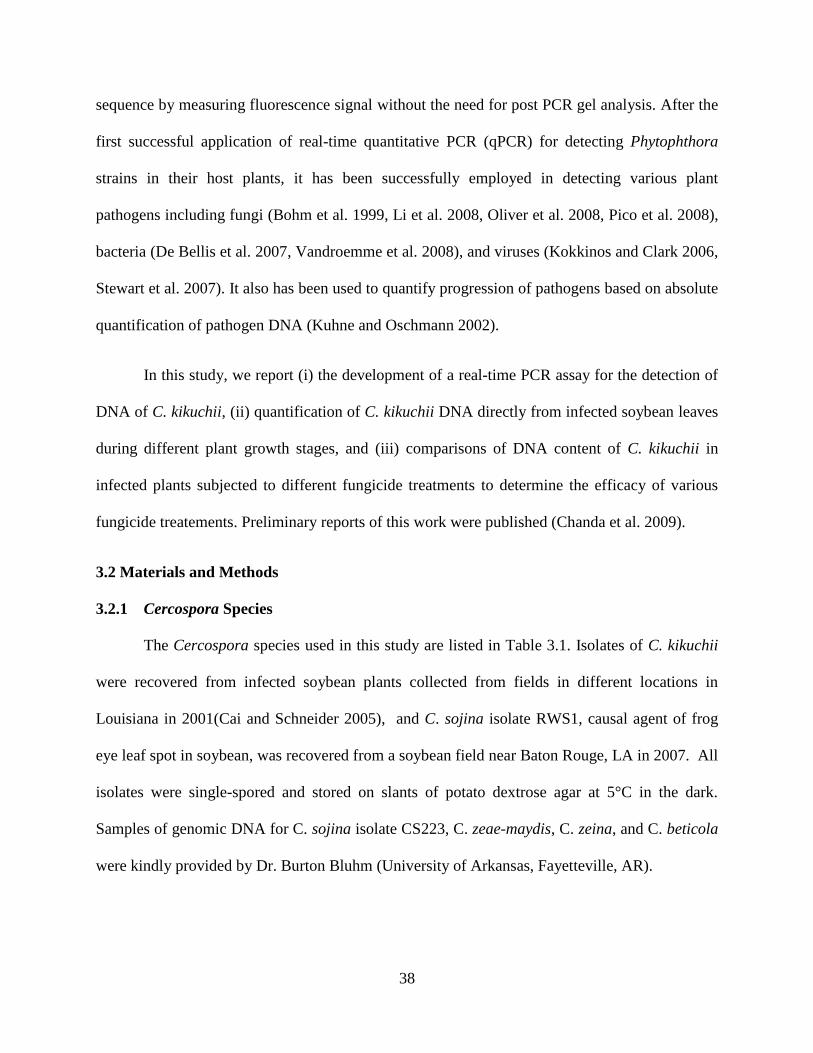
38
sequence by measuring fluorescence signal without the need for post PCR gel analysis. After the
first successful application of real-time quantitative PCR (qPCR) for detecting Phytophthora
strains in their host plants, it has been successfully employed in detecting various plant
pathogens including fungi (Bohm et al. 1999, Li et al. 2008, Oliver et al. 2008, Pico et al. 2008),
bacteria (De Bellis et al. 2007, Vandroemme et al. 2008), and viruses (Kokkinos and Clark 2006,
Stewart et al. 2007). It also has been used to quantify progression of pathogens based on absolute
quantification of pathogen DNA (Kuhne and Oschmann 2002).
In this study, we report (i) the development of a real-time PCR assay for the detection of
DNA of C. kikuchii, (ii) quantification of C. kikuchii DNA directly from infected soybean leaves
during different plant growth stages, and (iii) comparisons of DNA content of C. kikuchii in
infected plants subjected to different fungicide treatments to determine the efficacy of various
fungicide treatements. Preliminary reports of this work were published (Chanda et al. 2009).
3.2 Materials and Methods
3.2.1 Cercospora Species
The Cercospora species used in this study are listed in Table 3.1. Isolates of C. kikuchii
were recovered from infected soybean plants collected from fields in different locations in
Louisiana in 2001(Cai and Schneider 2005), and C. sojina isolate RWS1, causal agent of frog
eye leaf spot in soybean, was recovered from a soybean field near Baton Rouge, LA in 2007. All
isolates were single-spored and stored on slants of potato dextrose agar at 5°C in the dark.
Samples of genomic DNA for C. sojina isolate CS223, C. zeae-maydis, C. zeina, and C. beticola
were kindly provided by Dr. Burton Bluhm (University of Arkansas, Fayetteville, AR).

39
Table 3.1. Cercospora species tested for the specificity of the real-time PCR primers and probe
developed in this study.
y, See reference Cai and Schneider (2005)
z, Yes indicates significant amplification in real-time PCR and No indicates no amplification
3.2.2 Development of Specific Real-time PCR Primers and Probe for C. kikuchii
Because of limited genome sequence information available for C. kikuchii, 14 sets of
PCR primers (Table 3.2) specific for eight cercosporin toxin biosynthesis (CTB) pathway genes
and four adjacent open reading frames (ORFs) in C. nicotianae were designed based upon
known sequences (Chen et al. 2007b). These primers were used to amplify their corresponding
genes and ORFs from C. kikuchii. PCR was performed on genomic DNAs from C. kikuchii and
C. sojina. The CNCTB6 primer pair, which targeted the NADPH-dependent oxidoreductase gene
(CTB6) from C. nicotianae (GenBank accession DQ991508), produced a specific amplification
product from C. kikuchii but not from C. sojina. The PCR fragment amplified from C. kikuchii
was confirmed to be the CTB6 gene by direct sequencing (data not shown). The real-time PCR
primers (CKCTB6-2F: 5'-CACCATGCTAGATGTGACGACA-3', CKCTB6-2R: 5'-
GGTCCTGGAGGCAGCCA-3') and the fluorescent probe (CKCTB6-PRB: 5'-FAM-
CTCGTCGCACAGTCCCGCTTCG-TAMRA-3'), which was specific to the C. kikuchii CTB6
gene, were designed using Primer Express 2.0 (Applied Biosystems, Foster City, CA) based on
Cercospora
Species
Isolate Host Source Detectionz
C. kikuchii MRL 6020-2By Soybean Leaf Yes
C. kikuchii DLL 6013-1By Soybean Leaf Yes
C. kikuchii DLL 50908-1By Soybean Leaf Yes
C. kikuchii MRS 6020-2By Soybean Seed Yes
C. kikuchii MRS 5012-1Ay Soybean Seed Yes
C. sojina RWS1 Soybean Leaf No
C. sojina CS223 Soybean Leaf No
C. zeae-maydis SCOH1-5 Maize Leaf No
C. zeina DYPA Maize Leaf No
C. beticola S1 Sugarbeet Leaf No
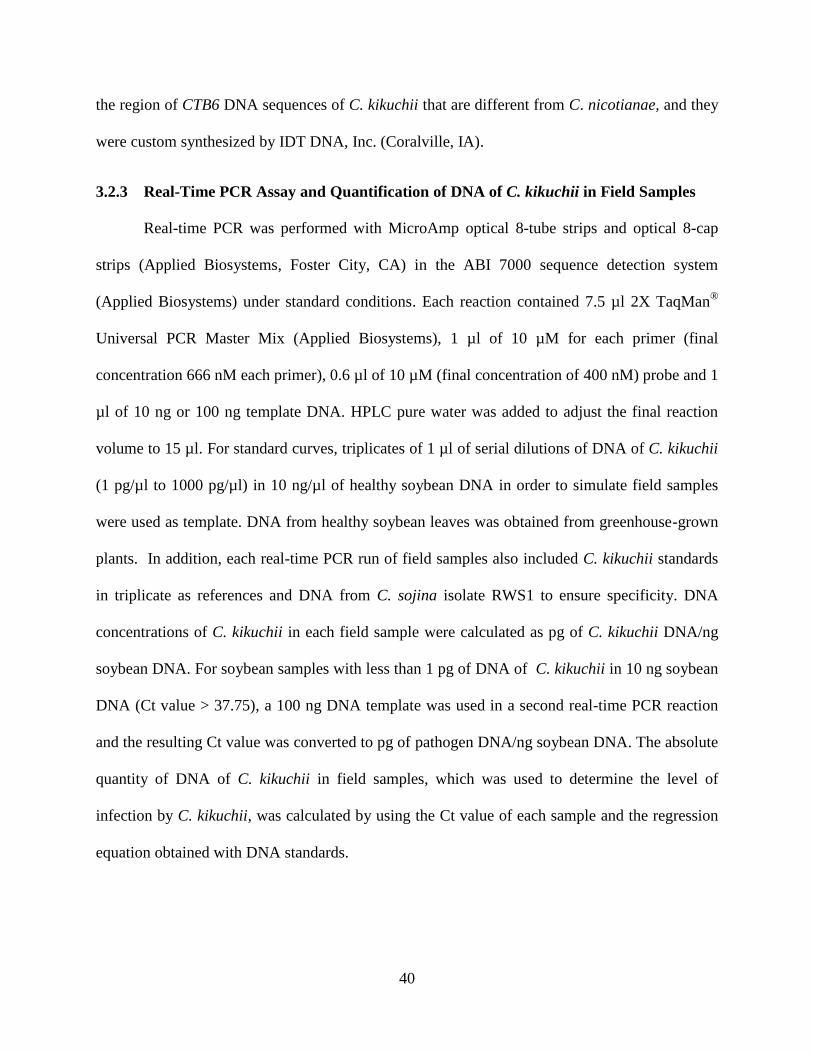
40
the region of CTB6 DNA sequences of C. kikuchii that are different from C. nicotianae, and they
were custom synthesized by IDT DNA, Inc. (Coralville, IA).
3.2.3 Real-Time PCR Assay and Quantification of DNA of C. kikuchii in Field Samples
Real-time PCR was performed with MicroAmp optical 8-tube strips and optical 8-cap
strips (Applied Biosystems, Foster City, CA) in the ABI 7000 sequence detection system
(Applied Biosystems) under standard conditions. Each reaction contained 7.5 µl 2X TaqMan®
Universal PCR Master Mix (Applied Biosystems), 1 µl of 10 µM for each primer (final
concentration 666 nM each primer), 0.6 µl of 10 µM (final concentration of 400 nM) probe and 1
µl of 10 ng or 100 ng template DNA. HPLC pure water was added to adjust the final reaction
volume to 15 µl. For standard curves, triplicates of 1 µl of serial dilutions of DNA of C. kikuchii
(1 pg/µl to 1000 pg/µl) in 10 ng/µl of healthy soybean DNA in order to simulate field samples
were used as template. DNA from healthy soybean leaves was obtained from greenhouse-grown
plants. In addition, each real-time PCR run of field samples also included C. kikuchii standards
in triplicate as references and DNA from C. sojina isolate RWS1 to ensure specificity. DNA
concentrations of C. kikuchii in each field sample were calculated as pg of C. kikuchii DNA/ng
soybean DNA. For soybean samples with less than 1 pg of DNA of C. kikuchii in 10 ng soybean
DNA (Ct value > 37.75), a 100 ng DNA template was used in a second real-time PCR reaction
and the resulting Ct value was converted to pg of pathogen DNA/ng soybean DNA. The absolute
quantity of DNA of C. kikuchii in field samples, which was used to determine the level of
infection by C. kikuchii, was calculated by using the Ct value of each sample and the regression
equation obtained with DNA standards.

41
Table 3.2. Primer pairs, based upon the CTB gene cluster in Cercospora nicotianae, used for amplification in Cercospora kikuchii.
Primer name Forward sequence (5' - 3') Reverse sequence (5' - 3')
Target gene from C.
nicotianae (GenBank
accession number)
CNCTB1A CAGCGAGCAACAAGAAGAGAC AGCGAACGCCATCAAATGC CTB1 (AY649543)
CNCTB1B CAGCGAGCAACAAGAAGAGAC GACCAGAGGCAGCAAGGATA CTB1 (AY649543)
CNCTB1C GCCCACAAGTAAACAGCCAC TGAGCAGAACACGACGCTT CTB1 (AY649543)
CNCTB1D CAGACCTTTGCGTCCATCAAT ATGCTCGCTCTCCACAACT CTB1 (AY649543)
CNCTB2 AGCCCGTAGCATCACTGTT CCGTTGACACCATTAGCCTG CTB2 (DQ991505)
CNCTB3 ACAACTGCGATGCTCAAACTC ATCCTCTTGCTGCCAACCTC CTB3 (DQ355149)
CNCTB4 TCGTGACTGCTTGACTGGAG TTCATCGGGCTCAGCATCA CTB4 (DQ991506)
CNCTB5 AGCCTGGGCAAGAACTCAGT ACCACTCACGCTCCATCTCA CTB5 (DQ991507)
CNCTB6 ATACTTCTTCCTACGCCGTCG TTTGACAACCCGCTCTTGC CTB6 (DQ991508)
CNCTB7 CCCAAGCAGTGTGAACATCA CATCAATCCAGCCCACCAAA CTB7 (DQ991509)
CNCTB8 TGCGTGAAGGAACATCGTTTG TGGGTAGCACATCAGAAGGC CTB8 (DQ991510)
CNORF9 CGATAGTCGCCTGGTTGGAA ACCTTGCTACAATCCACTCCC ORF9 (DQ993249)
CNORF10 GAGTGGGCATACATCAGCAG TTACGCCTACCTCGCTTCTC ORF10 (DQ993250)
CNORF11 CCTTGGGTAGAAAGTTGCGAG TGCTTCGTCCGTCTTTACCA ORF11(DQ993251)
CNORF12 CGATACGAGCGACCTCAGTT TGCCATTACAGCGTGTCCA ORF12 (DQ993252)

42
3.2.4 Plant Materials, Sampling Details, and Fungicide Sprays
Field studies to determine when soybean plants became infected with C. kikuchii using
real-time PCR were conducted in 2007, 2009, and 2010. Field experiments in each year were
arranged in randomized complete blocks. Each treatment in the experiments described in Table
3.3 consisted of three plots (replications) with each plot comprised of four rows on 76 cm centers
by 12 m long. Plants were maintained according to standard practices (Levy et al. 2011). Leaf
samples were collected from plants in each plot for each treatment, i.e., treated with fungicide or
not treated. If plants were sprayed with fungicides on a sampling date, samples were collected
before spraying. Each sample consisted of 30 randomly collected uppermost fully developed
leaves from the middle two rows in each plot. Uppermost leaves were used because CLB
symptoms first appear on upper leaves that are exposed to sun light (Hartman et al. 1999). Leaf
samples were frozen in liquid nitrogen and stored at -80°C until further processing.
3.2.5 DNA Extraction
All 30 leaves from each sample were ground to a fine powder in liquid nitrogen with a
pre-chilled mortar and pestle. Three subsamples of 100 mg each were transferred to 2.0 ml
microcentrifuge tubes, and DNA was extracted with a GenEluteTM
Plant Genomic DNA
Miniprep Kit (Sigma-Aldrich, St Louis, MO) according to the manufacturer’s instructions. DNA
of C. kikuchii and C. sojina was extracted with the same kit using 100 mg of lyophilized ground
mycelial powder. Mycelia were collected by filtration from 5-day-old cultures grown in potato
dextrose broth on rotary shakers in the dark. Mycelia were washed three times with sterile
distilled water before being lyophilized, ground with a mortar and pestle and stored at -80°C
until further processing. All DNA samples were diluted to 10 ng/µl based on DNA quantification
by measuring absorbance at 260 nm using a NanoDrop ND-1000 Spectrophotometer (Thermo

43
Table 3.3. Experimental details for field studies related to Cercospora leaf blight of soybean.
Exper
iment
Year Cultivar Planting
date
Growth
stages at
samplinga
Sampling date
(DAP)b
Fungicide
application
(DAP)
Fungicide treatments
(ml/ha ai)c
A 2007 CP 5892 22 May R2 – R6 58, 78, 85, 107 62, 78 pyraclostrobin (322) plus
metconazole (548)
B 2007 DP 5634 22 May R2 – R6 58, 78, 85, 107 62, 78 pyraclostrobin (322) plus
metconazole (548)
C 2007 CP 5892 5 June V8 – R6 44, 64, 71, 93 64 pyraclostrobin (322) plus
metconazole (548)
D 2007 DP 5634 5 June V8 – R6 44, 64, 71, 93 64 pyraclostrobin (322) plus
metconazole (548)
E 2007 CP 5892 27 June V3 – R5 22, 42, 57, 71 42 pyraclostrobin (322) plus
metconazole (548)
F 2007 DP 5634 27 June V3 – R5 22, 42, 57, 71 42 pyraclostrobin (322) plus
metconazole (548)
G 2009 DP 5808RR 15 May V4 – R7 35, 52, 59, 70, 76,
85, 97, 109, 116,
124
48, 55, 74, 90, 103 pyraclostrobin (877)
H 2010 95Y20 26 May V5 – R5 33, 44, 58, 100 30 flutriafol (512)
I 2010 95Y20 26 May V5 – R5 33, 44, 58, 100 30, 51, 77 flutriafol (512)
J 2010 95Y20 26 May V5 – R5 33, 44, 58, 100 30, 51, 77, 99, 113 flutriafol (512) a : See Fehr et al. 1971 for description of different soybean growth stages.
b : DAP: days after planting.
c : Materials were applied in a spray volume of 187 liters/ha, ai = active ingredient

44
Fisher Scientific Inc., Wilmington, DE). The uniformity of diluted genomic DNA was verified
using real-time PCR assays with primers specific for plant 18S rRNA (Zm18s1F: 5’-
GAGAAACGGCTACCACATCCA-3’ and Zm18s1R: 5’-ACGCGCCCGGTATTGTTAT-3’)
and SYBR®
Green dye chemistry on eight randomly chosen leaf samples, all of which yielded
similar threshold cycle (Ct) values with a mean 14.95 ± 0.2 standard deviations.
3.2.6 Cercospora Leaf Blight Disease Severity Ratings
CLB does not lend itself to quantitative estimates of disease severity, e.g. percent leaf
area affected, because symptoms begin as small brick red necrotic lesions on petioles and
progress ultimately to the classic leathery purple discoloration of leaves exposed to direct
sunlight. Therefore, the following semiquantitative scale was used: 1 = no symptoms; 2 = few
symptoms on petioles (up to 10% of petioles that had symptoms); 3 = as above plus up to 5%
affected leaves including leaf veins; 4 = as above plus up to 10% affected leaves; 5 = as above
with about 50% petioles and up to 30% of leaves with symptoms; 6 = up to 100% of petioles
affected but leaves do not have reddish cast and are not chlorotic; 7 = up to 20% of upper leaves
becoming reddened or chlorotic; 8 = moderate chlorosis, reddening and necrosis on up to 50% of
upper leaves; 9 = as above but symptoms are severe plus defoliation. The 1 to 9 scale was
converted to 0 to 100% disease severity for statistical analysis using ANOVA. At least 20 plants
were examined in the center two rows, and a composite value was assigned to each plot. Disease
incidence was 100%.
3.2.7 Data Analysis
Analysis of variance (ANOVA) using the mixed procedure (PROC MIXED) of SAS
(version 9.1, SAS Institute, Cary, NC) was performed on data from the fungicide-sprayed and
non-sprayed plants. Means were compared by Tukey’s Honestly Significant Difference (HSD)

45
at P < 0.05 with Kramer adjustment for unbalanced design (Kramer 1956).
3.3 Results
3.3.1 Developing Real-Time PCR Primers Specific to C. kikuchii
CNCTB6F and CNCTB6R primers (Table 3.2) amplified a 1.14 kb PCR product only in
the presence of genomic DNA from C. kikuchii but not from C. sojina (Fig. 3.1). When field
samples were tested, these primers produced a specific product from soybean leaves either with
CLB symptoms or from purple stained seeds but not from healthy leaves collected from
greenhouse-grown plants (Fig. 3.1). These results indicated that the CTB6 gene can be used to
differentiate between C. kikuchii and C. sojina and that the primers can detect C. kikuchii in
soybean leaves. Homology analysis of the sequenced PCR product (GenBank accession
JF830016, this study) showed that the CTB6 gene shared 97% sequence identity between C.
kikuchii and C. nicotianae (data not shown). The DNA region containing the most sequence
differences between C. kikuchii and C. nicotianae was used to design real-time PCR primers and
probe (Fig. 3.2). The specificity of real-time PCR primers CKCTB6-2F, CKCTB6-2R and
fluorescent probe CKCTB6-PRB was tested by performing real-time PCR with genomic DNA
from C. kikuchii, C. sojina, C. zeae-maydis, C. zeina, C. beticola, greenhouse-grown healthy
soybean leaves (negative control), and the no-template control (NTC). Amplification was
detected only in the presence of C. kikuchii genomic DNA as assessed by changes in
fluorescence intensity. No significant fluorescence was detected in real-time PCR reactions
containing genomic DNA from the other Cercospora species, healthy soybean or NTC.
46
Figure 3.1. CNCTB6F/CNCTB6R primer pair showing specificity to Cercospora kikuchii pure
culture or C. kikuchii infected soybean leaves. Lane 1, C. kikuchii isolate MRL 6020-2B; lane 2,
C. sojina isolate RWS1; lane 3, healthy greenhouse-grown soybean cultivar CP 5892; lane 4,
healthy greenhouse-grown soybean cultivar 1001M; lane 5, greenhouse-grown soybean cultivar
1001M grown from purple stained seed; lanes 6 and 7, naturally infected field grown soybean
cultivar DP 5634 at R5 stage (71 DAP), showing typical CLB symptoms.
Figure 3.2. Partial DNA sequence of CTB6 gene from Cercospora kikuchii (CK). Open boxes
indicate the variable nucleotides between CK and C. nicotianae (CN). Arrows indicate location
of real-time PCR primers (CKCTB6-2F and CKCTB6-2R) and probe (CKCTB6-PRB) used in
real-time PCR detection of C. kikuchii in soybean samples.
47
3.3.2 Standard Curves and Sensitivity of Real-Time PCR Assays
Quantification of serial diluted DNA of C. kikuchii showed a linear relationship (Fig.
3.3A) between the amount of genomic DNA (x) and Ct values (y) (y = -1.434ln(x) + 37.913)
with a R2 value of 0.9984 and a slope of 3.3, indicating nearly 100% amplification efficiency
(Fig. 3.3B). Mean Ct values for C. kikuchii DNA ranged from 27.87 for 1000 pg to 37.75 for 1
pg, which was reliably detected in all samples. Therefore, the lowest detection limit of our assay
for DNA of C. kikuchii was 1 pg in 10 or 100 ng of soybean DNA. The addition of as much as 1
ng of DNA of C. sojina per 10 ng of soybean DNA still produced a negative result (Ct ≥ 40),
which confirmed the high specificity of this assay.
3.3.3 Visual Rating of Disease Severity and Quantification of C. kikuchii DNA in Soybean
Leaf Samples Using Real-Time PCR
For the first and second plantings in the 2007 (Experiments A, B, C and D, Table 3.3),
CLB symptoms were more severe in the non-sprayed DP 5634 plants compared to sprayed plants
(Fig. 3.4A), whereas there was no difference in disease severity between fungicide-sprayed and
non-sprayed CP 5892 plants. No symptoms were observed for leaf samples collected from the
third planting (Experiments E and F, Table 3.3) for either cultivar by the last sampling time (R5
stage).
C. kikuchii DNA was detected in all samples of all three plantings from V3 through R6.
In general, the fungal DNA levels were lower in sprayed lines compared to non-sprayed controls.
In the first planting, the amount of C. kikuchii DNA in soybean leaves collected from non-
sprayed plants from R2 to R4 significantly increased from 0.02 to 1.32 pg and 0.11 to 1.86 pg in
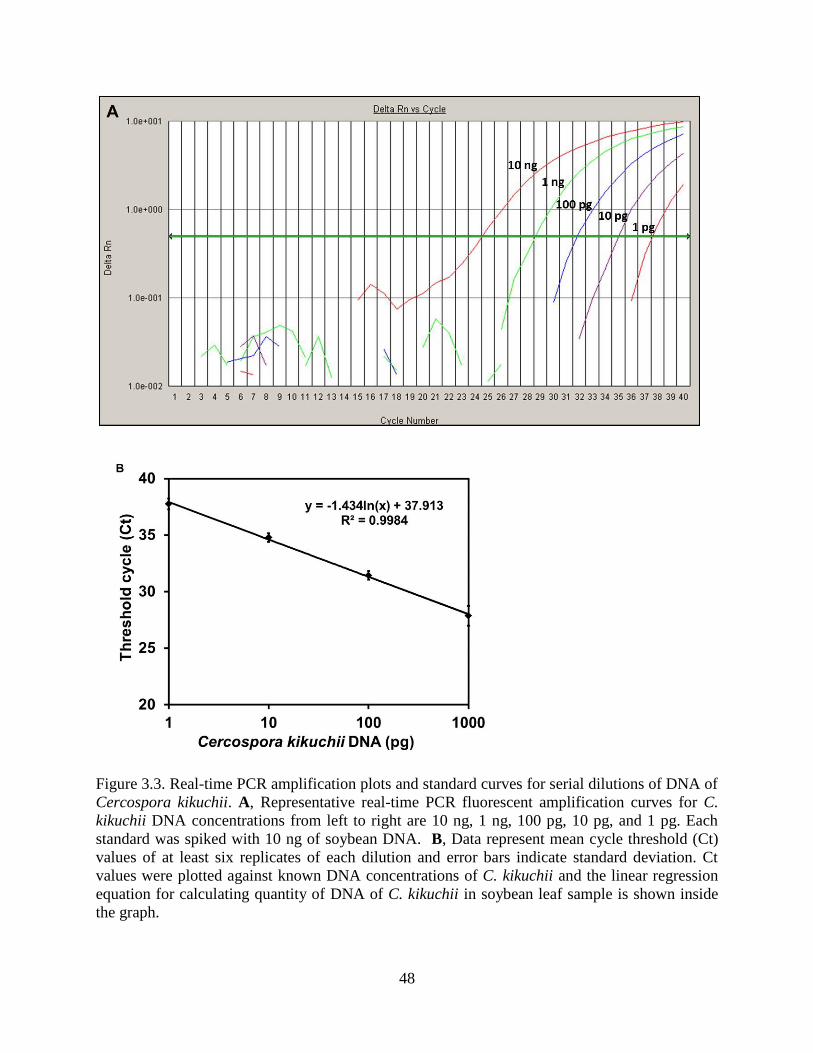
48
Figure 3.3. Real-time PCR amplification plots and standard curves for serial dilutions of DNA of
Cercospora kikuchii. A, Representative real-time PCR fluorescent amplification curves for C.
kikuchii DNA concentrations from left to right are 10 ng, 1 ng, 100 pg, 10 pg, and 1 pg. Each
standard was spiked with 10 ng of soybean DNA. B, Data represent mean cycle threshold (Ct)
values of at least six replicates of each dilution and error bars indicate standard deviation. Ct
values were plotted against known DNA concentrations of C. kikuchii and the linear regression
equation for calculating quantity of DNA of C. kikuchii in soybean leaf sample is shown inside
the graph.
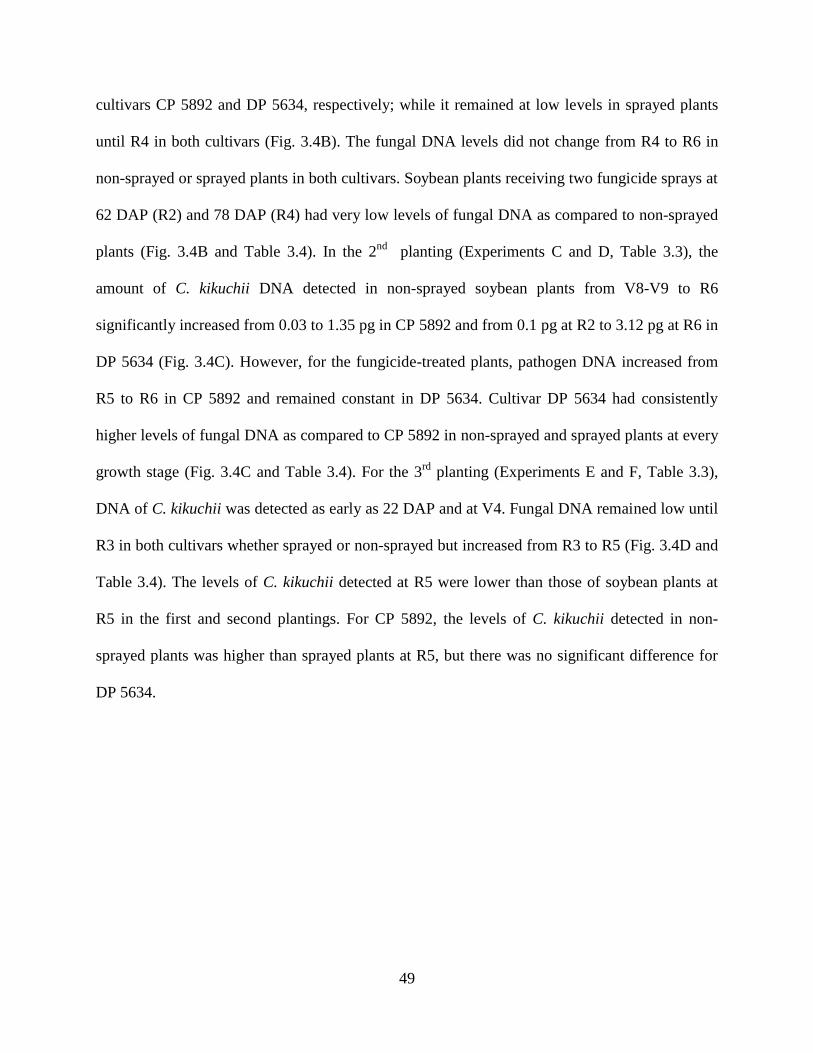
49
cultivars CP 5892 and DP 5634, respectively; while it remained at low levels in sprayed plants
until R4 in both cultivars (Fig. 3.4B). The fungal DNA levels did not change from R4 to R6 in
non-sprayed or sprayed plants in both cultivars. Soybean plants receiving two fungicide sprays at
62 DAP (R2) and 78 DAP (R4) had very low levels of fungal DNA as compared to non-sprayed
plants (Fig. 3.4B and Table 3.4). In the 2nd
planting (Experiments C and D, Table 3.3), the
amount of C. kikuchii DNA detected in non-sprayed soybean plants from V8-V9 to R6
significantly increased from 0.03 to 1.35 pg in CP 5892 and from 0.1 pg at R2 to 3.12 pg at R6 in
DP 5634 (Fig. 3.4C). However, for the fungicide-treated plants, pathogen DNA increased from
R5 to R6 in CP 5892 and remained constant in DP 5634. Cultivar DP 5634 had consistently
higher levels of fungal DNA as compared to CP 5892 in non-sprayed and sprayed plants at every
growth stage (Fig. 3.4C and Table 3.4). For the 3rd
planting (Experiments E and F, Table 3.3),
DNA of C. kikuchii was detected as early as 22 DAP and at V4. Fungal DNA remained low until
R3 in both cultivars whether sprayed or non-sprayed but increased from R3 to R5 (Fig. 3.4D and
Table 3.4). The levels of C. kikuchii detected at R5 were lower than those of soybean plants at
R5 in the first and second plantings. For CP 5892, the levels of C. kikuchii detected in non-
sprayed plants was higher than sprayed plants at R5, but there was no significant difference for
DP 5634.
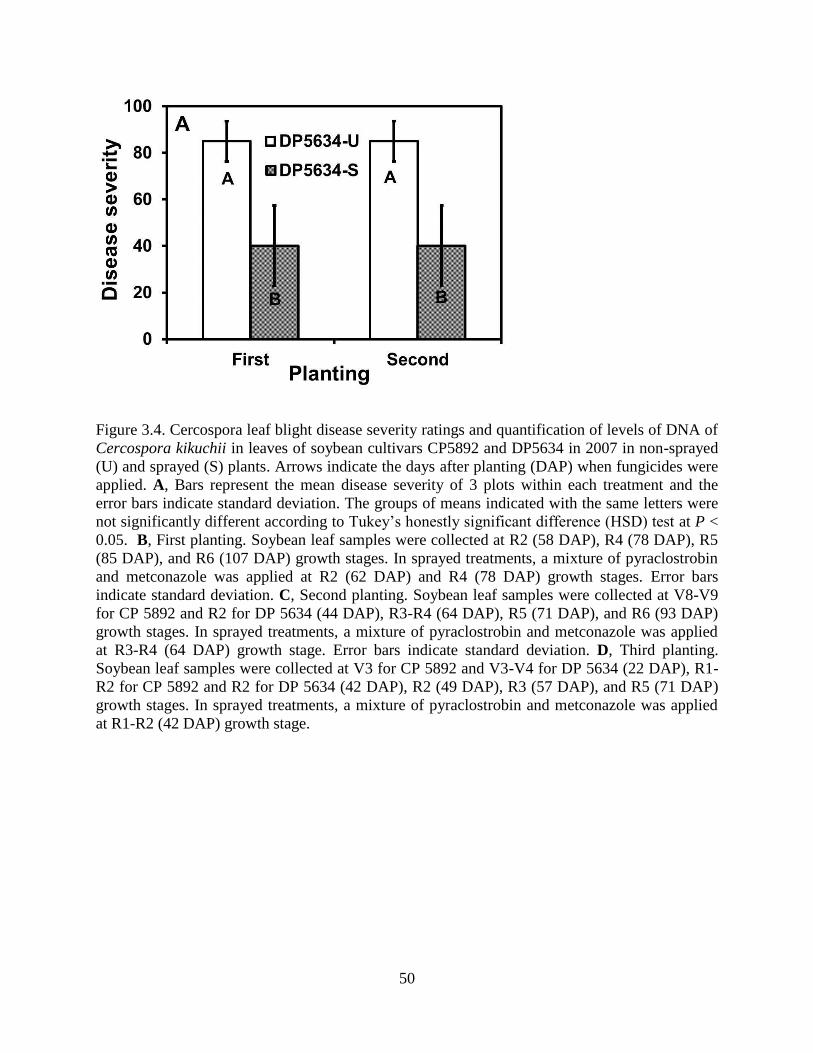
50
Figure 3.4. Cercospora leaf blight disease severity ratings and quantification of levels of DNA of
Cercospora kikuchii in leaves of soybean cultivars CP5892 and DP5634 in 2007 in non-sprayed
(U) and sprayed (S) plants. Arrows indicate the days after planting (DAP) when fungicides were
applied. A, Bars represent the mean disease severity of 3 plots within each treatment and the
error bars indicate standard deviation. The groups of means indicated with the same letters were
not significantly different according to Tukey’s honestly significant difference (HSD) test at P <
0.05. B, First planting. Soybean leaf samples were collected at R2 (58 DAP), R4 (78 DAP), R5
(85 DAP), and R6 (107 DAP) growth stages. In sprayed treatments, a mixture of pyraclostrobin
and metconazole was applied at R2 (62 DAP) and R4 (78 DAP) growth stages. Error bars
indicate standard deviation. C, Second planting. Soybean leaf samples were collected at V8-V9
for CP 5892 and R2 for DP 5634 (44 DAP), R3-R4 (64 DAP), R5 (71 DAP), and R6 (93 DAP)
growth stages. In sprayed treatments, a mixture of pyraclostrobin and metconazole was applied
at R3-R4 (64 DAP) growth stage. Error bars indicate standard deviation. D, Third planting.
Soybean leaf samples were collected at V3 for CP 5892 and V3-V4 for DP 5634 (22 DAP), R1-
R2 for CP 5892 and R2 for DP 5634 (42 DAP), R2 (49 DAP), R3 (57 DAP), and R5 (71 DAP)
growth stages. In sprayed treatments, a mixture of pyraclostrobin and metconazole was applied
at R1-R2 (42 DAP) growth stage.
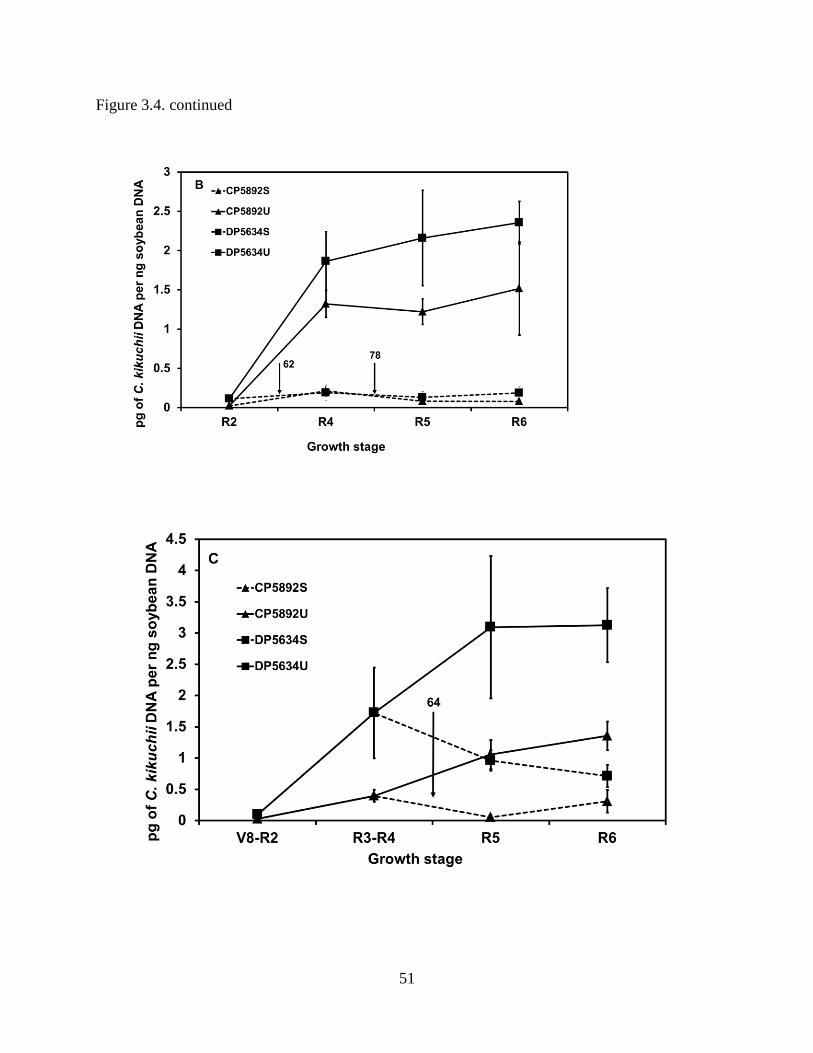
51
Figure 3.4. continued

52
Figure 3.4. continued

53
Table 3.4. Cercospora kikuchii infection of soybean leaf samples collected at various growth
stages in 2007.
Planting
DAPx
DNA of C. kikuchii (pg/ng soybean DNA)
CP 5892 DP 5634
Growth
Stage
Non-
sprayedy
Sprayed Growth
Stage
Non-
sprayed Sprayed
First 58 R2 0.02 b - R2 0.11 b -
78 R4 1.32 a 0.21 b R4 1.86 a 0.19 b
85 R5 1.22 a 0.08 b R5 2.16 a 0.13 b
107 R6 1.52 a 0.08 b R6 2.36 a 0.19 b
Second 44 V8-V9 0.03 de - R2 0.1 c -
64 R3-R4 0.4 c - R4 1.72 b -
71 R5 1.06 b 0.06 e R5 3.09 a 0.96 bc
93 R6 1.35 a 0.31 cd R6 3.12 a 0.71 c
Third 22 V3 0.16 c - V3-V4 0.16 b -
42 R1-R2 0.22 bc - R2 0.19 b -
49 R2 0.23 bc 0.14 bc R2 0.23 b 0.18 b
57 R3 0.25 bc 0.07 c R3 0.22 b 0.2 b
71 R5 0.66 a 0.46 ab R5 0.7 a 0.9 a
x DAP, days after planting.
y Means followed by the same letter in non-sprayed and sprayed treatments in a given cultivar
and given planting were not significantly different according to the Tukey’s honestly significant
difference (HSD) test at P < 0.05.
In 2009 (Experiment G, Table 3.3), there was no significant difference in CLB severity
between sprayed and non-sprayed plants for DP 5808RR (Fig. 3.5A). There was no significant
change in fungal DNA from V4 to R4 in non-sprayed plants and from V4 to R5 in sprayed plants
(Fig. 3.5B). However, fungal DNA significantly increased from 1.15 pg at late R4 to 20.4 pg at
R7 in non-sprayed plants and significantly increased from 2.41 pg at R6 to 11.67 pg at R7 in
sprayed plants. Non-sprayed plants were about 7 to 10 days ahead of sprayed plants with regard
to development of C. kikuchii at R6 and R7. There was almost a two-fold increase in fungal
DNA in non-sprayed plants as compared to sprayed plants at R7 (Fig. 3.5B and Table 3.5).
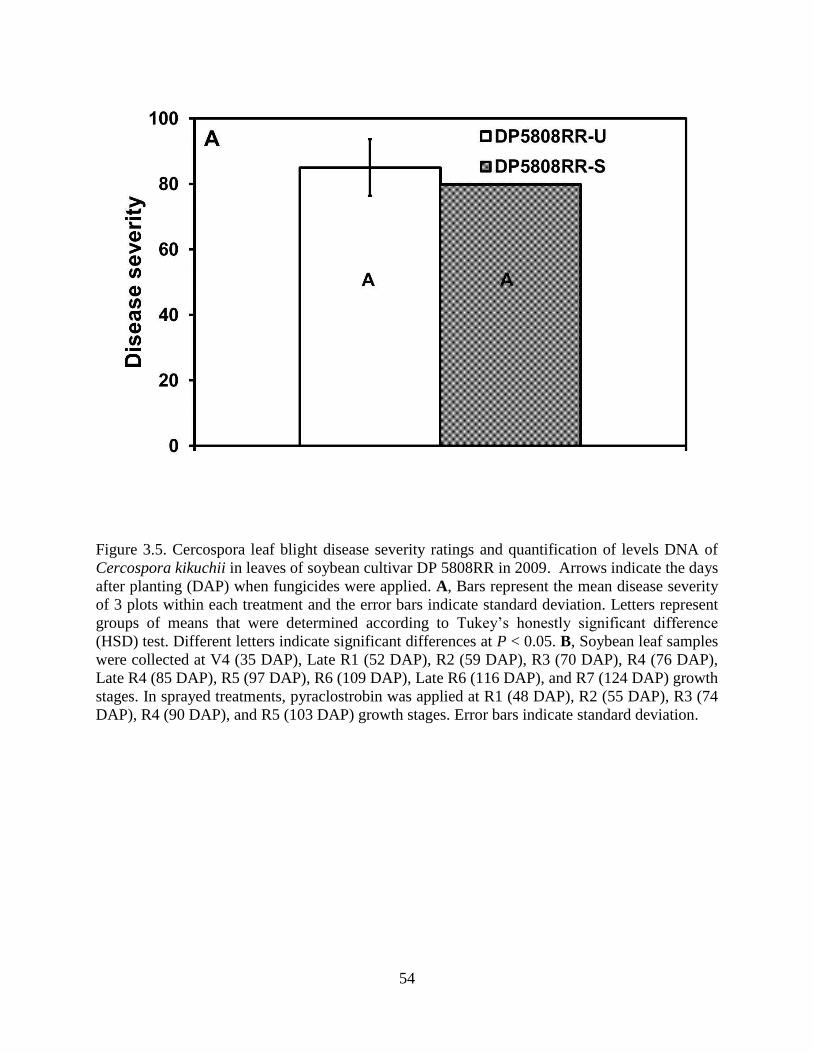
54
Figure 3.5. Cercospora leaf blight disease severity ratings and quantification of levels DNA of
Cercospora kikuchii in leaves of soybean cultivar DP 5808RR in 2009. Arrows indicate the days
after planting (DAP) when fungicides were applied. A, Bars represent the mean disease severity
of 3 plots within each treatment and the error bars indicate standard deviation. Letters represent
groups of means that were determined according to Tukey’s honestly significant difference
(HSD) test. Different letters indicate significant differences at P < 0.05. B, Soybean leaf samples
were collected at V4 (35 DAP), Late R1 (52 DAP), R2 (59 DAP), R3 (70 DAP), R4 (76 DAP),
Late R4 (85 DAP), R5 (97 DAP), R6 (109 DAP), Late R6 (116 DAP), and R7 (124 DAP) growth
stages. In sprayed treatments, pyraclostrobin was applied at R1 (48 DAP), R2 (55 DAP), R3 (74
DAP), R4 (90 DAP), and R5 (103 DAP) growth stages. Error bars indicate standard deviation.
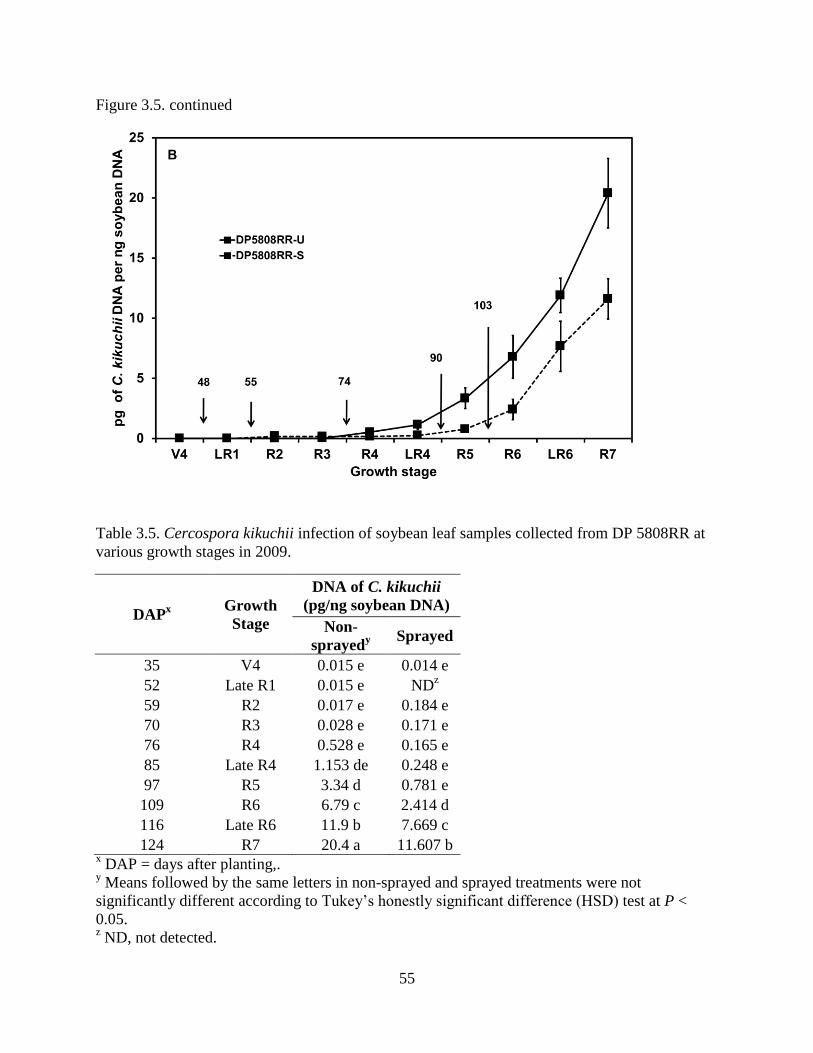
55
Figure 3.5. continued
Table 3.5. Cercospora kikuchii infection of soybean leaf samples collected from DP 5808RR at
various growth stages in 2009.
DAPx
Growth
Stage
DNA of C. kikuchii
(pg/ng soybean DNA)
Non-
sprayedy
Sprayed
35 V4 0.015 e 0.014 e
52 Late R1 0.015 e NDz
59 R2 0.017 e 0.184 e
70 R3 0.028 e 0.171 e
76 R4 0.528 e 0.165 e
85 Late R4 1.153 de 0.248 e
97 R5 3.34 d 0.781 e
109 R6 6.79 c 2.414 d
116 Late R6 11.9 b 7.669 c
124 R7 20.4 a 11.607 b x DAP = days after planting,.
y Means followed by the same letters in non-sprayed and sprayed treatments were not
significantly different according to Tukey’s honestly significant difference (HSD) test at P <
0.05. z ND, not detected.

56
In 2010, CLB symptoms were more severe in non-sprayed plants and plants with one
spray (1S) as compared to plants with three (3S) and five (5S) sprays (Experiments H, I and J,
Table 3.3) (Fig. 3.6A). There was no significant change in fungal DNA from V5 to R2 in any
treatment. However, at R5, non-sprayed plants had the highest content of DNA of C. kikuchii
(4.99 pg), followed by plants with one and three sprays (Fig. 3.6B). The least amount of fungal
DNA was detected in plants with five sprays (Fig. 3.6B and Table 3.6). There was a significant
difference in the amount of fungal DNA between sprayed and non-sprayed plants at R5. In all
sprayed plants, there was more than a ten-fold increase in DNA of C. kikuchii from R2 to R5
although the rate of increase was much smaller than in the non-sprayed plants (Fig. 3.6B).
3.4 Discussion
CLB has become a serious concern for soybean producers in the southern U.S. in recent
years because most soybean cultivars are susceptible (Moore and Wolcott 2000). Given the lack
of disease resistant cultivars, the use of fungicides has become the primary means by which this
disease is managed. However, management of CLB with fungicides has been less than
satisfactory even though C. kikuchii is sensitive to commonly used fungicides in in vitro tests
(Robertson et al. 2011). We hypothesized that this apparent inconsistency may be attributed to a
long latent period during which the pathogen may become established within leaf tissues in sites
where fungicide concentration may be too low to suppress subsequent symptom expression.
Thus, fungicides would have to be applied during the early stages of latent infection, and there
would have to be sufficient residual activity or additional applications to suppress pathogen
development during reproductive stages of plant growth. Cerkauskas and Sinclair (1980) first
observed the development of C. kikuchii lesions on stems and pods of soybean plants
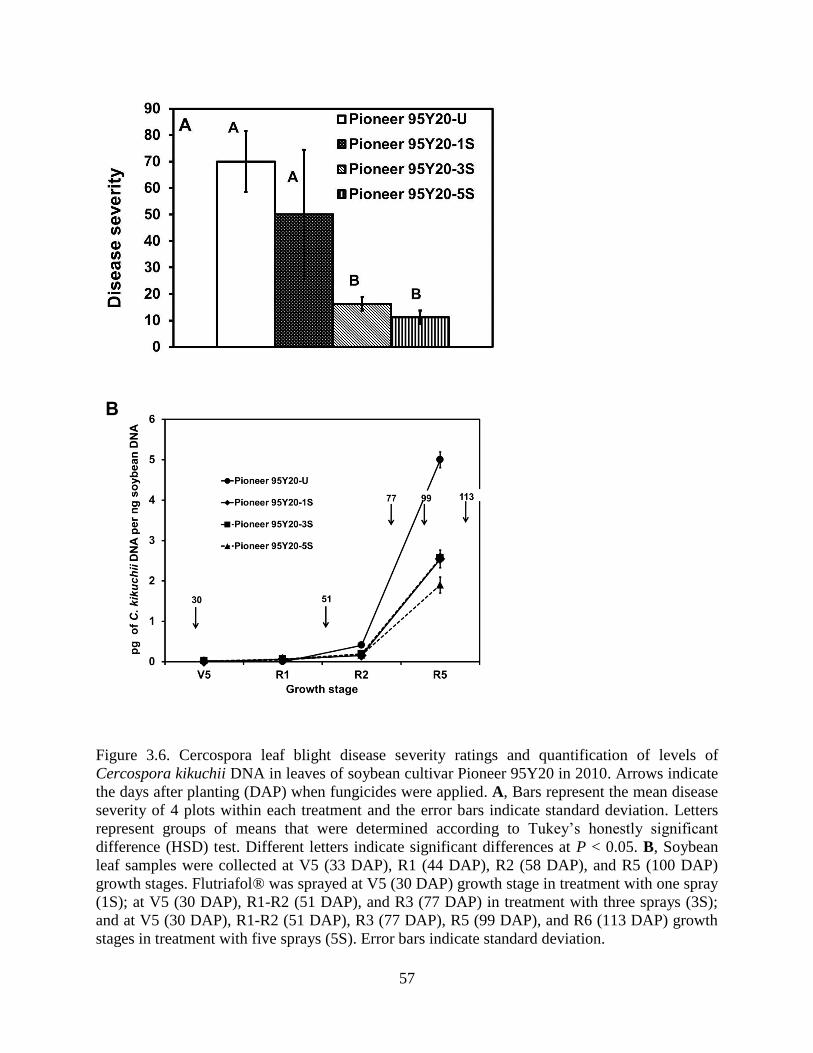
57
Figure 3.6. Cercospora leaf blight disease severity ratings and quantification of levels of
Cercospora kikuchii DNA in leaves of soybean cultivar Pioneer 95Y20 in 2010. Arrows indicate
the days after planting (DAP) when fungicides were applied. A, Bars represent the mean disease
severity of 4 plots within each treatment and the error bars indicate standard deviation. Letters
represent groups of means that were determined according to Tukey’s honestly significant
difference (HSD) test. Different letters indicate significant differences at P < 0.05. B, Soybean
leaf samples were collected at V5 (33 DAP), R1 (44 DAP), R2 (58 DAP), and R5 (100 DAP)
growth stages. Flutriafol® was sprayed at V5 (30 DAP) growth stage in treatment with one spray
(1S); at V5 (30 DAP), R1-R2 (51 DAP), and R3 (77 DAP) in treatment with three sprays (3S);
and at V5 (30 DAP), R1-R2 (51 DAP), R3 (77 DAP), R5 (99 DAP), and R6 (113 DAP) growth
stages in treatment with five sprays (5S). Error bars indicate standard deviation.
B
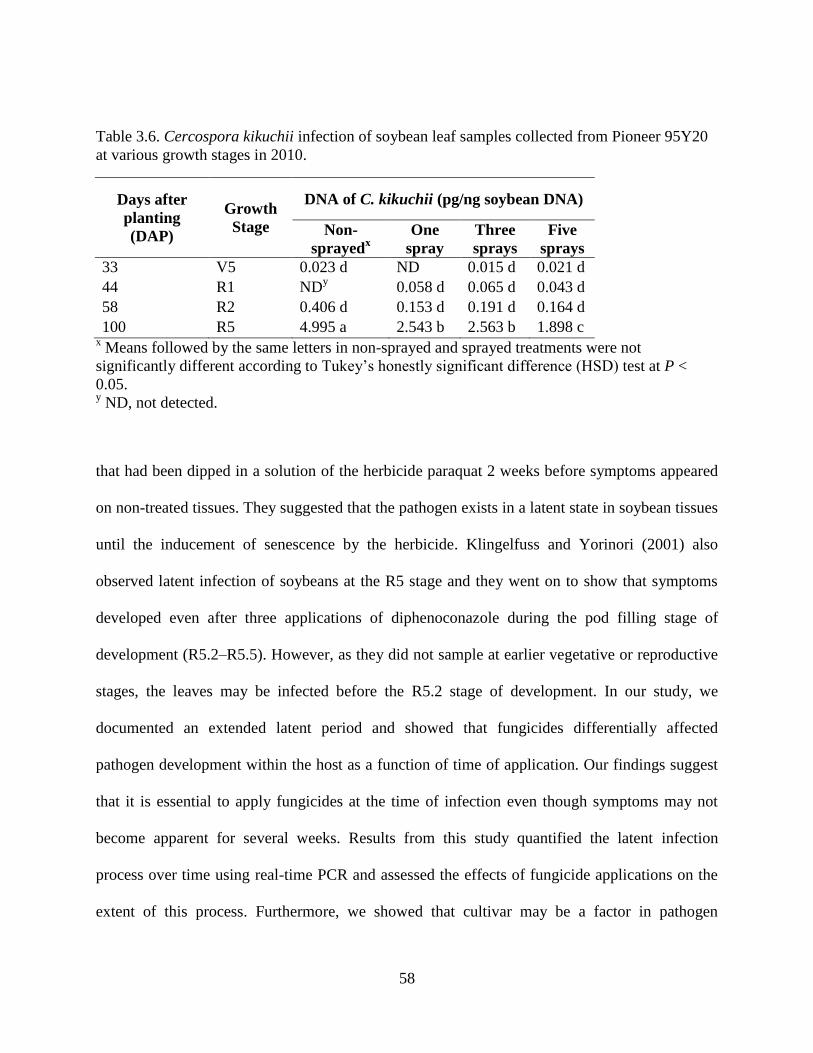
58
Table 3.6. Cercospora kikuchii infection of soybean leaf samples collected from Pioneer 95Y20
at various growth stages in 2010.
Days after
planting
(DAP)
Growth
Stage
DNA of C. kikuchii (pg/ng soybean DNA)
Non-
sprayedx
One
spray
Three
sprays
Five
sprays
33 V5 0.023 d ND 0.015 d 0.021 d
44 R1 NDy 0.058 d 0.065 d 0.043 d
58 R2 0.406 d 0.153 d 0.191 d 0.164 d
100 R5 4.995 a 2.543 b 2.563 b 1.898 c x Means followed by the same letters in non-sprayed and sprayed treatments were not
significantly different according to Tukey’s honestly significant difference (HSD) test at P <
0.05. y ND, not detected.
that had been dipped in a solution of the herbicide paraquat 2 weeks before symptoms appeared
on non-treated tissues. They suggested that the pathogen exists in a latent state in soybean tissues
until the inducement of senescence by the herbicide. Klingelfuss and Yorinori (2001) also
observed latent infection of soybeans at the R5 stage and they went on to show that symptoms
developed even after three applications of diphenoconazole during the pod filling stage of
development (R5.2–R5.5). However, as they did not sample at earlier vegetative or reproductive
stages, the leaves may be infected before the R5.2 stage of development. In our study, we
documented an extended latent period and showed that fungicides differentially affected
pathogen development within the host as a function of time of application. Our findings suggest
that it is essential to apply fungicides at the time of infection even though symptoms may not
become apparent for several weeks. Results from this study quantified the latent infection
process over time using real-time PCR and assessed the effects of fungicide applications on the
extent of this process. Furthermore, we showed that cultivar may be a factor in pathogen
59
development as well. To our knowledge this is the first report of using real-time PCR for
detection and quantification of C. kikuchii in soybean plants.
The real-time PCR primer set (CKCTB6-2F and CKCTB6-2R) and probe (CKCTB6-
PRB), which was based upon the cloned CTB6 gene sequence from C. kikuchii, produced a
specific amplicon using genomic DNA from C. kikuchii but not from other Cercospora species
tested in this study. The detection limit was 1 pg of C. kikuchii DNA in the presence of 10 to100
ng of soybean DNA. This was equivalent to 34 copies of the genomes, which is based upon an
estimate of the genome size of C. kikuchii of 28.4 Mb (or equivalent of 0.03 pg) (Hightower et
al. 1995). The sensitivity was similar in the absence of soybean DNA. However, in order to
simulate soybean leaf samples, the standard curve was constructed with serial dilutions of C.
kikuchii genomic DNA in the presence of 10 ng of soybean genomic DNA. A similar approach
was used in quantifying Fusarium solani f. sp. glycines in artificially inoculated soybean roots
(Li et al. 2008). The real-time PCR protocol developed in this study was quantitative over four
orders of magnitude of fungal genomic DNA concentrations, which was similar to results
obtained by Guo et al. (2007). The relatively higher detection limit as compared to other studies
with femtogram sensitivity may be attributed to the use of internal transcribed spacer (ITS)
sequences used in other studies (Pastrik and Maiss 2000) that have far more copies than
structural genes, such as the toxin biosynthetic pathway gene (CTB6) that we used in this study.
Also, using the cercosporin pathway gene was important in differentiating C. kikuchii from C.
sojina because both are capable of infecting soybean, but only C. kikuchii is known to produce
cercosporin (Goodwin et al. 2001). In addition, a BLAST search done in October 2010 revealed
that the ITS1 and ITS2 sequences of C. kikuchii share 97 and 100% similarity with C. sojina,
respectively, and 100% similarity with other species of Cercospora, such as C. beticola, C. apii,
60
C. capsici, and C. rodmanii. These similarities render ITS sequences of C. kikuchii of little use
for developing species-specific real-time PCR primers.
We showed that C. kikuchii was present in soybean leaf samples as early as 22 DAP (V4)
in the third planting in 2007, 33 DAP (V5) in 2010, and 35 DAP (V4) in 2009, which were long
before the development of symptoms at R6 (107 and 93 DAP in the first and second plantings,
respectively, in 2007, 97 DAP in 2009, and 113 DAP in 2010).We documented a general trend of
increasing amount of fungal DNA in non-sprayed soybean plants from R2/R3 to R4/R5 during
2007 and 2010 and post R4 during 2009. These findings suggest that latent infection is quiescent
until plants begin reproductive growth, at which time there is a steady increase in fungal biomass
leading ultimately to symptom development.
Results from this study indicated that latent infection responded differentially to different
fungicide combinations. In 2007, the cultivars sprayed with a mixture of pyraclostrobin and
metconazole for the first two plantings had significantly lower levels of fungal DNA at later
stages of soybean growth as compared to non-sprayed controls. Whereas in 2009, multiple
applications of pyraclostrobin alone only delayed the onset of rapid pathogen development by
one growth stage as compared to non-sprayed controls. However, in 2010, a single flutriafol
application at V5 was enough to limit development of C. kikuchii as there was no significant
difference in fungal DNA content between the treatment receiving the single V5 spray and the
treatment receiving three sprays with the last one being applied at R3. The treatment receiving
five sprays, with the last one occurring at R6, had the lowest DNA content at the end of the
season. However, three and five fungicide applications are impractical commercial practices for
managing CLB. Clearly, fungicides must be applied during early latent stages in order to
61
suppress pathogen development, and Robertson et al. (2011) demonstrated that application of
flutriafol and other fungicides during late vegetative stages provided superior disease control.
It is likely that fungicidal control of other diseases with protracted latent infection periods
would benefit from similar studies. For example, Ward et al. (2011) showed that the soybean rust
pathogen, Phakopsora pachyrhizi, also has an extended latent period and that fungicide
applications are most efficacious when applied shortly before the rapid increase in fungal
biomass, which occurs about 2 weeks before pustules become evident. Guo et al. (2006) detected
Mycosphaerella graminicola DNA in wheat two weeks before symptoms were visible.
With the exception of the DP 5634 cultivar in 2007, there was not a clear relationship
between DNA content of C. kikuchii and disease severity. This may be attributed to the effects
of environment on symptom expression. For example, CLB is generally most severe when
plants are exposed to hot, dry conditions late in the season. It is possible that the pathogen is
induced to produce more cercosporin in the plant, or the plant may be more sensitive to the toxin
under these conditions even though fungal biomass may not be affected. These relationships
warrant further study.
62
CHAPTER 4: IDENTIFICATION AND CHARACTERIZATION OF
LIGHT-INDUCIBLE PROTEINS FROM CERCOSPORA KIKUCHII
4.1 Introduction
Cercospora kikuchii (T. Matsumoto & Tomoy.) M. W. Gardner causes purple seed stain
(PSS) and cercospora leaf blight (CLB) in soybeans (Orth and Schuh 1994). C. kikuchii and at
least 22 other Cercospora spp. (Assante et al. 1977) produce a non-hostspecific phytotoxin
known as cercosporin. Kuyama and Tamura (1957) isolated this deep red pigment from dried
mycelia of C. kikuchii. Kuyama (1962) described the nature of aromatic ring of cercosporin. The
chemical structure of cercosporin was elucidated to be 1,12-bis(2-hydroxypropyl)-2,11-
dimethoxy-6,7-methylenedioxy-4,9-dihydroxyperylene-3,10-quinone (C29H26O10) (Lousberg et
al. 1971; Yamazaki and Ogawa 1972). Cercosporin is a photosensitizer that absorbs light energy
and converts to energetically activated triplet state (3S), which in turn reacts with molecular
oxygen to generate superoxide ions (O2-.) or may react directly with oxygen by an energy
transfer process to generate singlet oxygen (1O2) (Daub and Ehrenshaft 1997). Cercosporin with
photosensitizing activity can cause peroxidation of membrane lipids, leading to membrane
breakdown and cell death (Daub and Briggs 1983; Macri and Vianello 1979).
Cercosporin production is highly affected by environmental factors such as light,
nutrient conditions, temperature, and culture age (Chung 2003; Daub and Ehrenshaft 2000;
Ehrenshaft and Upchurch 1991; Jenns et al. 1989). Light is not only essential for cercosporin
production but also for activation (Daub 1982). Cercosporin production is stimulated by light of
450-490 nm in wavelengths (Lynch and Geoghegan 1979) and C. kikuchii isolates grown in
continuous light accumulated more cercosporin than when grown in continuous dark (Ehrenshaft
and Upchurch 1991; Fajola 1978; Rollins et al. 1993).
63
Cercosporin plays a critical role in the disease development by Cercospora species that
synthesize the toxin. Light intensity and day length were strongly correlated with disease severity
caused by Cercospora species in coffee (Daub and Ehrenshaft 1997), banana (Calpouzos 1966),
and sugar beet (Calpouzos and Stalknecht 1967). Cercosporin has been shown to be the crucial
pathogenicity factor for C. kikuchii (soybean), C. nicotianae (tobacco), and C. zeae-maydis
(maize) and gene disruption mutants [CFP disruption mutants in C. kikuchii (Callahan et al.
1999), CZK3 disruption mutants in C. zeae-maydis (Shim and Dunkle 2003), CTB1 disruption
mutants in C. nicotianae (Choquer et al. 2005)] showed reduced or abolished cercosporin
production and produced fewer or no lesions when inoculated on their respective host plants.
Using restriction enzyme mediated insertional mutagenesis (REMI), the cercosporin toxin
biosynthesis (CTB) gene cluster harboring 8 genes CTB1 to CTB8, was identified in C.
nicotianae (Chen et al. 2007b). Suppressive subtractive hybridization (SSH) was used to identify
genes involved in cercosporin biosynthesis in C. kikuchii (Ehrenshaft and Upchurch 1991) and
C. zeae-maydis (Shim and Dunkle 2002). However, so far the genes identified are very different
in C. kikuchii, C. zeae-maydis, and C. nicotianae indicating that cercosporin biosynthesis is very
complex at physiological and genetic levels (You et al. 2008) and also involves calcium signal
transduction pathways (Chung 2003)
To aid in developing resistance in plants to Cercospora spp. that require cercosporin as a
pathogenicity factor, our primary goal is be to identify the genes/proteins that are either directly
involved in or regulating cercosporin biosynthesis and conferring resistance to cercosporin.
Eventually we can target these genes to suppress the cercosporin production by Cercospora spp.
in plants by using recent technologies like host-induced gene silencing (HIGS) (Nowara et al.
2010; Tinoco et al. 2010; Yin et al. 2011). In this study, we used 2-dimensional gel

64
electrophoresis (2-DGE) to identify differentially regulated proteins in C. kikuchii grown under
continuous light. In this study, we describe the complete cloning and functional characterization
of hydroxynaphthalene reductase (HNR) and adenosylhomocysteinase (AHCY) genes by
generating hnr and ahcy disruption mutants, and demonstrated the requirement of HNR and
AHCY genes for fungal pathogenesis of C. kikuchii on soybeans.
4.2 Materials and Methods
4.2.1 Fungal Cultures and Cercosporin Determination
Cercospora kikuchii isolate MRL6020-2B was isolated from leaves of naturally infected
soybean cultivar SS RT 6299N in Winnsboro, Louisiana (Cai and Schneider 2005). C. kikuchii
was grown on PDA for 1 week and three 7-mm mycelial plugs (2 mm away from margins) were
cut with a cork borer and ground in 2 ml of sterile water in a glass grinder. Two hundred
microliters of this mycelial suspension was used to inoculate 250 ml of liquid complete medium
[Ingredients per liter were: glucose (10 g); yeast extract (1 g); casein hydrolysate (1 g);
Ca(NO3)2.4H2O (1 g); 10 ml of a solution containing 2 g of KH2PO4, 2.5 g of MgSO4.7H2O, and
1.5 g of NaCl in 100 ml of H2O, adjusted to pH 5.3 with NaOH] (Jenns et al. 1989) in a 500 ml
Erlenmeyer flask. Cultures were incubated at 25°C with constant shaking (200 rpm) under light
(240 μE m-2
s-1
) or dark (achieved by wrapping flasks with two layers of aluminum foil). Cultures
from light and dark were harvested at 4, 6, 8, 10, 12, and 16 days. Entire cultures were blended
in Waring blender twice for 20 sec with high speed pulses and 4-ml aliquot of the suspension
(mycelium plus medium) was mixed with 4 ml of 5N KOH, incubated in dark for 4 h and
cercosporin concentration was determined with spectrophotometer by measuring absorbance of
the sample at 480 nm [Molar extinction coefficient of cercosporin in base is 23,300 (Jenns et al.
1989)]. C. kikuchii mycelia from the remaining suspension were separated from media by

65
vacuum filtration. Mycelia were freeze-dried and ground to fine powder using liquid nitrogen
and stored at -80°C for further use. The entire experiment was repeated four times.
4.2.2 Protein Extraction
Total proteins were extracted from fungal mycelia using a phenol method followed by
methanolic ammonium acetated precipitation (Hurkman and Tanaka 1986). One gram of ground
C. kikuchii mycelia was transferred to 30 ml oak ridge tube (Nalgene, Rochester, NY) and
homogenized with 2.5 ml of Tris pH 8.8 buffered phenol and 2.5 ml of extraction buffer (0.1 M
Tris-HCl pH 8.8, 10 mM EDTA, 0.4% 2-mercaptoethanol, 0.9 M sucrose) using a Polytron PT
3100 (Kinematica Inc., Newark, NJ) homogenizer at 10,000 rpm for 1 min. Samples were
agitated for 30 min at 4°C and centrifuged at 5000 g for 10 min at 4°C. The phenol layer (top)
with proteins was transferred to a second tube. Proteins were re-extracted by adding an equal
volume of Tris pH 8.8 buffered phenol to the first tube. After agitation for 30 min and
centrifugation at 5000 g for 10 min, the phenol layer (top) was transferred to the second tube.
The combined phenol phase was extracted with an equal volume of extraction buffer. The top
phenol phase was transferred to a new tube and proteins were precipitated by adding 10 volumes
of 0.1 M ammonium acetate in 100% methanol (pre-chilled to -80°C) and tubes were left at -
80°C overnight. Proteins were pelleted by centrifugation at 4000 g for 30 min at 4°C and the
pellet was washed twice with 0.1 M ammonium acetate in 100% methanol containing 10 mM
dithiotheritol (DTT), followed by two washes with ice-cold 80% acetone containing 10 mM
DTT. Protein pellets were air dried in a laminar air flow hood and stored at -30°C until further
use.

66
4.2.3 First-Dimension Gel Electrophoresis
Approximately 5 mg protein pellets were solubilized in lysis buffer [8 M urea, 4% 3-[(3-
cholamidopropyl) dimethylammonio]-1-propane sulfonate (CHAPS), 40 mM dithiotheritol
(DTT), and 2% (w/v) 3-10 NL IPG (Non-linear immobilized pH gradient) buffer (Gorg et al.
1998)] for 30 minutes at room temperature (RT). Samples were centrifuged at 14,000 rpm for 10
min at RT and supernatant was transferred to a fresh 1.5 ml microfuge tube and protein
concentration was determined using a protein assay buffer (Bio-Rad) (Bradford 1976). IPG strips
(18 cm, pH 3-10 NL, ImmobilineTM
DryStrip, GE Healthcare) were rehydrated overnight in 340
μl of rehydration buffer (8 M urea, 2% (w/v) CHAPS, 20 mM DTT, 0.002% bromophenol blue,
and 0.5% (w/v) 3-10 NL IPG buffer) with 100 μg of protein for silver staining (analytical gels)
and 1000 μg of protein for Coomassie Brilliant Blue staining (preparative gels). Strips in the
rehydration tray were covered by ImmobilineTM
DryStrip cover fluid (3 ml per strip) (GE
Healthcare, Cat # 17-1335-01), leveled horizontally, and left overnight at RT. Isoelectric
focusing (IEF) was done at 20°C using the following conditions: 500 V for 1 h, 1000 V for 1 h
and 8000 V for 5 h. The maximum current per strip was limited to 50 µA. The focused IPG strips
were equilibrated for 20 min in 7 ml per strip of equilibration buffer I (50 mM Tris-HCl pH 8.8,
6 M urea, 30% (v/v) glycerol, 20% (w/v) SDS, a trace of bromophenol blue, 1% (w/v) DTT)
with gentle shaking, followed by 20 min in 7 ml per strip of equilibration buffer II [50 mM Tris-
HCl pH 8.8, 6 M urea, 30% (v/v) glycerol, 20% (w/v) SDS, a trace of bromophenol blue, 2.5%
(w/v) iodoacetamide (IAA)].
4.2.4 Second-Dimension Gel Electrophoresis, Staining, and Gel Analysis
The equilibrated IPG strips were embedded in 1% agarose overlay solution on top of a
12.5% sodium dodecyl sulfate-polyacrylamide (SDS-PAGE) gel [235 mm (width) x 190 mm
67
(length) x 1.5 mm (thickness)] for the second dimension (EttanTM
DALTtwelve large vertical
system, GE Healthcare). Electrophoresis was carried out at 40 V for 1 h and 110 V for 16 h until
the bromophenol blue dye reached the bottom of the gel. Proteins were visualized in analytical
gels by staining with the Dodeca Silver Stain Kit (Bio-Rad) according to the manufacturer’s
instructions. Preparative gels were stained with 0.125% (w/v) Coomassie Brilliant Blue (CBB)
R-250. All stained gels were scanned using a UMAX PowerLook II scanner (UMAX data
systems, Taiwan) and analyzed using the Progenesis SameSpots software (Nonlinear Dynamics,
Durham, NC, USA). The 2-DE gels were prepared from four independent biological replicates
and only consistent differentially expressed protein spots were processed for identification using
LC-MS/MS.
4.2.5 Protein Identification
The selected protein spots were excised from two to three CBB stained gels and were
subjected to in-gel trypsin digestion. The digested peptides were subjected to liquid
chromatography tandem mass spectrometry (LC-MS/MS) at the Pennington Biomedical Center
(Baton Rouge, LA). The gel plugs were destained, reduced, alkylated, and then digested with
trypsin at 37ºC overnight using an automated robotic workstation (MassPrep, Waters Corp.,
Milford, MA). The digested peptide fragments were extracted with 2% (v/v) acetonitrile and 1%
(v/v) formic acid and transferred to a 96-well plate for analysis. The peptides from each digested
spot were separated by a capillary LC system coupled to a nanospray quadrupole time-of-flight
(Q-TOF) tandem mass spectrometer (Waters Corp). Briefly, the peptides were injected onto a 75
µm C18 reverse phase capillary column (Dionex) and separated using a gradient of 3 to 40%
acetonitrile during a 30 min run. The MS was operated in a data-dependent acquisition mode, in
which a full survey of the parental ions was followed by three MS/MS scans using normalized
68
collision energy. The instrument was operated in positive ion mode, with an electrospray voltage
of 3.5 kV, sample cone voltage of 40 V and extraction cone voltage of 1.5 V. The peaklist (pkl)
files were generated using ProteinLynx Global Server 2.2.5 (PLGS 2.2.5, Waters Corp.) with
default parameters. Tandem mass spectra were searched against the SwissProt database using the
PLGS 2.2.5 software (Waters Corp.) with the following settings: one missed tryptic cleavage;
precursor-ion mass tolerance, 200 ppm; fragment-ion mass tolerance, 0.1 Da and fixed
carbamidomethylation of cysteine residues. Methionine oxidation of proteins was allowed as a
variable modification in the database search query in PLGS, and automodification query was
selected to identify peptides with further post-translational modifications in PLGS. The top
ranking hits (PLGS scores between 8-13) were further evaluated using molecular weight, pI, and
% sequence coverage to help confirm protein identities. Proteins were identified by searching the
non-redundant protein database of the National Center for Biotechnology Information (NCBI),
expressed sequence tags (ESTs) from Cercospora zeae-maydis with the Mascot search engine
(Perkins et al. 1999, http://www.matrixscience.com) and taxonomy limited to fungi. De novo
sequencing directly from MS/MS data was also done using PEAKS software (Ma et al. 2003) to
identify peptides.
4.2.6 Cloning of the HNR Gene from C. kikuchii
Two degenerate primers were synthesized for spot 57, HNRF (5′-
GTIGTIGTBAAYTAYGCIAAY-3′) and HNRR (5′- YTTICCRTTVACCCAYTCICC-3′)
[I=Inosine, B=C/G/T, Y= T/C, R=A/G, V=A/C/G], based on peptide sequences VVVNYANS
and GEWVNGK, respectively. The resulting 703 bp PCR amplicon was cloned into pCR®2.1-
TOPO®
TA Cloning vector (Invitrogen, Carlsbad, CA) and sequenced. To clone full length HNR,
a chromosome library of C. kikuchii was constructed using the Universal GenomeWalkerTM
kit
69
per the manufacturer’s instructions (Clontech Laboratories Inc., Mountain View, CA). To walk
upward and downward into unknown genomic regions, primers were synthesized to complement
the known regions (HNRL1: 5′- aatgtcaactggctgtccaacacgag-3′; HNRL2: 5′-
gaactcacctcatcaacctcgtcatc-3′; HNRR4: 5′-aactcgacatcgtgtgctcaaactct-3′; HNRR3: 5′-
gtgctatcaaggagcacggtggagat-3′) and used for two rounds of PCR amplification with adaptor
primers (AP1: 5′-gtaatacgactcactatagggc-3′; AP2: 5′- actatagggcacgcgtggt-3′) supplied with the
kit. DNA fragments amplified from the library by PCR were cloned into pCR®2.1-TOPO
® TA
Cloning vector (Invitrogen, Carlsbad, CA) for sequencing at Louisiana State University GeneLab
(Baton Rouge, Louisiana). Prediction of ORFs and exon/intron junctions was first performed
using the gene-finding software at http://www.softberry.com. The full length HNR gene was 862
bp with one intron. Oligonucleotides used for PCR and sequencing were synthesized by
Integrated DNA Technologies (IDT, Coralville, IA).
4.2.7 Targeted Disruption of the HNR Gene
The hygromycin (HYG) cassette fused with HNR 5′ and 3′ fragments was constructed
using three rounds of PCR using a high fidelity DNA polymerase (Roche Applied Science,
Indianapolis, IN) according to Yu et al. (2004b). The HYG gene encodes a phosphotransferase
under the control of the Aspergillus nidulans trpC promoter and terminator, conferring
hygromycin resistance (pUCATPH vector was kindly provided by Dr. Turgeon, Cornell
University). In the first round, HYG cassette, 5′ HNR, and 3′ HNR fragments were amplified.
The HYG cassette (2.5 kb) was amplified from pUCATPH (Lu et al. 1994) with the primers
M13R (5′-agcggataacaatttcacacagga-3′) and M13F (5′-cgccagggttttcccagtcacgac-3′). The 5′ HNR
fragment (0.8 kb) was amplified by PCR with the primers HNR5F (5′- aacgggcggtgattcttgct-3′)
and M13RHNR5R (5′-tcctgtgtgaaattgttatccgctgtccgaatgatacaacgccag-3′) and the 3′ HNR
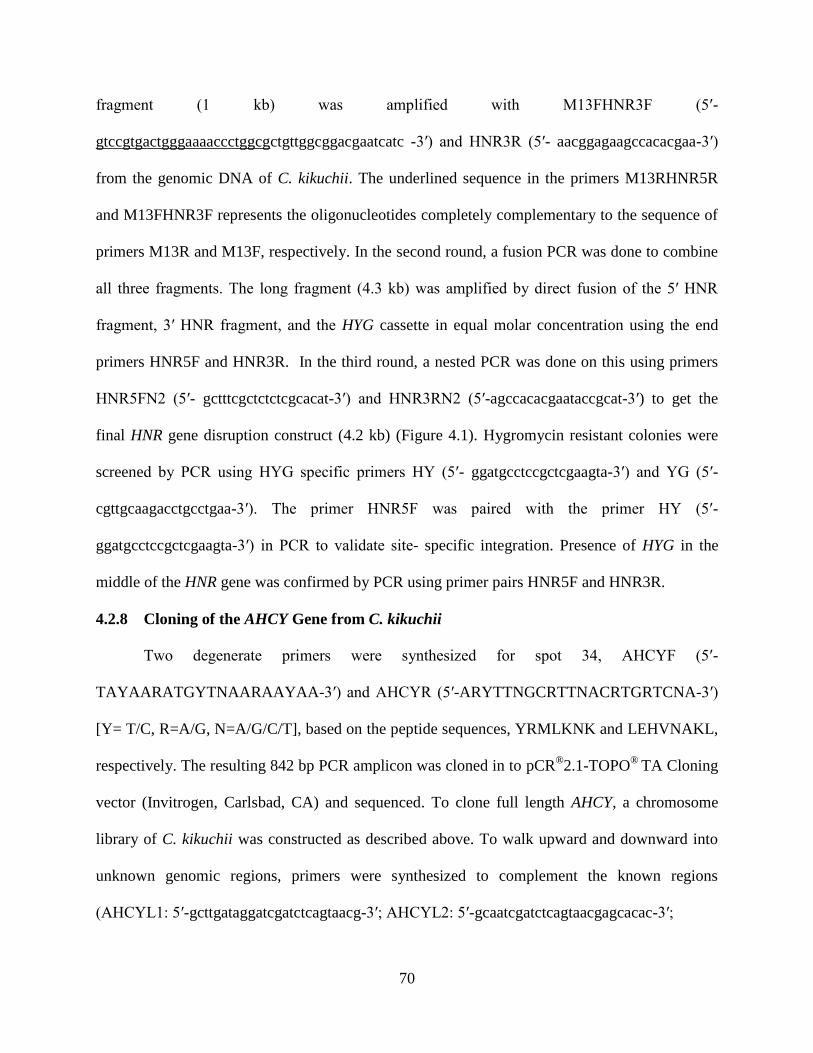
70
fragment (1 kb) was amplified with M13FHNR3F (5′-
gtccgtgactgggaaaaccctggcgctgttggcggacgaatcatc -3′) and HNR3R (5′- aacggagaagccacacgaa-3′)
from the genomic DNA of C. kikuchii. The underlined sequence in the primers M13RHNR5R
and M13FHNR3F represents the oligonucleotides completely complementary to the sequence of
primers M13R and M13F, respectively. In the second round, a fusion PCR was done to combine
all three fragments. The long fragment (4.3 kb) was amplified by direct fusion of the 5′ HNR
fragment, 3′ HNR fragment, and the HYG cassette in equal molar concentration using the end
primers HNR5F and HNR3R. In the third round, a nested PCR was done on this using primers
HNR5FN2 (5′- gctttcgctctctcgcacat-3′) and HNR3RN2 (5′-agccacacgaataccgcat-3′) to get the
final HNR gene disruption construct (4.2 kb) (Figure 4.1). Hygromycin resistant colonies were
screened by PCR using HYG specific primers HY (5′- ggatgcctccgctcgaagta-3′) and YG (5′-
cgttgcaagacctgcctgaa-3′). The primer HNR5F was paired with the primer HY (5′-
ggatgcctccgctcgaagta-3′) in PCR to validate site- specific integration. Presence of HYG in the
middle of the HNR gene was confirmed by PCR using primer pairs HNR5F and HNR3R.
4.2.8 Cloning of the AHCY Gene from C. kikuchii
Two degenerate primers were synthesized for spot 34, AHCYF (5′-
TAYAARATGYTNAARAAYAA-3′) and AHCYR (5′-ARYTTNGCRTTNACRTGRTCNA-3′)
[Y= T/C, R=A/G, N=A/G/C/T], based on the peptide sequences, YRMLKNK and LEHVNAKL,
respectively. The resulting 842 bp PCR amplicon was cloned in to pCR®2.1-TOPO
® TA Cloning
vector (Invitrogen, Carlsbad, CA) and sequenced. To clone full length AHCY, a chromosome
library of C. kikuchii was constructed as described above. To walk upward and downward into
unknown genomic regions, primers were synthesized to complement the known regions
(AHCYL1: 5′-gcttgataggatcgatctcagtaacg-3′; AHCYL2: 5′-gcaatcgatctcagtaacgagcacac-3′;
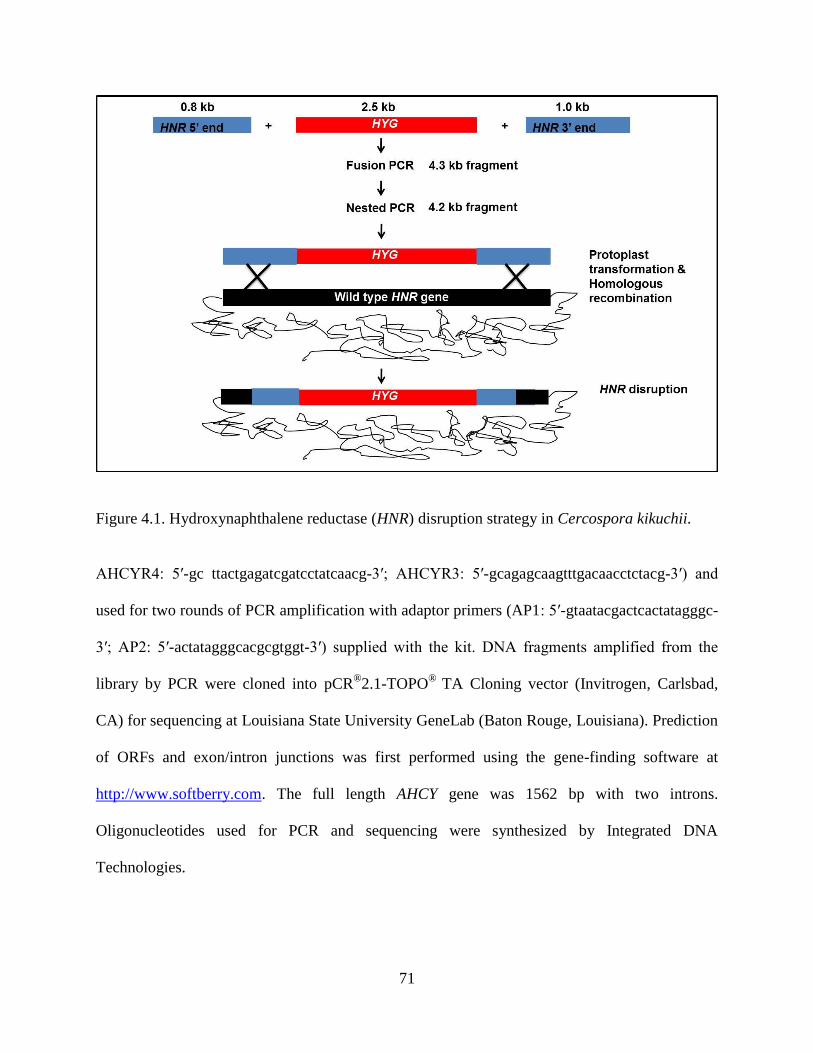
71
Figure 4.1. Hydroxynaphthalene reductase (HNR) disruption strategy in Cercospora kikuchii.
AHCYR4: 5′-gc ttactgagatcgatcctatcaacg-3′; AHCYR3: 5′-gcagagcaagtttgacaacctctacg-3′) and
used for two rounds of PCR amplification with adaptor primers (AP1: 5′-gtaatacgactcactatagggc-
3′; AP2: 5′-actatagggcacgcgtggt-3′) supplied with the kit. DNA fragments amplified from the
library by PCR were cloned into pCR®2.1-TOPO
® TA Cloning vector (Invitrogen, Carlsbad,
CA) for sequencing at Louisiana State University GeneLab (Baton Rouge, Louisiana). Prediction
of ORFs and exon/intron junctions was first performed using the gene-finding software at
http://www.softberry.com. The full length AHCY gene was 1562 bp with two introns.
Oligonucleotides used for PCR and sequencing were synthesized by Integrated DNA
Technologies.

72
4.2.9 Targeted Disruption of the AHCY Gene
The HYG cassette fused with AHCY 5′ and 3′ fragments was constructed using three
rounds of PCR using a high fidelity DNA polymerase (Roche Applied Science, Indianapolis, IN)
according to Yu et al. (2004b). The HYG gene encodes a phosphotransferase under the control of
the Aspergillus nidulans trpC promoter and terminator, conferring hygromycin resistance. In the
first round, HYG cassette, 5′ AHCY, and 3′ AHCY fragments were amplified. The HYG cassette
(2.5 kb) was amplified from pUCATPH (Lu et al. 1994) with the primers M13R (5′-
agcggataacaatttcacacagga-3′) and M13F (5′-cgccagggttttcccagtcacgac-3′). The 5′ AHCY
fragment (1.4 kb) was amplified by PCR with the primers AHCY5F (5′- gcatagcgtgggaggatgtat-
3′) and M13RAHCY5R (5′-ttcctgtgtgaaattgttatccgcttcaaacttgctcttggtgacg-3′) and the 3′ AHCY
fragment (1.4 kb) was amplified with M13FAHCY3F (5′-
gtcgtgactgggaaaaccctggcgccgtgtgctcgttactgaga-3′) and AHCY3R (5′-gttgaagaacggacagcgaa-3′)
from the genomic DNA of C. kikuchii. The underlined sequence in the primers M13RAHCY5R
and M13FAHCY3F represents the oligonucleotides completely complementary to the sequence
of primers M13R and M13F, respectively. In the second round, a fusion PCR was performed to
combine all three fragments. The long fragment (5.3 kb) was amplified by direct fusion of the 5′
AHCY fragment, 3′ AHCY fragment, and HYG cassette in equal molar concentration using the
end primers AHCY5F and AHCY3R. In the third round, a nested PCR was done on this using
primers AHCY5FN2 (5′-tatgctggtcgttgagagcg-3′) and AHCY3RN2 (5′-gaaacaggcagaggaaacagt-
3′) to get the final AHCY gene disruption construct (5.1 kb) (Fig. 4.2). Hygromycin resistant
colonies were screened by PCR by using HYG specific primers HY (5′- ggatgcctccgctcgaagta-3′)
and YG (5′-cgttgcaagacctgcctgaa-3′). The primer AHCY5F was paired with the primer HY (5′-
ggatgcctccgctcgaagta-3′) in PCR to validate site-specific integration.

73
Figure 4.2. Adenosylhomocysteinase (AHCY) disruption strategy in Cercospora kikuchii.
4.2.10 Preparation of C. kikuchii Protoplasts
C. kikuchii protoplasts were prepared as previously described (Chung et al. 2002;
Upchurch et al. 1991) with some modifications. Two hundred microliters of mycelial suspension
(two 5-mm diameter mycelial agar plugs ground in 2 ml of water) was transferred into 200 ml of
complete medium (CM) and grown for 5 days at 25°C with continuous shaking at 180 rpm. Then
the culture was blended (two 8-sec cycles) in a Waring blender, and 50 ml of the mycelial slurry
was transferred into 200 ml of fresh CM and incubated overnight. Culture flasks were wrapped
in two layers of aluminum foil to minimize the production of cercosporin. One gram (fresh wt.)
of mycelium was completely resuspended in 40 ml of an enzyme cocktail containing 10 mg/ml
Glucanex (Sigma L1412), 5 mg/ml Driselase (Sigma D9515), 1200 U/ml ß-glucuronidase
(Sigma G0876), 0.7 M NaCl, 10 mM CaCl2, and 10 mM Na2HPO4 (pH 5.8). Digestion was done

74
at 30°C for 3 h with gentle shaking (90 rpm). After digestion, the solution was passed, in
succession, through cheesecloth, glass wool and Miracloth (EMD Millipore). Fungal protoplasts
were harvested by centrifugation at 4000 g for 5 min at 4°C. Protoplasts were washed once with
10 ml 0.7 M NaCl followed by two washes with STC buffer (1.2 M sorbitol, 10 mM Tris-HCl
pH 7.5, 10 mM CaCl2). Finally protoplasts were adjusted to 108 per ml in four parts of STC and
one part of 50% PEG (polyethylene glycol 3350, 10 mM Tris-HCl pH 7.5, 10 mM CaCl2), stored
as 100 ul aliquots at -80°C.
4.2.11 C. kikuchii Transformation
Fungal transformation was performed as described (Turgeon et al. 2010) with
modifications. All steps were performed on ice. Approximately 1x10⁷ protoplasts in 100 μl
STC/PEG solution were mixed gently with 10 μg of DNA [purified PCR product of HNR or
AHCY gene disruption constructs or pUCATPH plasmid] and incubated on ice for 10 min.
Freshly prepared polyethylene glycol (30 g Polyethylene glycol, MW 3,350 (60% w/v), 0.5 ml of
1 M Tris–HCl pH 7.5 (10 mM), 0.37 g CaCl2·2H2O (50 mM), H2O to 50 ml) was added in three
aliquots of 200, 200, and 800 ul each and mixed well after each addition by rolling. The tubes
were incubated for 10 min on ice after the first and second addition and at room temperature
after the third addition. Four hundred microliter aliquots were plated in 20 ml molten complete
medium (Ingredients per liter: 1 g yeast extract, 1 g casein hydrolysate, 342 g sucrose, and 16 g
agar) and incubated overnight in dark at room temperature. The plates were overlaid with 10 ml
of 1% agar containing 900 μg/ml Hygromycin B (Sigma H9773). The final concentration of
Hygromycin B in the plate was 300 μg/ml. One plate per transformation was kept as no overlay
control. Plates were incubated at 25°C and the colonies of transformants that appeared between 6

75
and 9 days (growing through the Hygromycin B overlay) were selected and transferred to
complete media plates containing 300 μg/ml Hygromycin B.
4.2.12 Pathogenicity Assay on Soybeans
For a detached leaf assay, C. kikuchii wild type, vector control, hnr and ahcy disruption
mutants were grown on CM agar plates for 1 week. Three-millimeter diameter mycelial agar
plugs were cut from the plates and placed on the adaxial surface of soybean leaves (collected at
the R1 stage from greenhouse grown AG6202 cultivar) with the mycelial side touching the leaf
and gently pressed. These leaves were placed on a moist filter paper in a Petri dish and incubated
at 25°C with 16 h light and 8 h dark regime and development of chlorotic and necrotic symptoms
was observed for 2 weeks and leaves were photographed using a digital camera. The experiment
was repeated two times and each time 4 to 5 leaves were used for each control or mutant tested.
For greenhouse inoculations, C. kikuchii wild type, vector control, hnr and ahcy
disruption mutants were grown on CM agar plates lined with Spectra/Por 1 6-8 kDa MWCO
dialysis membrane (VWR labshop, Batavia, IL) placed on top of the medium, for 10 days in dark
at 25°C. Mycelia were removed from the top of the dialysis membrane with the help of a forceps.
One gram of mycelia (fresh wt.) was blended with 100 ml sterile distilled water in a Waring
blender, filtered through three layers of cheese cloth. Tween-20 was added to the filtrate at
0.001% concentration and the filtrate (1.5x10⁴ CFU/ml) was used to inoculate greenhouse grown
soybean variety AG6202 at the R1 stage. Approximately 10 ml filtrate was sprayed on each
plant. Immediately after inoculation, the plants were kept in a plastic bag with moist paper
towels (to maintain 100 % RH) and kept in dark for 24 h. Later the plants were transferred to
greenhouse benches and development of symptoms was observed at 14 days post inoculation

76
(dpi). The experiment was repeated two times and each time 4 to 5 soybean plants were
inoculated for each control or mutant tested.
4.3 Results
4.3.1 Light Enhanced Cercosporin Production in C. kikuchii
The C. kikuchii isolate MRL 6020-2B used in our study produced high levels of
cercosporin in CM broth, whereas it did not produce any detectable levels of cercosporin in
potato dextrose broth (PDB) (data not shown). The red color of cercosporin was visible in 4-day-
old C. kikuchii cultures on CM under continuous light. Spectrophotometric analysis confirmed
the production of cercosporin toxin with a characteristic peak of absorbance at 480 nm in 5N
KOH (alkali). Dark-grown cultures grown in the dark accumulated significantly less cercosporin
compared to those grown in light. On any sampling day after 4 days, cultures in light had up to
6-fold more cercosporin than under dark conditions (Fig. 4.3A). More mycelial growth also was
observed in dark-grown cultures compared to light (Fig. 4.3B).
4.3.2 Comparison of Protein Profiles between Light and Dark Grown C. kikuchii
2-DE analysis of mycelial proteins extracted at 4, 6, 8, 10, 12, and 16 d from light and
dark grown C. kikuchii cultures revealed approximately 1100 ± 55 spots from both light and
dark samples using silver staining (Fig. 4.4A and 4.4B). Protein profiles from four biological
replicates showed reproducible patterns. Protein levels of visible spots were quantified with
Progenesis Samespots software after normalization and the average normalized volume of the
spots was used for calculating fold change of up- and down-regulation between differentially
expressed proteins grown under light and dark during the time-course experiment (Fig. 4.4A,
4.4B, and 4.4C). The up-regulated spots in light include, spot 57: 5-fold at 4 d; spots 34 and 28:
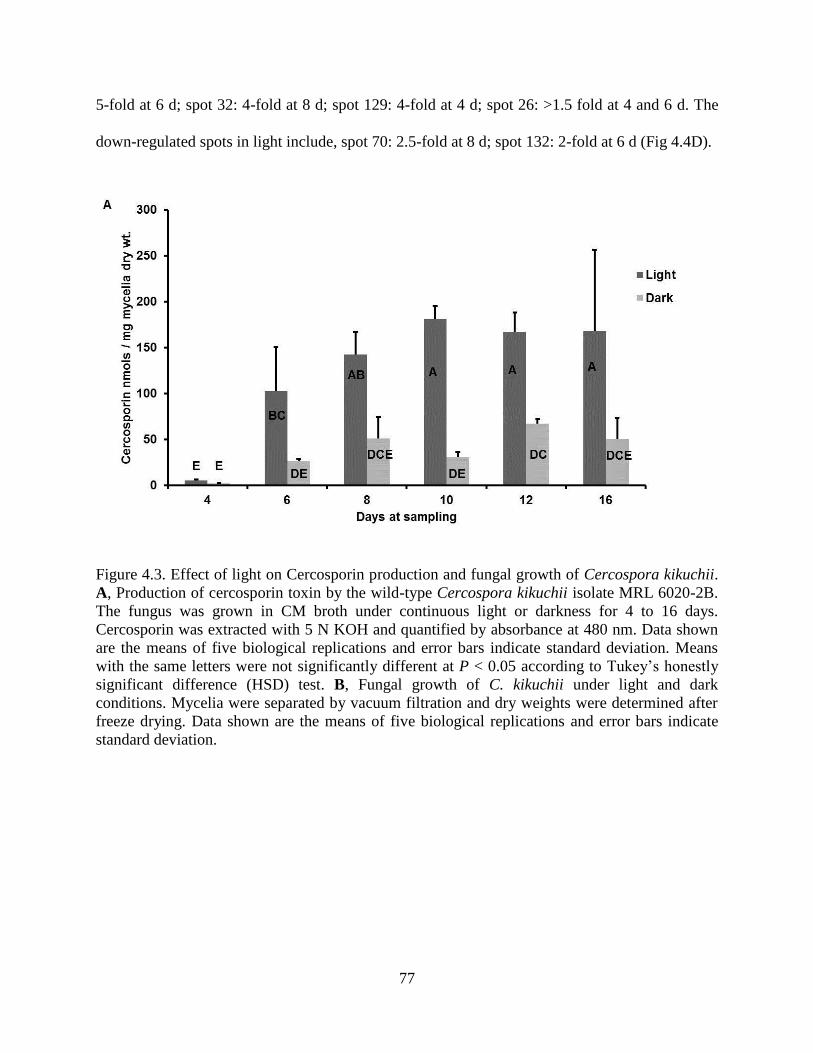
77
5-fold at 6 d; spot 32: 4-fold at 8 d; spot 129: 4-fold at 4 d; spot 26: >1.5 fold at 4 and 6 d. The
down-regulated spots in light include, spot 70: 2.5-fold at 8 d; spot 132: 2-fold at 6 d (Fig 4.4D).
Figure 4.3. Effect of light on Cercosporin production and fungal growth of Cercospora kikuchii.
A, Production of cercosporin toxin by the wild-type Cercospora kikuchii isolate MRL 6020-2B.
The fungus was grown in CM broth under continuous light or darkness for 4 to 16 days.
Cercosporin was extracted with 5 N KOH and quantified by absorbance at 480 nm. Data shown
are the means of five biological replications and error bars indicate standard deviation. Means
with the same letters were not significantly different at P < 0.05 according to Tukey’s honestly
significant difference (HSD) test. B, Fungal growth of C. kikuchii under light and dark
conditions. Mycelia were separated by vacuum filtration and dry weights were determined after
freeze drying. Data shown are the means of five biological replications and error bars indicate
standard deviation.

78
Figure 4.3. continued
4.3.3 Identification of Differentially Expressed Proteins
Six up-regulated and two down-regulated spots visible in Coomassie Brilliant Blue
stained gels were recovered and sequenced at Pennington Biomedical Research Center through a
fee-based service (Table 4.1). For the hypothetical/predicted proteins, probable function was
assigned by considering sequence homology with other species using BLASTP. The presence of
highly conserved domains was also taken into consideration using NCBI’s Conserved Domain
Database (CDD). Peptide sequences of each spot and their sequence homology identified
through database searches are summarized in Table 4.1. Peptide sequences of Spot 57 showed
high similarity to hydroxynaphthalene reductase (HNR) from Cochliobolus lunatus. Spot 34
showed homology to adenosylhomocysteinase (AHCY) from Verticillium albo-atrum. Spots 28
and 26 were identified as S-adenosylmethionine synthetase and superoxide dismutase
(mitochondrial precursor), respectively. The peptide sequences from Spots 132 and 70 showed
high homology to elongation factor 2 and 60S ribosomal protein L7, respectively.

79
Figure 4.4. Two dimensional gel electrophoresis of proteins extracted from Cercospora kikuchii
mycelia grown under light and dark conditions. Mycelial protein profiles of C. kikuchii grown in
continuous light for 6 days (A), or under continuous dark for 8 days (B). 100 µg mycelia proteins
were subjected to IEF on 18 cm 3-10 NL IPG strips followed by second dimension on 12.5%
linear SDS-PAGE, and visualization of proteins with silver staining. Differentially expressed
protein spots were indicated with open circles and spots were excised from the gels as indicated
and subjected to in-gel digestion with trypsin prior to LC-MS/MS analysis. C, Gel sub-sections
of selective protein spots up- (57 and 34) and down-regulated under light. D, Heat map showing
fold change up- and down-regulation of protein spots under light.

80
Figure 4.4 continued

81
Figure 4.4 continued
4.3.4 Cloning and Characterization of HNR and AHCY Genes
The 703 bp fragment obtained by PCR using degenerate primers HNRF and HNRR (Fig.
4.5A) showed homology to Brn1 gene coding for hydroxynaphthalene reductase from Embellisia
hyacinthi (AB120882.1) and Cochliobolus lunatus (AB288866.1). To clone the full length HNR
gene, a C. kikuchii genome library was constructed using the universal GenomeWalkerTM
kit.
Using gene specific primers and adapter primers, 1.8 kb upstream and 2.0 kb downstream
fragments were obtained. After sequencing, these 2 fragments were aligned into a 3.2 kb contig.
Sequence analysis of this contig revealed the presence of an 862-bp open reading frame with a
52-bp intron (Fig. 4.5B). A transcriptional start site (TSS) was predicted 601 bp upstream of the
ATG start codon, and the transcriptional termination site was located 143 bp downstream of the
translational stop codon (www.softberry.com). The intron had the characteristic 5′-XX/GT and
AG/XX-3′ splicing junctions commonly found in filamentous fungi and also contained an
internal lariat consensus sequences CT(A/G) A (T/C) (Radford and Parish 1997). The HNR gene
was predicted to encode a polypeptide of 269 amino acids (aa) with a predicted molecular mass
of 28.6 kDa and a predicted isoelectric point (pI) of 5.71. BlastP search (Altschul et al. 1997) of
82
Table 4.1. Identification of differentially expressed protein spots from Cercospora kikuchii
grown under continuous light and dark through peptide sequencing using tandem mass
spectrometry (MS/MS). Spot Top Hit Organism NCBI accession
number
pIw
MW
(kDa)x
E-
value
Peptide Sequence
57 Hydroxynaphthalene
reductase
Cochliobolus
lunatus
AF419330.1 7.0 31 1e-95 VVVNYANSz
DVTEEFDRz
LGSDAz
LVSAEGEWLNGKz
34 Adenosylhomocystei
nase
Verticillium
albo-atrum
XP_003009749.1 5.6 17 1e-07 KIAVVAGFGDVGKGy
KHIILLAEGRLy
HLLLLAEGRz
28 Predicted protein (S-
adenosylmethionine
synthetase)
Mycosphaerell
a graminicola
EGP86389.1 5.0 17 9e-16 VACETATKTGMVMVFGEITTKSy
EALKDLGYDDSALz
26 Hypothetical protein
(superoxide
dismutase,
mitochondrial
precursor)
Mycosphaerell
a graminicola
EGP88469.1 5.5 24 1e-17 KETMEIHYTKHy
KHHQTYVNNLNNLIKGy
132* Hypothetical protein
(similar to
Elongation factor 2)
Botryotinia
fuckeliana
XP_001551461.1 6.3 33 6e-14 RILADNHGWDVTDARKy
KAVQYLNEIKDy
REGPIGEEPMRSy
REGPIGEEPMRSy
KDSVVSGFQWATKEy
KAYLPVNESFGFNGELRQy
RKIFAFGPDTNGANLLVDQTKAy
70* Similar to 60S
ribosomal protein L7
Leptosphaeria
maculans
CBY00501.1 8.3 31 5e-13 KHFIEGGDLGNREy
KQASNFLWPFKLy
RLLQINNGVFIRVy
KIVEPFVAYGYPNLKSy
*: Indicates spots that were down-regulated under continuous light; the spots were up-regulated
under continuous light w: Experimental pI
x: Experimental MW
y: Peptides identified using MASCOT
z: Peptides identified using PEAKS

83
the National Center for Biotechnology Information (NCBI) protein database revealed that the
predicted 269-aa translation product of HNR had high similarity to a hypothetical protein from
Mycosphaerella graminicola (overall 88% identity, 94% similarity), an ESC reductase from
Elsinoe fawcetti (overall 84% identity, 92% similarity), and a hydroxynaphthalene reductase
from several fungi (maximum overall 78% identity, 87% similarity) (Fig. 4.5C). Analysis of the
predicted translational product of the C. kikuchii HNR gene revealed the presence of a
tetrahydroxynaphthalene/trihydroxynaphthalene reductase-like classical (c) SDR domain, 3-
ketoacyl-(acyl-carrier-protein) reductase domain, and a NADP binding site (Rossmann
superfamily).
Figure 4.5. Cloning and characterization of the hydroxynaphthalene reductase (HNR) gene from
Cercospora kikuchii. A, PCR amplification of HNR coding region from C. kikchii gDNA using
degenerate primers HNRF and HNRR (see Materials and Methods). A specific PCR product was
amplified only in the presence of both HNRF and HNRR primers and the template (lane 1). No
specific amplifications was visible when PCR with only one primer (HNRF only, lane 2; HNRR
only, lane 3) or without template (lane 4). B, Schematic diagram of strategy to clone the full
length HNR gene using genome walking. Note: drawing is not to scale. C, Multiple sequence
alignment of HNR protein to hydroxynaphthalene reductase from Cochliobolus lunatus (gi
23451229), Brn1 from Cochliobolus heterostrophus (gi 2760604), 1,3,8-trihydroxynaphthalene
reductase from Alternaria alternata (gi 4115722), 1,3,8-trihydroxynaphthalene reductase from
Setosphaeria turcica (gi 188039929), a hypothetical protein from Mycosphaerella graminicola
(gi 339468210), and an ESC reductase (RDT1) from Elsinoe fawcettii (gi 166865159).
Conserved amino acid residues across all sequences were shaded in black.
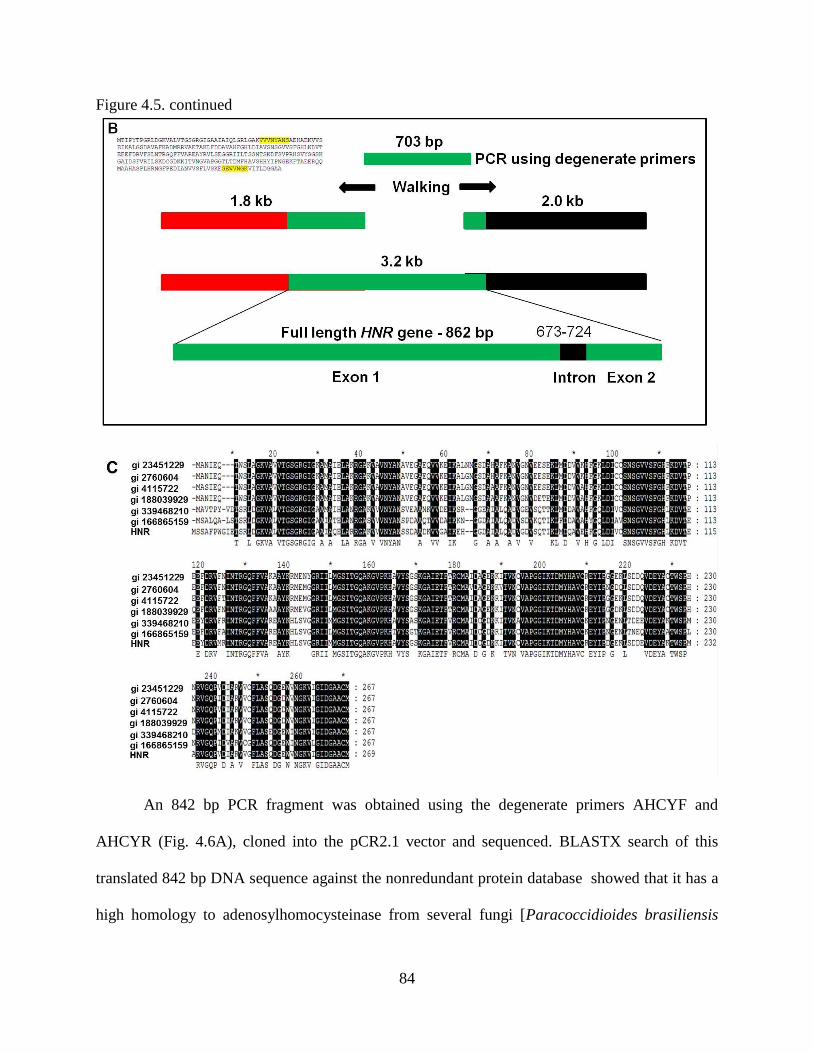
84
Figure 4.5. continued
An 842 bp PCR fragment was obtained using the degenerate primers AHCYF and
AHCYR (Fig. 4.6A), cloned into the pCR2.1 vector and sequenced. BLASTX search of this
translated 842 bp DNA sequence against the nonredundant protein database showed that it has a
high homology to adenosylhomocysteinase from several fungi [Paracoccidioides brasiliensis

85
(EEH21092.1), Ajellomyces capsulatus (EEH07964.1), Coccidioides posadasii
(XP_003072218.1)]. To clone the full length AHCY gene, genome libraries were constructed
using the universal GenomeWalkerTM
kit. Using gene specific primers and adapter primers, a 2.0
kb and a 5.0 kb fragments were amplified for the up- and down-stream of AHCY, respectively.
After sequencing, these fragments were aligned into a 3.7 kb contig. Sequence analysis of this
contig revealed the presence of a 1562 bp ORF with two introns (47 and 69 bp) (Fig. 4.6B). The
transcriptional start site (TSS) was predicted 545 bp upstream of the ATG start codon, and the
transcriptional termination site was located 18 bp downstream of the translational stop codon
(www.softberry.com). The AHCY gene was predicted to encode a polypeptide of 481 aa with a
predicted molecular mass of 52.2 kDa and a predicted pI of 6.12. BlastP search (Altschul et al.
1997) of the NCBI protein database revealed that the predicted 481 aa translation product of
AHCY had high similarity to a hypothetical protein from Mycosphaerella graminicola (overall
79% identity, 85% similarity) and Pyrenophora teres f. teres (overall 71% identity, 77%
similarity), and adenosylhomocysteinase from several fungi (maximum overall 72% identity,
78% similarity) (Fig. 4.6C). Analysis of the predicted protein sequence of the C. kikuchii AHCY
gene revealed the presence of a S-adenosyl-L-homocysteine hydrolase (AdoHycase) domain, and
a NADP binding site (Rossmann superfamily).
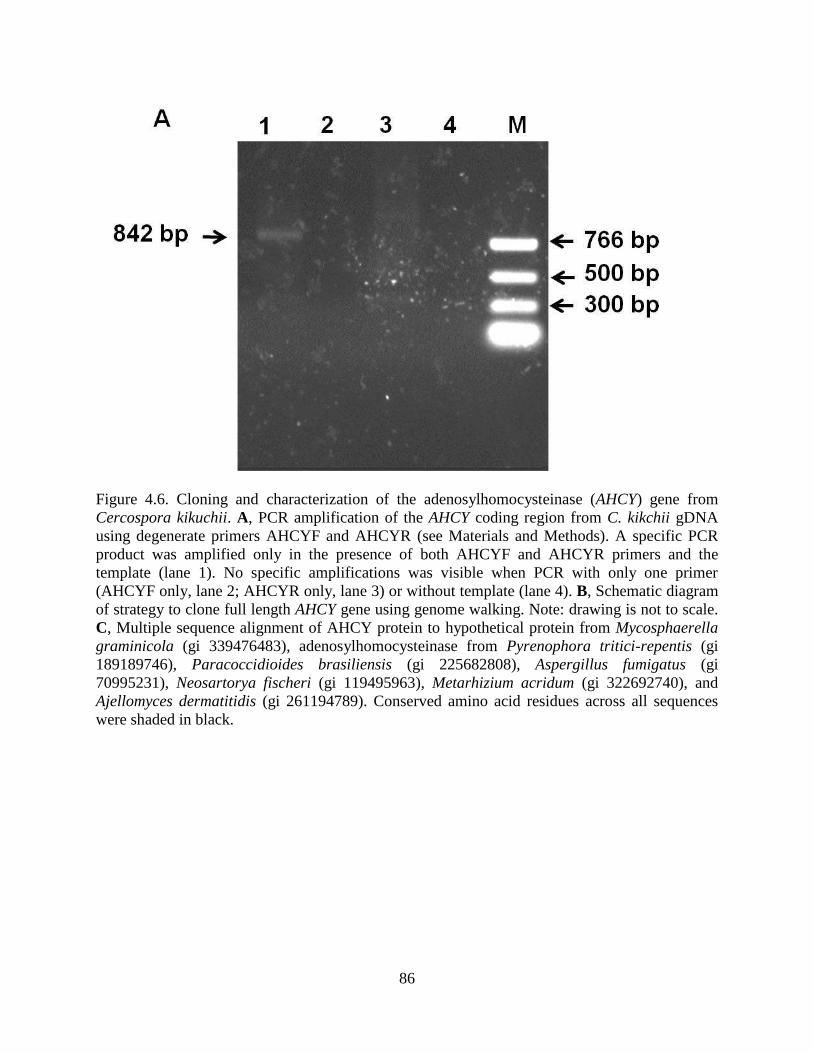
86
Figure 4.6. Cloning and characterization of the adenosylhomocysteinase (AHCY) gene from
Cercospora kikuchii. A, PCR amplification of the AHCY coding region from C. kikchii gDNA
using degenerate primers AHCYF and AHCYR (see Materials and Methods). A specific PCR
product was amplified only in the presence of both AHCYF and AHCYR primers and the
template (lane 1). No specific amplifications was visible when PCR with only one primer
(AHCYF only, lane 2; AHCYR only, lane 3) or without template (lane 4). B, Schematic diagram
of strategy to clone full length AHCY gene using genome walking. Note: drawing is not to scale.
C, Multiple sequence alignment of AHCY protein to hypothetical protein from Mycosphaerella
graminicola (gi 339476483), adenosylhomocysteinase from Pyrenophora tritici-repentis (gi
189189746), Paracoccidioides brasiliensis (gi 225682808), Aspergillus fumigatus (gi
70995231), Neosartorya fischeri (gi 119495963), Metarhizium acridum (gi 322692740), and
Ajellomyces dermatitidis (gi 261194789). Conserved amino acid residues across all sequences
were shaded in black.

87
Figure 4.6. continued
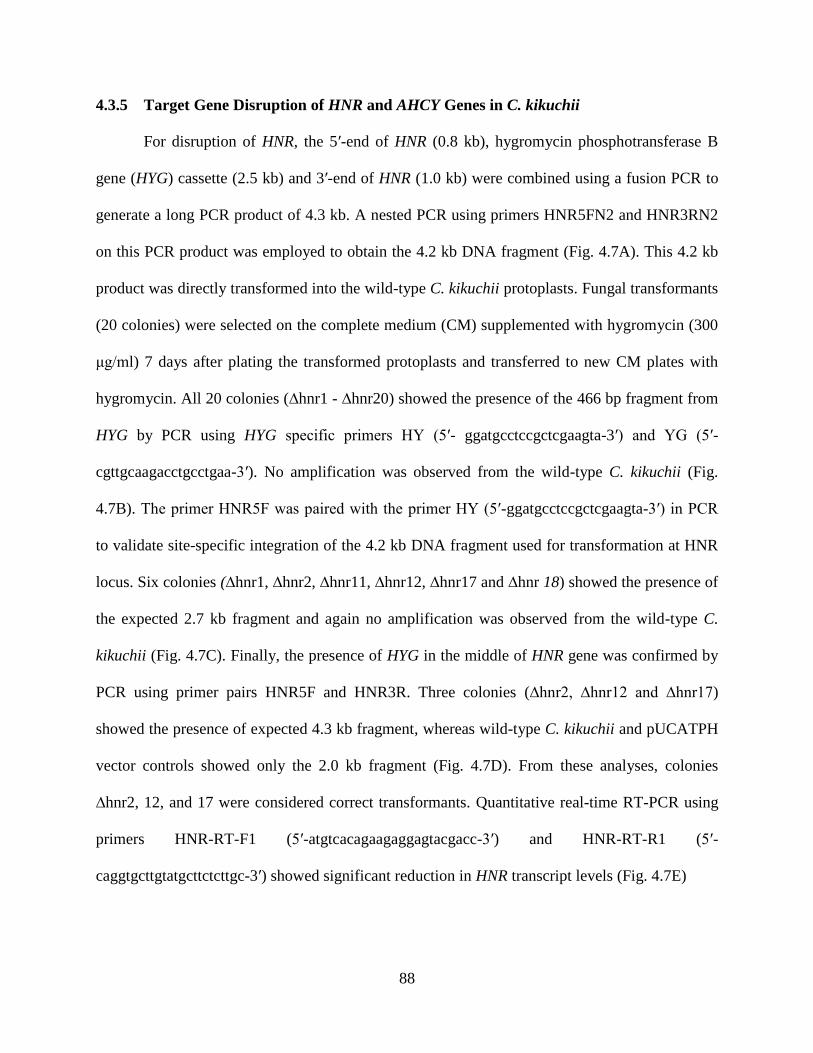
88
4.3.5 Target Gene Disruption of HNR and AHCY Genes in C. kikuchii
For disruption of HNR, the 5′-end of HNR (0.8 kb), hygromycin phosphotransferase B
gene (HYG) cassette (2.5 kb) and 3′-end of HNR (1.0 kb) were combined using a fusion PCR to
generate a long PCR product of 4.3 kb. A nested PCR using primers HNR5FN2 and HNR3RN2
on this PCR product was employed to obtain the 4.2 kb DNA fragment (Fig. 4.7A). This 4.2 kb
product was directly transformed into the wild-type C. kikuchii protoplasts. Fungal transformants
(20 colonies) were selected on the complete medium (CM) supplemented with hygromycin (300
μg/ml) 7 days after plating the transformed protoplasts and transferred to new CM plates with
hygromycin. All 20 colonies (∆hnr1 - ∆hnr20) showed the presence of the 466 bp fragment from
HYG by PCR using HYG specific primers HY (5′- ggatgcctccgctcgaagta-3′) and YG (5′-
cgttgcaagacctgcctgaa-3′). No amplification was observed from the wild-type C. kikuchii (Fig.
4.7B). The primer HNR5F was paired with the primer HY (5′-ggatgcctccgctcgaagta-3′) in PCR
to validate site-specific integration of the 4.2 kb DNA fragment used for transformation at HNR
locus. Six colonies (∆hnr1, ∆hnr2, ∆hnr11, ∆hnr12, ∆hnr17 and ∆hnr 18) showed the presence of
the expected 2.7 kb fragment and again no amplification was observed from the wild-type C.
kikuchii (Fig. 4.7C). Finally, the presence of HYG in the middle of HNR gene was confirmed by
PCR using primer pairs HNR5F and HNR3R. Three colonies (∆hnr2, ∆hnr12 and ∆hnr17)
showed the presence of expected 4.3 kb fragment, whereas wild-type C. kikuchii and pUCATPH
vector controls showed only the 2.0 kb fragment (Fig. 4.7D). From these analyses, colonies
∆hnr2, 12, and 17 were considered correct transformants. Quantitative real-time RT-PCR using
primers HNR-RT-F1 (5′-atgtcacagaagaggagtacgacc-3′) and HNR-RT-R1 (5′-
caggtgcttgtatgcttctcttgc-3′) showed significant reduction in HNR transcript levels (Fig. 4.7E)
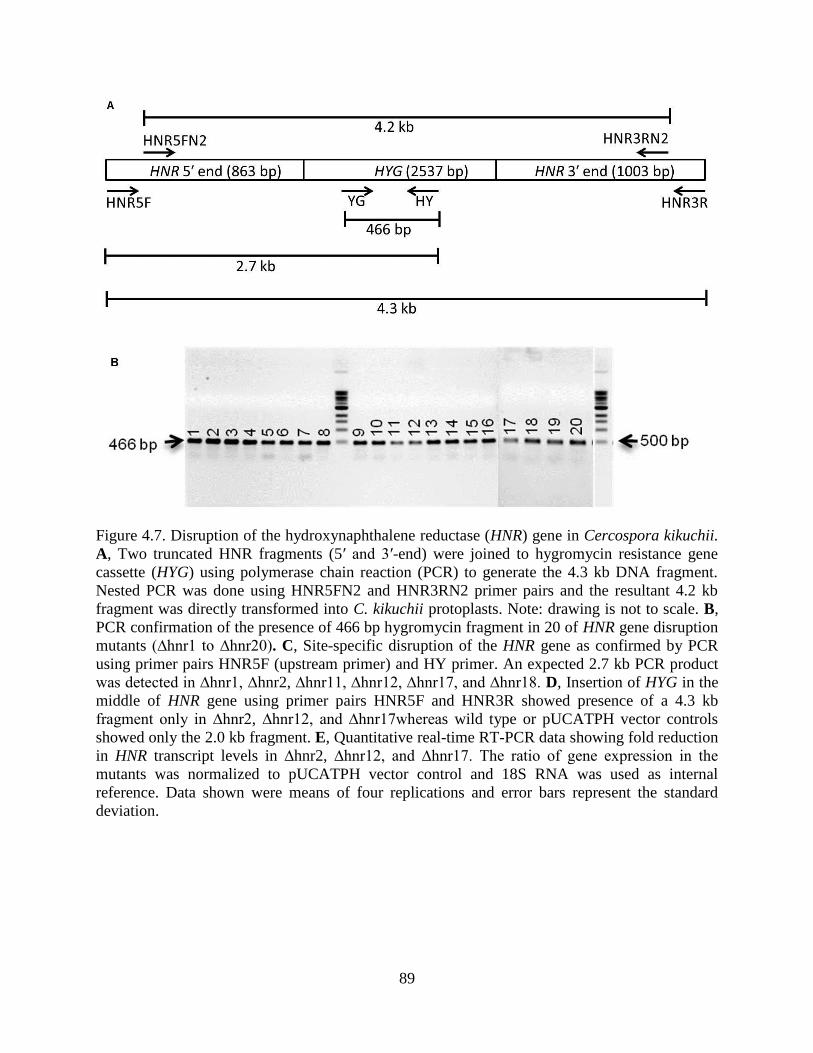
89
Figure 4.7. Disruption of the hydroxynaphthalene reductase (HNR) gene in Cercospora kikuchii.
A, Two truncated HNR fragments (5′ and 3′-end) were joined to hygromycin resistance gene
cassette (HYG) using polymerase chain reaction (PCR) to generate the 4.3 kb DNA fragment.
Nested PCR was done using HNR5FN2 and HNR3RN2 primer pairs and the resultant 4.2 kb
fragment was directly transformed into C. kikuchii protoplasts. Note: drawing is not to scale. B,
PCR confirmation of the presence of 466 bp hygromycin fragment in 20 of HNR gene disruption
mutants (∆hnr1 to ∆hnr20). C, Site-specific disruption of the HNR gene as confirmed by PCR
using primer pairs HNR5F (upstream primer) and HY primer. An expected 2.7 kb PCR product
was detected in ∆hnr1, ∆hnr2, ∆hnr11, ∆hnr12, ∆hnr17, and ∆hnr18. D, Insertion of HYG in the
middle of HNR gene using primer pairs HNR5F and HNR3R showed presence of a 4.3 kb
fragment only in ∆hnr2, ∆hnr12, and ∆hnr17whereas wild type or pUCATPH vector controls
showed only the 2.0 kb fragment. E, Quantitative real-time RT-PCR data showing fold reduction
in HNR transcript levels in ∆hnr2, ∆hnr12, and ∆hnr17. The ratio of gene expression in the
mutants was normalized to pUCATPH vector control and 18S RNA was used as internal
reference. Data shown were means of four replications and error bars represent the standard
deviation.

90
Figure 4.7. continued
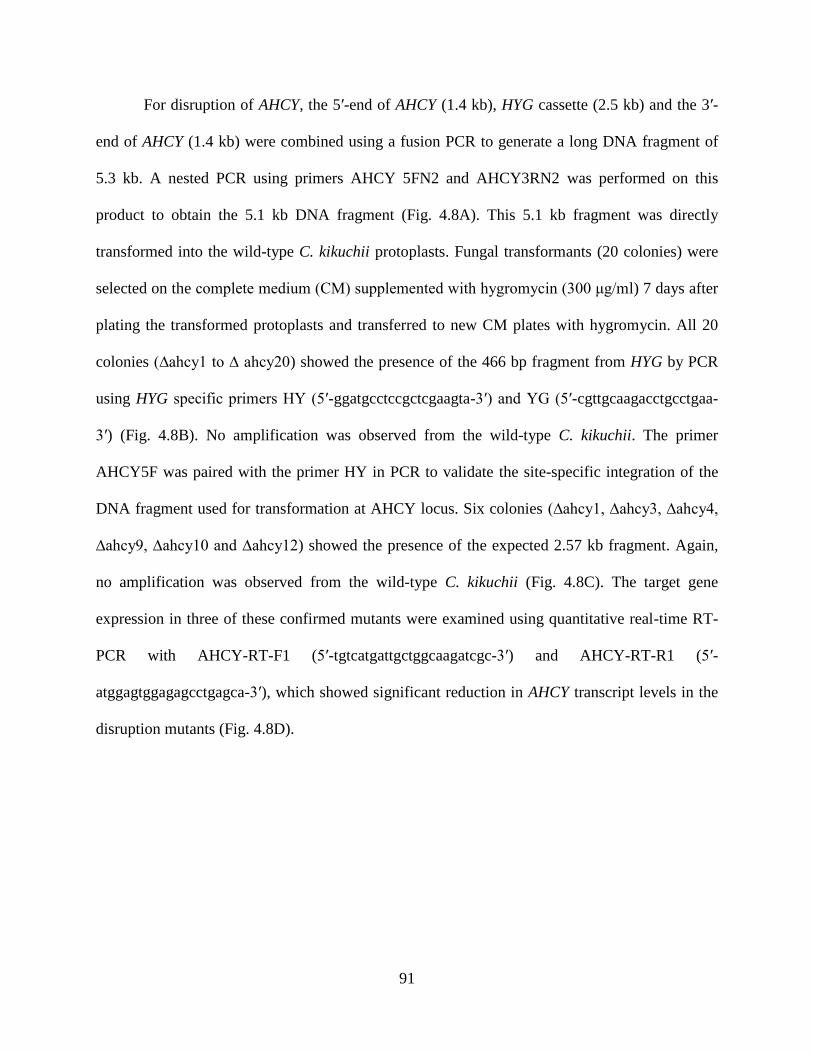
91
For disruption of AHCY, the 5′-end of AHCY (1.4 kb), HYG cassette (2.5 kb) and the 3′-
end of AHCY (1.4 kb) were combined using a fusion PCR to generate a long DNA fragment of
5.3 kb. A nested PCR using primers AHCY 5FN2 and AHCY3RN2 was performed on this
product to obtain the 5.1 kb DNA fragment (Fig. 4.8A). This 5.1 kb fragment was directly
transformed into the wild-type C. kikuchii protoplasts. Fungal transformants (20 colonies) were
selected on the complete medium (CM) supplemented with hygromycin (300 μg/ml) 7 days after
plating the transformed protoplasts and transferred to new CM plates with hygromycin. All 20
colonies (∆ahcy1 to ∆ ahcy20) showed the presence of the 466 bp fragment from HYG by PCR
using HYG specific primers HY (5′-ggatgcctccgctcgaagta-3′) and YG (5′-cgttgcaagacctgcctgaa-
3′) (Fig. 4.8B). No amplification was observed from the wild-type C. kikuchii. The primer
AHCY5F was paired with the primer HY in PCR to validate the site-specific integration of the
DNA fragment used for transformation at AHCY locus. Six colonies (∆ahcy1, ∆ahcy3, ∆ahcy4,
∆ahcy9, ∆ahcy10 and ∆ahcy12) showed the presence of the expected 2.57 kb fragment. Again,
no amplification was observed from the wild-type C. kikuchii (Fig. 4.8C). The target gene
expression in three of these confirmed mutants were examined using quantitative real-time RT-
PCR with AHCY-RT-F1 (5′-tgtcatgattgctggcaagatcgc-3′) and AHCY-RT-R1 (5′-
atggagtggagagcctgagca-3′), which showed significant reduction in AHCY transcript levels in the
disruption mutants (Fig. 4.8D).

92
Figure 4.8. Disruption of adenosylhomocysteinase (AHCY) gene in Cercospora kikuchii. A, Two
truncated AHCY fragments (5′ and 3′-end) were joined to the hygromycin resistance gene
cassette (HYG) using polymerase chain reaction (PCR) as described in text to generate the 5.3 kb
DNA fragment. A nested PCR was conducted using AHCY5FN2 and AHCY3RN2 primer pairs
and the resultant 5.1 kb fragment was directly transformed into C. kikuchii protoplasts. Note:
drawing is not to scale. B, PCR confirmation of the presence of 466 bp hygromycin fragment in
20 AHCY gene disruption mutants (∆ahcy1 to ∆ahcy20). C, Site-specific disruption of the AHCY
gene as confirmed by PCR using primer pairs AHCY5F (upstream primer) and HY primer,
which showed presence of a 2.57 kb fragment in ∆ahcy1, ∆ahcy3, ∆ahcy4, ∆ahcy9, ∆ahcy10,
and ∆ahcy12. D, Quantitative real-time RT-PCR data showing fold reduction in AHCY transcript
levels in ∆ahcy1, ∆ahcy3, and ∆ahcy4. The ratio of gene expression in the mutants was
normalized to pUCATPH vector control and 18S RNA was used as internal reference. Data
shown were means of four replications and error bars represent the standard deviation.

93
Figure 4.8. continued
4.3.6 Detection and Quantification of Cercosporin
Cercosporin production in the hnr and ahcy disruption mutants was measured and
compared to that of pUCATPH vector transformed control by growing the fungal strains on CM
plates amended with hygromycin (300 μg/ml). Mycelial plugs were extracted with 5N KOH and
the amounts of cercosporin in the extract quantified by measuring the absorbance of the extract
at 480 nm (Jenns et al. 1989). Both hnr and ahcy disruption mutants produced significantly lower
levels of cercosporin compared to vector transformed control (Fig. 4.9A and B). There was no

94
significant difference in cercosporin levels among the three hnr or ahcy disruption mutants. The
secretion of cercosporin into the media underneath was not affected in hnr or ahcy disruption
mutants. Apart from lower cercosporin production, no other phenotypic characteristics were
observed among the hnr and ahcy disruption mutants compared to the vector control or the wild-
type. All hnr and ahcy disruption mutants exhibited normal growth on CM. In addition, when
tested for sensitivity to exogenously applied cercosporin, all mutants retained normal growth
similar to the vector control (data not shown).
4.3.7 Pathogenicity Assay on Soybeans
Three hnr disruption mutants (∆hnr2, ∆hnr12, and ∆hnr17), three ahcy disruption mutants
(∆ahcy1, ∆ahcy3, and ∆ahcy4), and vector-transformed control were compared to wild-type C.
kikuchii for pathogenicity on soybeans using two methods. In the detached leaf assay, severe
necrosis and chlorosis of the entire leaf was observed 14 days after inoculation with wild-type or
vector-transformed C. kikuchii controls. However, neither hnr nor ahcy disruption mutants were
able to cause severe chlorosis and necrosis with the exception of ∆hnr17 and ∆ahcy3, in which
mild necrosis was observed at the site of attachment of mycelial plugs (Fig. 4.10). Lactophenol
blue staining revealed the mycelia of hnr and ahcy disruption mutants were able to spread
throughout the leaf (data not shown) but unable to cause chlorosis and necrosis. In the second
method, mycelia from the above fungal strains were directly inoculated on soybean plants at the
first flower stage in the greenhouse. Fourteen days after inoculation, small necrotic lesions were
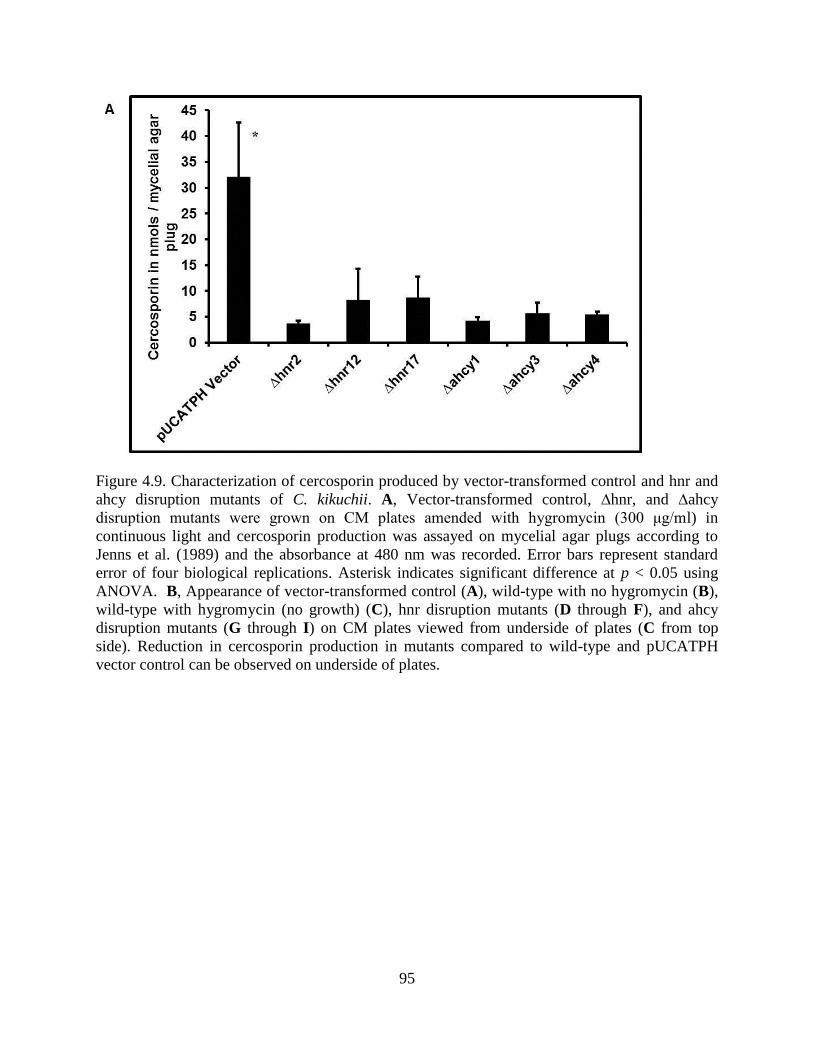
95
Figure 4.9. Characterization of cercosporin produced by vector-transformed control and hnr and
ahcy disruption mutants of C. kikuchii. A, Vector-transformed control, ∆hnr, and ∆ahcy
disruption mutants were grown on CM plates amended with hygromycin (300 μg/ml) in
continuous light and cercosporin production was assayed on mycelial agar plugs according to
Jenns et al. (1989) and the absorbance at 480 nm was recorded. Error bars represent standard
error of four biological replications. Asterisk indicates significant difference at p < 0.05 using
ANOVA. B, Appearance of vector-transformed control (A), wild-type with no hygromycin (B),
wild-type with hygromycin (no growth) (C), hnr disruption mutants (D through F), and ahcy
disruption mutants (G through I) on CM plates viewed from underside of plates (C from top
side). Reduction in cercosporin production in mutants compared to wild-type and pUCATPH
vector control can be observed on underside of plates.
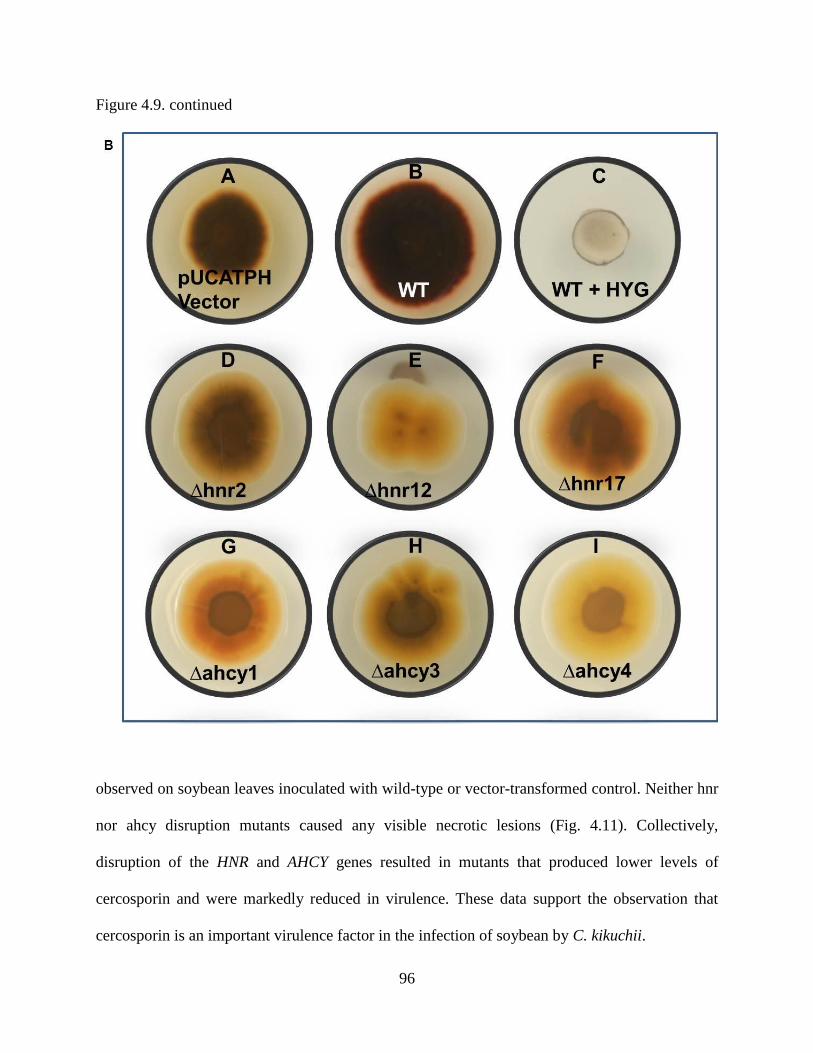
96
Figure 4.9. continued
observed on soybean leaves inoculated with wild-type or vector-transformed control. Neither hnr
nor ahcy disruption mutants caused any visible necrotic lesions (Fig. 4.11). Collectively,
disruption of the HNR and AHCY genes resulted in mutants that produced lower levels of
cercosporin and were markedly reduced in virulence. These data support the observation that
cercosporin is an important virulence factor in the infection of soybean by C. kikuchii.

97
4.4 Discussion
Cercosporin accumulation by different Cercospora species in vitro is highly variable and
dependent on light, temperature, media type, pH, and C:N ratio of the media and also the
complex interaction of the above factors. For the C. kikuchii isolate used in this study, CM
Figure 4.10. Pathogenicity assay of ∆hnr and ∆ahcy mutants on detached soybean leaves
harvested at R1 growth stage from cv. ASGROW 6202. Three 3 mm diameter mycelial agar
plugs were excised from 7 day-old cultures grown on CM plates and directly placed on the
detached soybean leaves with mycelia side touching the adaxial surface of leaves in a Petri plate.
Plates were kept under 16 h light and 8 h dark at 25 ºC for 2 weeks and observed for symptoms.
Severe necrosis and chlorosis was observed in leaves treated with wild type C. kikuchii (A) or C.
kikuchii transformed with pUCATPH vector (B) compared to very minimal symptoms in leaves
treated with C. kikuchii ∆hnr (C through E) or ∆ahcy (F through H) mutants.
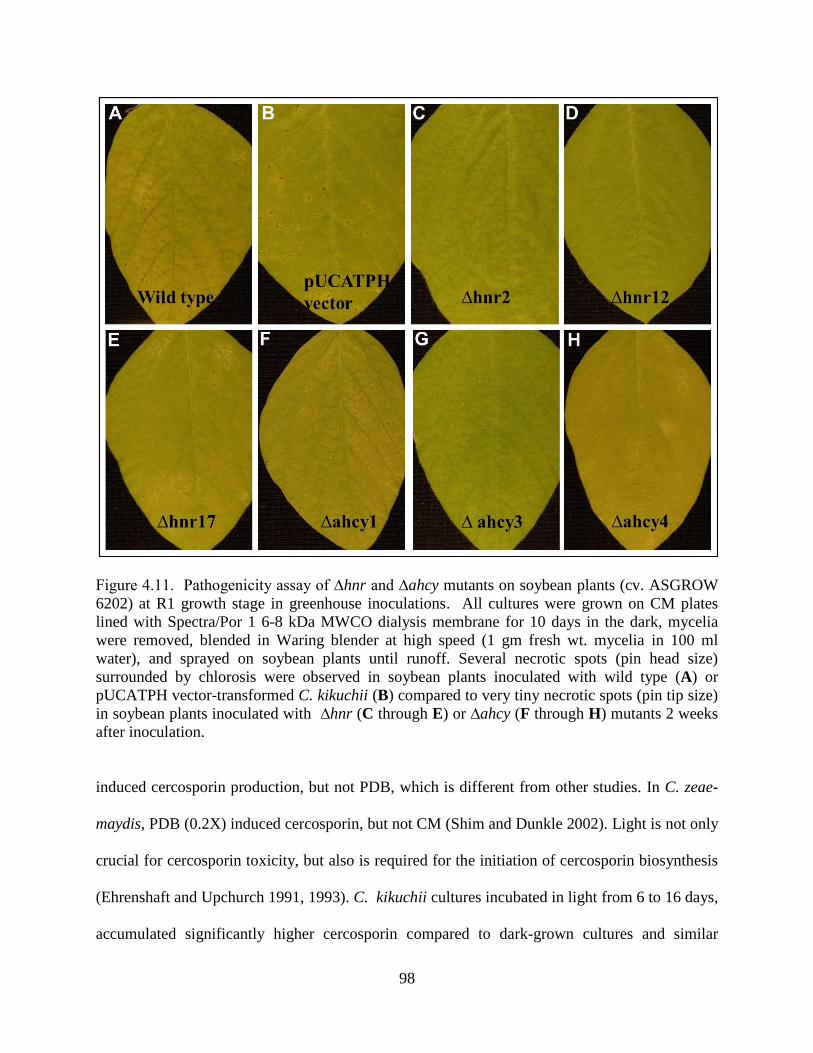
98
Figure 4.11. Pathogenicity assay of ∆hnr and ∆ahcy mutants on soybean plants (cv. ASGROW
6202) at R1 growth stage in greenhouse inoculations. All cultures were grown on CM plates
lined with Spectra/Por 1 6-8 kDa MWCO dialysis membrane for 10 days in the dark, mycelia
were removed, blended in Waring blender at high speed (1 gm fresh wt. mycelia in 100 ml
water), and sprayed on soybean plants until runoff. Several necrotic spots (pin head size)
surrounded by chlorosis were observed in soybean plants inoculated with wild type (A) or
pUCATPH vector-transformed C. kikuchii (B) compared to very tiny necrotic spots (pin tip size)
in soybean plants inoculated with ∆hnr (C through E) or ∆ahcy (F through H) mutants 2 weeks
after inoculation.
induced cercosporin production, but not PDB, which is different from other studies. In C. zeae-
maydis, PDB (0.2X) induced cercosporin, but not CM (Shim and Dunkle 2002). Light is not only
crucial for cercosporin toxicity, but also is required for the initiation of cercosporin biosynthesis
(Ehrenshaft and Upchurch 1991, 1993). C. kikuchii cultures incubated in light from 6 to 16 days,
accumulated significantly higher cercosporin compared to dark-grown cultures and similar
99
results were reported in C. kikuchii, C. beticola and C. riciniella (Balis and Payne 1971; Fajola
1978; Lynch and Geoghegan 1979; Rollins et al. 1993).
Before performing 2D experiments, several protein extraction methods, such as the
TCA/acetone (Damerval et al. 1986), Tri-HCl (Chen et al. 2006) and phenol-methanol (Hurkman
and Tanaka 1986) methods as well as the methods specifically developed for filamentous fungi
(Fernandez-Acero et al. 2006; Fragner et al. 2009) were compared for extracting proteins from
C. kikuchii mycelia. The phenol-methanol method was selected for use as it had greater protein
yield and well resolved proteins on 2D gels. This method was also followed to extract proteins
from plant samples and shown to be very efficient (Carpentier et al. 2005; Park et al. unpublished
data; Saravan and Rose 2004). Phenol extraction followed by methanolic precipitation eliminates
nucleic acids, membrane lipids, and cell wall fragments that might interfere with downstream
protein solubility and electrophoresis (Saravan and Rose 2004). The 3-10 NL pH gradient IPG
strips proteins produced very well resolved profiles of about 1100 ± 55 proteins using silver
staining.
Rollins et al. (1993) compared the 2D protein profiles of extracted proteins and in vitro
translated products (from poly A+ RNAs) from wild-type and mutant C. kikuchii isolates and
found some proteins up-regulated under light, but they did not sequence any protein spots for
further identification. In this study, six protein spots were found up-regulated and two were
down-regulated in C. kikuchii cultures grown under light compared to dark conditions. These six
up-regulated spots (spots 57, 34, 28, 26, 32, and 129) and two down-regulated spots (spots 132
and 70) in light were recovered from Coomassie stained gels, sequenced using LC-MS/MS. Six
of them were identified (Table 1) based on peptide sequence homology analysis. Spot 57 showed
homology to 1,3,8-trihydroxynaphthalene reductase (3HNR) gene from Cochliobolus lunatus

100
(Rižner and Wheeler 2003) and RDT1 gene from Elsinoё fawcettii, (Chung and Liao 2008).
3HNR codes for a reductase that is involved in 1,8-dihydroxynaphthalene (DHN)-melanin
biosynthetic pathway by reducing 1,3,8-trihydroxynaphthalene to vermelone in fungal cells.
RDT1 encodes a putative polypeptide similar to a wide range of reductases, with strong
similarity to the 1,3,8-trihydroxynaphthalene reductase (Chung and Liao 2008). It is located
upstream of TSF1 gene, a transcriptional factor that regulates the biosynthesis of elsinochrome
phytotoxin in E. fawcettii (Chung and Liao 2008), a photosensitizing compound that shares
structural similarity to cercosporin (Weiss et al. 1987). Targeted disruption of the HNR gene
resulted in a significant reduction in cercosporin accumulation by hnr disruption mutants. This
suggests that HNR either is involved in the regulation of cercosporin biosynthesis or is one of the
key homologs that function in the cercosporin biosynthetic pathway. Presence of RDT1 upstream
of TSF1 in E. fawcetti also suggests that melanin biosynthesis may be related to elsinochrome
biosynthesis. Melanin is the key pigment produced by many fungi to protect the spores and
mycelia from harmful UV radiation (Bell and Wheeler 1986; Kawamura et al. 1999; Wheeler
and Bell 1988) as well as damage caused by reactive oxygen species (ROS), such as singlet
oxygen and super oxide radicals (Herrling et al. 2008; Tada et al. 2010). Because the main mode
of action of cellular damage caused by cercosporin is through the production of ROS (Daub and
Ehrenshaft 1997), C. kikuchii might have its own melanin biosynthesis linked to cercosporin
biosynthesis. This is supported by the observation that HNR was up-regulated in cultures grown
in continuous light, which is favorable for cercosporin production. Melanin is also important for
virulence of pathogenic fungi on plants (Chumley and Valent 1990; Howard and Valent 1996;
Kawamura et al. 1997; Takano et al. 1995).
101
Spots 34 and 28 were also up-regulated in light and showed homology to enzymes
involved in cysteine and methionine metabolism. Spot 34 showed homology (72%) to
adenosylhomocysteinase (AHCY) from several fungi. AHCY converts S-adenosylhomocysteine
to homocysteine, which can be used to regenerate methionine or to form cysteine (Palmer and
Abeles 1979) in amino acid metabolism. AHCY was also identified in the proteomics studies of
extra-radical phase of arbuscular mycorrhiza (Recorbet et al. 2009) and haustoria of the the
barley pathogen Blumeria graminis f.sp. hordei (Godfrey et al. 2009). Spot 28 showed homology
(83%) to S-adenosyl methionine synthetase (SAM synthetase). SAM synthetase catalyzes the
formation of SAM from methionine, which is involved in transferring methyl groups in many
metabolic processes (Peleman et al. 1989). A proposed cercosporin biosynthesis pathway in C.
nicotianae (Chen et al. 2007b) indicated the involvement of SAM, CTB2, and CTB3 gene
products in the formation of pentaketomethylene, which upon dimerization forms cercosporin.
SAM synthetase and AHCY proteins that are up-regulated in light might be associated with this
step during cercosporin biosynthesis. However, ahcy disruption mutants did not completely
abolish cercosporin production indicating that there may be more than one methyl donor
involved in that particular step.
Spot 26 showed a high homology to superoxide dismutase, which causes dismutation of
superoxide radicals (O2·- + O2·
- + 2H
+ → O2 + H2O2) (McCord and Fridovich 1969). In the
presence of light, cercosporin gets activated, reaches a triplet state that reacts with molecular
oxygen, resulting in the formation of singlet oxygen and superoxide radicals collectively known
as ROS. ROS cause damage to membrane lipids and also other cellular components ultimately
leading to cell death (Daub and Briggs 1983). As C. kikuchii grown under light accumulated
higher cercosporin compared to dark-grown cultures, it is reasonable to expect that superoxide
102
dismutase also expressed at higher levels in light to protect fungal cells from the damage caused
by ROS. We were unable to identify spots 32 and 129 as the mass spectrometry was not
successful. Elongation factor 2 (spot 132) and 60S ribosmal protein L7 (spot 70), which are
involved in protein metabolism, were down-regulated under light. This is in accordance with the
observation that the C. kikuchii grown under dark had more mycelial growth compared to light.
Cercosporin is known to be a crucial pathogenicity factor in C. kikuchii (Upchurch et al.
1991), C. nicotianae (Choquer et al. 2005), and C. zeae-maydis (Shim and Dunkle 2003) and
mutants deficient in cercosporin biosynthesis caused reduced or no disease. Both hnr and ahcy
gene disruption mutants in C. kikuchii resulted in significantly lower production of cercosporin
compared to the vector-transformed control and produced minimal or no chlorosis and necrosis
on soybean leaves in both detached leaf assay (Fig. 4.10) and greenhouse inoculation
experiments (Fig. 4.11). However, growth of the mutants in inoculated leaves as visualized
through lactophenol blue staining was comparable to the wild type (data not shown). Slight
necrosis at the site of inoculation in the detached leaf assay with disruption mutants ∆hnr17 and
∆ahcy3 might be caused by damage from cercosporin present in the agar block.
Since hnr and ahcy gene disruption mutants were not completely deficient in cercosporin
production, the possibility of involvement of these genes in conferring resistance to exogenously
applied cercosporin also was tested. In a preliminary experiment, when vector-transformed
control and hnr and ahcy gene disruption mutants were grown on CM plates in the presence of
10 μM cercosporin, no visual difference in fungal growth was observed between the mutants and
the wild-type, indicating that the mutants were not sensitive to exogenously applied cercosporin
(data not shown). One possible explanation for this observation is that the mutants are still
103
producing lower amounts of cercosporin, and the cercosporin self-protection mechanism is still
operational under these conditions.
Various strategies were employed to identify genes involved in or regulating cercosporin
biosynthesis in different Cercospora species. Ehrenshaft and Upchurch (1991) isolated six light
enhanced cDNAs by using suppressive subtractive hybridization (SSH) in C. kikuchii and one
cDNA was characterized as the CFP gene (coding for cercosporin facilitator protein) by
Callahan et al. (1999). Shim and Dunkle (2002) also used SSH in C. zeae-maydis and identified
several genes up-regulated under cercosporin-producing conditions and characterized a MAP
kinase kinase kinase (CZK3) involved in cercosporin biosynthesis (Shim and Dunkle 2003).
Chung et al. (2003c) used restriction enzyme-mediated integration (REMI) mutagenesis in C.
nicotianae and identified a polyketide synthase gene (CTB1) involved in cercosporin
biosynthesis and further sequencing of upstream and downstream region of CTB1 revealed the
presence of a gene cluster with CTB1 through CTB8 genes that code for various enzymes such as
polyketide synthase, oxidoreductases, major facilitator proteins for cercosporin export and also
identified four ORFs surrounding the gene clusters for which no putative function could be
assigned (Chen et al. 2007a; Chen et al. 2007b; Choquer et al. 2007; Dekkers et al. 2007). The
proteomics approach used in this study identified several up- and down-regulated proteins in C.
kikuchii under light. HNR and AHCY genes characterized in this study were not identified in
earlier studies, indicating that proteomics can be used as a complementary approach to other
approaches like SSH and REMI to identify additional genes related to cercosporin biosynthesis.
Further studies indicate that cercosporin biosynthesis is influenced by various factors and
is regulated in a very complex manner (Chen et al. 2007b). The general mode of action of
cercosporin with the generation of ROS is essential for successful pathogenicity of Cercospora

104
fungi that produce cercosporin. But, some Cercospora species, such as C. sojina (frog eye leaf
spot pathogen of soybeans) do not produce cercosporin and yet it is pathogenic. This suggests the
involvement of additional factors in pathogenicity. The HNR and AHCY genes identified in this
study are either involved in regulating cercosporin biosynthesis or part of redundant structural
genes involved in cercosporin biosynthesis. Since hnr and ahcy disruption mutants are still
producing small amount of cercosporin, further studies are necessary to better understand how
HNR and AHCY genes are interacting with other genes by comparing protein profiles from wild-
type, hnr, and ahcy gene disruption mutants and identify differentially expressed proteins.

105
CHAPTER 5: IDENTIFICATION OF SECRETED PROTEINS FROM
CERCOSPORA KIKCUHII
5.1 Introduction
Many plant pathogenic fungi secrete a large number of degradative enzymes and other
proteins, which have diverse functions in colonization, nutrient acquisition, and ecological
interactions (de Vries 2003; Freimoser et al. 2003; Walton 1994). Many extracellular enzymes
such as polygalacturonase, pectate lyase, xylanase, and lipase, have been shown or proposed to
be required for virulence in plant pathogenic fungi (Brito et al. 2006; Deising et al. 1992; Isshiki
et al. 2001; Oeser et al. 2002; ten Have et al. 1998; Voigt et al. 2005; Yakoby et al. 2001).
Several proteomics studies have been conducted on plant pathogenic fungi to understand the
nature of secreted proteins (Cao et al. 2009; Liang et al. 2010; Lim et al. 2001; Yajima and Kav
2006). The secretome of Aspergillus flavus and A. parasiticus in response to different growth
media containing rutin, glucose and potato dextrose was examined (Medina et al. 2004, 2005). A
high number of secreted proteins were identified when Fusarium graminearum was grown on
hop cell wall (Phalip et al. 2005) indicating that fungal metabolism becomes oriented towards the
synthesis and secretion of an arsenal of enzymes able to digest almost the complete plant cell
wall. A high-throughput MS/MS (tandem mass spectrometry) to identify secreted proteins of F.
graminearum in vitro (grown on 13 different media) and in planta (infection of wheat heads)
identified a total of 289 proteins (229 in vitro and 120 in planta) with high statistical confidence
(Paper et al. 2007). A comprehensive proteomic-level comparison of Pyrenophora tritici-
repentis avirulence race 4 and virulence race 5, by 2-DE followed by MS/MS, identified 29
differentially abundant proteins in the secretome, including α-mannosidase, exo-β-1,3-glucanase,
heat-shock, BiP (binding innmunoglobulin protein) proteins, and various metabolic enzymes

106
(Cao et al. 2009). The proteome-level differences suggested that reduced pathogenic ability in
race 4 of P. tritici-repentis may reflect its adaptation to a saprophytic habit. Fernandez-Acero et
al. (2010) studied the discrete sets of proteins secreted by B. cinerea grown on culture media
supplemented with different carbon sources [glucose, carboxymethylcellulose (CMC), starch,
pectin] and plant-based elicitors [tomato cell walls (TCW)] and identified 78 spots by MALDI-
TOF/TOF MS/MS (matrix-assisted laser desorption/ionization time-of-flight/time-of-flight
tandem mass spectrometry) analysis, corresponding to 56 unique proteins and 45 identified
proteins contained secretion signal peptides for both classical and nonclassical secretory
pathways.
Plant pathogenic bacteria deliver a plethora of proteins, known as effector proteins, into
their host plants, using the type III secretion system (TTSS) (Abramovitch et al. 2006).
Staskawitz et al. (1984) successfully cloned the first effector protein coding gene avrA
(avirulence A) from Pseudomonas syringae pv. glycinea and later several effector proteins were
discovered. First fungal effector (avr9) was identified in Cladosporium fulvum in 1991 (van Kan
et al. 1991) and followed by the first oomycete effector (Extracellular Protease Inhibitor 1) in
2004 (Tian et al. 2004). These effector proteins are secreted by the pathogens during the
interaction with their corresponding hosts (Catanzariti and Jones 2010). Effector proteins are
required for enhanced virulence in the absence of a corresponding R gene in the host (Cui et al.
2009). The pathogen effector and host R gene proteins may interact directly or indirectly (guard
model) leading to effector triggered immunity (ETI) (Dangl and Jones 2001). As a result of ETI,
pathogens respond by mutating or losing effectors, or by developing novel effectors that can
avoid or suppress ETI, whereas plants develop novel R proteins mediating recognition of novel
effectors (de Wit 2007; Jones and Dangl 2006). Extracellular fungal pathogens such as
107
Cladosporium fulvum and Fusarium oxysporum f. sp. lycopersici (Fol) secrete a large number of
effector proteins that are small and rich in cysteine which provides stability in protease-rich
environments (reviewed in Stergiopoulos and de Wit 2009). In C. fulvum, so far eight effector
proteins were identified which include Avr2, Avr4, Avr4E, Avr9, Ecp1, Ecp2, Ecp4, and Ecp5
(Joosten et al. 1994; Laugé et al. 1997; Laugé et al. 2000; Luderer et al. 2002; van den
Ackerveken et al. 1992; Westerink et al. 2004). In Fol, seven proteins have been identified in
xylem sap during infection known as SIX (Secreted in xylem) proteins (reviewed in Catanzariti
and Jones 2010). The fungus Leptosphaeria maculans, causal agent of black leg disease in
brassicas, secretes three effectors, AvrLm1 (Gout et al. 2006), AvrLm6 (Fudal et al. 2007), and
AvrLm4-7 (Parlange et al. 2009). Three small proteins are secreted by Rhyncosporium secalis,
causal agent of barley leaf scald, known as necrosis inducing proteins (NIP). NIP1 can cause leaf
necrosis by affecting the host’s plasma membrane H+-ATPase (Wevelsliep et al. 1993) and also
activates ETI in barley cultivars carrying the Rrs1 resistance gene (Hahn et al. 1993; Rohe et al.
1995). Necrotrophic fungi also secrete small effector proteins that have a functional role as
virulence factors (Tan et al. 2010). Pyrenophora tritici-repentis, causal agent of tan spot of
wheat, secretes PtrToxA and PtrToxB (Ballance et al. 1989; Martinez et al. 2001; Strelkov et al.
1999). The presence of SnToxA in Stagonospora nodorum, which showed a high homology to
PtrToxA from P. tritici-repentis suggested that the genes coding for effector proteins can be
horizontally transferred across different fungal genera (Stukenbrock and McDonald 2007).
Biotrophic fungi and oomycetes have evolved haustoria for secretion of particular classes of
host-translocated fungal and oomycete effectors (Catanzariti et al. 2006; Dodds et al. 2004;
Whisson et al. 2007). Based on the evidence from the above studies, as the effector proteins
108
produced by fungi are secreted proteins, there is every need to study secreted proteins from C.
kikuchii to identify potential effector proteins.
The study of fungal secreted proteins, which often contain virulence factors/effectors to
either suppress host defense response or breach host defense mechanism/breach host physical
barrier to gain access to host nutrients, is another approach to understanding host-pathogen
interaction which may be used to enhance resistance to C. kikuchii infection in soybean. In this
study we isolated secreted proteins form C. kikuchii grown under continuous light and dark and
protein sequencing was done using liquid chromatography tandem mass spectrometry (LC-
MS/MS).
5.2 Materials and Methods
5.2.1 Culture Conditions and Concentrating Culture Supernatant Fraction
Cercospora kikuchii isolate MRL6020-2B was grown on potato dextrose agar (PDA) for
1 week and three 7-mm mycelial plugs (taken 2 mm from the margins) were cut with a cork
borer and ground in 2 ml of water in a glass grinder. Two hundred microliters of this mycelial
suspension was used to inoculate 200 ml of minimal media [ingredients per liter were: glucose
(10.0 g); Ca(NO3)2.4H2O (1.0 g); 10 ml of a solution containing 2.0 g of KH2PO4, 2.5 g of
MgSO4.7H2O, and 1.5 g of NaCl in 100 ml of H2O, adjusted to pH 5.3 with NaOH (Jenns et al.
1989)] in a 500 ml Erlenmeyer flask. Cultures were incubated at 25°C with constant shaking
(200 rpm) in light (240 μEm-2
s-1
) or dark (achieved by wrapping flasks with two layers of
aluminum foil). Cultures from light and dark were harvested at 7 and 14 days. Mycelia were
separated from media by vacuum filtration to obtain a culture supernatant. The supernatant was
concentrated using Vivaspin 20 centrifugal concentrators (GE Healthcare, Piscataway, NJ) with
5000 Da molecular weight cut off (MWCO) until the final volume was approximately 2 ml (100-

109
fold concentration). Concentrated protein samples were stored at -30°C until further use. All
centrifugations were performed at 4°C.
5.2.2 Protein Extraction
An aliquot of concentrated protein sample was mixed with 3 volumes of pre-chilled 10%
(w/v) trichloroacetic acid (TCA) in acetone containing 0.07% 2-mercaptoethanol (2-ME) and
kept at -30°C overnight (Damerval et al. 1986; Vincent et al. 2009). Proteins were pelleted by
centrifugation at 10,000 g for 30 min at 4°C. The protein pellet was washed three times with
80% acetone containing 0.07% 2-ME. Each time the pellet was resuspended in acetone. After
washing, the protein pellet was air dried and stored at -30°C until further use.
5.2.3 2-DE (IEF/SDS-PAGE), Staining, and Scanning
Protein pellets were solubilized in lysis buffer (8 M urea, 4% 3-[(3- cholamidopropyl)
dimethylammonio]-1-propane sulfonate (CHAPS), 40 mM dithiotheritol (DTT), and 2% (w/v) 3-
10 NL IPG (Non-linear immobilized pH gradient) buffer. IPG strips (7 cm, pH 3-5.6 NL, GE
Healthcare) were rehydrated overnight in 125 μl of rehydration solution (8 M urea, 2% (w/v)
CHAPS, 20 mM DTT, 0.002% bromophenol blue, and 0.5% (w/v) 3-5.6 NL IPG buffer)
containing 51 to 259 μg of proteins. Strips in the re-swelling tray were covered by Immobiline™
DryStrip cover fluid (GE Healthcare, Piscataway, NJ), leveled horizontally, and left overnight at
room temperature. Isoelectric focusing (IEF) was performed as follows: (i) step and hold 300 V
for 30 min; (ii) gradient to 1000 V for 30 min; (iii) gradient to 5000 V for 90 min; and (iv) step
and hold 5000 V for 90 min for a total of 12 kVh. The focused IPG strips were equilibrated for
20 min in 7 ml per strip of equilibration buffer I (50 mM Tris-HCl pH 8.8, 6 M urea, 30% (v/v)
glycerol, 20% (w/v) SDS, a trace of bromophenol blue, 1% (w/v) DTT) with gentle shaking,
followed by another 20 min in 7 ml of equilibration buffer II [50 mM Tris-HCl pH 8.8, 6 M urea,
110
30% (v/v) glycerol, 20% (w/v) SDS, a trace of bromophenol blue, 2.5% (w/v) iodoacetamide
(IAA)] per strip. The equilibrated IPG strips were subjected to second dimension on the 12%
Mini-PROTEAN® TGX precast gels with IPG comb (Bio-Rad, Cat # 456-1041, Hercules, CA).
Electrophoresis was carried out at 20 V for 10 min and 100 V for 90 min until the bromophenol
blue dye reached the bottom of the gel. Gels were fixed overnight in fixing solution [10% (v/v)
acetic acid and 40% (v/v) methanol] followed by staining with Coomassie Brilliant Blue G-250
dye [(2% (v/v) phosphoric acid, 10% (w/v) (NH4)2SO4, 0.1% (w/v) Coomassie Brilliant Blue G-
250, and 20% (v/v) methanol] (Candiano et al. 2004; Neuhoff et al. 1985, 1988) for 24 hr at
room temperature. The secreted proteins prepared from three biological repeats for each
treatment (light and dark) and time point (7 and 14 days) were separated on 2-DE gels. Only
consistently expressed protein spots were recovered for identification using LC-MS/MS.
5.2.4 In-Gel Trypsin Digestion
Fifteen protein spots were excised from the 2-DE gels, cut into 1 mm2 pieces and
subjected to in-gel digestion by trypsin (Proteomics grade trypsin, Sigma, Cat # T6567) as
previously described (Shevchenko et al. 2007). Briefly, the recovered gel pieces were first
destained twice using 100 mM ammonium bicarbonate and acetonitrile (ACN) (1:1 v/v) followed
by shrinking by adding 500 μl acetonitrile. On ice, 50 μl of trypsin digestion buffer [20 μg
trypsin dissolved in 1.5 ml of 10 mM NH4HCO3/10% (v/v) ACN (1:1 v/v)] was added to cover
the gel pieces and left for 30 min. Samples were left on ice for another 90 minutes. Samples were
incubated at 37°C overnight for trypsin digestion. Peptides were extracted from the gel by adding
extraction buffer containing 5% formic acid/acetonitrile (1:2 v/v). The collected supernatants,
which contain the peptide mixtures, were dried under vacuum in a Savant SpeedVac (Thermo
Scientific) and stored at -30°C. Just before mass spectrometry, peptides were resuspended in 10

111
μl of 0.1% (v/v) trifluoroacetic acid (TFA). The peptide mixtures were injected into LC-MS/MS
to determine peptide mass spectra or de novo peptide sequences.
5.2.5 Liquid Chromatography Tandem Mass Spectrometry and Protein Identification
Liquid chromatography tandem mass spectrometry (LC-MS/MS) was used to analyze the
peptides extracted from the gel spots. The tryptic peptides dissolved in 10 μl 0.1% (v/v) TFA
was injected with a microplate autosampler (Famos, Dionex, Sunnyvale, CA, USA) onto a
0.3 × 1 mm trapping column (PepMap C18, Dionex) on a nano-LC system (Ultimate, Dionex) at
a flow rate of 10 μl/min. After sample loading, the trapping column was washed with 0.1% (v/v)
formic acid at a flow rate of 5 μl/min for an additional 5 min. The peptides were then eluted onto
a 75 μm × 15 cm C18 column (Biobasic Vydac, Grace Davison, IL, USA) and separated using a
gradient of 5–40% solvent B over 60 min with a flow rate of 200 nl/min. Solvent A was 95%
water and 5% acetonitrile containing 0.1% formic acid. Solvent B was 80% acetonitrile and 20%
water containing 0.1% formic acid. The effluent was directed to a quadrupole time-of-flight mass
spectrometer (QSTAR XL, Applied Biosystems, Foster City, CA, USA) and ionized using a
nano-electrospray source at a voltage of 2.5 kV. The mass spectrometer was operated in
information-dependent acquisition (IDA) mode. Three collision energies (25, 38 and 50 eV)
were selected for fragmentation of the peptides. The MS/MS spectra were subjected to database
search using MASCOT (Perkins et al. 1999, http://www.matrixscience.com) and proteins were
identified based on homology searches against the NCBI non-redundant (NCBInr) protein
database and the SwissProt database with taxonomy limited to fungi. MASCOT individual ions
scores of 48 or greater indicate a significant homology to the peptide spectra in the database
(p<0.05). Ions score is calculated as -10*Log(P), where P is the probability that the observed
match is a random event.

112
5.3 Results
5.3.1 2-D Electrophoresis of the Secreted Proteins
Initial trial 2-D gels in which the first dimension was done with IPG strips spanning a pH
range of 3-10, showed most of the protein spots were concentrated in the pH range 3-6 (not
shown). Therefore, IPG strips with a pH range of 3–5.6 NL were used for subsequent
experiments. For each time point (7 and 14 days) and cultures grown in light and dark, proteins
from three biological repeats were separated in three gels. The spot patterns in these gels were
very consistent and reproducible. For cultures grown in light, the total number of protein spots
was approximately 50, whereas about 60 spots were observed in samples from cultures grown in
the dark (Fig. 5.1). Differences in protein profiles between light and dark were observed, such as
the presence of high molecular weight proteins in light-grown cultures, but not in dark-grown
cultures. In addition, some of the medium and low molecular weight proteins with a pI range of
4.5–5.6 were found only in the dark-grown cultures (Fig. 5.1).
5.3.2 Protein Identification
Fifteen protein spots (Fig. 5.1) were excised from 2-D gels. Following in-gel trypsin
digestion, peptides were separated by liquid chromatography and subjected to tandem mass
spectrometry. Out of 15 spots, only three spots were positively identified based on their MS/MS
spectra, corresponding to three different hypothetical proteins (Table 5.1) with only one
matching peptide per protein. Spots 4 and 26 showed the presence of possible signal peptides
based on predictions with SignalP 4.0 (http://www.cbs.dtu.dk/services/SignalP/). Identities of the
remaining 12 spots are unknown although their partial peptide sequences have been obtained
determined (Table 5.2).
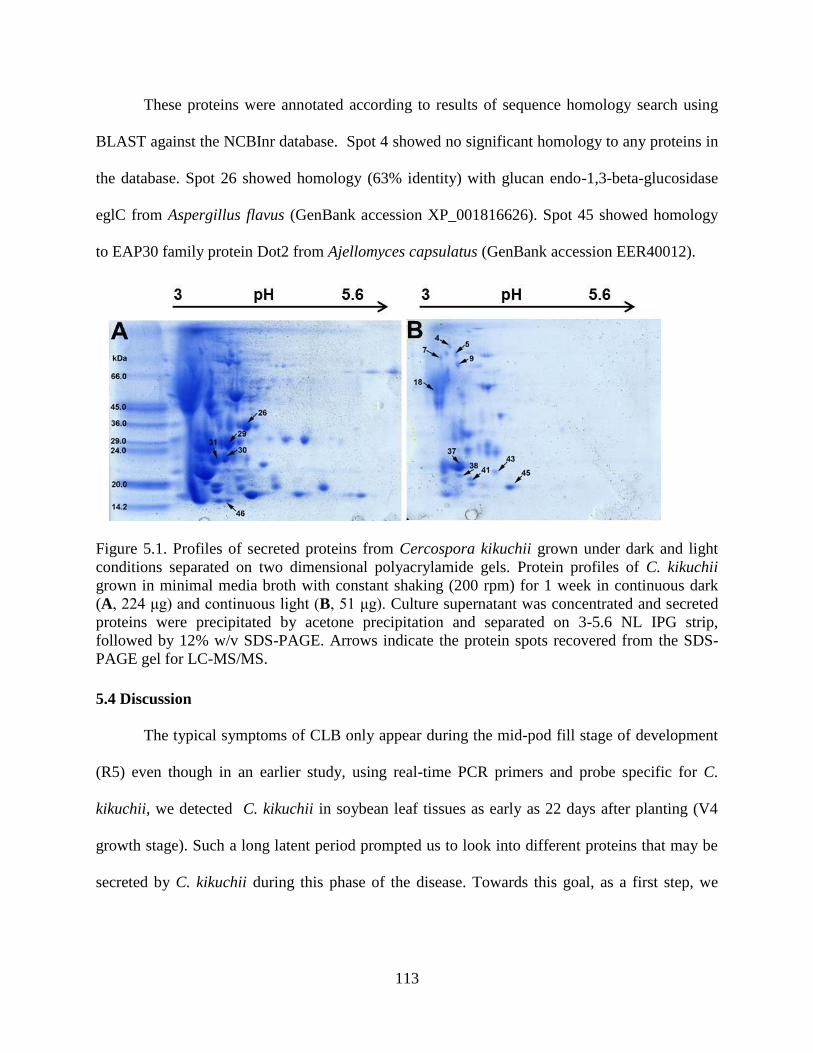
113
These proteins were annotated according to results of sequence homology search using
BLAST against the NCBInr database. Spot 4 showed no significant homology to any proteins in
the database. Spot 26 showed homology (63% identity) with glucan endo-1,3-beta-glucosidase
eglC from Aspergillus flavus (GenBank accession XP_001816626). Spot 45 showed homology
to EAP30 family protein Dot2 from Ajellomyces capsulatus (GenBank accession EER40012).
Figure 5.1. Profiles of secreted proteins from Cercospora kikuchii grown under dark and light
conditions separated on two dimensional polyacrylamide gels. Protein profiles of C. kikuchii
grown in minimal media broth with constant shaking (200 rpm) for 1 week in continuous dark
(A, 224 μg) and continuous light (B, 51 μg). Culture supernatant was concentrated and secreted
proteins were precipitated by acetone precipitation and separated on 3-5.6 NL IPG strip,
followed by 12% w/v SDS-PAGE. Arrows indicate the protein spots recovered from the SDS-
PAGE gel for LC-MS/MS.
5.4 Discussion
The typical symptoms of CLB only appear during the mid-pod fill stage of development
(R5) even though in an earlier study, using real-time PCR primers and probe specific for C.
kikuchii, we detected C. kikuchii in soybean leaf tissues as early as 22 days after planting (V4
growth stage). Such a long latent period prompted us to look into different proteins that may be
secreted by C. kikuchii during this phase of the disease. Towards this goal, as a first step, we

114
designed this experiment to gain insight into proteins secreted by C. kikuchii in vitro when grown
on minimal media. To our knowledge, this is the first report of proteins secreted by C. kikuchii.
Out of 15 spots recovered and sequenced, only spots 4, 26, and 45 were positively
identified in this study (20% discovery) that show significant homology to other proteins in the
database. Spot 4 has no significant homology to any known proteins in the database suggesting
this protein may be an uncharacterized protein of C. kikuchii. Spot 26 showed homology to
glucan beta 1,3-glucosidase (EC 3.2.1.58), which belongs to a class of hydrolytic enzymes that
catalyze the cleavage of 1,3-β-D-glucosidic linkages in β-1,3-glucans and are found in many
fungi (Espino et al. 2010; Fernandez-Acero et al. 2010; Liang et al. 2010; Vincent et al. 2009)
and plants (Doxey et al. 2007). The secretion of beta-1,3-glucanases by the yeast Pichia
membranifaciens is one of the possible mechanisms related to its antagonism against Botrytis
cinerea (Masih and Paul 2002). β-glucanases have a role in many developmental processes
including fungal cell wall growth and extension (Adams 2004). They are also involved in
mobilization of β-glucans in response to conditions of carbon and energy source exhaustion
(Piston et al. 1993). They play important nutritional roles in both saprobic and mycoparasitic
fungi, and represent primary biochemical offensive weapons for parasitized fungal cell wall
degradation (de la Cruz et al. 1995; Pitson et al. 1993). β-glucanases play a crucial role in fungal
cell autolysis that is triggered by many factors (White et al. 2002). Given the various roles played
by β-glucanases in fungi, it is not surprising to see this protein secreted by C. kihuchii.

115
Table 5.1. List of secreted proteins of Cercospora kikuchii identified by LC-MS/MS.
Spotw Top Hit Organism NCBI accession
number
pIx MW
(kDa)y
MASCOT
scorez
E
value
Peptide Sequence
4 Hypothetical protein
MYCGRDRAFT_64715
Mycosphaerella
graminicola
EGP82597.1 4.45 60 88 5.7e-
06
AGLTTAGAVYGLDGR
26 Hypothetical protein
BC1G_09079
Botryotinia
fuckeliana
XP_001552608.1 4.34 44 49 0.054 VVGISVGSEDLYR
45 Hypothetical protein
MYCGRDRAFT_103841
Mycosphaerella
graminicola
EGP88932.1 6.1 28 51 0.043 AENGGMIALAEAR
w: spot number corresponds to spots shown in Fig. 5.1
x: predicted isoelectric point
y: predicted Molecular weight
z: see materials and methods (5.2.5) for description of scores
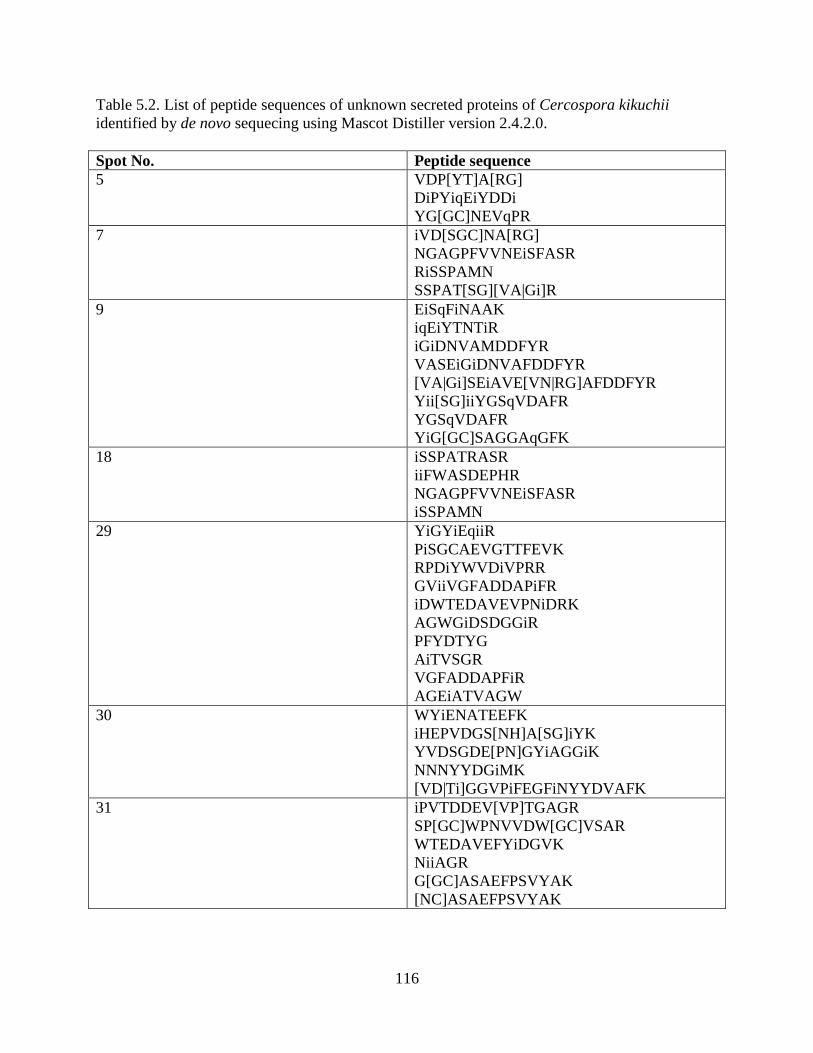
116
Table 5.2. List of peptide sequences of unknown secreted proteins of Cercospora kikuchii
identified by de novo sequecing using Mascot Distiller version 2.4.2.0.
Spot No. Peptide sequence
5 VDP[YT]A[RG]
DiPYiqEiYDDi
YG[GC]NEVqPR
7 iVD[SGC]NA[RG]
NGAGPFVVNEiSFASR
RiSSPAMN
SSPAT[SG][VA|Gi]R
9 EiSqFiNAAK
iqEiYTNTiR
iGiDNVAMDDFYR
VASEiGiDNVAFDDFYR
[VA|Gi]SEiAVE[VN|RG]AFDDFYR
Yii[SG]iiYGSqVDAFR
YGSqVDAFR
YiG[GC]SAGGAqGFK
18 iSSPATRASR
iiFWASDEPHR
NGAGPFVVNEiSFASR
iSSPAMN
29 YiGYiEqiiR
PiSGCAEVGTTFEVK
RPDiYWVDiVPRR
GViiVGFADDAPiFR
iDWTEDAVEVPNiDRK
AGWGiDSDGGiR
PFYDTYG
AiTVSGR
VGFADDAPFiR
AGEiATVAGW
30 WYiENATEEFK
iHEPVDGS[NH]A[SG]iYK
YVDSGDE[PN]GYiAGGiK
NNNYYDGiMK
[VD|Ti]GGVPiFEGFiNYYDVAFK
31 iPVTDDEV[VP]TGAGR
SP[GC]WPNVVDW[GC]VSAR
WTEDAVEFYiDGVK
NiiAGR
G[GC]ASAEFPSVYAK
[NC]ASAEFPSVYAK

117
Table 5.2. (continued) List of peptide sequences of unknown secreted proteins of Cercospora
kikuchii identified by de novo sequecing using Mascot Distiller version 2.4.2.0.
Spot No. Peptide sequence
37 qEFDqAiTiVK
qDFATFAiYSDNR
EDFATFANYSDNR
FYESiGNR
qEAqRAD[NF]R
EAEWGiSYAGAiR
FAiYSDNR
NGADiDi[Pq]ANAK
ADVWVNq[VP]NSNTPSPDR
TGYSSPDR
YiS[GC]PGAiTFDNT[PA]K
38 ATFAiYSDNR
GEAEqFiNAAK
qGDiiPRVi[GC]R
iAASSYN
qDFATFAiYSDNR
SiDPAVPN
EAEWGiSYAGAiR
CETiAGEqSiMCD[CC][PA]K
41 GAGPFDqGTNDPK
DADqGTNDPK
VGEViATADPN
NPDATAiVEGVPVR
DATAiVEGV[VP]R
N[WP]TAiVEGV[VP]R
ATAiVEGV
[SGC]N[PD|Vi]ATPS[GC]
43 [VD|Ti]ADiiiTSiSR
EiV[GCC]iNAAK
GNEqFiNAAR
FATFAiYSDNR
46 AGPATE
iE[NA|Gq]TEEFK
MiiRiSSPAT
iSSPATGS
AqAFNPSTiAN[AA]K
WiENATEEFK
AqDFCGK
NFqqSGqVS[GC]K

118
Spot 45 showed homology to EAP30 family protein. EAP30 encodes for a 30 kDa
protein, which is part of a multiprotein complex of RNA polymerase elongation factor ELL and
three ELL-associated proteins (Shilatifard 1998). EAP30 protein shows significant homology to
the Saccharomyces cerevisiae SNF8 gene, which is required for efficient derepression of glucose
repressed genes (Schmidt et al. 1999). As C. kikuchii was grown on minimal media containing
glucose, EAP30 protein might be induced.
MASCOT search uses an algorithm in which MS/MS spectra of peptide ions generated
are searched against the available protein information in public databases such as NCBInr and
SwissProt. If a particular protein is not present in the database, the chance of having a positive
identification is very low. The reason for such a low discovery rate (20%) in this study is the lack
of genome sequence information for C. kikuchii. The alternative approach to identify the
peptides would be to analyze the MS/MS spectra using de novo sequencing software such as
Mascot Distiller and obtain the peptide sequences by carefully reading the mass spectra. We
were not able to identify the proteins based on de novo approach. Once genome sequence of C.
kikuchii is available in future, many secreted proteins can be identified from C. kikuchii, and
some of the secreted effector proteins can be used as a potential target for silencing using virus
induced gene silencing (VIGS), as a means of enhancing resistance to C. kikuchii infection in
soybeans.
119
CHAPTER 6: EVALUATION OF HOST-INDUCED GENE SILENCING
(HIGS) STRATEGY FOR CONTROL OF CERCOSPORA KIKUCHII
INFECTION OF SOYBEANS
6.1 Introduction
RNA interference (RNAi) is a conserved gene silencing mechanism in eukaryotes
(Baulcombe 2004). RNAi was first described in Caenorhabditis eleagns in which double-
stranded RNA (dsRNA) induces sequence specific post-transcriptional gene silencing (PTGS)
(Fire et al. 1998). RNAi is referred to as quelling in fungi (Romano and Macino 1992) and, co-
suppression in plants (Napoli et al. 1990). RNAi is typically achieved by application or
expression of dsRNA homologous to a target sequence to silence its expression. Various RNAi
pathways utilize small noncoding RNAs (sRNAs) of about 20 to 30 nucleotides (nt) that act as
regulators of cellular processes, host defense, transcription and translation (Reviewed in Dang et
al. 2011). sRNAs include both short interfering RNAs (siRNAs) and micro RNAs (miRNAs).
Both miRNAs and siRNAs are derived from dsRNA precursors that are recognized and
processed by Dicer to generate short duplexes (21 to 25 nt). siRNAs are derived from exogenous
dsRNA (e.g. viral RNA) or endogenous transcript from repetitive sequences, or from transcripts
that can form long hairpins (Carthew and Sontheimer 2009; Ghildiyal and Zamore 2009; Hannon
2002), and siRNA-induced silencing requires RNA-dependent RNA polymerases (RdRPs)
(Allen et al. 2005; Cogoni and Macino 1999; Gent et al. 2010) whereas miRNAs are generated
from miRNA-encoding genes that generate ssRNA precursor transcripts from hairpin structures.
siRNAs trigger RNA cleavage or transcriptional silencing mediated by Argonaute proteins and
generally function in genome defense, while miRNAs can target mRNAs that are not fully
complementary and cause mRNA degradation and translational repression (Ambros et al. 2003;
Bartel 2004). RNAi components (Dicer, Argonaute, and RdRP) have been identified in all major

120
branches of eukaryotes (Cerutti and Casas-Mollano 2006; Shabalina and Koonin 2008),
suggesting that RNAi is an ancient defense and/or regulatory mechanism that existed in the
common eukaryotic ancestor.
RNAi has been used commercially to engineer virus resistance in plants by expression of
viral sequences as transgenes (Frizzi and Huang 2010). RNAi-based silencing showed reduced
development of root knot nematodes as well as Lepidoptera and Coleoptera insects feeding on
transgenic plants carrying RNAi constructs against target genes in these pests (Baum et al. 2007;
Huang et al. 2006; Huvenne and Smagghe 2010; Mao et al. 2007;Sindhu et al. 2009; Yadav et al.
2006). Tomilov et al. (2008) reported that β-glucuronidase (GUS) expression was suppressed in
Tryphysaria spp. by expressing dsRNA of the GUS gene in the host plant, and they demonstrated
the application of host-induced gene silencing (HIGS).
Like other eukaryotes, fungi are sensitive to RNAi (Nakayashiki 2005; Nakayashiki and
Nguyen 2008; Nakayashiki et al. 2006). Exploration of HIGS to engineer resistance in plants to
fungi seems to be a viable alternative based on the outcome from several recent studies. Tinoco
et al. (2010) showed that tobacco transformed to express a GUS hairpin-structured dsRNA
specifically silenced GUS transcripts in a GUS-expressing strain of Fusarium verticillioides
during infection. In planta expression of fungal dsRNA also triggered HIGS in the biotrophic
pathogens Blumeria graminis and Puccinia striiformis f.sp. tritici. Nowara et al. (2010) used
virus induced gene silencing (VIGS) in barley using barley stripe mosaic virus (BSMV) to
produce antisense GTF1 and GTF2 transcripts (1,3-β-glucanosyltransferase) that resulted in
significant reduction in haustorium formation and the rate of secondary hyphal elongation,
respectively. Yin et al. (2011) demonstrated HIGS in wheat targeting Puccinia striiformis f.sp.
tritici (PST) genes in which a highly abundant haustorial PST transcript (PSTha12J12) was
121
silenced by the expression of dsRNA in VIGS mediated BSMV–wheat transformants. Further
examination of other PST genes revealed that only genes highly expressed in haustoria were
effectively silenced (Yin et al. 2011).
Bean pod mottle virus (BPMV)-VIGS system has been successfully used to test the
candidate genes for their involvement in resistance to Phakopsora pachyrhizi in soybeans
(Meyer et al. 2009; Pandey et al. 2011). In this study, a C. kikuchii gene (AHCY) was selected for
analysis. AHCY codes for adenosylhomocysteinase and in our previous experiments ahcy
disruption mutants of C. kikuchii produced low levels of cercosporin and also showed reduced
virulence on soybeans. The BPMV-VIGS system is used to express dsRNA from C. kikuchii
AHCY gene in soybean plants to determine whether silencing signals can be delivered to the
pathogen and suppress expression of the fungal genes. The broader goals are to develop a host-
induced gene-silencing system for functional analysis of C. kikuchii genes and for control of C.
kikuchii infection of soybeans.
6.2 Materials and Methods
6.2.1 Construction of BPMV-Derived Vectors
The Cercospora kikuchii AHCY gene was targeted for silencing using BPMV derived
vectors (Figure 6.1A; Zhang et al. 2010). The middle and 3′-end fragments of AHCY were
designated as AHCY #6 and AHCY #7-1, respectively (Figure 6.1B). The AHCY #6 and AHCY
#7-1 sequences were used to search public sequence databases and showed no homology to the
available soybean genome sequences. AHCY #6 and AHCY #7-1 were amplified by PCR from
cDNA of C. kikuchii using primer pairs AHCY_F_176/AHCY_R_614 and
AHCY_F_491/AHCY_R_883, respectively (Fig. 6.2). The AHCY_F_176/AHCY_R_614
primers contain a StuI restriction site at the 5′-end and a SalI site at the 3′-end allowing insertion
122
of AHCY #6 in a reverse orientation into the vector pBPMV-IA-V2. The AHCY #6 and #7-1
were subcloned into pCRTM
2.1-TOPO®
TA Cloning vector (Invitrogen, Carlsbad, CA) to obtain
pTOPO-AHCY-6 and pTOPO-AHCY-7-1, respectively, and confirmed by DNA sequencing
using vector specific primers T7 and M13. The AHCY #6 was released from pTOPO-AHCY-6
by StuI and SalI digestion (Fig. 6.3) and inserted into similarly digested and dephosphorylated
pBPMV-IA-V2 (Zhang et al. 2010) to generate pBPMV-AHCY-6. StuI and SalI digestion of
pBPMV-AHCY-6 confirmed the release of the insert with the expected size (428 bp) (Fig. 6.3).
AHCY #7 was released from pTOPO-AHCY-7-1 by SalI digestion (Fig. 6.3) and inserted into
similarly digested and dephosphorylated pBPMV-IA-V2 to generate the pBPMV-AHCY-7. SalI
digestion of the pBPMV-AHCY-7 also confirmed the release of the insert with the expected size
(241 bp) (Fig. 6.3). pBPMV-PDS-3R (Zhang et al. 2010) was used as a positive control in which
silencing of the phytoene desaturase (PDS) gene shows photo-bleaching of soybean leaves and
pBPMV-IA-V2 was used as an empty vector control.
6.2.2 Delivery of BPMV-Derived Vectors into Soybean Leaves
For HIGS experiments, pBPMV-IA-R1M (modified RNA1 of BPMV, Zhang et al. 2010)
was either mixed with pBPMV-IA-V2 (empty vector control), pBPMV-PDS-3R (positive
control), pBPMV-AHCY-6 (AHCY #6), or pBPMV-AHCY-7 (AHCY #7) and biolistically
introduced into the primary leaves (vegetative cotyledon stage) of 14-day-old soybean seedlings
(cultivar ASGROW 6202) by a single particle bombardment (Please see Appendix for detailed
protocol) as described (Sanford et al. 1993) using a Biolistic PDS-1000/He system (Bio-Rad
Laboratories, Hercules, CA), 1.0 μm gold particles, and 1,100-psi rupture disks at a distance of

123
Figure 6.1. A, Diagram of the RNA2 molecule of BPMV. The restriction sites at the end are for
integration of genes of interests into the vector. B, Diagram of AHCY gene with arrows
indicating location of primers used to amplify the middle and 3′ fragments of the AHCY gene in
Cercospora kikuchii. Note: Map is not to scale.
Figure 6.2. PCR amplification of two different regions of AHCY gene from Cercospora kikuchii.
Lane 1, the middle region of AHCY (AHCY #6, 439 bp); lane 2, the 3′ end of AHCY (AHCY #7-
1, 393 bp); and lane M is 1 kb DNA ladder.
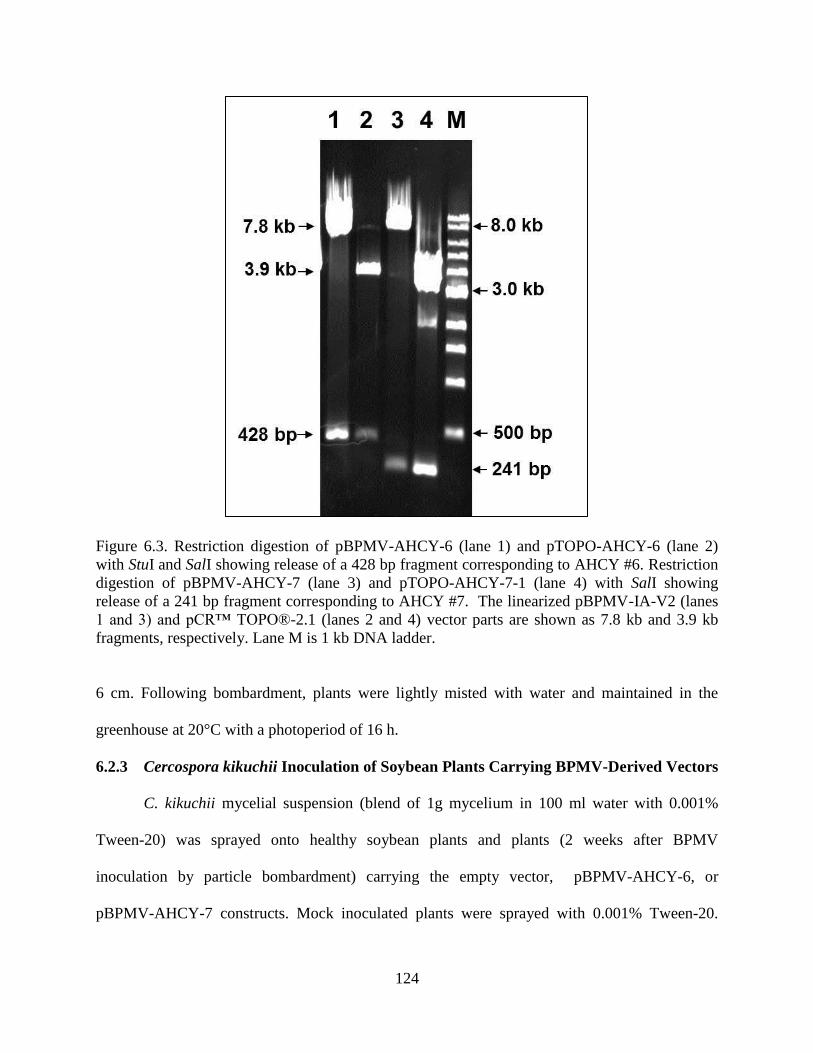
124
Figure 6.3. Restriction digestion of pBPMV-AHCY-6 (lane 1) and pTOPO-AHCY-6 (lane 2)
with StuI and SalI showing release of a 428 bp fragment corresponding to AHCY #6. Restriction
digestion of pBPMV-AHCY-7 (lane 3) and pTOPO-AHCY-7-1 (lane 4) with SalI showing
release of a 241 bp fragment corresponding to AHCY #7. The linearized pBPMV-IA-V2 (lanes
1 and 3) and pCR™ TOPO®-2.1 (lanes 2 and 4) vector parts are shown as 7.8 kb and 3.9 kb
fragments, respectively. Lane M is 1 kb DNA ladder.
6 cm. Following bombardment, plants were lightly misted with water and maintained in the
greenhouse at 20°C with a photoperiod of 16 h.
6.2.3 Cercospora kikuchii Inoculation of Soybean Plants Carrying BPMV-Derived Vectors
C. kikuchii mycelial suspension (blend of 1g mycelium in 100 ml water with 0.001%
Tween-20) was sprayed onto healthy soybean plants and plants (2 weeks after BPMV
inoculation by particle bombardment) carrying the empty vector, pBPMV-AHCY-6, or
pBPMV-AHCY-7 constructs. Mock inoculated plants were sprayed with 0.001% Tween-20.
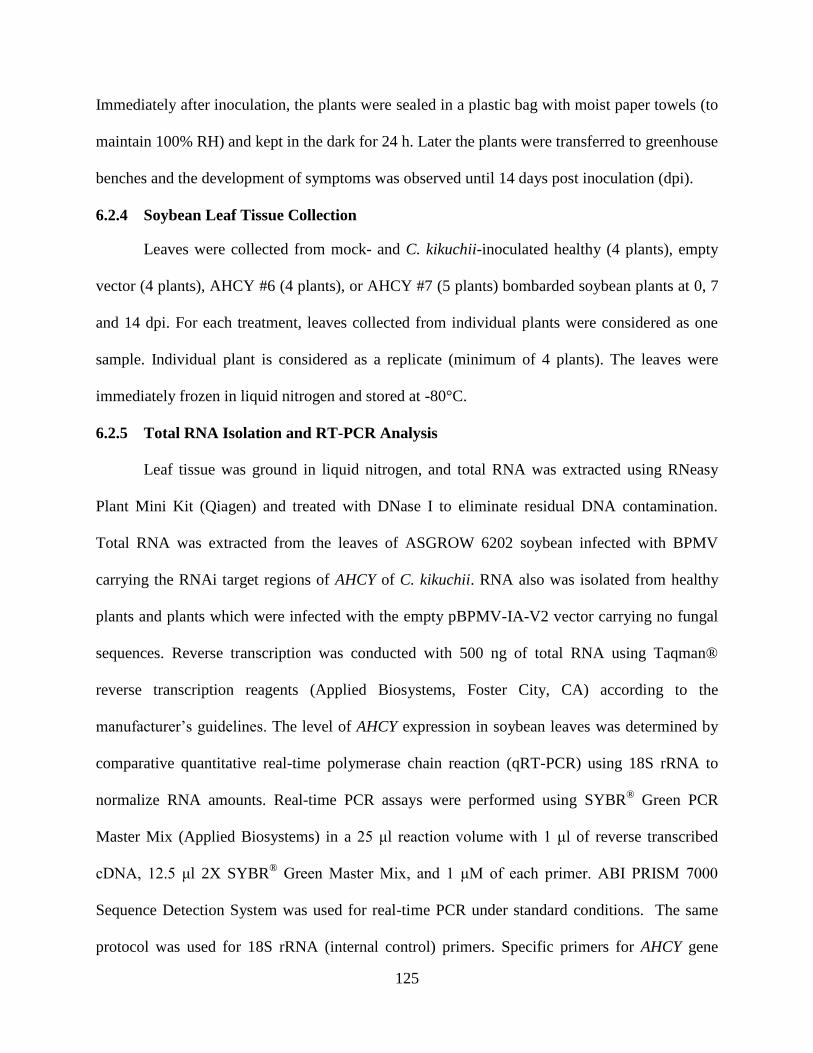
125
Immediately after inoculation, the plants were sealed in a plastic bag with moist paper towels (to
maintain 100% RH) and kept in the dark for 24 h. Later the plants were transferred to greenhouse
benches and the development of symptoms was observed until 14 days post inoculation (dpi).
6.2.4 Soybean Leaf Tissue Collection
Leaves were collected from mock- and C. kikuchii-inoculated healthy (4 plants), empty
vector (4 plants), AHCY #6 (4 plants), or AHCY #7 (5 plants) bombarded soybean plants at 0, 7
and 14 dpi. For each treatment, leaves collected from individual plants were considered as one
sample. Individual plant is considered as a replicate (minimum of 4 plants). The leaves were
immediately frozen in liquid nitrogen and stored at -80°C.
6.2.5 Total RNA Isolation and RT-PCR Analysis
Leaf tissue was ground in liquid nitrogen, and total RNA was extracted using RNeasy
Plant Mini Kit (Qiagen) and treated with DNase I to eliminate residual DNA contamination.
Total RNA was extracted from the leaves of ASGROW 6202 soybean infected with BPMV
carrying the RNAi target regions of AHCY of C. kikuchii. RNA also was isolated from healthy
plants and plants which were infected with the empty pBPMV-IA-V2 vector carrying no fungal
sequences. Reverse transcription was conducted with 500 ng of total RNA using Taqman®
reverse transcription reagents (Applied Biosystems, Foster City, CA) according to the
manufacturer’s guidelines. The level of AHCY expression in soybean leaves was determined by
comparative quantitative real-time polymerase chain reaction (qRT-PCR) using 18S rRNA to
normalize RNA amounts. Real-time PCR assays were performed using SYBR® Green PCR
Master Mix (Applied Biosystems) in a 25 μl reaction volume with 1 μl of reverse transcribed
cDNA, 12.5 μl 2X SYBR® Green Master Mix, and 1 μM of each primer. ABI PRISM 7000
Sequence Detection System was used for real-time PCR under standard conditions. The same
protocol was used for 18S rRNA (internal control) primers. Specific primers for AHCY gene

126
were selected from regions outside of those used in RNAi target regions for AHCY #6 and
AHCY #7 and were designed using primer design software available at http://www.idtdna.com
(Table 6.1). Melting curve analysis was conducted to confirm amplification of a single product
and the absence of primer dimers. Relative RNA expression of AHCY was determined using the
∆∆Ct method ([Ct (18S rRNA) – Ct (AHCY)]AHCY #6 or #7 - [Ct (18S rRNA) – Ct (AHCY)]empty vector) (Pfaffl
2001).
6.2.6 DNA Isolation and Quantitative Real-Time PCR Assessment of C. kikuchii
Accumulation
Leaf tissue was ground in liquid nitrogen, and DNA was extracted using a GenEluteTM
Plant Genomic DNA Miniprep Kit (Sigma-Aldrich, St Louis, MO) according to the
manufacturer’s instructions. All DNA samples were diluted to 10 ng/µl according to DNA
Table 6.1. List of primers used in this HIGS study.
Primer Sequence (5′ to 3′)
AHCY_F_176 GAGGCCTCGCACCATCCATC
AHCY_R_614 AACGTCGACGGCGGTCTTCTTCA
AHCY_F_491 GAGGCCGAGACATCATTGTTGG
AHCY_R_883 TGAGTCGACCCTCCTCTTGGA
BPMV-IA-F1 TGTGCTGCTGTTGGCTTGAC
BPMV-IA-R1 TCAGTTTGCCCATAAACCTAT
R2-3195F CCTCATTGGTACAAGTGTTT
Gm-PDS-3F CGCGGATCCGCAAGGAATATTATAGCCCAAA
AHCY_R_510 AACAATGATGTCTCGGCAACC
AHCY_R_816 GACATACTTGGTGGCGAACTG
hAHCY-RT-F2 ACTCAAGATCACGCTGCC
hAHCY-RT-R2 CATCTCTGGGTACTTGGTGTG
CKCTB6-2F CACCATGCTAGATGTGACGACA
CKCTB6-2R GGTCCTGGAGGCAGCCA
quantification based on absorption at 260 nm using a NanoDrop ND-1000 Spectrophotometer
(Thermo Fisher Scientific Inc., Wilmington, DE). Real-time PCR using primers CKCTB6-
2F/CKCTB6-2R and fluorescent probe (CKCTB6-PRB: 5'-FAM-

127
CTCGTCGCACAGTCCCGCTTCG-TAMRA-3') targeting the C. kikuchii CTB6 gene, was
performed with MicroAmp optical 8-tube strips and optical 8-cap strips (Applied Biosystems,
Foster City, CA) in the ABI 7000 sequence detection system (Applied Biosystems) under the
standard conditions. Each reaction contained 7.5 µl 2X TaqMan Universal PCR Master Mix
(Applied Biosystems), 1 µl of 10 µM each primer (final concentration 666 nM each primer), 0.6
µl of 10 µM (final concentration of 400 nM) probe and 1 µl of 10 ng or 100 ng template DNA.
The absolute quantity of DNA of C. kikuchii in leaf samples, which was used to determine the
level of infection by C. kikuchii, was calculated by using the Ct value of each sample and the
regression equation obtained with DNA standards of C. kikuchii (y = -1.434ln(x) + 37.913), with
x being pg of C. kikuchii DNA and y being Ct value. Amounts of DNA of C. kikuchii are
expressed as picograms per nanogram soybean DNA.
6.3 Results
6.3.1 Successful Delivery of VIGS Vectors into Soybeans
The biolistic inoculation method used in this study to deliver the modified BPMV was
successful. After approximately 14 days, plants inoculated with recombinant pBPMV-IA-V2
constructs developed typical BPMV symptoms such as crinkled leaves with a mosaic of light and
dark green regions and photobleaching was observed in positive control plants bombarded with
pBPMV-IA-PDS-3R (Fig 6.4). Reverse transcription (RT)-PCR was performed with pBPMV-
IA-V2 vector-specific forward primer R2-3195F and each insert-specific reverse primer, Gm-
PDS-3F for PDS, AHCY_R_510 for AHCY #6, and AHCY_R_816 for AHCY #7 to examine
the integrity of the recombinant BPMV RNA2. A single band with the expected size was
observed for each BPMV RNA2 carrying the corresponding PDS or AHCY insert (Fig. 6.5)
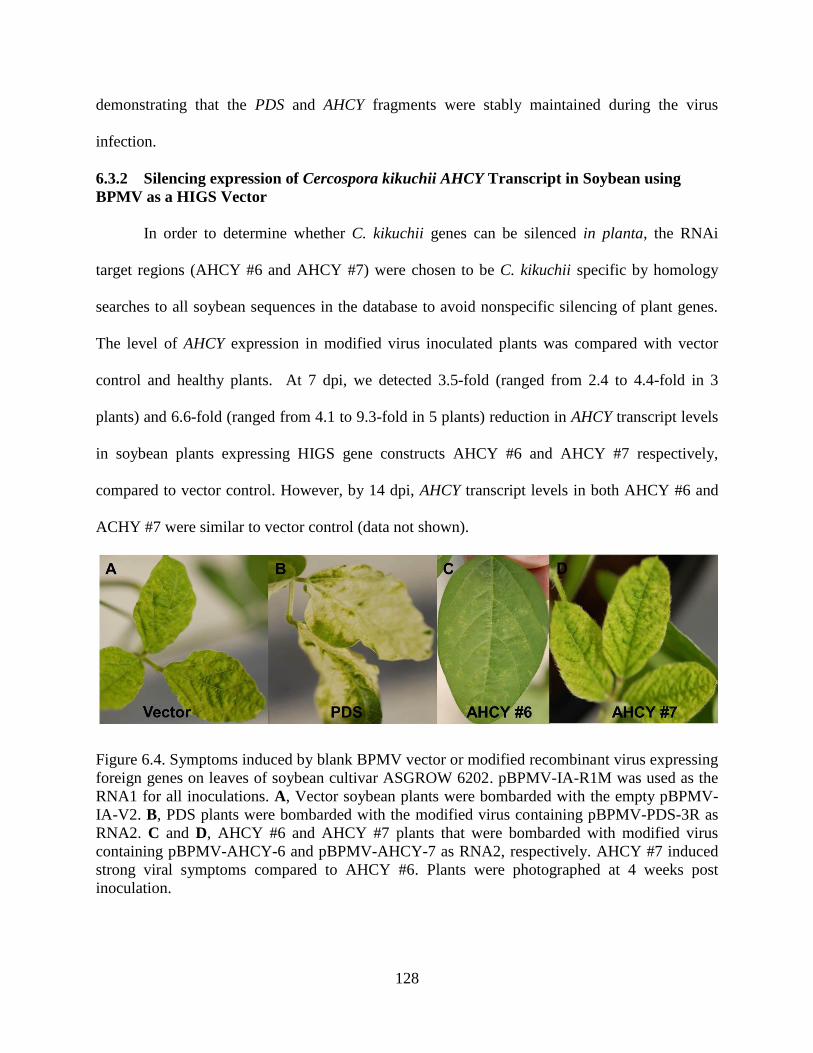
128
demonstrating that the PDS and AHCY fragments were stably maintained during the virus
infection.
6.3.2 Silencing expression of Cercospora kikuchii AHCY Transcript in Soybean using
BPMV as a HIGS Vector
In order to determine whether C. kikuchii genes can be silenced in planta, the RNAi
target regions (AHCY #6 and AHCY #7) were chosen to be C. kikuchii specific by homology
searches to all soybean sequences in the database to avoid nonspecific silencing of plant genes.
The level of AHCY expression in modified virus inoculated plants was compared with vector
control and healthy plants. At 7 dpi, we detected 3.5-fold (ranged from 2.4 to 4.4-fold in 3
plants) and 6.6-fold (ranged from 4.1 to 9.3-fold in 5 plants) reduction in AHCY transcript levels
in soybean plants expressing HIGS gene constructs AHCY #6 and AHCY #7 respectively,
compared to vector control. However, by 14 dpi, AHCY transcript levels in both AHCY #6 and
ACHY #7 were similar to vector control (data not shown).
Figure 6.4. Symptoms induced by blank BPMV vector or modified recombinant virus expressing
foreign genes on leaves of soybean cultivar ASGROW 6202. pBPMV-IA-R1M was used as the
RNA1 for all inoculations. A, Vector soybean plants were bombarded with the empty pBPMV-
IA-V2. B, PDS plants were bombarded with the modified virus containing pBPMV-PDS-3R as
RNA2. C and D, AHCY #6 and AHCY #7 plants that were bombarded with modified virus
containing pBPMV-AHCY-6 and pBPMV-AHCY-7 as RNA2, respectively. AHCY #7 induced
strong viral symptoms compared to AHCY #6. Plants were photographed at 4 weeks post
inoculation.
129
Figure 6.5. Empty vector (pBPMV-IA-V2) amplified with primers BPMV-IA-F1 and BPMV-IA-
R1 (lane 1) showing expected 1.1 kb fragment with no insert. RT-PCR analysis using the
forward primer R2-3195F and each of the reverse primer corresponding to the PDS, AHCY #6,
and AHCY #7 target sequence in each of the HIGS constructs to confirm the PDS (lane 2),
AHCY #6 (lane 3) and AHCY #7 (lane 4) fragment insertions. Lane M is 1 kb DNA ladder.
6.3.3 Inoculation of Soybeans Plants Carrying HIGS Constructs with Cercospora kikuchii
Soybeans bombarded with two HIGS gene constructs (AHCY #6 and AHCY #7), vector
control constructs with no fungal genes, and healthy plants were inoculated with mycelial
suspension of C. kikuchii. At 7 dpi, healthy and vector control plants developed numerous
necrotic lesions, whereas in AHCY #6 and AHCY #7 plants had few necrotic lesions (Fig. 6.7).
Real time PCR analysis of DNA samples isolated from C. kikuchii inoculated soybean plants that
had been pre-bombarded with HIGS constructs found that by 7 dpi, C. kikuchii biomass
decreased by 16-fold and 18-fold fold in AHCY #6 and AHCY #7 plants respectively (Fig 6.8).
We saw good negative correlation between AHCY transcript levels and C. kikuchii biomass in
AHCY #6 (r = -0.81) and AHCY #7 (r = -0.72) plants.
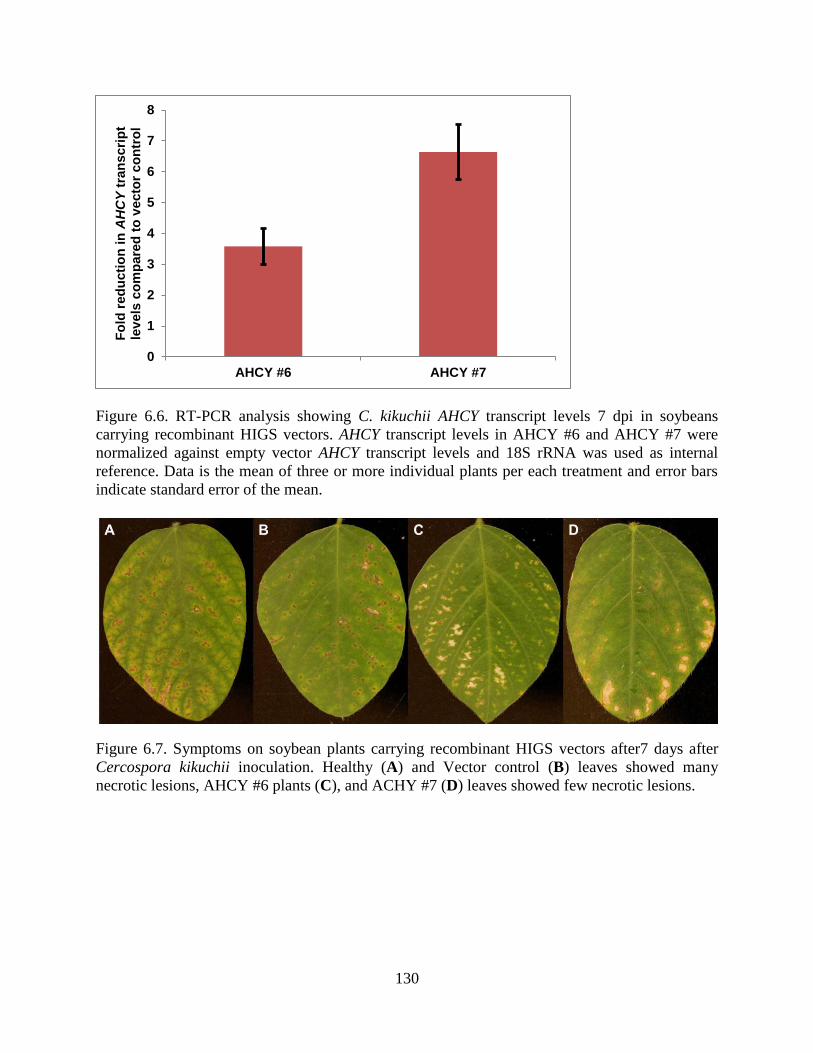
130
Figure 6.6. RT-PCR analysis showing C. kikuchii AHCY transcript levels 7 dpi in soybeans
carrying recombinant HIGS vectors. AHCY transcript levels in AHCY #6 and AHCY #7 were
normalized against empty vector AHCY transcript levels and 18S rRNA was used as internal
reference. Data is the mean of three or more individual plants per each treatment and error bars
indicate standard error of the mean.
Figure 6.7. Symptoms on soybean plants carrying recombinant HIGS vectors after7 days after
Cercospora kikuchii inoculation. Healthy (A) and Vector control (B) leaves showed many
necrotic lesions, AHCY #6 plants (C), and ACHY #7 (D) leaves showed few necrotic lesions.
0
1
2
3
4
5
6
7
8
AHCY #6 AHCY #7
Fo
ld r
ed
ucti
on
in
AH
CY
tra
nscri
pt
lev
els
co
mp
are
d t
o v
ecto
r co
ntr
ol

131
Figure 6.8. Quantitative real-time PCR analysis showing differential accumulation of C. kikuchii
at 7 dpi in soybeans carrying recombinant HIGS vectors. Leaves collected form individual plant
constitute a sample. Data indicate mean for healthy (4 plants), empty vector (3 plants), AHCY #6
(3 plants), and AHCY #7 (3 plants) and error bars indicate standard error of the mean.
6.4 Discussion
HIGS assay with the AHCY gene of C. kikuchii showed that upon successful inoculation
of soybeans with C. kikuchii, BPMV carrying parts of the AHCY gene could silence the AHCY
gene of C. kikuchii in planta. The AHCY transcript levels in AHCY #6 and AHCY #7 plants
were reduced compared to empty vector control at 7 dpi. Necrotic spots typical of C. kikuchii
infection seen in greenhouse soybean inoculations with fungal mycelial suspensions, were
evident at 7 dpi. Healthy and vector control plants developed extensive necrotic lesions
compared to AHCY #6 and AHCY #7 (Fig. 6.7). In our previous study, ahcy disruption mutants
produced significantly less cercosporin compared to wild type and also were less virulent on
soybeans. We saw the similar results using this HIGS study by silencing the AHCY transcript.
There was a clear difference in C. kikuchii biomass accumulation in the vector control,
AHCY #6 and AHCY #7 plants at 7 dpi with a rapid increase in C. kikuchii biomass in vector
0
2
4
6
8
10
12
14
16
18
Healthy Empty Vector AHCY #6 AHCY #7
pg
of
DN
A o
f C
. kik
uch
ii p
er
ng
so
yb
ean
DN
A

132
control plants compared to AHCY #6 and AHCY #7 plants. The data are in agreement with
reduction in AHCY transcript levels in both AHCY #6 and AHCY #7 at 7 dpi. These results are
similar to other HIGS studies with fungi. HIGS was promising in the Blumeria graminis-barley
interaction, in which effector gene Avra10 was silenced resulting in reduced fungal development
in the absence of matching resistance gene Mla10 (Nowara et al. 2010). Yin et al. (2011) also
achieved silencing of highly expressed genes in haustoria of rust fungi belonging to Puccinia
spp. by using Barley Stripe Mosaic Virus (BSMV) as a vector.
The VIGS approach was originally developed for silencing plant genes for functional
genomics studies, and now by inserting a piece of pathogen genes in the VIGS vectors, it opens
new arenas of research for developing disease resistance in host plants by targeting essential
virulence/pathogenicity factors of pathogens. In plants, the mobile RNA silencing signals are
transported systemically mainly through phloem to all plant parts (reviewed in Melnyk et al.
2011). In the case of biotrophic pathogens like rusts dsRNA fragments can enter fungal cells
through haustoria (Yin et al. 2011). However, the movement of dsRNAs in to the mycelia of C.
kikuchii in the infected soybean has to be demonstrated. Future studies are needed to demonstrate
the presence of gene-specific dsRNA in the fungus, which will be key in determining whether
HIGS can be used to control fungal disease in soybean.

133
CHAPTER 7: GENERAL CONCLUSIONS AND PROSPECTS FOR
FUTURE RESEARCH
7.1 General Conclusions
CLB symptoms are visible at R5 growth stage of soybeans
PCR primers designed based on C. nicotianae CTB gene cluster can amplify specific
gene product in C. kikuchii, indicating that some CTB genes are conserved across
Cercospora spp.
The qPCR assay developed based on CTB6 gene is highly sensitive for the detection of C.
kikuchii with a detection limit of 1 pg of genomic DNA
The qPCR assay can detect C. kikuchii as early as 22 DAP in field grown soybeans
The qPCR also can be used to quantify C. kikuchii biomass in soybean leaves at different
growth stages
The C. kikuchii biomass showed a slow increase during vegetative stages followed by a
quick increase during late reproductive stages
Multiple fungicide applications beginning from late vegetative stages until reproductive
stages reduced the C. kikuchii levels and development of CLB symptoms
Fungicides tested in this study differed in their effectiveness in controlling CLB
symptoms
C. kikuchii accumulated up to 6-fold higher cercosporin under light compared to dark
Differential expression of proteins was detected in C. kikuchii grown on CM under light
and dark. More proteins were up-regulated under light compared to dark
HNR protein (Spot 57) up-regulated under light showed homology to RDT1 from Elsinoё
fawcettii and suggests that melanin biosynthesis in C. kikuchii may be tightly linked to
cercosporin biosynthesis
AHCY (Spot 34) and S-adenosyl methionine synthetase (Spot 28) proteins were up-
regulated under light, indicating a direct relationship between cysteine and methionine
metabolism and cercosporin biosynthesis
Up-regulation of superoxide dismutase (Spot 26) in general under light indicates a
possible role of this protein in protecting C. kikuchii from harmful reactive oxygen
species generated by photosensitizing cercosporin
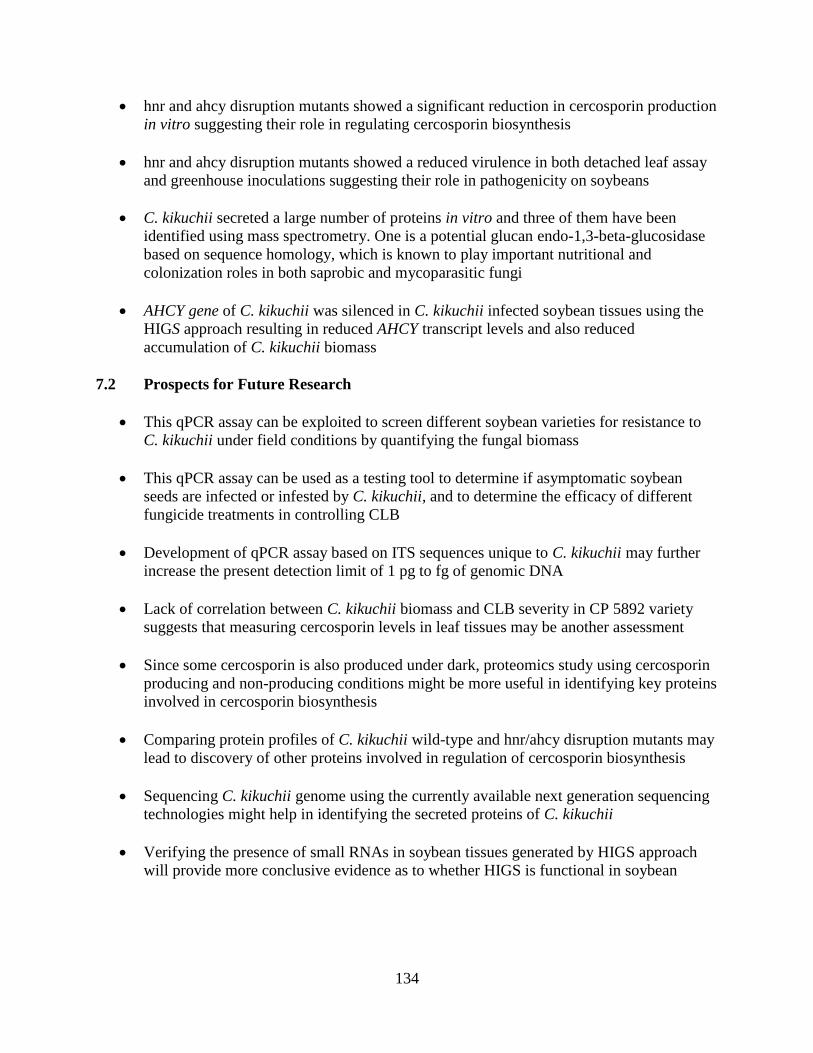
134
hnr and ahcy disruption mutants showed a significant reduction in cercosporin production
in vitro suggesting their role in regulating cercosporin biosynthesis
hnr and ahcy disruption mutants showed a reduced virulence in both detached leaf assay
and greenhouse inoculations suggesting their role in pathogenicity on soybeans
C. kikuchii secreted a large number of proteins in vitro and three of them have been
identified using mass spectrometry. One is a potential glucan endo-1,3-beta-glucosidase
based on sequence homology, which is known to play important nutritional and
colonization roles in both saprobic and mycoparasitic fungi
AHCY gene of C. kikuchii was silenced in C. kikuchii infected soybean tissues using the
HIGS approach resulting in reduced AHCY transcript levels and also reduced
accumulation of C. kikuchii biomass
7.2 Prospects for Future Research
This qPCR assay can be exploited to screen different soybean varieties for resistance to
C. kikuchii under field conditions by quantifying the fungal biomass
This qPCR assay can be used as a testing tool to determine if asymptomatic soybean
seeds are infected or infested by C. kikuchii, and to determine the efficacy of different
fungicide treatments in controlling CLB
Development of qPCR assay based on ITS sequences unique to C. kikuchii may further
increase the present detection limit of 1 pg to fg of genomic DNA
Lack of correlation between C. kikuchii biomass and CLB severity in CP 5892 variety
suggests that measuring cercosporin levels in leaf tissues may be another assessment
Since some cercosporin is also produced under dark, proteomics study using cercosporin
producing and non-producing conditions might be more useful in identifying key proteins
involved in cercosporin biosynthesis
Comparing protein profiles of C. kikuchii wild-type and hnr/ahcy disruption mutants may
lead to discovery of other proteins involved in regulation of cercosporin biosynthesis
Sequencing C. kikuchii genome using the currently available next generation sequencing
technologies might help in identifying the secreted proteins of C. kikuchii
Verifying the presence of small RNAs in soybean tissues generated by HIGS approach
will provide more conclusive evidence as to whether HIGS is functional in soybean
135
LITERATURE CITED
Abe Y., Ono C., Hosobuchi M., Yoshikawa H. (2002) Functional analysis of mlcR, a regulatory
gene for ML-236B (compactin) biosynthesis in Penicillium citrinum. Molecular Genetics
and Genomics 268:352-361.
Abramovitch R.B., Janjusevic R., Stebbins C.E., Martin G.B. (2006) Type III effector AvrPtoB
requires intrinsic E3 ubiquitin ligase activity to suppress plant cell death and immunity.
Proceedings of the National Academy of Sciences of the United States of America
103:2851-2856.
Adams D.J. (2004) Fungal cell wall chitinases and glucanases. Microbiology 150:2029-2035.
Ahn J.H., Walton J.D. (1996) Chromosomal organization of TOX2, a complex locus controlling
host-selective toxin biosynthesis in Cochliobolus carbonum. Plant Cell 8:887-897.
Ajiro N., Miyamoto Y., Masunaka A., Tsuge T., Yamamoto M., Ohtani K., Fukumoto T., Gomi
K., Peever T.L., Izumi Y. (2010) Role of the host-selective ACT-toxin synthesis gene
ACTTS2 encoding an enoyl-reductase in pathogenicity of the tangerine pathotype of
Alternaria alternata. Phytopathology 100:120-126.
Allen E., Xie Z., Gustafson A.M., Carrington J.C. (2005) microRNA-directed phasing during
trans-acting siRNA biogenesis in plants. Cell 121:207-221.
Altschul S.F., Madden T.L., Schäffer A.A., Zhang J., Zhang Z., Miller W., Lipman D.J. (1997)
Gapped BLAST and PSI-BLAST: a new generation of protein database search programs.
Nucleic Acids Research 25:3389-3402.
Ambros V., Bartel B., Bartel D.P., Burge C.B., Carrington J.C., Chen X., Dreyfuss G., Eddy
S.R., Griffiths-Jones S., Marshall M. (2003) A uniform system for microRNA annotation.
RNA 9:277-279.
Amnuaykanjanasin A., Daub M.E. (2009) The ABC transporter ATR1 is necessary for efflux of
the toxin cercosporin in the fungus Cercospora nicotianae. Fungal Genetics and Biology
46:146-158. DOI: 10.1016/j.fgb.2008.11.007.
Assante G., Locci R., Camarda L., Merlini L., Nasini G. (1977) Screening of genus Cercospora
for secondary metabolites. Phytochemistry 16:243-247.
Balis C., Payne M.G. (1971) Triglycerides and cercosporin from Cercospora beticola - fungal
growth and cercosporin production. Phytopathology 61:1477-1484.
Ballance G.M., Lamari L., Bernier C.C. (1989) Purification and characterization of a host-
selective necrosis toxin from Pyrenophora tritici-repentis. Physiological and Molecular
Plant Pathology 35:203-213.

136
Bartel D.P. (2004) MicroRNAs: genomics, biogenesis, mechanism, and function. Cell 116:281-
297.
Baulcombe D. (2004) RNA silencing in plants. Nature 431:356-363.
Baum J.A., Bogaert T., Clinton W., Heck G.R., Feldmann P., Ilagan O., Johnson S., Plaetinck
G., Munyikwa T., Pleau M. (2007) Control of coleopteran insect pests through RNA
interference. Nature Biotechnology 25:1322-1326.
Bell A.A., Wheeler M.H. (1986) Biosynthesis and functions of fungal melanins. Annual Review
of Phytopathology 24:411-451.
Berggren K.N., Schulenberg B., Lopez M.F., Steinberg T.H., Bogdanova A., Smejkal G., Wang
A., Patton W.F. (2002) An improved formulation of SYPRO Ruby protein gel stain:
comparison with the original formulation and with a ruthenium II tris
(bathophenanthroline disulfonate) formulation. Proteomics 2:486-498.
Bhadauria V., Popescu L., Zhao W.S., Peng Y.L. (2007) Fungal transcriptomics. Microbiological
Research 162:285-298. DOI: 10.1016/j.micres.2007.06.006.
Blencowe B.J., Khanna M. (2007) RNA in control. Nature 447:391-393.
Bluhm B.H., Dhillon B., Lindquist E.A., Kema G.H., Goodwin S.B., Dunkle L.D. (2008)
Analyses of expressed sequence tags from the maize foliar pathogen Cercospora zeae-
maydis identify novel genes expressed during vegetative, infectious, and reproductive
growth. BMC Genomics 9:523. DOI: 10.1186/1471-2164-9-523.
Böhm J., Hahn A., Schubert R., Bahnweg G., Adler N., Nechwatal J., Oehlmann R., Obszwald
W. (1999) Real-time Quantitative PCR: DNA determination in isolated spores of the
mycorrhizal fungus Glomus mosseae and monitoring of Phytophthora infestans and
Phytophthora citricola in their respective host plants. Journal of Phytopathology
147:409-416. DOI: 10.1111/j.1439-0434.1999.tb03842.x.
Böhmer M., Colby T., Böhmer C., Bräutigam A., Schmidt J., Bölker M. (2007) Proteomic
analysis of dimorphic transition in the phytopathogenic fungus Ustilago maydis.
Proteomics 7:675-685.
Bradford M.M. (1976) A rapid and sensitive method for the quantitation of microgram quantities
of protein utilizing the principle of protein-dye binding. Analytical Biochemistry 72:248-
254.
Brito N., Espino J.J., Gonzalez C. (2006) The endo-beta-1,4-xylanase xyn11A is required for
virulence in Botrytis cinerea. Molecular Plant-Microbe Interactions 19:25-32. DOI:
10.1094/mpmi-19-0025.

137
Broude N.E. (2005) Molecular Beacons and Other Hairpin Probes. Encyclopedia of Diagnostic
Genomics and Proteomics DOI: 10.1081/E-EDGP 120020717
Brown D.W., Yu J.H., Kelkar H.S., Fernandes M., Nesbitt T.C., Keller N.P., Adams T.H.,
Leonard T.J. (1996) Twenty-five coregulated transcripts define a sterigmatocystin gene
cluster in Aspergillus nidulans. Proceedings of the National Academy of Sciences
93:1418-1422.
Brown M.P., Brown-Jenco C.S., Payne G.A. (1999) Genetic and molecular analysis of aflatoxin
biosynthesis. Fungal Genetics and Biology 26:81-98.
Bulcke M., Bauw G., Castresana C., Van Montagu M., Vandekerckhove J. (1989)
Characterization of vacuolar and extracellular β (1, 3)-glucanases of tobacco: Evidence
for a strictly compartmentalized plant defense system. Proceedings of the National
Academy of Sciences 86:2673.
Cai G., Schneider R.W. (2005) Vegetative compatibility groups in Cercospora Kuchii, the causal
agent of cercospora leaf blight and purple seed stain in soybean. Phytopathology 95:257-
261. DOI: 10.1094/phyto-95-0257.
Cai G., Schneider R.W. (2008) Population structure of Cercospora kikuchii, the causal agent of
Cercospora leaf blight and purple seed stain in soybean. Phytopathology 98:823-829.
Cai G.H., Schneider R.W., Padgett G.B. (2009) Assessment of lineages of Cercospora kikuchii
in Louisiana for aggressiveness and screening soybean cultivars for resistance to
cercospora leaf blight. Plant Disease 93:868-874. DOI: 10.1094/pdis-93-9-0868.
Callahan T.M., Rose M.S., Meade M.J., Ehrenshaft M., Upchurch R.G. (1999) CFP, the putative
cercosporin transporter of Cercospora kikuchii, is required for wild type cercosporin
production, resistance, and virulence on soybean. Molecular Plant-Microbe Interactions
12:901-910.
Calpouzos L., Stallknecht G.F. (1966) Phototropism by conidiophores of Cercospora beticola.
Phytopathology 56:702-704.
Calpouzos L., Stalknecht G.F. (1967) Symptoms of Cercospora leaf spot of sugar beets
influenced by light intensity. Phytopathology 57:799-800.
Candiano G., Bruschi M., Musante L., Santucci L., Ghiggeri G.M., Carnemolla B., Orecchia P.,
Zardi L., Righetti P.G. (2004) Blue silver: a very sensitive colloidal Coomassie G-250
staining for proteome analysis. Electrophoresis 25:1327-1333.
Cao A.X., Liu X.Z., Zhu S.F., Lu B.S. (2005) Detection of the pinewood nematode,
Bursaphelenchus xylophilus, using a real-time polymerase chain reaction assay.
Phytopathology 95:566-571.

138
Cao T., Kim Y.M., Kav N.N.V., Strelkov S.E. (2009) A proteomic evaluation of Pyrenophora
tritici repentis, causal agent of tan spot of wheat, reveals major differences between
virulent and avirulent isolates. Proteomics 9:1177-1196.
Carpentier S.C., Witters E., Laukens K., Deckers P., Swennen R., Panis B. (2005) Preparation of
protein extracts from recalcitrant plant tissues: An evaluation of different methods for
two-dimensional gel electrophoresis analysis. Proteomics 5:2497-2507. DOI:
10.1002/pmic.200401222.
Carthew R.W., Sontheimer E.J. (2009) Origins and mechanisms of miRNAs and siRNAs. Cell
136:642-655.
Catanzariti A.M., Dodds P.N., Lawrence G.J., Ayliffe M.A., Ellis J.G. (2006) Haustorially
expressed secreted proteins from flax rust are highly enriched for avirulence elicitors.
Plant Cell 18:243-256.
Catanzariti A.M., Jones D.A. (2010) Effector proteins of extracellular fungal plant pathogens
that trigger host resistance. Functional Plant Biology 37:901-906.
Cerkauskas R.F., Sinclair J.B. (1980) Use of paraquat to aid detection of fungi in soybean
tissues. Phytopathology 70:1036-1038.
Cerutti H., Casas-Mollano J.A. (2006) On the origin and functions of RNA-mediated silencing:
from protists to man. Current Genetics 50:81-99.
Chanda A.K., Chen Z., Schneider R.W. (2009) Real-time PCR-based detection and
quantification of Cercospora kikuchii in soybean plants. Phytopathology 99:S197-S197.
Cheah M.T., Wachter A., Sudarsan N., Breaker R.R. (2007) Control of alternative RNA splicing
and gene expression by eukaryotic riboswitches. Nature 447:497-500.
Chen M.D., Lyda S.D., Halliwell R.S. (1979) Environmental factors influencing growth and
sporulation of Cercospora kikuchii. Mycologia 71:1150-1157.
Chen S.X., Harmon A.C. (2006) Advances in plant proteomics. Proteomics 6:5504-5516. DOI:
10.1002/pmic.200600143.
Chen Z.Y., Brown R.L., Rajasekaran K., Damann K.E., Cleveland T.E. (2006b) Identification of
a maize kernel pathogenesis-related protein and evidence for its involvement in resistance
to Aspergillus flavus infection and aflatoxin production. Phytopathology 96:87-95. DOI:
10.1094/phyto-96-0087.
Chen Y.M., Chen T., Shen S.H., Zheng M.Z., Guo Y.M., Lin J.X., Baluska F., Samaj J. (2006a)
Differential display proteomic analysis of Picea meyeri pollen germination and pollen-
tube growth after inhibition of actin polymerization by latrunculin B. Plant Journal
47:174-195. DOI: 10.1111/j.1365-313X.2006.02783.x.

139
Chen H.Q., Lee M.H., Chung K.R. (2007a) Functional characterization of three genes encoding
putative oxidoreductases required for cercosporin toxin biosynthesis in the fungus
Cercospora nicotianae. Microbiology 153:2781-90. DOI: 10.1099/mic.0.2007/007294-0.
Chen H., Lee M.H., Daub M.E., Chung K.R. (2007b) Molecular analysis of the cercosporin
biosynthetic gene cluster in Cercospora nicotianae. Molecular Microbiology 64:755-770.
DOI: 10.1111/j.1365-2958.2007.05689.x.
Chi M.H., Park S.Y., Kim S., Lee Y.H. (2009) A novel pathogenicity gene is required in the rice
blast fungus to suppress the basal defenses of the host. Plos Pathogens 5:e1000401.
DOI:10.1371/journal.ppat.1000401.
Choquer M., Dekkers K.L., Chen H.Q., Cao L., Ueng P.P., Daub M.E., Chung K.R. (2005) The
CTB1 gene encoding a fungal polyketide synthase is required for cercosporin
biosynthesis and fungal virulence of Cercospora nicotianae. Molecular Plant-Microbe
Interactions 18:468-76. DOI: 10.1094/MPMI-18-0468.
Choquer M., Lee M.H., Bau H.J., Chung K.R. (2007) Deletion of a MFS transporter-like gene in
Cercospora nicotianae reduces cercosporin toxin accumulation and fungal virulence.
FEBS Letters 581:489-494. DOI: 10.1016/j.febslet.2007.01.011.
Chumley F.G., Valent B. (1990) Genetic analysis of melanin-deficient, nonpathogenic mutants
of Magnaporthe grisea. Molecular Plant-Microbe Interactions 3:135-143.
Chung K.R. (2003) Involvement of calcium/calmodulin signaling in cercosporin toxin
biosynthesis by Cercospora nicotianae. Applied and Environmental Microbiology
69:1187-1196. DOI: 10.1128/aem.69.2.1187-1196.2003.
Chung K.R., Ehrenshaft M., Daub M.E. (2002a) Functional expression and cellular localization
of cercosporin-resistance proteins fused with the GFP in Cercospora nicotianae. Current
Genetics 41:159-167. DOI: 10.1007/s00294-002-0289-8.
Chung K.R., Shilts T., Li W., Timmer L.W. (2002b) Engineering a genetic transformation
system for Colletotrichum acutatum, the causal fungus of lime anthracnose and
postbloom fruit drop of citrus. FEMS Microbiology Letters 213:33-39.
Chung K.R., Daub M.E., Ehrenshaft M. (2003a) Expression of the cercosporin toxin resistance
gene (CRG1) as a dicistronic mRNA in the filamentous fungus Cercospora nicotianae.
Current Genetics 43:415-424. DOI: 10.1007/s00294-003-0414-3.
Chung K.R., Daub M.E., Kuchler K., Schuller C. (2003b) The CRG1 gene required for
resistance to the singlet oxygen-generating cercosporin toxin in Cercospora nicotianae
encodes a putative fungal transcription factor. Biochemical and Biophysical Research
Communications 302:302-310. DOI: 10.1016/s0006-291x(03)00171-2.

140
Chung K.R., Ehrenshaft M., Wetzel D.K., Daub M.E. (2003c) Cercosporin-deficient mutants by
plasmid tagging in the asexual fungus Cercospora nicotianae. Molecular Genetics and
Genomics 270:103-113. DOI: 10.1007/s00438-003-0902-7.
Chung E., Seong E., Kim Y.C., Chung E.J., Oh S.K., Lee S., Park J.M., Joung Y.H., Choi D.
(2004) A method of high frequency virus-induced gene silencing in chili pepper
(Capsicum annuum L. cv. Bukang). Molecules and Cells 17:377-380.
Chung K.R., Liao H.L. (2008) Determination of a transcriptional regulator-like gene involved in
biosynthesis of elsinochrome phytotoxin by the citrus scab fungus, Elsinoë fawcettii.
Microbiology 154:3556-3566.
Chupp C. (1954) A monograph of the fungus genus Cercospora. Cornell University Press,
Ithaca, New York.
Chupp C. (1957) The possible infection of the human body with Cercospora appi. Mycologia
49:773-774.
Cogoni C., Macino G. (1999) Gene silencing in Neurospora crassa requires a protein
homologous to RNA-dependent RNA polymerase. Nature 399:166-169.
Cooper B., Neelam A., Campbell K.B., Lee J., Liu G., Garrett W.M., Scheffler B., Tucker M.L.
(2007) Protein accumulation in the germinating Uromyces appendiculatus uredospore.
Molecular Plant-Microbe Interactions 20:857-866.
Cui H., Xiang T., Zhou J.M. (2009) Plant immunity: a lesson from pathogenic bacterial effector
proteins. Cellular Microbiology 11:1453-1461.
Damerval C., de Vienne D., Zivy M., Thiellement H. (1986) Technical improvements in two-
dimensional electrophoresis increase the level of genetic variation detected in wheat-
seedling proteins. Electrophoresis 7:52-54. DOI: 10.1002/elps.1150070108.
Dang Y., Yang Q., Xue Z., Liu Y. (2011) RNA Interference in Fungi: Pathways, Functions, and
Applications. Eukaryotic Cell 10:1148-1155.
Dangl J.L., Jones J.D.G. (2001) Plant pathogens and integrated defence responses to infection.
Nature 411:826-833.
Daub M.E. (1982) Peroxidation of tobacco membrane-lipids by the photosensitizing toxin,
cercosporin. Plant Physiology 69:1361-1364.
Daub M.E. (1987) The fungal photosensitizer cercosporin and its role in plant disease. ACS
Symposium Series 339:271-280.
Daub M.E., Briggs S.P. (1982) Membrane fluidity changes induced by the photosensitizing
toxin, cercosporin. Phytopathology 72:941-941.

141
Daub M.E., Briggs S.P. (1983) Changes in tobacco cell membrane composition and structure
caused by the fungal toxin, cercosporin. Plant Physiology 71:763-766.
Daub M.E., Ehrenshaft, M. (1997) The photoactivated toxin cercosporin: toxicity, resistance,
regulation and role in disease. Pages 37-66 in: Toxins in Plant Disease Development and
Evolving Biotechnology. R.K. Upadhyay and K.G. Mukerji, eds. Science Publishers,
Enfield, N.H.
Daub M.E., Ehrenshaft M. (2000) The photoactivated Cercospora toxin cercosporin:
Contributions to plant disease and fundamental biology. Annual Review of
Phytopathology 38:461-490.
Daub M.E., Hangarter R.P. (1983) Light-induced production of singlet oxygen and superoxide
by the fungal toxin, cercosporin. Plant Physiology 73:855-857.
Daub M.E., Leisman G.B., Clark R.A., Bowden E.F. (1992) Reductive detoxification as a
mechanism of fungal resistance to singlet oxygen-generating photosensitizers.
Proceedings of the National Academy of Sciences 89:9588-9592.
Davison D.B. (2002) The number of human genes and proteins. Nanotechnology 2:6-11.
De Bellis P., Schena L., Cariddi C. (2007) Real-time Scorpion-PCR detection and quantification
of Erwinia amylovora on pear leaves and flowers. European Journal of Plant Pathology
118:11-22. DOI: 10.1007/s10658-006-9078-4.
de la Cadena M.P., Rodriguez-Pineiro A.M., Alvarez-Chaver P., Martinez-Zorzano V.S.,
Rodriguez-Berrocal F.J. (2007) Relevance of protein isoforms in proteomic studies.
Current Proteomics 4:235-252.
de la Cruz J., Pintor-Toro J.A., Benitez T., Llobell A., Romero L.C. (1995) A novel endo-β-1, 3-
glucanase, BGN13. 1, involved in the mycoparasitism of Trichoderma harzianum.
Journal of Bacteriology 177:6937-6945.
de Vries R. (2003) Regulation of Aspergillus genes encoding plant cell wall polysaccharide-
degrading enzymes; relevance for industrial production. Applied Microbiology and
Biotechnology 61:10-20.
de Wit P.J.G.M. (2007) How plants recognize pathogens and defend themselves. Cellular and
Molecular Life Sciences 64:2726-2732.
Deising H., Nicholson R.L., Haug M., Howard R.J., Mendgen K. (1992) Adhesion pad formation
and the involvement of cutinase and esterases in the attachment of uredospores to the host
cuticle. Plant Cell 4:1101-1111. DOI: 10.2307/3869478.
Dekkers K.L., You B.J., Gowda V.S., Liao H.L., Lee M.H., Bau H.H., Ueng P.P., Chung K.R.
(2007) The Cercospora nicotianae gene encoding dual O-methyltransferase and FAD-
142
dependent monooxygenase domains mediates cercosporin toxin biosynthesis. Fungal
Genetics and Biology 44:444-454. DOI: 10.1016/j.fgb.2006.08.005.
Dixon D.M., Polak A., Szaniszlo P.J. (1987) Pathogenicity and virulence of wild-type and
melanin-deficient Wangiella dermatitidis. Medical Mycology 25:97-106.
Dobrowolski D.C., Foote C.S. (1983) Chemistry of singlet oxygen cercosporin, a singlet oxygen
generator. Angewandte Chemie-International Edition in English 22:720-721.
Dodds P.N., Lawrence G.J., Catanzariti A.M., Ayliffe M.A., Ellis J.G. (2004) The Melampsora
lini AvrL567 avirulence genes are expressed in haustoria and their products are
recognized inside plant cells. Plant Cell 16:755-768.
Domon B., Aebersold R. (2006) Mass spectrometry and protein analysis. Science 312:212-217.
Doxey A.C., Yaish M.W.F., Moffatt B.A., Griffith M., McConkey B.J. (2007) Functional
divergence in the Arabidopsis β-1, 3-glucanase gene family inferred by phylogenetic
reconstruction of expression states. Molecular biology and evolution 24:1045-1055.
Ehrenshaft M., Upchurch R.G. (1991) Isolation of light-enhanced cDNAs of Cercospora
kikuchii. Applied and Environmental Microbiology 57:2671-2676.
Ehrenshaft M., Upchurch R.G. (1993) Host protein (s) induces accumulation of the toxin
cercosporin and mRNA in a phytopathogenic strain of Cercospora kikuchii.
Physiological and Molecular Plant Pathology 43:95-107.
Ehrenshaft M., Jenns A.E., Chung K.R., Daub M.E. (1998) SOR1, a gene required for
photosensitizer and singlet oxygen resistance in Cercospora fungi, is highly conserved in
divergent organisms. Molecular Cell 1:603-609.
Ehrenshaft M., Chung K.R., Jenns A.E., Daub M.E. (1999) Functional characterization of SOR1,
a gene required for resistance to photosensitizing toxins in the fungus Cercospora
nicotianae. Current Genetics 34:478-85.
Elgholl N.E., Alfieri S.A., Ridings W.H., Schoulties C.L. (1982) Growth and sporulation invitro
of Cercospora apii, Cercospora arachidicola, Cercospora kikuchii and other species of
Cercospora. Canadian Journal of Botany-Revue Canadienne De Botanique 60:862-868.
Espino J.J., Gutiérrez-Sánchez G., Brito N., Shah P., Orlando R., González C. (2010) The
Botrytis cinerea early secretome. Proteomics 10:3020-3034.
Fajola A.O. (1978) Cercosporin, a phytotoxin from Cercospora spp. Physiological Plant
Pathology 13:157-164.
Fehr W.R., Caviness C.E., Burmood D.T., Pennington J.S. (1971) Stage of development
descriptions for soybeans, Glycine max (L.) Merrill. Crop Science 11:929-931.
143
Fekete C., Fung R.W.M., Szabó Z., Qiu W., Chang L., Schachtman D.P., Kovács L.G. (2009)
Up-regulated transcripts in a compatible powdery mildew-grapevine interaction. Plant
Physiology and Biochemistry 47:732-738.
Fernández-Acero F.J., Jorge I., Calvo E., Vallejo I., Carbú M., Camafeita E., López J.A.,
Cantoral J.M., Jorrín J. (2006) Two dimensional electrophoresis protein profile of the
phytopathogenic fungus Botrytis cinerea. Proteomics 6:S88-96.
Fernández-Acero F.J., Jorge I., Calvo E., Vallejo I., Carbú M., Camafeita E., Garrido C., Lopez
J.A., Jorrin J., Cantoral J.M. (2007) Proteomic analysis of phytopathogenic fungus
Botrytis cinerea as a potential tool for identifying pathogenicity factors, therapeutic
targets and for basic research. Archives of Microbiology 187:207-215.
Fernández-Acero F.J., Colby T., Harzen A., Carbú M., Wieneke U., Cantoral J.M., Schmidt J.
(2010) 2-DE proteomic approach to the Botrytis cinerea secretome induced with different
carbon sources and plant-based elicitors. Proteomics 10:2270-2280.
Filion M., St-Arnaud M., Jabaji-Hare S.H. (2003) Direct quantification of fungal DNA from soil
substrate using real-time PCR. Journal of Microbiological Methods 53:67-76.
Fire A., Xu S.Q., Montgomery M.K., Kostas S.A., Driver S.E., Mello C.C. (1998) Potent and
specific genetic interference by double-stranded RNA in Caenorhabditis elegans. Nature
391:806-811.
Fraaije B.A., Lovell D.J., Coelho J.M., Baldwin S., Hollomon D.W. (2001) PCR-based assays to
assess wheat varietal resistance to blotch (Septoria tritici and Stagonospora nodorum)
and rust (Puccinia striiformis and Puccinia recondita) diseases. European Journal of
Plant Pathology 107:905-917.
Fragner D., Zomorrodi M., Kües U., Majcherczyk A. (2009) Optimized protocol for the 2-DE of
extracellular proteins from higher basidiomycetes inhabiting lignocellulose.
Electrophoresis 30:2431-2441.
Francois C., Castagnone C., Boonham N., Tomlinson J., Lawson R., Hockland S.U.E., Quill J.,
Vieira P., Mota M., Castagnone-Sereno P. (2007) Satellite DNA as a target for TaqMan
real-time PCR detection of the pinewood nematode, Bursaphelenchus xylophilus.
Molecular Plant Pathology 8:803-809.
Freimoser F.M., Screen S., Hu G., St Leger R. (2003) EST analysis of genes expressed by the
zygomycete pathogen Conidiobolus coronatus during growth on insect cuticle.
Microbiology 149:1893-1900.
Frizzi A., Huang S. (2010) Tapping RNA silencing pathways for plant biotechnology. Plant
Biotechnology Journal 8:655-677.

144
Fudal I., Ross S., Gout L., Blaise F., Kuhn M.L., Eckert M.R., Cattolico L., Bernard-Samain S.,
Balesdent M.H., Rouxel T. (2007) Heterochromatin-like regions as ecological niches for
avirulence genes in the Leptosphaeria maculans genome: map-based cloning of AvrLm6.
Molecular Plant-Microbe Interactions 20:459-470.
Gachon C., Saindrenan P. (2004) Real-time PCR monitoring of fungal development in
Arabidopsis thaliana infected by Alternaria brassicicola and Botrytis cinerea. Plant
Physiology and Biochemistry 42:367-371.
Gao X., Jackson T.A., Lambert K.N., Li S., Hartman G.L., Niblack T.L. (2004) Detection and
quantification of Fusarium solani f. sp glycines in soybean roots with real-time
quantitative polymerase chain reaction. Plant Disease 88:1372-1380.
Gardiner D.M., Cozijnsen A.J., Wilson L.M., Pedras M.S.C., Howlett B.J. (2004) The
sirodesmin biosynthetic gene cluster of the plant pathogenic fungus Leptosphaeria
maculans. Molecular Microbiology 53:1307-1318.
Gardner M.W. (1926) Indiana plant diseases, 1924, Proceedings of Indiana Academy of Science.
pp. 237-257.
Gent J.I., Lamm A.T., Pavelec D.M., Maniar J.M., Parameswaran P., Tao L., Kennedy S., Fire
A.Z. (2010) Distinct phases of siRNA synthesis in an endogenous RNAi pathway in C.
elegans soma. Molecular Cell 37:679-689.
Ghildiyal M., Zamore P.D. (2009) Small silencing RNAs: an expanding universe. Nature
Reviews Genetics 10:94-108.
Godfrey D., Zhang Z., Saalbach G., Thordal-Christensen H. (2009) A proteomics study of barley
powdery mildew haustoria. Proteomics 9:3222-3232.
Gonzalez-Fernandez R., Prats E., Jorrin-Novo J.V. (2010) Proteomics of plant pathogenic fungi.
Journal of Biomedicine and Biotechnology. DOI: 93252710.1155/2010/932527.
Goodwin S.B., Dunkle L.D., Zismann V.L. (2001) Phylogenetic analysis of Cercospora and
Mycosphaerella based on the internal transcribed spacer region of ribosomal DNA.
Phytopathology 91:648-658.
Görg A., Weiss W., Dunn M.J. (2004) Current two dimensional electrophoresis technology for
proteomics. Proteomics 4:3665-3685.
Gout L., Fudal I., Kuhn M.L., Blaise F., Eckert M., Cattolico L., Balesdent M.H., Rouxel T.
(2006) Lost in the middle of nowhere: the AvrLm1 avirulence gene of the
Dothideomycete Leptosphaeria maculans. Molecular Microbiology 60:67-80.
145
Grinyer J., McKay M., Herbert B., Nevalainen H. (2004) Fungal proteomics: mapping the
mitochondrial proteins of a Trichoderma harzianum strain applied for biological control.
Current Genetics 45:170-175.
Guo J.R., Schnieder F., Verreet J.A. (2006) Presymptomatic and quantitative detection of
Mycosphaerella graminicola development in wheat using a real-time PCR assay. Fems
Microbiology Letters 262:223-229. DOI: 10.1111/j.1574-6968.2006.00393.x.
Guo J.R., Schnieder F., Verreet J.A. (2007) A Real-time PCR Assay for Quantitative and
Accurate Assessment of Fungicide Effects on Mycosphaerella graminicola Leaf Blotch.
Journal of Phytopathology 155:482-487.
Gygi S.P., Rochon Y., Franza B.R., Aebersold R. (1999) Correlation between protein and mRNA
abundance in yeast. Molecular and Cellular Biology 19:1720-1730.
Hahn M., Jüngling S., Knogge W. (1993) Cultivar-specific elicitation of barley defense reactions
by the phytotoxic peptide NIP1 from Rhynchosporium secalis. Molecular Plant-Microbe
Interactions 6:745-754.
Hannon G.J. (2002) RNA interference. Nature 418:244-251.
Hart C., Schulenberg B., Steinberg T.H., Leung W.Y., Patton W.F. (2003) Detection of
glycoproteins in polyacrylamide gels and on electroblots using Pro-Q Emerald 488 dye, a
fluorescent periodate Schiff base stain. Electrophoresis 24:588-598.
Hartman P.E., Dixon W.J., Dahl T.A., Daub M.E. (1988) Multiple modes of photodynamic
action by cercosporin. Photochemistry and Photobiology 47:699-703.
Hartman G.L., Sinclair J.B., Rupe J.C. (1999) Compendium of soybean diseases. Fourth ed.
American Phytopathological Society Press, St. Paul, MN.
Hartwig, E.E. (1973) Varietal development. In: Soybeans: Improvement, Production, and Uses,
B. E. Caldell, ed. American Society of Agronomy Monograph 16, Madison, Wisconsin.
pp. 187-210
Heid C.A., Stevens J., Livak K.J., Williams P.M. (1996) Real time quantitative PCR. Genome
Research 6:986-994.
Helber N., Wippel K., Sauer N., Schaarschmidt S., Hause B., Requena N. (2011) A versatile
monosaccharide transporter that operates in the arbuscular mycorrhizal fungus Glomus sp
is crucial for the symbiotic relationship with plants. Plant Cell 23:3812-3823.
Herrling T., Jung K., Fuchs J. (2008) The role of melanin as protector against free radicals in
skin and its role as free radical indicator in hair. Spectrochimica Acta Part A: Molecular
and Biomolecular Spectroscopy 69:1429-1435.

146
Hightower R.C., Callahan T.M., Upchurch R.G. (1995) Electrophoretic karyotype of Cercospora
kikuchii. Current Genetics 27:290-292.
Hogg A.C., Johnston R.H., Dyer A.T. (2007) Applying real-time quantitative PCR to fusarium
crown rot of wheat. Plant Disease 91:1021-1028. DOI: Doi 10.1094/Pdis-91-8-1021.
Hohn T.M., McCormick S.P., Desjardins A.E. (1993) Evidence for a gene cluster involving
trichothecene-pathway biosynthetic genes in Fusarium sporotrichioides. Current
Genetics 24:291-295.
Howard R.J., Valent B. (1996) Breaking and entering: host penetration by the fungal rice blast
pathogen Magnaporthe grisea. Annual Reviews in Microbiology 50:491-512.
Huang G., Allen R., Davis E.L., Baum T.J., Hussey R.S. (2006) Engineering broad root-knot
resistance in transgenic plants by RNAi silencing of a conserved and essential root-knot
nematode parasitism gene. Proceedings of the National Academy of Sciences 103:14302-
14306. DOI: 10.1073/pnas.0604698103.
Hurkman W.J., Tanaka C.K. (1986) Solubilization of plant membrane proteins for analysis by
two-dimensional gel electrophoresis. Plant Physiology 81:802-806.
Huvenne H., Smagghe G. (2010) Mechanisms of dsRNA uptake in insects and potential of RNAi
for pest control: a review. Journal of Insect Physiology 56:227-235.
Isshiki A., Akimitsu K., Yamamoto M., Yamamoto H. (2001) Endopolygalacturonase is essential
for citrus black rot caused by Alternaria citri but not brown spot caused by Alternaria
alternata. Molecular Plant-Microbe Interactions 14:749-757.
Jackson E.W., Avant J.B., Overturf K.E., Bonman J.M. (2006) A quantitative assay of Puccinia
coronata f. sp avenae DNA in Avena sativa. Plant Disease 90:629-636. DOI: 10.1094/Pd-
90-0629.
Jackson E.W., Feng C., Fenn P., Chen P. (2008) Genetic mapping of resistance to purple seed
stain in PI 80837 soybean. Journal of Heredity 99:319-322. DOI: 10.1093/jhered/esm123.
Jenns A.E., Daub M.E., Upchurch R.G. (1989) Regulation of cercosporin accumulation in
culture by medium and temparature manipulation. Phytopathology 79:213-219.
Jin L.T., Li X.K., Cong W.T., Hwang S.Y., Choi J.K. (2008) Previsible silver staining of protein
in electrophoresis gels with mass spectrometry compatibility. Analytical Biochemistry
383:137-143.
Jones J.P. (1968) Survival of Cercospora kikuchii on soybean stems in the field. Plant Disease
Reporter 52:931-934.
Jones J.D.G., Dangl J.L. (2006) The plant immune system. Nature 444:323-329.
147
Joosten M.H.A.J., Cozijnsen T.J., De Wit P.J.G.M. (1994) Host resistance to a fungal tomato
pathogen lost by a single base-pair change in an avirulence gene. Nature 367:384-386.
Kawamura C., Moriwaki J., Kimura N., Fujita Y., Fuji S., Hirano T., Koizumi S., Tsuge T.
(1997) The melanin biosynthesis genes of Alternaria alternata can restore pathogenicity
of the melanin-deficient mutants of Magnaporthe grisea. Molecular Plant-Microbe
Interactions 10:446-453.
Kawamura C., Tsujimoto T., Tsuge T. (1999) Targeted disruption of a melanin biosynthesis gene
affects conidial development and UV tolerance in the Japanese pear pathotype of
Alternaria alternata. Molecular Plant-Microbe Interactions 12:59-63.
Kikuchi R. (1924) The scientific researches of the alumni association of Utsunomiya agricultural
college (Japan) I:7-25.
Kilpatrick R.A. (1956) Longevity of Cercospora kikuchii on soybean stems. Phytopathology
46:58-58.
Klein D. (2002) Quantification using real-time PCR technology: applications and limitations.
Trends in Molecular Medicine 8:257-260.
Klingelfuss L.H., Yorinori J.T. (2001) Latent infection by Colletotrichum truncatum and
Cercospora kikuchii in soybean. Fitopatologia Brasileira 26:158-164.
Kokkinos C.D., Clark C.A. (2006) Interactions among Sweet potato chlorotic stunt virus and
different potyviruses and potyvirus strains infecting sweetpotato in the United States.
Plant Disease 90:1347-1352. DOI: Doi 10.1094/Pd-90-1347.
Kramer C.Y. (1956) Extension of multiple range tests to group means with unequal numbers of
replications. Biometrics 12:307-310.
Kuhne B.S., Oschmann P. (2002) Quantitative real-time RT-PCR using hybridization probes and
imported standard curves for cytokine gene expression analysis. Biotechniques 33:1078-
1089.
Kuyama S., Tamura T. (1957) Cercosporin - A piment of Cercospora kikuchii Matsumoto Et
Tomoyasu. 1. Cultivation of fungus, isolation and purification of pigment. Journal of the
American Chemical Society 79:5725-5726.
Kuyama S. (1962) Cercosporin- Pigment of Cercosporina kikuchii -Matsomoto Et Tomoyasu 3.
Nature of aromatic ring of cercosporin. Journal of Organic Chemistry 27:939-944.
Lamour K.H., Finley L., Hurtado-Gonzales O., Gobena D., Tierney M., Meijer H.J.G. (2006)
Targeted gene mutation in Phytophthora spp. Molecular Plant-Microbe Interactions
19:1359-1367.
148
Langfelder K., Streibel M., Jahn B., Haase G., Brakhage A.A. (2003) Biosynthesis of fungal
melanins and their importance for human pathogenic fungi. Fungal Genetics and Biology
38:143-158.
Laugé R., Joosten M.H.A.J., van den Ackerveken G.F.J.M., van den Broek H.W.J., de Wit
P.J.G.M. (1997) The in planta-produced extracellular proteins ECP1 and ECP2 of
Cladosporium fulvum are virulence factors. Molecular Plant-Microbe Interactions
10:725-734. DOI: 10.1094/mpmi.1997.10.6.725.
Laugé R., Goodwin P.H., De Wit P.J.G.M., Joosten M.H.A.J. (2000) Specific HR-associated
recognition of secreted proteins from Cladosporium fulvum occurs in both host and non-
host plants. The Plant Journal 23:735-745. DOI: 10.1046/j.1365-313x.2000.00843.x.
Lehman S.G. (1950) Purple Stain of Soybean Seeds. North Carolina Agricultural Experimental
Station Bulletin 39:11.
Leisman G.B., Daub M.E. (1992) Singlet oxygen yields, optical properties, and phototoxicity of
reduced derivatives of the photosensitizer cercosporin. Photochemistry and Photobiology
55:373-379.
Leonard B.R., Boquet J.D., Padgett B., Davis J.A., Schneider R.W., Griffin J.L., Valverde R.A.,
Levy R.J. (2011) Soybean green plant malady contributing factors and mitigation.
Louisiana Agriculture 54:32-34.
Leubner-Metzger G., Meins F. (1999) Functions and regulation of plant ß-1, 3-glucanases (PR-
2). Pathogenesis-related proteins in plants Datta SK, Mmuthukrishnan S (eds) CRC Press.
pp:49-76.
Levy R., Blanche S.B., Boquet D.J., Golden B., Harrell D., Padgett G.B., Stephenson D., Stevens
J., Viator S., Udeigwe T.K. (2011) Soybean Variety Yields and Production Practices.
LSU AgCenter publication.
Li R., Rimmer R., Buchwaldt L., Sharpe A.G., Séguin-Swartz G., Coutu C., Hegedus D.D.
(2004) Interaction of Sclerotinia sclerotiorum with a resistant Brassica napus cultivar:
expressed sequence tag analysis identifies genes associated with fungal pathogenesis.
Fungal Genetics and Biology 41:735-753.
Li D., Behiatnia S.A.A., Dry I.B., Walker A.R., Randles J.W., Rezaian M.A. (2008a) Tomato
leaf curl virus satellite DNA as a gene silencing vector activated by helper virus
infection. Virus Research 136:30-34. DOI: 10.1016/j.virusres.2008.04.011.
Li S., Hartman G.L., Domier L.L., Boykin D. (2008b) Quantification of Fusarium solani f. sp
glycines isolates in soybean roots by colony-forming unit assays and real-time
quantitative PCR. Theoretical and Applied Genetics 117:343-352. DOI: 10.1007/s00122-
008-0779-2.

149
Liang Y., Strelkov S.E., Kav N.N.V. (2010) The Proteome of Liquid Sclerotial Exudates from
Sclerotinia sclerotiorum. Journal of Proteome Research 9:3290-3298.
Lim D., Hains P., Walsh B., Bergquist P., Nevalainen H. (2001) Proteins associated with the cell
envelope of Trichoderma reesei: a proteomic approach. Proteomics 1:899-910.
Lousberg R.J., Weiss U., Salemink C.A., Arnone A., Merlini L., Nasini G. (1971) Structure of
cercosporin, a naturally occuring quinone. Journal of the Chemical Society D-Chemical
Communications:1463-1464.
Lu B.W., Hanson M.R. (1994) A single homogeneous form of ATP6 protein accumulates in
petunia mitochondria despite the presence of differentially edited ATP6 transcripts. Plant
Cell 6:1955-1968.
Luderer R., Takken F.L.W., de Wit P.J.G.M., Joosten M.H.A.J. (2002) Cladosporium fulvum
overcomes Cf-2-mediated resistance by producing truncated AVR2 elicitor proteins.
Molecular Microbiology 45:875-884. DOI: 10.1046/j.1365-2958.2002.03060.x.
Luster D.G., McMahon M.B., Carter M.L., Fortis L.L., Nuñez A. (2010) Proteomic analysis of
germinating urediniospores of Phakopsora pachyrhizi, causal agent of Asian soybean
rust. Proteomics 10:3549-3557.
Lynch F.J., Geoghegan M.J. (1979) Role of pigmentation in survival of the leaf spot fungus
Cercospora beticola. Annals of Applied Biology 91:313-318.
Ma B., Zhang K., Hendrie C., Liang C., Li M., Doherty-Kirby A., Lajoie G. (2003) PEAKS:
powerful software for peptide de novo sequencing by tandem mass spectrometry. Rapid
Communications in Mass Spectrometry 17:2337-2342.
Ma Z., Michailides T.J. (2004) A real-time PCR assay for the detection of azoxystrobin-resistant
Alternaria populations from pistachio orchards in California. Crop Protection 23:1259-
1263.
Mackintosh J.A., Choi H.Y., Bae S.H., Veal D.A., Bell P.J., Ferrari B.C., Van Dyk D.D., Verrills
N.M., Paik Y.K., Karuso P. (2003) A fluorescent natural product for ultra sensitive
detection of proteins in one-dimensional and two-dimensional gel electrophoresis.
Proteomics 3:2273-2288.
Macri F., Vianello A. (1979) Inhibition of K+ uptake, H+ extrusion and K+-activated ATPase,
and depolarization of transmembrane potential in plant-tissues treated with Cercospora
beticola toxin. Physiological Plant Pathology 15:161-170.
Madani M., Subbotin S.A., Moens M. (2005) Quantitative detection of the potato cyst nematode,
Globodera pallida, and the beet cyst nematode, Heterodera schachtii, using Real-Time
PCR with SYBR green I dye. Molecular and cellular probes 19:81-86.

150
Mao Y.B., Cai W.J., Wang J.W., Hong G.J., Tao X.Y., Wang L.J., Huang Y.P., Chen X.Y.
(2007) Silencing a cotton bollworm P450 monooxygenase gene by plant-mediated RNAi
impairs larval tolerance of gossypol. Nature Biotechnology 25:1307-1313.
Martinez J.P., Ottum S.A., Ali S., Francl L.J., Ciuffetti L.M. (2001) Characterization of the ToxB
gene from Pyrenophora tritici-repentis. Molecular Plant-Microbe Interactions 14:675-
677.
Masih E.I., Paul B. (2002) Secretion of β-1, 3-glucanases by the yeast Pichia membranifaciens
and its possible role in the biocontrol of Botrytis cinerea causing grey mold disease of the
grapevine. Current Microbiology 44:391-395.
Matsumoto T., Tomoyasu R. (1925) Studies on the purple speck of soybean seed. Annals of
Phytopathological Society of Japan 1:1-14.
McCord J.M., Fridovich I. (1969) Superoxide dismutase. Journal of Biological Chemistry
244:6049.
Medina M.L., Kiernan U.A., Francisco W.A. (2004) Proteomic analysis of rutin-induced
secreted proteins from Aspergillus flavus. Fungal Genetics and Biology 41:327-335.
Medina M.L., Haynes P.A., Breci L., Francisco W.A. (2005) Analysis of secreted proteins from
Aspergillus flavus. Proteomics 5:3153-3161.
Meijer H.J.G., van de Vondervoort P.J.I., Yin Q.Y., de Koster C.G., Klis F.M., Govers F., de
Groot P.W.J. (2006) Identification of cell wall-associated proteins from Phytophthora
ramorum. Molecular Plant-Microbe Interactions 19:1348-1358.
Melnyk C.W., Molnar A., Baulcombe D.C. (2011) Intercellular and systemic movement of RNA
silencing signals. The EMBO Journal 30:3553-3563.
Meyer J.D.F., Silva D.C.G., Yang C., Pedley K.F., Zhang C., van de Mortel M., Hill J.H.,
Shoemaker R.C., Abdelnoor R.V., Whitham S.A. (2009) Identification and analyses of
candidate genes for rpp4-mediated resistance to Asian soybean rust in soybean. Plant
Physiology 150:295-307.
Miller I., Crawford J., Gianazza E. (2006) Protein stains for proteomic applications: which,
when, why? Proteomics 6:5385-5408.
Mitchell T.K., Chilton W.S., Daub M.E. (2002) Biodegradation of the polyketide toxin
cercosporin. Applied and Environmental Microbiology 68:4173-4181. DOI:
10.1128/aem.68.9.4173-4181.2002.
Moore S.H., Wolcott M.C. (2000) Using yield maps to create management zones in field crops.
Louisiana Agriculture 43:12-13.
151
Moore S.H., Boquet D.J. (2009) Evaluating very early maturing soybeans in Louisiana.
Louisiana Agriculture 51:28-29.
Mullis K.B., Faloona F.A. (1987) Specific synthesis of DNA in vitro via a polymerase-catalyzed
chain reaction. Methods in enzymology 155:335-350.
Murakishi H.H. (1951) purple seed stain of soybean. Phytopathology 41:305-318.
Nakayashiki H. (2005) RNA silencing in fungi: mechanisms and applications. FEBS Letters
579:5950-5957.
Nakayashiki H., Kadotani N., Mayama S. (2006) Evolution and diversification of RNA silencing
proteins in fungi. Journal of Molecular Evolution 63:127-135.
Nakayashiki H., Nguyen Q.B. (2008) RNA interference: roles in fungal biology. Current
Opinion in Microbiology 11:494-502.
Nandi A., Krothapalli K., Buseman C.M., Li M., Welti R., Enyedi A., Shah J. (2003)
Arabidopsis sfd mutants affect plastidic lipid composition and suppress dwarfing, cell
death, and the enhanced disease resistance phenotypes resulting from the deficiency of a
fatty acid desaturase. Plant Cell 15:2383-2398.
Napoli C., Lemieux C., Jorgensen R. (1990) Introduction of a chimeric chalcone synthase gene
into petunia results in reversible co-suppression of homologous genes in trans. Plant Cell
2:279-289.
Neuhoff V., Stamm R., Eibl H. (1985) Clear background and highly sensitive protein staining
with Coomassie Blue dyes in polyacrylamide gels: a systematic analysis. Electrophoresis
6:427-448.
Neuhoff V., Arold N., Taube D., Ehrhardt W. (1988) Improved staining of proteins in
polyacrylamide gels including isoelectric focusing gels with clear background at
nanogram sensitivity using Coomassie Brilliant Blue G-250 and R-250. Electrophoresis
9:255-262.
Noir S., Colby T., Harzen A., Schmidt J., Panstruga R. (2009) A proteomic analysis of powdery
mildew (Blumeria graminis f. sp. hordei) conidiospores. Molecular Plant Pathology
10:223-236.
Nowara D., Gay A., Lacomme C., Shaw J., Ridout C., Douchkov D., Hensel G., Kumlehn J.,
Schweizer P. (2010) HIGS: Host-Induced Gene Silencing in the Obligate Biotrophic
Fungal Pathogen Blumeria graminis. Plant Cell 22:3130-3141. DOI:
10.1105/tpc.110.077040.
O' Farrell P.H. (1975) High resolution two-dimensional electrophoresis of proteins. Journal of
Biological Chemistry 250:4007-4021.
152
Oeser B., Heidrich P.M., Müller U., Tudzynski P., Tenberge K.B. (2002) Polygalacturonase is a
pathogenicity factor in the Claviceps purpurea/rye interaction. Fungal Genetics and
Biology 36:176-186.
Oh S.K., Bek K.H., Park J.M., Yi S.Y., Yu S.H., Kamoun S., Choi D. (2008) Capsicum annuum
WRKY protein CaWRKY1 is a negative regulator of pathogen defense. New Phytologist
177:977-989. DOI: 10.1111/j.1469-8137.2007.02310.x.
Okubo A., Yamazaki S., Fuwa K. (1975) Biosynthesis of cercosporin. Agricultural and
Biological Chemistry 39:1173-1175.
Oliver R.P., Rybak K., Shankar M., Loughman R., Harry N., Solomon P.S. (2008) Quantitative
disease resistance assessment by real-time PCR using the Stagonospora nodorum-wheat
pathosystem as a model. Plant Pathology 57:527-532. DOI: 10.1111/j.1365-
3059.2007.01787.x.
Orth C.E., Schuh W. (1992) Histological comparison of latent and active infections of soybean
foliage by Cercospora kikuchii. Phytopathology 82:1159.
Orth C.E., Schuh W. (1994) Resistance of 17 soybean cultivars to foliar, latent, and seed
infection by Cercospora kikuchii. Plant Disease 78:661-664.
Palmer J.L., Abeles R.H. (1979) The mechanism of action of S-adenosylhomocysteinase. Journal
of Biological Chemistry 254:1217-1226.
Pandey A.K., Yang C., Zhang C., Graham M.A., Horstman H.D., Lee Y., Zabotina O.A., Hill
J.H., Pedley K.F., Whitham S.A. (2011) Functional analysis of the Asian soybean rust
resistance pathway mediated by Rpp2. Molecular Plant-Microbe Interactions 24:194-206.
Paper J.M., Scott-Craig J.S., Adhikari N.D., Cuomo C.A., Walton J.D. (2007) Comparative
proteomics of extracellular proteins in vitro and in planta from the pathogenic fungus
Fusarium graminearum. Proteomics 7:3171-3183.
Parlange F., Daverdin G., Fudal I., Kuhn M., Balesdent M.H., Blaise F., Grezes-Besset B.,
Rouxel T. (2009) Leptosphaeria maculans avirulence gene AvrLm4-7 confers a dual
recognition specificity by the Rlm4 and Rlm7 resistance genes of oilseed rape, and
circumvents Rlm4-mediated recognition through a single amino acid change. Molecular
Microbiology 71:851-863. DOI: 10.1111/j.1365-2958.2008.06547.x.
Pastrik K.H., Maiss E. (2000) Detection of Ralstonia solanacearum in potato tubers by
polymerase chain reaction. Journal of Phytopathology-Phytopathologische Zeitschrift
148:619-626.
Pathan M.A., Sinclair J.B., McClary R.D. (1989) Effects of Cercospora kikuchii on soybean seed
germination and quality. Plant Disease 73:720-723.
153
Peleman J., Boerjan W., Engler G., Seurinck J., Botterman J., Alliotte T., Van Montagu M., Inzé
D. (1989) Strong cellular preference in the expression of a housekeeping gene of
Arabidopsis thaliana encoding S-adenosylmethionine synthetase. Plant Cell 1:81-93.
Perkins D.N., Pappinl D.J.C., Creasy D.M., Cottrell J.S. (1999) Probability-based protein
identification by searching sequence databases using mass spectrometry data.
Electrophoresis 20:3551-3567.
Perpetua N.S., Kubo Y., Yasuda N., Takano Y., Furusawa I. (1996) Cloning and characterization
of a melanin biosynthetic THR1 reductase gene essential for appressorial penetration of
Colletotrichum lagenarium. Molecular Plant-Microbe Interactions 9:323-329.
Phalip V., Delalande F., Carapito C., Goubet F., Hatsch D., Leize-Wagner E., Dupree P.,
Dorsselaer A.v., Jeltsch J.M. (2005) Diversity of the exoproteome of Fusarium
graminearum grown on plant cell wall. Current Genetics 48:366-379.
Pico B., Roig C., Fita A., Nuez F. (2008) Quantitative detection of Monosporascus cannonballus
in infected melon roots using real-time PCR. European Journal of Plant Pathology
120:147-156. DOI: 10.1007/s10658-007-9203-z.
Pitson S.M., Seviour R.J., McDougall B.M. (1993) Noncellulolytic fungal β-glucanases: their
physiology and regulation. Enzyme and microbial technology 15:178-192.
Ploper L.D., Abney S., Roy K.W. (1992) Influence of soybean genotype on rate of seed
maturation and its impact on seedborne fungi. Plant Disease 76:287-292.
Proctor R.H., Brown D.W., Plattner R.D., Desjardins A.E. (2003) Co-expression of 15
contiguous genes delineates a fumonisin biosynthetic gene cluster in Gibberella
moniliformis. Fungal Genetics and Biology 38:237-249.
Qi M., Yang Y. (2002) Quantification of Magnaporthe grisea during infection of rice plants
using real-time polymerase chain reaction and northern blot/phosphoimaging analyses.
Phytopathology 92:870-876.
Randhawa P.S., Pannu S.S., Schaad N.W. (2001) Improved Bio-PCR test for detection of
Acidovorax avenae subsp. citrulli in watermelon and cantaloupe seeds. Phytopathology
91:S74.
Recorbet G., Rogniaux H., Gianinazzi-Pearson V., DumasGaudot E. (2009) Fungal proteins in
the extra-radical phase of arbuscular mycorrhiza: a shotgun proteomic picture. New
Phytologist 181:248-260.
Rižner T.L., Wheeler M.H. (2003) Melanin biosynthesis in the fungus Curvularia lunata
(teleomorph: Cochliobolus lunatus). Canadian Journal of Microbiology 49:110-119.
154
Robertson C.L., Ward N.A., Schneider R.W. (2011) Chemical control of Cercospora leaf blight
of soybean: Evaluation of fungicide efficacy and time of application. Phytopathology
101:S268.
Rohe M., Gierlich A., Hermann H., Hahn M., Schmidt B., Rosahl S., Knogge W. (1995) The
race-specific elicitor, NIP1, from the barley pathogen, Rhynchosporium secalis,
determines avirulence on host plants of the Rrs1 resistance genotype. The EMBO journal
14:4168.
Rollins J.A., Ehrenshaft M., Upchurch R.G. (1993) Effects of light-cercosporin and altered
cercosporin phenotypes of gene expression in Cercospora kikuchii. Canadian Journal of
Microbiology 39:118-124.
Romano N., Macino G. (1992) Quelling: transient inactivation of gene expression in Neurospora
crassa by transformation with homologous sequences. Molecular Microbiology 6:3343-
3353. DOI: 10.1111/j.1365-2958.1992.tb02202.x.
Roy K.W., Abney T.S. (1976) Purple seed stain of soybeans. Phytopathology 66:1045-1049.
Roy K.W. (1982) Cercospora kikuchii and other pigmented Cercospora species: Cultural and
reproductive characteristics and pathogenicity to soybean. Canadian Journal of Plant
Pathology 4:226-232.
Sanford J.C., Smith F.D., Russell J.A. (1993) Optimizing the biolistic process for different
biological applications. Methods in enzymology 217:483-509.
Saravanan R.S., Rose J.K.C. (2004) A critical evaluation of sample extraction techniques for
enhanced proteomic analysis of recalcitrant plant tissues. Proteomics 4:2522-2532. DOI:
10.1002/pmic.200300789.
Sayler R.J., Cartwright R.D., Yang Y.N. (2007) Genetic characterization and real-time PCR
detection of Burkholderia glumae, a newly emerging bacterial pathogen of rice in the
United States. Plant Disease 91:1050-1050.
Schaad N.W., Berthier-Schaad Y., Sechler A., Knorr D. (1999) Detection of Clavibacter
michiganensis subsp sepedonicus in potato tubers by BIO-PCR and an automated real-
time fluorescence detection system. Plant Disease 83:1095-1100.
Schmidt A.E., Miller T., Schmidt S.L., Shiekhattar R., Shilatifard A. (1999) Cloning and
characterization of the EAP30 subunit of the ELL complex that confers derepression of
transcription by RNA polymerase II. Journal of Biological Chemistry 274:21981-21985.
Schneider R.W., Whitam H.K. (2002) Evaluation of fungicides for control of Cercospora leaf
blight and frogeye leaf spot in soybeans, 2002. Fungicide and Nematicide Tests
58:FC023.

155
Schneider R.W., Bollich P.K., Harville B.G. (2003) Evaluation of soybean cultivars for reactions
to three foliar diseases. Biological and Cultural Tests for Control of Plant Diseases
18:P003. DOI: 10.1094/BC18.
Schneider R.W., Robertson C.L., Giles C.G., Mumma E.P. (2005) Evaluation of fungicides,
registered to control Asian soybean rust, for the control of Cercospora leaf blight, 2005.
Fungicide and Nematicide Tests 61:FC015.
Schnitzler N., Peltroche-Llacsahuanga H., Bestier N., Zundorf J., Lutticken R., Haase G. (1999)
Effect of melanin and carotenoids of Exophiala (Wangiella) dermatitidis on
phagocytosis, oxidative burst, and killing by human neutrophils. Infection and Immunity
67:94-101.
Schumacher J., De Larrinoa I.F., Tudzynski B. (2008) Calcineurin-responsive zinc finger
transcription factor CRZ1 of Botrytis cinerea is required for growth, development, and
full virulence on bean plants. Eukaryotic Cell 7:584-601.
Seo J.A., Proctor R.H., Plattner R.D. (2001) Characterization of four clustered and coregulated
genes associated with fumonisin biosynthesis in Fusarium verticillioides. Fungal
Genetics and Biology 34:155-165.
Sexton A.C., Cozijnsen A.J., Keniry A., Jewell E., Love C.G., Batley J., Edwards D., Howlett
B.J. (2006) Comparison of transcription of multiple genes at three developmental stages
of the plant pathogen Sclerotinia sclerotiorum. Fems Microbiology Letters 258:150-160.
Shabalina S.A., Koonin E.V. (2008) Origins and evolution of eukaryotic RNA interference.
Trends in ecology & evolution 23:578-587.
Shah P., Atwood III J.A., Orlando R., El Mubarek H., Podila G.K., Davis M.R. (2009a)
Comparative proteomic analysis of Botrytis cinerea secretome. Journal of Proteome
Research 8:1123-1130.
Shah P., Gutierrez-Sanchez G., Orlando R., Bergmann C. (2009b) A proteomic study of pectin-
degrading enzymes secreted by Botrytis cinerea grown in liquid culture. Proteomics
9:3126-3135.
Shevchenko A., Henrik Tomas J.H., Olsen J.V., Mann M. (2007) In-gel digestion for mass
spectrometric characterization of proteins and proteomes. Nature Protocols 1:2856-2860.
Shilatifard A. (1998) Identification and purification of the Holo-ELL complex. Journal of
Biological Chemistry 273:11212-11217.
Shim W.B., Dunkle L.D. (2002) Identification of genes expressed during cercosporin
biosynthesis in Cercospora zeae-maydis. Physiological and Molecular Plant Pathology
61:237-248. DOI: 10.1006/pmpp.2002.0437.

156
Shim W.B., Dunkle L.D. (2003) CZK3, a MAP kinase kinase kinase homolog in Cercospora
zeae-maydis, regulates cercosporin biosynthesis, fungal development, and pathogenesis.
Molecular Plant-Microbe Interactions 16:760-768.
Sinclair J.B. (1991) Latent infection of soybean plants and seeds by fungi. Plant Disease 75:220-
224.
Sindhu A.S., Maier T.R., Mitchum M.G., Hussey R.S., Davis E.L., Baum T.J. (2009) Effective
and specific in planta RNAi in cyst nematodes: expression interference of four parasitism
genes reduces parasitic success. Journal of Experimental Botany 60:315-324.
Spiering M.J., Moon C.D., Wilkinson H.H., Schardl C.L. (2005) Gene cluster for insecticidal
loline alkaloids in the grass-endophytic fungus Neotyphodium uncinatum. Genetics
169:1403-1414.
Stärkel C. (2011) Host Induced Gene Silencing - strategies for the improvement of resistance
against Cercospora beticola in sugar beet (B. vulgaris L.) and against Fusarium
graminearum in wheat (T. aestivum L.) and maize (Z. mays L.), Dissertation submitted to
University of Hamburg, Berlin.
Staskawicz B.J., Dahlbeck D., Keen N.T. (1984) Cloned avirulence gene of Pseudomonas
syringae pv. glycinea determines race-specific incompatibility on Glycine max (L.) Merr.
Proceedings of the National Academy of Sciences 81:6024-6028.
Steinberg T.H., Agnew B.J., Gee K.R., Leung W.Y., Goodman T., Schulenberg B., Hendrickson
J., Beechem J.M., Haugland R.P., Patton W.F. (2003) Global quantitative phosphoprotein
analysis using multiplexed proteomics technology. Proteomics 3:1128-1144.
Steinkamp M.P., Martin S.S., Hoefert L.L., Ruppel E.G. (1979) Ultrastructure of lesions
produced by Cercospora beticola in leaves on Beta vulgaris. Physiological Plant
Pathology 15:13-16.
Steinkamp M.P., Martin S.S., Hoefert L.L., Ruppel E.G. (1981) Ultrastucture of lesions
produced in leaves of Beta vulgaris by cercosporin, a toxin from Cercospora beticola.
Phytopathology 71:1272-1281.
Stergiopoulos I., de Wit P.J.G.M. (2009) Fungal effector proteins. Annual Review of
Phytopathology 47:233-263.
Stewart E.L., Qu X.S., Overton B.E., Gildow F.E., Wenner N.G., Grove D.S. (2007)
Development of a real-time RT-PCR SYBR green assay for Tomato ring spot virus in
grape. Plant Disease 91:1083-1088. DOI: Doi 10.1094/Pdis-91-9-1083.
Stintzi A., Heitz T., Prasad V., Wiedemann-Merdinoglu S., Kauffmann S., Geoffroy P., Legrand
M., Fritig B. (1993) Plant ‘pathogenesis-related’proteins and their role in defense against
pathogens. Biochimie 75:687-706.
157
Strausbaugh C.A., Overturf K., Koehn A.C. (2005) Pathogenicity and real-time PCR detection of
Fusarium spp. in wheat and barley roots. Canadian Journal of Plant Pathology 27:430-
438.
Strelkov S.E., Lamari L., Ballance G.M. (1999) Characterization of a host-specific protein toxin
(Ptr ToxB) from Pyrenophora tritici-repentis. Molecular Plant-Microbe Interactions
12:728-732.
Stukenbrock E.V.A.H., McDonald B.A. (2007) Geographical variation and positive diversifying
selection in the host-specific toxin SnToxA. Molecular Plant Pathology 8:321-332.
Suárez M.B., Sanz L., Chamorro M.I., Rey M., González F.J., Llobell A., Monte E. (2005)
Proteomic analysis of secreted proteins from Trichoderma harzianum:: Identification of a
fungal cell wall-induced aspartic protease. Fungal Genetics and Biology 42:924-934.
Sulc M., Peslova K., Zabka M., Hajduch M., Havlicek V. (2009) Biomarkers of Aspergillus
spores: strain typing and protein identification. International Journal of Mass
Spectrometry 280:162-168.
Suzuki K. (1921) Studies on the cause of "Shihan" of soybean. Chosen Nokaiho 16:24-28.
Syrovy I., Hodny Z. (1991) Staining and quantification of proteins separated by polyacrylamide
gel electrophoresis. Journal of Chromatography B: Biomedical Sciences and Applications
569:175-196.
Tada M., Kohno M., Niwano Y. (2010) Scavenging or quenching effect of melanin on
superoxide anion and singlet oxygen. Journal of clinical biochemistry and nutrition
46:224-228.
Takahara H., Dolf A., Endl E., O’Connell R. (2009) Flow cytometric purification of
Colletotrichum higginsianum biotrophic hyphae from Arabidopsis leaves for stage-
specific transcriptome analysis. Plant Journal 59:672-683.
Takano Y., Kubo Y., Shimizu K., Mise K., Okuno T., Furusawa I. (1995) Structural analysis of
PKS1, a polyketide synthase gene involved in melanin biosynthesis in Colletotrichum
lagenarium. Molecular and General Genetics 249:162-167.
Tan K.C., Oliver R.P., Solomon P.S., Moffat C.S. (2010) Proteinaceous necrotrophic effectors in
fungal virulence. Functional Plant Biology 37:907-912.
Tanaka A., Tsuge T. (2000) Structural and functional complexity of the genomic region
controlling AK-toxin biosynthesis and pathogenicity in the Japanese pear pathotype of
Alternaria alternata. Molecular Plant-Microbe Interactions 13:975-986.
158
Taylor T.V., Mitchell T.K., Daub M.E. (2006) An oxidoreductase is involved in cercosporin
degradation by the bacterium Xanthomonas campestris pv. zinniae. Applied and
Environmental Microbiology 72:6070-6078. DOI: 10.1128/aem.00483-06.
ten Have A., Mulder W., Visser J., van Kan J.A.L. (1998) The endopolygalacturonase gene
Bcpg1 is required for full virulence of Botrytis cinerea. Molecular Plant-Microbe
Interactions 11:1009-1016.
Thelwell N., Millington S., Solinas A., Booth J., Brown T. (2000) Mode of action and
application of Scorpion primers to mutation detection. Nucleic Acids Research 28:3752-
3761.
Tian M., Huitema E., da Cunha L., Torto-Alalibo T., Kamoun S. (2004) A Kazal-like
extracellular serine protease inhibitor from Phytophthora infestans targets the tomato
pathogenesis-related protease P69B. Journal of Biological Chemistry 279:26370-26377.
Tinoco M., Dias B., Dall'Astta R., Pamphile J., Aragão F. (2010) In vivo trans-specific gene
silencing in fungal cells by in planta expression of a double-stranded RNA. BMC
Biology 8:27. DOI: 10.1186/1741-7007-8-27
Tjalsma H., Bolhuis A., Jongbloed J.D.H., Bron S., Van Dijl J.M. (2000) Signal peptide-
dependent protein transport in Bacillus subtilis: a genome-based survey of the secretome.
Microbiology and Molecular Biology Reviews 64:515-547.
Tomilov A.A., Tomilova N.B., Wroblewski T., Michelmore R., Yoder J.I. (2008) Trans-specific
gene silencing between host and parasitic plants. The Plant Journal 56:389-397.
Tsai-Morris C.H., Sheng Y., Lee E., Lei K.J., Dufau M.L. (2004) Gonadotropin-regulated
testicular RNA helicase (GRTH/Ddx25) is essential for spermatid development and
completion of spermatogenesis. Proceedings of the National Academy of Sciences of the
United States of America 101:6373-6378.
Tseng S.C., Liu S.Y., Yang H.H., Lo C.T., Peng K.C. (2008) Proteomic study of biocontrol
mechanisms of Trichoderma harzianum ETS 323 in response to Rhizoctonia solani.
Journal of Agricultural and Food Chemistry 56:6914-6922.
Tudzynski B., Hölter K. (1998) Gibberellin Biosynthetic Pathway in Gibberella fujikuroi:
Evidence for a Gene Cluster. Fungal Genetics and Biology 25:157-170.
Tudzynski P., Hölter K., Correia T., Arntz C., Grammel N., Keller U. (1999a) Evidence for an
ergot alkaloid gene cluster in Claviceps purpurea. Molecular and General Genetics
261:133-141.
Tudzynski P., Hölter K., Correia T., Arntz C., Grammel N., Keller U. (1999b) Evidence for an
ergot alkaloid gene cluster in Claviceps purpurea. Molecular and General Genetics
261:133-141.
159
Turgeon B.G., Condon B., Liu J., Zhang N. (2010) Protoplast transformation of filamentous
fungi. Methods in Molecular Biology 638:3-19.
Tyagi S., Kramer F.R. (1996) Molecular beacons: probes that fluoresce upon hybridization.
Nature Biotechnology 14:303-308.
Ünlü M., Morgan M.E., Minden J.S. (1997) Difference gel electrophoresis. A single gel method
for detecting changes in protein extracts. Electrophoresis 18:2071-2077.
Upchurch R.G., Ehrenshaft M., Walker D.C., Sanders L.A. (1991) Genetic-Transformation
system for the fungal soybean pathogen Cercospora kikuchii. Applied and Environmental
Microbiology 57:2935-2939.
Upchurch R.G., Rose M.S., Eweida M., Callahan T.M. (2002) Transgenic assessment of CFP-
mediated cercosporin export and resistance in a cercosporin-sensitive fungus. Current
Genetics 41:25-30. DOI: 10.1007/s00294-002-0280-4.
van den Ackerveken G.F.J.M., van Kan J.A.L., de Wit Wit P.J.G.M. (1992) Molecular analysis
of the avirulence gene avr9 of the fungal tomato pathogen Cladosporium fulvum fully
supports the gene-for-gene hypothesis. Plant Journal 2:359-366.
van Kan J.A.L., Van den Ackerveken G.F.J.M., De Wit P.J.G.M. (1991) Cloning and
characterization of cDNA of avirulence gene avr9 of the fungal pathogen Cladosporium
fulvum, causal agent of tomato leaf mold. Mol. Plant-Microbe Interactions 4:52-59.
Vandroemme J., Baeyen S., Van Vaerenbergh J., De Vos P., Maes M. (2008) Sensitive real-time
PCR detection of Xanthomonas fragariae in strawberry plants. Plant Pathology 57:438-
444. DOI: 10.1111/j.1365-3059.2007.01813.x.
Vathakos M.G., Walters H.J. (1979) Production of conidia by Cercospora kikuchii culture.
Phytopathology 69:832-833.
Venkataramani K. (1967) Isolation of cercosporin from Cercospora personata. Phytopathology
58:379-382.
Venkatesh B., Hettwer U., Koopmann B., Karlovsky P. (2005) Conversion of cDNA differential
display results (DDRT-PCR) into quantitative transcription profiles. BMC Genomics
6:51.
Venu R.C., Jia Y., Gowda M., Jia M.H., Jantasuriyarat C., Stahlberg E., Li H., Rhineheart A.,
Boddhireddy P., Singh P. (2007) RL-SAGE and microarray analysis of the rice
transcriptome after Rhizoctonia solani infection. Molecular Genetics and Genomics
278:421-431.
160
Vincent D., Balesdent M.H., Gibon J., Claverol S., Lapaillerie D., Lomenech A.M., Blaise F.,
Rouxel T., Martin F., Bonneu M. (2009) Hunting down fungal secretomes using liquid-
phase IEF prior to high resolution 2-DE. Electrophoresis 30:4118-4136.
Voigt C.A., Schäfer W., Salomon S. (2005) A secreted lipase of Fusarium graminearum is a
virulence factor required for infection of cereals. Plant Journal 42:364-375.
Walters H.J. (1980) Soybean leaf blight caused by Cercospora kikuchii. Plant Disease 64:961-
962.
Walton J.D. (1994) Deconstructing the cell wall. Plant Physiology 104:1113-1118.
Wang Z., Gerstein M., Snyder M. (2009a) RNA-Seq: a revolutionary tool for transcriptomics.
Nature Revews Genetics 10:57-63.
Wang X., Tang C., Zhang G., Li Y., Wang C., Liu B., Qu Z., Zhao J., Han Q., Huang L. (2009b)
cDNA-AFLP analysis reveals differential gene expression in compatible interaction of
wheat challenged with Puccinia striiformis f. sp. tritici. BMC Genomics 10:289. DOI:
10.1186/1471-2164-10-289.
Ward N.A., Schneider R.W. (2011) Documentation of an extended latent infection period with
Phakopsora pachyrhizi in soybean. Phytopathology 101:S269.
Weiss U., Merlini L., Nasini G. (1987) Naturally occurring perylenequinones. Progress in the
chemistry of organic natural products. 52:2-71.
Weller S.A., Elphinstone J.G., Smith N.C., Boonham N., Stead D.E. (2000) Detection of
Ralstonia solanacearum strains with a quantitative, multiplex, real-time, fluorogenic PCR
(TaqMan) assay. Applied and Environmental Microbiology 66:2853-2858.
Weller S.A., Stead D.E. (2002) Detection of root mat associated Agrobacterium strains from
plant material and other sample types by post-enrichment TaqMan PCR. Journal of
Applied Microbiology 92:118-126.
Westerink N., Brandwagt B.F., de Wit P.J.G.M., Joosten M.H.A.J. (2004) Cladosporium fulvum
circumvents the second functional resistance gene homologue at the Cf-4 locus (Hcr9-4E
) by secretion of a stable avr4E isoform. Molecular Microbiology 54:533-545. DOI:
10.1111/j.1365-2958.2004.04288.x.
Westermeier R., Marouga R. (2005) Protein detection methods in proteomics research.
Bioscience Reports 25:19-32.
Wevelsiep L., Rupping E., Knogge W. (1993) Stimulation of barley plasmalemma H+-ATPase
by phytotoxic peptides from the fungal pathogen Rhynchosporium secalis. Plant
Physiology 101:297-301.

161
Wheeler M.H., Bell A.A. (1988) Melanins and their importance in pathogenic fungi. Current
topics in medical mycology 2:338-387.
Whisson S.C., Boevink P.C., Moleleki L., Avrova A.O., Morales J.G., Gilroy E.M., Armstrong
M.R., Grouffaud S., Van West P., Chapman S. (2007) A translocation signal for delivery
of oomycete effector proteins into host plant cells. Nature 450:115-118.
White S., McIntyre M., Berry D.R., McNeil B. (2002) The autolysis of industrial filamentous
fungi. Critical Reviews in Biotechnology 22:1-14.
Wilcox J.R., Abney T.S. (1973) Effects of Cercospora kikuchii on soybeans. Phytopathology
63:796-797.
Wilkins M.R., Sanchez J.C., Gooley A.A., Appel R.D., Humphery-Smith I., Hochstrasser D.F.,
Williams K.L. (1995) Progress with proteome projects: why all proteins expressed by a
genome should be identified and how to do it. Biotechnology & Genetic Engineering
Reviews 13:19-50.
Winton L.M., Manter D.K., Stone J.K., Hansen E.M. (2003) Comparison of biochemical,
molecular, and visual methods to quantify Phaeocryptopus gaeumannii in Douglas-Fir
foliage. Phytopathology 93:121-126.
Wise R.P., Moscou M.J., Bogdanove A.J., Whitham S.A. (2007) Transcript Profiling in Host-
Pathogen Interactions*. Annual Review of Phytopathology 45:329-369.
Wittmann-Liebold B., Graack H.R., Pohl T. (2006) Two-dimensional gel electrophoresis as tool
for proteomics studies in combination with protein identification by mass spectrometry.
Proteomics 6:4688-4703.
Wrather J.A., Koenning S.R. (2006) Estimates of disease effects on soybean yields in the United
States 2003 to 2005. Journal of Nematology 38:173-180.
Wrather J.A., Anderson T.R., Arsyad D.M., Gai J., Ploper L.D., Porta-Puglia A., Ram H.H.,
Yorinori J.T. (1997) Soybean disease loss estimates for the top 10 soybean producing
countries in 1994. Plant Disease 81:107-110.
Wrather J.A., Anderson T.R., Arsyad D.M., Tan Y., Ploper L.D., Porta-Puglia A., Ram H.H.,
Yorinori J.T. (2001) Soybean disease loss estimates for the top ten soybean-producing
countries in 1998. Canadian Journal of Plant Pathology-Revue Canadienne De
Phytopathologie 23:115-121.
Xu S., Chen J.I.E., Liu L., Wang X., Huang X., Zhai Y. (2007) Proteomics associated with
virulence differentiation of Curvularia lunata in maize in China. Journal of Integrative
Plant Biology 49:487-496.
162
Yadav B.C., Veluthambi K., Subramaniam K. (2006) Host-generated double stranded RNA
induces RNAi in plant-parasitic nematodes and protects the host from infection.
Molecular and biochemical parasitology 148:219.
Yajima W., Kav N.N.V. (2006) The proteome of the phytopathogenic fungus Sclerotinia
sclerotiorum. Proteomics 6:5995-6007.
Yakoby N., Beno-Moualem D., Keen N.T., Dinoor A., Pines O., Prusky D. (2001)
Colletotrichum gloeosporioides pelB is an important virulence factor in avocado fruit-
fungus interaction. Molecular Plant-Microbe Interactions 14:988-995.
Yamazaki S., Ogawa T. (1972) Chemistry and stereochemistry of cercosporin. Agricultural and
Biological Chemistry 36:1707-1718.
Yamazaki S., Okubo A., Akiyama Y., Fuwa K. (1975) Cercosporin, a novel photodynamic
pigment isolated from Cercospora kikuchii. Agricultural and Biological Chemistry
39:287-288.
Yeh C.C., Sinclair J.B. (1979) Conidium ontogeny and morphology of Cercospora kikuchii.
Mycotaxon 10:93-98.
Yeh C.C., Sinclair J.B. (1980) Sporulation and variation in size of conidia and conidiophores
among five isolates of Cercospora kikuchii. Plant Disease 64:373-374
Yeh C.C., Sinclair J.B. (1982) Effects of Cercospora kikuchii on soybean seed germination and
its interaction with Phomopsis sp. Journal of Phytopathology 105:265-270.
Yin Y.J., Zuo S.M., Wang H., Chen Z.X., Gu S.L., Zhang Y.F., Pan X.B. (2009) Evaluation of
the effect of qSB-9(Tq) involved in quantitative resistance to rice sheath blight using
near-isogenic lines. Canadian Journal of Plant Science 89:731-737.
Yin C., Jurgenson J.E., Hulbert S.H. (2011) Development of a host-induced RNAi system in the
wheat stripe rust fungus Puccinia striiformis f. sp. tritici. Molecular Plant-Microbe
Interactions 24:554-561.
You B.J., Lee M.H., Chung K.R. (2008) Production of cercosporin toxin by the phytopathogenic
Cercospora fungi is affected by diverse environmental signals. Canadian Journal of
Microbiology 54:259-269. DOI: 10.1139/w08-002.
Yu J., Bhatnagar D., Cleveland T.E. (2004a) Completed sequence of aflatoxin pathway gene
cluster in Aspergillus parasiticus. FEBS Letters 564:126-130.
Yu J.H., Hamari Z., Han K.H., Seo J.A., Reyes-Domínguez Y., Scazzocchio C. (2004b) Double-
joint PCR: a PCR-based molecular tool for gene manipulations in filamentous fungi.
Fungal Genetics and Biology 41:973-981.

163
Zhang C., Bradshaw J.D., Whitham S.A., Hill J.H. (2010) The development of an efficient
multipurpose bean pod mottle virus viral vector set for foreign gene expression and RNA
silencing. Plant Physiology 153:52-65.
164
APPENDIX
A. Preparation of gold particles
1. Transfer 30 mg gold particles (Bio-Rad Cat # 165-2263) to a 1.5 ml low retention
microcentrifuge tube (Phenix Research Products Cat # MAX-815S ), and vortex
vigorously in 0.5 ml of 100% (v/v) ethanol
2. Incubate at room temperature for 10 min
3. Pellet the gold particle by centrifugation @ 15,000 RPM for 2 min, decent the ethanol
4. Wash three times with 0.5 ml of sterile distilled water (SDW) each time
5. Resuspend gold particles in 500 µl of SDW and store as aliquots of 25 µl in 1.5 ml tubes
at -20°C until further use
B. Coating of gold particles with Plasmid DNA and particle bombardment
1. To a 25 µl aliquot of prepared gold particles in 1.5 ml tube, add the following while
vigorously vortexing after adding each component (very important to ensure uniform
coating)
a. 2.5 µl of pBPMV-IA-RIM DNA (1 µg/µl) – RNA1
b. 2.5 µl of pBPMV-IA-V2 DNA (1 µg/µl) – RNA2 or pBPMV-IA-V2 carrying
gene of interest
c. 50 µl of 50% glycerol
d. 25 µlof 2.5 M CaCl2
e. 10 µl of 0.1 M freshly prepared spermidine (Sigma, Cat # S-0266)
2. Centrifuge at 14,000 RPM and discard the supernatant
3. Wash particles with 70 µl of 70% isopropanol
4. Wash particles with 70 µl of 100% isopropanol
5. Resuspend the particles in 25 µl of 100% isopropanol

165
6. Wash macrocarrier discs (Bio-Rad, Cat # 165-2335) with 100% isopropanol and air dry
7. Load 6 µl of prepared gold particles onto center of the macrocarrier and spread uniformly
using a yellow pipet tip
8. Load rupture disc (Bio-Rad Cat # 165-2329), prepared macrocarrier, and stopping screen
(Bio-Rad Cat # 165-2336) into sample holder
9. Place 14 days old soybean seedlings in the bottom chamber with primary leaves spread
out directly under the macrocarrier
10. Press the vacuum switch
11. Press the fire switch and hold it until you hear the shooting sound
12. Remove the plants from chamber, lightly mist with water
13. Transfer the plant to a growth chamber that maintains 22°C and 16 h of light period
14. After 1 week, transfer the plants to big pots in the greenhouse and add fertilizer
15. Observe the development of viral symptoms in 2 weeks on newly developing trifoliates
(This protocol is adapted from Dr. Chunquan Zhang, Alcorn State University)
166
VITA
Ashok Kumar Chanda was born in 1979 in Kodad, Andhra Pradesh (State), India. He attended
primary schools in Kodad and moved to Vidwan residential college for his Intermediate
education. He received a Bachelor’s Science degree in Agriculture from ANGR agricultural
University, Aswaraopet campus, India. His interest in biotechnology during bachelors made him
to pursue a Master of Science in Agricultural Biotechnology in the same university, but in
Hyderabad campus. He had the opportunity to complete master’s thesis research on peanuts at
ICRISAT, Patancheru under the supervision of Dr. Jonathan Crouch. He joined ICRISAT as a
Research Technician under supervision of Dr. Tom Hash, where he became familiar with Marker
Assisted Breeding and various molecular markers. In the Fall of 2006, Ashok got admitted into
the doctoral program in the department of Plant Pathology & Crop Physiology at Louisiana State
University under the guidance of Dr. Zhi-Yuan Chen and Dr. Raymond Schneider. During his
time at LSU, he acquired the 2-D gel proteomics and fungal molecular biology skills. He became
a member of the American Phytopathological Society and attended annual meetings to present
his research findings. He served as Treasurer and Vice-President of the PPCP Graduate Student
Association and led the Journal club committee. During his PhD program, Ashok met his wife,
Mala, and also they were blessed with a baby girl, Hamsini. Mr. Chanda’s research efforts were
recognized by the Department of Plant Pathology and Crop Physiology by making him the
recipient of the 2011 C.W. Edgerton Award. He will receive the degree of Doctor of Philosophy
at the Summer 2012 Commencement.