molecular and metabolic responses associated with …
TRANSCRIPT

JESSICA ALINE SOUSA BARROS
MOLECULAR AND METABOLIC RESPONSES ASSOCIATED
WITH THE LACK OF AUTOPHAGY FOLLOWING ENERGY
DEPRIVATION IN Arabidopsis thaliana
Dissertation presented to the
Universidade Federal de Viçosa, as
part of the requirements of the Plant
Physiology Graduate Program for
obtention of the degree of Master
Scientiae.
VIÇOSA
MINAS GERAIS - BRAZIL
2016

Ficha catalográfica preparada pela Biblioteca Central daUniversidade Federal de Viçosa - Câmpus Viçosa
T
Barros, Jessica Aline Sousa, 1991-B277m2016
Molecular and metabolic responses associated withthe lack of autophagy following energy deprivation inArabidopsis thaliana / Jessica Aline Sousa Barros. -Viçosa, MG, 2016.
v, 47f. : il. (algumas color.) ; 29 cm.
Orientador : Wagner Luiz Araújo.Dissertação (mestrado) - Universidade Federal de
Viçosa.Inclui bibliografia.
1. Metabolismo vegetal. 2. Metabolismo celular.3. Fisiologia vegetal. 4. Arabidopsis thaliana. 5. Mortecelular. I. Universidade Federal de Viçosa.Departamento de Biologia Vegetal. Programa de Pós-graduação em Fisiologia Vegetal. II. Título.
CDD 22 ed. 581.133
FichaCatalografica :: Fichacatalografica https://www3.dti.ufv.br/bbt/ficha/cadastrarficha/...
2 de 4 31/12/1969 20:49

JESSICA ALINE SOUSA BARROS
MOLECULAR AND METABOLIC RESPONSES ASSOCIATED
WITH THE LACK OF AUTOPHAGY FOLLOWING ENERGY
DEPRIVATION IN Arabidopsis thaliana
Dissertation presented to the
Universidade Federal de Viçosa, as
part of the requirements of the Plant
Physiology Graduate Program for
obtention of the degree of Master
Scientiae.
Approved: July 18th
, 2016.
_____________________________ ___________________________
--Dr. João Henrique F. Cavalcanti Prof. Adriano Nunes Nesi
____________________________ ____________________________
Prof. Dimas Mendes Ribeiro Prof. Wagner L. Araújo
(Adviser)
ii
ACKNOWLEDGMENTS
First of all I would like to thank God for guiding my ways and allow major works
in my life.
To my parents Ana Goreth and João Henrique (in memorium) for everything and
for always trusting me and in my choices.
Thanks to CAPES (Coordination for Scientific Support for Post Graduate Level
Training) for the scholarships conceded. Financial support from FAPEMIG
(Foundation for Research Assistance of the Minas Gerais State) and Max-Planck-
Institut für Molekulare Pflanzenphysiologie (MPIMP), Potsdam-Golm, Germany
are gratefully acknowledged.
Thanks to the Universidade Federal de Viçosa (UFV), especially to the Plant
Physiology Graduate Program at the UFV for providing all conditions required to
develop my work.
I want to thank my advisor Prof. Wagner L. Araújo for the opportunity to work on
his team. I am also grateful for guidance, support, and for always encourage me
professionally and help me in all instances.
To my supervisor João Henrique Cavalcanti for help in this work in several
aspects, for guidance and good suggestions. Furthermore, I must acknowledge
him for the friendship and the funny moments.
I am grateful to Prof. Adriano Nunes-Nesi for co-advice and for scientific
contribution to this research.
I am also very grateful to my evaluation committee for accepting to judge my
work and for their perspectives that contributed to improve it.
Many thanks to João Antonio B. Siqueira for all the encouragement and help me
in every moment and circumstance.
I also would like to thank all my friends in Viçosa for the friendship and good
moments we have shared, especially to Gillian for his friendship since our firsts
days at the UFV.
Thanks to all members of my working group of UCP, especially to David, Dora,
Jorge and Willian for help in lab work.
Finally to all people that someway contributed to this work and for those who has
supported me throughout my journey, my thanks.

iii
TABLE OF CONTENT
ABSTRACT ................................................................................................................................ iv
RESUMO ......................................................................................................................................v
1. INTRODUCTION......................................................................................................................1
2.1 Plant Material and Dark Treatment ...................................................................................... 5
2.2 Characterization of T-DNA Insertion Mutants .................................................................... 5
2.3 Evaluation of Biometric Parameters of Seeds ....................................................................... 5
2.4 Biochemical Characterization .............................................................................................. 6
2.4.1 Processing and extraction .............................................................................................. 6
2.4.2 Chlorophyll Determination ........................................................................................... 6
2.4.3 Malate and Fumarate Content ....................................................................................... 6
2.4.4 Amino acids Content .................................................................................................... 7
2.4.5 Determination of Sugars Content .................................................................................. 7
2.4.6 Determination of Starch Levels ..................................................................................... 7
2.4.7 Determination of Protein ............................................................................................... 8
2.5 Measurements of Photosynthetic Parameters ........................................................................ 8
2.6 Metabolite Profiling............................................................................................................. 8
2.7 Expression Analysis by RT-PCR ......................................................................................... 9
2.8 Statistical Analyses ............................................................................................................ 10
3. RESULTS ................................................................................................................................ 11
3.1 Isolation of T-DNA insertional mutants of ATG genes ....................................................... 11
3.2 Autophagy deficiency reduce growth and seed yield .......................................................... 11
3.3 Atg mutants are more susceptible to energy deprivation ..................................................... 15
3.4 Deficiency of autophagy leads to differential metabolic response in carbon
starvation ................................................................................................................................ 16
3.5 Carbon starvation leads to induction of alternative pathways in atg mutants ....................... 22
3.6 The lack of autophagy induces senescence and chloroplast degradation events ................... 23
4. DISCUSSION .......................................................................................................................... 26
5. CONCLUSION ........................................................................................................................ 34
6. REFERENCES ........................................................................................................................ 35
7. SUPPLEMENTAL DATA ....................................................................................................... 42
iv
ABSTRACT
BARROS, Jessica Aline Sousa, M.Sc., Universidade Federal de Viçosa, July
2016. Molecular and metabolic responses associated with the lack of
autophagy following energy deprivation in Arabidopsis thaliana. Advisor:
Wagner Luiz Araújo.
The oxidation of carbohydrate in mitochondria is the primary energy source for
cellular metabolism. However, during energy-limited conditions alternative
substrates are required to support respiration. The oxidation of amino acids plays
a key role in this process by generating electrons that can be transferred to
mitochondrial electron transport chain via the electron transfer flavoprotein/
ubiquinone oxireductase (ETF/ETFQO) system. Compelling evidence has
demonstrated the close association of autophagy in providing alternative
substrates for power generation under carbohydrate-limited conditions; however,
how and to which extent autophagy and primary metabolism interact to support
respiration remains unclear. To obtain a comprehensive picture of the metabolic
importance of autophagy during development and extended darkness Arabidopsis
thaliana mutants with impairments in autophagy were used. atg mutants showed
reduction of growth and seed production. Following extended darkness atg
mutants were characterized by early signs of senescence as well as decreased
chlorophyll content and maximum photochemical efficiency of PSII (Fv /Fm).
Metabolite profile of dark-treated leaves revealed an extensive metabolic
reprogramming in which increases in amino acids contents were partially
compromised and thus limiting their utilization as substrate to sustain respiration
in atg mutants. Additionally, transcript levels of genes involved in alternative
pathways of respiration, amino acid catabolism, and chloroplast vesiculation (CV)
were up-regulated in atg mutants. Our results thus suggest that autophagy
contributes to energy availability by supplying amino acids for alternative
pathways of respiration. Furthermore, our finding demonstrated the potential role
of CV as a compensatory protein degradation pathway under C-limiting
conditions when autophagy is impaired.
v
RESUMO
BARROS, Jessica Aline Sousa, M.Sc., Universidade Federal de Viçosa, Julho de
2016. Respostas moleculares e metabólicas associadas a ausência do processo
autofágico durante limitação energética em Arabidopsis thaliana. Orientador:
Wagner Luiz Araújo.
A oxidação de carboidratos na mitocôndria é a principal fonte de energia para
metabolismo celular. Contudo, em condições de limitação energética, substratos
alternativos são necessários para a manutenção da respiração. A oxidação de
aminoácidos tem papel fundamental nesse processo gerando elétrons que podem
ser transferidos para cadeia de transporte de elétrons mitocondrial através do
sistema flavoproteína de transferência de elétrons/ flavoproteína de transferência
de elétrons oxidoredutase da ubiquinona (ETF/ETFQO). A associação entre
autofagia e o fornecimento de substratos alternativos para geração de energia tem
sido relatada, porém pouco se sabe acerca do papel da autofagia no metabolismo
primário para a manutenção do processo respiratório. Com intuito de se investigar
a importância metabólica da autofagia durante o desenvolvimento e em condições
de senescência induzida pela escuro, plantas mutantes de Arabidopsis thaliana
com comprometimento do processo autofágico foram utilizadas. Mutantes atg
apresentaram redução no crescimento e na produção de sementes. Sob escuro
prolongado, fenótipos de senescência antecipada assim como redução no conteúdo
de clorofila e na eficiência fotoquímica máxima do FSII (Fv/Fm) foram observados
nos mutantes atg. A análise do perfil metabólico revelou uma extensa
reprogramação metabólica em que o aumento do conteúdo de aminoácidos foi
parcialmente comprometido, limitando seu uso como substrato para suprir a
respiração nos mutantes atg. Adicionalmente, níveis de transcritos de genes
envolvidos em vias de catabolismo de aminoácidos e degradação do cloroplasto
(CV) foram induzidos nesses genótipos. Em conjunto, os resultados obtidos
demonstram uma potencial função compensatória de CV como processo de
degradação de proteínas em condições de limitação de carbono, particularmente
quando o processo autofágico é comprometido.
.

1
1. INTRODUCTION
Energy availability is a primary factor affecting both plant growth and
development. Accordingly, plants obtain their energy by both driving light-energy
at photosynthesis and oxidation of sugars by the mitochondrial respiration.
Mitochondrial respiration is mostly dependent of carbohydrate through the
oxidation of organic acids by the tricarboxylic acid (TCA) cycle (Plaxton and
Podesta, 2006; Sweetlove et al., 2010; Araújo et al., 2011). Notwithstanding,
under some circumstances, including a wide range of environmental stress
conditions or even during natural leaf senescence, changes in the carbohydrate
supply might occurs and, consequently, energy availability is compromised
(Buchanan-Wollaston et al., 2005; Baena-González et al., 2007; Baena-González
and Sheen, 2008).
In situations when carbohydrates become limited plants are forced to use
alternative substrates such as lipids and amino acids to provide energy and to
maintain mitochondrial metabolism active (Buchanan-Wollaston et al., 2005;
Araújo et al., 2011; Kirma et al., 2012). Compelling evidence has demonstrated
that amino acids produced from protein degradation can be an important source of
alternative substrates for plant respiration supporting ATP synthesis through a
distinct route that differs from the classical respiration (Araújo et al, 2010;
Engqvist et al, 2011; Peng et al, 2015). The electron transfer flavoprotein
(ETF)/ETF: ubiquinone oxidoreductase (ETF/ETFQO) system is substantially
characterized in mammals for the catabolism of fatty acid, amino acids, and
choline, supplying the mitochondrion with alternative respiratory substrates to
glucose (Watmough and Frerman, 2010). By contrast to the situation observed in
mammals in which it has been demonstrated that at least 11 dehydrogenases are
able to connect the ETF/ETFQO system to mitochondrial electron transport chain,
in plants only two dehydrogenases have been identified as able to donate electrons
to the ETF/ETFQO complex. These two enzymes are: (i) Isovaleryl-CoA
dehydrogenase (IVDH) that is involved in the degradation of branched-chain
amino acids (BCAA); and (ii) 2-hydroxyglutarate dehydrogenase (D2HGDH) that
use lysine as alternative substrates (Engqvist et al., 2009; Araújo et al., 2010;

2
Engqvist et al., 2011). These alternative pathways can provide electrons from
amino acids oxidation directly to mitochondrial electron transport chain via the
ETF complex as well as by the direct feeding of catabolic products into the TCA
cycle (Ishizaki et al., 2005, 2006; Araújo et al., 2010, 2011; Kirma et al., 2012).
Compelling evidence has demonstrated the importance of amino acids
degradation for mitochondrial energy. More recently, the oxidation of sulfur-
containing amino acids such as cysteine and methionine by the Ethylmalonic
Encephalopathy Protein 1 (ETHE1) has been also suggested as another amino
acid degradation pathway related to the ETF/ETFQO system (Krüßel et al., 2014).
Notably, ETHE1 seems to play a major role during situations of high protein
turnover such as carbohydrate starvation, senescence, and seed production (Krüßel
et al., 2014). Thus, not only the dehydrogenases related with ETF/ETFQO
complex but also enzymes associated with lysine catabolism have extensively
been associated with mitochondrial metabolism. Accordingly, the Lysine-
ketoglutarate reductase/sacharopine dehydrogenase (LKR/SDH) can provide
acetyl-CoA to support mitochondrial metabolism (Zhu and Galili, 2003; Enquivist
et al., 2009, 2011; Kirma et al., 2012).
The physiological role of the ETF/ETFQO system during stress responses
has been unequivocally demonstrated during the last years (for a review see
Araújo et al., 2011). Additionally, several studies have demonstrated the induction
of enzymes of this pathway during dark-induced senescence (Buchanan-
Wollaston et al., 2005), oxidative stress (Lehmann et al., 2009) and under
conditions in which free amino acids are plentiful (Weigelt et al. 2008).
Furthermore, the function of this alternative pathway and BCAA catabolism in
stress tolerance mechanisms including drought and carbon starvation have been
demonstrated (Ishizaki et al., 2005; Ishizaki et al., 2006; Araújo 2010; Engqvist et
al., 2011; Peng et al., 2015; Pires at al., 2016). Although these studies have clearly
enhanced our understanding concerning the usage of amino acids in feeding
electrons to the TCA cycle under stress situations, the functional linkage between
protein degradation, amino acid turnover, and alternative pathways of respiration
remains to be fully elucidated.

3
Macroautophagy (referred to hereafter as autophagy) is a highly conserved
and regulated catabolic process involved in the degradation of cytoplasmic
constituents including soluble proteins, protein aggregates or even entire
organelles allowing the recycling of cell components into primary molecules (Li
and Vierstra, 2012; Liu and Bassham, 2012; Zientara‐Rytter and Sirko, 2016).
Briefly, during this process cell components are sequestered by the
autophagosomes and delivered into the vacuoles where the material is then
degraded and macromolecules are released back into the cytosol for reuse (Feng et
al., 2014). The knowledge of autophagy mechanisms has primarily expanded
through genetic analyses in Saccharomyces cerevisiae; in Arabidopsis about 30
ATG homologues, which correspond to the yeast ATG genes, have been
identified (Doelling et al., 2002; Hanaoka et al., 2002; Xiong et al., 2005). The
autophagy proteins are classified into four functional groups: (i) the ATG1/13
kinase complex which initiates autophagosome formation in response to nutrient
demands; (ii) the ATG9 complex involved in lipidation and expansion of pre-
autophagosomal structure; (iii) PI3 kinase complex that acts at the stage of vesicle
nucleation; and (iv) two ubiquitination-like, ATG8 and ATG12 conjugation
systems, which play roles in elongation and enclosure steps during
autophagosome formation (Supplemental Figure 1) (Avila-Ospina et al., 2014;
Zientara‐rytter and Sirko, 2016).
Several Arabidopsis loss-of function mutants involved in the autophagic
process have been characterized (Doelling et al., 2002; Hanaoka et al., 2002;
Yoshimoto et al., 2004; Xiong et al., 2005; Harrison-Lowe and Olsen, 2008;
Phillips et al., 2008). The physiological importance of the autophagy has been
demonstrated by showing that early senescence and hypersensitivity in response
to carbon and nitrogen starvation are phenotypes commonly observed in atg
mutants (Doeling et al., 2002; Bassham, 2009; Wada et. al., 2009; Li and Vierstra,
2012; Liu and Bassham, 2012; Yoshimoto, 2014). Notably, the involvement of
the autophagy system in providing energetic substrates following stress conditions
has been only recently demonstrated. Growth impairments under both long and
short day conditions have been observed in Arabidopsis starch less atg double
mutant, which has reduced soluble sugars availability during the night (Izumi et

4
al., 2013). Metabolic profiling showed that autophagy was most likely responsible
for the maintenance of amino acids pools during nighttime starvation. Since
amino acids can be used as alternative substrates for energy supply following
carbon starvation (Araújo et al., 2010), autophagy seems to have a potential role
in plant energetic maintenance under this condition. Changes in free amino acids
levels have also been reported in etiolated Arabidopsis seedlings used as a model
for carbon starvation (Avin-Wittenberg et al. 2015). The reduction in BCAA and
Lys content in addition to increased redistribution of label lysine to malate, a TCA
cycle intermediate, indicated a potential role of amino acids in supporting the
higher respiration flux observed in atg mutants (Avin-Wittenberg et al. 2015).
Although the function of autophagy in catabolic events under nutrient-
starved and stressful environments is currently known, the link between
autophagy, protein degradation, and alternative pathways of respiration remains
unclear. Here, we investigated how primary metabolism and physiological aspects
are impaired in three independent atg T-DNA insertion mutant lines during dark
induced senescence. Given that mutations affecting ATG8 and ATG12
conjugation showed the same degree of phenotype resulting in more severe
phenotypes than the ones observed in ATG9 complex (Chung et al., 2010; Shin et
al., 2014), here we investigated mutants for ATG5 and ATG7 genes that have a
full inhibition of the autophagic process (Thompson et al., 2005; Phillips et al.,
2008, Shin et al., 2014) and the atg9-1 mutant that presented only a reduction of
autophagic process (Shin et al., 2014). Our results demonstrated an early
senescence phenotype coupled with an accumulation of organic acids levels in atg
mutants following darkness, suggesting impairments of the TCA cycle. Metabolic
analysis revealed reduced levels of several amino acids in atg mutants associated
with an induction at the transcriptional level of enzymes of ETF/ETFQO pathway.
Collectively, the data obtained indicates that recycling during autophagy and
alternative pathways of respiration are required to provide energetic substrates
under carbon starvation. These combined results are discussed in the context of
the consequence of mutations in the autophagy process and the current models of
reserve mobilization and alternative pathways of respiration during extended
dark-induced senescence in leaves.

5
2. METHODS
2.1 Plant Material and Dark Treatment
All Arabidopsis plants used in this study were of Columbia ecotype (Col-
0). The T-DNA mutant lines atg9-1 (Hanoaka et al., 2002), atg5-1
(SAIL_129B079) (Yoshimoto et al., 2009), atg7-2 (GK-655B06) (Hofius et al.,
2009) were used in this study. Seeds were surface-sterilized and imbibed for 4
days at 4°C in the dark on 0.7% (w/v) agar plates containing half-strength
Murashige and Skoog (MS) media (pH 5.7). Seeds were subsequently germinated
and seedlings grown at 22°C under short-day conditions (8 h light/16 h dark),
60% relative humidity with 150 μmol photons m-2
s-1
. For dark treatments, 10 to
14-d-old seedlings were transferred to soil and then grown at 22°C under short-
day for 4 weeks. Afterwards, plants were maintained in dark in the same growth
cabinet. The rosettes of two different plants for composite sample were harvested
at intervals of 0, 3, 6, 9 days after transition to darkness and immediately frozen in
liquid nitrogen and stored at ‒80 oC until further analysis.
2.2 Characterization of T-DNA Insertion Mutants
Homozygous mutant lines were identified by PCR using ATG7 specific
primers specific (Fw-GACTGTACCTAACTCAGTGGGATG and Rv-
GCTCCTGCAATAGGAGCTAGAC) in combination with the T-DNA left border
primer (GABI-08474, Fw-ATAATAACGCTGCGGACATCTACATTTT) for
atg7-2 mutant, ATG5 specific primers (Fw-
TTAGCACCAAGAATAGGATATTTGC and Rv- TGCAATTT
CCATTGATGATATATTG) in combination with the T-DNA left border primer
(LB1, Fwd- GCCTTTTCAGAAATGGATAAATAGCCTTGCTTCC) for atg5-1
mutant and ATG9 specific primers (Fw- CTAAGAGA TGGCGTGGAAAGG and
Rv- CTTGAGGTTTGAGGCATTTCA) with the T-DNA left border primer (LB1,
GCCTTTTCAGAAATGGATAAA TAGCCTTGCTTC) for atg9-1 mutant.
2.3 Evaluation of Biometric Parameters of Seeds
For phenotyping of reproductive tissues, seeds were submitted to the
procedure described above and the seedlings were transferred to commercial
substrate and were kept in growth chamber at 22 ± 2 °C, 60% relative humidity

6
and irradiance of 150 µmol photons m-2
s-1
with a photoperiod of 12 h light and 12
h dark for seed production. Siliques were harvested and cleared with 0.2N NaOH
and 1% Sodium dodecyl sulfate (SDS) solution to remove pigments. For silique
length determination, images of approximately 50 Arabidopsis siliques were taken
with a digital camera (Canon Poweshot A650 IS) attached to stereo microscope
(Zeizz Stemi 2000-C). The measurement of silique length was performed on the
images using the ImageJ software. Seed weight was determined by weighing the
aliquots of a known number of seeds (approximately 500 seeds per aliquot). Total
seed yield was determined by weighting seeds collected from individual plants.
2.4 Biochemical Characterization
2.4.1 Processing and extraction
Whole rosettes were harvested at the indicated time points, immediately
frozen in liquid nitrogen, and stored at -80°C until further analysis. Extraction was
performed by rapid grinding of tissue in liquid nitrogen and immediate addition of
ethanol as described by Gibon et al. (2004). The ethanol extracts and the
precipitated were stored at -20°C for subsequent metabolites quantification.
2.4.2 Chlorophyll Determination
The content of chlorophyll (a and b) was determined immediately after
ethanolic extraction using aliquots from the supernatant and ethanol mix placed
on microplates. The absorbance was measured at 645 and 665 nm. The content of
chlorophyll a was determined following the equation suggested by Arnon (1949).
Last, the total content of chlorophyll (a + b) as well as chlorophyll a/b ratio were
determined.
2.4.3 Malate and Fumarate Content
Malate and fumarate content were determined as previously described by
Nunes-Nesi et al. (2007). The mix containing buffer Tricine / KOH 0.4 M, pH 9;
MgCl2 10 mM, MTT (methylthiazolyldiphenyl - tetrazolium bromide) 10 mM,
NAD+ (60 mM), phenazinaetosulfato 20 mM, Triton X100 10% (v/v) and H2O
was added to 10 μL of ethanol extract in a microplate reader. The absorbances
were read at 570 nm in one minute intervals. Once the values were stabilized a
successive addition of malate dehydrogenase (1U/reaction) and fumarase

7
(0,1U/reaction) was performed. The concentration of malate and fumarate in the
samples was calculated based on standard curves.
2.4.4 Amino acids Content
Total amino acids content was determined as described by Cross et al.
(2006). Briefly, the mix containing 1 M citrate buffer, pH 5.2 with ascorbic acid
0.2% (w / v), 50 μL of ethanol extract and 100 mL of ninhydrin solution of 1%
(w/v in 70% ethanol) was added to the microplate which was incubated for 20 min
at 95 °C. After incubation, the plates were centrifuged for 10 seconds at 10.000 g
and subsequently the samples were transferred to a new microplate and readings
were made at 570 nm. For the determination of total amino acid content, a
standard curve of Leucine was performed.
2.4.5 Determination of Sugars Content
The levels of glucose, fructose and sucrose were determined in the ethanol
soluble fraction as previously described (Fernie et al., 2001). Briefly, 60 μL of
ethanol extract were add to a reaction medium containing HEPES/KOH buffer 0,1
M pH 7, MgCl2 (30 mM), ATP (60 mg mL-1
), NADP (36 mg mL-1
) and glucose-
6-phosphate dehydrogenase (G6PDH) (70U mL-1
). The absorbance was
determined at 340 nm in one minute intervals. Once the absorbance was
stabilized, it was added hexokinase (1.5 U/reaction), phosphoglucose isomerase
(0.7 U/reaction), and invertase (5U/reaction) to determine glucose, fructose, and
sucrose, respectively. To calculate the concentration of the respective sugars the
following equation μmol NADPH= ΔOD/(2,85*6,22) was used.
2.4.6 Determination of Starch Levels
Starch level was measured as previously described (Fernie et al., 2001).
Briefly, the precipitate was resuspended in 0.1 M NaOH, and neutralized with 1M
acetic acid. The mix for degradation of starch containing the enzymes
amyloglucosidase and α-amylase diluted in sodium acetate 0.5M pH 4.0 was
added to 40 μL of suspension and incubated at 55°C for 60 min. The plates were
centrifuged for 10 seconds at 10.000g and then 50 μL of the suspension was
transferred to a new plate where it was added to each well 160 μL of a mix
containing HEPES / KOH buffer 1M, pH 7.0, MgCl2 (30 mM), ATP (60mg/mL),

8
NADP (36mg/mL), and glucose-6-phosphate dehydrogenase (0.7 U/μL). The
absorbances were read at 340 nm in one minute intervals. Once the absorbance
was stabilized, the reaction was started by adding hexokinase (2U/well). To
calculate the concentration of glucose the following equation was used: μmol
NADPH= ΔOD/(2,85*6,22).
2.4.7 Determination of Protein
Protein content was determined as in Cross et al. (2006). Briefly, it was
added to the tubes containing the precipitate NaOH 0.1 M following incubation
for 1 hour at 95°C. Subsequently, the tubes were centrifuged at 16.000g for 5
minutes. Aliquot of 3 μL of supernatant was added to a microplate containing in
each well 180 μL of Bradford reagent (1/5). The absorbance was determined at
the wavelength of 595 nm. The content of protein of each sample was determined
using a standard curve of bovine serum albumin (BSA)
2.5 Measurements of Photosynthetic Parameters
Gas-exchange measurements were performed with an open-flow infrared
gas exchange analyser system (Li-Cor 6400XT, Li-Cor Inc., Lincoln, NE, USA)
with a portable leaf chamber of 2 cm2. Light was supplied from a series of light
emitting diodes located above the cuvette, providing an irradiance of either 150 or
1000 µmol photons m-2
s-1
. The reference CO2 concentration was set at 400 μmol
CO2 mol-1
air. Dark respiration was measured using the same protocol after 30
min during the dark period. All measurements were performed at 25oC and vapour
pressure deficit was maintained at 2.0 ±0.2 KPa while the amount of blue light
was set to 10 % of photon flux density to optimize stomatal aperture. The
determination of the photosynthetic parameters was performed in four week old
plants. The ratio of Fv/Fm, which corresponds to the potential quantum yield of the
photochemical reactions of PSII and represents a measure of the photochemical
efficiency, was measured as previously described (Oh et al., 1996).
2.6 Metabolite Profiling
Metabolite extraction was performed essentially by following an
established gas chromatography-mass spectrometry (GC-MS)-based metabolite
profiling protocol of Lisec et al. (2006) modified. Approximately 50 mg of

9
homogenized plant materials were aliquoted in tubes and extracted in 100%
methanol and internal standard (0.2 mg ribitol mL-1
water). 2.0 mL tubes were
shaken for 15 min at 70°C and next centrifuged at 17000g for 10 min. The
supernatant was transferred to new tubes and, afterwards, 100% chloroform and
distilled water were added. Tubes were centrifuged at 1500g for 15 min. Finally,
150 μL of the upper phase of each sample were transferred to new 1.5 mL tubes
and let to dry overnight in a vacuum centrifuge (SPD 111 V-230, Thermo
Scientific, Waltham, USA).
The derivatization and sample injection steps were carried out exactly as
previously described (Lisec et al., 2006). Peak detection, retention time alignment,
and library matching were performed using Target Search R-package (Cuadros-
Inostroza et al., 2009). Metabolites were identified in comparison to database
entries of authentic standards (Kopka et al., 2005; Schauer et al., 2005).
Identification and annotation of detected peaks followed the recommendations for
reporting metabolite data described in Fernie et al. (2011). The full dataset from
the metabolite profiling study is additionally available as Supplemental Table S1.
2.7 Expression Analysis by RT-PCR
Total RNA was isolated using TRIzol reagent (Ambion, Life Technology)
according to the manufacturer's recommendations. The total RNA was treated
with DNAse I (RQ1 RNase free DNase I, Promega, Madison, WI, USA). The
integrity of the RNA was checked on 1% (w/v) agarose gels, and the
concentration was measured using a Nanodrop spectrophotometer. Finally, 2 μg
of total RNA were reverse transcribed with Superscript II Rnase H2 reverse
transcriptase (Invitrogen) and oligo (dT) primer according to the manufacturer's
recommendations. Real-time PCR reactions were performed in a 96-well
microtitre plate with an ABI PRISM 7900 HT sequence detection system
(Applied Biosystems Applera, Darmstadt, Germany), using Power SYBR Green
PCR Master Mix according to Piques et al. (2009). The primers used here were
designed using the open-source program QuantPrime-qPCR primer designed tool
(Arvidsson et al., 2008) and are described in the Supplemental Table S2. The
transcription abundance was calculated by the standard curves of each selected
gene and normalized using the constitutively expressed genes ACTIN

10
(AT2G37620). Data analyses were performed as described by Caldana et al.
(2007). Three biological replicates were processed for each experimental
condition.
2.8 Statistical Analyses
The experiments were conducted in a completely randomized design with
3-6 replicates of each genotype. Data were statistically examined using analysis of
variance and tested for significant (P < 0.05) differences using Student’s t tests.
All statistical analyses were performed using the algorithm embedded into
Microsoft Excel.

11
3. RESULTS
3.1 Isolation of T-DNA insertional mutants of ATG genes
To examine the involvement of autophagy in metabolic responses during
plant development and carbon limitation, we analyzed three previously described
loss-of-function mutants of the autophagy pathway, namely (i) ATG5 (atg5-1;
Thompson et al., 2005), (ii) ATG-7 (atg-7-2; Hofius et al., 2009) and (iii) ATG-9
(atg-9-1; Hanaoka et al., 2002). To this end, the homozygosity of each mutant line
was confirmed by using primer pairs designed to span the T-DNA insertion sites
of each loci. The Arabidopsis glyceraldehyde 3-phosphate dehydrogenase
(GAPDH) gene was used as a control to demonstrate the integrity and quantity of
the RNA preparation (Supplemental Figure 2D). ATG5, ATG7 and ATG9
mRNAs were detected in the wild-type (WT) control (Columbia-0) using the
primer set L1/R, L2/R2 and L3/R3, respectively (Supplemental Figure 2A, B and
C). No amplification products were observed in atg mutants for each gene
correspondent to mutation (Supplemental Figure 2D), confirming that transcripts
spanning the T-DNA insertion site are absent in these mutant lines.
3.2 Autophagy deficiency reduce growth and seed yield
In order to gain further insight on the consequences of the lack of
autophagy related genes under non stressing environmental conditions, mutants
plants were grow side by side with their respective wild-type to evaluated
morphological and physiological parameters. Analysis of the morphologic
parameters showed a clear decrease of rosette area only for atg7-2 mutants
followed by a decrease in both fresh and dry weight accumulation in this genotype
(Table 1). No differences were observed for specific leaf area between wild-type
plants and atg mutant lines (Table 1).

12
Table 1: Growth parameters of atg mutants (4-week-old-plants)
Parameters Genotypes
WT atg5-1 atg7-2 atg9-1
Fresh weigth (mg) 88.45 ±9.1 77.85 ± 3.94 62.28± 4.33 91.69 ± 10.91
Dry weigth (mg) 9.94 ± 1.19 7.63 ± 0.44 5.92 ± 0.30 8.62 ± 0.92
Rosette area (cm2) 30.04 ± 2.15 29.06 ± 1.28 24.57 ± 0.30 30.52 ± 1.88
Specific leaf area
(cm2 g
-1)
425.61 ± 15.43 460 ± 19.88 481.89 ± 20.75
448.75 ± 34.68
*Values presented are means ± SE of at least six independent biological replicates per
genotype; values in bold were determined by the Student’s t-test to be significantly
different (P< 0.05) from the WT
Given that the disruption of autophagy seems to result in minor growth
impairments, we next evaluated a range of physiological parameters to assess
whether changes in growth may be associated with alteration in those parameters
in 4-week-old plants. Dark respiration (Rd) was similar between WT and mutant
plants (Figure 1A). Gas exchange parameters were measured and no differences
were observed in net assimilation rate (A) (Figure 1B), stomatal conductance (gs)
(Figure 1C) and internal CO2 concentration (Ci) (Figure 1D). Thus, although
autophagy seems to be a limiting factor for normal growth in Arabidopsis plants it
is not likely related to photosynthetic efficiency per se.
We next investigated the impact of the autophagy process during the reproductive
stage. Although reductions in the number of seeds per silique were observed
(Figure 2A), no major changes in 1000 seeds weight (Figure 2B) and in silique
length (Figure 2C) were observed in atg mutants. Total number of siliques per
plant was reduced in atg mutants (Figure 2E) with no changes in branch numbers
(Figure 2F) leading to reductions in yield per plant in atg mutants (Figure 2D), in
agreement with previous observation of lower seeds dry weight per plant in
Arabidopsis plants lacking core components of the ATG system (Guiboileau et
al., 2012). These results demonstrated the importance of autophagy for efficient

13
seed production under optimal conditions and that this phenotype might be a
result either of the decreased photoassimilate delivery and/or a disruption of
normal developmental cues within the mutant silique.
WT atg5-1 atg7-2 atg9-1
Rd (
mm
ol m
-2 s
-1)
0.0
0.5
1.0
1.5
2.0
0.22 0.1907 0.2204 0.1914
A (m
ol m
-2 s
-1)
0
2
4
6
WT atg5-1 atg7-2 atg9-1
gs (
mm
ol m
-2 s
-1)
0.0
0.1
0.2
0.3
WT atg5-1 atg7-2 atg9-1
C i
(µm
ol C
O2 m
ol-1
)
0
100
200
300
400
A B
C D
WTWT
Figure 1. Gas-exchange parameters are not affected in WT and atg mutants.
(A) Dark respiration (Rd), (B) net CO2 assimilation rate (A), (C) stomatal
conductance (gs), (D) internal CO2 concentration (Ci). Values presented are means
± SE of five biological replicates per genotype; an asterisk (*) designate values
that were determined by the Student’s t-test to be significantly different (P < 0.05)
from WT.

14
Seed w
eig
ht (m
g/ 1000 s
eed)
0
5
10
15
20
25
Seeds/ sili
que
0
10
20
30
40
50
60
Sili
que length
(cm
)
0.0
0.3
0.6
0.9
1.2
1.5
1.8
Genotypes
WT atg5-1 atg7-2 atg9-1
Tota
l sili
que p
er
pla
nt
0
30
60
90
120
150
180
* *
*
*
wt 5-1 7-2 9-1
Seed y
ield
per
pla
nt (m
g)
0
20
40
60
80
100
* *
*
*
*
*
*
Genotypes
WT atg5-1 atg7-2 atg9-1
Bra
nch n
um
ber
0
1
2
3
4
A B
C D
E F
WT WT
Figure 2: Seed and silique phenotype observed in Arabidopsis atg mutants.
(A) number of seeds/silique, (B) seed weight, (C) silique length (D) seed yield,
(E) total silique per plant, (F) Branch number. Seed weight was obtained by
measuring 1000 seeds (n=10). Silique length (C) was determined in images which
were taken with a digital camera (Canon Poweshot A650 IS) attached to stereo
microscope (Zeizz Stemi 2000-C). The measurements were performed on the
images using the ImageJ software. Values presented are means ± SE of at least ten
biological replicates per genotype; an asterisk (*) designate values that were
determined by the Student’s t-test to be significantly different (P < 0.05) from
WT.

15
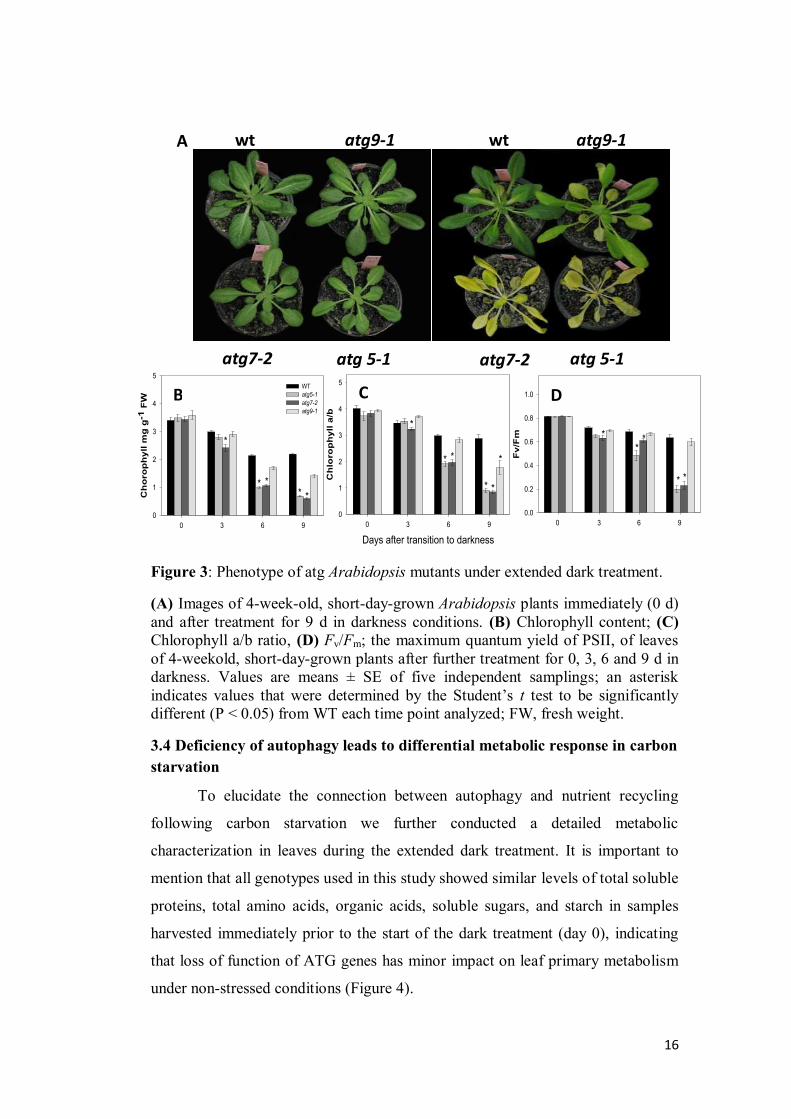
3.3 atg mutants are more susceptible to energy deprivation
Given that previous studies have implicated the function of autophagy in
providing alternative substrates to respiration under stress conditions (Izumi et al.,
2013; Avin-Wittenberg et al., 2015), we next transferred 4-week-old mutants
plants to extended dark conditions alongside their respective wild-type. Under
these conditions, a range of phenotypes became apparent (Figure 3). The atg5-1
and atg7-2 mutants started to wilt and show signs of senescence already after 6
days of continuous darkness, and both mutants were apparently dead after 12 days
of continuous darkness (Supplemental Figure 3). It should be pointed out that
wild-type plants were still alive and exhibited only limited signs of senescence
and no visible abnormalities after 12 days of continuous darkness. It is noteworthy
that the atg9-1 mutant also showed signs of senescence after 9 days of continuous
darkness but with a less severe phenotype in comparison with atg5-1 and atg7-2
mutants, showing thus an intermediate senescence phenotype between wild-type
control plants and the others two atg mutants lines (Figure 3A).
In order to further investigate this accelerated senescence symptoms, two
parameters related to chloroplast function, chlorophyll contents and maximum
photochemical efficiency of PSII (maximum variable fluorescence to maximum
yield of fluorescence ratio Fv/Fm) were analyzed (Figure 3B, C and D). During
extended dark conditions the chlorophyll content declined more rapidly in the
mutants than in the wild-type (Figure 3B) and it was coupled with similar
reduction in the chlorophyll a/b ratio (Figure 3C). Accordingly, these results were
associated with a more rapid decline in the photochemical efficiency of PSII
(Fv/Fm) in atg5-1 and atg7-2 mutants after 6 d of darkness. By contrast, Fv/Fm
values in both wild-type and atg9-1 lines remained similar throughout the entire
time period of the experiment (Figure 3D). Thus, these parameters are in good
agreement with the early senescence phenotype we observed in both atg5-1 and
atg7-2 mutants in comparison to wild-type and atg9-1.
16
Figure 3: Phenotype of atg Arabidopsis mutants under extended dark treatment.
(A) Images of 4-week-old, short-day-grown Arabidopsis plants immediately (0 d)
and after treatment for 9 d in darkness conditions. (B) Chlorophyll content; (C)
Chlorophyll a/b ratio, (D) Fv/Fm; the maximum quantum yield of PSII, of leaves
of 4-weekold, short-day-grown plants after further treatment for 0, 3, 6 and 9 d in
darkness. Values are means ± SE of five independent samplings; an asterisk
indicates values that were determined by the Student’s t test to be significantly
different (P < 0.05) from WT each time point analyzed; FW, fresh weight.
3.4 Deficiency of autophagy leads to differential metabolic response in carbon
starvation
To elucidate the connection between autophagy and nutrient recycling
following carbon starvation we further conducted a detailed metabolic
characterization in leaves during the extended dark treatment. It is important to
mention that all genotypes used in this study showed similar levels of total soluble
proteins, total amino acids, organic acids, soluble sugars, and starch in samples
harvested immediately prior to the start of the dark treatment (day 0), indicating
that loss of function of ATG genes has minor impact on leaf primary metabolism
under non-stressed conditions (Figure 4).
A
0 DAY 9 DAY
0 3 6 9 F
v/F
m0.0
0.2
0.4
0.6
0.8
1.0
Days after transition to darkness
0 3 6 9
Ch
loro
ph
yll
a/b
0
1
2
3
4
5
0 3 6 9
Ch
oro
ph
yll
mg
g-1
FW
0
1
2
3
4
5
WT
atg5-1
atg7-2
atg9-1
*
* ** *
* *
*
**
**
**
* *
B C D
wt
atg7-2
atg9-1
atg 5-1
wt
atg7-2
atg9-1
atg 5-1

17
Glu
cose (m
ol g
-1 F
W)
0
1
2
3
4
5
WT
atg5-1
atg7-2
atg9-1
0 3 6 9
Fru
tose (m
ol g
-1 F
W)
0.0
0.2
0.4
0.6
0.8
1.0
Pro
tein
(m
g g
-1 F
W)
0
5
10
15
20
0 3 6 9
Sucro
se (m
ol g-1
FW
)
0
1
2
3
4
5
6
7
0 3 6 9
Sta
rch
(µm
ol g
-1 F
W)
0
10
20
30
40
50
* * *
** * * *
* ***
**
A B
C D
Days after transition to darkness
0 3 6 9
Am
ino A
cid
s (m
ol g-1
FW
)
0
10
20
30
40
50
Days after trasition to darkness
0 3 6 9
Fum
ara
te (m
ol g-1
FW
)
0
2
4
6
8
Days after transition to darkness
0 3 6 9
Mala
te (m
ol g-1
FW
)
0
5
10
15
20
25
**
* ** *
* *
*
**
*
**
* *
*
*
*
*
E F
G H
Figure 4: Metabolite levels in atg Arabidopsis mutants. Metabolites were
measured using whole rosette of 4-week old short-day-grown Arabidopsis plants
after further treatment for 0, 3, 6 and 9 d in extended darkness.
(A) Glucose, (B) Sucrose, (C) Fructose, (D) Starch, (E) Protein, (F) Amino acids,
(G) Malate and (H) Fumarate. Values presented are means ± SE of five biological
replicates per genotype; an asterisk (*) designate values that were determined by
the Student’s t-test to be significantly different (P < 0.05) from the wild-type.

18
As it might be expected, the extended dark treatment led to a rapid decline
in starch and sugars (sucrose, fructose, and glucose) contents in both wild-type
and atg mutants analyzed here (Figure 4A-D). After 9 d of darkness, we observed
high levels of starch in atg5-1 and atg7-2 mutants coupled with lower levels of
sucrose and glucose in atg mutants in comparison to wild-type plants. While these
changes are striking it has been previously demonstrated that autophagy
contributes to starch degradation (Wang et al., 2013). Taken together, these results
coupled with those of Wang et al (2013) indicates that in plants without
autophagic machinery there is starch accumulation, most likely because
impairments in its degradation, leading also to low glucose and sucrose content at
end of darkness treatment.
Given that proteins are targets of the autophagy machinery (Li and Viestra,
2012), we next decided to examine the protein content during the extended dark
treatment. Thus, while total protein content decreased during dark treatment in all
genotypes (Figure 4E), it should be noted that the levels were reduced in a lower
extent in the mutants, especially in atg5-1 and atg7-2 lines, in comparison to wild-
type suggesting possible impairments in protein degradation due to disruption of
the autophagic process. Significant increases in the levels of total amino acids
were observed throughout the dark treatment most likely as a result of enhanced
protein degradation following carbon starvation conditions (Figure 4F).
Accordingly, after 9 d of darkness the amino acid content were higher in atg5-1
and atg7-2 mutants, followed by less severe increments in atg9-1 mutants. Both
TCA cycle intermediates analyzed spectrophotometrically, malate and fumarate,
decreased at the first days at darkness, but significant increased levels in atg
mutants following exposure to 9 d of extended darkness were observed (Figure
4G and H).

19
Figure 5: Relative levels of sugars and organic acids in Arabidopsis atg mutants
during extended dark conditions as measured by GC-MS.
The y axis values represent the metabolite level relative to WT. Data were
normalized to the mean response calculated for the 0-d dark treated leaves of the
WT. Values presented are means ± SE of five biological replicates per genotype;
an asterisk (*) designate values that were determined by the Student’s t-test to be
significantly different (P < 0.05) from WT each time point analyzed.
In order to obtain a more comprehensive characterization of changes in the
primary metabolism of atg mutants, we next decided to extend this study to major
pathways of metabolism by using an established gas chromatography-mass
spectrometry (GC-MS) based metabolite profiling which was able to successfully
identify 30 primary metabolites. It was observed considerable changes in the
levels of a wide range of organic acids, amino acids and sugars in atg mutants in
2-oxoglutarate
0 3 6 9d
0
2
4
6
8
10Citrate
0d 3d 6d 9d
0
2
4
6
8
10
12
Col 149
Col 152
Col 155
Col 158
Fumarate
0d 3d 6d 9d
0.0
0.5
1.0
1.5
2.0
2.5 Malate
0d 3d 6d 9d
0
1
2
3
4
5
Col 173
Col 176
Col 179
Col 182
Oxaloacetate
od 3d 6d 9d
0
10
20
30
40
Pyruvate
0d 3d 6d 9d
Re
lative
Va
lue
s
0.0
0.3
0.6
0.9
1.2
1.5Fructose
0d 3d 6d 9d
0.0
0.3
0.6
0.9
1.2
Maltose
0 3 6 9
0.0
0.3
0.6
0.9
1.2
1.5 Sucrose
Days after transition to darkness0 3 6 9
0.0
0.2
0.4
0.6
0.8
1.0
1.2
Glucose
0.0
0.2
0.4
0.6
0.8
1.0
1.2
* *
**
**
*
*
* **
*
Dehydroascorbate
0.0
0.2
0.4
0.6
0.8
1.0
1.2
* * *
*
**
*
*
* *
*
*
*
**
**
*
*
*
Trehalose
0 3 6 9
0
1
2
3
4
5
WT
atg5-1
atg7-2
atg9-1
* *
* * * * * *
**
* *
* *
*
*
*
20
response to dark treatment (Figures 5 and 6). The TCA cycle intermediates citrate,
fumarate, malate, 2-oxoglurate, and pyruvate were significantly increased in all
atg mutants at the end of dark treatment (Figure 5). While in wild-type plants the
levels of these organic acids are constant or tended to reduce in dark treatment,
indicating impairment of TCA cycle operation in atg mutants. Although not
different from wild-type plants, there were increments in the levels of
oxaloacetate, whereas the levels of dehydroascorbate were dramatically reduced at
the end of dark treatment declining to as low as 35% of the levels measured at the
start of the treatment. In agreement with our spectrometric assays reduced levels
of sugars were observed in all genotypes starting after 3 d of darkness. It is
important to mention that minor differences including significant reduced levels
of sucrose, glucose, and fructose in atg mutants after 9 d at darkness were
observed. Additionally, increased of trehalose levels starting from 6 d at darkness
were observed in all mutant lines coupled with the absence of changes in maltose
levels (Figure 5).
The levels of individual amino acids revealed that Asparagine, Isoleucine,
Leucine, Lysine, Ornithine, Phenylalanine, Tryptophan, Tyrosine and Valine
significantly increased in all genotypes following dark treatment while the levels
of Alanine and Glutamine were reduced (Figure 6). Noteworthy, some metabolites
showed similar trend to changes with respect to the wild-type, meaning increases
or decreases, but with different intensity, as in the case of Arginine, ß-alanine and
Methionine that increased less in atg mutants whereas Aspartate and Histidine
increased more in the mutants in general. Thus, higher levels of Aspartate and
Histidine were observed only in atg5-1 and atg7-2 mutants following 6 d of
darkness (Figure 6). Although Glutamine levels were virtually constant in wild-
type following dark treatment significant reductions were observed for both atg5-
1 and atg7-2 mutant lines. Asparagine levels increased in all mutant lines but
without differing from wild-type levels.

21
Figure 6: Relative levels of amino acids in Arabidopsis atg mutants during
extended dark conditions as measured by GC-MS.
The y axis values represent the metabolite level relative to WT. Data were
normalized to the mean response calculated for the 0-d dark treated leaves of the
WT. Values presented are means ± SE of five biological replicates per genotype;
an asterisk (*) designate values that were determined by the Student’s t-test to be
significantly different (P < 0.05) from WT each time point analyzed.
Tryptophan
0 3 6 9
0
10
20
30
40
50
60
70
Alanine
0.0
0.5
1.0
1.5
2.0
col
5-1
7-2
9-1
Asparagine
0
10
20
30
40Arginine
0
5
10
15
20
25
WT
atg5-1
atg7-2
atg9-1
* *
**
* *
Aspartate
0
1
2
3
4
5
6
* *
*
*
*
*
Alanine
0
2
4
6
8
10
12
* * * **
* *
Glutamine
0.0
0.5
1.0
1.5
* **
* **
Glycine
Re
lative
valu
es
0.0
0.2
0.4
0.6
0.8
1.0
1.2
1.4
* *
Histidine
0
10
20
30
40
*
* *
*
Isoleucine
0
10
20
30
40
* *
* * * *
*
**
Leucine
0
5
10
15
20
25
* *
*
**
** *
*
Lysine
0
10
20
30
40
50
60
**
* *
**
**
*
Methionine
0
10
20
30
40
50
*
*
**
*
Ornithine
0
20
40
60
80
100
* **
*
* *
Phenylalanine
0
10
20
30
40
50
60
70
*
Serine
0.0
0.5
1.0
1.5
2.0
2.5
*****
*
*
Valine
0 3 6 9
0
2
4
6
8
10
12
14
16Tyrosine
Days after transition to darkness
0 3 6 9
0
10
20
30
40
50
60
* ** *
** *
**
* ** * *
*
*
* *

22
Interestingly, increases in BCAA (Leucine, Isoleucine, and Valine),
Lysine, Tyrosine, Methionine and Ornithine observed in wild-type plants
following dark treatment were also observed in atg mutant lines but less
pronounced and thus partially compromised in atg mutants during dark treatment.
The importance of BCAAs, aromatic amino acids, and Lys for respiration during
sugar starvation has been previously demonstrated (Araújo et al, 2010). However,
it is important to note that the lower levels of the majority of these amino acids
observed in our experimental conditions indicated that they might be used as
potential alternative substrate for respiratory energetic production in plants with
impairments of autophagy.
3.5 Carbon starvation induced by darkness leads to induction of alternative
pathways in atg mutants
In order to investigate whether autophagy impairments coupled with
amino acids reduction are involved with alternative pathways of respiration,
transcription analysis of genes related to the ETF/ETFQO pathway by quantitative
RT-PCR were performed (Figure 7). During carbon starvation the importance of
BCAAs, aromatic amino acids, and Lysine for respiration has been demonstrated
through of loss-of-function mutants for isovaleryl-CoA dehydrogenase (IVDH),
2-hydroxyglutarate dehydrogenase (D2HGDH), electron-transfer flavoprotein
(ETF), and electron-transfer flavoprotein:ubiquinone oxidoreductase (ETFQO)
(Ishizaki et al., 2005, 2006; Araújo et al., 2010). Thus, firstly, we demonstrated
that in general the transcript levels of IVDH, ETFQO, ETFß and D2HGDH were
clearly induced in atg5-1 and atg7-2 in comparison to the levels observed in wild-
type plants while in atg9-1 mutants a mild induction was observed when
compared with the others atg mutants under extended-dark treatment (Figure 7).
More specifically, ETFß was only up regulated in atg5-1 and atg7-2 plants after 6
and 9 day of darkness with no changes observed in both wild-type and atg9-1
mutants plants (Figure 7A). In addition, ETFQO was up regulated following dark
treatment in all genotypes but more expressively in atg mutants after 6 d of
darkness (Figure 7B). Also, there was an early induction of IVDH transcripts in
both wild-type and atg mutants after 3 d of darkness (Figure 7C). Such strong

23
induction of IVDH reaching increments higher than 20-fold after 3 d of dark
transition reinforces its pivotal role in amino acids degradation (Araújo et al.,
2010; Peng et al., 2015). Given that Lysine catabolism can occur by either
D2HGDH or LKR/SDH (Engqvist et al., 2009, 2011, Galili, 2011; Kirma et al,
2012) we next decided to investigate the changes in the expression of those genes.
Similarly to the observed for the ETFß the expression of D2HGDH was only up
regulated in atg5-1 and atg7-2 plants after 6 and 9 day of darkness with no
changes in the other genotypes used here (Figure 7D). Interestingly, the
expression of LKR/SDH was strongly induced in all genotypes following dark
treatment with higher induction being observed in atg5-1 and atg7-2 after 6 and 9
d of darkness (Figure 7E). Our data also demonstrated a higher induction of
LKR/SDH (about 200-fold) than of D2HGDH (10-fold, Figure 7). Thus, it seems
tempting to speculate that Lysine degradation occurs preferably by LKR/SDH
pathway following extended dark conditions.
3.6 The lack of autophagy induces senescence and chloroplast degradation
events
Given that several senescence parameters are also induced in response to
darkness, we next investigated the expression of the commonly known
senescence-associated genes SAG12 and SAG13 during dark induced senescence.
Interestingly, although no changes in the transcript levels of both SAG12 and
SAG13 were observed in both wild-type and atg9-1 mutants plants following dark
treatment, the transcripts levels of SAG12 and SAG13 were highly induced in
atg5-1 and atg7-2 mutants in all times points analyzed (Figure 7F and 7G). Taken
together with chlorophyll content and Fv/Fm values, these results are in good
agreement with an early-senescence associated phenotype observed in those
genotypes.

24
ETF
0
2
4
6
8WT
atg5-1
atg7-2
atg9-1
ETFQO
0 3 6 9
0
10
20
30
60
90
120
D2HGDH
0
2
4
10
15
IVDH
0
10
20
30
* **
** * *
*
*
*
*
*
* * *
*
*
CV
Days after transition to darkness
0 3 6 9
0
3
6
9
60
90
120
150
SAG 12
Rel
ativ
e va
lues
0
20
40
60
ATG 7
0
1
2
3
4
5
60
90
120
150
ATG 9
Days after transition to darkness
0 3 6 9
0
1
2
10
20
30
*
*
*
*
*
**
**
*
*
*
*
*
*
*
SAG 13
0
1
2
3
4
5
6
7
*
*
*
* *
**
LKR/SDH
0
100
200
300
400
500
*
*
*
**
*
A B
C D
E F
G H
I J
Rel
ativ
e va
lues
Figure 7: Transcript expression levels of genes related to alternative pathways of
respiration, senescence, chloroplast vesiculation, and ATG genes in 4-weekold,
short-day-grown, Arabidopsis plants after further treatment for 0, 3, 6 and 9 d in
extended darkness.
The y axis values represent the metabolite level relative to the wild-type (WT).
Data were normalized to the mean response calculated for the 0-d dark treated
leaves of the wild-type. Values are average of three independent biological
replicates. (*) indicates values that were determined by the Student’s t test to be significantly different (P < 0.05) from the wild-type in which dark point.

25
To examine the changes associated with autophagy following dark
conditions, we next measured transcript levels of ATG7 and ATG9 genes. No
expression of ATG7 and ATG9 was observed in atg7-2 and atg9-1, respectively
(Figure 7H and I). It was additionally observed accumulation of ATG7 transcripts
in atg5-1 and atg9-1 mutants, whereas accumulation of ATG9 transcripts in atg5-1
and atg7-2 mutants was also similarly observed. In accordance, the increased of
autophagy transcripts in atg mutants during carbon starvation has been
extensively reported (Thompson et al., 2005; Rose et al., 2006; Phillips at al.,
2008), suggesting that expression of transcripts related with different steps of
autophagic process is upregulated by autophagic defect. In contrast, no induction
of those ATG genes was observed in wild-type plants during dark induced
senescence (Figure 7H and I).
Degradation of chloroplasts is assumedly one hallmark of both natural and
stress-induced plant senescence (Ishida et al., 2014), and autophagy is an
established cellular pathway involved in targeting chloroplast proteins for
degradation (Ishida et al., 2008; Wang et al., 2013; Ishida et al., 2014). Recently,
an autophagy-independent pathway for chloroplast degradation, the chloroplast
vesiculation (CV) which is associated with thylakoid and stroma proteins
degradation, was unequivocally demonstrated (Wang and Blumwald, 2014). Thus,
we further investigated the expression of CV gene during our experimental
conditions. Interestingly, it was observed an expressive higher induction of CV
gene expression in atg5-1 and atg7-2 mutants under dark induced senescence (110
and 60-fold after 9 days of darkness, respectively), while the transcripts levels
remained virtually constant in wild-type plants with relatively minor induction in
atg9-1 mutants (Figure 7J).

26
4. DISCUSSION
During the last decade we have witnessed a growing body of evidence
showing the function of autophagy in nutrient recycling under energy-limited
conditions (Thompson et al., 2005; Phillips et al., 2008; Chung et al., 2010; Izumi
et al., 2010). Thus, although the connection between autophagy, protein
degradation and amino acid availability during energetic limitation has been
recently demonstrated (Izumi et al., 2013; Avin-Wittenberg et al., 2015) our
current understanding of the precise metabolic process involved in energy supply
following carbon starvation remains fragmented. Here, by using a range of
biochemical and molecular tools coupled with the use of T-DNA insertional lines
we provided further evidence of the importance of autophagy in governing a
highly exquisite metabolic reprogramming allowing the supply of energy during
both carbon starvation and developmental stages of plant life cycle.
By using previous characterized autophagy deficient mutants we first
provide further evidence that this process impacts both vegetative and
reproductive development. Growth parameters evaluated by rosette area, fresh and
dry weight were smaller in atg7-2 mutant (Table 1). This growth impairment did
not seem to be associated with alterations in photosynthetic or dark respiration
rates that were not affected in atg mutant but it rather seems to be intriguingly
associated with metabolic effects. In good agreement, growth inhibition has also
been observed in atg mutants grown under both short day conditions and mineral-
rich medium without sucrose, providing a mechanism where autophagic process
operates in nighttime energy availability and sustain growth (Izumi et al., 2013).
Regarding the importance of autophagy during the reproductive stage, it was
observed that the lack of autophagic process culminates with a negative impact in
seed production (Figure 2D). Thus, atg mutants have reduced number of seeds per
silique and therefore atg5-1 shows the lower seed yield followed by atg7-2 and
atg9-1 (Figure 2). Remarkably, lower seed yield in conjunction with deficiency of
nitrogen remobilization has been previously demonstrated in atg mutants (Avila-
Ospina et al, 2014). The results obtained here are in good agreement with the
pivotal importance of amino acid catabolism to the seed energy status (Galili and
Amir, 2013). Furthermore, the blockage of leucine catabolism in 3-methylcrotonyl

27
CoA carboxylase (MCCAse) loss-of-function plants diminished both seed
germination and seed yield in Arabidopsis thaliana (Ding et al., 2012). Thus, it
seems highly tempting to suggest that the impaired reproductive growth
phenotype observed in atg mutants can be at least partly associated with
impairment of protein degradation that compromises remobilization processes and
amino acid metabolism. Furthermore, our results strongly suggest that autophagy
is necessary for efficient seed production under optimal conditions. Functional
relationship between energetic metabolism, seed production, and autophagy itself
will need to be further investigated in future studies.
Despite the function of autophagy during plant developmental processes,
our main goal here was to enhance our understanding of the metabolic implication
of autophagy following carbon starvation and its impact on energetic pathways.
The first evidence for the importance of autophagy function was the early onset of
dark-induced senescence observed in atg mutants accompanied by chlorophyll
and photosynthetic competence losses under extended darkness (Figure 3).
Interestingly atg7-2 and atg5-1 mutants exhibit a stronger phenotype than atg9-1
mutant, which seems to be associated with the degree of autophagy impairment in
each mutant line. Arabidopsis mutants atg7-2 and atg5-1 were previously
characterized by full inhibition of autophagy while atg9-1 presented only a
reduction of autophagic bodies occurrence (Thompson et al., 2005; Shin et al.,
2014). In agreement with the phenotype observed, senescence-associated genes
such as SAG12 and SAG13 were up regulated in atg mutants during dark
treatment, with no changes being observed in wild-type plants (Figure 7). It
should be noted that SAG12 appears to be closely linked to natural senescence and
chlorosis whilst a range of stress are unable to induce it (Noh and Amasino, 1999;
Grbić, 2003). Considering that we used 4-week-old plants and that wild-type
plants started to show few signs of senescence from 12 d of darkness onwards, it
is reasonable to assume that this mild status of induced senescence experimented
for wild-type plants was not sufficient to induce SAG12 and SAG13 transcripts. In
good agreement younger darkened plants also presented lower expression levels
of SAG12 and SAG13 when compared to older leaves (Weaver and Amasino,
2001), characterizing an age-mediated response of those transcripts. It is

28
important to mention that SAG12 and SAG13 expression has also been shown to
be partly dependent on the Salicylic acid (SA) pathway (Morris et al., 2000; Zhao
et al., 2016) and that autophagy negatively regulates SA signaling and
accumulation (Yoshimoto et al., 2009). That said, the up regulation of SAGs
transcripts can be at least partially associated with the accumulation of SA that is
usually observed in atg mutants. In agreement with our results, Yoshimoto et al
(2009) noticed that atg5 mutants accumulate SA and the senescence marker gene
SAG12 is expressed before showing any visible senescence phenotype. The
induction at transcriptional level of autophagic process has been observed in
response to nutrient starvation (Thompson et al., 2005; Rose et al., 2006; Osuna et
al., 2007), however, the abundance of these transcripts appears to be differentially
regulated by extended darkness (Rose et al., 2006; Philips et al., 2008; Chung et
al., 2010). Despite a higher induction of ATG9 and ATG7 genes verified in atg
mutants under dark treatment, the levels remained virtually constant in wild-type
plants (Figure 7H-I). In fact, it has been reported that ATG genes involved in
different steps of autophagic process may show distinct pattern of expression
under energy deprivation (Thompson et al., 2005; Rose et al., 2006; Phillips et al.,
2008). In this scenario, further gene expression analysis of other ATG genes are
required to ascertain whether the whole pathway of autophagy is induced
following carbon starvation and which ATG genes are more strictly associated in
this response in wild-type.
Hypersensitivity to carbon limited conditions is a classical response of atg
mutants in plants (for review see Li and Vierstra, 2012; Liu and Bassham, 2012;
Avila-Ospina et al., 2014); however, little is currently known about the metabolic
reprogramming that underlies this intriguingly behavior. Here, we used dark
extended conditions as our model systems for studying the association between
autophagy and alternative pathways of respiration. Thus far, although the
metabolic responses of autophagy have only being obtained using nitrogen or
carbon starvation associated with starch impairments (Izumi et al., 2013;
Guiboileau et al., 2013; Masclaux-Daubresse et al., 2014) the closest link to
alternative pathways of respirations remains far from clear. Thus, analysis of
primary metabolites showed a strong decrease of sugars and starch within the first
29
3 d of darkness, indicating that carbohydrates are completely consumed into the
first days of dark-extended treatment (Figure 4A-D). Interestingly, a subset of
organic acids exhibited a biphasic behavior during prolonged exposure to
darkness in atg mutants. This was particularly noticeable for some TCA cycle
intermediates, including fumarate, malate, citrate, and oxoglutarate, which
accumulated after 6 d of dark treatment despite decreasing during the first 3 d
(Figure 4 and 5). Remarkably, the impairment in starch degradation observed in
atg mutants following extended darkness resulted in minor levels of sugars
(Figure 4D). These results alongside with the fact that autophagy has previously
been associated with leaf starch degradation at the end of the night (Wang et al.
2013), strongly suggests that autophagy also plays a major role in starch
degradation during prolonged carbon-limited periods. Moreover, the changes
observed in TCA cycle intermediates are in good agreement with previously
results obtained with mutants for the ETF/ETFQO pathway and its alternative
associated dehydrogenases under dark-induced senescence (Ishizaki et al., 2005;
Ishizaki et al., 2006; Araujo et al., 2010), suggesting that impairments in
respiratory metabolism are also present in atg mutants. This fact notwithstanding
the organization and flux of organic acid metabolism in plants is highly dependent
on the metabolic and physiological demands of the cell (Sweetlove et. al, 2010).
Thus, it is reasonable to suggest that these changes can be consequence of an
impairment of TCA cycle or reduction of biosynthetic reactions (Ishizaki et al.,
2006; Araújo et al., 2010). Increased levels of aspartate were also observed in atg
mutants after 3 d of darkness (Figure 6). It is well known that plants usually adjust
their metabolism suppressing genes of biosynthetic enzymes of amino acids to
conserve energy under limited conditions (Baena-Gonzalez and Sheen, 2008;
Bunik and Fernie, 2009; Sulpice et al., 2009). Moreover, aspartate is involved in
the biosynthesis of lysine, threonine, methionine, and isoleucine (Azevedo et al.,
2006). Thus, aspartate accumulation may indicate a decrease in pathways of
amino acids synthesis (see Kirma et al., 2012), reinforcing the motion of a general
state of down regulation in biosynthetic pathways in atg mutants following
darkness conditions.

30
During carbon starvation proteins are degraded and the complete oxidation
of their amino acids produces energy required to fuel metabolic demands
(Hildebrandt et al., 2015). Our results demonstrated the concomitantly reduction
of protein levels coupled with increased of total amino acid content during
extended darkness (Figure 4), exactly as observed in other studies involving
amino acids metabolism under other stress conditions (Dietrich et al., 2011; Pires
et al., 2015). Although this general metabolic response was observed for all
genotypes used here, it was observed that atg mutants presented a significantly
less pronounced reduction in protein content in accordance with the fundamental
role of autophagy process in maintenance of protein breakdown (Araújo et al.,
2011; Michaeli et al., 2016). By contrast, the content of free amino acids
increased much more in atg mutants under prolonged darkness. In accordance, an
over-accumulation of total amino acids was also observed in atg mutants under
nitrogen starvation (Masclaux-Daubresse et al., 2014). Usually, higher levels of
amino acid have been associated with proteolysis events during several stress
conditions (Usadel et al., 2008; Obata and Fernie et al., 2012). However, pool
sizes of free amino acids not only depend on the relative rate of amino acid
anabolism or catabolism, but also rely on protein degradation and biosynthesis
(Obata and Fernie, 2012; Hildebrandt et al., 2015). In this scenario, our metabolite
profiling analysis provided an overview of the impact of extended darkness on
distinct amino acids. Interestingly, the levels of the majority of the amino acids
generally increased within the first 3d of darkness, albeit to a lesser extent in atg
mutants (Figure 6). The reduced relative levels of free amino acids found in atg
mutants compared with wild-type levels, particularly of those associated with
electron donors to the TCA cycle and mitochondrial electron transport chain
under carbon starvation as observed previously (Araújo et al., 2010), are likely
result of altered mitochondrial function under carbon starvation. Similar results
have been previously observed in Arabidopsis seedling following carbon
starvation (Avin-Wittenberg et al., 2015). Furthermore, these results also suggests
that the higher content of total amino acids observed in atg mutants result from
levels of aspartate, histidine, phenylalanine and tryptophan that substantially
increased during prolonged darkness.

31
Since BCAA, aromatic amino acids, and lysine have been substantially
characterized as substrates to energy provision through alternative pathways of
respiration (Ishizaki et al., 2005, 2006; Araújo et al., 2010), we paid particular
attention to the response of those amino acids (Figure 6). Our findings
demonstrated that following dark treatment increases in those amino acids were
partially compromised in atg mutants in comparison with wild-type plants (Figure
6). It has been previous demonstrated that BCAA are able to sustain respiration
during carbon starvation both by feeding electrons directly to the mitochondrial
electron chain and by providing TCA cycle intermediates following their
degradation (Araújo et al., 2011). Thus, it seems reasonable to suggest that
functional autophagy is required to allow the provision of energetic substrates
during carbon starvation. This finding is further supported by the significantly
transcript induction of genes involved with alternative respiration (ETFβ, ETFQO,
IVDH, D2HGDH) and with lysine catabolism (LKR/SDH) in atg mutants
following extended darkness (Figure 6). The up-regulation of alternative pathways
indicates higher amino acids oxidation resulting in reduced levels of amino acids
as observed in atg mutants. Support to this claim comes also from another study
with carbon starved seedling of atg mutants (Avin-Wittenberg et al., 2015)
showing that an enhancement of carbon flow is directed through the TCA cycle in
those mutants. However, considering the hypersensitivity response of atg mutants
to prolonged darkness, the catabolism of these amino acids seems not to be
sufficient to maintain proper metabolism during carbon starvation. Taken
together, the results presented here indicates that proper function of autophagy is
responsible, at least in some extent, for the release of these amino acids in
response to carbon starvation. Thus, despite the up regulation of alternatives
pathways of respiration, the levels of amino acids that can provide energy is
substantially reduced in atg mutants. Although the molecular mechanisms
involved in the regulation of amino acid metabolism are largely unknown
(Hildebrandt et al, 2015), the elucidation of the mechanism behind such interplay
between autophagy and the catabolism of protein and amino acids remains as
important areas of research that should be addressed in future.

32
In agreement of up-regulation of of several genes related with the
ETF/EFTQO in atg mutants (Figure 7), it has been previously demonstrated that
the genes associated with the ETF/ETFQO pathway are clearly induced in wild-
type plants following water stress (Pires et al., 2016). Altogether these results
indicate a good co-expression amongst the genes of this pathway, as previously
observed, particularly under stress conditions (Araújo et al., 2011). Moreover, we
also found an intense up regulation of CV gene in atg mutants following carbon
starvation (Figure 7). Accordingly, the degradation of chloroplasts is assumedly a
hallmark of both natural and stress-induced plant senescence, and furthermore the
role of autophagy in this process is well known (Ishida et al., 2008; Liu and
Bassham, 2012; Izumi et al., 2015; Xie et al., 2015). However, an autophagic-
independent process of chloroplast degradation associated with the CV pathway
has been recently demonstrated (Wang and Blumwald, 2014). Interestingly, our
results suggest that CV is highly induced in the absence of autophagy contributing
with the early senescence phenotype observed in atg mutants. It is worth to
mention that the disruption of CV has been associated with increased chloroplast
stability delaying induced senescence and enhancing tolerance to abiotic stress
whereas overexpression caused premature leaf senescence in A. thaliana (Wang
and Blumwald, 2014). Thus, it seems tempting to suggest that this autophagy
independent process of chloroplast degradation can have a substantially different
function during conditions in which photosynthesis and chloroplast activity is not
required such as dark-induced senescence. Following this assumption CV and
autophagy pathways might interact to ensure chloroplast degradation during
energy limited conditions. In summary, although our results provide only
circumstantial evidence, they clearly highlight compensatory mechanisms where
the chloroplast vesiculation pathway is induced during catabolic events in which
autophagy is disrupted. However, the mechanisms underlying the possible
interaction between the processes of autophagy and CV dependent degradation
during carbon starvation are mostly unknown and clearly deserve further
investigation.

33
Figure 8: Schematic model showing the association of catabolic process involved
in macromolecules degradation leading to electron donation to the ETF/ETFQO
pathway during dark-induced senescence in WT plants (A) and atg mutants (B).
Carbon starvation conditions promoted by extended darkness are associated with
macromolecules degradation including protein via several catabolic pathways
(e.g. autophagy) releasing amino acids to be oxidized. The electrons generated are
transferred to the respiratory chain through the ubiquinol pool via the
ETF/ETFQO system, promoting plant survival. In atg mutants there is a
compromised amino acid supply, particularly BCAA and lysine, previously
recognized to be able to feed electrons to the ETF/ETFQO system.
Simultaneously, there is a higher induction of genes associated with the
ETF/ETFQO pathways and the autophagy independent for chloroplast
degradation, the CV, which leads to an inefficient energy provision leading to a
hypersensitivity response to energetic limitations in atg mutants.

34
5. CONCLUSION
In this study we presented compelling evidence that autophagy has an
important role in sustain energetic requirements in either developmental stages or
during carbon deprivation conditions in A. thaliana. Although the impairment of
growth observed is not related with changes in both photosynthesis and
respiration, it is noteworthy that reduction in seed yield in atg mutants strongly
reinforces the significant contribution of autophagy to metabolic process affecting
plant developmental fitness. Furthermore, during prolonged darkness conditions
impairments of protein degradation and amino acid release experienced by
autophagy mutants culminates with a more critical status of energy deprivation
and resulted in a hypersensitive phenotype in A. thaliana. This assumption is
further supported by relatively minor increases in the levels of several amino acids
which can be used as alternative substrates to mitochondrial respiration. However,
despite the higher up regulation of genes related to alternative pathways of
respiration, the supply of amino acids seems not to be enough for maintenance of
energetic metabolism in atg mutants. Collectively, this energetic depletion may
favor an induction of other catabolic pathways including the degradation of
chloroplastidic proteins that is independent of autophagy such as the CV. Taken
together, the phenotypic, metabolic and transcriptional results presented here
coupled with the previously recognized connections between autophagy,
alternative pathways of respiration, and chloroplast recycle (Izumi et al., 2010;
Araujo, 2011; Izumi, et al., 2013; Xie et al., 2015) highlights the complexity and
specificity of plant metabolism in response to carbon limitation and suggest a
complex interplay involved in plant respiration and autophagy regulation.
Dissecting these mechanisms is clearly required to fully understand the key
components underlying the implications of autophagy on energetic processes in
plant metabolism. From a biotechnological perspective, understanding these
mechanisms may facilitate strategies for crop improvement towards enhanced
stress tolerance. Functional genomics coupled with omics tools hold considerable
promise for understanding these highly regulated processes.

35
6. REFERENCES
Araújo WL, Ishizaki K, Nunes-Nesi A, Larson TR, Tohge T, Krahnert I, Witt S, Obata T, Schauer N, Graham IA, Leaver CJ, Fernie AR (2010)
Identification of the 2-hydroxyglutarate and isovaleryl-CoA dehydrogenases
as alternative electron donors linking lysine catabolism to the electron
transport chain of Arabidopsis mitochondria. Plant Cell 22: 1549-1563.
Araújo WL, Tohge T, Ishizaki K, Leaver CJ, Fernie AR (2011) Protein
degradation - an alternative respiratory substrate for stressed plants. Trends
in Plant Science 16: 489–498.
Arnon DI (1949) Copper enzymes in isolated chloroplasts. Polyphenoloxidase in
Beta vulgaris. Plant physiology 24:1-
Arvidsson S, Kwasniewski M, Riano-Pachon DM, Mueller-Roeber B (2008)
QuantPrime-a flexible tool for reliable high-throughput primer design for
quantitative PCR. BMC Bioinformatics 9:465.
Avila-Ospina L, Moison M, Yoshimoto K, Masclaux-Daubresse C (2014)
Autophagy, plant senescence and nutrient recycling. Journal of Experimental
Botany 65:3799–3811.
Avin-Wittenberg T, Bajdzienko K, Wittenberg G, Alseekh S, Tohge T, Bock R, Giavilasco P, Fernie AR (2015) Global analysis of the role of autophagy
in cellular metabolism and energy homeostasis in Arabidopsis seedlings
under carbon starvation. The Plant Cell 27: 306–22.
Azevedo RA, Lancien M, Lea PJ (2006) The aspartic acid metabolic pathway,
an exciting and essential pathway in plants. Amino Acids 30:143–162
Baena-González E, Rolland F, Thevelein JM, Sheen J (2007) A central
integrator of transcription networks in plant stress and energy signalling.
Nature 448: 938–942.
Baena-González E, Sheen J (2008) Convergent energy and stress signaling.
Trends Plant Science 13: 474–482.
Bassham, DC (2009). Function and regulation of macroautophagy in plants.
Biochimical Biophysica Acta 1793: 1397–1403.
Buchanan-Wollaston V, Page T, Harrison E, Breeze E, Lim PO, Nam HG,
Lin JF, Wu SH, Swidzinski J, Ishizaki K, Leaver CJ (2005) Comparative
transcriptome analysis reveals significant differences in gene expression and
signalling pathways between developmental and dark/starvation induced
senescence in Arabidopsis. Plant Journal 42: 567–585.
Bunik VI, Fernie AR (2009) Metabolic control exerted by the 2-oxoglutarate
dehydrogenase reaction: a cross-kingdom comparison of the crossroad
between energy production and nitrogen assimilation. Biochemical Journal
422: 405-421
Chung T, Phillips AR, Vierstra RD (2010) ATG8 lipidation and ATG8-
mediated autophagy in Arabidopsis require ATG12 expressed from the
differentially controlled ATG12A and ATG12B loci. Plant Journal 62: 483–493.

36
Cross JM, von Korff M, Altmann T, Bartzetko L, Sulpice R, Gibon Y,
Palacios N, Stitt M (2006) Variation of enzyme activities and metabolite
levels in 24 Arabidopsis accessions growing in carbon-limited conditions.
Plant Physiology 142: 1574–1588
Cuadros-Inostroza A; Caldana C; Redestig H; Kusano M; Lisec J; Peña-
Cortés H; Willmitzer L; Hannah MA (2009) TargetSearch – a
Bioconductor package for the efficient preprocessing of GC-MS metabolite
profiling data. BMC Bioinformatics 10:428
Dietrich K, Weltmeier F, Ehlert A, Weiste C, Stahl M, Harter K, Dröge-
Laser W (2011). Heterodimers of the Arabidopsis transcription factors
bZIP1 and bZIP53 reprogram amino acid metabolism during low energy
stress.The Plant Cell 23: 381-395.
Ding G, Che P, Ilarslan H, Wurtele ES, Nikolau BJ (2012) Genetic dissection
of methylcrotonyl CoA carboxylase indicates a complex role for
mitochondrial leucine catabolism during seed development and
germination.The Plant Journal 70: 562-577.
Doelling JH, Walker JM, Friedman EM, Thompson AR, Vierstra RD (2002)
The APG8/12-activating enzyme APG7 is required for proper nutrient
recycling and senescence in Arabidopsis thaliana. Journal of Biological
Chemistry 277: 33105–33114
Engqvist M, Drincovich MF, Fluegge UI, Maurino VG (2009) Two D-2-
hydroxy-acid dehydrogenases in Arabidopsis thaliana with catalytic
capacities to participate in the last reactions of the methylglyoxal and ß-
oxidation pathways. Journal of Biological Chemistry 284: 25026-25037
Engqvist MKM, Kuhn A, Wienstroer J, Weber K, Jansen EEW, Jakobs C,
Weber APM, Maurino VG (2011) Plant D-2-hydroxyglutarate
dehydrogenase participates in the catabolism of lysine especially during
senescence. Journal of Biological Chemistry 286: 11382-11390
Feng Y, He D, Yao Z, Klionsky DJ (2014) The machinery of macroautophagy.
Cell research 24: 24-41
Fernie AR, Roscher A, Ratcliffe RG, Kruger NJ (2001) Fructose 2,6-
bisphosphate activates pyrophosphate: fructose-6-phosphate 1-
phosphotransferase and increases triose phosphate to hexose phosphate
cycling in heterotrophic cells. Planta 212: 250-263.
Fernie AR, Aharoni A, Willmitzer L, Stitt M, Tohge T, Kopka J, Caroll AJ,
Saito K, Fraser PD, DeLuca V (2011) Recommendations for reporting
metabolite data.Plant Cell 23: 2477-2482.
Galili G, Amir R (2013) Fortifying plants with the essential amino acids lysine
and methionine to improve nutritional quality. Plant Biotechnology Journal
11:211-222
Gibon Y, Blaesing OE, Hannemann J, Carillo P, Hohne M, Hendriks JHM,
Palacios N, Cross J, Selbig J, Stitt M (2004) A robot-based platform to
measure multiple enzyme activities in Arabidopsis using a set of cycling

37
assays: Comparison of changes of enzyme activities and transcript levels
during diurnal cycles and in prolonged darkness. Plant Cell 16: 3304-3325.
Grbić V (2003) SAG2 and SAG12 protein expression in senescing Arabidopsis
plants. Physiologia Plantarum 119: 263-269.
Guiboileau A, Yoshimoto K, Soulay F, Bataillé MP, Avice JC, Masclaux-
Daubresse C (2012). Autophagy machinery controls nitrogen remobilization
at the whole-plant level under both limiting and ample nitrate conditions in
Arabidopsis. New Phytologist 194: 732–740
Guiboileau A, Avila-Ospin L, Yoshimot K, Soulay F, Azzopardi M,
Marmagne A, Lothier J, Masclaux-Daubresse C (2013) Physiological and
metabolic consequences of autophagy deficiency for the management of
nitrogen and protein resources in Arabidopsis leaves depending on nitrate
availability. New Phytologist 199: 683–694.
Hanaoka H, Noda T, Shirano Y, Kat T, Hayashi H, Shibata D, Tabata S, Ohsumi Y (2002). Leaf senescence and starvation induced chlorosis are
accelerated by the disruption of an Arabidopsis autophagy gene. Plant
Physiology 129: 1181–1193.
Harrison-Lowe NJ, Olsen LJ (2008) Autophagy protein 6 (ATG6) is required
for pollen germination in Arabidopsis thaliana. Autophagy 4: 339–348.
Hildebrandt TM, Nunes Nesi A, Araújo WL, Braun HP (2015) Amino Acid
Catabolism in Plants. Molecular Plant 8: 1563–79.
Hofius D, Schultz-Larsen T, Joensen J, Tsitsigiannis DI, Petersen NH, Mattsson O, Jørgensen LB, Jones JD, Mundy J, Petersen M (2009)
Autophagic components contribute to hypersensitive cell death in
Arabidopsis. Cell 137: 773–783.
Ishida H, Izumi M, Wada S, Makino A (2014) Roles of autophagy in
chloroplast recycling. Biochimica et Biophysica Acta - Bioenergetics, 1837:
512–521.
Ishizaki K, Larson TR, Schauer N, Fernie AR, Graham IA, Leaver CJ (2005)
The critical role of Arabidopsis electron-transfer flavoprotein: Ubiquinone
oxido reductase during dark-induced starvation. The Plant Cell 17: 2587-
2600.
Ishizaki K, Schauer N, Larson TR, Graham IA, Fernie AR, Leaver CJ (2006)
The mitochondrial electron transfer flavoprotein complex is essential for
survival of Arabidopsis in extended darkness. The Plant Journal 47: 751-760.
Izumi M, Hidema J, Makino A, Ishida H (2013) Autophagy contributes to
nighttime energy availability for growth in Arabidopsis. Plant Physiology
161: 1682–1693.
Kirma M, Araújo WL, Fernie AR, Galili G (2012) The multifaceted role of
aspartate-family amino acids in plant metabolism. Journal of Experimental
Botany 63: 4995–5001.
Kopka J, Schauer N, Krueger S, Birkemeyer C, Usadel B, Bergmuller E,
Dormann P, Weckwerth W, Gibon Y, Stitt M, Willmitzer L, Fernie AR,

38
Steinhauser D (2005) [email protected]: the Golm metabolome database.
Bioinformatics 21:1635-1638.
Krüßel L, Junemann J, Wirtz M, Birke H, Thorton JD, Browning LW,
Poschet G, Hell R, Balk J, Braun HP, Hildebrant T (2014) The
mitochondrial sulfur dioxygenase ETHYLMALONIC
ENCEPHALOPATHY PROTEIN1 is required for amino acid catabolism
during carbohydrate starvation and embryo development in Arabidopsis.
Plant Physiology 165: 92-104
Lehmann M, Schwarzländer M, Obata T, Sirikantaramas S, Burow M, Olsen
CE, Tohge T, Fricker MD, Møller BL, Fernie AR, Sweetlove LJ, Laxa M (2009) The metabolic response of Arabidopsis roots to oxidative stress is
distinct from that of heterotrophic cells in culture and highlights a complex
relationship between the levels of transcripts, metabolites, and flux. Mol
Plant 2: 390-406
Li F, Vierstra RD (2012). Autophagy: a multifaceted intracellular system for
bulk and selective recycling. Trends Plant Science 17: 526–537
Lisec L, Schauer N, Kopka J, Willmitzer L, Fernie AR (2006) Gas-
Chromatografy mass spectometry-based metabolite profiling in plants.Nature
Protocols 1:387-396
Liu Y, Bassham DC (2012) Autophagy: pathways for self eating in plant cells.
Annual Review of Plant Biology 63: 215–237.
Liu Y, Xiong Y, Bassham DC (2009) Autophagy is required for tolerance of
drought and salt stress in plants. Autophagy 5: 954–963.
Masclaux-Daubresse C, Clément G, Anne P, Routaboul JM, Guiboilea A, Soulay F, Shirasu K, Yoshimoto K (2014) Stitching together the multiple
dimensions of autophagy using metabolomics and transcriptomics reveals
impacts on metabolism, development, and plant responses to the
environment in Arabidopsis. The Plant Cell 26: 1–22.
Michaeli S, Galili G, Genschik P, Fernie AR, Avin-Wittenberg T (2016)
Autophagy in Plants--What’s New on the Menu? Trends Plant Science 21:
134–144.
Morris K, MacKerness SA, Pag T, John CF, Murphy M, Carr JP, Buchanan-Wollaston V (2000) Salicylic acid has a role in regulating gene expression
during leaf senescence. Plant Journal 23: 677–685.
Noh YS, Amasino RM (1999) Identification of a promoter region responsible for
the senescence-specific expression of SAG12. Plant Molecular Biology 41:
181–194
Nunes-Nesi A, Carrari F, Gibon Y, Sulpice R, Lytovchenko A, Fisahn J, Graham J, Ratcliffe RG, Sweetlove LJ, Fernie AR (2007) Deficiency of
mitochondrial fumarase activity in tomato plants impairs photosynthesis via
an effect on stomatal function. Plant Journal 50: 1093-1106.
Obata T, Fernie AR (2012) The use of metabolomics to dissect plant responses
to abiotic stresses. Cellular and Molecular Life Sciences 69: 3225-3243.

39
Oh SA, Lee SY, Chung IK, Lee CH, Nam HG (1996) A senescence-associated
gene of Arabidopsis thaliana is distinctively regulated during natural and
artificially induced leaf senescence. Plant Molecular Biology 30: 739-754.
Osuna D, Usadel B, Morcuende R, Gibon Y, Blasing O E (2007) Temporal
responses of transcripts, enzyme activities and metabolites after adding
sucrose to carbon-deprived Arabidopsis seedlings. Plant Journal 49: 463–491.
Peng C, Uygun S, Shiu SH, Last RL (2015) The Impact of the Branched-Chain
Ketoacid Dehydrogenase Complex on Amino Acid Homeostasis in
Arabidopsis. Plant Physiology 169, 1807-1820.
Piques M, Schulze WX, Hohne M, Usadel B, Gibon Y, Rohwer J, Stitt M.
(2009) Ribosome and transcript copy numbers, polysome occupancy and
enzyme dynamics in Arabidopsis Molecular Systems Biology 5:314.
Pires MV, Pereira-Júnior AA, Medeiros DB, Daloso DM, Pham PA, Barros KA, Florian A, Krahner I, Maurino VG,Araujo WL, Fernie AR (2016).
The influence of alternative pathways of respiration that utilize branched-
chain amino acids following water shortage in Arabidopsis. Plant, Cell and
Environment doi: 10.1111/pce.12682
Phillips AR, Suttangkakul A, Vierstra RD (2008) The ATG12-conjugating
enzyme ATG10 is essential for autophagic vesicle formation in Arabidopsis
thaliana. Genetics 178: 1339–1353
Plaxton WC, Podesta FE (2006) The functional organization and control of plant
respiration. Critical Review Plant Science 25: 159-198
Rose TL, Bonneau L, Der C, Marty‐Mazars D, Marty F
(2006)Starvation‐induced expression of autophagy‐related genes in
Arabidopsis. Biology of Cell 98: 53-67
Schauer N, Steinhauser D, Strelkov S, Schomburg D, Allison G, Moritz T,
Lundgren K, Roessner U, Forbes MG, Willmitzer L, Fernie AR, Kopka J (2005) GC-MS libraries for the rapid identification of metabolites in
complex biological 1 samples. FEBS Letters 579:1332-1337
Shin KD, Lee HN, Chung T (2014). A revised assay for monitoring autophagic
flux in Arabidopsis thaliana reveals involvement of AUTOPHAGY-
RELATED9 in autophagy. Molecules and Cells 37: 399–405.
Sulpice R, Pyl E-T, Ishihara H, Trenkamp S, Steinfath M, Witucka-Wall H,
Gibon Y, Usadel B, Poree F, Piques MC, Von Korff M, Steinhauser MC,
Keurentjes JJB, Guenther M, Hoehne M, Selbig J, Fernie AR, Altmann T, Stitt M (2009) Starch as a major integrator in the regulation of plant
growth. Proceedings of the National Academy of Sciences. USA 106: 10348-
10353
Sweetlove LJ, Bear KFM, Nunes-Nesi A, Fernie AR, Ratcliffe RG (2010) Not
just a circle: flux modes in the plant TCA cycle. Trends in Plant Science 15:
462-470

40
Thompson AR (2005). Autophagic Nutrient Recycling in Arabidopsis Directed
by the ATG8 and ATG12 Conjugation Pathways. Plant Physiology 138:
2097–2110.
Usadel B, Bläsin OE, Gibon Y, Retzlaff K, Höhn M, Günther M, Stitt M (2008). Global transcript levels respond to small changes of the carbon status
during progressive exhaustion of carbohydrates in Arabidopsis rosettes. Plant
Physiology 146: 1834-1861.
Wada S, Ishida H, Izumi M, Yoshimoto K, Ohsumi Y, Mae T, Makino A (2009) Autophagy plays a role in chloroplast degradation during senescence
in individually darkened leaves. Plant Physiology 149: 885–893.
Wang Y , Yu B, Zhao J, Guo J, Li Y, Han S, Huang L, Du Y, Hong Y,
Tang D, Liu YL (2013) Autophagy contributes to leaf starch
degradation. The Plant Cell 25: 1383–1399.
Wang S, Blumwald E (2014) Stress-induced chloroplast degradation in
Arabidopsis is regulated via a process independent of autophagy and
senescence-associated vacuoles. The Plant Cell 26: 4875–88.
Watmough NJ, Frerman FE (2010) The electron transfer flavoprotein
ubiquinone oxidoreductases. Biochimica Biophysica Acta 1797: 1910-1916.
Weaver LM, Amasino RM (2001) Senescence is induced in individually
darkened Arabidopsis leaves, but inhibited in whole darkened plants. Plant
Physiology 127: 876-886.
Weigelt K, Küster H, Radchuk R, Müller M, Weichert H, Fait A, Fernie AR, Saalbach I, Weber H (2008) Increasing amino acid supply in pea embryos
reveals specific interactions of N and C metabolism, and highlights the
importance of mitochondrial metabolism. Plant J 55: 909-926
Xie Q, Michaeli S, Peled-Zehavi H, Galili G (2015) Chloroplast degradation:
One organelle, multiple degradation pathways. Trends in Plant Science 20:
264–265.
Xiong Y, Contento AL, Bassham DC (2005) AtATG18a is required for the
formation of autophagosomes during nutrient stress and senescence in
Arabidopsis thaliana. Plant Journal 42: 535–546.
Yoshimoto K, Hanaoka H, Sato S, Kato T, Tabata S, Noda T,Ohsumi Y (2004) Processing of ATG8s, ubiquitin-like proteins, and their deconjugation
by ATG4s are essential for plant autophagy. Plant Cell 16: 2967–2983
Yoshimoto K, Jikumaru Y, Kamiya Y, Kusano M, Consonni C, Panstruga R,
Ohsumi Y, Shirasu K (2009). Autophagy negatively regulates cell death by
controlling NPR1-dependent salicylic acid signaling during senescence and
the innate immune response in Arabidopsis. Plant Cell 21: 2914–2927.
Yoshimoto K, Shibata M, Kondo M, Oikawa K, Sato M, Toyooka K, Shirasu
K, Nishimura M, Ohsumi Y (2014) Organ-specific quality control of plant
peroxisomes is mediated by autophagy. Journal of Cell Science 127: 1161–1168.

41
Zhao Y, Chan Z, Gao J, Xing L, Cao M, Yu C, Hu H, You J,Shi H, Zhu Y,
Gong Y,Mu Z, Wang H, Deng X, Wang P, Bressan RA, Zu JK (2016)
ABA receptor PYL9 promotes drought resistance and leaf senescence.
Proceedings of the National Academy of Sciences 113: 1949-1954.
Zhu X, Galili G (2003) Increased lysine synthesis coupled with a knockout of its
catabolism synergistically boosts lysine content and also transregulates the
metabolism of other amino acids in Arabidopsis seeds. The Plant Cell 15:
845-853
Zientara‐rytter K, Sirko A (2016) To deliver or to degrade–an interplay of the
ubiquitin–proteasome system, autophagy and vesicular transport in
plants. The FEBS journal.

42
7. SUPPLEMENTAL DATA
Figure S1. Schematic representation of the sites of T-DNA insertion in atg
mutants.
Genomic structure of ATG5 (A), ATG7 (B) and ATG9 (C). Closed boxes indicate
exons. Arrowheads represent positions of primers used for genotyping of wild
type and mutant lines. (D) RT-PCR analysis on total RNA from WT and atg
mutant lines. The primers used are indicated in the figure left. Gene expression by
RT-PCR showed absence transcript in mutant lines: atg5-1, L1 5´-
GTTGTGCAAAGGGCTTAATAGAG-3´/R15´CAAGAAGGCTCATGAAAA
GACAG-3´; atg7-2, L2 5´- ACAAGACCACCGTTGGTAAACTC-3´/R2 5´-
CTCCGGCTAATCTTACACAAGG-3´; atg9-1, L3 5´- CTAAGAGATGGC
GTGGAAAGG-3´/R3 5´- CTTGAGGTTTGAGGCATTTCA-3´. Gliceraldeide-3-
phosphate- dehydrogenase (GAPDH): forward 5´- TGGTTGATCTCGTTG
TGCAGGTCTC-3´ and reverse 5´- GTCAGCCAAGTCAACAACTCTCTG-3'
was used for normalization of gene transcript levels.
A
B
C
D Genotypes
WT atg5-1 atg7-2 atg9-1
ATG 5
ATG 7
ATG 9
GAPDH

43
Supplemental Figure 2: Schematic representation of plant autophagic process.
Three functional groups of atg proteins are presented: (i) the ATG1/13 kinase
complex which initiates the pre autophagosome structure (PAS) in response to
TOR (Target of Rapamycin) regulation; (ii) the Atg18/Atg2/Atg9 complex that
plays role in lipid recruitment for expansion of pre-autophagosomal structure; (iii)
ATG8 and ATG12 ubiquitination-like conjugation systems participate in the
elongation, enclosure steps and conjugation of ATG8 to
phosphatidylethanolamine for anchoring into the membrane of autophagosomes.
.

44
Supplemental Figure 2: Phenotype of atg Arabidopsis mutants under extended
dark treatment
Images of 4-week-old, short-day-grown Arabidopsis plants immediately (0 day)
and after further treatment for 12 days in darkness conditions. The leaves of the
atg mutants atg5-1 and atg7-2 presented higher signs of senescence following 12
days of growth in darkness compared with the wild-type (Col-0) and atg9-1
mutant.
0 DAY 12 DAY wt
atg7-2
atg9-1
atg 5-1
wt
atg7-2
atg9-1
atg 5-1
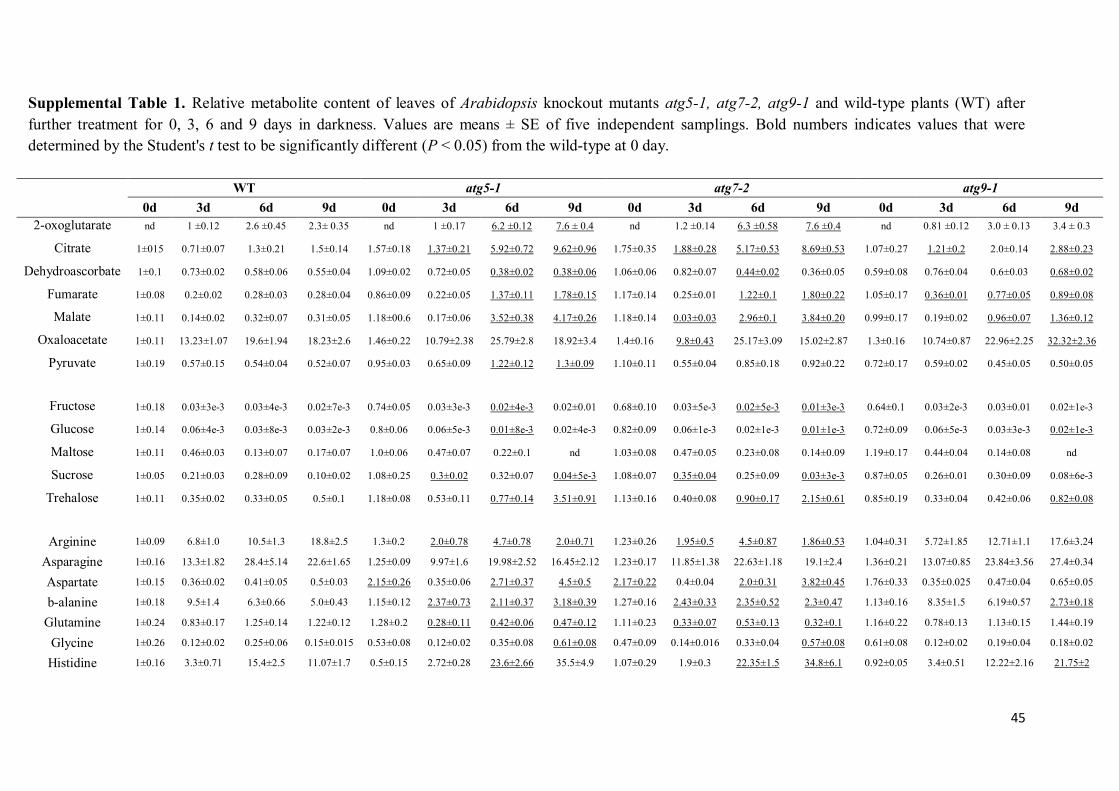
45
Supplemental Table 1. Relative metabolite content of leaves of Arabidopsis knockout mutants atg5-1, atg7-2, atg9-1 and wild-type plants (WT) after
further treatment for 0, 3, 6 and 9 days in darkness. Values are means ± SE of five independent samplings. Bold numbers indicates values that were
determined by the Student's t test to be significantly different (P < 0.05) from the wild-type at 0 day.
WT atg5-1 atg7-2 atg9-1
0d 3d 6d 9d 0d 3d 6d 9d 0d 3d 6d 9d 0d 3d 6d 9d
2-oxoglutarate nd 1 ±0.12 2.6 ±0.45 2.3± 0.35 nd 1 ±0.17 6.2 ±0.12 7.6 ± 0.4 nd 1.2 ±0.14 6.3 ±0.58 7.6 ±0.4 nd 0.81 ±0.12 3.0 ± 0.13 3.4 ± 0.3
Citrate 1±015 0.71±0.07 1.3±0.21 1.5±0.14 1.57±0.18 1.37±0.21 5.92±0.72 9.62±0.96 1.75±0.35 1.88±0.28 5.17±0.53 8.69±0.53 1.07±0.27 1.21±0.2 2.0±0.14 2.88±0.23
Dehydroascorbate 1±0.1 0.73±0.02 0.58±0.06 0.55±0.04 1.09±0.02 0.72±0.05 0.38±0.02 0.38±0.06 1.06±0.06 0.82±0.07 0.44±0.02 0.36±0.05 0.59±0.08 0.76±0.04 0.6±0.03 0.68±0.02
Fumarate 1±0.08 0.2±0.02 0.28±0.03 0.28±0.04 0.86±0.09 0.22±0.05 1.37±0.11 1.78±0.15 1.17±0.14 0.25±0.01 1.22±0.1 1.80±0.22 1.05±0.17 0.36±0.01 0.77±0.05 0.89±0.08
Malate 1±0.11 0.14±0.02 0.32±0.07 0.31±0.05 1.18±00.6 0.17±0.06 3.52±0.38 4.17±0.26 1.18±0.14 0.03±0.03 2.96±0.1 3.84±0.20 0.99±0.17 0.19±0.02 0.96±0.07 1.36±0.12
Oxaloacetate 1±0.11 13.23±1.07 19.6±1.94 18.23±2.6 1.46±0.22 10.79±2.38 25.79±2.8 18.92±3.4 1.4±0.16 9.8±0.43 25.17±3.09 15.02±2.87 1.3±0.16 10.74±0.87 22.96±2.25 32.32±2.36
Pyruvate 1±0.19 0.57±0.15 0.54±0.04 0.52±0.07 0.95±0.03 0.65±0.09 1.22±0.12 1.3±0.09 1.10±0.11 0.55±0.04 0.85±0.18 0.92±0.22 0.72±0.17 0.59±0.02 0.45±0.05 0.50±0.05
Fructose 1±0.18 0.03±3e-3 0.03±4e-3 0.02±7e-3 0.74±0.05 0.03±3e-3 0.02±4e-3 0.02±0.01 0.68±0.10 0.03±5e-3 0.02±5e-3 0.01±3e-3 0.64±0.1 0.03±2e-3 0.03±0.01 0.02±1e-3
Glucose 1±0.14 0.06±4e-3 0.03±8e-3 0.03±2e-3 0.8±0.06 0.06±5e-3 0.01±8e-3 0.02±4e-3 0.82±0.09 0.06±1e-3 0.02±1e-3 0.01±1e-3 0.72±0.09 0.06±5e-3 0.03±3e-3 0.02±1e-3
Maltose 1±0.11 0.46±0.03 0.13±0.07 0.17±0.07 1.0±0.06 0.47±0.07 0.22±0.1 nd 1.03±0.08 0.47±0.05 0.23±0.08 0.14±0.09 1.19±0.17 0.44±0.04 0.14±0.08 nd
Sucrose 1±0.05 0.21±0.03 0.28±0.09 0.10±0.02 1.08±0.25 0.3±0.02 0.32±0.07 0.04±5e-3 1.08±0.07 0.35±0.04 0.25±0.09 0.03±3e-3 0.87±0.05 0.26±0.01 0.30±0.09 0.08±6e-3
Trehalose 1±0.11 0.35±0.02 0.33±0.05 0.5±0.1 1.18±0.08 0.53±0.11 0.77±0.14 3.51±0.91 1.13±0.16 0.40±0.08 0.90±0.17 2.15±0.61 0.85±0.19 0.33±0.04 0.42±0.06 0.82±0.08
Arginine 1±0.09 6.8±1.0 10.5±1.3 18.8±2.5 1.3±0.2 2.0±0.78 4.7±0.78 2.0±0.71 1.23±0.26 1.95±0.5 4.5±0.87 1.86±0.53 1.04±0.31 5.72±1.85 12.71±1.1 17.6±3.24
Asparagine 1±0.16 13.3±1.82 28.4±5.14 22.6±1.65 1.25±0.09 9.97±1.6 19.98±2.52 16.45±2.12 1.23±0.17 11.85±1.38 22.63±1.18 19.1±2.4 1.36±0.21 13.07±0.85 23.84±3.56 27.4±0.34
Aspartate 1±0.15 0.36±0.02 0.41±0.05 0.5±0.03 2.15±0.26 0.35±0.06 2.71±0.37 4.5±0.5 2.17±0.22 0.4±0.04 2.0±0.31 3.82±0.45 1.76±0.33 0.35±0.025 0.47±0.04 0.65±0.05
b-alanine 1±0.18 9.5±1.4 6.3±0.66 5.0±0.43 1.15±0.12 2.37±0.73 2.11±0.37 3.18±0.39 1.27±0.16 2.43±0.33 2.35±0.52 2.3±0.47 1.13±0.16 8.35±1.5 6.19±0.57 2.73±0.18
Glutamine 1±0.24 0.83±0.17 1.25±0.14 1.22±0.12 1.28±0.2 0.28±0.11 0.42±0.06 0.47±0.12 1.11±0.23 0.33±0.07 0.53±0.13 0.32±0.1 1.16±0.22 0.78±0.13 1.13±0.15 1.44±0.19
Glycine 1±0.26 0.12±0.02 0.25±0.06 0.15±0.015 0.53±0.08 0.12±0.02 0.35±0.08 0.61±0.08 0.47±0.09 0.14±0.016 0.33±0.04 0.57±0.08 0.61±0.08 0.12±0.02 0.19±0.04 0.18±0.02
Histidine 1±0.16 3.3±0.71 15.4±2.5 11.07±1.7 0.5±0.15 2.72±0.28 23.6±2.66 35.5±4.9 1.07±0.29 1.9±0.3 22.35±1.5 34.8±6.1 0.92±0.05 3.4±0.51 12.22±2.16 21.75±2

46
Isoleucine 1±0.12 32.6±3.24 31.21±5.6 33.1±0.8 1.13±0.06 10.73±1.62 4.28±1.04 3.9±0.34 1.38±0.25 9.99±1.21 4.38±0.9 3.26±0.58 0.88±0.12 19.36±2.34 16.20±1.53 14.34±1.06
Leucine 1±0.19 16.36±0.29 17.23±3.14 16.70±0.69 1.13±0.12 4.26±1.0 2.45±0.36 4.68±0.41 1.48±0.33 3.99±0.58 3.07±1.18 3.61±0.5 0.85±0.15 7.93±1.56 6.05±0.83 6.15±0.51
Methionine 1±0.21 14.98±0.99 37.3±3.19 38.99±3.04 1.58±0.19 12.19±2.04 19.13±2.0 19.28±2.81 1.4±0.17 9.99±1.4 24.78±3.21 21.07±2.99 1.17±0.23 13.63±1.82 32.67±2.70 44.37±4.42
Ornithine 1±0.25 22.22±2.76 33.23±5.98 76.5±5.93 2.43±0.14 5.89±2.64 11.51±1.78 6.98±2.81 2.22±0.56 6.29±1.62 17.38±4.16 5.25±1.79 1.75±0.44 18.18±5.05 49.93±5.35 77.01±8.25
Phenylalanine 1±0.19 18.85±1.51 41.08±5.24 41.56±2.29 0.93±0.16 13.47±2.16 47.78±2.92 49.58±3.32 1.11±0.16 14.89±1.52 45.56±2.05 46.74±3.50 0.71±0.15 16.53±1.42 41.98±1.57 55.02±3.03
Serine 1±0.18 1.87±0.20 2.08±0.23 1.97±0.12 1.23±0.81 0.82±0.15 1.02±0.10 0.92±0.12 1.24±0.12 0.82±0.10 0.94±0.09 0.89±0.12 0.94±0.12 1.29±0.18 1.98±0.19 1.71±0.18
Tryptophan 1±0.09 8.68±1.33 34.26±4.99 33.29±2.8 1.44±0.34 3.8±1.21 39.54±6.51 27.32±9.61 1.30±0.27 4.4±0.79 40.48±0.87 40.76±10.64 1.13±0.3 6.62±1.23 44.73±5.85 57.25±8.19
Tyrosine 1±017 40.27±2.68 42.81±3.76 44.96±2.99 1.03±0.13 8.83±1.48 7.32±0.42 11.59±1.04 1.21±0.17 9.13±0.98 8.38±1.06 9.00±1.55 1.06±0.16 20.94±1.68 21.34±1.59 22.85±1.5
Valine 1±0.09 10.7±1.04 11.88±1.89 11.08±0.09 0.93±0.07 6.2±1.12 5.46±0.58 5.4±0.32 1.05±0.12 6.30±0.89 5.71±0.84 4.37±0.76 0.77±0.13 8.39±1.08 9.25±1.09 8.46±0.95

47
Supplemental Table 2. Primers used in the RT-PCR analyses performed in this study
Gene Locus Forward primer Reverse primer
ETFQO AT2G43400 5'-TTGGCCATTAGTGCTATGGAACAC-3' 5'-TCCCATGCTTGAGCGTGAAAGG-3'
IVDH AT3G45300 5'-AATGGGAAAGTTGACCCAAAGGAC-3' 5'-TAAAGCGACCTGCGTTGCTCTC-3'
ETF(beta) AT5G43430 5'-TTCTTAGGGAAACAGGCGATA-3' 5'-GCTTGTGGCCAACCAAGTAA-3'
D2HGDH AT4G36400 5'-GAAGCTGTCATATCGGTGGA-3' 5'-TCGTACCCAGTATTGTCTTTGC-3'
LKR/SDH AT4G33150 5'-TGATTGTCGCGTCTCTGTATC-3' 5'-ATCTAGCCGAACTGCTTCTAC-3'
SAG12 AT5G45890 5'-ACAAAGGCGAAGACGCTACTTG-3' 5'-ACCGGACATCCTCATAACCTG-3'
SAG13 At2g29350 5'-GGCTTGGGAGAGAACTCAAGA-3' 5'-GCTTCCCCGATGCCTTTAGAG-3'
CV AT2G25625 5'-CGGAGGTGGAGTGACAAGAG-3' 5'-GAGCAGACGGACGAGGAAGA-3'
ATG7 AT5G45900 5'-ACGTGGTTGCACCTCAGGATTC-3' 5'-ACTAAGAGTTCAACGGCGAGAGC-3'
ATG9 AT2G31260 5'-TGGGAAGAGAATGCAAGAAG-3' 5'-ACCGTAATGTGGTGCTTGAT-3
ACT AT2G37620 5'-CTTGCACCAAGCAGCATGAA -3' 5'-CCGATCCAGACACTGTACTTCCTT-3'
ETFQO, electron-transfer flavoprotein: ubiquinone oxidoreductase; IVDH, isovaleryl-CoA dehydrogenase; ETFß,
electron-transfer flavoprotein; D2HGDH, 2-hydroxyglutarate dehydrogenase; LKR/SDH, lysine-ketoglutarate
reductase/saccharopine dehydrogenase; senescence-associated genes, SAG12 and SAG13; CV, chloroplast vesiculation;
autophagy genes, ATG7 and ATG9; ACT, actin.